You are currently viewing a new version of our website. To view the old version click .
Metals
  • Article
  • Open Access

14 November 2025

Geometric Effects and Boundary Condition Issues in the Corrosion of Magnesium

,
,
,
,
and
1
School of Engineering, Liberty University, Lynchburg, VA 24551, USA
2
Department of Chemistry, Mississippi State University, Starkville, MS 39762, USA
3
Department of Civil/Environmental and Chemical Engineering, Youngstown State University, Youngstown, OH 44555, USA
*
Author to whom correspondence should be addressed.
This article belongs to the Special Issue Erosion–Corrosion Behaviour and Mechanisms of Metallic Materials

Abstract

A new experiment was conducted to determine the corrosion rates of different geometric structures (vertical plate, horizontal plate, cube, and sphere) with the same surface area of pure magnesium in a saltwater immersion environment of 3.5% NaCl for 108 h, illustrating a clear geometry effect arising from local boundary layer water flow. Magnesium was chosen as an idealized material because of its small electrochemical potential. The different corrosion mechanisms were analyzed and quantified by measuring the surface roughness (localized corrosion) via laser profilometry, mass loss (general corrosion) by weighing specimens, localized and intergranular corrosion via Scanning Electron Microscopy and Optical Microscopy, and total corrosion via hydrogen measurements. Although the corrosion rates were very similar at the beginning of the tests, the vertical and horizontal plates gave corrosion rates greater than the cube and sphere shortly after the tests started. Water circulation induced by hydrogen gas bubbles caused a greater corrosion rate at the edges of the plates and cube. These results indicate that a structure’s geometric edges should be made smoother to lessen corrosion effects in design. Also, when one is designing for corrosion resistance of a structural component, our results demonstrate that the designer must consider the fluid dynamics in the boundary value problem surrounding the structural component, since the geometric shape changes the corrosion rate.

1. Introduction

When examining the electrochemical potentials of different structural materials, magnesium is an idealized material for scientific inquiry because it has one of the smallest electrochemical potentials, while also possessing the lowest density for a structural metal and a good strength-to-weight ratio. Of engineering significance, magnesium is of great interest to the automotive and aerospace industries. The lack of adequate corrosion resistance; however, makes the use of magnesium impractical in many potential structural applications that would require the metal to be exposed to the environment []. Research shows that alloying magnesium (Mg) with aluminum (Al), zinc (Zn), manganese (Mn), and certain rare earth metals can greatly improve the corrosion resistance with a minimal increase in density [,,,,]. The most common types of magnesium alloys are AM (Mg-Al-Mn) and AZ (Mg-Al-Zn) variations in various percentages of the secondary and tertiary elements. The addition of 2–10% aluminum to magnesium has been shown to increase the corrosion resistance [,], but other research demonstrated that a lower percentage of alloying aluminum produces the best corrosion resistance as it minimizes β-phase Mg17Al12 particles, which act as microgalvanic sites within the α-Mg phase [,]. Increased corrosion resistance can also be achieved through grain refinement. In other words, as the grain size decreased, the magnesium corrosion rate decreased [,]. Also, refining the β-phase to be fine and continuous creates a barrier between the α-Mg grains and hinders the propagation of corrosion []. However, balancing the contrasting β-phase effects in traditional magnesium alloys can be problematic. Thus, a combination of methods, dependent upon the specific application for the magnesium alloy, is best for optimum corrosion resistance. More traditional methods of coating, painting, and lubricating the surface of magnesium are also quite effective in certain applications. Continued research on different methods to improve magnesium’s corrosion resistance is needed. However, thus far, there has not been a study on how the geometry of a structural component influences the corrosion rate of magnesium. The work herein is a study of the effects of geometry and related boundary conditions on the corrosion rate of pure magnesium. Having this baseline regarding pure magnesium sets up further experiments, whereby alloying studies can be conducted to elucidate further chemical composition effects arising from local galvanic cells. This becomes important when designing a structural component that is made of magnesium alloys.
Based on previous magnesium alloy corrosion studies, a corrosion damage model was developed by Walton et al. []. and Horstemeyer et al. [], which considers general, intergranular, and localized corrosion mechanisms, termed “pitting” in the most general application of the term, according to the following equation:
ϕ c =   ϕ g c + ϕ i c + ϕ p c
where the total damage is additive decomposition from general corrosion (gc), intergranular corrosion (ic), and localized (pitting) corrosion (pc). The model multiplicatively decomposes pitting into pit nucleation (η), pit growth (ν), and pit coalescence (c),
ϕ p c = η p ν p c p
the corrosion damage model includes research on magnesium alloys such as AZ31 [,], AZ61 [], AE44 [,,], AM30 [], and AM60 [], all in immersion environments. The corrosion model is used to quantify the associated damage of the pure magnesium sphere and cube. The rate forms of Equations (1) and (2) are shown by the following,
ϕ ˙ c = ϕ ˙ g c + ϕ ˙ i c + ϕ ˙ p c
ϕ ˙ = η ˙ p ν p c p + η p ν ˙ p c p + η p ν p c ˙ p
where ϕ ˙ c is the total damage rate, ϕ ˙ g c is the time rate of change in the thickness or loss in surface area related to general corrosion, ϕ ˙ i c is the time rate of change in the volume fraction related to intergranular corrosion, and ϕ ˙ p c is the time rate of change in the volume fraction related to pitting corrosion associated with nucleation, growth, and coalescence. Herein, η ˙ is the nucleation rate of the pits (pit number density rate change), ν ˙ is the growth rate of the pits (average pit volume rate change), and c ˙ is the coalescence rate of the pits (pit nearest neighbor distance rate change). The mathematical details of the corrosion model are given in Walton []. This mathematical model is used to unite the different corrosion mechanisms (general, intergranular, and pitting) in terms of measurable quantities obtained from the experimental data to quantify the total corrosion damage. In Walton et al. [], throughout the corrosion testing period in either the immersion or salt spray environment, one mechanism (generalized, localized, or intergranular) of corrosion could dominate while the other mechanisms contribute little to the corrosion damage at a particular time. The dominance of any of the mechanism(s) can change at any given time for the material in question. However, these equations, or any corrosion model equations, do not have any functions related to the geometry of the specimen or component when used in a complex boundary value problem.
The new experimental study described in this work is the first of its kind to help assess the geometric effects on corrosion mechanisms by employing a vertical plate, a horizontal plate, a sphere, and a cube of the same surface area. Note that Equations (1)–(4) do not include geometry effects as they act only as the constitutive equations [,], where the full set of conservation laws of mass, momentum, and energy is required with the geometries and the constitutive model to solve the associated boundary value problem of corrosion. If one were to ask, which geometry (cube, sphere, or rectangular plate) would allow the most corrosion with the same surface area, which would you pick? It is not obvious, so we created an immersion environment that was used to allow for evolved hydrogen gas measurements and direct observations of the samples during corrosion to distinguish the different corrosion rates from the different geometries.
The following section includes a description of the materials and methods. Section 3 describes a flat surface of pure magnesium over time to create a baseline for the descriptions of the different corrosion mechanisms: (1) localized pitting from surface roughness measurements, Scanning Electron Microscopy (SEM) measurements, and Optical Microscopy analysis; (2) general corrosion from mass loss measurements; (3) intergranular corrosion from optical microscopy; and (4) overall corrosion from hydrogen capture measurements. Section 4 then covers the different geometry effects related to localized pitting, general corrosion, and intergranular corrosion. Section 5 summarizes the overall conclusions.

2. Materials and Methods

A sphere, a cube, and two rectangular plates of pure magnesium were machined such that the specimens had the same surface area of approximately 62.50 cm2. The sphere was measured in several places with an average diameter of 4.460 cm. The length of each side of the cube was 3.227 cm. The horizontal and vertical plates had dimensions of 4.089 cm by 4.115 cm by 1.676 cm. The weights of the sphere, cube, and plates were 80.9 g, 57.5 g, 50.8 g, and 50.7 g. The blocks of magnesium were cut with a vertical bandsaw out of a billet of magnesium from U.S. Magnesium. One of the blocks was then cut on a HAAS CNC Lathe machine (Haas, Oxnard, CA, USA) and shaped into a sphere. The sphere was sequentially sanded with 800-grit, 1200-grit, 2000-grit, and 4000-grit sandpaper. The diameter was measured 12 times from different angles to find the average surface area of the sphere (62.50 cm2). The second block was cut on a Lagun Manual Milling machine (Lagun, Harbor City, CA, USA) and shaped into a cube having a slightly larger average surface area than the sphere. The cube was sequentially sanded with 800-grit, 1200-grit, 2000-grit, and 4000-grit sandpaper to obtain the same surface area as the sphere. The sphere incurred a 0.61% out-of-roundness for the outside circumference prior to testing, while the sides of the cube were 0.32%, 0.33%, and 0.63% out-of-squareness. The two plates were also cut by the bandsaw, followed by the milling machine. They were then sanded, such as the cube. Hence, the geometric specimens had similar tolerance differences in less than 1% so that the surface roughness values were similar. The surface roughness is a ratio of the small-scale variations or irregularities of the height of the physical surface with respect to the surface length. After being corroded, a greater surface roughness indicated that more pitting occurred. A lower surface roughness indicated a smoother surface, and that general corrosion occurred at a greater rate than pitting. Because the initial surface roughness was so low compared to the specimen measurements during the corrosion process, replicates with different initial surface roughness did not affect the corrosion rates, because the corrosion made a much, much greater surface roughness than the initial condition. Furthermore, the anisotropy from cutting and polishing would have been diminished by the lower surface roughness ratio as was measured with laser profilometry in the same fashion as other works [,,]. We estimate that the strong anisotropy from magnesium’s hexagonal close-packed system would dominate over the machining effects.
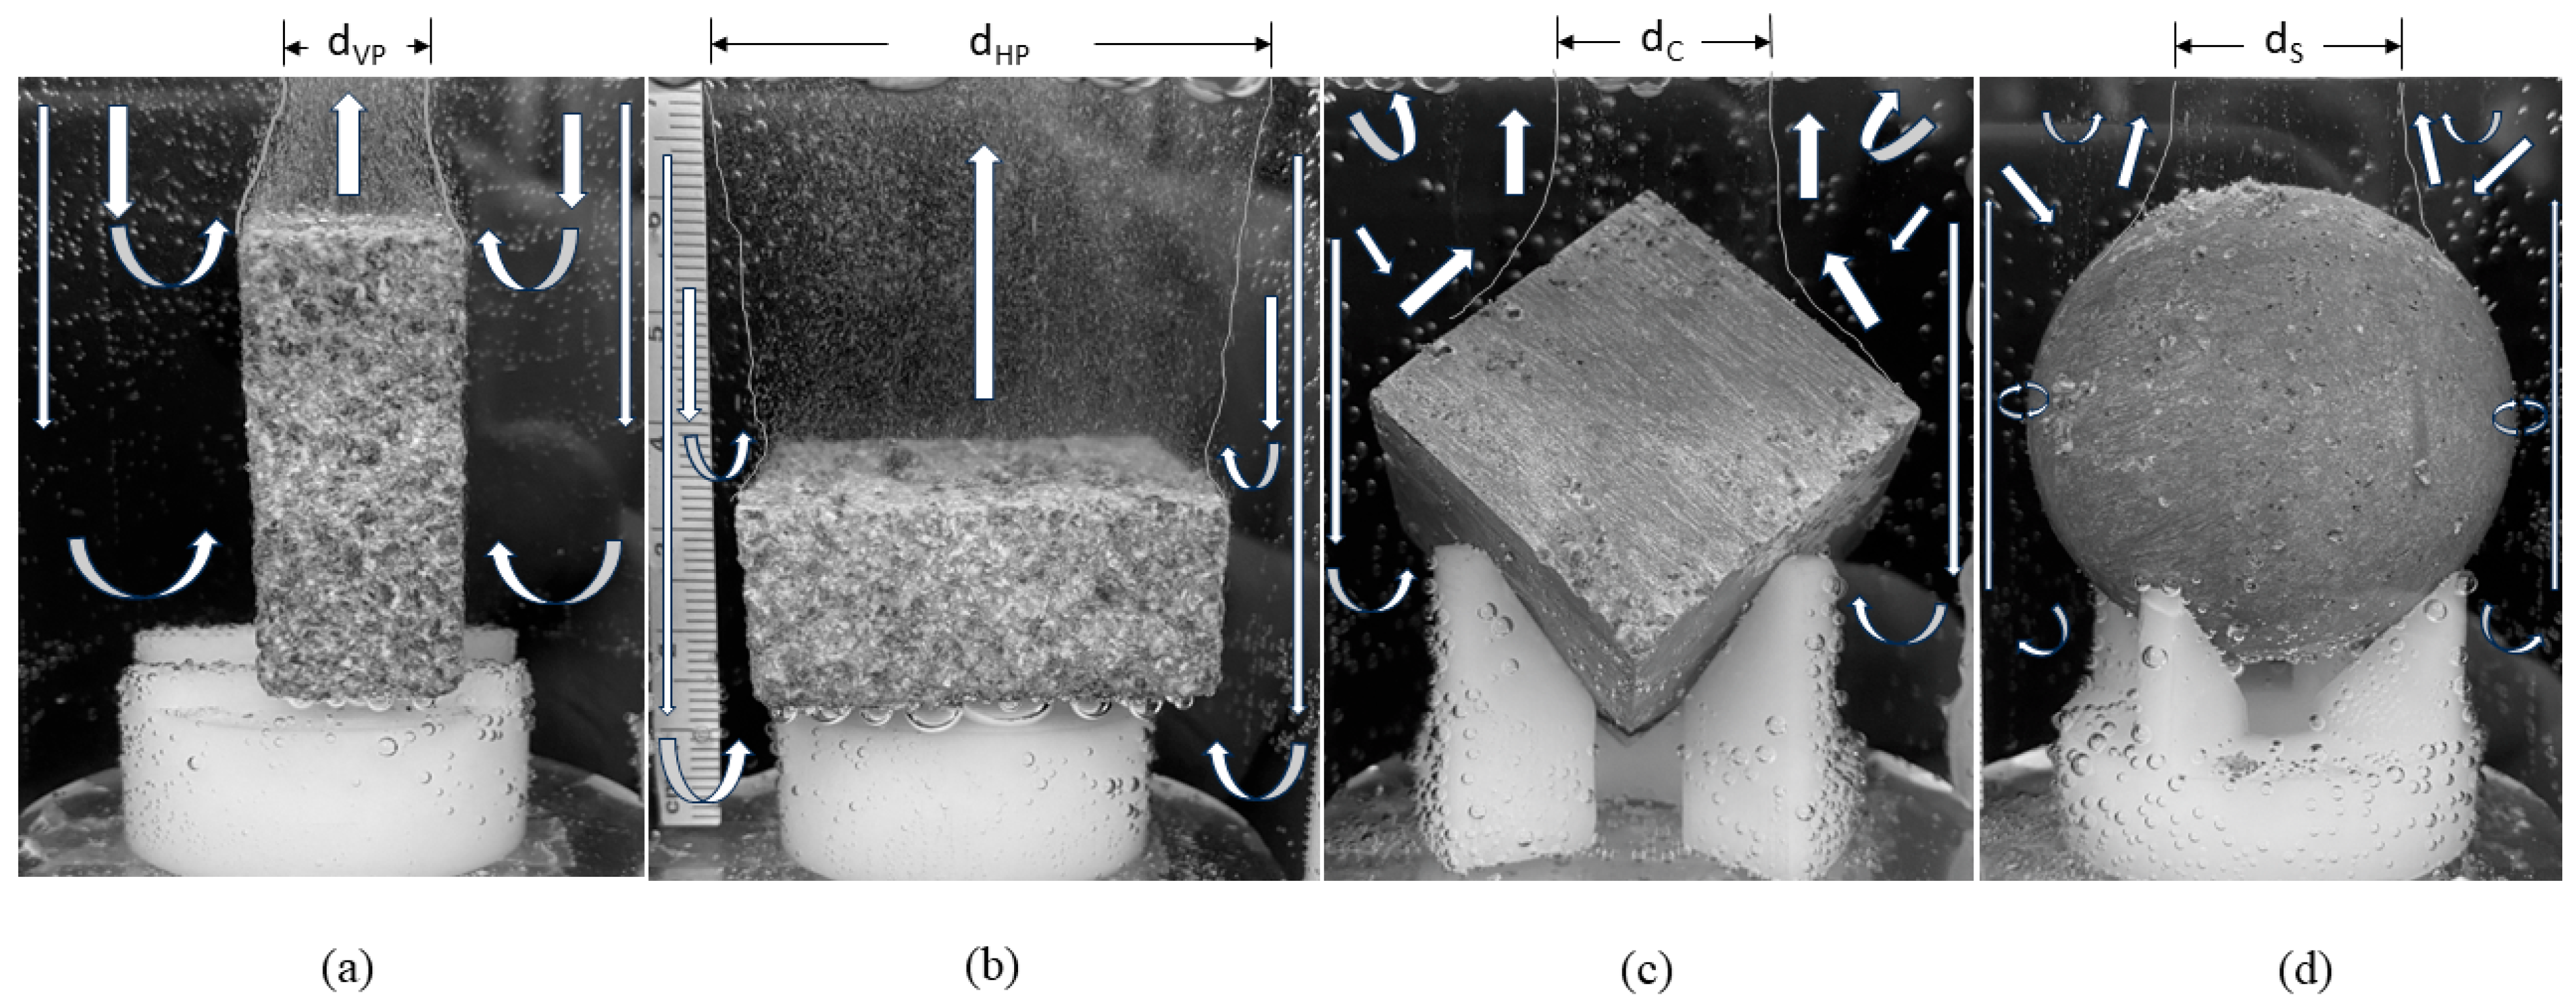
The samples were tested in increments of 1 h, 3 h, 8 h, and four increments of 24 h, for a total of 108 h of corrosion testing. The samples were immersed in an aquarium filled with a 3.5% NaCl solution made with deionized (DI) water. The specimens were placed on specially designed plastic stands in the aquarium to ensure all sides were exposed to the same environment. A four-pronged stand was machined for the sphere with the prongs at a 45° angle. A three-pronged stand was machined for the cube with the prongs at a 54.7° angle so that the top and bottom corners would align. The plates stand for the plates that were created with channels to ensure the saltwater could move underneath the plates. Tape was used on the bottom of the aquarium as a fiducial to designate the positions of the stands, so that they could be returned to the same position for each subsequent corrosion test after the specimens were weighed. Cellophane wrap was used to cover the aquarium once the samples were in place to limit the evaporation of water from the solution. The hydrogen gas was collected for each corrosion increment as a measure of the total corrosion from all three mechanisms. The H2 gas was collected in an inverted graduated cylinder atop an inverted funnel placed directly above the samples, as shown in Figure 1. The initial and final readings of the meniscus in each cylinder were taken as the H2 level was noted at the end of each test increment. Figure 1 shows a zoomed-in view of the geometries.
Figure 1. (a) The experimental setup of the (a) horizontal plate, (b) vertical plate, (c) cube, and (d) sphere in the corrosive environment.
Independent of the geometries, a separate pure magnesium sample was cold-mounted in epoxy and polished to expose the grain morphology. The sample was sanded sequentially to 1200 grit (14 μm), 2000 grit (9 μm), 4000 grit (5 μm), 2 μm, 1 μm, and 0.05 μm. The polished sample was corroded in the same manner as the previous samples. Increments of 15 min, 15 min, and 30 min were used for a total corrosion of 1 h. After each increment, the sample was sonicated for 10 min in pure ethanol to remove any corrosion byproducts. Optical microscopy was used to obtain images of the grains prior to corrosion and after each increment of testing. The mounted sample was used to determine if the intergranular corrosion mechanism would be significant in the corrosion model of pure magnesium.

3. Results and Discussion: Corrosion Mechanisms of Pure Magnesium

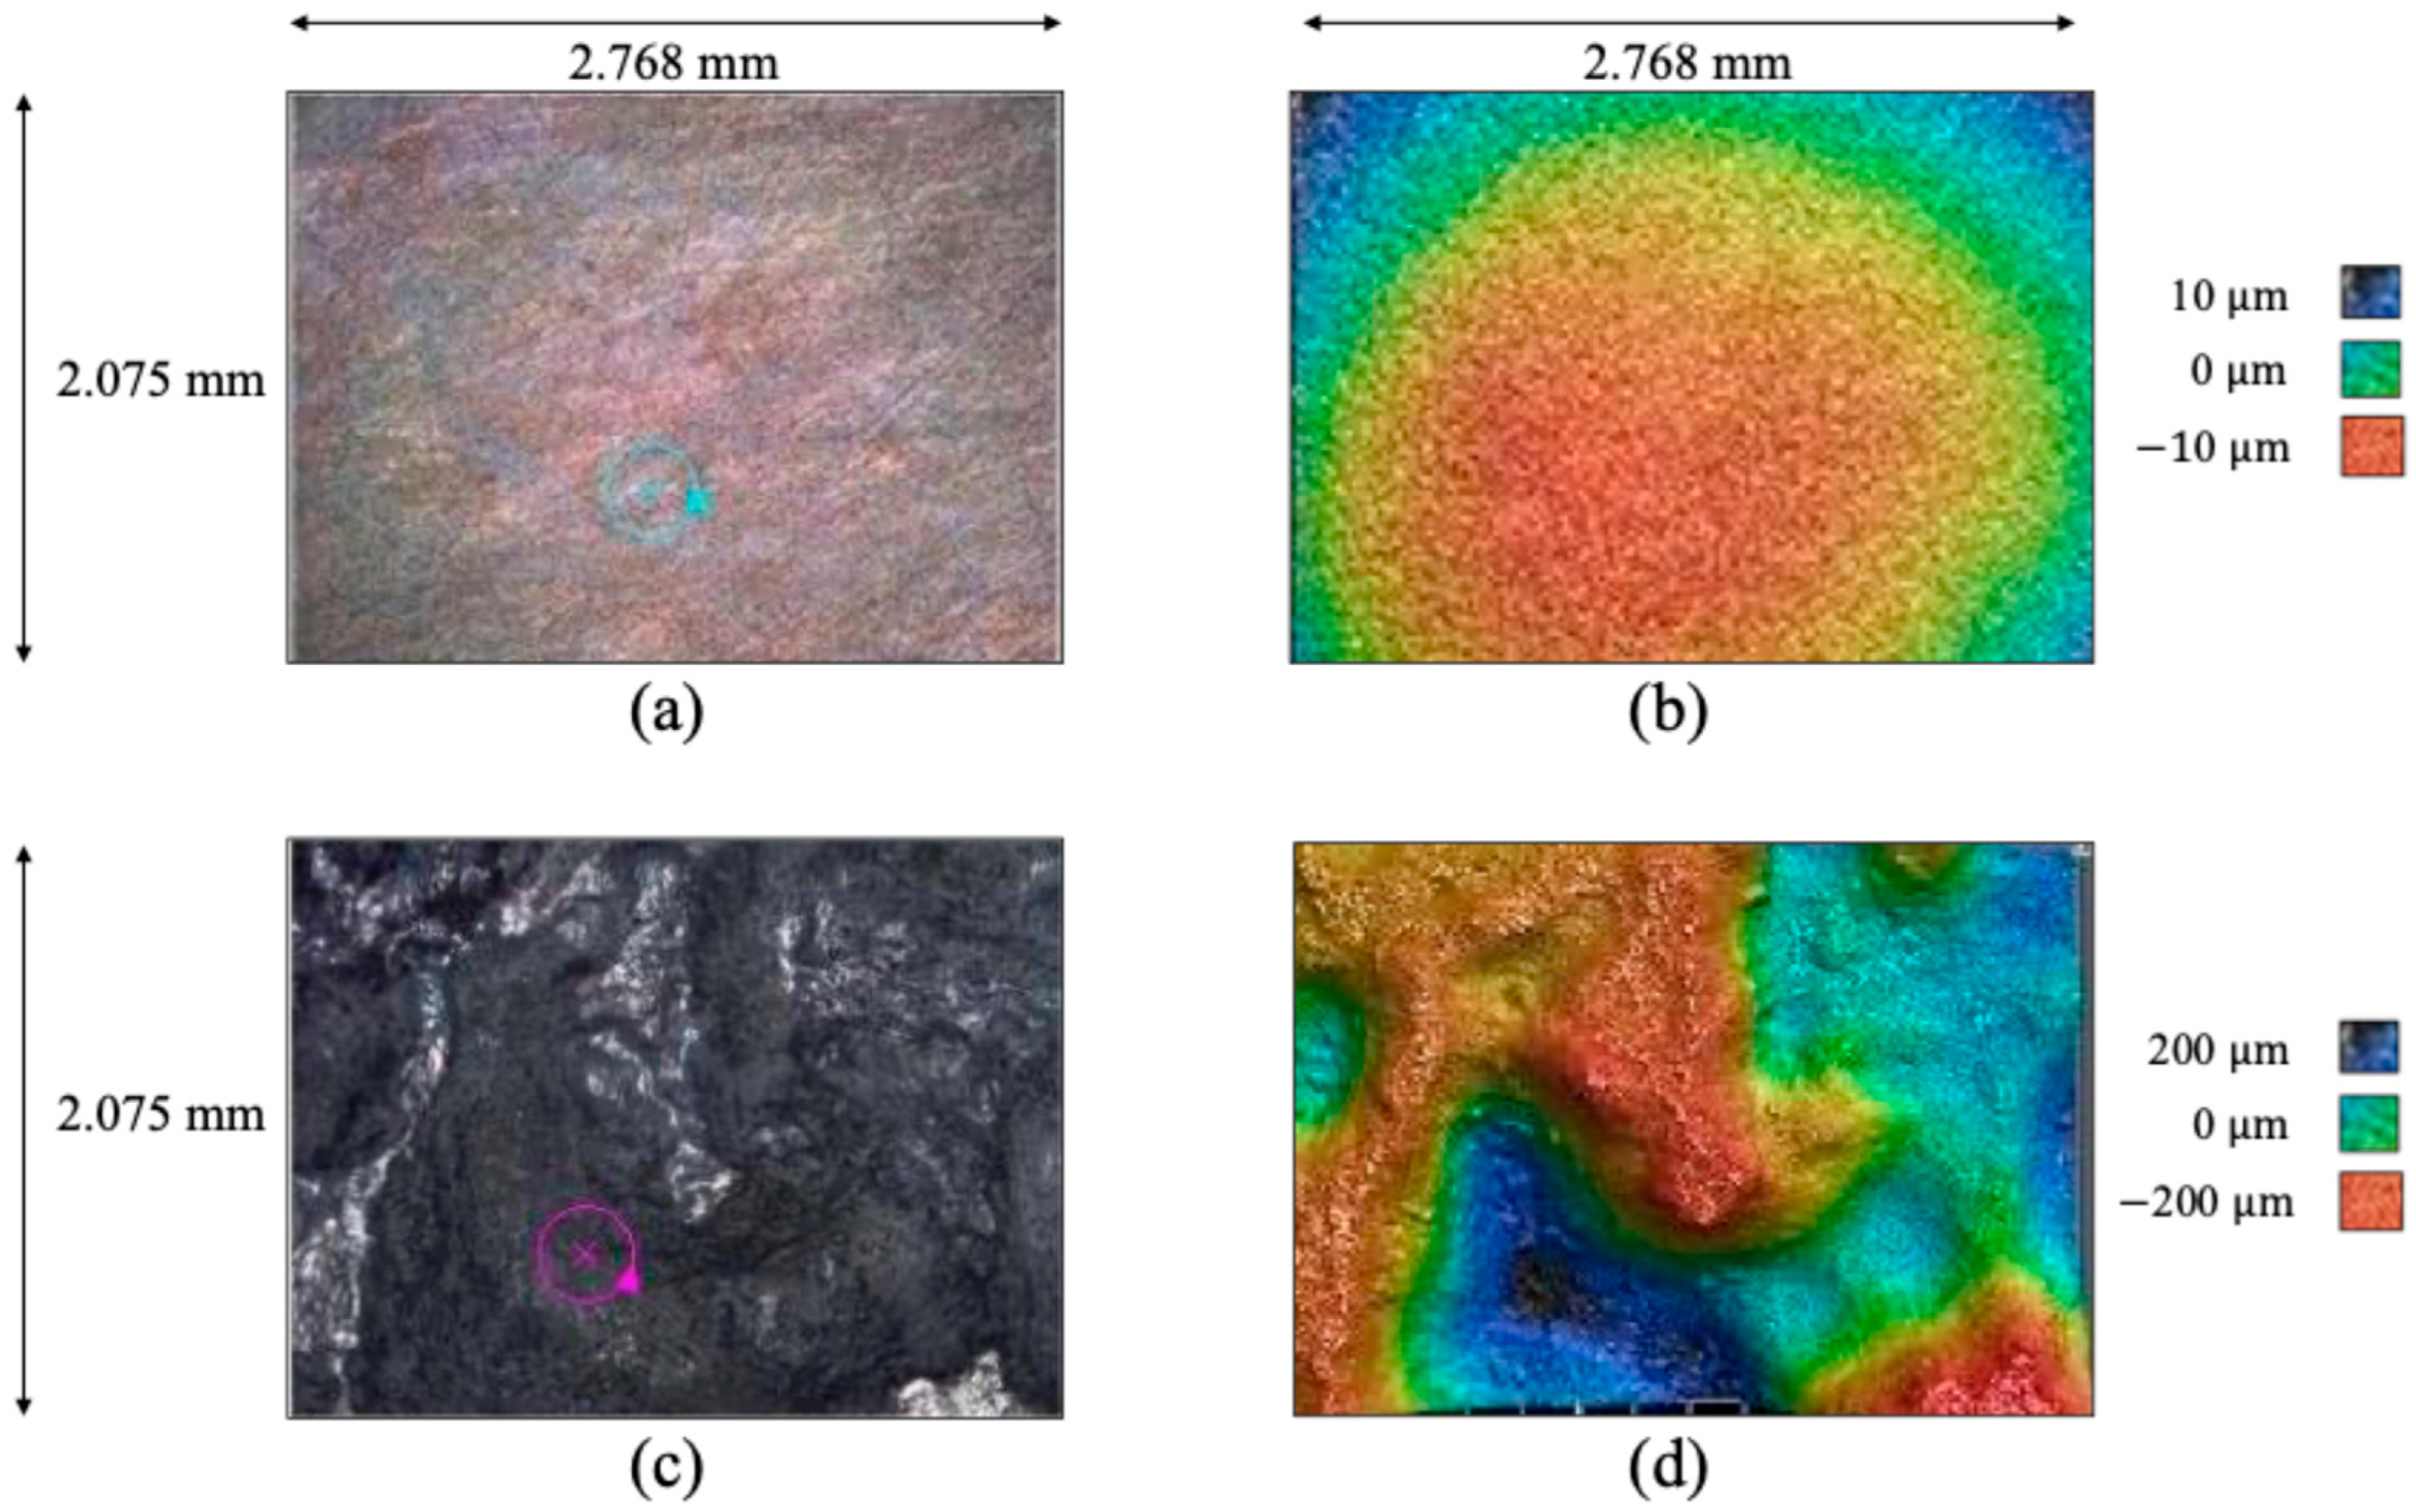
Different corrosion mechanisms occur within magnesium alloys: localized “pitting” corrosion related to Equation (2), general corrosion embedded in Equation (1), and intergranular/intragranular corrosion embedded in Equation (1). Pitting was observed in all of the pure magnesium specimens, no matter the geometry. Figure 2 shows optical micrographs (a,c) with associated laser profilometry color mappings (b,d) showing a pit that nucleated and grew on the pure magnesium sphere prior to corrosion (a,b) and after 108 h of corrosion (c,d). Note that this particular pit nucleated from a region (a,b) with a surface roughness initially of 2.934 mm that grew into (c,d) a pit with a surface roughness of 108.6581 mm. The circle in (a) and (c) shows the same location where the pit nucleated and grew. The dark blue region in (d) shows the pit.
Figure 2. Optical micrographs (a,c) with associated laser profilometry color mappings (b,d) showing a pit that nucleated and grew on the pure magnesium sphere prior to corrosion (a,b) and after 108 h of corrosion (c,d). Note that this particular pit nucleated from a region (a,b) with a surface roughness initially of 2.934 mm that grew into (c,d) a pit with a surface roughness of 108.6581 mm. The circle in (a,c) shows the same location where the pit nucleated and grew. The dark blue region in (d) shows the pit.
Analysis showed that the intergranular corrosion was not a significant contributor to the total corrosion of the sample. Instead, intragranular corrosion dominated as many localized regions were observed within single grains that were imaged. In addition, the remaining scratches from polishing also resulted in localized corrosion, especially demonstrated in the difference between Figure 2b and Figure 2c, where the scratches appear wider and darker. By Figure 2d, the scratches are no longer as intense. Corrosion can also occur at twin boundaries and grain boundaries. Table 1 shows the relative number of localized corrosion sites at grain boundaries, twin boundaries, and in the bulk of the sample (making allowance for previously existing surface defects). The number of localized corrosion sites at each location over the course of an hour did not show any notable preference for grain boundaries or twin boundaries compared to the bulk of the sample.
Table 1. The number of localized corrosion sites (pits) in a single grain at various times denotes the location of localized nucleation sites (pits) on the polished, cold-mounted pure magnesium sample.
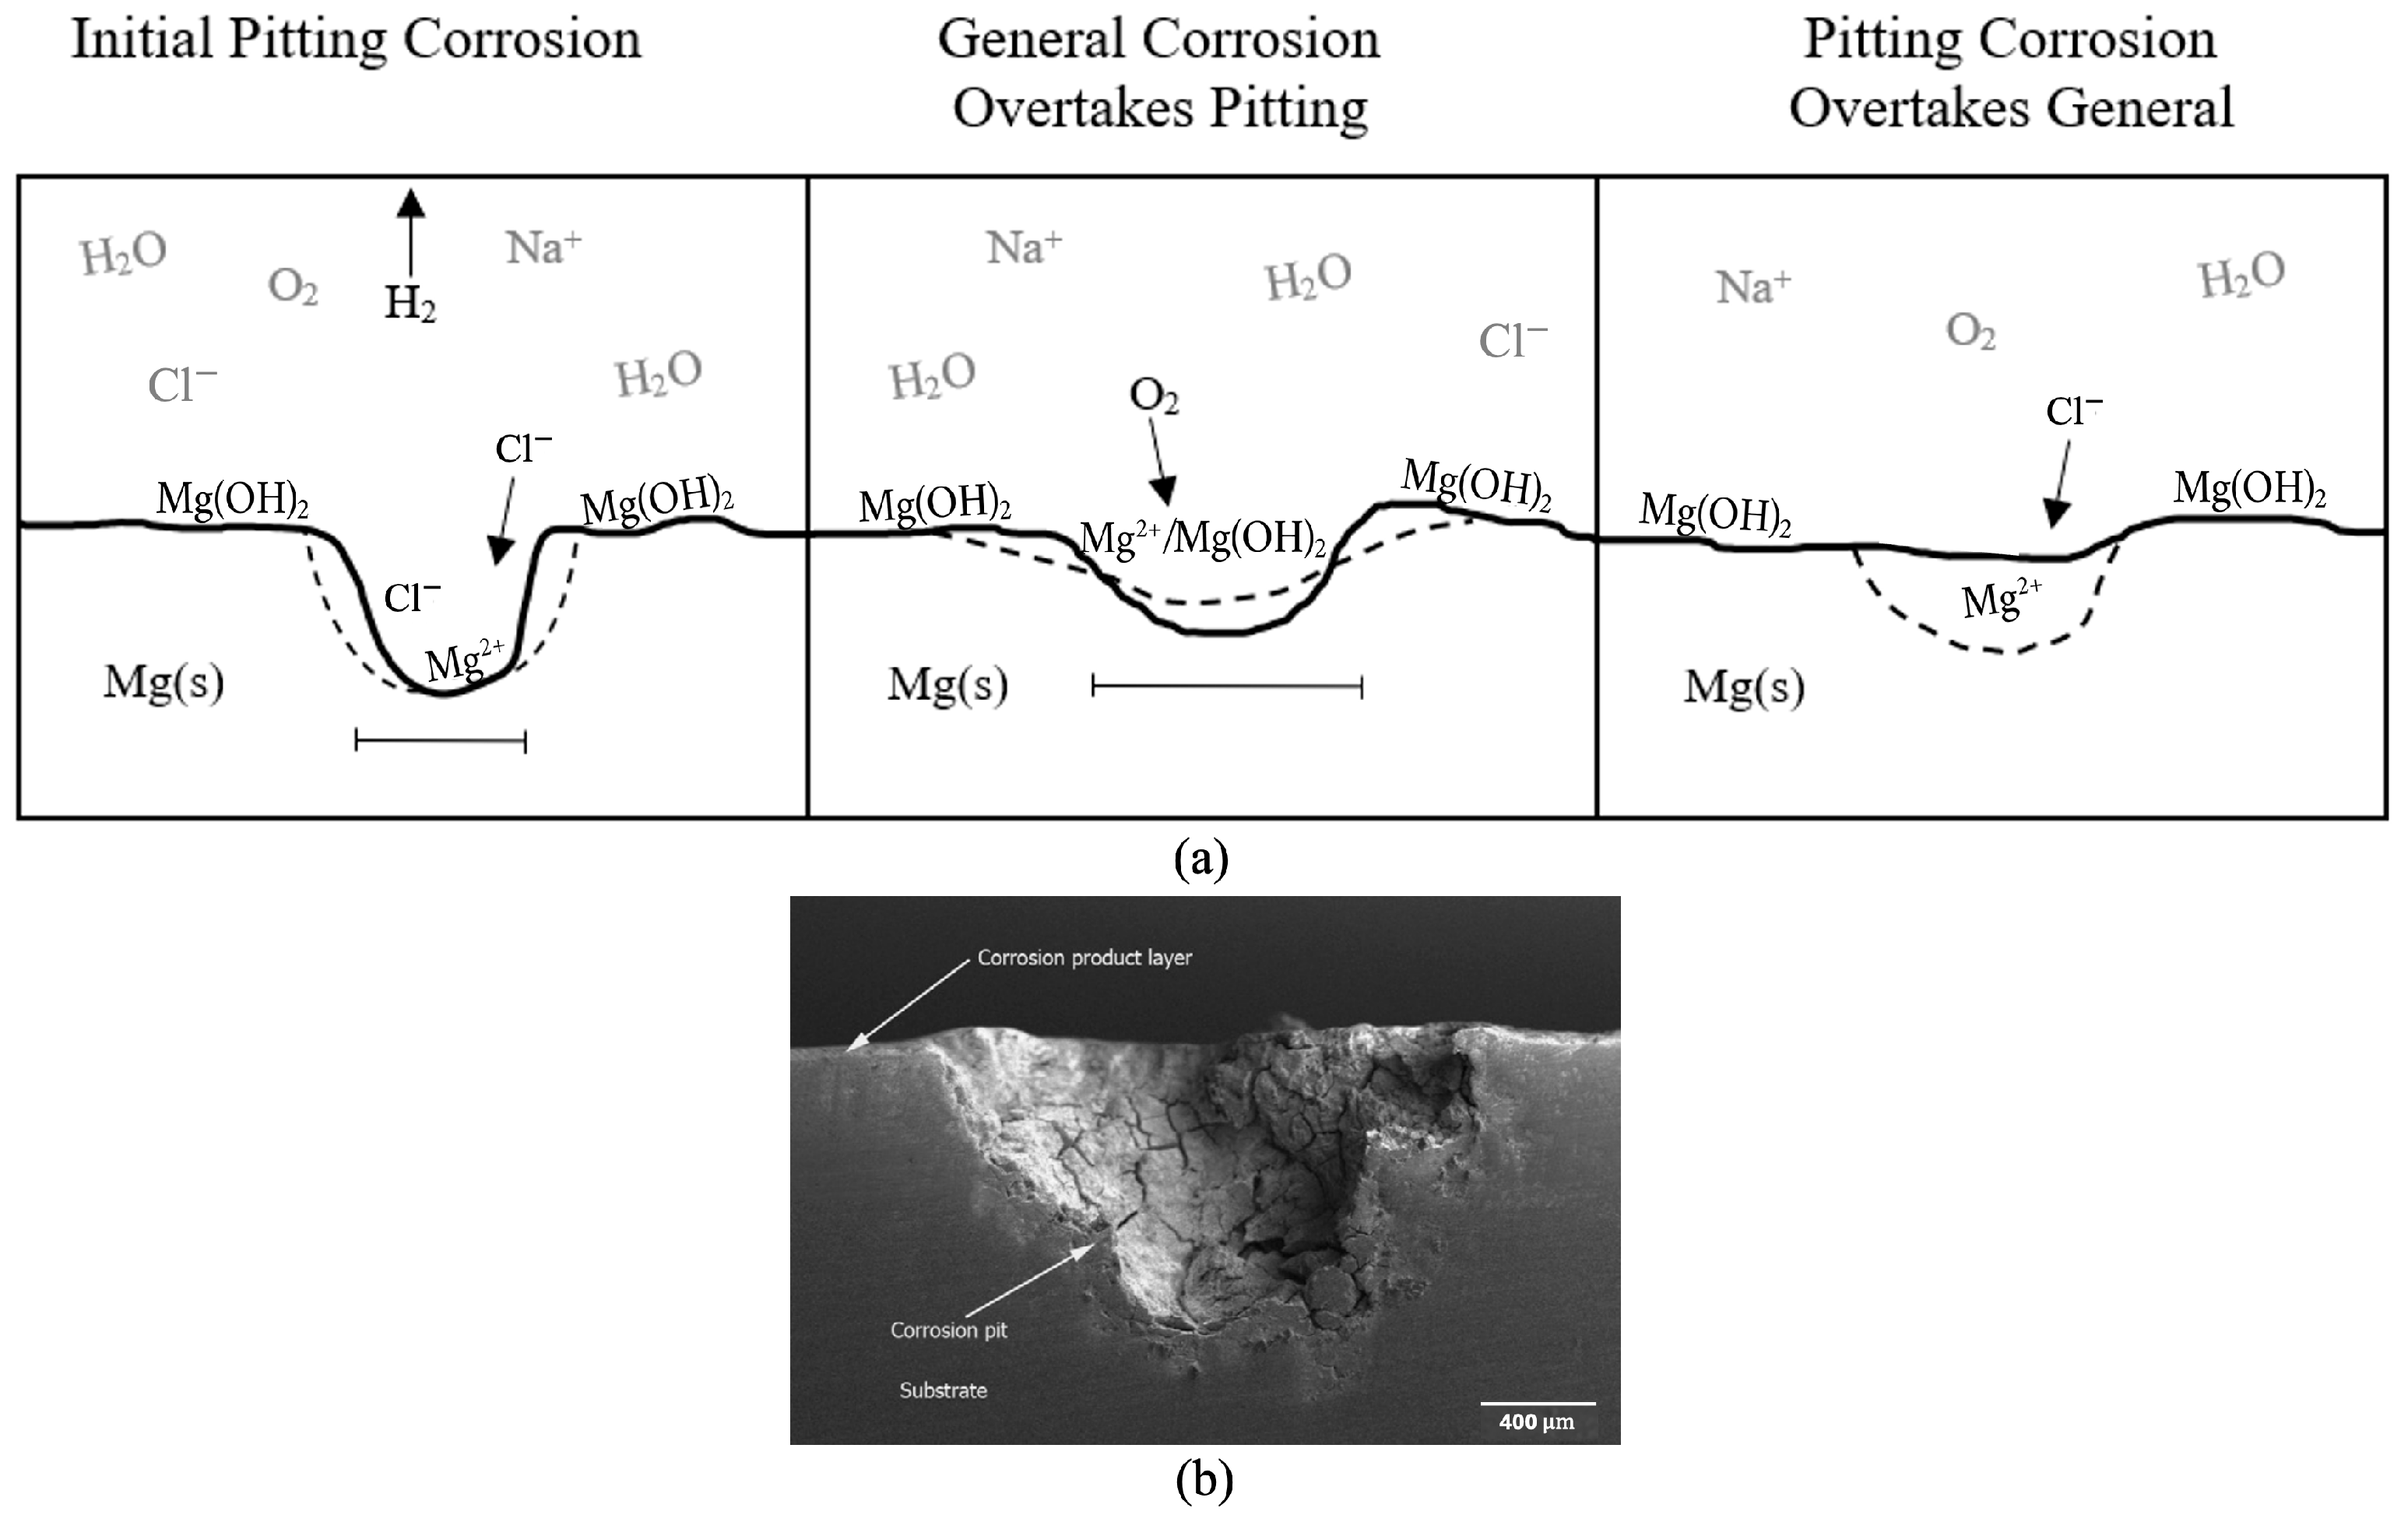
Figure 3 shows a diagram of the corrosion progression that was observed and could be expected for any geometry, and an associated pit image that was retrieved from Scanning Electron Microscopy. Magnesium does not readily maintain a protective oxide layer, or passivate, when exposed to the environment, unlike steel [,], although an insoluble, weakly bonded magnesium oxide film, MgO, can be formed. As a result, magnesium undergoes localized corrosion at a much greater rate due to the uninhibited exposure of the pure magnesium surface to the corrosive species. Chemical reactions tend to occur in the most energetically favorable way to restore equilibrium [,,]. This occurs on both a local and global level in a system. Because there is little sustained passivation in magnesium, there is a continual surplus of reactants (Mg metal atoms) that pushes the equilibrium towards the products via the most energetically favorable path. Therefore, the initial localized corrosion that readily occurs in magnesium is the most energetically favorable path for corrosion to occur in the early hours of testing. Therefore, the assumption is made that the localized corrosion depth observed in the surface roughness analyses (Figure 3) is due to “pitting” effects and is not affected by added thickness from a protective oxide layer.
Figure 3. (a) Diagram of the sequence of corrosion on the surface of the pure magnesium samples. The localized pitting corrosion with chloride attack is pictured first, then the general corrosion overtakes the pitting corrosion through O2 passivation. Finally, the pitting again takes over because the chloride ions once again attack the magnesium hydroxide surface. (b) Actual pit image from SEM.
From Figure 3, we ascertained that the initial pitting corrosion with chloride anion attack is pictured first (0–30 h). The chloride ions caused local breakdown of the rapidly formed protective film. These negative ions continued to draw in positive hydrogen ions that react with the available electrons and create positive magnesium ions inside the pits until the cross-sectional area was large enough for dissolved oxygen to enter and repassivate the surface of the pits. This is because magnesium hydroxide, Mg(OH)2, is only lightly soluble in water, but is soluble in an acidic environment, which would be present in the pits due to the presence of chloride and hydrogen ions. Pictured second is the general corrosion overtaking the pitting corrosion through O2 passivation (30–84 h), forming Mg(OH)2 and MgO. Once the surface was lightly repassivated, general corrosion became the dominant mechanism to smooth out the surface of the sample, as the entire surface was covered with a layer of Mg(OH)2. Pictured third is the pitting again dominating because the chloride ions once more dissolve the magnesium hydroxide film and form local pits, or the magnesium hydroxide film flakes off the surface, freeing up fresh magnesium to form pits. This increased pitting was seen from 84 to 108 h. During this time frame, the pit depth increased, signifying an increase in surface roughness and a decrease, in general, corrosion. The magnesium surface would cycle through these mechanisms until all solid metal was corroded.
One way to measure general corrosion was to quantify the thickness loss of the pure magnesium specimens, which occurred when the magnesium reacted with the aqueous environment to form a magnesium hydroxide film, according to the following equation:
Mg (s) + 2H2O → Mg(OH)2 + H2
While the film was protective, the aqueous chloride anions rapidly dissolved the protective film by reacting with the film to produce the following chemical reaction:
Mg (s) + 2NaCl + 2H2O → Mg(OH)2 + H2 + 2Na+ + 2Cl
Thus, a fresh magnesium surface was exposed to the corrosive environment. Through this mechanism, the thickness and mass loss occur [,,,]. The presence of dissolved oxygen can change the equilibrium and drive the reaction to produce more Mg(OH)2 and MgO and reform the lightly protective film [,]. General corrosion also decreased in the pitting effects, as it has a morphological smoothing effect on the surface, decreasing both the pit size and depth []. As the general corrosion takes over, the pits become smaller until the surface is smoothed. Then the chloride anions dissolve the protective film to form pits, and the cycle begins again.
The intergranular corrosion for pure magnesium was negligible in the polished sample after one hour of corrosion (Figure 2). Twins, or partial misalignments, were observed throughout the surface of the polished magnesium sample prior to corrosion. Optical images of a single pit at the different time increments showed that pit nucleation primarily occurred at twin boundaries, grain boundaries, and intragranular sites on previously existing surface defects (Table 1). These areas are particularly susceptible to corrosive attack because of the additional space provided by the misorientation of atoms and notches or ridges on the surface. Aung et al. [] observed that intra-granular corrosion (general corrosion) in the α-Mg grains dominated over inter-granular corrosion in AZ31 magnesium alloy. Walton et al. [] expounded on this observation for AZ31 by noting that the inter-granular corrosion area fraction (ICAF) is directly related to the formation of β-phase Mg17Al12 on the grain boundaries. The same trend of negligible intergranular corrosion was observed in pure magnesium, though for different reasons, as there was no β-phase. Since the grain boundaries are not cathodically protected by the β-phase, a very similar pit nucleation rate was observed throughout the entire sample with no particular preference for the grain boundaries. Since we do not have the β-phase in this pure magnesium, the intergranular corrosion mechanism is considered equivalent to the pitting corrosion and is not considered a separate corrosion mechanism. Considering the large grain size of pure magnesium, as well as the rapid nucleation and growth of pits that initially occurred, followed by significant coalescence of pits and general corrosion, the expectation was that there would be only negligible intergranular corrosion, as was observed. However, another factor that must be considered is the presence of twins, which has also been shown to increase the corrosion rate [].
The presence of twins generally accelerates the intragranular corrosion rate in magnesium alloys []. Twinning is prevalent in pure magnesium and magnesium alloys because of the constraints from the hexagonal close-packed atomic configuration. Twinning creates a partial misorientation that is vulnerable to corrosive attack by chloride anions, as there is additional space for the attack to occur. When looking at Table 1, the pit number was comparable at all three times for the three locations, namely twin boundary, grain boundary, and within the grains, in the corrosion environment, thus signifying that pit nucleation occurs almost evenly at twin boundaries, grain boundaries, and surface defects. This data indicates that, for intergranular corrosion to preferentially occur at the twin boundaries, additional elements must be present, which causes a change in the corrosion rate.
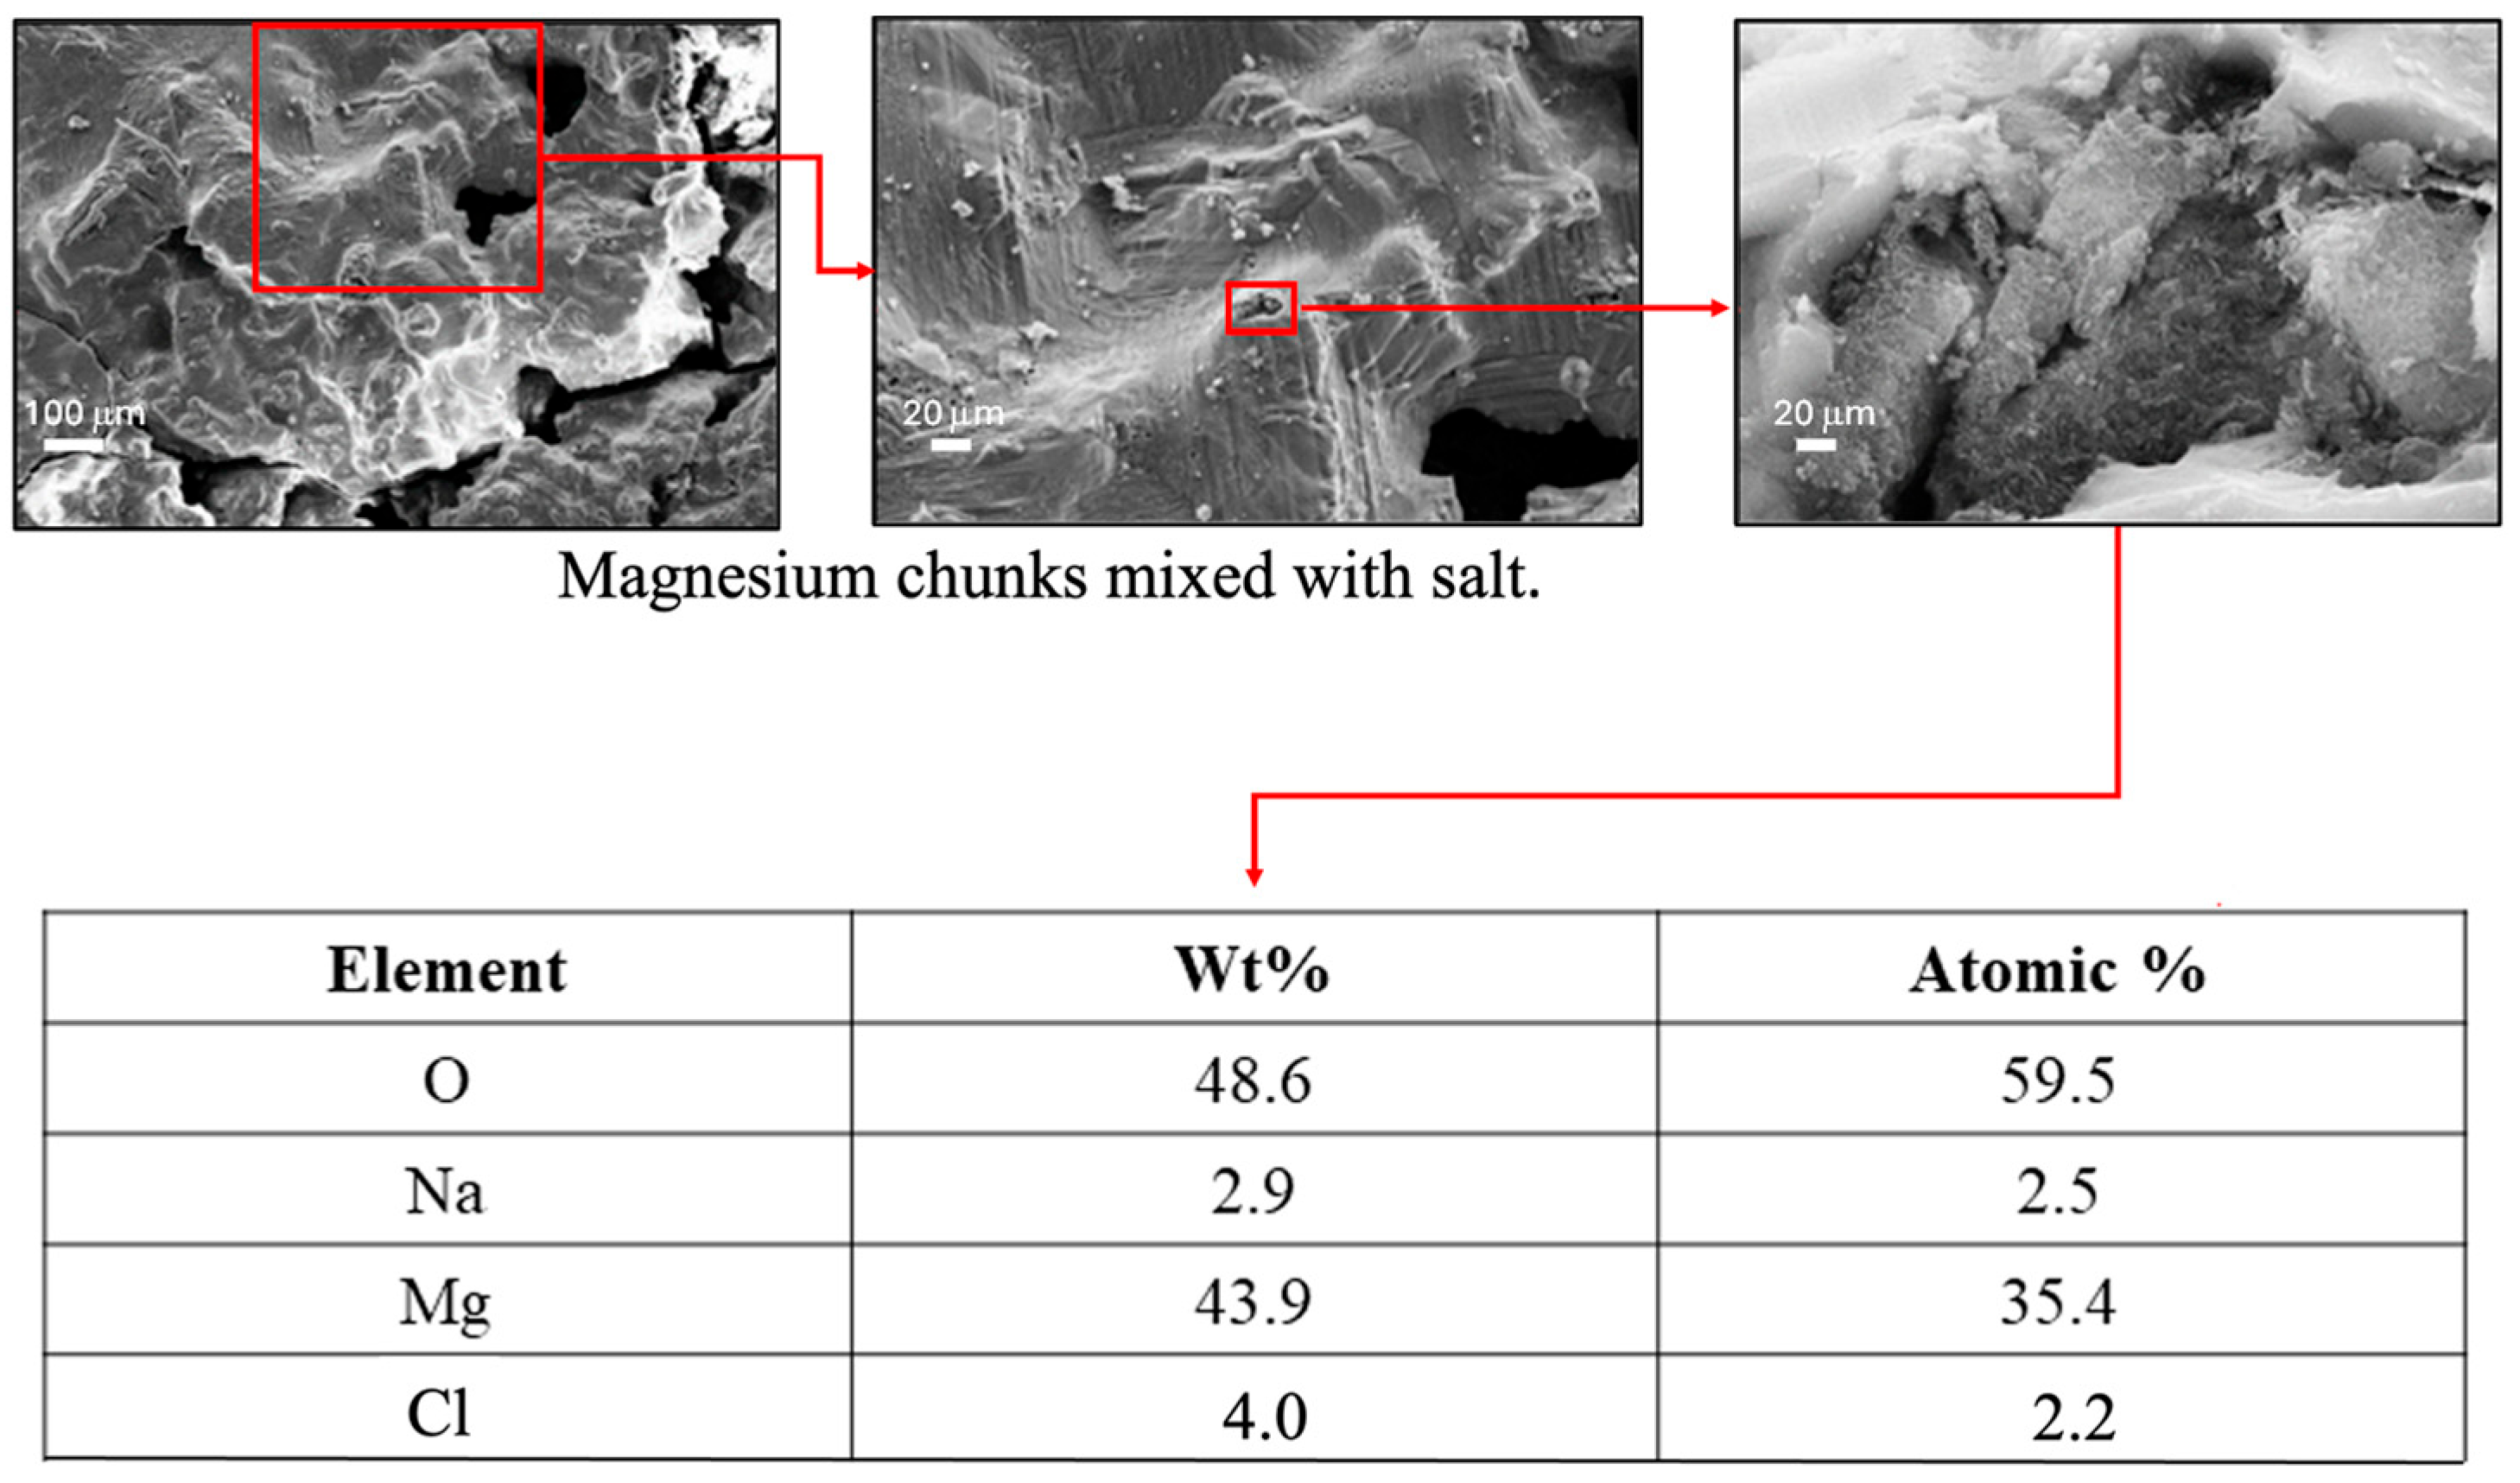
Following each increment of testing, Scanning Electron Microscopy (SEM) and Energy Dispersive X-Ray Spectroscopy (EDS) were performed on the corrosion products formed during the tests to determine the precipitate’s chemical composition. Figure 4 shows (a) the precipitate that formed during the corrosion experiments at 90×, along with SEM images of the precipitate at magnifications of (b) 250×, and (c) 4780×. Figure 4 also shows the EDS analysis results. The sizable percentage of magnesium and oxygen denotes the presence of MgO and/or Mg(OH)2. Since these are both corrosion by-products of water and magnesium, the presence of both would further indicate that corrosion is occurring, with the removed magnesium forming precipitates that fall out of solution.
Figure 4. A precipitate formed during the corrosion experiments and Scanning Electron Microscope (SEM) images are shown of the precipitate at sequentially 90×, 250×, and 4780×. Energy Dispersive Spectroscopy (EDS) was performed to determine the chemical composition of the precipitate. Note the large percentage of magnesium (Mg) and oxygen (O), denoting the presence of MgO and/or Mg(OH)2. Note also that a small amount of NaCl is present.
After each increment of testing, all specimens were cleaned in DI water, sonicated for 15 min in DI water, weighed, and analyzed with the laser profilometer (Talysurf CLI 2000, Taylor Hobson Precision Ltd., Leicester, UK). As such, no solid remnants were left on the surface. Laser profilometry was performed following each corrosion increment. In general, a 1 mm by 1 mm area was scanned using a laser beam profilometer for a duration of 3 h 42 min at different locations on each specimen. The scanning speed was 500 µm/s, with a spacing of 0.5 µm and a resolution of 2001 points. For example, Figure 5 shows results from laser profilometry measurements of the surface of the pure magnesium surface at different times: (a) t0 = 0 h of corrosion showing distributed uniformity at the micron scale, (b) t36 = 36 h of corrosion showing differences between 30 microns and 160 microns, and t108 = 108 h of corrosion showing changes in surface up to 475 microns (0.475 mm). The greatest corrosion penetration occurred on the cold-mounted cube face at t108. Upon completion of the corrosion tests, the laser profilometry 2D images were analyzed using ImageJ (https://imagej.net/Welcome, accessed on 3 November 2025) [] software to determine the number of pits, average pit area, and pit area fraction.
Figure 5. Laser profilometry measurements of the surface of the pure magnesium cube (face) to illustrate the corrosion at different times: (a) t0 = 0 h showing distributed uniformity at the micron scale, (b) t36 = 36 h showing differences between 30 microns and 160 microns, and (c) t108 = 108 h showing up to 475 microns (0.475 mm). The greatest corrosion penetration occurred on the cube face at t108.
The development of the surface roughness of magnesium over the testing period can be observed in Figure 5. The pit depth and pit area both exhibited a marked increase with time as can be qualitatively observed by the assorted colors in Figure 5. Figure 5a–c shows the progression of localized corrosion over time. In Figure 5a, the range from dark blue to red-pink is 29 μm, indicating a relatively smooth surface. Slight unevenness was observed on the surfaces prior to corrosion, but the surface roughness range varied by less than 40 μm for all three regions across the 1 mm by 1 mm area that was analyzed. After 36 h (Figure 5b), the range from dark blue to red-pink has increased to 190 μm. The dark blue areas are very wide, indicating the development of a pit, as indicated by the indented area. Where pits have not formed, the surface is red, indicating height. After 108 h (Figure 5c), the range from dark blue to red-pink is 0.45 mm, indicating the growth of the pits into the magnesium. Looking at the pit that is present on the left side of Figure 5c, one can see that the pit is covering a large area, denoting pit growth and coalescence. The red-pink surface on the right side of the image demonstrates that general corrosion has evened out a portion of the surface as well.
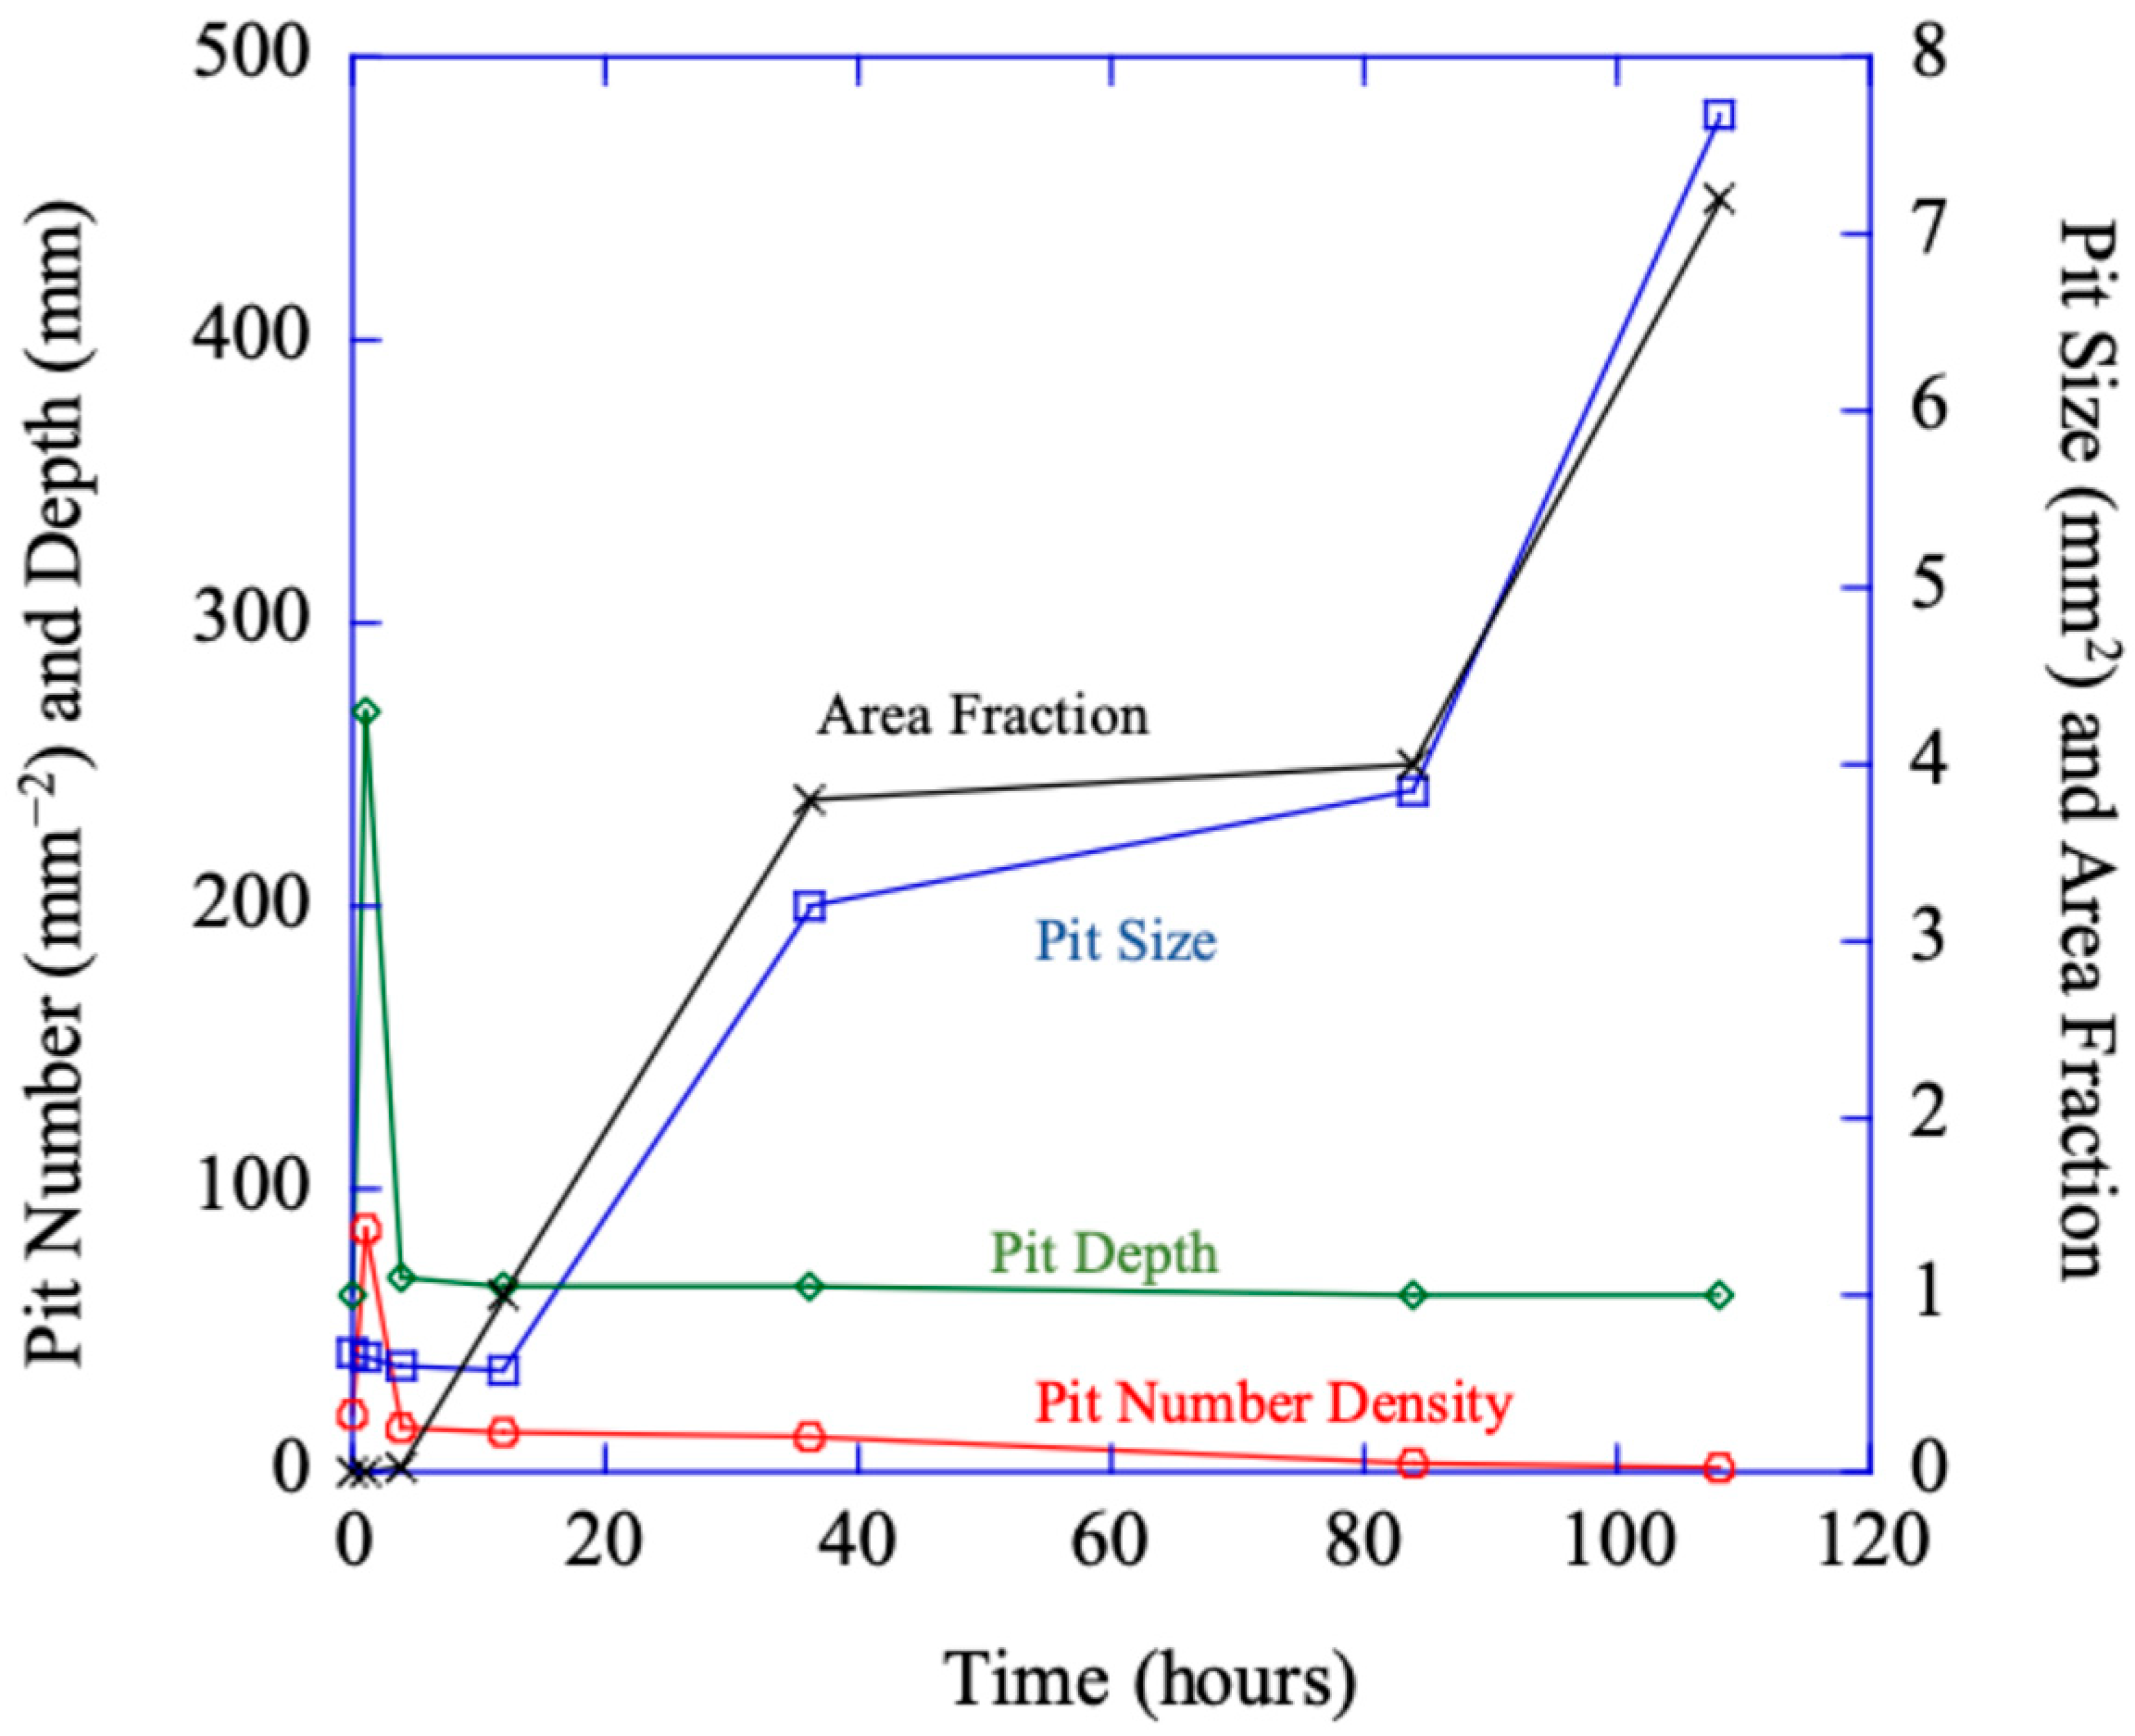
Figure 6 makes the point that the total damage (area fraction) is most related to the pit size and not the number density or pit depth. Figure 6 shows the pit number density (hp in Equation (2) reflecting the localized nucleation events), volume (size) changes (vp from Equation (2)) over time, the pit depth over time, and area fraction (fpc from Equation (2)). Figure 6 shows a similar initial increase and then drop-off for the localized pit number density and pit depth from all three regions. The increases and decreases in pit depth in the different regions denote the mechanism change from localized to generalized corrosion. Figure 6 shows that after 12 h, the localized pit size (vp) and the total volume fraction (Φpc) garnered from the ImageJ [] results dramatically increased, which effectively summarizes the multiplication of the number of localized corrosion sites and localized corrosion area. This experimental data shown in Figure 6 concurs with the multiplicative decomposition of the area fraction equaling the pit number density multiplied by the pit (size) area on the surface shown in Equation (2).
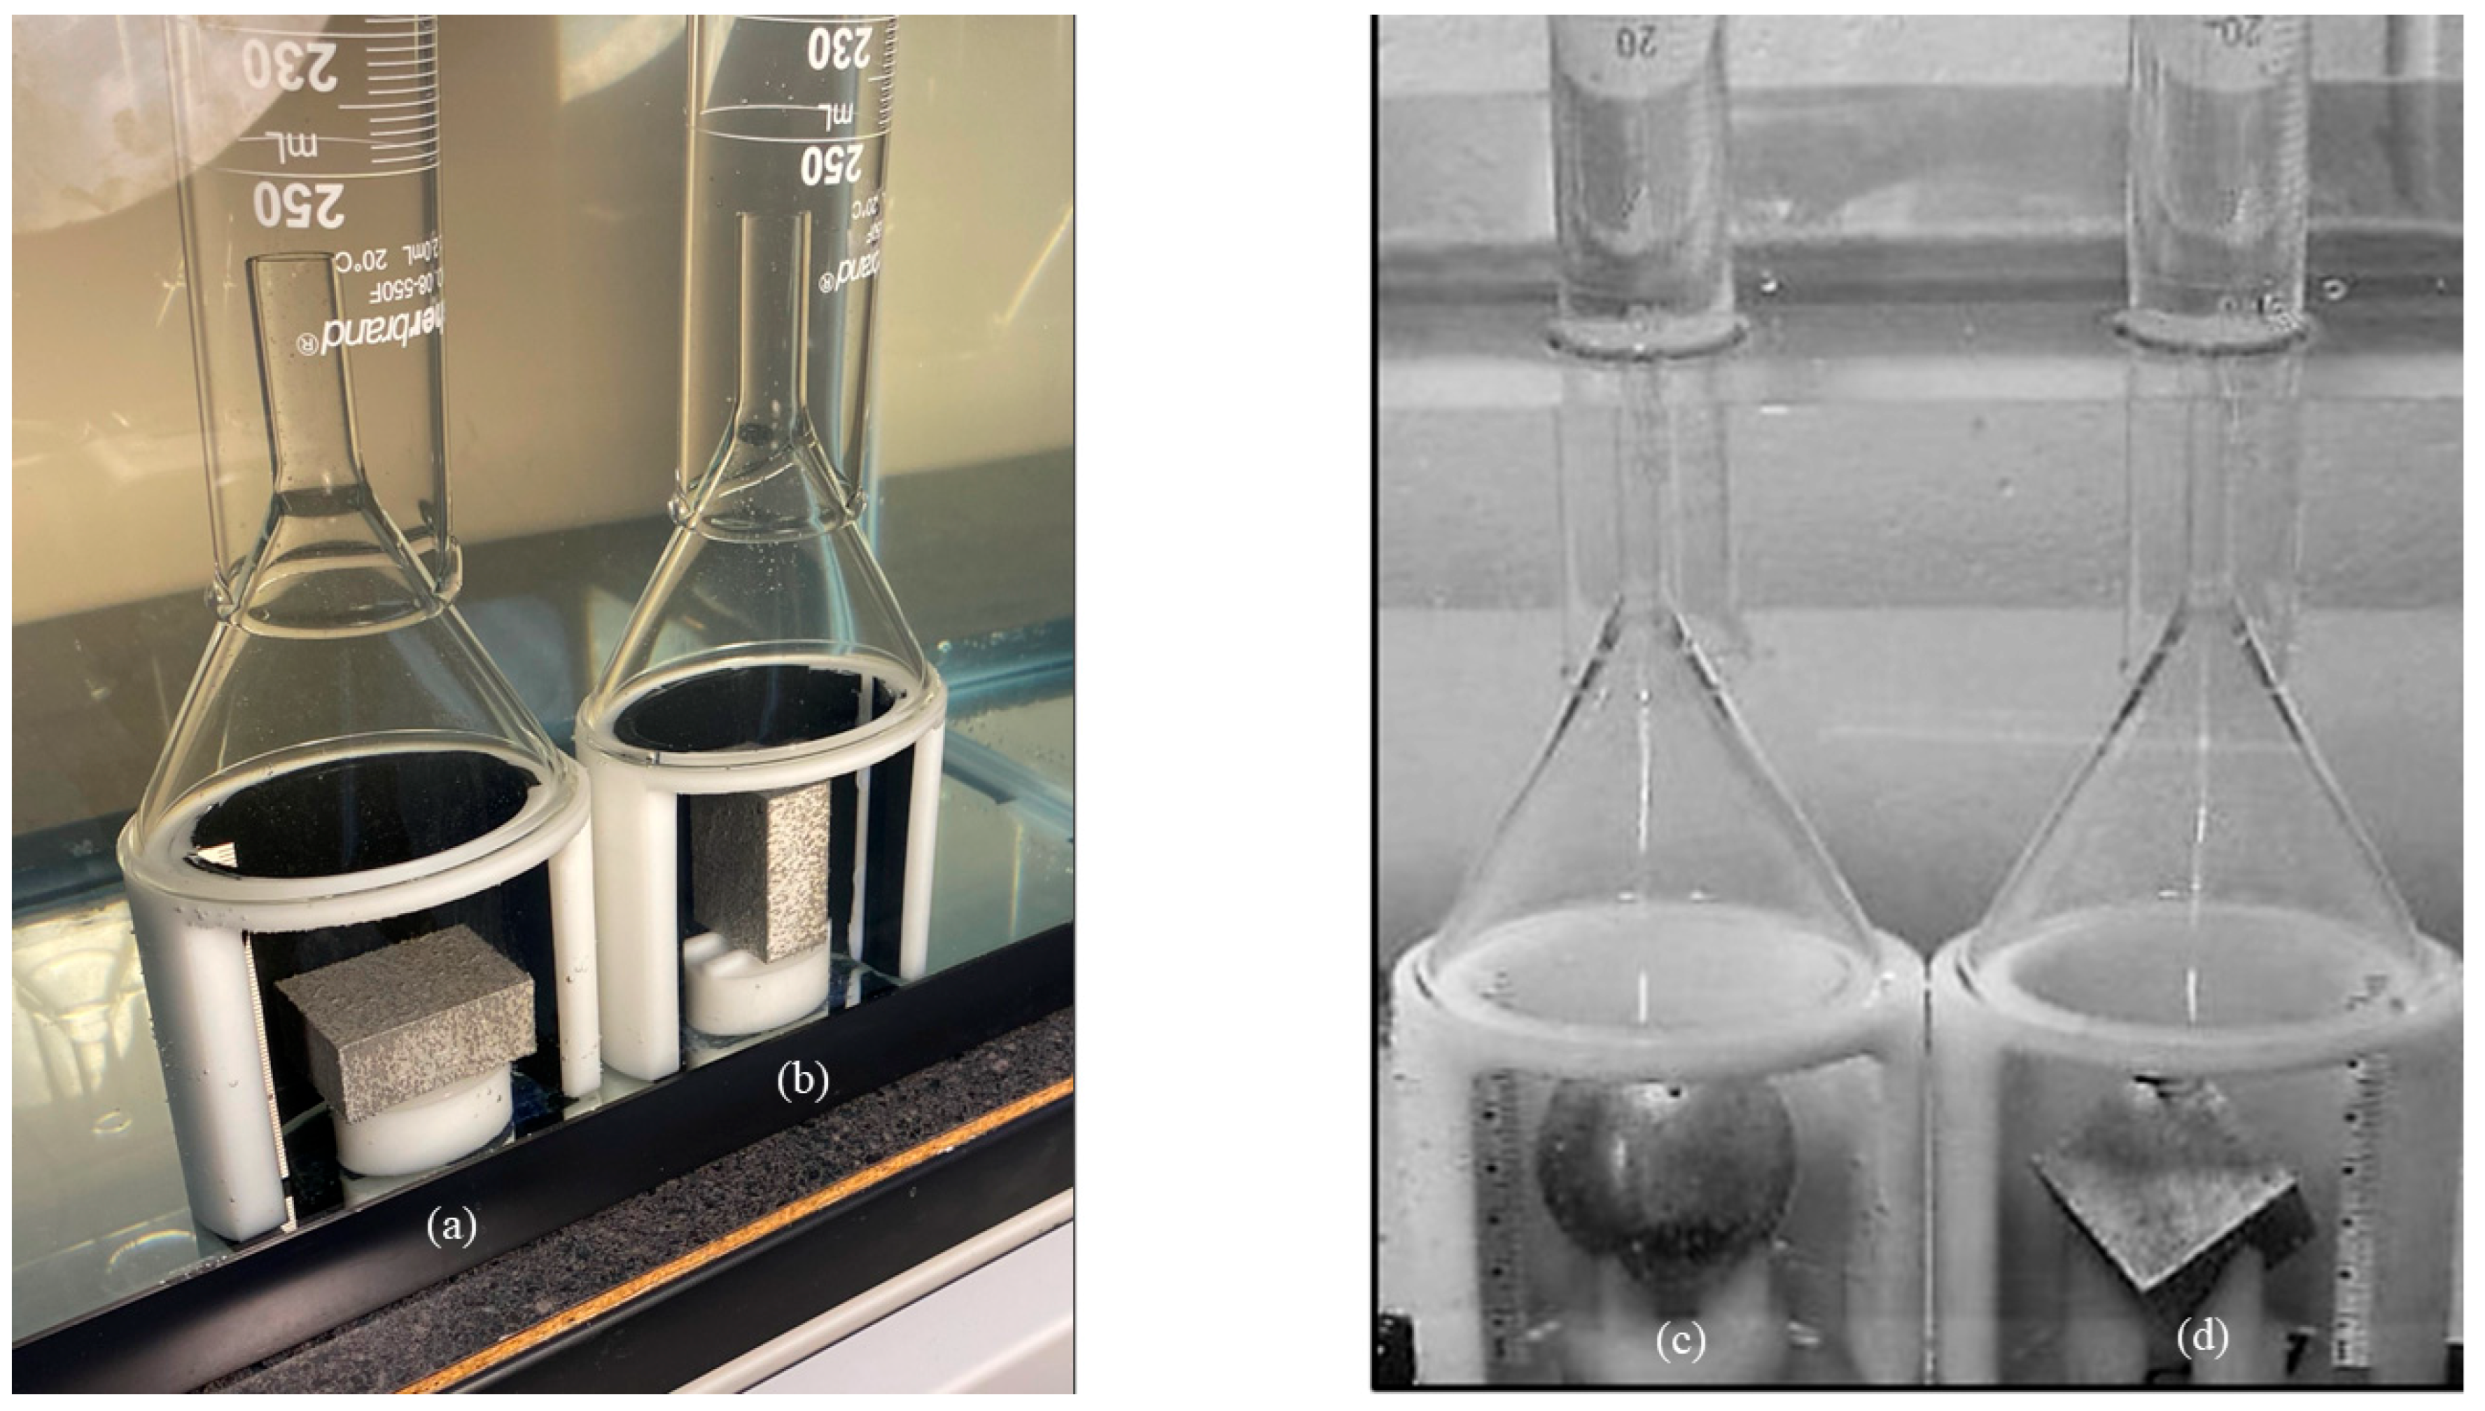
Figure 6. The pit number density (reflecting pit nucleation events) and the pit depth show the same trend as a function of time (hours) in pure magnesium. Note the almost immediate growth in the number and size of the pits, and then the drop-off. Conversely, the pit size and surface area fraction also show the same trend, which is different from the number density and depth trend. At the beginning, the pit size and area fraction were slow to increase, and then dramatically increased as the pits had already nucleated.

4. Results and Discussion: Geometry Differences in the Specimens

4.1. Fluid Flow Around the Geometries

The materials science corrosion community has developed different concepts of corrosion based upon mechanisms (see ASM Handbook []). If the different geometric effects play a role in affecting the corrosion rate or mechanism transfer, then one should consider geometries similar to the boundary condition for a mechanical stress field created by a local notch. Figure 7 shows that a bubble-induced fluid flow from the four different geometries: (a) vertical plate (VP), horizontal plate (HP), (c) cube, and (d) sphere. The white arrows in Figure 7 show the magnitude and directions of each flow pattern that arose from the bubbles and particles resulting from the chemical corrosion of the magnesium surfaces and structures. Note the differences in the flow of bubbles from each of the different geometries, where the diameter, d, is the diameter of the bubble flow at the top. Also note that the thickness of the arrows designates the velocity amplitude increase.
Figure 7. The fluid flows observed around the (a) vertical plate (VP), (b) horizontal plate (HP), (c) cube and (d) sphere demonstrating the flow of bubbles and particles resulting from the chemical corrosion of the magnesium surfaces and structures. Different flow paths were observed with white arrows on the images. Note the differences in the flow of bubbles from each of the different geometries where the diameter, d, is the diameter of the bubble flow at the top. Also note that the thickness of the arrows designates the velocity amplitude.
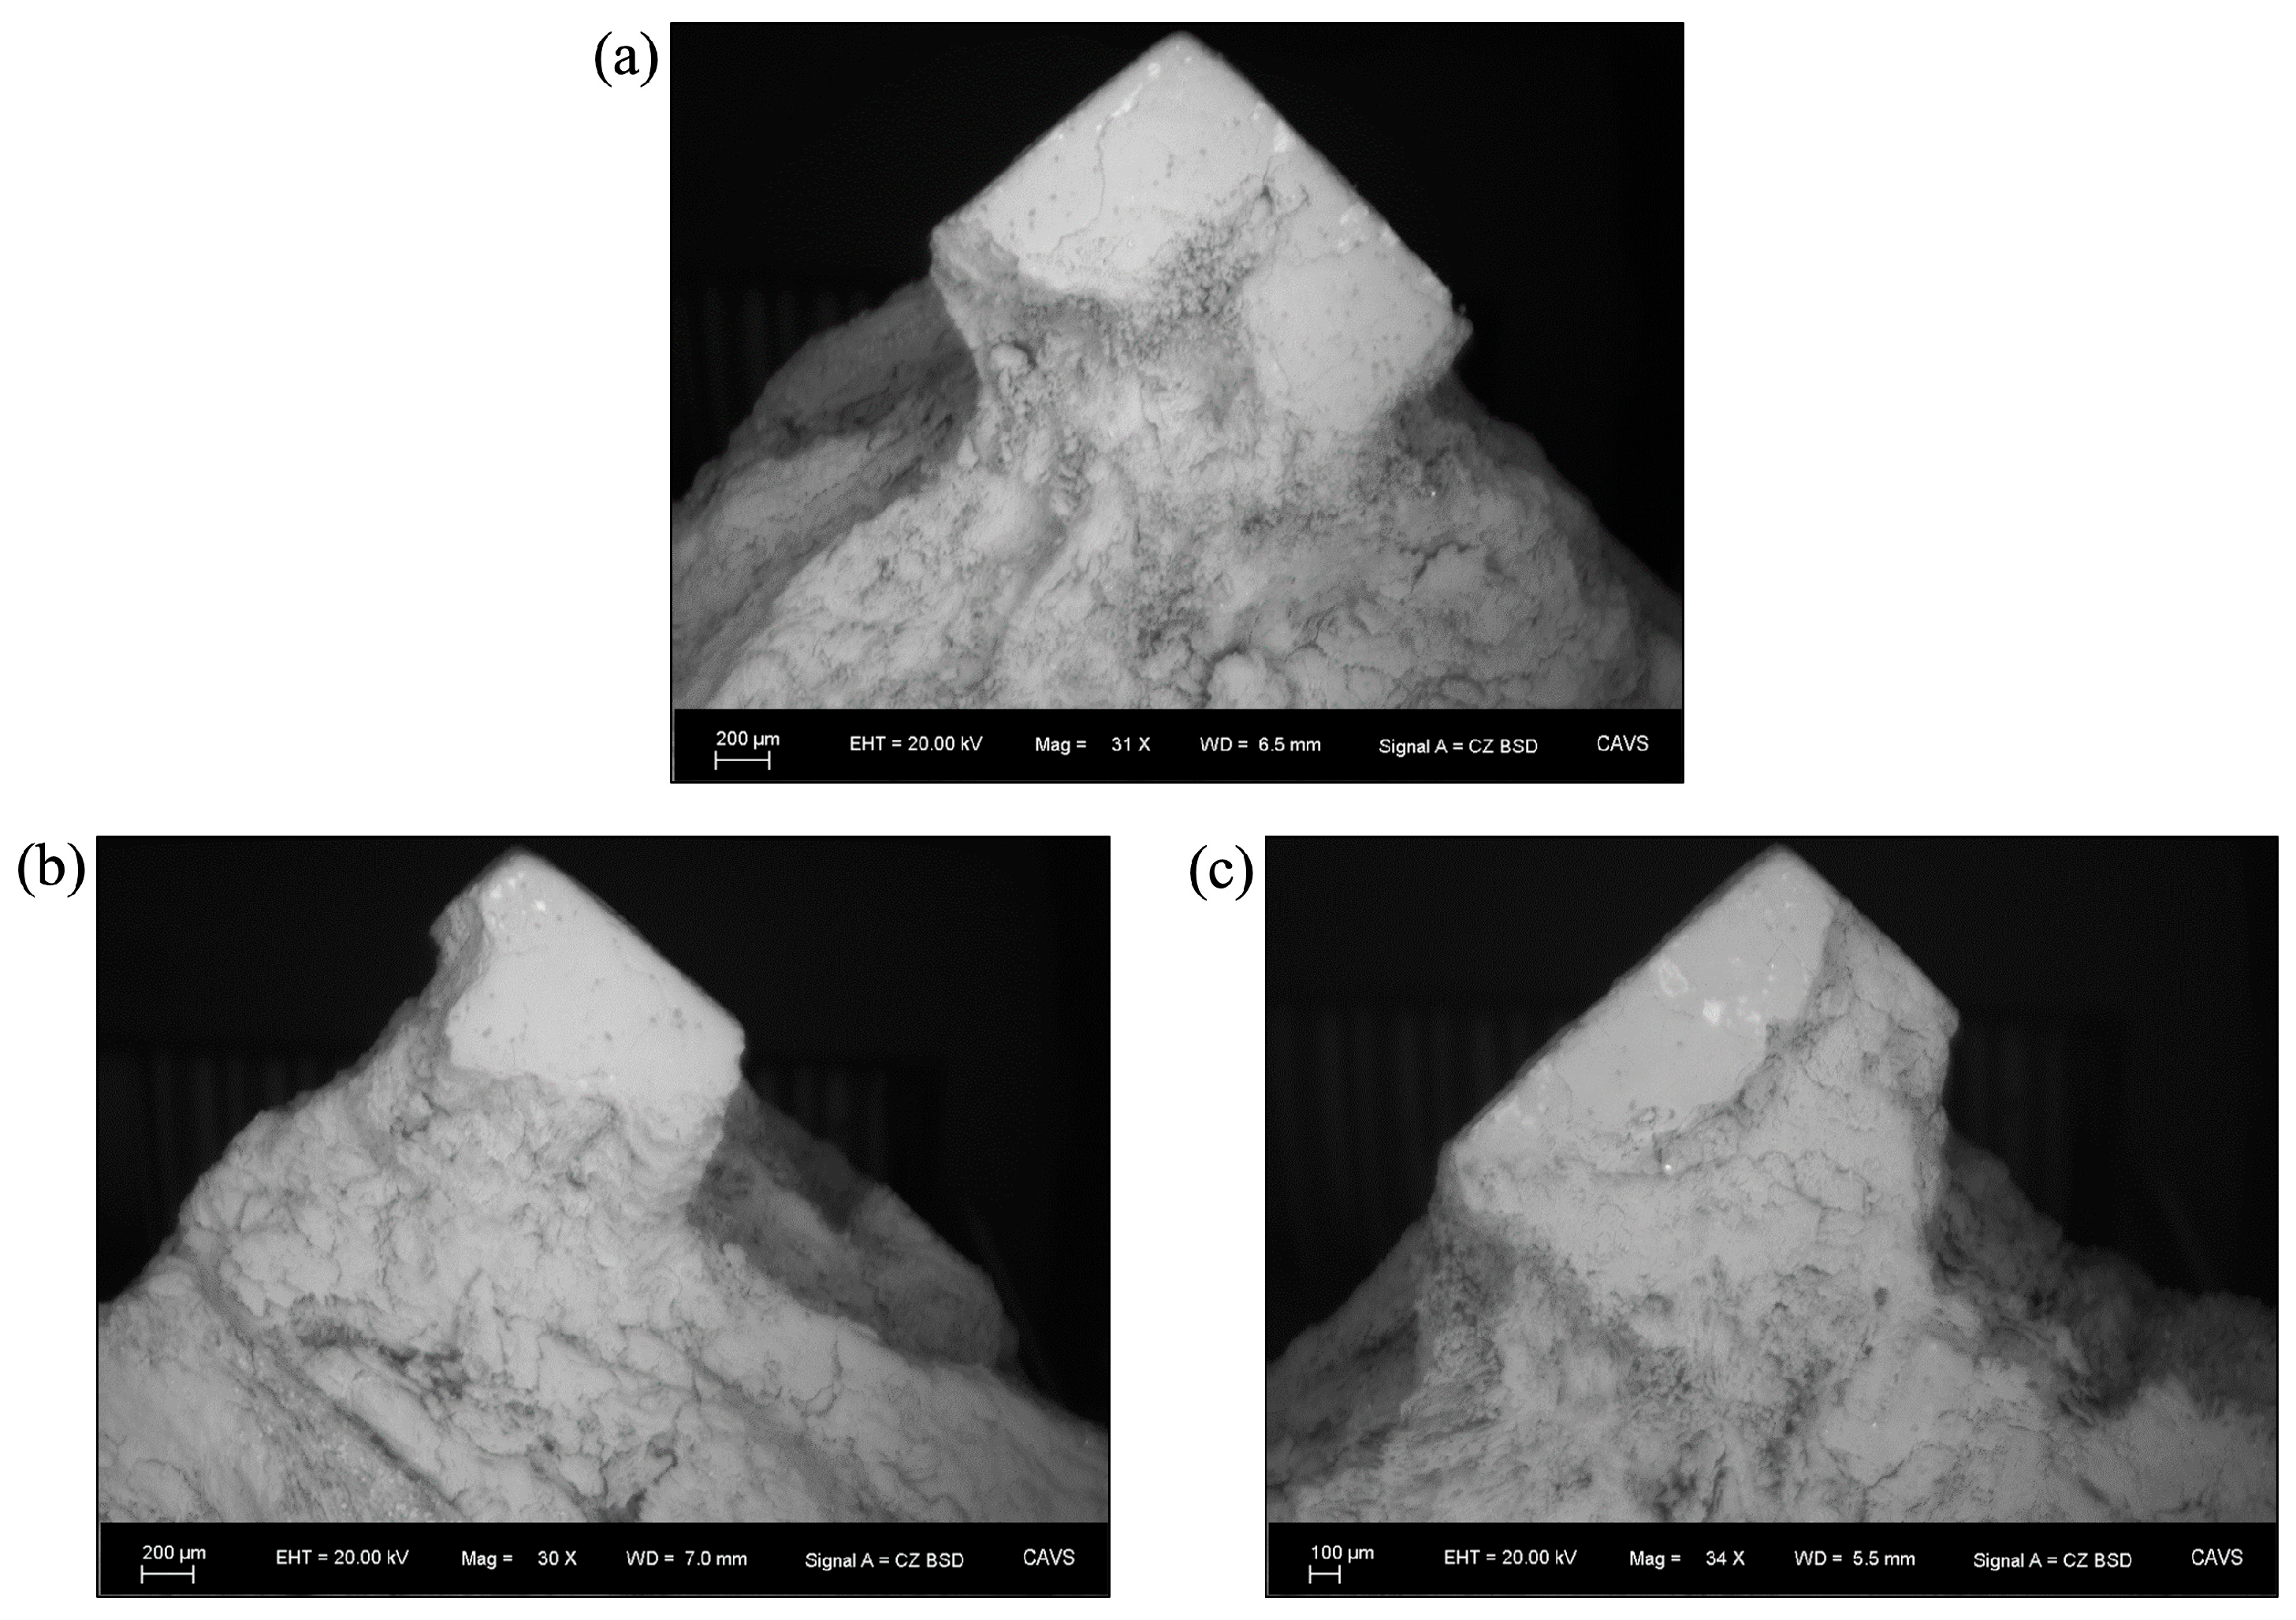
One expectation was that the corners and edges of the plates and cube would corrode first, due to the buoyant flow of hydrogen gas around the plates/cube as its surface-area-to-volume ratio is greater than the other portions of the magnesium specimens. If true, one can assume that corrosion occurs preferentially at sharply defined geometry points in structures. However, four of the eight corners of the cube were still present after 108 h of corrosion as observed via SEM. Figure 8 shows the continued presence of the top corner after 108 h of corrosion (also, the bottom corner was preserved). Four of the six equatorial corners were corroded, possibly due to the local microstructural properties at those specific areas []. Also, a plausible reason that some of the corners remained could be due to the location of the hydrogen bubble flow produced from the magnesium’s chemical reaction with salt water.
Figure 8. Scanning Electron Microscope (SEM) images showing the top corner of the cube and viewed from (a) the front at 31 times magnification, (b) the right side at 30 times magnification, and (c) the left side at 34 times magnification. Note that the tip of the corner was present even after the edges were rounded from corrosion.
The fluid mechanics of bubble-induced liquid phase natural convection affected the corrosion rate, particularly that of the corners, as evidenced by three different observations. First, we observed that the cube top corner was preserved, and the flow of bubbles left the magnesium surface before reaching the tip of the top corner, as illustrated in Figure 7 and Figure 8. Second, although no pictures are presented in this paper showing the bottom corner, it also did not corrode. Clearly, the top and bottom corners experienced little to no bubble flow, while the equatorial corners experienced the most bubble flow. Thirdly, there was an interacting fluid flow between the equatorial corners that also played a role in the corrosion. Here, buoyancy-induced liquid flows created vortices that arose due to different adjacent heights of the corners (two different planes).
The bubble-induced flow created a local erosion–corrosion environment. Huang et al. [] and Zeng et al. [] showed that the erosion–corrosion rate was an order of magnitude greater than the immersion corrosion rate in 3.5% NaCl solution for magnesium alloys. Figure 7 shows clearly that each geometry experienced bubble-induced erosion–corrosion in addition to immersion corrosion, and that all four geometries behaved differently from each other. Note that the diameter (ds) of the multiphase plume for the sphere was greater than that (dc) of the cube. Hence, both the bubbles and the particles illustrate that the flow of entities in the water affected the total corrosion rate, and the mechanism changed from localized to generalized corrosion. The assignment of a plume diameter was determined by the height from the bottom. Different heights could give different plume diameters; however, trends would remain the same. From Figure 7, we can clearly identify that geometry played a role in the different corrosion mechanisms as well as the flow of bubbles and particles around the magnesium specimens.
Boissonneau and Byrne [] conducted an experimental evaluation of bubbles that were induced in a sodium sulfate water solution in which the bubbles caused a transition from laminar to turbulent flow. Bubble-induced multiphase flows are as commonplace as they are critical in many chemical and mechanical engineering processes. The bubble-induced flow for the magnesium structures is similar to that from a Bubble Column Reactor (BCR) []. Bulk BCR agitation, often involving very large-scale industrial vertically oriented cylinders, is driven solely by bubble-induced natural convection. There is a spectrum of characteristic bubbly flows in a BCR, ranging from laminar “bubbly flow” to violent “churn turbulent” flow. However, generally speaking, bubble shapes and sizes are determined by the specific bubble feed apparatus for “bubbly flow,” while a “churn turbulent” evolving plume self-determines its bubble shapes and sizes. Natural convection drives bubble collisions and break-up, and those, in turn, control bubble sizes, which cycle back to the rise rate of the bubbles and then the plume velocity. In all cases, the goal of the BCR is to create interfacial area between the gas and the liquid; the cumulative interfacial area represents the only region of heat/mass transfer between the two phases and limits the rate of chemical reaction (and, by extension, process throughput). While our magnesium specimen corrosion scenario is most definitely operating in the “bubbly flow” regime, bubbles also control the corrosion reactions. As previously implied, this control is only indirect as follows. The lift-off of the bubble from the surface creates a local region of low pressure and relatively high velocity. The existence of a low-pressure region will be discussed later, but the localized high velocity replenishes the metal surface with fresh reactants. In addition to that, bubbles drag the liquid along while they rise. The liquid accelerates in response to that drag due to momentum transfer. Then, bubbles disengage from the upper liquid surface, and, by mass conservation, the liquid must return (sink) back down into the tank. The induced bulk stirring then replenishes more regions with reactants, which produces bubbles, and so on.
With this backdrop, a more detailed comparison of the plume behavior of the different geometric structures can be elucidated. As bulk stirring in the tank develops into its full character, apparently after approximately 36 h, the liquid flow over the specimen can be thought of in terms of an external boundary layer flow. Adverse pressure gradients were created by the liquid phase, and those gradients encouraged the liquid boundary layers to separate from the objects. Vorticity, which was already present in the boundary layer, then produced 3D flow structures [] that interacted with the bubbles. This separation was greater around the equatorial cube corners than it was around the sphere and/or top and bottom plate edges/corners. The greater separation induced lower pressure and higher velocities in those regions. The higher velocity replenished the reactants and facilitated the reactions. Then, bubbles were formed more quickly, and the process continued. Natural circulation could not either mechanically or electrochemically flush the top and bottom corners when compared to the other regions of the cube. The lower pressure at the equatorial corners was the reason the bubbles clung to the cube and followed the surface and edges, which would otherwise be the most resistive path. Due to the fact that the early corrosion rates were comparable between the plates, cube, and sphere, the obvious cause of the differentiated corrosion rates later in the tests was the development of the bulk stirring character and resulting external boundary layer flow.
We also note that the hydrogen bubble rate could be greater even with a smaller region experiencing corrosion. In other conditions and wider regions, there could be a greater corrosion rate just because of the greater surface area. These nuances need to be determined in the future with computational fluid dynamics simulation to determine the various mechanisms.
Hence, the application of a material model and a fluid dynamics model that predicts corrosion must account somehow for these previously ignored aspects of corrosion. In particular, bubble-induced flow, along with particle-induced flow of water, clearly played a role in the corrosion rate of the magnesium studied here. The observations made herein can lead us to the conclusion that other corrodible materials, such as steel alloys in the hull of a ship or submarine, would experience different corrosion rates depending on the different designs and the resulting flow rates of salt water around the vessel.

4.2. Mass Loss Differences Between the Different Geometries

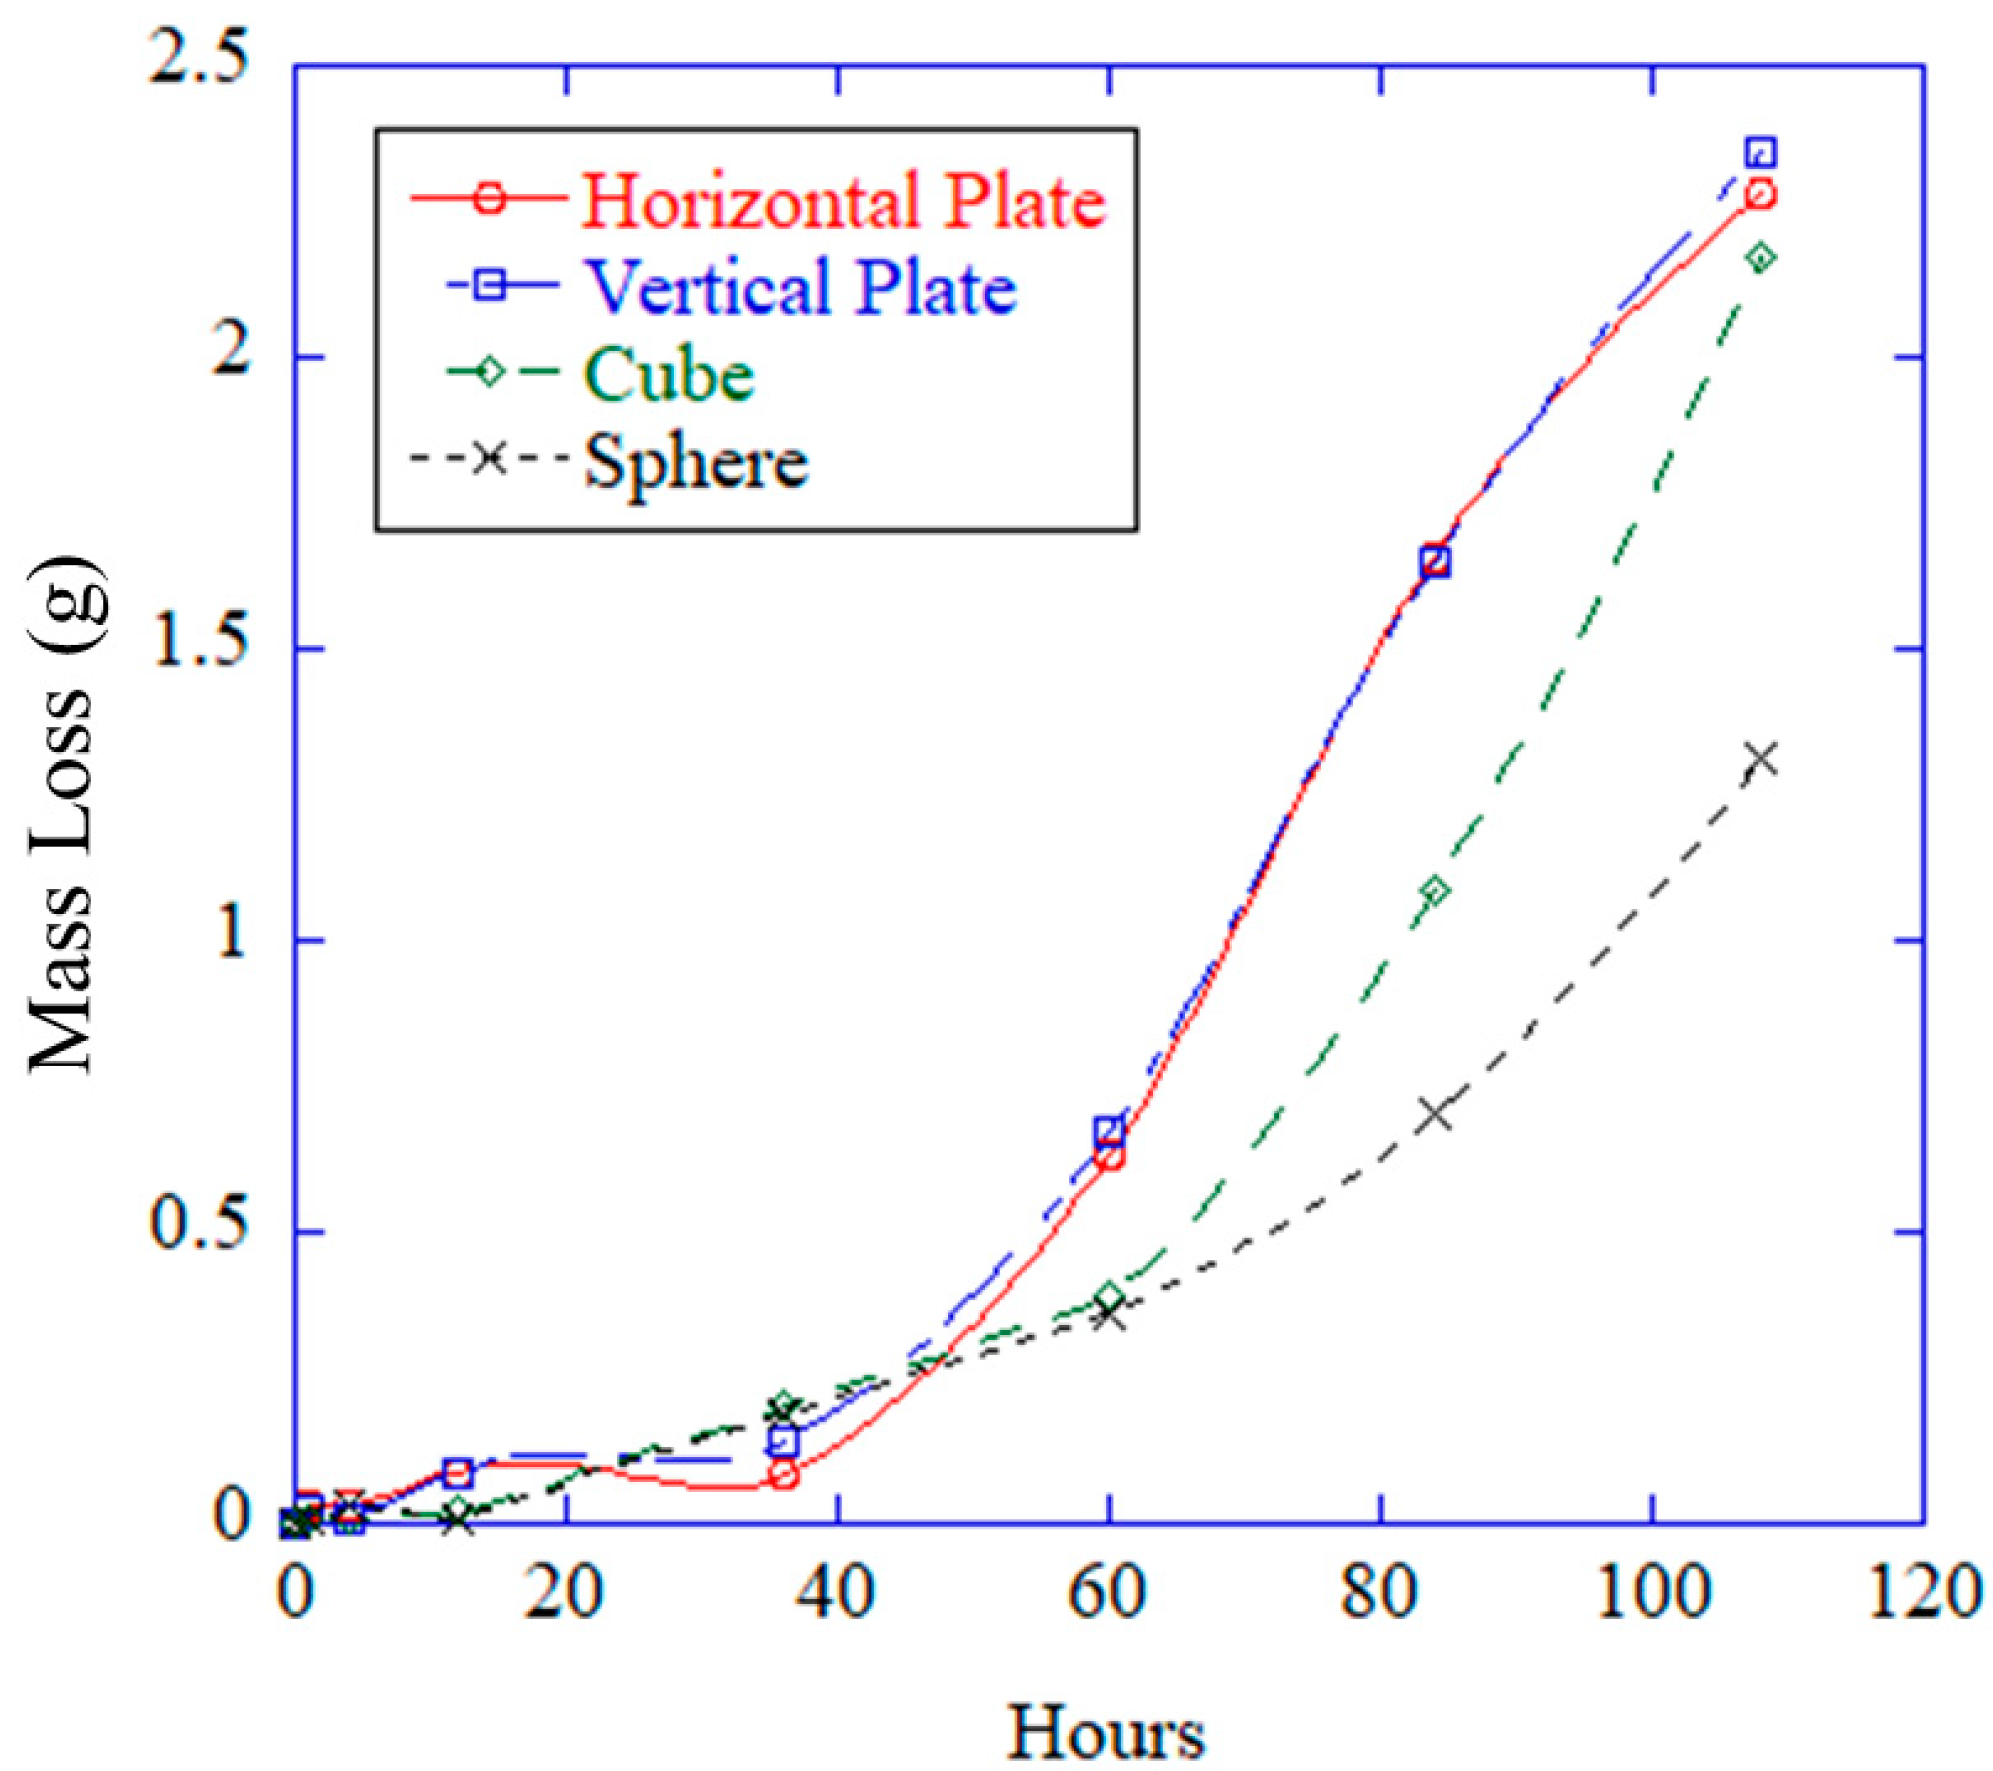
Related mainly to general corrosion, mass loss measurements were taken for each of the different magnesium specimens. Figure 9 shows the change in mass versus time for the four different geometries. Note also that the rate of mass loss for the vertical and horizontal plates was roughly the same rate, and was greater than the cube, while the cube was greater than that of the sphere after approximately 40 h. As such, the plates incurred a greater general corrosion rate than the cube general corrosion rate, which in turn was greater than that of the sphere general corrosion rate. We note that the plume diameter sizes shown in Figure 7 (HP, sphere, cube, and VP from largest to smallest) did not correlate with the general corrosion rates of Figure 9 (VP, HP, cube, and sphere from largest to smallest).
Figure 9. The change in mass versus the time indicates the direct effect of general corrosion. Note also that the rate of mass loss for the cube is greater than that of the sphere after 60 h.

4.3. Hydrogen Accumulation Differences Between the Different Geometries

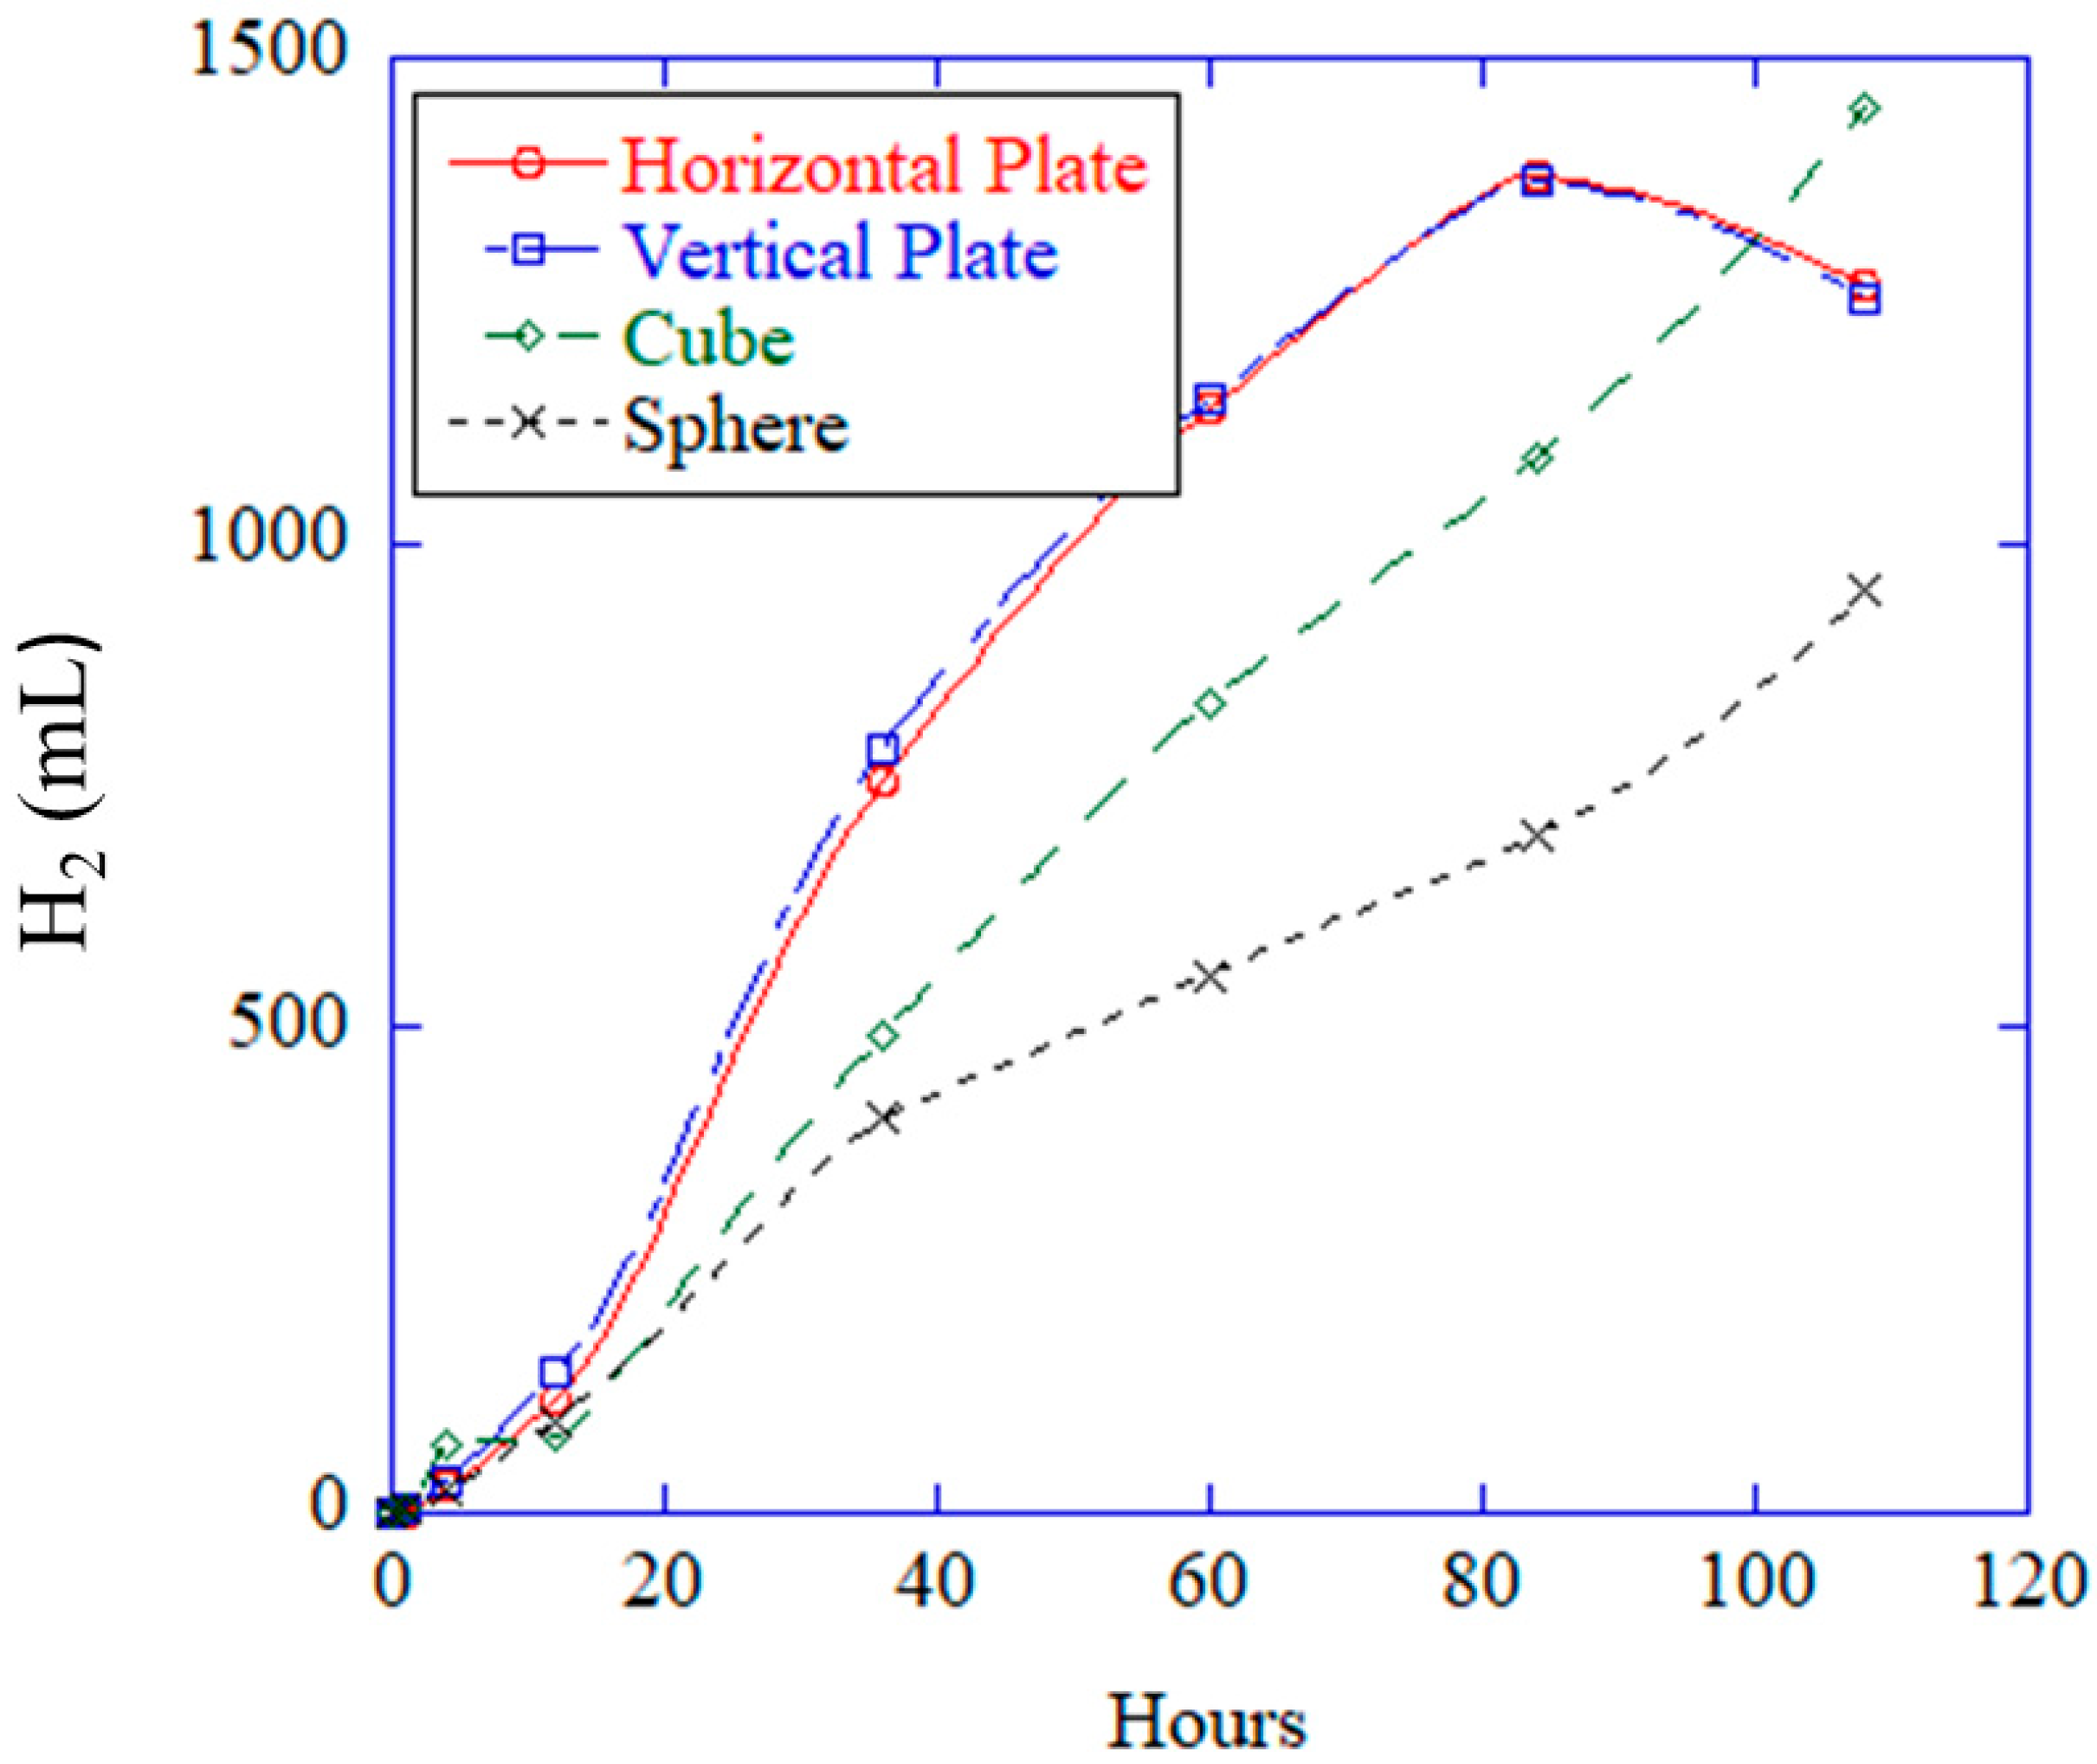
Figure 10 shows the H2 gas production for each of the different specimens over time, which effectively adds up all of the different corrosion mechanism effects and their magnitudes. Essentially, all of the quantities in Equation (1) are captured in total by H2 production. Note that all of the H2 gas production rates were similar up to approximately 12 h; however, after that, the vertical and horizontal plates incurred an almost equal total corrosion rate, though a greater total corrosion level than the cube, with the sphere experiencing the lowest corrosion rate. At approximately 100 h, the total corrosion rate for the plates dropped off lower than that of the cube. However, the sphere’s total corrosion rate was always lower than that of the plates and cube after 12 h.
Figure 10. The hydrogen production versus the time for a pure magnesium horizontal plate, vertical plate, cube, and sphere indicating all corrosion mechanisms added together. Note that the plates had a greater corrosion rate followed by the cube and then followed finally by the sphere.

4.4. Surface Roughness Differences Between the Different Geometries

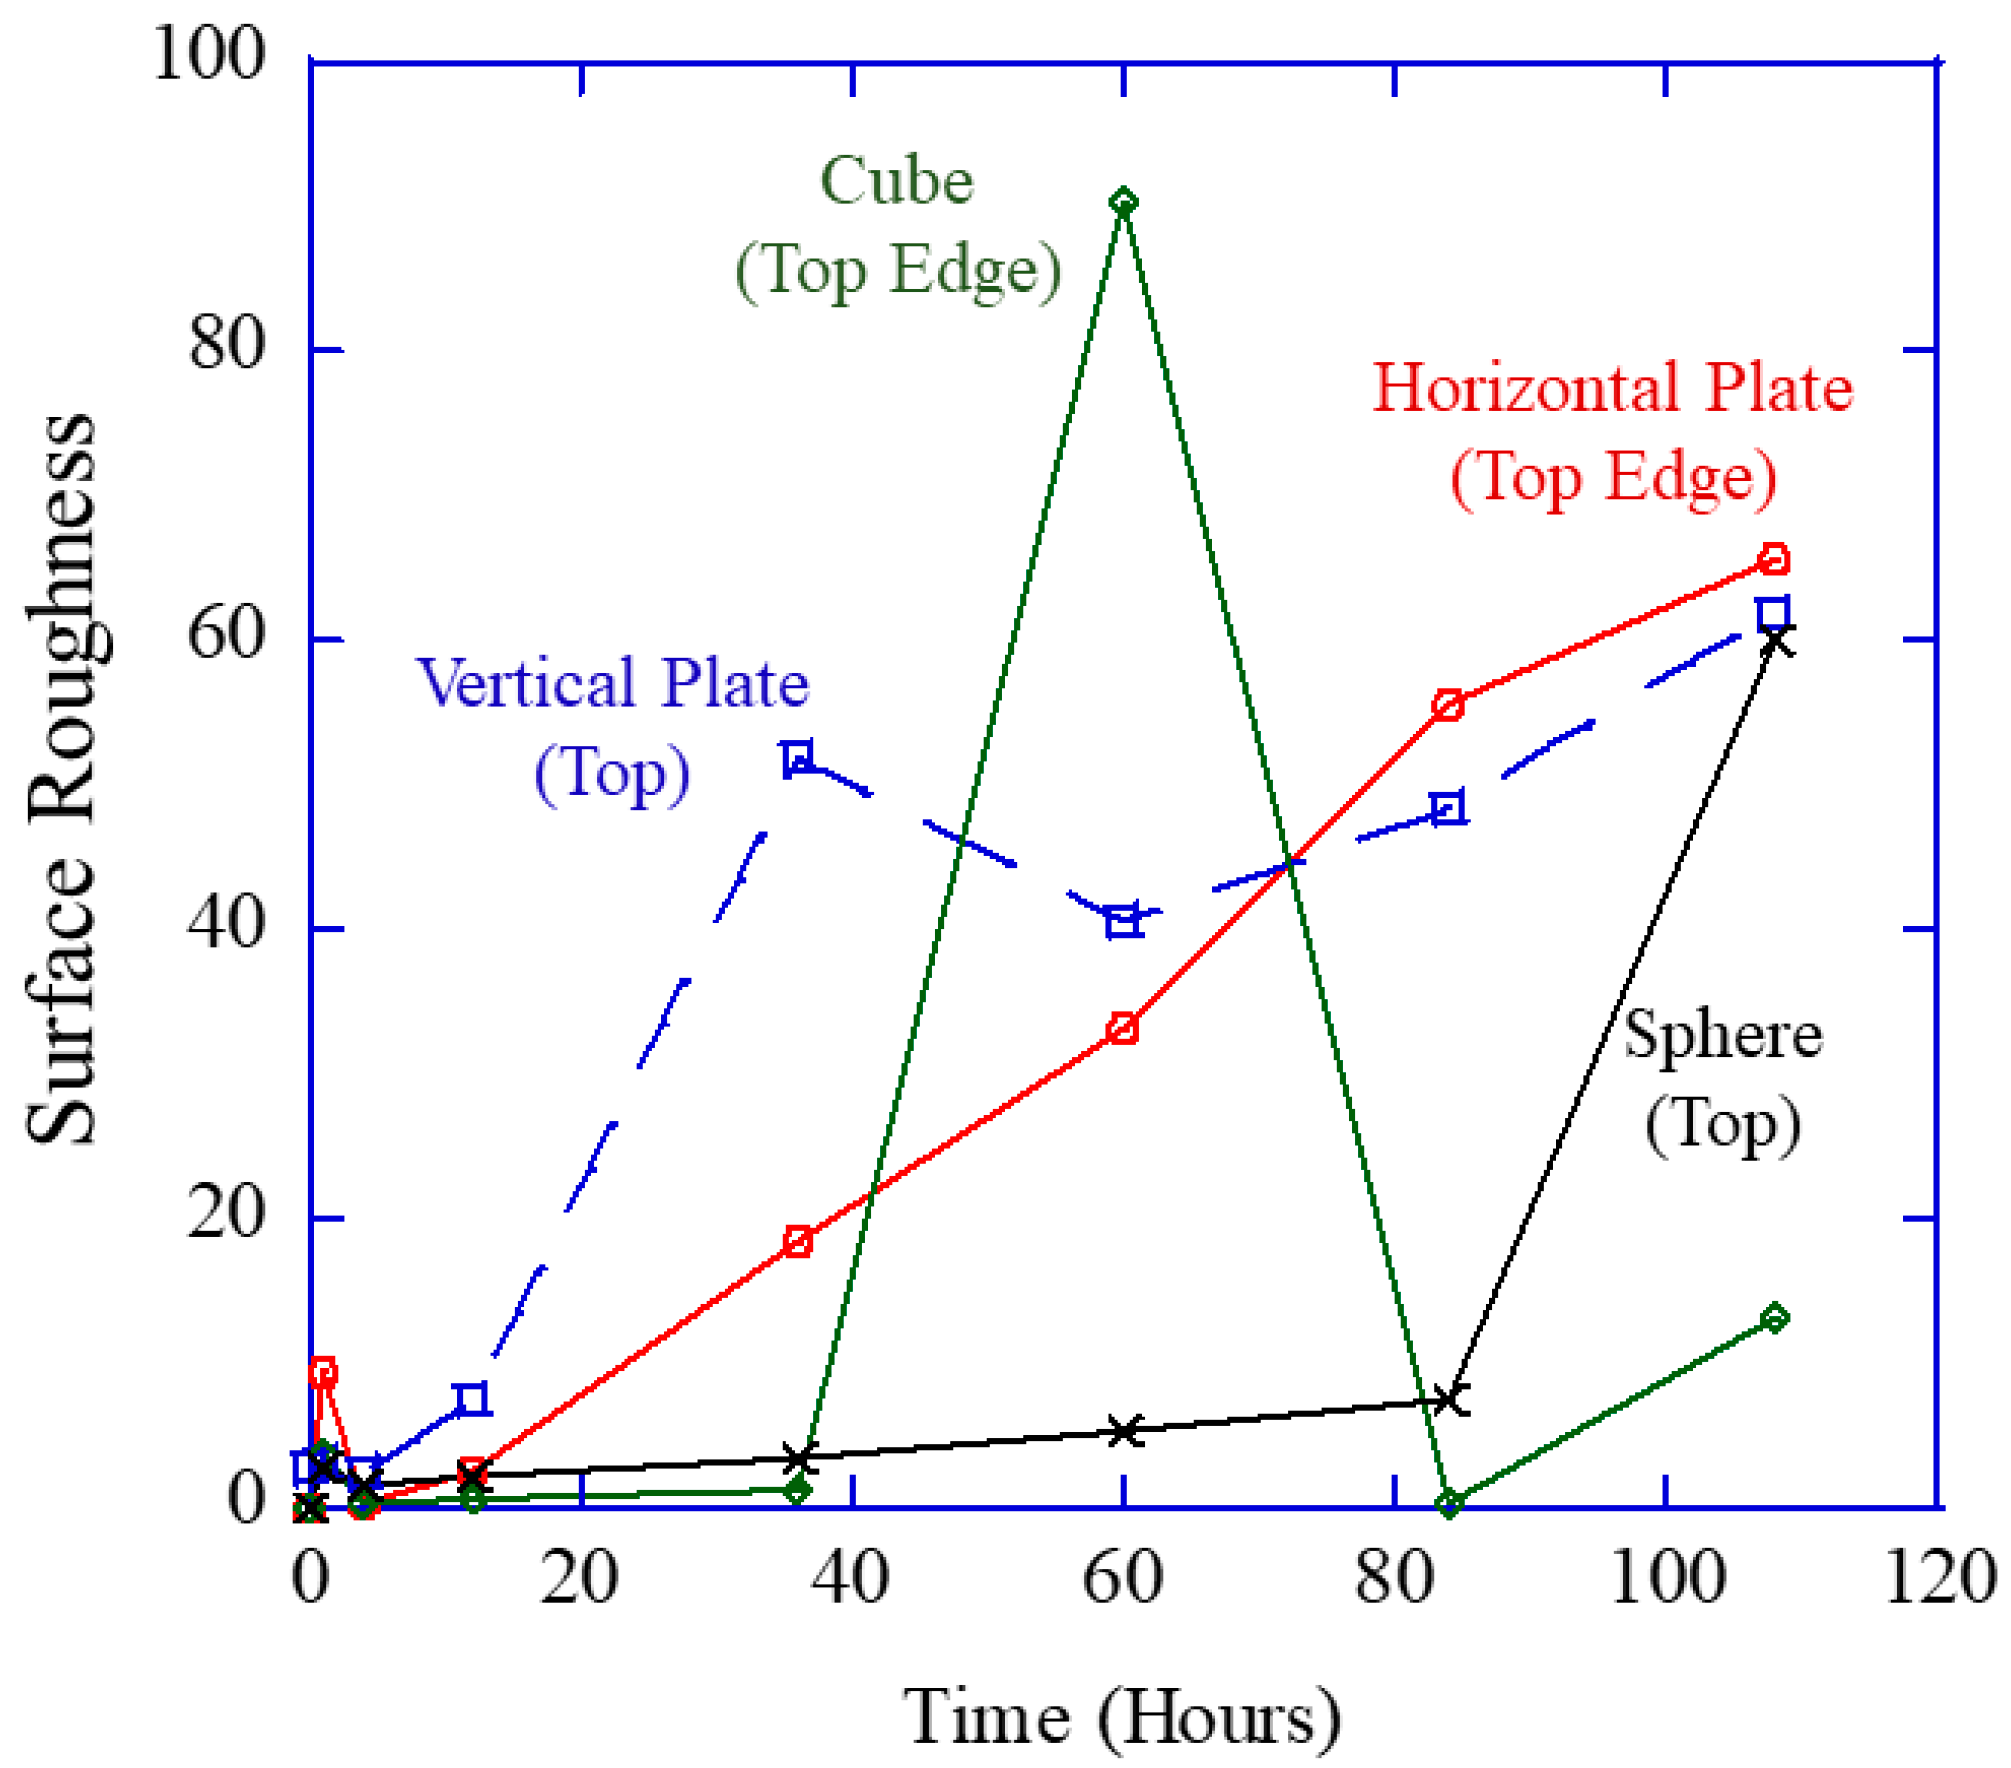
Recall that Figure 5 shows the different stages of localized pitting corrosion. In this section, we examined each different geometric structure with the same surface roughness analysis. Figure 11 summarizes the maximum surface roughness changes as a function of time for the four different geometric structures, and note that they are all different. Although all four specimens incurred the greatest surface roughnesses at the top of the specimens, the total levels and time rates of change were different for each specimen. Note that the horizontal plate and sphere both exhibited nonlinear continuous increases in surface roughness, whereas the cube and vertical plate exhibited greater surface roughnesses earlier on, then decreased, thus indicating more general corrosion overtaking the localized corrosion. In addition, with the exception of the cube, all surfaces had a higher surface roughness at the end of 108 h. The following are more in-depth examinations of each of the four shapes.
Figure 11. The peak surface roughness of the four geometric structures (sphere, cube, horizontal plate, and vertical plate) as a function of time shows that the peak localized corrosion occurred at different times and in different locations, indicating the significance of the geometry in creating a bubble-induced flow that, in turn, affected the corrosion rate.

4.4.1. Sphere

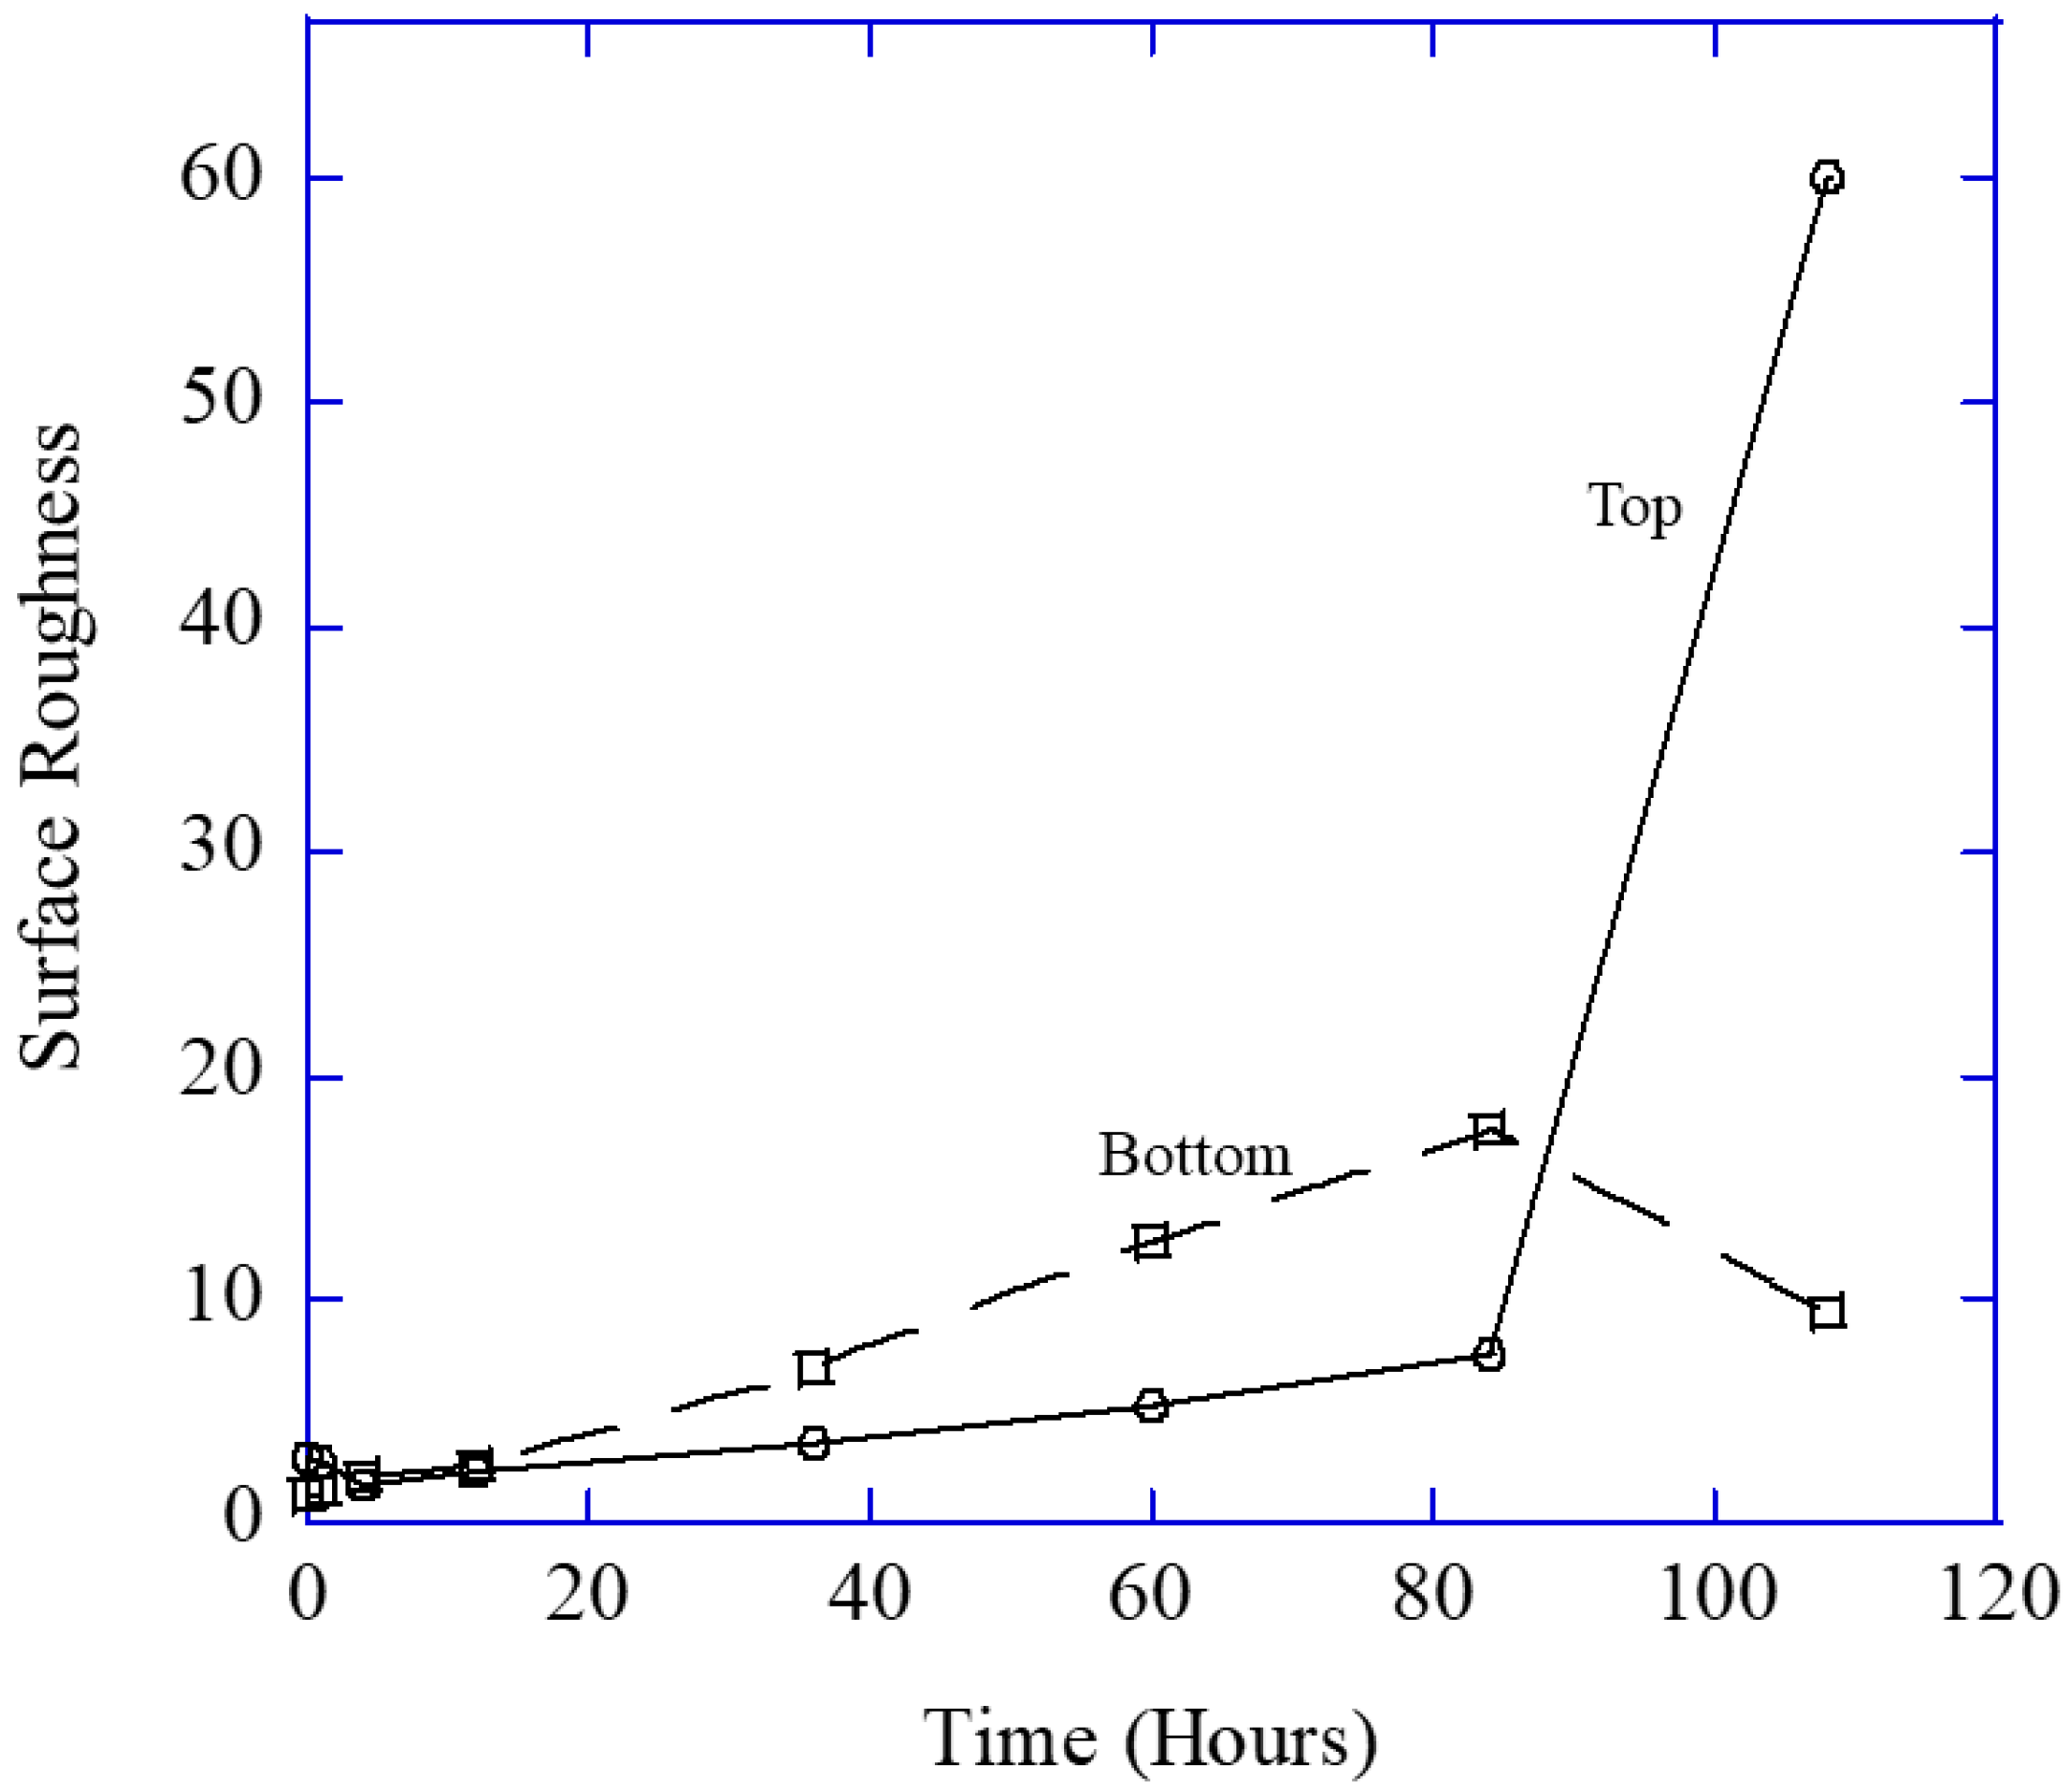
Figure 12 shows the surface roughness of both the top and bottom of the magnesium sphere as a function of time, illustrating that the sphere’s bottom was the first to experience the localized corrosion, followed by general corrosion, as denoted by the surface roughness decrease at approximately 80 h. Conversely, the sphere’s top slowly increased in its surface roughness until later, when it nonlinearly increased to much greater surface roughness values, indicating greater localized pitting. When looking at Figure 7, the difference between the two surfaces of the cube examined is a bit clearer. At the bottom, more fluid motion occurs, while the very top of the cube has minimal fluid motion. With more fluid motion, more corrosive media can reach the surface, while more hydrogen can be removed. At the top, due to fluid motion, less corrosive media can reach the top, thereby reducing the corrosion of the top surface. Between 80 h and 108 h, though, the corrosion mechanism changes. For the bottom, general corrosion and pit coalescence begin, reducing the surface roughness, as the deep tip of the pit is shortened, and general corrosion reduces the overall surface. For the top, pitting increases, especially as other parts of the cube become lightly passivated. Since pits preferentially grow with gravity, while it took an extended period of time to achieve the top, an increase in corrosion occurs, and more pits form and grow, which would greatly increase the surface roughness.
Figure 12. The surface roughness of the magnesium sphere as a function of time showing that the sphere bottom was the first to experience the localized corrosion and then experience general corrosion as the surface roughness decreased. Conversely, the sphere top slowly increased in its surface roughness until later when it nonlinearly increased to much greater surface roughness values indicating greater localized pitting.

4.4.2. Cube

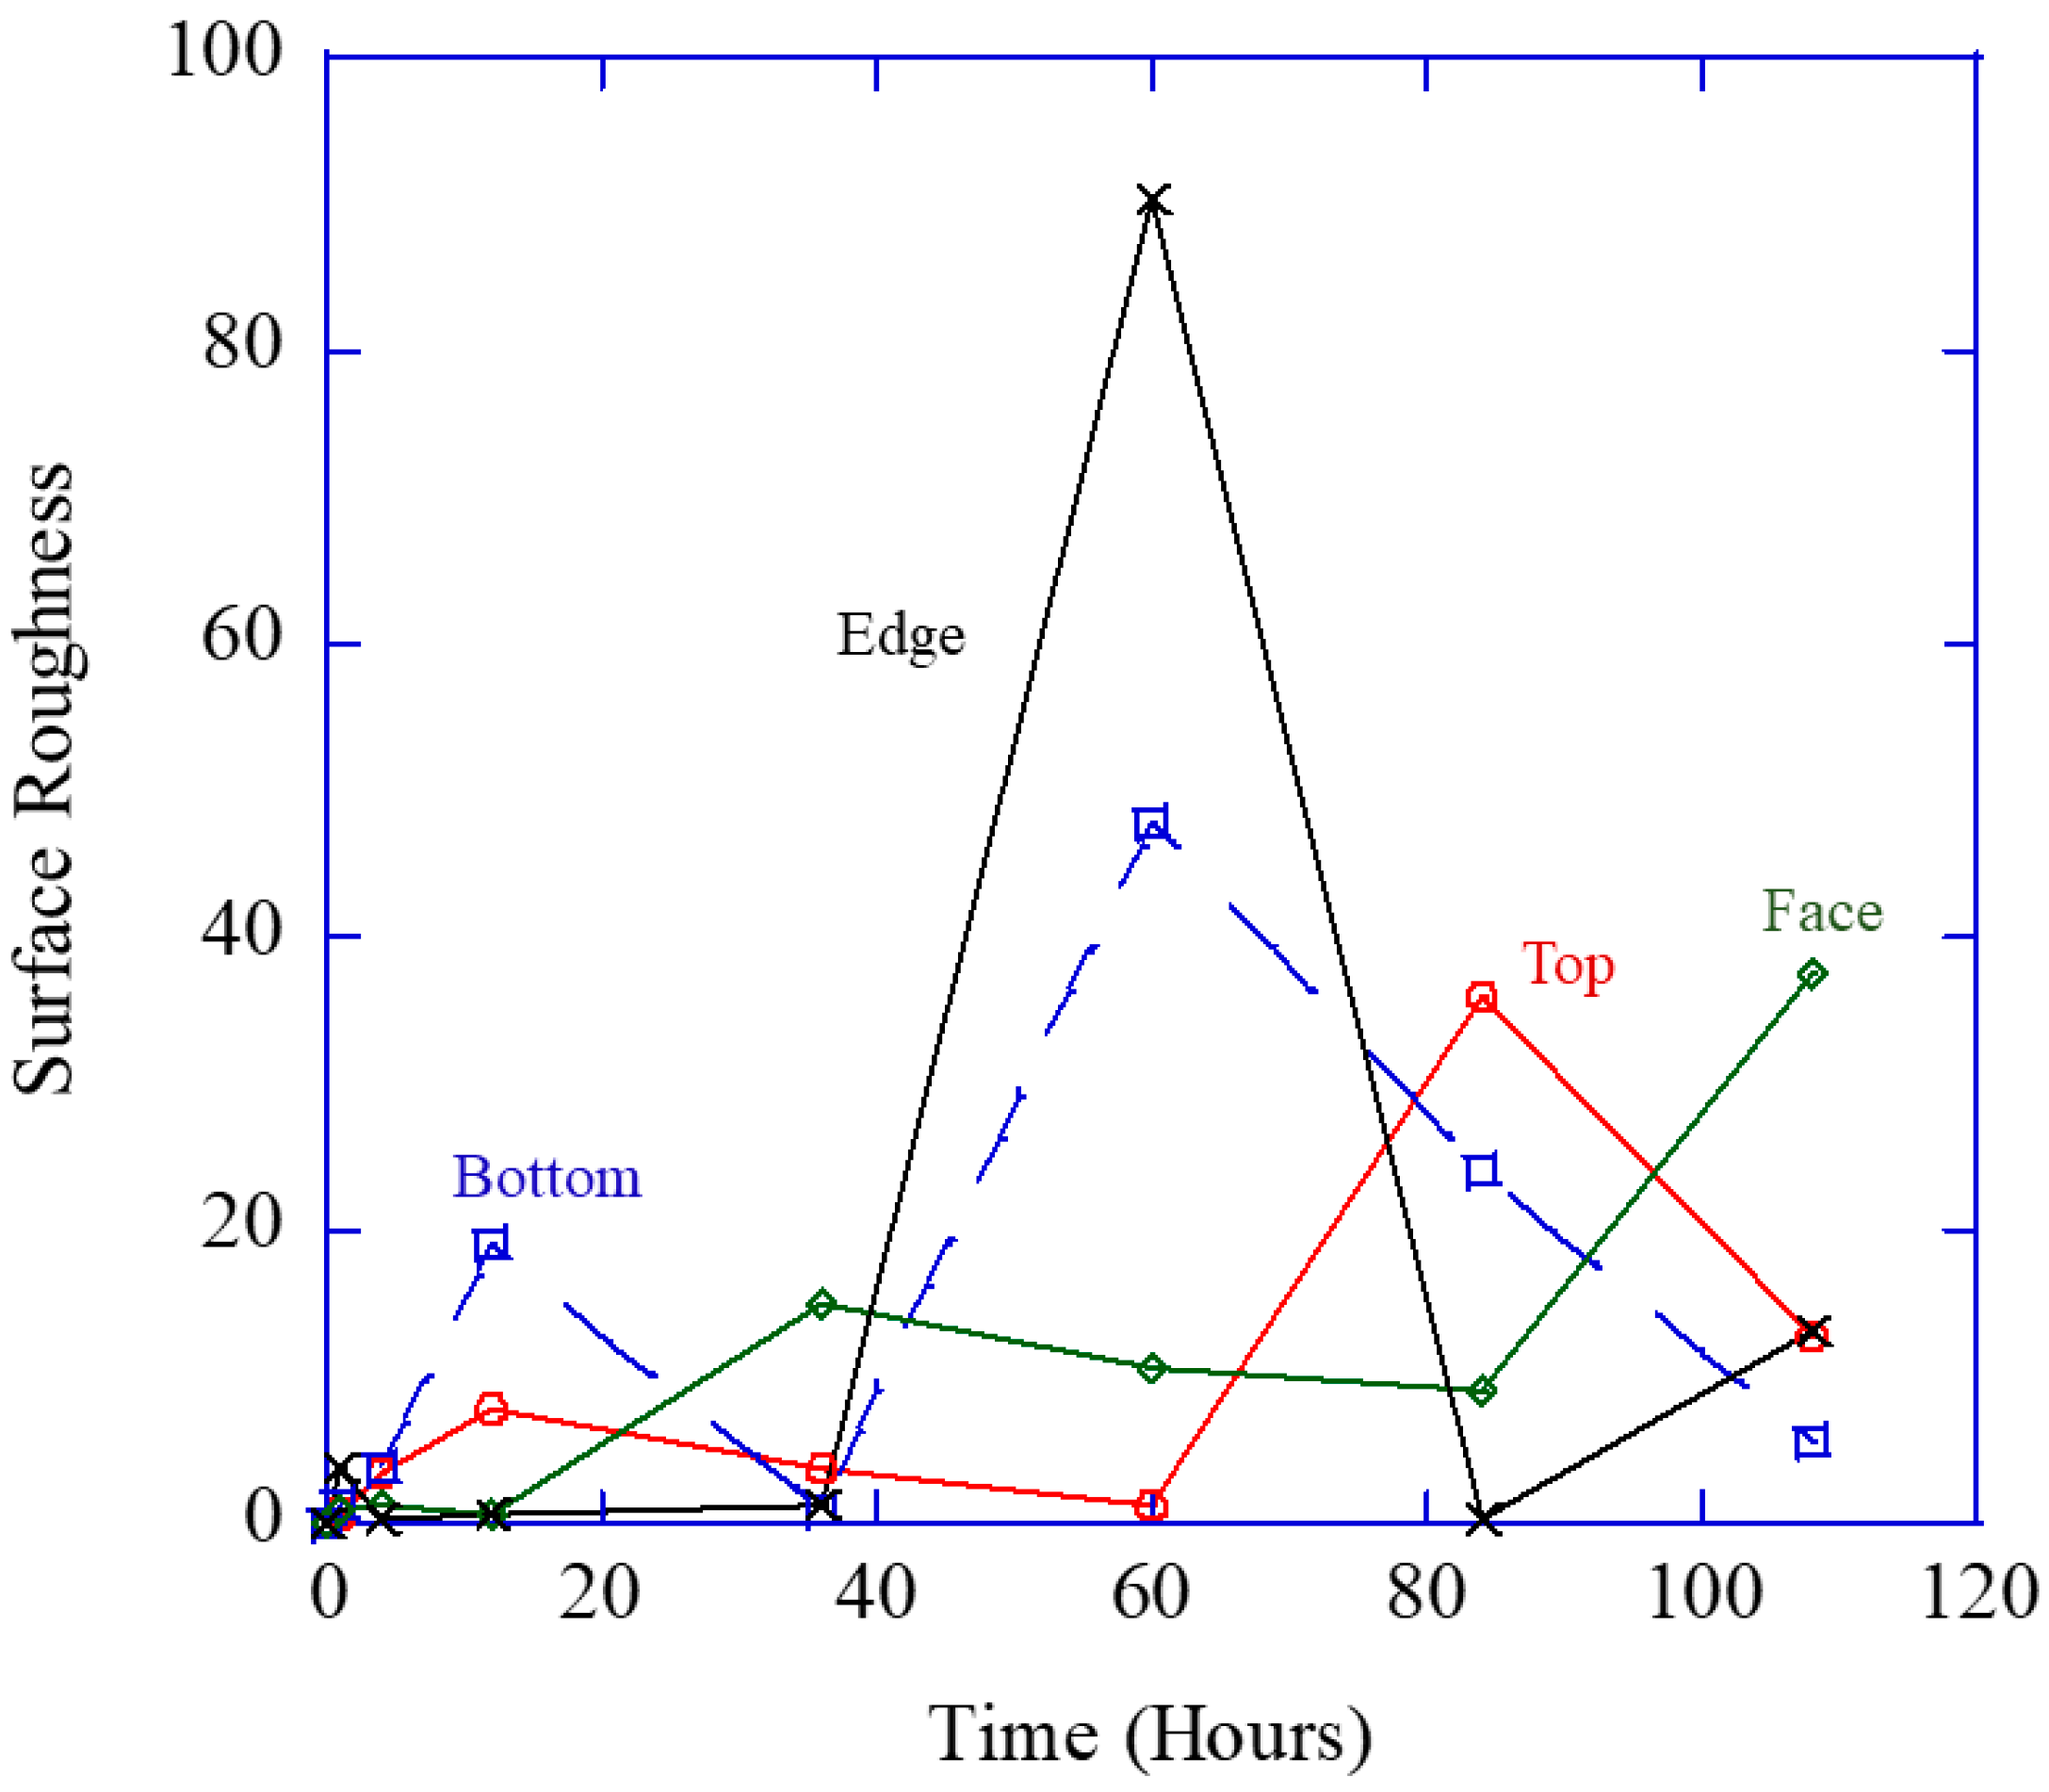
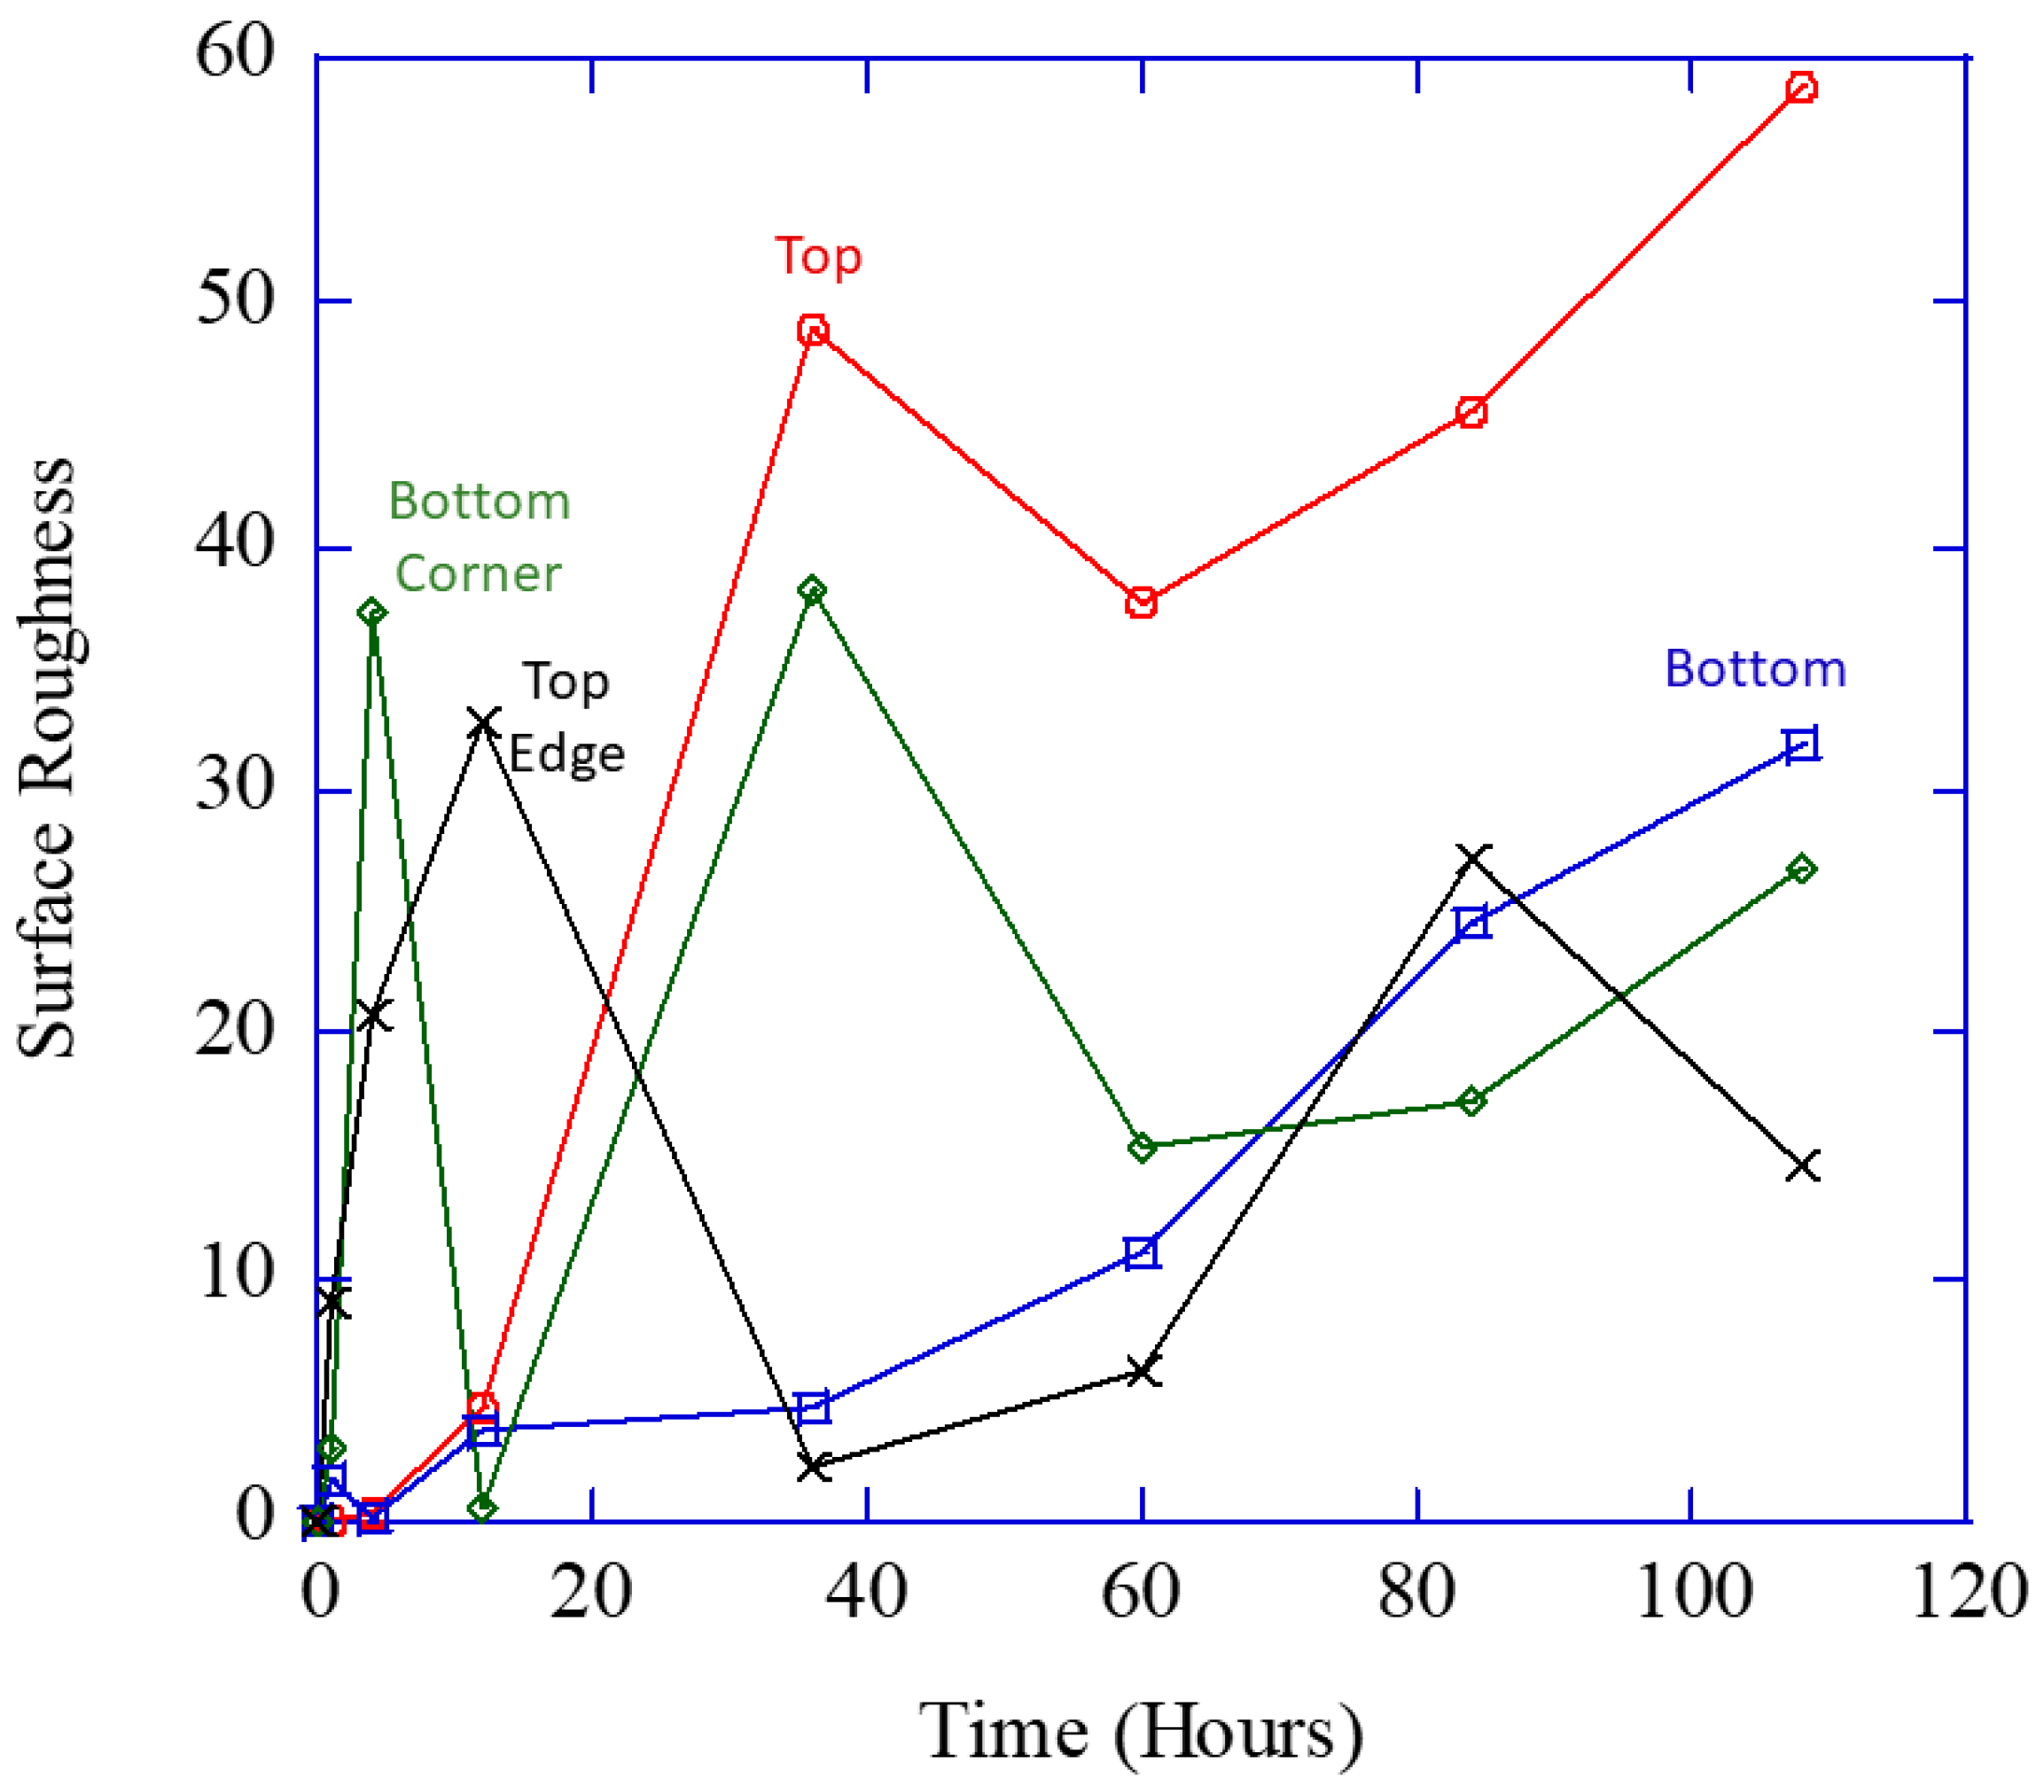
Figure 13 shows the surface roughness of the magnesium cube as a function of time, showing that the cube face was the first to experience the localized corrosion, followed by general corrosion as the surface roughness decreased. With the exception of the edge examined, all surfaces experienced an increase in surface roughness before 20 h, followed by a decrease in surface roughness to about 36 h. The edge and bottom then experienced a large increase in surface roughness to 60 h, at which point, the surface roughness dropped, indicating that general corrosion was smoothing the surface. The top also followed this trend, although this occurred at roughly 80 h. At the end of 108 h, all surfaces except the face experienced a decrease in surface roughness, again further demonstrating that general corrosion had become the dominant mechanism at this point of the experiment.
Figure 13. The surface roughness of the magnesium cube as a function of time. In the early corrosion time (within approximately 20 h), localized corrosion increased at the cube’s bottom. Afterwards, the edge then exhibited the greatest localized corrosion, but then that decreased as general corrosion took over until finally the top face exhibited the most localized corrosion.
Because of fluid flow around the cube, the bottom would have experienced less movement at the beginning, meaning it would be harder to replenish the corrosive media, causing the bottom to corrode less quickly. The face corroded more quickly because of the fluid movement across the entire surface. The top and the edges did have very strong peaks, with strong decreases, demonstrating that the fluid motion also helped bring in oxygen to passivate the pits and create smoother surfaces due to general corrosion.
The cycling of the localized pitting to general corrosion back to localized pitting is illustrated in Figure 13 by the cyclic surface roughness behavior. Note that the chemistry aspects of this were described in relation to Figure 3.
When comparing the fluid flow in Figure 7 between the cube (Figure 7c) and sphere (Figure 7d), the directions of the velocity flows were similar, but the magnitudes were different. As such, the bubble-induced flow gave a different localized corrosion pitting rate and generalized corrosion pitting rate between each geometry, as demonstrated when comparing Figure 12 (sphere) and Figure 13 (cube). The sphere’s top had the greatest pit growth into the depth of the specimen, but the cube face had a greater pit growth in terms of the 2D cross-sectional area of the pits. Interestingly, these differences in pitting corrosion between the sphere and cube occurred up to the 36 h mark, and yet the total corrosion damage (Φc) from all three mechanisms gave approximately the same result from the 0–36 h range when considering the mass loss (Figure 9) and H2 evolution (Figure 10). As shown in the model, the pitting corrosion term (Φpc from Equation (2)) is the product of the pit nucleation (η), pit growth (ν), and pit coalescence (c). While the nucleation, growth, and coalescence varied at different rates for the sphere and the cube, the product of these values was approximately the same for both geometries, producing a nearly identical volume of H2 gas.

4.4.3. Horizontal Plate

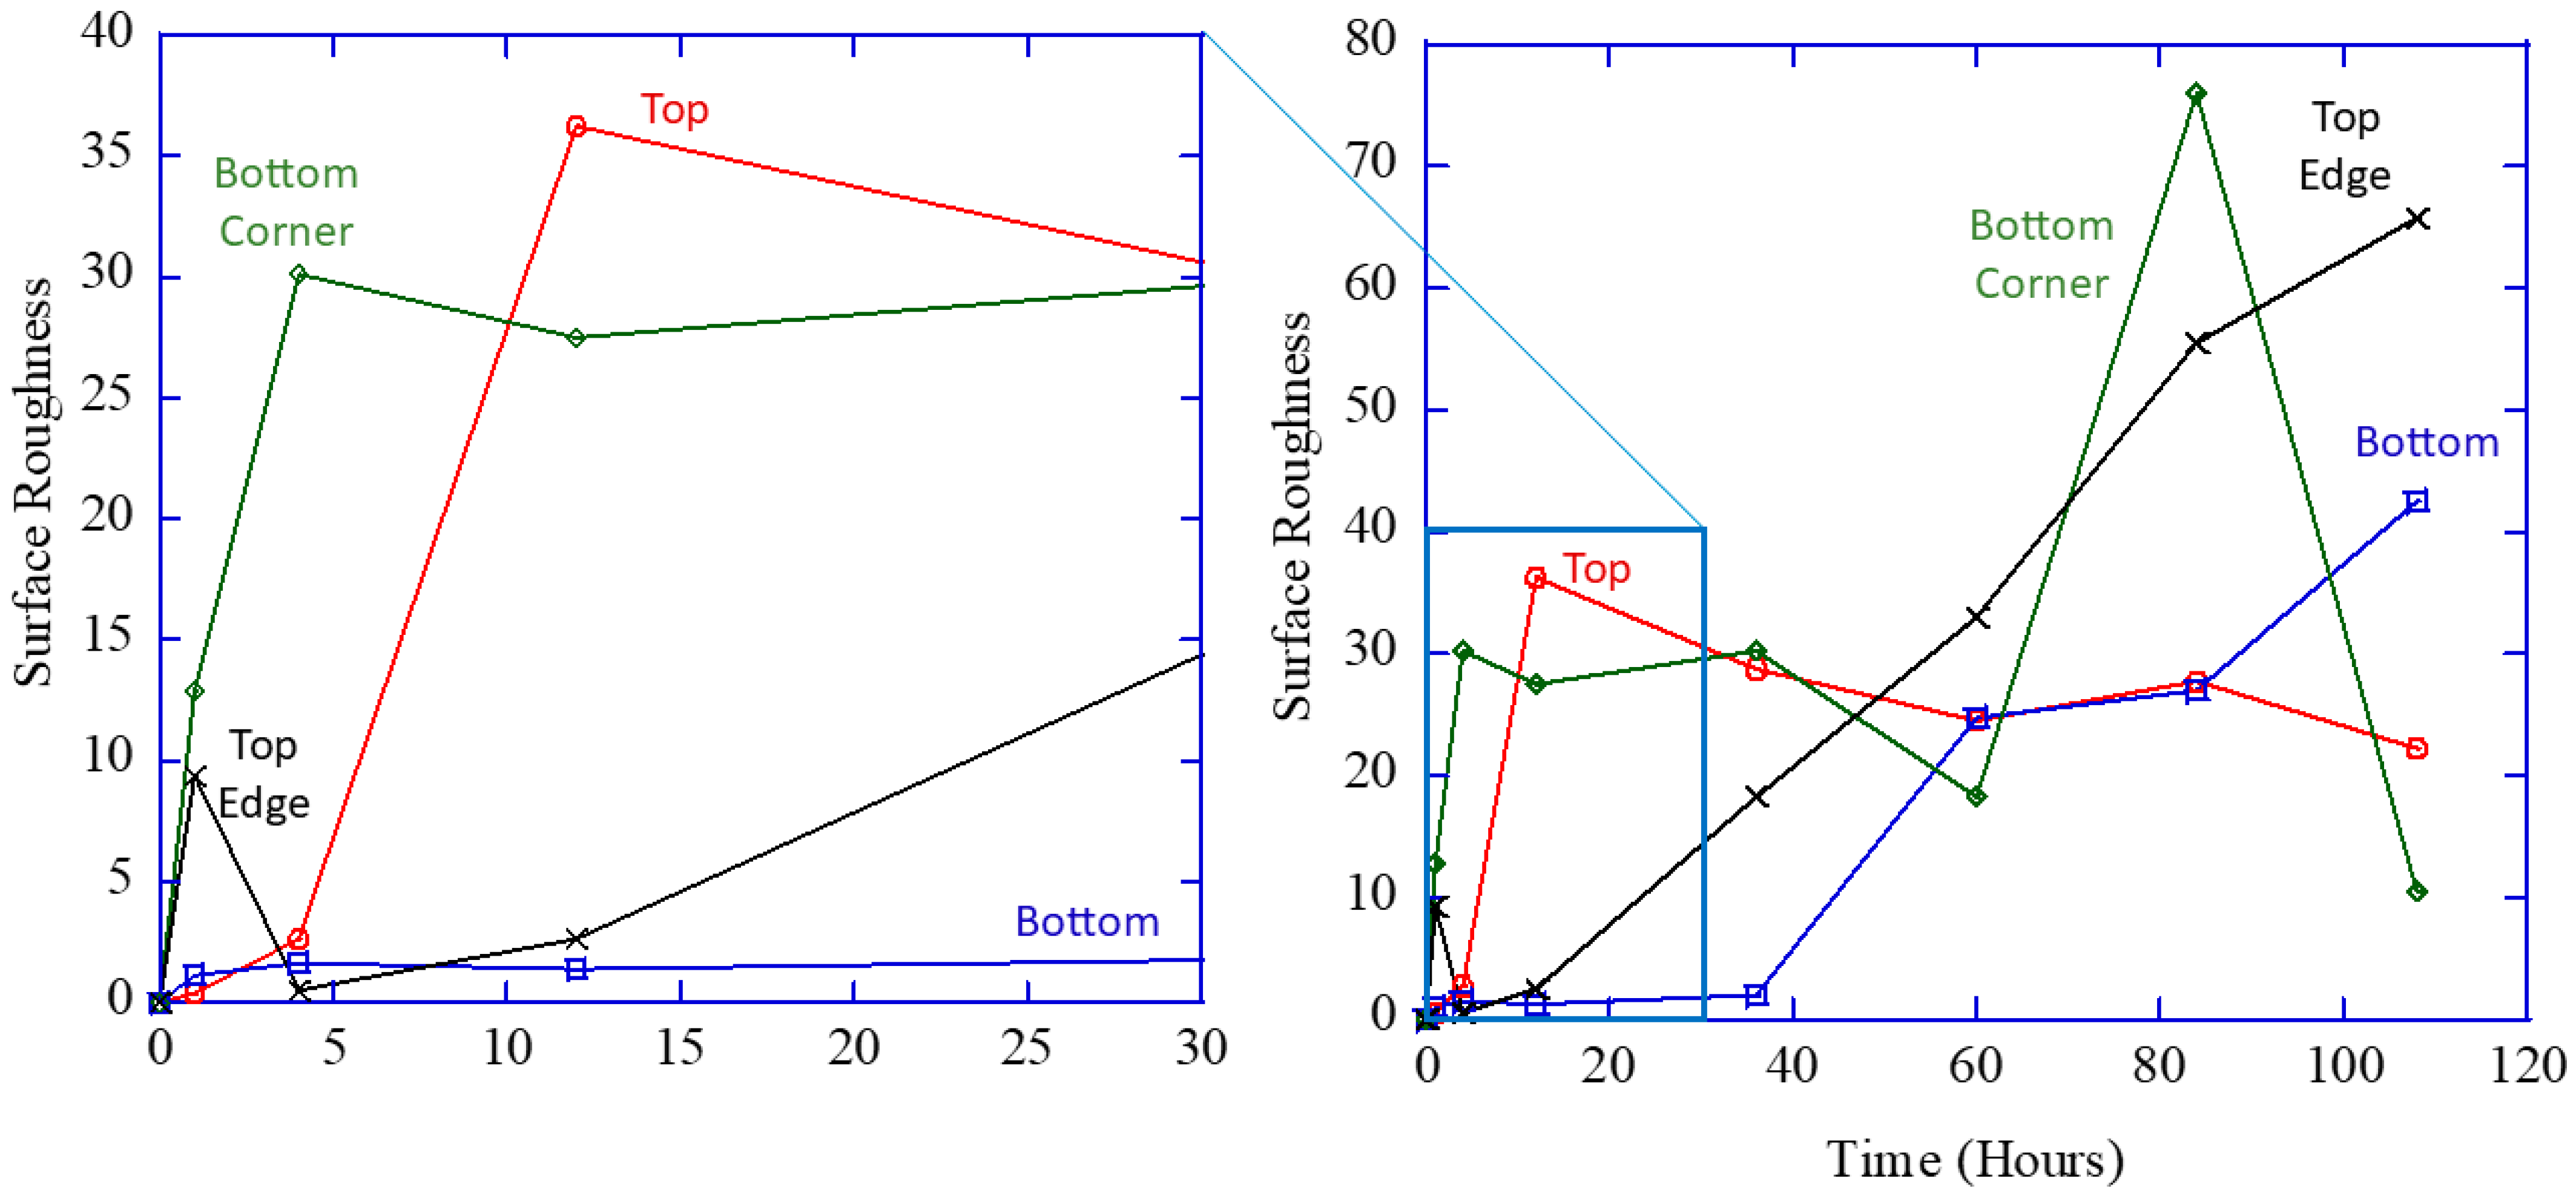
Figure 14 shows the surface roughness of the magnesium horizontal plate as a function of time, illustrating a different cyclic response than the cube and sphere. However, the cyclic response of immediate increased surface roughness followed by a decrease and then an increase again verifies Figure 3 description of the chemistry changes. Figure 14 shows that in the early corrosion time (within 12 h), localized corrosion increased dramatically at the horizontal plate’s bottom edge and top, with the top edge also increasing. Afterwards, the surface roughness decreased, indicating that general corrosion wore down the localized pitting. The cube top experienced greater localized corrosion (greater surface roughness) than the plate bottom earlier in the corrosion time, but later it switched, where the bottom incurred a greater surface roughness than the top. In addition, the two edges experienced the highest amount of localized corrosion, with the bottom corner experiencing the most smoothing out, while the top edge continued increasing in surface roughness.
Figure 14. The surface roughness of the magnesium horizontal plate as a function of time. In the early corrosion time (within 12 h), localized corrosion increased dramatically at the horizontal plate’s bottom edge, top edge, and top. Afterwards, the surface roughness decrease indicates that general corrosion wore down the localized pitting. The cube top experienced greater localized corrosion (greater surface roughness) than the plate bottom earlier in the corrosion time, but later it switched where the bottom incurred a greater surface roughness than the top.
When comparing the horizontal plate bubble-induced flow with the sphere and cube from Figure 7, one observes very different flow patterns in terms of magnitudes, directions, and vortices. Hence, one notes from Figure 14 that the magnitude of the surface was greater than that of the sphere and cube. This magnitude played into the total corrosion rate (Equation (1)) being greater, as illustrated in Figure 10, as it is related to the total H2 production, which is greater for the horizontal plate when compared to the sphere and cube.

4.4.4. Vertical Plate

Figure 15 shows the surface roughness of the magnesium vertical plate as a function of time, showing that the bottom corner of the plate was the first to experience the localized corrosion and then experience general corrosion as the surface roughness decreased, with the cycle occurring one more time before a gradual increase. This trend occurred sequentially on the top edge as well, followed by the top surface, although its cyclic behavior was a little slower and less intense than that of the bottom corner. Note that the top incurred the greatest surface roughness of the four measured values, indicating that fluid/bubble flow affected localized pitting more at the top than at the bottom. In addition, also notice that the bottom surface (not the edge) did not have a spike at the beginning of exposure, nor did it have any increases or decreases. Instead, the surface roughness on the bottom increased throughout the entire experiment, indicating that general corrosion did not greatly affect the localized corrosion that formed.
Figure 15. The surface roughness of the magnesium vertical plate as a function of time showing that the bottom corner of the plate was the first to experience the localized corrosion and then experience general corrosion as the surface roughness decreased. This trend occurred sequentially to the top edge as well followed by the top surface. Note that the top incurred a greater surface roughness than the bottom indicating that fluid/bubble flow affected localized pitting more at the top than at the bottom.
When comparing the vertical plate bubble-induced flow with the horizontal plate, sphere, and cube from Figure 7, one observes very different flow patterns in terms of magnitudes, directions, and vortices. However, the total hydrogen production rate was very close to the horizontal plate, except at the very end. Even with the similarities in the overall total corrosion rates being similar, differences existed when comparing Figure 14 (horizontal plate) and Figure 15 (vertical plate) for the surface roughness measurements. Given that the surface roughnesses were different between the plates, it indicates that localized corrosion pitting was exhibited. However, with the mass loss differences being small, one might conclude that general corrosion had a greater time rate of change than localized corrosion pitting for the two plates.

5. Discussion

It is worth noting that Atrens et al. [] compared mass loss rates versus hydrogen evolution rates in pure magnesium from many other corrosion rate experiments and showed a difference between the two. The difference they attributed to the mass loss measurements was due to the tolerance of the weighing machine and the amount of corrosive products that were left on the specimen. They also noted the nonlinear behavior and turnover of the rate as time reached between 80 and 100 h, as we did in the experiments that we conducted herein. However, Atrens et al. [] did not discuss the different specimen geometries in their review. One other worthwhile point to make with respect to Atrens et al. [] review is that they mentioned a corrosion rate in pure magnesium from 0.3 to 1.0 mm/year. This would have to be a gross average over time, as it assumes a linear rate, where the actual corrosion rates, whether measured by mass loss or hydrogen release, are highly nonlinear in the papers that they reviewed and the one herein. Our experiments exhibited similar results to the Atrens et al. [] analysis.
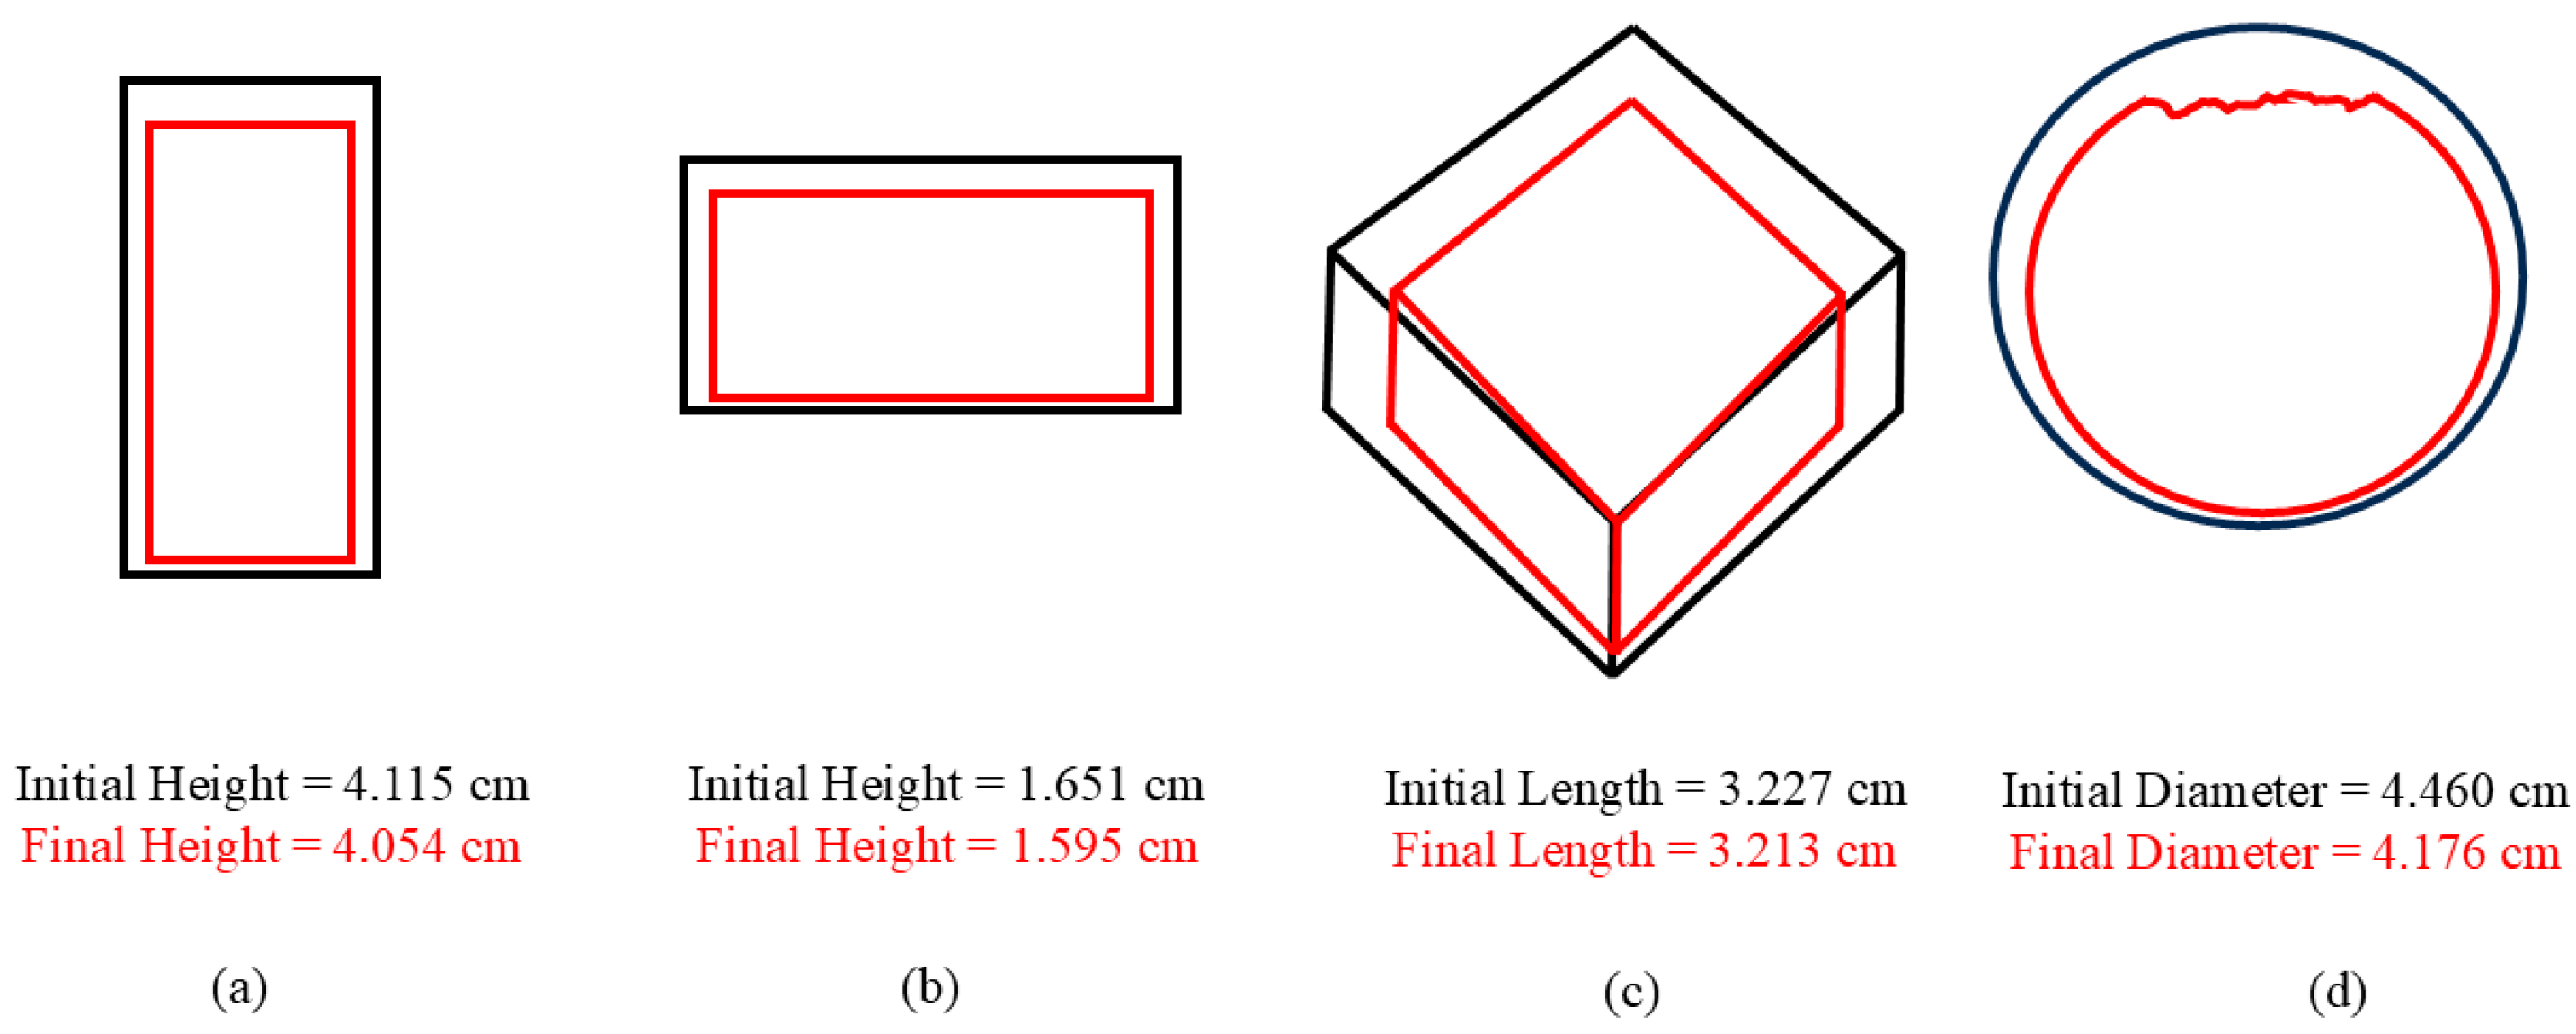
The idealized schematic in Figure 16 summarizes the overall global trends of the corrosion of the different geometry types. The surface roughnesses are not shown in Figure 16, and thus, the idealization perspective. What was observed, as shown in Figure 16, is that the tops of all of the specimens exhibited more corrosion than the bottoms of the specimens. Furthermore, the sides exhibited less corrosion than the top but more than the bottom. This further confirms the hydrogen bubble-induced flow that was exhibited beyond the flow patterns of the water within the corrosion environment. Atrens et al. [] couched pure magnesium corrosion rates in terms of a thickness reduction rate. Based on our results herein, we argue that a better metric is either mass loss or hydrogen measurements, because the different geometries exhibit non-uniform thickness changes depending on the water flow.
Figure 16. Comparison of the corrosion at the initial state versus the final state after 108 h of corrosion illustrating that the tops of the specimens exhibited more corrosion than the bottoms of the specimens. The black color represents the initial state and the red color represents the final state. Note: (a) vertical plate, (b) horizontal plate, (c) cube, and (d) sphere. Schematics not to scale.

6. Conclusions

The effects of geometry and related bubble-induced water flow boundary conditions related to the corrosion rate of different mechanisms were examined for different geometries of magnesium. The similarities between the different geometric structures were the following: (1) For the first 16 h, the four geometric structures had similar initial corrosion rates, although the rates deviated shortly afterward; (2) All specimens had the greatest corrosion near the top; (3) All specimens exhibited general corrosion and localized pitting corrosion.
Several conclusions were made based on the different geometric structures: (1) The plate edges incurred the greatest corrosion rates as evidenced by the greatest amount of hydrogen capture and the mass loss measurements; (2) The hydrogen bubble-induced flow introduced an interactive boundary layer of fluid motion that, in turn, affected the different localized pitting and general corrosion rates for each specimen type; (3) Fluid–structure modeling is required to accurately predict the corrosion of a component in an in-service lifetime analysis. For the constitutive model for corrosion on the solid portion of the modeling, one can employ the Walton et al. [] corrosion model within a boundary value problem for designing structural components. However, one also needs a fluid dynamics model because of various shapes of structural components, which induce fluid flow in diverse ways, thus affecting the corrosion rate.
Other, more specific comments are warranted:
  • For the first 40 h, localized pitting corrosion was the most dominant mechanism for all of the geometries occurring at localized twin boundaries, grain boundaries, and on surface defects where the dislocation density was the greatest.
  • General corrosion, measured by overall mass loss and lower surface roughness values, was more dominant than pitting beyond 40 h for all of the geometries.
  • The fluid flow and bubble flow were different for each geometry, giving rise to different localized and general corrosion rates and, thus, overall corrosion rates.

Author Contributions

Conceptualization, S.J.H., H.J.M. and M.F.H.; Methodology, S.J.H. and L.A.J.; Validation, S.J.H. and M.F.H.; Formal analysis, S.J.H., H.J.M., W.S.S., H.E.C. and M.F.H.; Investigation, S.J.H., L.A.J. and M.F.H.; Writing—original draft, S.J.H. and M.F.H.; Writing—review & editing, H.J.M., W.S.S., H.E.C. and M.F.H.; Visualization, S.J.H., L.A.J., H.E.C. and M.F.H.; Supervision, M.F.H.; Project administration, M.F.H.; Funding acquisition, M.F.H. All authors have read and agreed to the published version of the manuscript.

Funding

This research received no external funding.

Data Availability Statement

The original contributions presented in this study are included in the article. Further inquiries can be directed to the corresponding author.

Acknowledgments

Support from the Center for Advanced Vehicular Systems (CAVS) at Mississippi State University and the Center for Engineering Research and Education (CERE) at Liberty University is gratefully acknowledged. Also, the Army Research Laboratory (ARL) is recognized for supporting this effort.

Conflicts of Interest

The authors declare no conflict of interest.

References

  1. Hara, N.; Kobayashi, Y.; Kagaya, D.; Akao, N. Formation and breakdown of surface films on magnesium and its alloys in aqueous solutions. Corros. Sci. 2007, 49, 166–175. [Google Scholar] [CrossRef]
  2. Song, G.; Atrens, A. Understanding magnesium corrosion—A framework for improved alloy performance. Adv. Eng. Mater. 2003, 5, 837–858. [Google Scholar] [CrossRef]
  3. Song, W.; Martin, H.J.; Hicks, A.; Seely, D.; Walton, C.A.; Lawrimore, W.B., II; Wang, P.T.; Horstemeyer, M.F. Corrosion behaviour of extruded AM30 magnesium alloy under salt-spray and immersion environments. Corros. Sci. 2014, 78, 353–368. [Google Scholar] [CrossRef]
  4. Liu, W.; Cao, F.; Zhong, L.; Zheng, L.; Jia, B.; Zhang, Z.; Zhang, J. Influence of rare earth element Ce and La addition on corrosion behavior of AZ91 magnesium alloy. Mater. Corros. 2009, 60, 795–803. [Google Scholar] [CrossRef]
  5. Lunder, O.; Lein, J.E.; Aune, T.K.; Nisancioglu, K. Role of Mg17Al12 phase in the corrosion of Mg alloy AZ91. Corrosion 1989, 45, 741–748. [Google Scholar] [CrossRef]
  6. Makar, G.L.; Kruger, J. Corrosion Studies of Rapidly Solidified Magnesium Alloys. J. Electrochem. Soc. 1990, 137, 414–421. [Google Scholar] [CrossRef]
  7. Ghali, E.; Dietzel, W.; Kainer, K.-U. General and localized corrosion of magnesium alloys: A critical review. J. Mater. Eng. Perform. 2013, 22, 2875–2891. [Google Scholar] [CrossRef]
  8. Feliu, S., Jr.; Llorente, I. Corrosion product layers on magnesium alloys AZ31 and AZ61: Surface chemistry and protective ability. Appl. Surf. Sci. 2015, 347, 736–746. [Google Scholar] [CrossRef]
  9. Song, G.; Atrens, A.; Wu, X.; Zhang, B. Corrosion behaviour of AZ21, AZ501 and AZ91 in Sodium Chloride. Corros. Sci. 1998, 40, 1769–1791. [Google Scholar] [CrossRef]
  10. Aung, N.N.; Zhou, W. Effect of grain size and twins on corrosion behaviour of AZ31B magnesium alloy. Corros. Sci. 2010, 52, 589–594. [Google Scholar] [CrossRef]
  11. Ralston, K.D.; Birbilis, N.; Davies, C.H.J. Revealing the relationship between grain size and corrosion rate of metals. Scr. Mater. 2010, 63, 1201–1204. [Google Scholar] [CrossRef]
  12. Zhao, M.-C.; Liu, M.; Song, G.; Atrens, A. Influence of the β-phase morphology on the corrosion of the Mg alloy AZ91. Corros. Sci. 2008, 50, 1939–1953. [Google Scholar] [CrossRef]
  13. Walton, C.A.; Horstemeyer, M.F.; Martin, H.J.; Francis, D.K. Formulation of a macroscale corrosion damage internal state variable model. Int. J. Solids Struct. 2014, 51, 1235–1245. [Google Scholar] [CrossRef]
  14. Horstemeyer, M.F.; Song, W.; Cho, H.E.; Wipf, D.; Martin, H.J.; Francis, D.K.; Chaudhuri, S. A Multiscale Inelastic Internal State Variable Corrosion Model. Materials 2024, 17, 3995. [Google Scholar] [CrossRef] [PubMed]
  15. Walton, C.A.; Martin, H.J.; Horstemeyer, M.F.; Wang, P.T. Quantification of corrosion mechanisms under immersion and salt-spray environments on an extruded AZ31 magnesium alloy. Corros. Sci. 2012, 56, 194–208. [Google Scholar] [CrossRef]
  16. Walton, C.A.; Martin, H.J.; Horstemeyer, M.F.; Whittington, W.R.; Horstemeyer, C.J.; Wang, P.T. Corrosion stress relaxation and tensile strength effects in an extruded AZ31 magnesium alloy. Corros. Sci. 2014, 80, 503–510. [Google Scholar] [CrossRef]
  17. Martin, H.J.; Horstemeyer, M.F.; Wang, P.T. Structure-property quantification of corrosion pitting under immersion and salt-spray environments on an extruded AZ61 magnesium alloy. Corros. Sci. 2011, 53, 1348–1361. [Google Scholar] [CrossRef]
  18. Alvarez, R.B.; Martin, H.J.; Horstemeyer, M.F.; Chandler, M.Q.; Williams, N.; Wang, P.T.; Ruiz, A. Corrosion relationships as a function of time and surface roughness on a structural AE44 magnesium alloy. Corros. Sci. 2010, 52, 1635–1648. [Google Scholar] [CrossRef]
  19. Martin, H.J.; Horstemeyer, M.F.; Wang, P.T. Effects of variations in salt-spray conditions on the corrosion mechanisms of an AE44 magnesium alloy. Int. J. Corros. 2010, 2010, 602342. [Google Scholar] [CrossRef]
  20. Martin, H.J.; Horstemeyer, M.F.; Wang, P.T. Comparison of corrosion pitting under immersion and salt-spray environments on an as-cast AE44 magnesium alloy. Corros. Sci. 2010, 52, 3624–3638. [Google Scholar] [CrossRef]
  21. Martin, H.J.; Alvarez, R.B.; Danzy, J.; Horstemeyer, M.F.; Wang, P.T. Quantification of corrosion pitting under immersion and salt spray environments on an as-cast AM60 magnesium alloy. Corrosion 2012, 68, 571–585. [Google Scholar] [CrossRef]
  22. Pilling, N.B.; Bedworth, R.E. The Oxidation of Metals at High Temperatures. J. Inst. Met. 1923, 29, 529–591. [Google Scholar]
  23. Van’t Hoff, J.H. Etudes de Dynamique Chimique; Frederik Muller & Co.: Amsterdam, The Netherlands, 1884. [Google Scholar]
  24. De Heer, J. The principle of Le Chatelier and Braun. J. Chem. Educ. 1957, 34, 375–380. [Google Scholar] [CrossRef]
  25. De Heer, J. Le chatelier, scientific principle, or “Sacred Cow”? J. Chem. Educ. 1958, 35, 133. [Google Scholar] [CrossRef]
  26. Nordlien, J.H.; Ono, S.; Masuko, N.; Nisancioglu, K. A tem investigation of naturally formed oxide films on pure magnesium. Corros. Sci. 1997, 39, 1397–1414. [Google Scholar] [CrossRef]
  27. Dutta Majumdar, J.; Galun, R.; Mordike, B.L.; Manna, I. Effect of laser surface melting on corrosion and wear resistance of a commercial magnesium alloy. Mater. Sci. Eng. A 2003, 361, 119–129. [Google Scholar] [CrossRef]
  28. 2017. Available online: https://imagej.net/Welcome (accessed on 3 November 2025).
  29. Cramer, S.D.; Covino, B.S. Corrosion: Fundamentals, Testing, and Protection; ASM Handbook: Materials Park, OH, USA, 2003; Volume 13A. [Google Scholar]
  30. Song, G.; Atrens, A.; Dargusch, M. Influence of microstructure on the corrosion of diecast AZ91D. Corros. Sci. 1998, 41, 249–273. [Google Scholar] [CrossRef]
  31. Huang, W.; Hou, B.; Pang, Y.; Zhou, Z. Fretting wear behavior of AZ91D and AM60B magnesium alloys. Wear 2006, 260, 1173–1178. [Google Scholar] [CrossRef]
  32. Zeng, R.; Dietzel, W.; Witte, F.; Hort, N.; Blawert, C. Progress and challenge for magnesium alloys as biomaterials. Adv. Eng. Mater. 2008, 10, B3–B14. [Google Scholar] [CrossRef]
  33. Boissonneau, P.; Byrne, P. Experimental investigation of bubble-induced free convection in a small electrochemical cell. J. Appl. Electrochem. 2000, 30, 767–775. [Google Scholar] [CrossRef]
  34. Strasser, W.; Wonders, A. Hydrokinetic optimization of commercial scale slurry bubble column reactor. AIChE J. 2012, 58, 946–956. [Google Scholar] [CrossRef]
  35. Strasser, W. The Nature of “Searching” Vortices in Fluidic Logic Driven by a Switching Jet. J. Fluids Eng. 2022, 144, 081303. [Google Scholar] [CrossRef]
  36. Atrens, A.; Chen, X.; Shi, Z. Mg corrosion—Recent progress. Corros. Mater. Degrad. 2022, 3, 566–597. [Google Scholar] [CrossRef]
Disclaimer/Publisher’s Note: The statements, opinions and data contained in all publications are solely those of the individual author(s) and contributor(s) and not of MDPI and/or the editor(s). MDPI and/or the editor(s) disclaim responsibility for any injury to people or property resulting from any ideas, methods, instructions or products referred to in the content.

Article Metrics

Citations

Article Access Statistics

Article metric data becomes available approximately 24 hours after publication online.