Abstract
To optimize the microstructure and mechanical properties of Ti6Al4V alloys fabricated via Selective Laser Melting (SLM), this study proposes an optimization approach based on the chessboard scanning strategy. A systematic comparison of three scanning strategies—alternating, stripe, and chessboard scanning—was conducted to examine their effects on thermal input distribution, grain refinement, phase composition, and mechanical performance. Characterization results from Scanning Electron Microscopy (SEM), Electron Backscatter Diffraction (EBSD), and Transmission Electron Microscopy (TEM) revealed that the chessboard scanning strategy effectively refines the grain size to 88.64 ± 10.79 μm and increases the strengthening phase α′ content to 53.3%. Mechanical testing showed a tensile strength of 1179 ± 17 MPa (11.02% higher than stripe scanning) and elongation of 7.9 ± 0.4%. This strategy promotes random grain orientation by altering the scanning path, disrupting directional solidification, and suppressing texture formation. Microstructural mechanism analysis suggests that dislocation strengthening, increased α′ content, and grain refinement synergistically enhance both strength and ductility. These findings provide theoretical support for optimizing SLM parameters and the design of Ti6Al4V alloys’ microstructure and mechanical properties.
1. Introduction
Ti6Al4V is a typical α+β dual-phase titanium alloy. Since its co-development by the Bettis Atomic Power Laboratory and the Watertown Arsenal in 1954, it has become a key structural material in aerospace, biomedical, and advanced equipment manufacturing industries [1,2,3,4]. This is due to its high specific strength, excellent corrosion resistance, and good biocompatibility. However, conventional processing methods, such as forging and casting, are constrained by the alloy’s inherent work-hardening behavior and limited room-temperature formability [5]. This makes it difficult to achieve high-precision fabrication of complex geometries. Moreover, these processes often induce microstructural anisotropy, which restricts the material’s stability.
Additive manufacturing (AM) is characterized by a layer-by-layer deposition and rapid solidification mechanism. It effectively overcomes the geometric limitations of conventional manufacturing and enables near-net-shape fabrication of metallic components based on 3D CAD models [6,7]. As a representative of powder bed fusion AM technologies, selective laser melting (SLM) uses a high-energy laser beam to selectively melt and metallurgically fuse metal powders layer by layer. This provides excellent geometric freedom and high part density [8,9]. The rapid localized heating and nonequilibrium solidification in SLM processes [10] result in fine-grain strengthening effects and unconventional phase evolution behaviors in the formed microstructure. However, SLM inherently involves strong multiphysics coupling among thermal, fluid, solid, and interfacial phenomena. Melt pool dynamics (including thermal input, viscosity characteristics, Marangoni convection) and solidification microstructure evolution (including thermal gradient-induced phase transformations, elemental segregation, texture formation) collectively govern the resulting microstructure and the macroscopic performance of the fabricated parts [11,12,13,14,15,16]. Recent studies have shown that synergistic control of process parameters can effectively improve melt pool thermal behavior and its solidification microstructure, thereby optimizing the microstructural quality and mechanical properties of SLM components [17,18,19,20,21]. Among these process variables, scanning strategy, as an independent control path, modulates local thermal input distribution and grain competitive growth directions by altering the laser scanning path, direction, and area segmentation method. This exerts significant control over the formed microstructure [22,23,24,25,26]. Specifically, under the rapid cooling conditions of SLM, Ti6Al4V’s high-temperature β phase can transform into acicular or lamellar martensitic structures via diffusional (β→α) or diffusionless (β→α′) transformations. These transformations subsequently affect the overall performance of the final product. Shi et al. [27] examined the impact of R-scan, X-scan, Y-scan, XY-scan, and H-scan strategies on the microstructure and tensile properties of Ti6Al4V alloy during selective laser melting. The study revealed that different scanning strategies and offset angles resulted in variations in fracture characteristics and grain orientations. Notably, under a 45° offset angle with the XY-scan strategy, fracture cracks predominantly formed as dimple cracks. Additionally, when the orientation of the second phase α was aligned parallel to the tensile direction, the samples exhibited optimal performance in tests. Song et al. [28] investigated the relationship between scanning strategies, microstructure, crystal morphology, and mechanical properties of 316L stainless steel during the selective laser melting process. The results showed that optimizing the scanning strategy significantly enhanced the material’s strength and ductility. The interlayer rotation scanning strategy disrupted the columnar grain growth pattern, promoting grain refinement. At a 47° rotation angle, the grain size was smaller than that at a 90° angle. The study also suggested that the differences in grain boundary angles could be a key factor contributing to the improved mechanical properties of SLM-processed samples. Liu et al. [29] investigated the fabrication of high-strength and high-ductility Ti6Al4V alloy via selective laser melting, focusing on the effect of energy density on its microstructure and mechanical properties. The results indicated that the strengthening mechanism was primarily due to the refined and dense microstructure, as well as a high proportion of α and α′ phases. Additionally, optimizing the energy input significantly refined the grain size and promoted the formation of the martensitic phase, enhancing both the strength and ductility of the material.
Although preliminary studies have confirmed that scanning paths affect the microstructure and mechanical properties of SLM-fabricated parts, a systematic understanding of the relationship between scanning area segmentation and thermal input disturbance remains lacking. This work systematically evaluates the effects of three typical scanning strategies-alternate, stripe, and chessboard scanning—on the volume fraction of strengthening α′ phase, grain orientation, high-angle grain boundary proportion, and fracture mechanisms in Ti6Al4V, using SEM, EBSD, TEM, and mechanical testing. The microscopic mechanisms underlying the mechanical property enhancement are elucidated, providing a theoretical basis for achieving directional control of microstructure and tailored performance in SLM components.
2. Materials and Methods
2.1. Material
The Ti6Al4V alloy powder and data used in the study were provided by Suzhou Beifeng Intelligent Technology Co., Ltd. (Suzhou, China). The powder was produced through an atomization process, and its chemical composition is shown in Table 1. The powder morphology and particle size distribution are shown in Figure 1a and Figure 1b, respectively. The powder particle size ranged from 20 to 58 μm, with an average particle diameter (d50) of 39.976 μm. The samples were fabricated using an SP 101 selective laser melting machine (AmPro Innovations Technology Co., Ltd., Suzhou, China) equipped with a 500 W IPG fiber laser (spot diameter 60 μm, wavelength 1064 nm). Argon was used as the protective gas during fabrication, and the chamber oxygen content was controlled below 100 ppm. All samples were fabricated by near-net-shape SLM. Figure 1c presents the metallographic samples (10 mm × 10 mm × 10 mm) and the observation surface, while Figure 1d presents the detailed dimensions of the tensile specimen, which conforms to the ASTM E8/E8M-22 standard [30].

Table 1.
Composition of Ti6Al4V powder used for SLM.
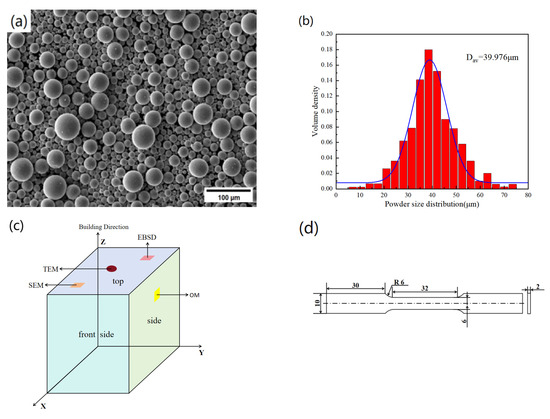
Figure 1.
(a) SEM morphology and (b) particle size distribution of Ti6Al4V alloy powder; (c) metallographic specimen observation surface; (d) tensile specimen dimensions (mm).
2.2. Process Parameters
To reduce residual stress during the fabrication process, the build platform was preheated to 100 ± 2 °C, and the scanning direction of each successive layer was rotated successively by 67° [31]. The key process parameters were set as follows: laser power P = 310 W, scanning speed v = 1200 mm/s, hatch spacing d = 80 μm, and layer thickness h = 30 μm. To isolate the independent effect of scanning strategies on performance, three groups of comparison samples were designed in this study. Each group consisted of three samples, corresponding to alternating scanning (S1), stripe scanning (S2), and chessboard scanning (S3). The detailed scanning paths are shown in Figure 2.

Figure 2.
Different scanning strategies for SLM Ti6Al4V: (a) alternate scanning, (b) stripe scanning, and (c) chessboard scanning.
2.3. Characterization
The samples were embedded in epoxy resin (cold setting), fixed, and sequentially ground using P240, P600, P1200, and P2000 metallographic papers. Coarse polishing was performed with a 3-micron diamond polishing agent, followed by fine polishing using OPS. The polished surfaces were rinsed, air-dried, and then etched for 30 s with Kroll’s reagent (HF:HNO3:H2O = 2:6:92). Finally, the samples were cleaned ultrasonically for 10 min. Microstructural morphology was characterized by scanning electron microscopy (SEM, Gemini 300, ZEISS, Oberkochen, Germany) at an accelerating voltage of 15 kV. Electron backscatter diffraction (EBSD) was employed to analyze the crystallographic texture, using an accelerating voltage of 15 kV, a step size of 0.15 μm, and electrochemical polishing of the samples at 243 K and 23 V. The electrolyte composition was HClO4:C4H10O:CH3OH = 3:17:30.
Transmission electron microscopy (TEM, JEOL JEM-2100F, JEOL, Tokyo, Japan) was employed to examine the dislocation structures in the samples under an accelerating voltage of 200 kV. TEM sample preparation was performed using a Gatan 695 ion milling system (Gatan, Inc., Pleasanton, CA, USA), with initial thinning at 4 kV and 10° tilt, followed by final polishing at 2.5 kV and 5° tilt to ensure a specimen thickness below 100 nm in the thin regions.
Microhardness measurements were conducted using an HM-3 Vickers microhardness tester (Future-Tech, Kawasaki, Japan) under a load of 0.2 kg with a dwell time of 15 s. Ten indentations were performed on the sample surface, and the average value was reported as the final hardness. Tensile tests were carried out on a 50 kN universal testing machine (AGS-X, Shimadzu, Kyoto, Japan) at a loading rate of 1 mm/min. The tensile direction was perpendicular to the build direction, and each test group was repeated three times to ensure data reliability. Fracture morphology was observed and analyzed by scanning electron microscopy (ZEISS Gemini 300).
3. Results and Discussion
3.1. Microstructure Characteristics
Figure 3 shows the optical micrographs of Ti6Al4V samples fabricated using different scanning strategies. All three samples exhibit columnar prior-β grains growing layer by layer along the build direction. The formation of these columnar β grains originates from the steep positive temperature gradient established in the melt pool during the solidification process. Figure 4 presents the scanning electron microscopy (SEM) images of Ti6Al4V samples. The observations indicate that all samples exhibit neither unmelted regions nor obvious interlayer defects. All samples exhibit a typical acicular α′ martensitic microstructure, which is characteristic of the rapid solidification behavior intrinsic to the selective laser melting process [32]. Notably, the sample fabricated using the chessboard scanning strategy displays a more randomized orientation of the secondary α′ phase grains, suggesting that subdividing the scanning path into multiple small, interlaced regions effectively disrupts directional solidification, suppresses texture formation, and promotes the development of a more isotropic microstructure.

Figure 3.
Optical micrographs of etched Ti6Al4V samples: (a) as-built sample S1, (b) as-built sample S2 and (c) as-built sample S3.
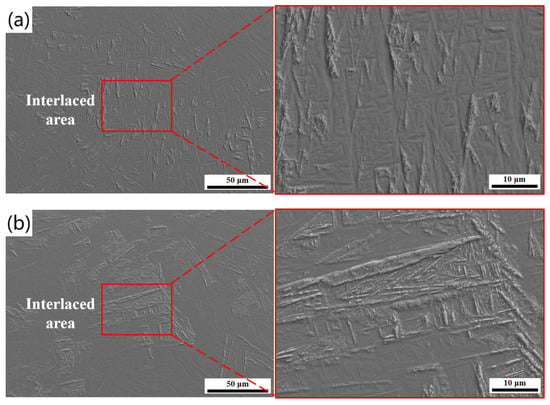
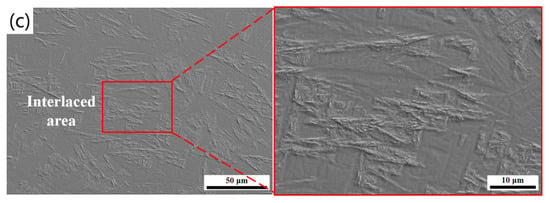
Figure 4.
Scanning electron microscopy images of Ti6Al4V samples: (a) as-built sample S1, (b) as-built sample S2 and (c) as-built sample S3.
3.2. Grain Orientation
Figure 5 shows the inverse pole figures (IPFs) of the α phase in samples fabricated using different scanning strategies. All samples predominantly consist of fine acicular α′ martensite with few columnar grains, in which the fine acicular α′ martensite is distributed in an interlaced needle-like morphology. Notably, the S3 sample exhibits a more randomized grain orientation distribution, lacking any obvious preferred orientation. This further confirms that the chessboard scanning strategy effectively disrupts the dominant thermal flow direction typically observed in conventional scanning strategies, thereby suppressing preferential grain growth along specific crystallographic directions. In contrast, the samples fabricated using alternate and stripe scanning strategies display more pronounced grain orientation consistency, highlighting the significant influence of thermal flow directionality on grain orientation evolution.

Figure 5.
Inverse pole figures for (a) as-built sample S1, (b) as-built sample S2 and (c) as-built sample S3.
Figure 6 presents the pole figures of samples fabricated with the three scanning strategies, all showing pronounced texture characteristics along the <0001> crystallographic direction. Among them, the sample produced by the chessboard scanning strategy exhibits the lowest random distribution density of 6.605 mrd, indicating a more dispersed grain orientation distribution and weaker texture intensity. In contrast, the sample fabricated using the alternate scanning strategy has the highest random distribution density (10.499 mrd), suggesting that its grains are more concentrated along specific orientations with pronounced anisotropic features. It is noteworthy that texture weakening helps reduce the directionality of material properties, which is crucial for improving the overall performance of structural components under multi-directional loading conditions.
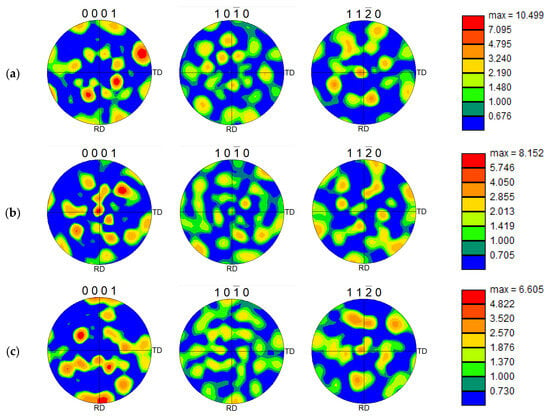
Figure 6.
Pole figures for (a) as-built sample S1, (b) as-built sample S2 and (c) as-built sample S3.
3.3. Mechanical Properties
The scanning strategy significantly affects the mechanical properties of metal parts fabricated via SLM, as shown in Table 2. Among them, thermal crack defects generated during the solidification process may lead to premature fracture and failure during tensile testing [33]. Figure 7 presents the engineering stress–strain curves of Ti6Al4V samples fabricated using different scanning strategies at room temperature, along with bar charts showing ultimate tensile strength (UTS), yield strength (YS), and elongation (EL).

Table 2.
The tensile properties of SLM-Ti6Al4V alloy samples.
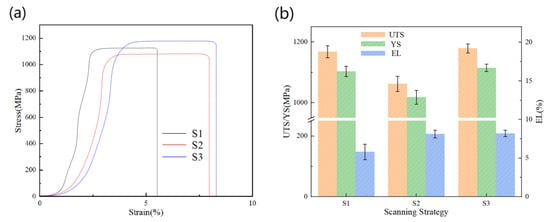
Figure 7.
(a) Engineering stress–strain curves and (b) dual Y-axis bar charts of ultimate tensile strength (UTS), yield strength (YS), and elongation (EL) for Ti6Al4V samples fabricated via SLM under different scanning strategies.
The S3 sample exhibits the highest ultimate tensile strength (1179 ± 17 MPa) and yield strength (1115 ± 11 MPa), along with an elongation of 7.9 ± 0.4%. Compared to S1 (UTS: 1168 ± 18 MPa, YS: 1109 ± 10 MPa) and S2 (UTS: 1062 ± 21MPa, YS: 977 ± 13 MPa), the mechanical properties of S3 are superior. Generally, strength and ductility are inversely correlated [35]; however, the S3 sample achieves a synergistic improvement in both, demonstrating excellent strength–ductility combination.
To investigate the effect of different scanning strategies on the fracture behavior of Ti6Al4V samples, tensile fracture surfaces were analyzed at both low and high magnifications using scanning electron microscopy (SEM). As shown in Figure 8, all three samples exhibit typical spherical porosity defects on their fracture surfaces. Thermal cracks were observed on the fracture surfaces of S1 and S2 samples (Figure 8a,c), whereas no thermal cracks were detected on the S3 sample (Figure 8e). This absence is primarily attributed to the chessboard scanning strategy’s effectiveness in reducing heat accumulation during fabrication [36]. Among the samples, S2 exhibited the highest number of thermal cracks, resulting in a marked decrease in ductility.
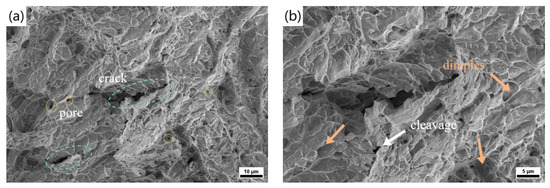
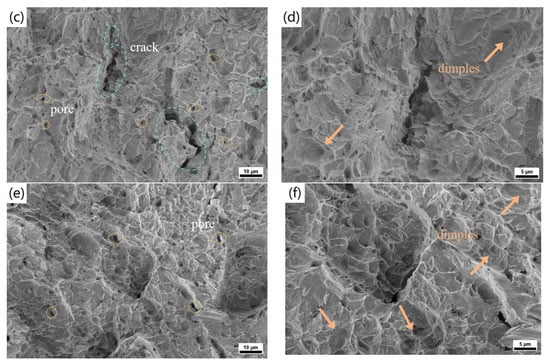
Figure 8.
Scanning electron microscopy images of tensile fracture surfaces under different scanning strategies: (a,b) as-built sample S1, (c,d) as-built sample S2 and (e,f) as-built sample S3.
Further analysis of the fracture surfaces revealed the presence of dimpled structures across all samples. Notably, the S3 sample exhibited a significantly increased number of dimples, characterized by greater depth and a more uniform distribution across the fracture surface. In contrast, the S1 fracture surface (Figure 8b) displayed a mixed mode of ductile and cleavage features, indicating a combination of ductile and brittle fracture. The S2 and S3 samples exhibited predominantly ductile fracture modes, indicating superior plastic deformation capacity.
To elucidate the influence of scanning strategies on localized plastic deformation, selective laser-melted Ti6Al4V samples were characterized using transmission electron microscopy (TEM) in conjunction with kernel average misorientation (KAM) maps derived from electron backscatter diffraction (EBSD) analysis (Figure 9). The results reveal a high density of dislocation structures in all three samples. Notably, the S3 sample exhibits pronounced cross-slip and dislocation entanglements near martensitic lamellar interfaces and grain boundaries. This complex dislocation network facilitates the uniform distribution of plastic strain at the microscale, promotes a stable plastic deformation mechanism, and enhances overall ductility. In contrast, the S1 sample shown in Figure 9a mainly features isolated dislocation entanglements. Such localized stress concentration microstructures are prone to microcrack initiation under external loading, likely serving as the nucleation sites for cleavage observed in Figure 8b, thereby significantly reducing fracture ductility.
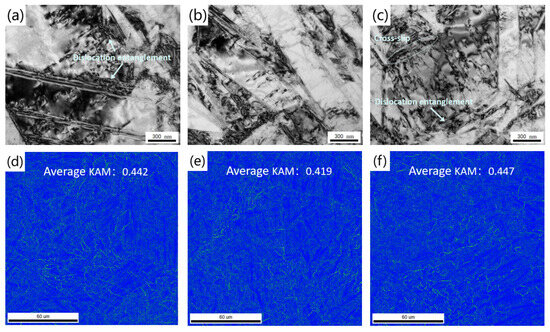
Figure 9.
TEM images of SLM-fabricated Ti6Al4V alloy samples: (a) as-built sample S1, (b) as-built sample S2, (c) as-built sample S3; and KAM maps: (d) as-built sample S1, (e) as-built sample S2, (f) as-built sample S3.
To further clarify the local strain distribution induced by different scanning strategies, the average misorientation map (KAM) of the α phase was employed to assess dislocation density. As depicted in Figure 9d–f, frequent changes in laser scanning direction and regional partitioning in the S3 sample reduce the thermal gradient and help maintain a relatively high temperature within the deposited alloy layers. This condition facilitates grain boundary migration, leading to an increased number and density of dislocations and ultimately resulting in a more uniform overall dislocation distribution.
The mechanical properties of Ti6Al4V alloy are closely related to its microstructure, including the content of strengthening phases and grain size [37]. Previous studies have shown that the acicular α′ martensitic structure exhibits the highest strength in Ti6Al4V, while the strength of columnar α+β phase microstructures is superior to that of equiaxed α+β structures [38]. To further investigate the micro-mechanisms underlying the synergistic strength–ductility effect observed with the chessboard scanning strategy, this study conducts a detailed characterization of the strengthening α′ phase content and grain size.
Figure 10 presents the Vickers microhardness of Ti6Al4V alloys fabricated under different scanning strategies. The hardness investigated here primarily depends on the content of the strengthening α′ phase. Accordingly, the final hardness of the samples is mainly determined by the volume fraction of the α′ phase, which is calculated as follows [37]:
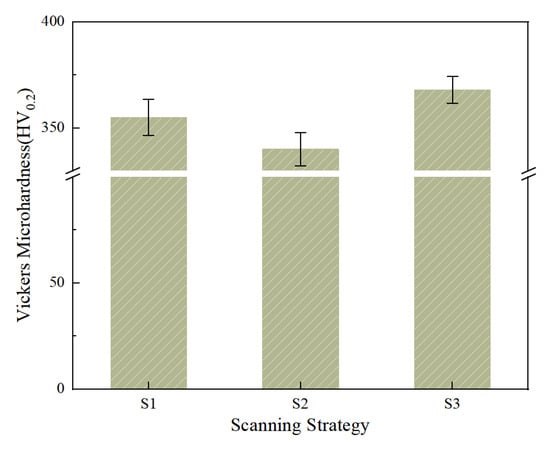
Figure 10.
Vickers microhardness of SLM-built samples with different scanning strategies.
In the equation, fα′ represents the volume fraction of the α′ phase, Hα′ is the hardness of the α′ phase (427 HV), and Hα is the hardness of the α phase (300 HV) [39]. directly from this relationship, the proportions of α′ and α phases in different samples were calculated and are summarized in Table 3. Previous studies have demonstrated that the scanning strategy significantly affects the melt pool temperature gradient and heat accumulation; lower cooling rates promote the formation of α′/α martensitic mixed microstructures, whereas cooling rates exceeding 410 °C/s tend to yield fully α′ martensitic structures [40].

Table 3.
Fraction of α/α′ phases with different process parameters.
The chessboard scanning strategy divides the scanning path into multiple small regions, facilitating more uniform heat diffusion from the melt pool to unmelted areas, thereby reducing local cooling rates and lowering peak heat accumulation. Although this strategy effectively mitigates excessive overheating, the frequent changes in scanning direction and intermittent exposure still lead to relatively high thermal gradients and thermal fluctuations. Under such complex, non-steady-state thermal cycling conditions, rapid nucleation and retention of the strengthening α′ martensite phase are promoted. As a result, the S3 sample exhibits the highest α′ phase content (53.3%), which microscopically contributes to increased dislocation density and enhanced interface strengthening, resulting in superior mechanical properties.
Figure 11a shows the distribution of high-angle grain boundaries (HAGBs) and low-angle grain boundaries (LAGBs) in samples fabricated with different scanning strategies. The results indicate that the proportion of HAGBs exceeds 91% in all samples, confirming the formation of numerous interfaces with significant grain orientation differences during the SLM process. Due to their strong lattice discontinuity, HAGBs effectively inhibit grain growth during deformation and recrystallization, maintaining a fine-grained structure and thereby enhancing mechanical properties. Further analysis reveals that the S3 sample has the lowest proportion of LAGBs, only 3.19%. Figure 11b shows the grain size distribution of the three samples, which was calculated using the Image-Pro Plus 6.0 software. The average grain size of the S3 sample is 88.64 ± 10.79 μm, which is significantly smaller than that of the S1 (97.52 ± 16.61 μm) and S2 (102.02 ± 18.72 μm) samples. Grain refinement increases the grain boundary density, which enhances the frequency of dislocation–boundary interactions during slip, thereby restricting dislocation mobility and reducing slip distances. This leads to faster stress accumulation macroscopically, manifesting as increased strength. According to the Hall–Petch relationship [41], the yield strength of the material can be expressed as follows:
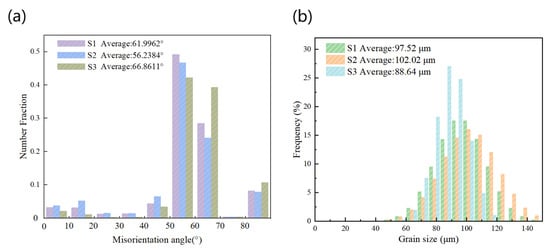
Figure 11.
(a) Grain boundary misorientation distribution and (b) grain size distribution of Ti6Al4V alloy samples fabricated via SLM under different scanning strategies.
In the equation, represents the yield strength, is the lattice friction stress, is a material-dependent constant, and is the average grain size. It can be seen that the smaller the grain size, the higher the yield strength. Therefore, the superior mechanical performance of the S3 sample is primarily attributed to grain refinement, where fine-grain strengthening serves as a dominant mechanism. Combined with the increased dislocation density and higher strengthening phase content, the S3 sample achieves a synergistic improvement in both strength and ductility.
4. Conclusions
This study systematically investigates the effects of three scanning strategies on the microstructure characteristics and mechanical properties of Ti6Al4V alloy fabricated via selective laser melting. Based on comprehensive microstructural characterization and mechanical testing, the main conclusions are as follows:
- (1)
- All samples predominantly exhibit an interlaced distribution of needle-like α′ martensitic structures. Compared to alternating and stripe scanning strategies, the chessboard scanning strategy segments the scanning area and frequently changes the scanning path. This approach suppresses directional solidification and promotes an isotropic microstructure. Pole figures and inverse pole figures further confirm that the grain orientation in the chessboard-scanned samples is randomly distributed. These samples show the lowest random distribution density (6.605 mrd) and the weakest texture strength, significantly reducing anisotropy.
- (2)
- The tensile fracture surface of the chessboard-scanned samples exhibits uniformly distributed ductile dimples, primarily governed by ductile fracture. In contrast, the fracture surface of the alternating and stripe scanning samples shows a mixed feature of dimples and cleavage, leading to reduced elongation. TEM combined with KAM mapping analysis reveals a higher dislocation density in the chessboard-scanned samples, with a complex network of cross-slip and dislocation entanglements.
- (3)
- The chessboard scanning strategy increased the α′ martensitic phase content to 53.3% and refined the grain size to 88.64 ± 10.79 μm, significantly enhancing the grain refinement strengthening effect. Combined with the synergistic effects of high strengthened phase content and dislocation strengthening, both strength and ductility were optimized. This strategy offers a new approach for improving the mechanical properties of Ti6Al4V alloy in additive manufacturing. In the future, it could be extended to optimize other high-performance alloys and multi-material systems, advancing the practical application of high-strength, high-ductility materials.
Author Contributions
Conceptualization, C.C.; methodology, H.Z.; validation, L.Y., H.G. and J.Y.; investigation, H.Z.; data curation, H.G.; writing—original draft preparation, H.Z.; writing—review and editing, H.Z. and C.C.; visualization, H.G. and J.Y.; supervision, C.C. and L.Y.; funding acquisition, C.C. All authors have read and agreed to the published version of the manuscript.
Funding
This research was funded by the Natural Science Foundation of China, grant number 51305251.
Data Availability Statement
The original contributions presented in this study are included in the article. Further inquiries can be directed to the corresponding author.
Conflicts of Interest
The authors declare no conflicts of interest.
References
- Tang, M.K.; Zhang, L.C.; Zhang, N. Microstructural evolution, mechanical and tribological properties of TiC/Ti6Al4V composites with unique microstructure prepared by SLM. Mater. Sci. Eng. A 2021, 814, 141187. [Google Scholar] [CrossRef]
- Luo, Y.W.; Wang, M.Y.; Zhu, J.; Tu, J.G.; Jiao, S.Q. Microstructure and Corrosion Resistance of Ti6Al4V Manufactured by Laser Powder Bed Fusion. Metals 2023, 13, 496. [Google Scholar] [CrossRef]
- Islam, S.A.; Hao, L.; Javaid, Z.; Xiong, W.; Li, Y.; Jamil, Y.; Chen, Q.Y.; Han, G.C. Surface Roughness of Interior Fine Flow Channels in Selective Laser Melted Ti-6Al-4V Alloy Components. Micromachines 2024, 15, 348. [Google Scholar] [CrossRef]
- Zhao, B.J.; Wang, H.; Qiao, N.; Wang, C.; Hu, M. Corrosion resistance characteristics of a Ti-6Al-4V alloy scaffold that is fabricated via electron beam melting and selective laser melting for implantation in vivo. Mater. Sci. Eng. C 2017, 70, 832–841. [Google Scholar] [CrossRef]
- Gisario, A.; Kazarian, M.; Martina, F.; Mehrpouya, M. Metal additive manufacturing in the commercial aviation industry: A review. J. Manuf. Syst. 2019, 53, 124–149. [Google Scholar] [CrossRef]
- Zhang, D.Y.; Feng, Z.; Wang, C.J.; Wang, W.D.; Liu, Z.; Niu, W. Comparison of microstructures and mechanical properties of Inconel 718 alloy processed by selective laser melting and casting. Mater. Sci. Eng. A 2018, 724, 357–367. [Google Scholar] [CrossRef]
- Shin, W.S.; Son, B.; Song, W.S.; Sohn, H.; Jang, H.; Kim, Y.J.; Park, C. Heat treatment effect on the microstructure, mechanical properties, and wear behaviors of stainless steel 316L prepared via selective laser melting. Mater. Sci. Eng. A 2021, 806, 140805. [Google Scholar] [CrossRef]
- Liu, Y.Q.; Shan, Z.D.; Yang, X.J.; Jiao, H.W.; Huang, W.Y. Effect of Scanning Strategies on the Microstructure and Mechanical Properties of Ti-22Al-25Nb Alloy Fabricated through Selective Laser Melting. Metals 2023, 13, 634. [Google Scholar] [CrossRef]
- Pal, S.; Finšgar, M.; Hudák, R.; Rajťúková, V.; Brajlih, T.; Gubeljak, N.; Drstvenšek, I. Mechanisms of defect formation in Ti-6Al-4V product during re-melting of layers in selective laser melting. J. Manuf. Process. 2023, 105, 260–275. [Google Scholar] [CrossRef]
- Eshawish, N.; Malinov, S.; Sha, W. Effect of Solution Treatment and Cooling Rate on the Microstructure and Hardness of Ti-6Al-4V Alloy Manufactured by Selective Laser Melting Before and After Hot Isostatic Pressing Treatment. J. Mater. Eng. Perform. 2022, 31, 3550–3558. [Google Scholar] [CrossRef]
- Xiong, Z.H.; Liu, S.L.; Li, S.F.; Shi, Y.; Yang, Y.F.; Misra, R.D.K. Role of melt pool boundary condition in determining the mechanical properties of selective laser melting AlSi10Mg alloy. Mater. Sci. Eng. A 2019, 740–741, 148–156. [Google Scholar] [CrossRef]
- Khorasani, A.M.; Gibson, I.; Goldberg, M.; Littlefair, G. A survey on mechanisms and critical parameters on solidification of selective laser melting during fabrication of Ti-6Al-4V prosthetic acetabular cup. Mater. Des. 2016, 103, 348–355. [Google Scholar] [CrossRef]
- Ye, D.S.; Zhu, K.P.; Fuh, J.Y.H.; Zhang, Y.J.; Soon, H.G. The investigation of plume and spatter signatures on melted states in selective laser melting. Opt. Laser Technol. 2018, 111, 395–406. [Google Scholar] [CrossRef]
- Le, K.Q.; Tang, C.; Wong, C.H. On the study of keyhole-mode melting in selective laser melting process. Int. J. Therm. Sci. 2019, 145, 105992. [Google Scholar] [CrossRef]
- Yu, G.Q.; Gu, D.D.; Dai, D.H.; Xia, M.J.; Ma, C.L.; Chang, K. Influence of processing parameters on laser penetration depth and melting/re-melting densification during selective laser melting of aluminum alloy. Appl. Phys. A 2016, 122, 891. [Google Scholar] [CrossRef]
- Thijs, L.; Verhaeghe, F.; Craeghs, T.; Humbeeck, J.V.; Kruth, J.P. A study of the microstructural evolution during selective laser melting of Ti–6Al–4V. Acta Mater. 2010, 58, 3303–3312. [Google Scholar] [CrossRef]
- Khorasani, A.M.; Gibson, I.; Awan, U.S.; Ghaderi, A. The effect of SLM process parameters on density, hardness, tensile strength and surface quality of Ti-6Al-4V. Addit. Manuf. 2019, 25, 176–186. [Google Scholar] [CrossRef]
- Larimian, T.; Kannan, M.; Grzesiak, D.; AlMangour, B.; Borkar, T. Effect of energy density and scanning strategy on densification, microstructure and mechanical properties of 316L stainless steel processed via selective laser melting. Mater. Sci. Eng. A 2020, 770, 138455. [Google Scholar] [CrossRef]
- McLouth, T.D.; Witkin, D.B.; Bean, G.E.; Sitzman, S.D.; Adams, P.M.; Lohser, J.M.; Yang, J.M.; Zaldivar, R.J. Variations in ambient and elevated temperature mechanical behavior of IN718 manufactured by selective laser melting via process parameter control. Mater. Sci. Eng. A 2020, 780, 139184. [Google Scholar] [CrossRef]
- Javidrad, H.R.; Ghanbari, M.; Javidrad, F. Effect of scanning pattern and volumetric energy density on the properties of selective laser melting Ti-6Al-4V specimens. J. Mater. Res. Technol. 2021, 12, 989–998. [Google Scholar] [CrossRef]
- Jing, Y.L.; Wang, P.; Yan, X.L. Effect of Process Parameters and Layer Thickness on the Quality and Performance of Ti-6Al-4V Fabricated via Selective Laser Melting. Coatings 2021, 11, 1323. [Google Scholar] [CrossRef]
- Strantza, M.; Ganeriwala, R.K.; Clausen, B.; Phan, T.Q.; Levine, L.E.; Pagan, D.C.; Ruff, J.P.C.; King, W.E.; Johnson, N.S.; Martinez, R.M.; et al. Effect of the scanning strategy on the formation of residual stresses in additively manufactured Ti-6Al-4V. Addit. Manuf. 2021, 45, 102003. [Google Scholar] [CrossRef]
- Chang, S.J.; Wei, Z.X. Influences of the scanning strategy on surface roughness in selective laser melting. Proc. Inst. Mech. Eng. Part B J. Eng. Manuf. 2020, 236, 14. [Google Scholar] [CrossRef]
- Wan, H.Y.; Zhou, Z.J.; Li, C.P.; Chen, G.F.; Zhang, G.P. Effect of scanning strategy on mechanical properties of selective laser melted Inconel 718. Mater. Sci. Eng. A 2019, 753, 42–48. [Google Scholar] [CrossRef]
- Zhang, H.M.; Gu, D.D.; Ma, C.L.; Guo, M.; Wang, R.; Yang, J.K.; Ge, Q. Microstructure and tribological property of selective laser melted Ni-based composites using different scanning strategies. Vacuum 2020, 177, 109439. [Google Scholar] [CrossRef]
- Giganto, S.; Martínez-Pellitero, S.; Barreiro, J.; Leo, P.; Castro-Sastre, M.Á. Impact of the laser scanning strategy on the quality of 17-4PH stainless steel parts manufactured by selective laser melting. J. Mater. Res. Technol. 2022, 20, 2734–2747. [Google Scholar] [CrossRef]
- Shi, W.T.; Han, Y.F.; Li, J.H.; Liu, Y.D.; Zhou, Y.S.; Lin, Y.X. Investigation of the scanning strategy on the microstructure and tensile property of Ti6Al4V alloy fabricated by selective laser melting. Proc. Inst. Mech. Eng. Part C J. Mech. Eng. Sci. 2022, 237, 1. [Google Scholar] [CrossRef]
- Song, Y.N.; Sun, Q.D.; Guo, K.; Wang, X.B.; Liu, J.W.; Sun, J. Effect of scanning strategies on the microstructure and mechanical behavior of 316L stainless steel fabricated by selective laser melting. Mater. Sci. Eng. A 2020, 793, 139879. [Google Scholar] [CrossRef]
- Liu, J.W.; Sun, Q.D.; Zhou, C.A.; Wang, X.B.; Li, H.; Guo, K.; Sun, J. Achieving Ti6Al4V alloys with both high strength and ductility via selective laser melting. Mater. Sci. Eng. A 2019, 766, 138319. [Google Scholar] [CrossRef]
- ASTM E8/E8M-22; Standard Test Methods for Tension Testing of Metallic Materials. ASTM International: West Conshohocken, PA, USA, 2022. [CrossRef]
- Bartlett, J.L.; Li, X.D. An overview of residual stresses in metal powder bed fusion. Addit. Manuf. 2019, 27, 131–149. [Google Scholar] [CrossRef]
- Xu, W.; Brandt, M.; Sun, S.; Elambasseril, J.; Liu, Q.; Latham, K.; Xia, K.; Qian, M. Additive manufacturing of strong and ductile Ti–6Al–4V by selective laser melting via in situ martensite decomposition. Acta Mater. 2015, 85, 74–84. [Google Scholar] [CrossRef]
- Nong, X.D.; Zhou, X.L. Effect of scanning strategy on the microstructure, texture, and mechanical properties of 15-5PH stainless steel processed by selective laser melting. Mater. Charact. 2021, 174, 111012. [Google Scholar] [CrossRef]
- Ali, H.; Ghadbeigi, H.; Mumtaz, K. Effect of scanning strategies on residual stress and mechanical properties of Selective Laser Melted Ti6Al4V. Mater. Sci. Eng. A 2018, 712, 175–187. [Google Scholar] [CrossRef]
- Lewandowski, J.J.; Seifi, M. Metal Additive Manufacturing: A Review of Mechanical Properties. Annu. Rev. Mater. Res. 2016, 46, 151–186. [Google Scholar] [CrossRef]
- Parry, L.; Ashcroft, I.A.; Wildman, R.D. Understanding the effect of laser scan strategy on residual stress in selective laser melting through thermo-mechanical simulation. Addit. Manuf. 2016, 12, 1–15. [Google Scholar] [CrossRef]
- Liu, S.Y.; Shin, Y.C. Additive manufacturing of Ti6Al4V alloy: A review. Mater. Des. 2019, 164, 107552. [Google Scholar] [CrossRef]
- Galarraga, H.; Warren, R.J.; Lados, D.A.; Dehoff, R.R.; Kirka, M.M.; Nandwana, P. Effects of heat treatments on microstructure and properties of Ti-6Al-4V ELI alloy fabricated via electron beam melting (EBM). Mater. Sci. Eng. A 2017, 685, 417–428. [Google Scholar] [CrossRef]
- Hahn, J.D.; Shin, Y.C.; Krane, M.J.M. Laser transformation hardening of Ti-6Al-4V in solid state with accompanying kinetic model. Surf. Eng. 2007, 23, 78–82. [Google Scholar] [CrossRef]
- Ahmed, T.; Rack, H.J. Phase transformations during cooling in α+β titanium alloys. Mater. Sci. Eng. A 1998, 243, 206–211. [Google Scholar] [CrossRef]
- Wei, F.X.; Cheng, B.S.; Chew, L.T.; Lee, J.J.; Cheong, K.H.; Wu, J.; Zhu, Q.; Tan, C.C. Grain distribution characteristics and effect of diverse size distribution on the Hall-Petch relationship for additively manufactured metal alloys. J. Mater. Res. Technol. 2022, 20, 4130–4136. [Google Scholar] [CrossRef]
Disclaimer/Publisher’s Note: The statements, opinions and data contained in all publications are solely those of the individual author(s) and contributor(s) and not of MDPI and/or the editor(s). MDPI and/or the editor(s) disclaim responsibility for any injury to people or property resulting from any ideas, methods, instructions or products referred to in the content. |
© 2025 by the authors. Licensee MDPI, Basel, Switzerland. This article is an open access article distributed under the terms and conditions of the Creative Commons Attribution (CC BY) license (https://creativecommons.org/licenses/by/4.0/).