Article

An Investigation into the Influence of Weld Bead Sequence on Residual Stress Distribution in a High-Speed Train Bogie Beam Using Thermo-Elastic–Plastic Finite Element Analysis

1
College of Materials Science and Engineering, Chongqing University, Chongqing 400044, China
2
Sichuan Kexin Electromechanical Co., Ltd., Deyang 618400, China
*
Authors to whom correspondence should be addressed.
Metals 2025, 15(11), 1225; https://doi.org/10.3390/met15111225
Submission received: 26 September 2025 / Revised: 1 November 2025 / Accepted: 2 November 2025 / Published: 6 November 2025

Abstract

The bogie serves as a critical structural component in high-speed trains, subjected to dynamic loads throughout its operational lifecycle. Enhancing the fatigue life of the bogie necessitates not only ensuring welding quality but also effectively managing welding residual stresses during the manufacturing process. In this study, an efficient and simplified thermal–elastoplastic finite element method was developed based on the ABAQUS software platform, and its reliability and applicability were validated through comparison with measured data. The computational approach was employed to investigate the distribution characteristics of welding residual stresses in a weathering steel bogie beam, with particular emphasis on the influence of different welding sequences on residual stress distribution. Simulated results demonstrate that the welding sequence significantly influences the residual stress distribution and magnitude within the beam. The numerical simulation methodology developed in this study offers a powerful tool for optimizing welding sequences to regulate residual stresses during the fabrication of bogie structures.

1. Introduction

The bogie is one of the most critical components of a high-speed train, and the welded joints within it may represent potential weak points in the overall structure. Therefore, the manufacturing quality and residual stress levels of these welded joints are directly related to the safe operation and service life of the vehicle [1]. As high-speed trains continue to evolve toward operation in harsher environments, longer distances, higher speeds, and extended service lifetime, the welded joints of bogies face increasingly severe challenges, particularly in terms of fatigue performance. As a core structural component of the bogie frame, the circumferential weld of the beam has been identified through fatigue load analysis as a region of high-stress amplitude, thereby posing a significant risk for fatigue crack initiation [2]. It is important to note that welding residual stress—particularly tensile residual stress—is a key factor influencing the fatigue performance of welded structures. High level of residual stress can significantly accelerate fatigue damage in welded joints [3,4]. Therefore, controlling both the magnitude and distribution of residual stress in the beam welds of bogies is of critical importance.
Currently, experimental measurement and numerical simulation are the two primary methods used to determine the residual stress distribution in structural components. In recent years, both approaches have been employed to investigate the residual stress in weathering steel beams of bogies. Hu et al. [5] measured residual stress at 12 points on the outer surface of the circumferential weld at the end of the bogie beam of the CRH380B high-speed EMU using X-ray diffraction. However, due to the limited number of measurement points, it was difficult to accurately characterize the overall stress distribution of the welded joint. Moreover, this experimental method is restricted to surface measurements and cannot capture internal residual stresses. Yu et al. [6] simulated the welding deformation and residual stress of an EMU beam using a double ellipsoidal heat source model. However, the authors only presented Mises stress distribution curves without providing detailed results for key stress components, such as axial and circumferential stresses. Experimental methods are generally time-consuming, labor-intensive, costly, and limited in their ability to provide comprehensive residual stress data across the entire welded joint [7]. Numerical simulation based on thermal elastic plastic finite element analysis offers an alternative to experimental approaches, enabling the determination of residual stress at any location within the welded joint and allowing for the tracking of residual stress evolution during the welding process. This method has gained increasing attention in recent years. However, due to limitations in computational hardware, simulating residual stress in large and complex welded structures often requires the use of fine and extensive finite element meshes, especially when dealing with large-scale components and multi-pass welds. This leads to long computation time and substantial storage requirements, which limit its practical application in engineering contexts. Therefore, it is both necessary and urgent to develop an efficient numerical simulation method that balances computational accuracy with resource efficiency.
Theoretically, residual stress in welded joints can be mitigated or reduced by optimizing welding process parameters. Among various process factors, the welding sequence within the structure and the sequence of weld beads within a single joint (particularly in multi-pass joints) have been shown to significantly influence the magnitude and distribution of residual stress [8,9]. Deng et al. [9,10] investigated the effects of welding sequence and weld bead arrangement on residual stress in thick plate butt joints of austenitic stainless steel, and J-groove pipe-to-plate joints. Zheng et al. [11] investigated the influence of welding sequence on residual stress in fillet-welded joints of composite girders fabricated from Q355D steel plates. Their findings indicated that welding sequence not only affects the peak residual stress but also alters the overall stress distribution pattern. For the beam in the bogie—the focus of this study—which contains an X-groove weld joint on each of its left and right sides, it can be inferred that the residual stress distribution and magnitude can be partially controlled through optimization of the weld bead sequence.
This study focuses on the welded structure of weathering steel beams in high-speed train bogies, employing numerical simulation to investigate the magnitude and distribution of residual stress in the welded joints. Additionally, the influence of weld sequence on residual stress is examined. First, by comparing a series of numerical simulation results with experimental data, an efficient computational method suitable for simulating residual stress in multi-layer and multi-pass butt joints of bogie beams is proposed. Subsequently, using the proposed method, the primary focus is on analyzing the effect of weld bead sequence on residual stress in the beam structure. Based on the simulation results, the weld bead sequence is optimized, and a strategy for controlling welding residual stress is developed.

2. Experimental Procedure

2.1. Fabrication of the Butt-Welded Joint

To validate the accuracy of numerical simulation in predicting welding residual stress, a butt-welded joint was fabricated using SMA490BW weathering steel as the base material. The residual stress distribution on the top surface of the joint was measured using the hole-drilling method. The butt-welded joint was formed by welding two steel plates with dimensions of 350 mm × 175 mm × 12 mm. The joint configuration was a V-groove with a groove angle of 60°, a root gap of 1.0 mm, and a root face of 1.0 mm. The groove and weld bead arrangement are illustrated in Figure 1. The welding consumable used was a self-developed wire specific to weathering steel, designated ER55-G (1.2 mm diameter). The chemical compositions of the base metal and weld metal are presented in Table 1. Gas metal arc welding (GMAW) was employed with a shielding gas mixture of 80% Ar and 20% CO2. The welding parameters for each weld pass are summarized in Table 2, and the inter-pass temperature was maintained below 150 °C. It should be noted that the third and fourth weld beads exhibit greater width owing to the use of higher arc voltage compared to other passes, as well as the implementation of weaving welding, which effectively reduces weld defects.

2.2. Residual Stress Measurement

Following the welding process, the residual stress distribution on the top surface of the butt joint was determined using the hole-drilling method. The strain gauges used were of model HK21A, manufactured by ZEMIC in Xi’an, China, with the specific type being BE120-2CA-K. The layout of the strain gauges is shown in Figure 2. Based on previous experience, the measurement error range of welding residual stress using this method is ±30 MPa. Due to the uneven surface texture of the weld bead, it was not feasible to attach strain gauges directly to the weld bead surface. Although the surface could be ground and polished to facilitate gauge attachment, such treatment might alter the original residual stress state. Therefore, residual stress measurements on the weld surface were not conducted in this study.

3. Thermal Elastic Plastic Finite Element Method and Simulation Cases

When the thermal elastic plastic finite element method is employed to simulate welding residual stress, the accuracy of the simulation results is primarily influenced by three key factors: (1) the accuracy of the constitutive equations, (2) the precision of the temperature-dependent material properties, and (3) the extent to which critical details of the welding process—such as boundary conditions—are considered. Theoretically, the use of three-dimensional (3D) full-scale models combined with a moving heat source model can yield more accurate predictions of temperature field, residual stress distribution, and welding-induced deformation. However, for large-scale welded structures or multi-pass welded joints, this approach typically demands extensive computational resources, including prolonged computing time and substantial storage capacity. Consequently, it imposes high requirements on computer hardware. In practical engineering applications involving multi-pass welds, the computational cost becomes even more significant. To address this challenge, simplifying a three-dimensional problem into a two-dimensional (2D) model—through model simplification or dimensional reduction—can significantly reduce computational time and memory usage. This study aims to evaluate the feasibility of applying dimensionally reduced model in predicting welding residual stress in the beam of high-speed railway bogies. Initially, a flat plate butt joint model was selected as the research object, and both a 3D model with a moving heat source and a 2D generalized plane strain model were employed to simulate welding residual stresses. The simulation results from both models were compared with experimental data to validate the accuracy and feasibility of the 2D model. Subsequently, a 2D axisymmetric model was utilized to simulate the residual stress distribution in the beam, and the influence of weld bead sequence on residual stress distribution was analyzed based on the numerical results.

3.1. Simulation of Welding Temperature Field

During the GMAW process, the welding wire is melted by the welding arc and subsequently transferred into the weld pool. Simultaneously, the surface of the base metal is heated by the arc. In the numerical simulation of the welding process, the aforementioned heat contributions—collectively referred to as welding heat input—can be modeled as an internal heat source within the welded structure. The transient heat conduction within the workpiece is governed by the Fourier equation, as expressed in Equation (1). Convective and radiative heat exchanges between the workpiece and the surrounding environment are described by Newton’s law of convection (Equation (2)) and the Stefan–Boltzmann law (Equation (3)), respectively [12].
ρ T c T T t = λ x T 2 T x 2 + λ y T 2 T y 2 + λ z T 2 T z 2 + Q s
q c = h c T s T 0
q r = ε σ T s + 273 4 T 0 + 273 4
where ρ denotes the material density; c represents the specific heat capacity; λ is the thermal conductivity; and Q s indicates the heat generation rate of the internal heat source. q c refers to convective heat loss, where h c is the convective heat transfer coefficient; T s is the ambient temperature, and T 0 is the initial temperature of the workpiece. q r represents radiative heat loss, with ε being the emissivity coefficient and σ the Stefan–Boltzmann constant.
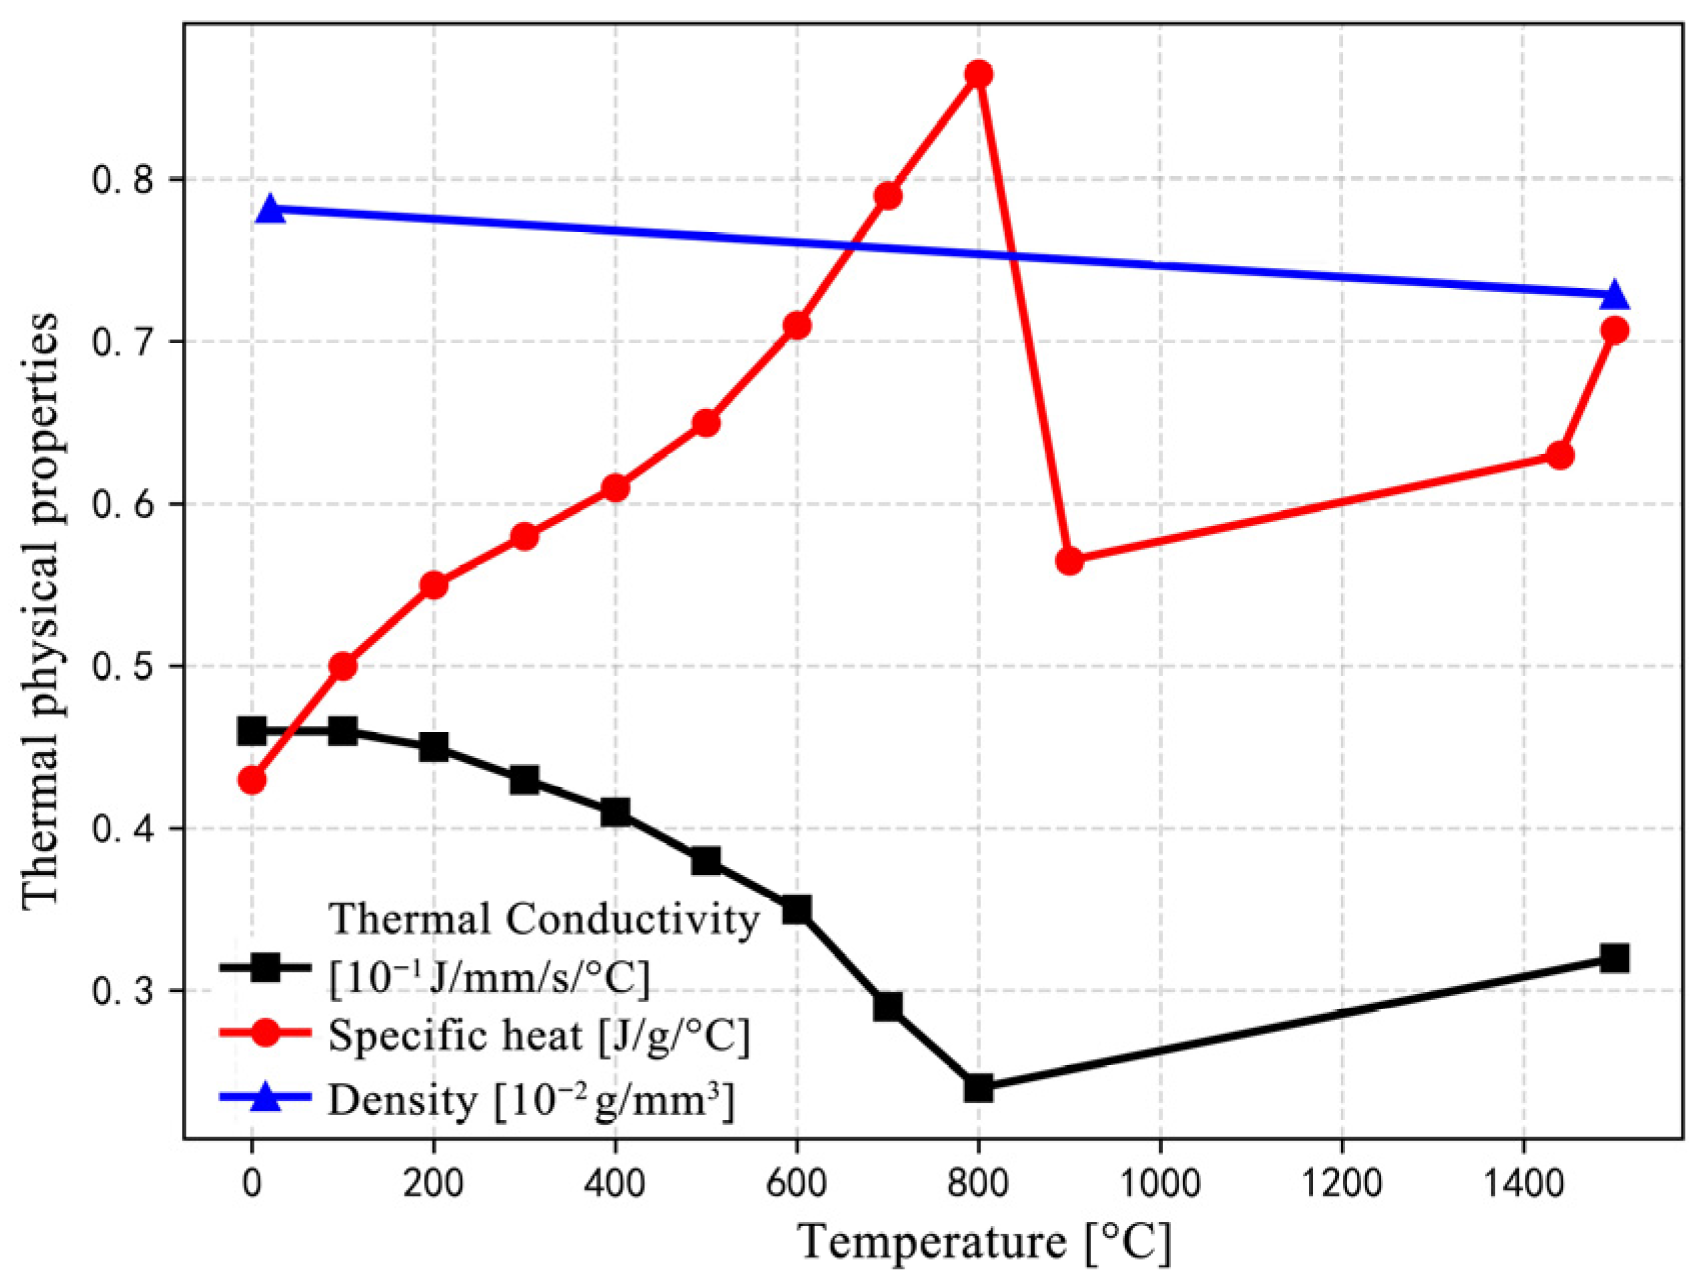
The thermal properties of base metal, including thermal conductivity, density, and specific heat capacity, which vary with temperature, were calculated using JMat Pro 7.0 software based on the material’s chemical composition, as illustrated in Figure 3. Given the negligible difference in chemical composition between the base metal and the filler material, both the weld metal and the base material are treated as the same material type in the simulation of the welding temperature field.
As previously stated, this study utilized two modeling approaches—a 3D full model and a 2D plane strain model—to simulate the residual stress distribution in a flat plate butt joint. Within the 3D model, the double ellipsoidal Gaussian heat source model proposed by Goldak [13] was employed to represent the welding heat input. This heat source model comprises separate heat flux density distribution functions for the front and rear portions of the weld pool, as defined by Equations (4) and (5), respectively.
q 1 ( x , y , z , t ) = 6 3 f f U w I w η a r c a f b c π π e x p 3 ( x v t x 0 ) 2 a f 2 + y y 0 2 b 2 + z z 0 2 c 2
q 2 ( x , y , z , t ) = 6 3 f r U w I w η α r c a r b c π π e x p 3 ( x v t x 0 ) 2 a r 2 + y y 0 2 b 2 + z z 0 2 c 2
where q 1 and q 2 denote the heat flux densities of the front and rear portions, respectively. The coordinates x′, y′, and z′ represent the global coordinate system, while x 0   y 0 and z 0 indicate the initial position of the heat source in the x, y, and z directions, respectively. The distribution coefficients f f and f r are assigned values of 0.67 and 1.33, respectively. The variable v denotes the welding speed, and t represents the welding start time. Additionally, U w and I w correspond to the arc voltage and welding current, respectively. The parameters a f , a r , b and c are the shape parameters of the heat source model [14]. The appropriate moving heat source model is selected by adjusting the shape parameters, guided by two evaluation criteria: (1) close agreement between the numerically simulated molten pool morphology and experimental observations, and (2) a peak molten pool temperature within the range of 1700–2000 °C.
For the 2D plane strain model, the heat source is treated as an instantaneous heat input, implying that the entire welding line is heated simultaneously. This model incorporates two primary parameters, namely, the heat flux density per unit volume and per unit time ( q v ) and the assumed heating duration ( t h ). Without considering solid-state phase transformations, residual stress is primarily influenced by peak temperature, the number of thermal cycles, and both internal and external constraint conditions [8]. Therefore, calibration of the 2D heat source model parameters is focused on achieving an appropriate peak molten pool temperature. In this procedure, while maintaining consistency with the total heat input per weld pass as used in the experimental setup, a realistic weld bead temperature distribution is obtained through iterative trial simulations of parameter adjustments, ensuring accurate prediction of residual stress. Typically, the heating time is approximated to be equivalent to the lifespan of the molten pool, which spans several seconds. In this study, a heating time of 4 s was adopted. The heat flux density in the 2D model is calculated using Equation (6) [10].
q v = η U I L / v t h V
where η represents the arc efficiency coefficient (assumed to be 0.8), L denotes the total length of the welding line, v is the welding speed, and V refers to the total volume of the weld metal.

3.2. Analysis of Welding Stress Field

This study employed the sequential coupling method to simulate welding residual stress. Specifically, the welding temperature field was first calculated to obtain the temperature history of each node in the finite element model. Subsequently, these temperature histories were applied as thermal loads in a separate stress analysis model to compute nodal displacements, from which element strains and stresses were derived. During the welding of low-alloy high-strength steel, the strain components include thermal strain, elastic strain, plastic strain, phase transformation strain, and creep strain, depending on the material’s temperature history. For SMA490BW steel, although austenitization occurs during welding, the transformation takes place at high temperatures where the material’s yield strength and Young’s modulus are relatively low. Consequently, while the phase transformation may influence non-elastic strain, its effect on transient stress and final residual stress is negligible. On the other hand, during the cooling process, solid-state phase transformations—specifically bainite formation at intermediate temperature and martensite formation at lower temperature—can significantly influence the development and final distribution of residual stresses in the weld and heat-affected zone (HAZ) [15]. However, when the transformation products are predominantly ferrite and pearlite, such transformations may affect the evolution of residual stresses but have negligible impact on their final magnitude and distribution [15]. In this study, no martensite formation was observed in the weld or HAZ, and bainitic transformation in the HAZ was minimal. Consequently, the effect of solid-state phase transformations was considered insignificant and thus neglected in the analysis. Additionally, the short duration of high-temperature exposure during welding renders the creep effect insignificant [16]. Therefore, the total strain in the material comprises only three components, as expressed in Equation (7):
ε total = ε elastic + ε plastic + ε thermal
where ε t o t a l , ε e l a s t i c , ε p l a s t i c   a n d   ε t h e r m a l denote the total, elastic, plastic, and thermal strains, respectively.
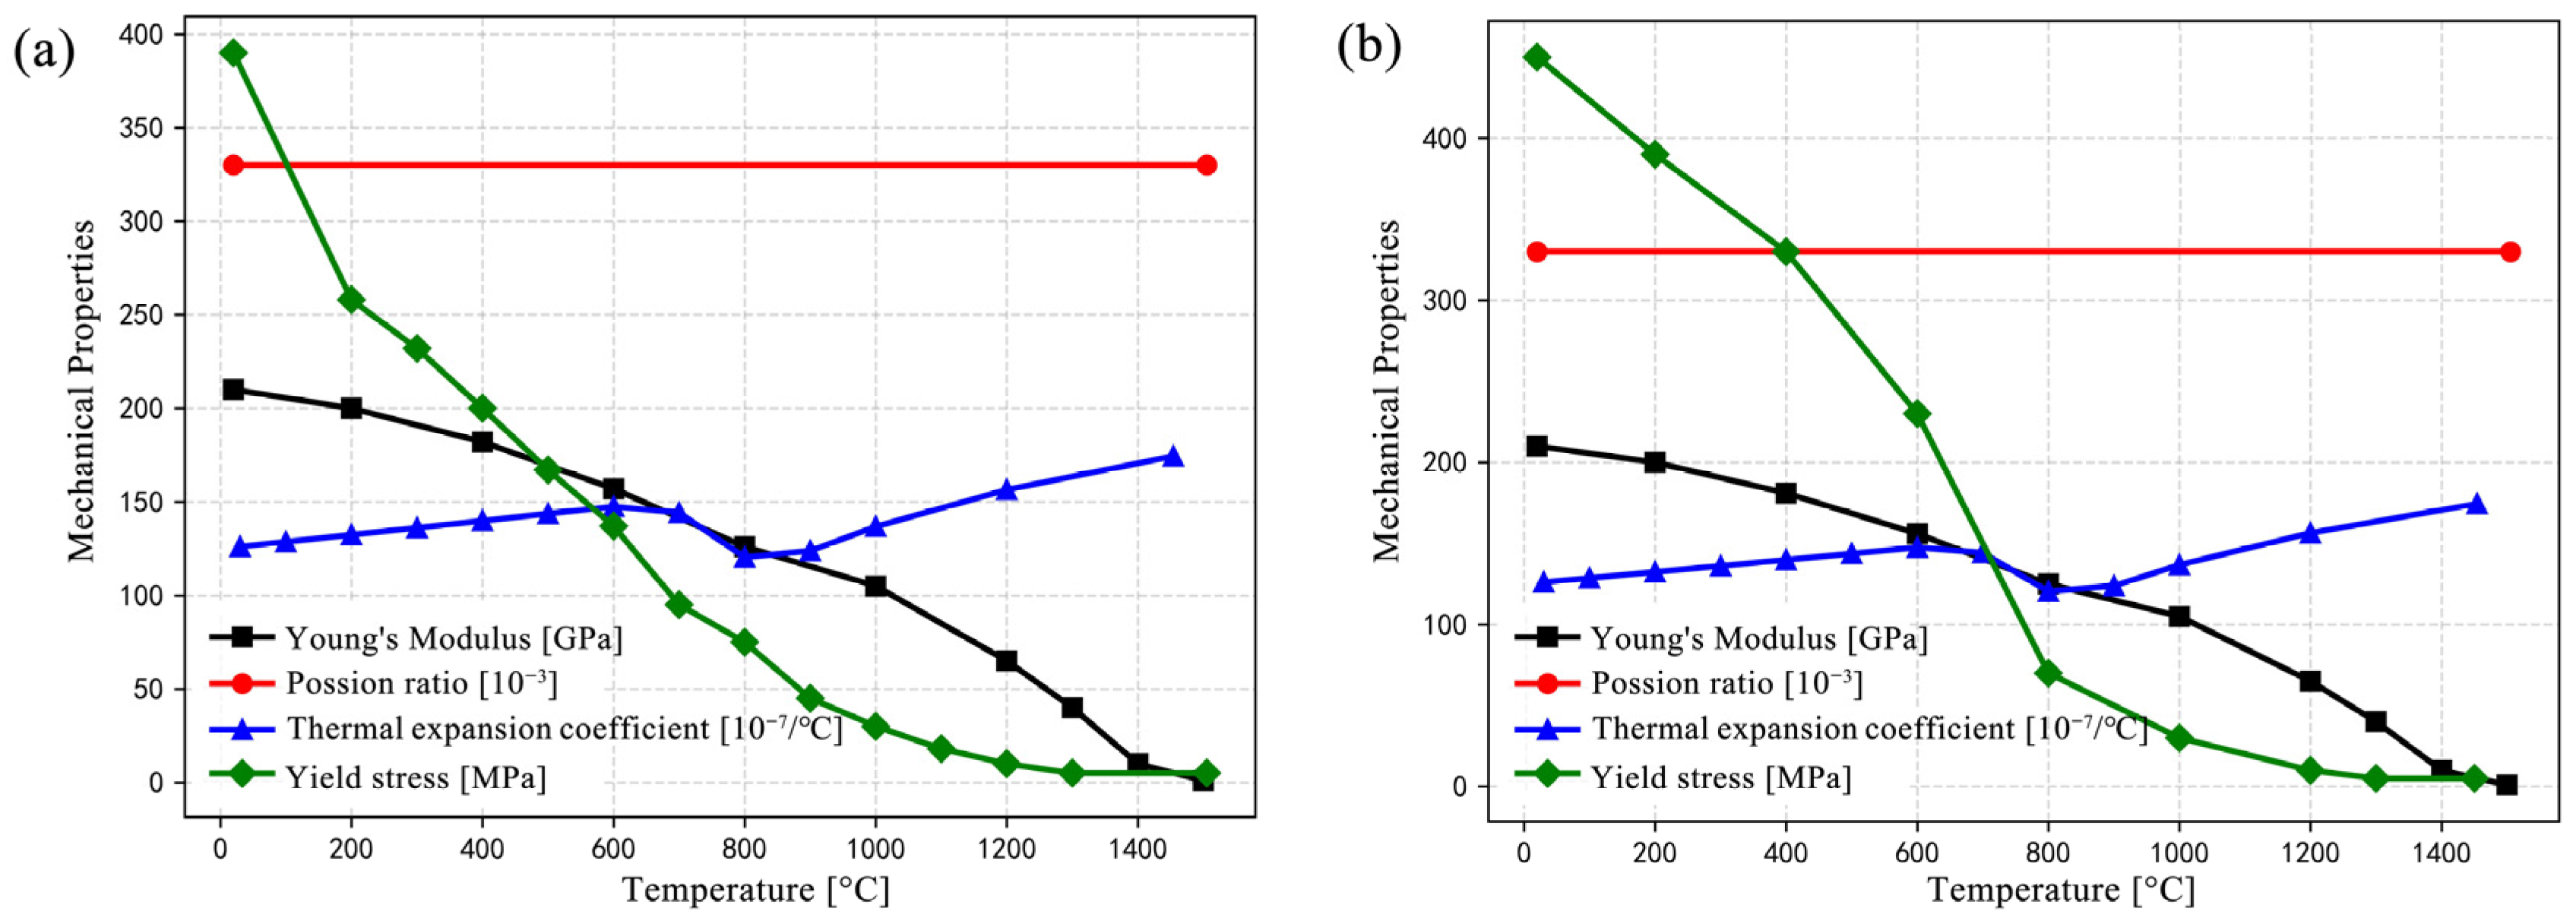
In the numerical simulation, elastic strain is calculated based on isotropic Hooke’s law, while plastic deformation follows the Von-Mises yield criterion. The temperature-dependent mechanical properties of the materials are incorporated into the stress calculations, as illustrated in Figure 4. The yield strength of the base metal and weld metal from room temperature to 800 °C was determined experimentally. Test pieces of the base metal were extracted from SMA490 steel plates, while Test pieces of the weld metal were obtained from deposited metal prepared in accordance with ISO 16834 [17]. Sampling locations and specimen dimensions strictly adhered to ISO 5178 [18] (for testing at room temperature) and ISO 6892-2 [19] (for testing at elevated temperature), respectively, and the test procedures were conducted in compliance with these standards. The test temperatures are indicated in Figure 4. At each temperature level, two test pieces were tested, and the presented results represent the average of the two measurements, whereas the yield strength at temperatures above 800 °C, Young’s modulus, Poisson’s ratio, and thermal expansion coefficient were obtained using JMat Pro software [20].

3.3. Finite Element Models and Simulation Cases

As previously mentioned, this study utilized both 3D model and 2D general plane strain model to simulate the residual stress in the butt-welded joint. This approach was undertaken to verify the feasibility of employing the 2D model, with the objective of applying it to predict welding residual stress in high-speed railway bogie beams. Accordingly, two simulation cases were established. Case 1 incorporates a 3D finite element model coupled with a moving heat source model, while Case 2 employs a 2D plane strain model in conjunction with a simplified heat source model, as listed in Table 3.
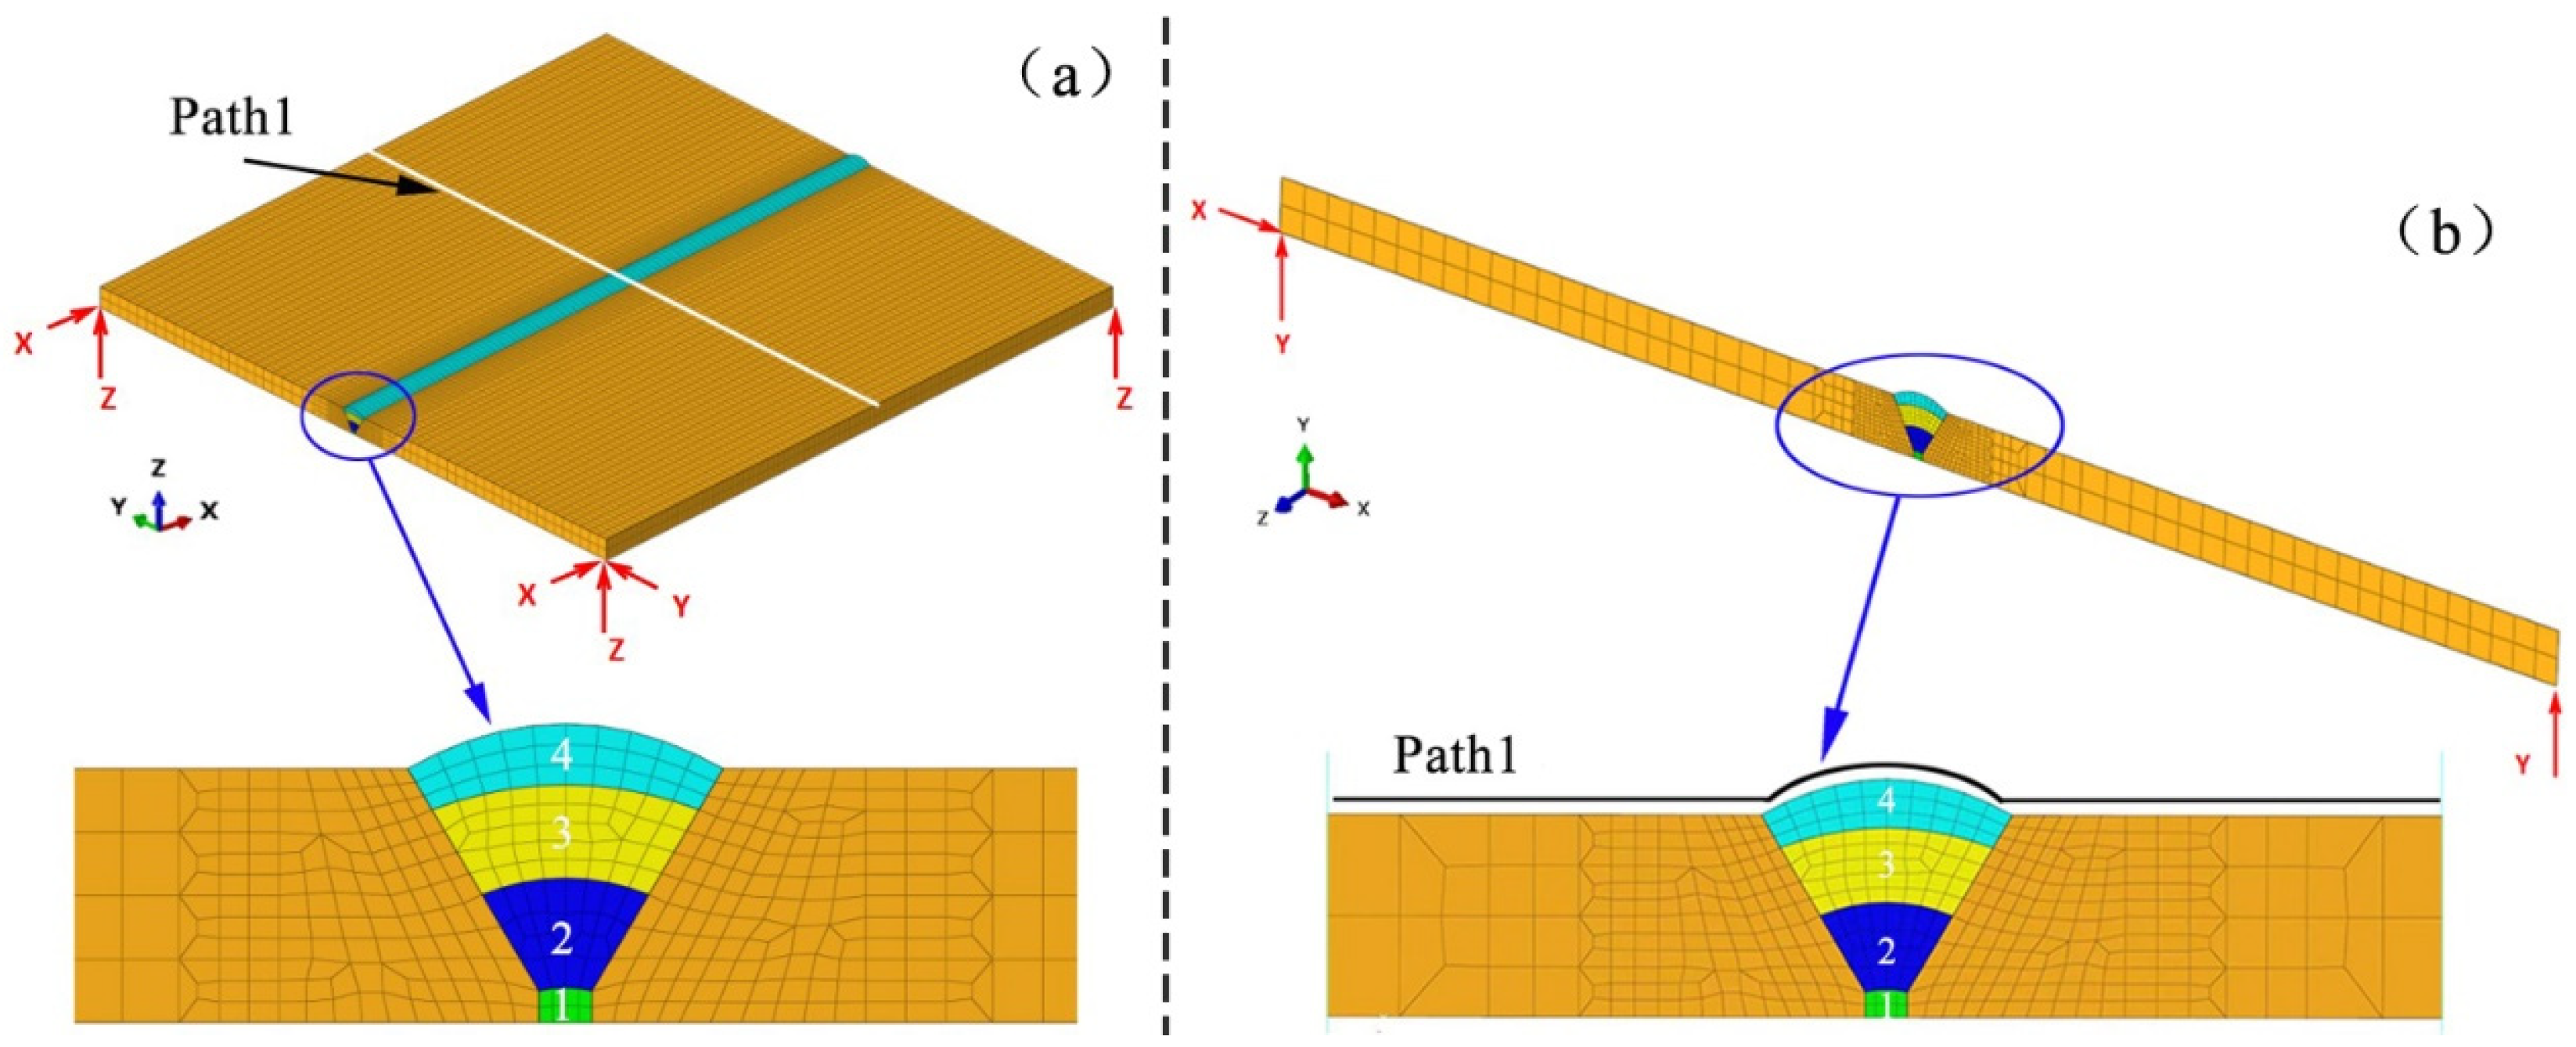
The dimensions, geometrical configuration, and weld bead arrangement in the 3D fi-nite element model are fully consistent with actual physical conditions. Within the finite element mesh, finer mesh density is employed in the weld zone and its adjacent regions (element size ≤ 1 mm), whereas coarser meshing is applied in areas farther from the fu-sion zone (maximum element size ≈ 4 mm). This meshing strategy aims to achieve an op-timal balance between computational efficiency and numerical accuracy. Specifically, the 3D finite element model (CASE 1) consists of a total of 49,800 elements and 58,883 nodes, as shown in Figure 5a. Thermal analysis is conducted using DC3D8 elements, while mechanical analysis employs C3D8R elements. Both are eight-node hexahedral elements with full integration, utilizing 8 Gauss integration points and trilinear shape functions. To accurately capture the morphology of the molten pool, heat source model parameters for each weld bead were calibrated through a series of preliminary simulations, with the final parameter values summarized in Table 4.
In contrast, the 2D finite element model comprises 498 elements and 584 nodes, with the corresponding mesh configuration illustrated in Figure 5b. The model is established under the plane strain assumption. Thermal and mechanical analyses are performed using DC2D4 and CPE4 elements, respectively—both four-node quadrilateral elements with full integration, 4 Gauss integration points, and bilinear shape functions.
Given that no external constraints are applied during the actual welding process, only minimal boundary constraints are introduced in the simulation to prevent rigid body motion. Specifically, three nodes (six degrees of freedom in total) are constrained in the 3D model, while two nodes (three degrees of freedom in total) are constrained in the 2D model.
The solution procedure adopts the full Newton–Raphson method for nonlinear iteration. An initial time step of 0.01 s is implemented, combined with an adaptive time-stepping algorithm to improve computational efficiency. Convergence is assessed using a dual tolerance criterion based on displacement and stress increments.
For the convenience of subsequent discussion, the middle cross-section and Path 1 on the top surface of the middle cross-section are defined in Figure 5.

3.4. Comparative Evaluation of Simulation Results and Measured Data for the Butt-Welded Joint

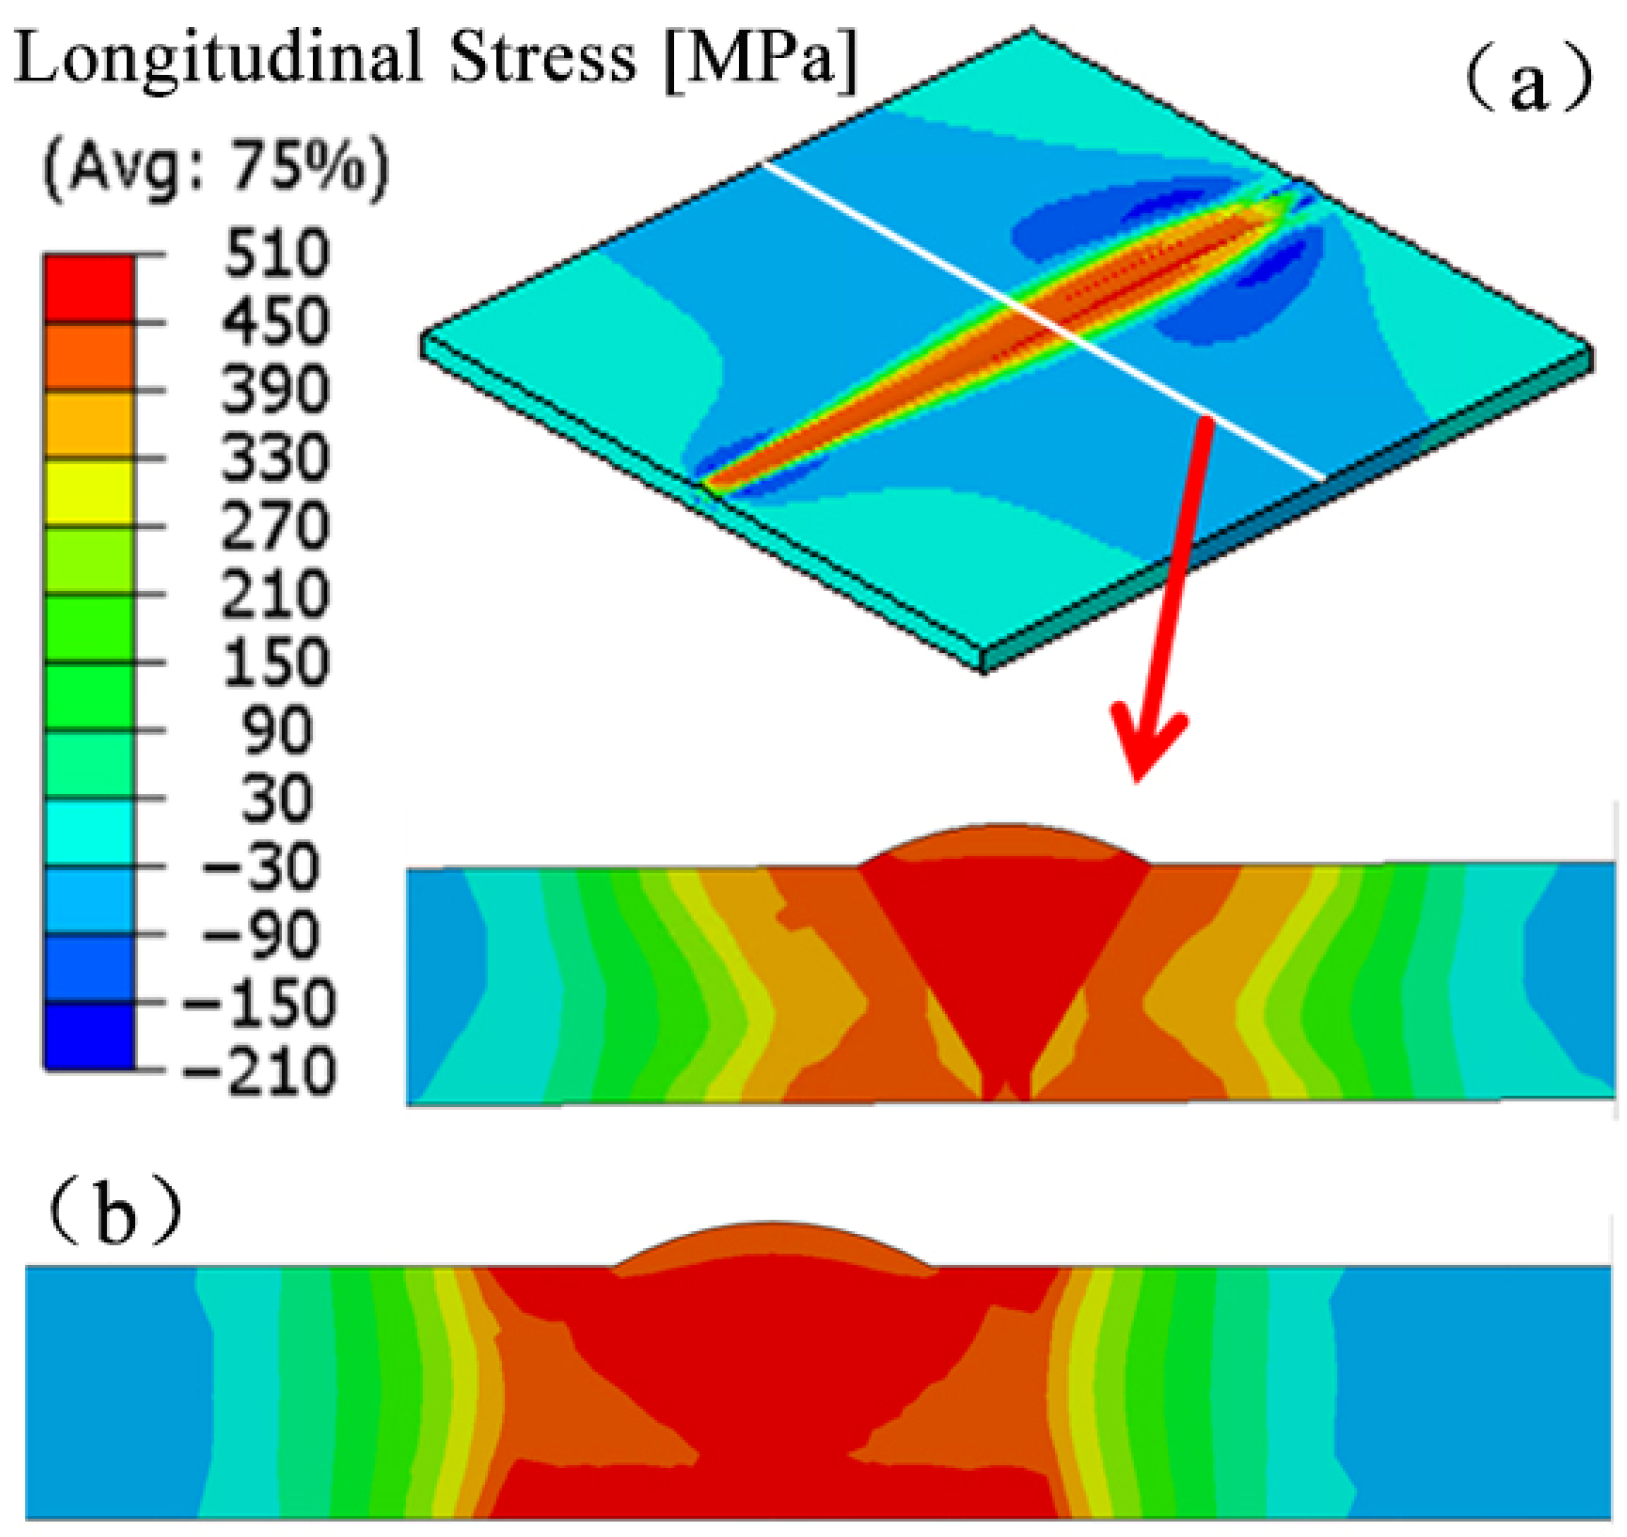
Figure 6 presents the contours of longitudinal residual stress distribution calculated using both 3D and 2D models. Due to the influence of the moving heat source and the geometric end effect, the magnitude and distribution of longitudinal residual stress near the ends of the welded joint, as obtained by the 3D model, are significantly different from those in the central region. Additionally, the longitudinal stress along the welding direction exhibits a certain degree of fluctuation. However, in the central portion of the joint, the variation in longitudinal residual stress is relatively minor, and its distribution appears more uniform. The longitudinal stress distribution in the central cross-section indicates that high tensile residual stress is primarily concentrated near the weld seam and the heat-affected zone, with peak values slightly exceeding the material’s yield strength at room temperature. A comparison between the longitudinal residual stress distribution on the middle cross-section of the 3D model and that obtained from the 2D model reveals certain differences in distribution patterns. Nevertheless, the overall and localized distribution characteristics of high tensile stress are largely consistent between the two models.
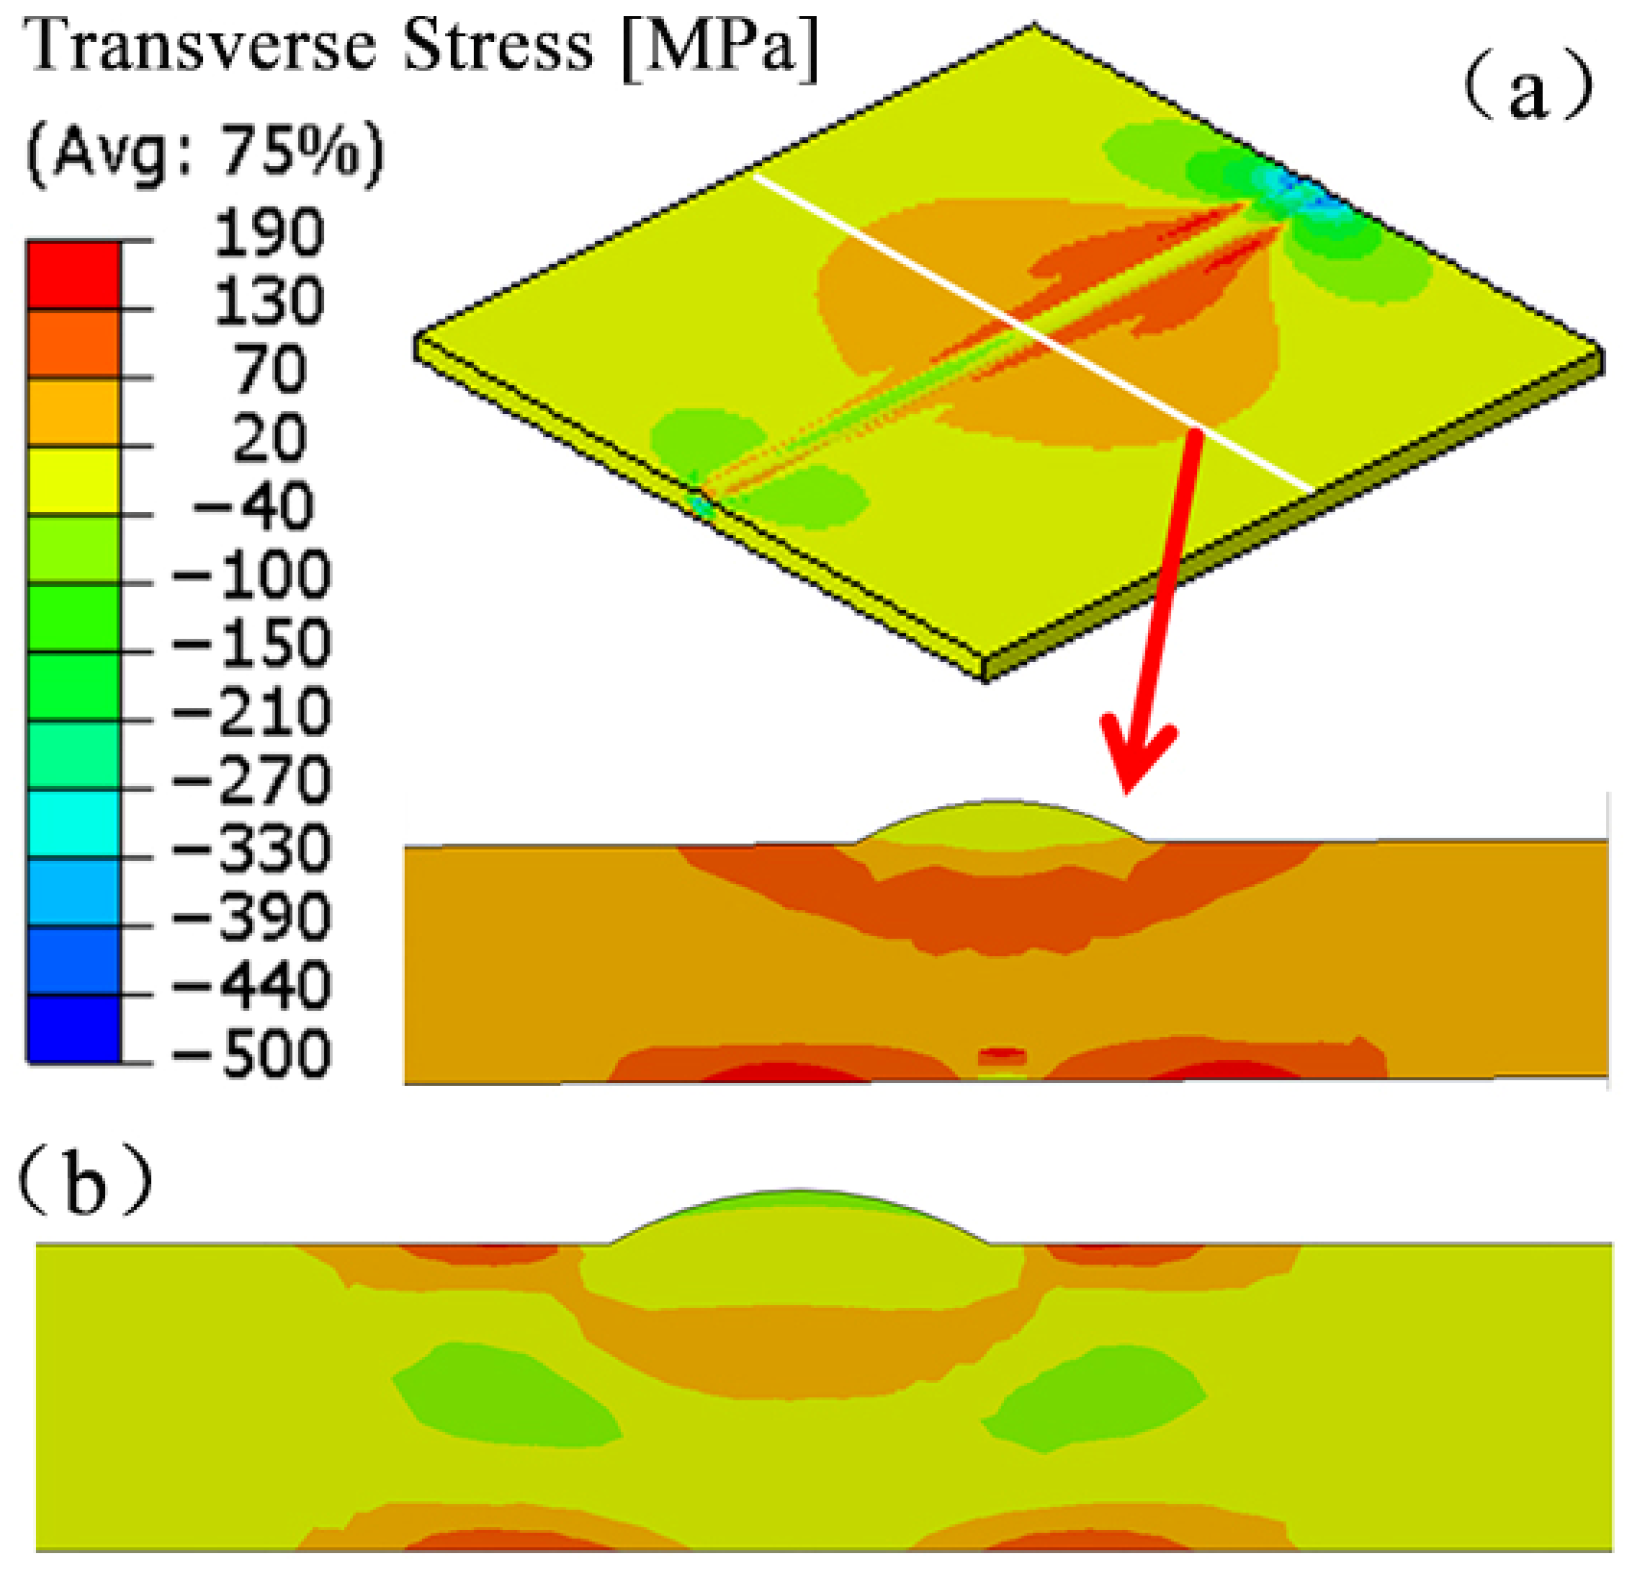
Figure 7 illustrates the contours of transverse residual stress distribution computed using the 3D and 2D models. Compared to the longitudinal residual stress, the discrepancy between the transverse residual stress distributions obtained from the 2D model and the middle cross-section of the 3D model is more pronounced. However, the general trends of transverse stress distribution remain broadly consistent between the two models.
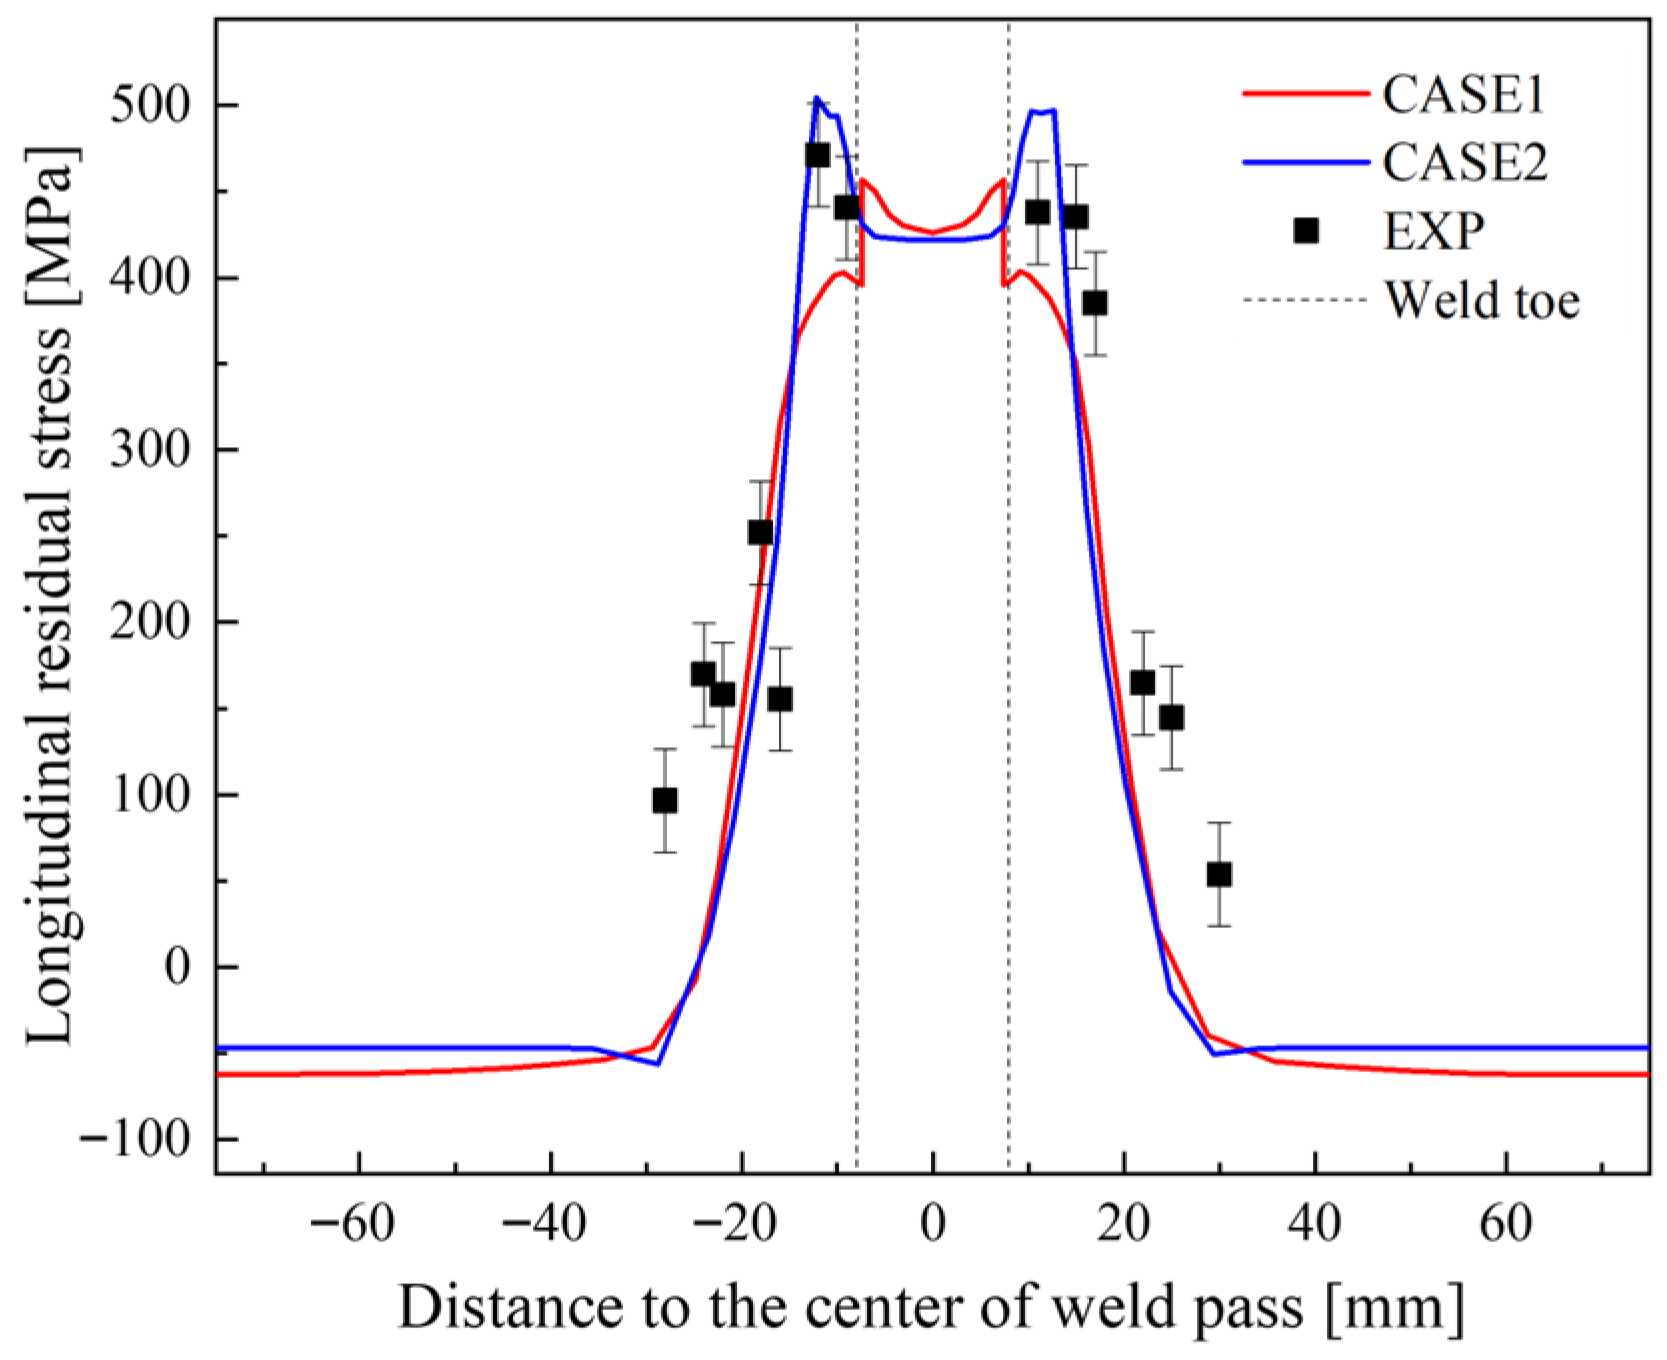
Figure 8 and Figure 9 provide comparative analyses of the longitudinal and transverse residual stress distributions along Path 1, respectively. As shown in Figure 8, the peak value of longitudinal residual stress along Path 1 computed by the 3D model is slightly lower than that obtained using the 2D model. In the weld zone and adjacent areas, minor differences in distribution patterns between the two models can be observed. Overall, both the 3D and 2D models demonstrate good agreement with the experimental data. This suggests that the use of a 2D model for calculating longitudinal residual stress in butt joints is feasible.
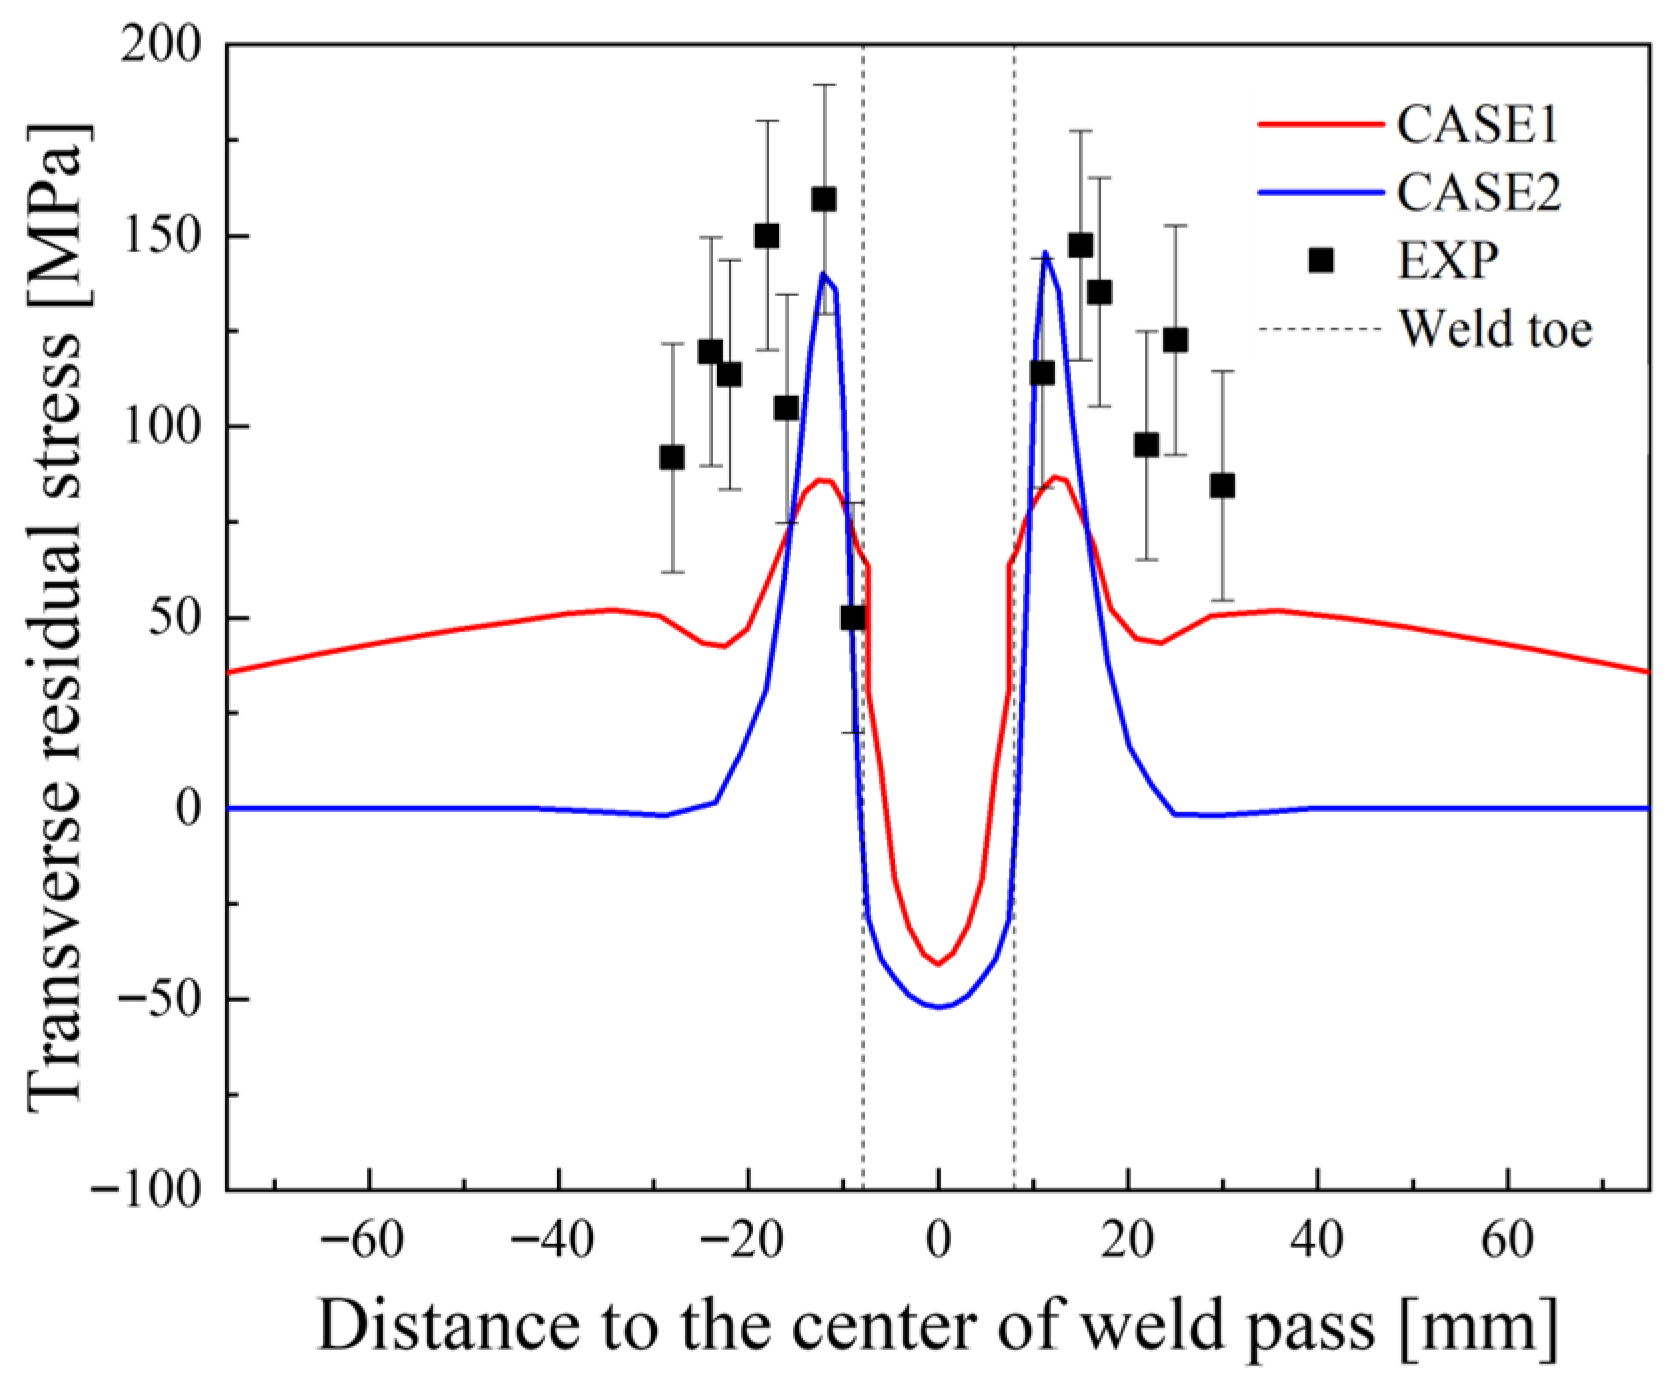
As illustrated in Figure 9, the peak transverse residual stress along Path 1 calculated by the 3D model is significantly lower than that obtained from the 2D model. Despite this discrepancy, the overall distribution patterns of transverse residual stress remain consistent between the two models. When compared with experimental results, both the 3D and 2D models underestimate the peak transverse residual stress along Path 1. However, the 2D model yields results that are closer to the experimental values. This further indicates that employing a 2D model for the calculation of transverse residual stress in a butt-welded joint is also a viable approach.
In addition to evaluating the computational accuracy of the 2D plane strain model, it is also essential to consider computational efficiency, which plays a crucial role in addressing practical engineering challenges. Table 5 compares the computational accuracy and computing time of 3D and 2D models. Computational accuracy is determined by the degree of alignment with experimental measurements, while computing time refers to the CPU processing duration under consistent hardware and computing environment, excluding the time required for mesh generation and the configuration of simulation settings. As indicated in Table 5, the application of 2D models can lead to a reduction of nearly 98% in computing time, offering substantial benefits for engineering applications.

4. Numerical Simulation of Residual Stress Distribution in the Bogie Beam

The comparison between numerical simulation results and experimental data for the butt-welded joint primarily validates the constitutive model and heat source model employed in this study. Specifically, the close agreement between the 3D moving heat source simulation results and experimental measurements indicates that the constitutive model ensures sufficient computational accuracy. Furthermore, the comparison between predictions from the 2D plane strain model and experimental results confirms that this model achieves satisfactory accuracy while significantly improving computational efficiency.
Given that the butt-welded joint in the beam shares the same base material, welding process, and comparable heat input levels as that in the flat-plate joint, the previously validated constitutive model and a similar 2D modeling approach are applied to simulate welding residual stresses in the beam structure. Considering the rotational symmetry of the beam geometry, this section focuses on the calculation of welding residual stresses in the bogie beam using a 2D axisymmetric model.

4.1. Welding Procedure of the Bogie Beam

The bogie beam is composed of two primary structural components, namely, the beam tube and the connecting seat, which are joined by welding. The beam structure and its welded joint are depicted in Figure 10. The beam has a total length of approximately 1,500 mm, an outer diameter of 210 mm, and a wall thickness of 35 mm. The thickness of the welded region is 20 mm. The configuration of the butt joint, including the groove geometry and arrangement of weld beads, is detailed in Figure 11.
The internal groove is of the V-type, with a bevel angle of 90°. The root face of the inner groove is positioned approximately 5 mm from the inner surface, and the root face thickness is 1 ± 0.5 mm on each side. The external groove is U-shaped, with a bevel angle of 24°, and the weld is completed in four passes. All weld beads are applied using the GMAW process, employing a shielding gas mixture consisting of 80% Ar + 20% CO2.
The base material used for the beam is SMA490BW weathering steel, and the welding consumable employed is a proprietary high-toughness weathering steel-specific wire electrode, ER55-G (Φ 1.2 mm). The chemical compositions of both the base metal and the weld metal are listed in Table 1. The welding parameters for each weld pass are specified in Table 6, and the inter-pass temperature is strictly controlled to remain below 150 °C, in accordance with the actual welding process parameters used for the beam.

4.2. Two-Dimensional Axisymmetric Model and Simulation Cases

Considering the beam structure and welding position of the rotating body, the actual component can be simplified into a 2D axisymmetric model for calculating welding residual stress. It is important to note that during the actual welding process, due to the movement of the welding arc, although the rotating body does not exhibit the geometric end effect observed in a flat plate model, a thermal end effect [21] occurs at the arc start/end location. When simulating welding residual stress using a 2D axisymmetric model, it is not possible to capture the stress characteristics at the arc start/end location. To address this limitation, a 3D full model combined with a moving heat source model should be employed. Based on our previous research findings [21], the axial and hoop stress distributions at the start and end locations of the weld bead in rotating structures exhibit considerable complexity and sharp gradients. However, the peak values of each stress component do not significantly exceed those observed within the steady-state region. Therefore, in this study, the residual stress distribution characteristics at the start/end position of the welded joint in the beam were temporarily disregarded.
Based on the beam structure and the welded joint positions illustrated in Figure 9, a 2D axisymmetric finite element model was established using the ABAQUS 2017 software platform, as shown in Figure 12. This model includes two welded joints on the left and right sides, with their respective groove and weld bead positions depicted in the subfigures of Figure 12. The 2D axisymmetric finite element model comprises a total of 21,044 elements and 21,515 nodes. In the thermal and mechanical analyses, the element types DCAX4 and CAX4 were used, respectively. Both are four-node quadrilateral elements that employ full integration with four integration points, and their shape functions are based on bilinear interpolation.
During the actual welding process, the inner wall and end face of the connecting seat on the left side are constrained using a fixture, while the opposite side is supported by a roller frame, as shown in Figure 10. To simulate the fixture’s constraint on the inner wall of the connecting seat, displacement in both the X and Y directions was restricted at the nodes corresponding to the arrow positions indicated in Figure 13. At the nodes representing contact with the roller frame, only displacement in the X direction was constrained. After the welding is completed, the fixture is removed, and the boundary condition is modified to one that prevents rigid-body displacement of the structure without imposing additional constraints.
Regarding the weld bead numbering for the joints on both sides of the beam (as shown in Figure 12), B denotes the inner weld bead, F denotes the outer weld bead, and L and R represent the left and right joints, respectively. To investigate the influence of different welding sequences on residual stress distribution, three distinct welding sequences were designed, as summarized in Table 7. In Case A, the two inner weld beads on the left joint are welded first, followed by the sequential welding of the four outer weld beads. The welding sequence on the right joint follows the same order as that on the left. In Case B, the two inner weld beads on the left joint are welded first, followed by the two inner weld beads on the right joint. Subsequently, the four outer weld beads on the left joint are welded, followed by the four outer weld beads on the right joint. In Case C, the sequence is reversed compared to Case A: the four outer weld beads on the left joint are welded first, followed by the two inner weld beads on the same joint. The same sequence is applied to the right joint. In summary, the primary difference between Case A and Case C lies in the reversed sequence of inner and outer weld beads within the same joint.

4.3. Results of Welding Residual Stress and Discussion

4.3.1. Hoop Residual Stress

Figure 14, Figure 15 and Figure 16 present the contours of hoop residual stress distribution calculated by Case A, Case B, and Case C, respectively. Taking Case A as an example, the residual stress distribution characteristics of the left and right welded joints are analyzed in detail. Figure 14a illustrates the overall hoop residual stress distribution for Case A, while Figure 14b,c depict the hoop residual stress distributions in the left and right joints, respectively. As shown in Figure 14b, higher tensile hoop residual stresses are generated in the fusion zone and its adjacent regions. The peak stress occurs at the central position through the plate thickness within the weld zone, with a magnitude slightly exceeding the room-temperature yield strength of the material. Notably, the hoop residual stress on the outer surface remains relatively low, and the hoop residual stress on the inner surface is also significantly below the material’s yield strength.
Figure 14c indicates that the peak hoop residual stress in the right welded joint also occurs near the center of the plate thickness. However, the overall stress distribution differs from that of the left joint. Compared to the left welded joint, the hoop stresses on both the inner and outer surfaces of the right joint are lower. This discrepancy is primarily attributed to the difference in restraint conditions during the welding process. Specifically, the left joint experiences a higher intensity of restraint, resulting in relatively higher stress level, whereas the right joint remains nearly free during welding, leading to a lower overall stress magnitude.
Figure 15 displays the hoop residual stress distribution for Case B. Compared to Case A, there is minimal difference in both the distribution pattern and magnitude of the residual stress. Although the welding sequences of Case A and Case B differ when considering the entire left and right joints as a whole, the sequence for each individual joint remains identical. The only distinction lies in the lower inter-pass temperature used in the third weld bead of Case B. Given that the inter-pass temperature is maintained below 150 °C, and the mechanical properties of the material, particularly the yield strength, do not significantly change at this temperature compared to room temperature, it is reasonable to conclude that the inter-pass temperature has a negligible effect on residual stress development when the weld bead sequence within each joint remains unchanged. This explains the observed similarity between Cases A and B.
Figure 16 illustrates the contour of hoop residual stress distribution for Case C. Differing from the welding sequences employed in Cases A and B, Case C adopts a procedure in which the outer U-shaped bevel of the butt joint is welded first, followed by the inner V-shaped bevel—effectively inverting the sequence used previously. When comparing Case C with Case A, it is evident that the former demonstrates higher levels of hoop residual stress in the regions adjacent to the inner surfaces of the left and right weld joints. Additionally, significant tensile hoop stress is present in the central region through the plate thickness and along the inner V-shaped groove. The greater constraint at the left weld joint, as compared to the right weld joint, results in a larger area with high tensile residual stress.
A comparative analysis of Figure 14 and Figure 16 highlights the substantial influence of weld bead sequence on the distribution of hoop residual stress. This sequence not only affects the overall pattern of hoop residual stress distribution but also determines the position of peak stress occurrence.
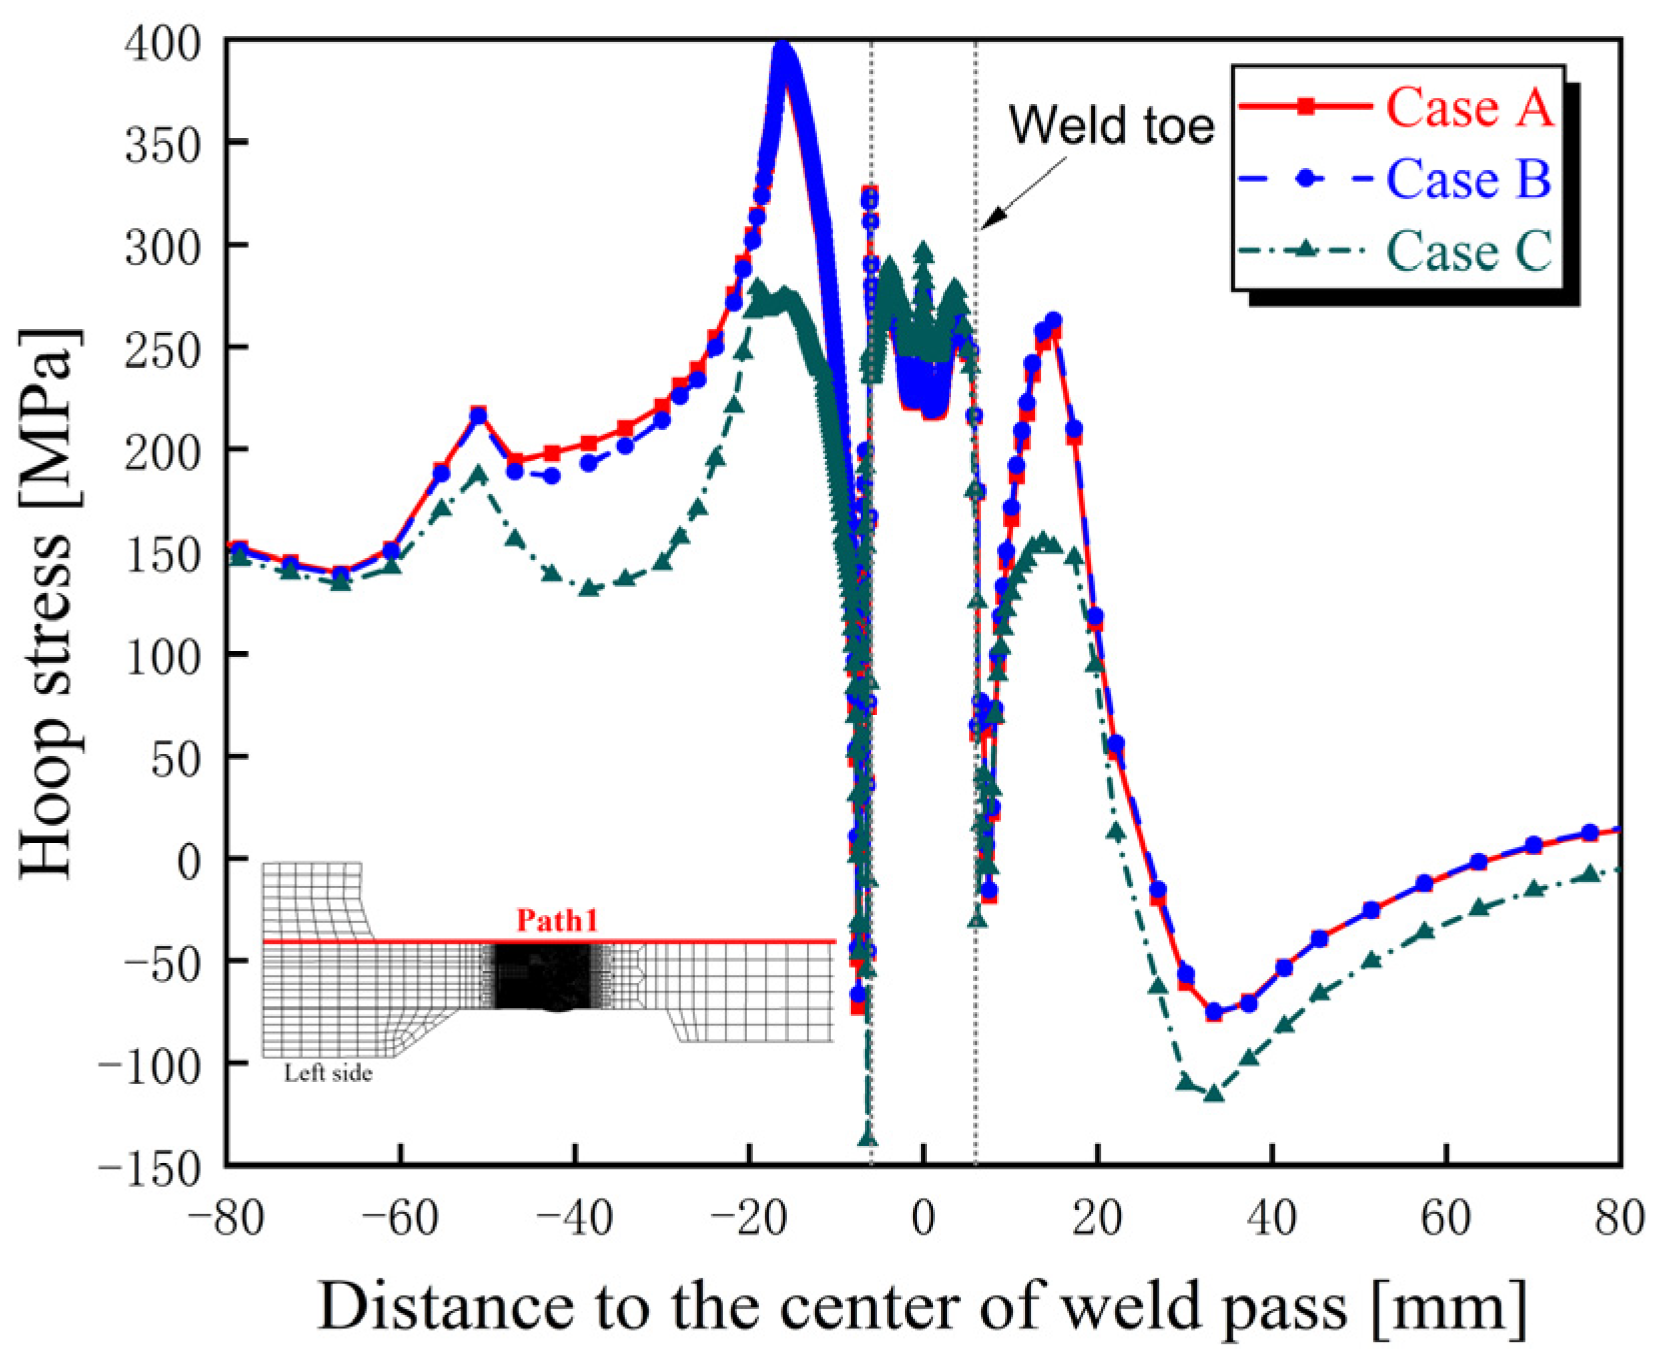
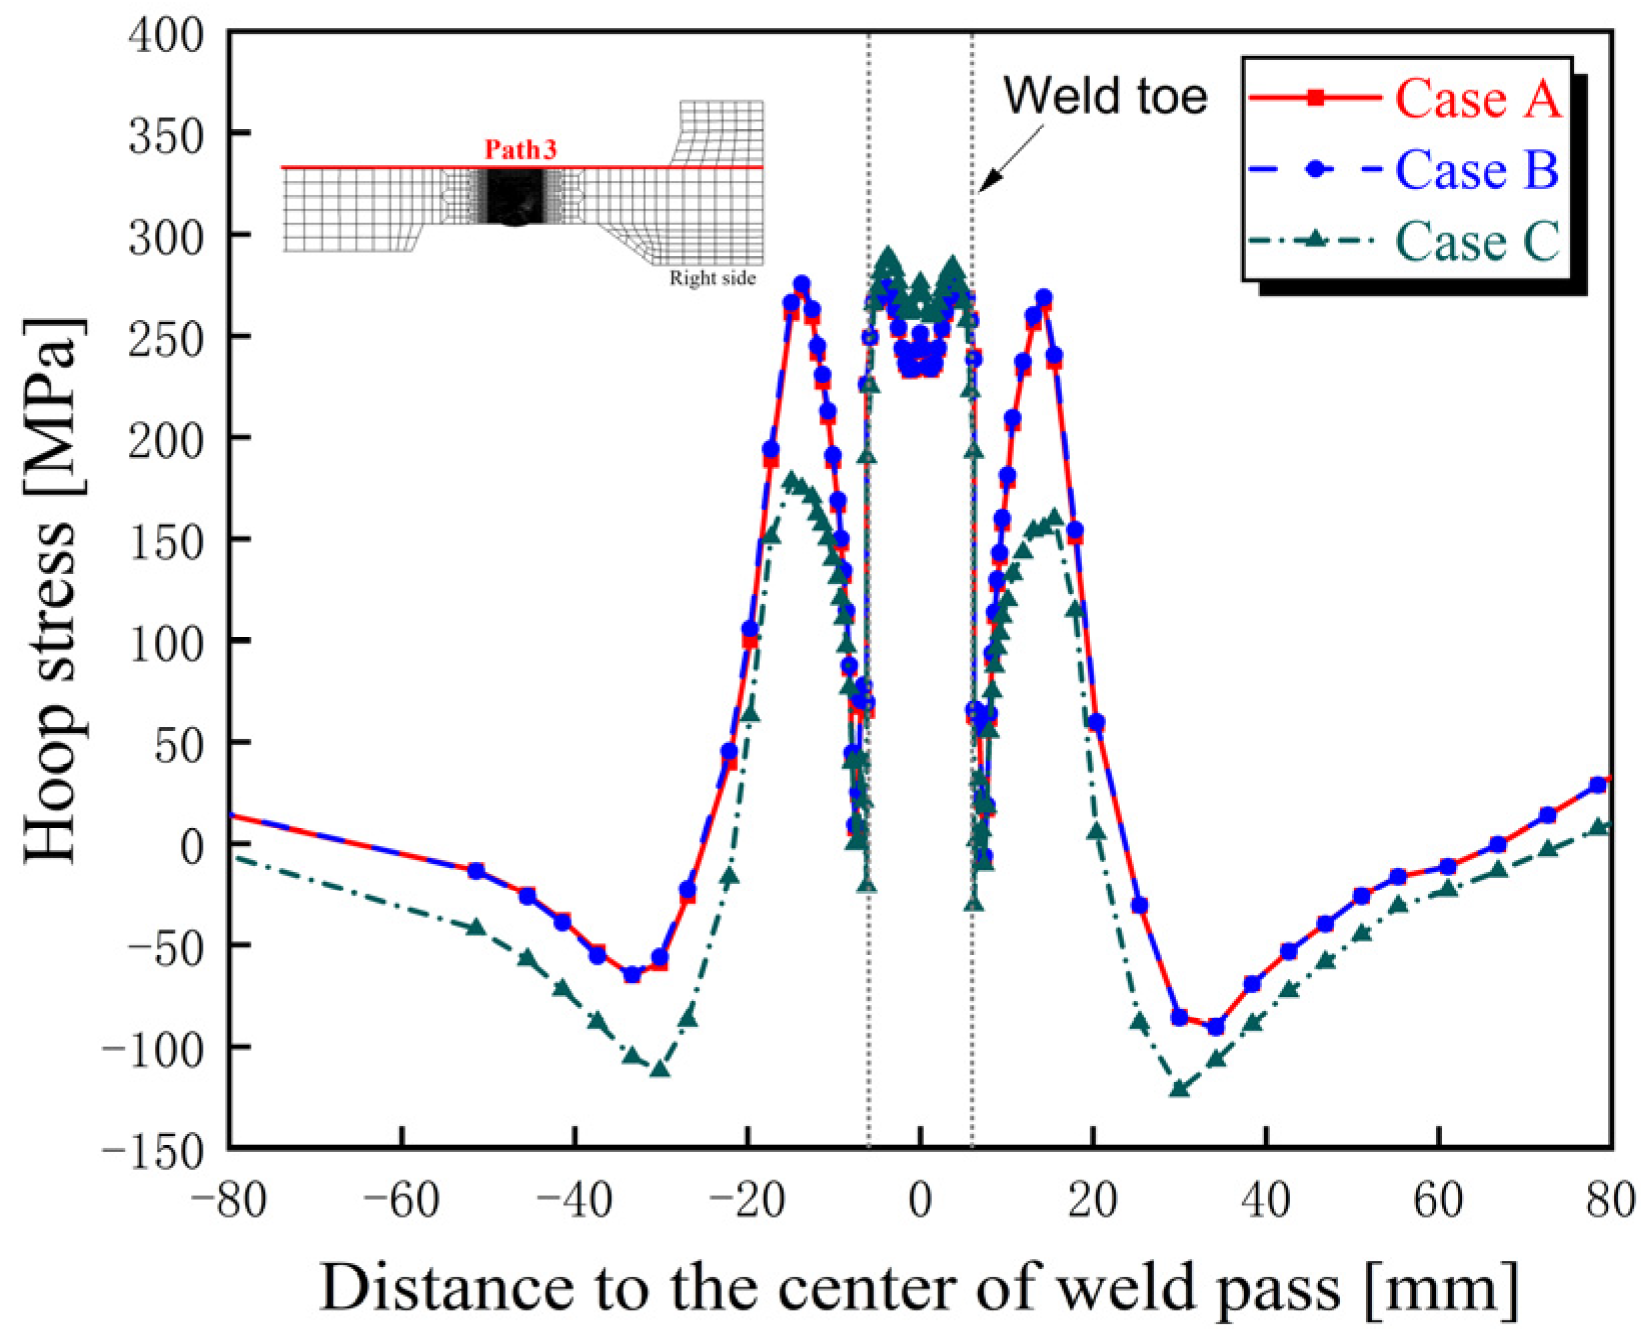
Figure 17 and Figure 18 present a quantitative comparison of the hoop residual stress distributions on the outer surfaces of the left and right joints located on the beam. As illustrated in these figures, the stress levels along Path 1 and Path 3 exhibit negligible differences between Case A and Case B. For the left joint along Path 1, the peak stress occurs approximately 10 mm from the weld toe on the outer surface, with a magnitude of 400 MPa, which is close to the yield strength of the base material. In contrast, the right joint without external constraint displays an almost symmetrical stress distribution on its outer surface, with a significantly lower peak stress compared to that of the left joint. Compared to Case A, both Path 1 and Path 3 in Case C exhibit considerably reduced levels of hoop residual stress. This observation indicates that the sequence of weld beads exerts a significant influence on the hoop residual stress distribution on the outer surface of the butt-welded joint.
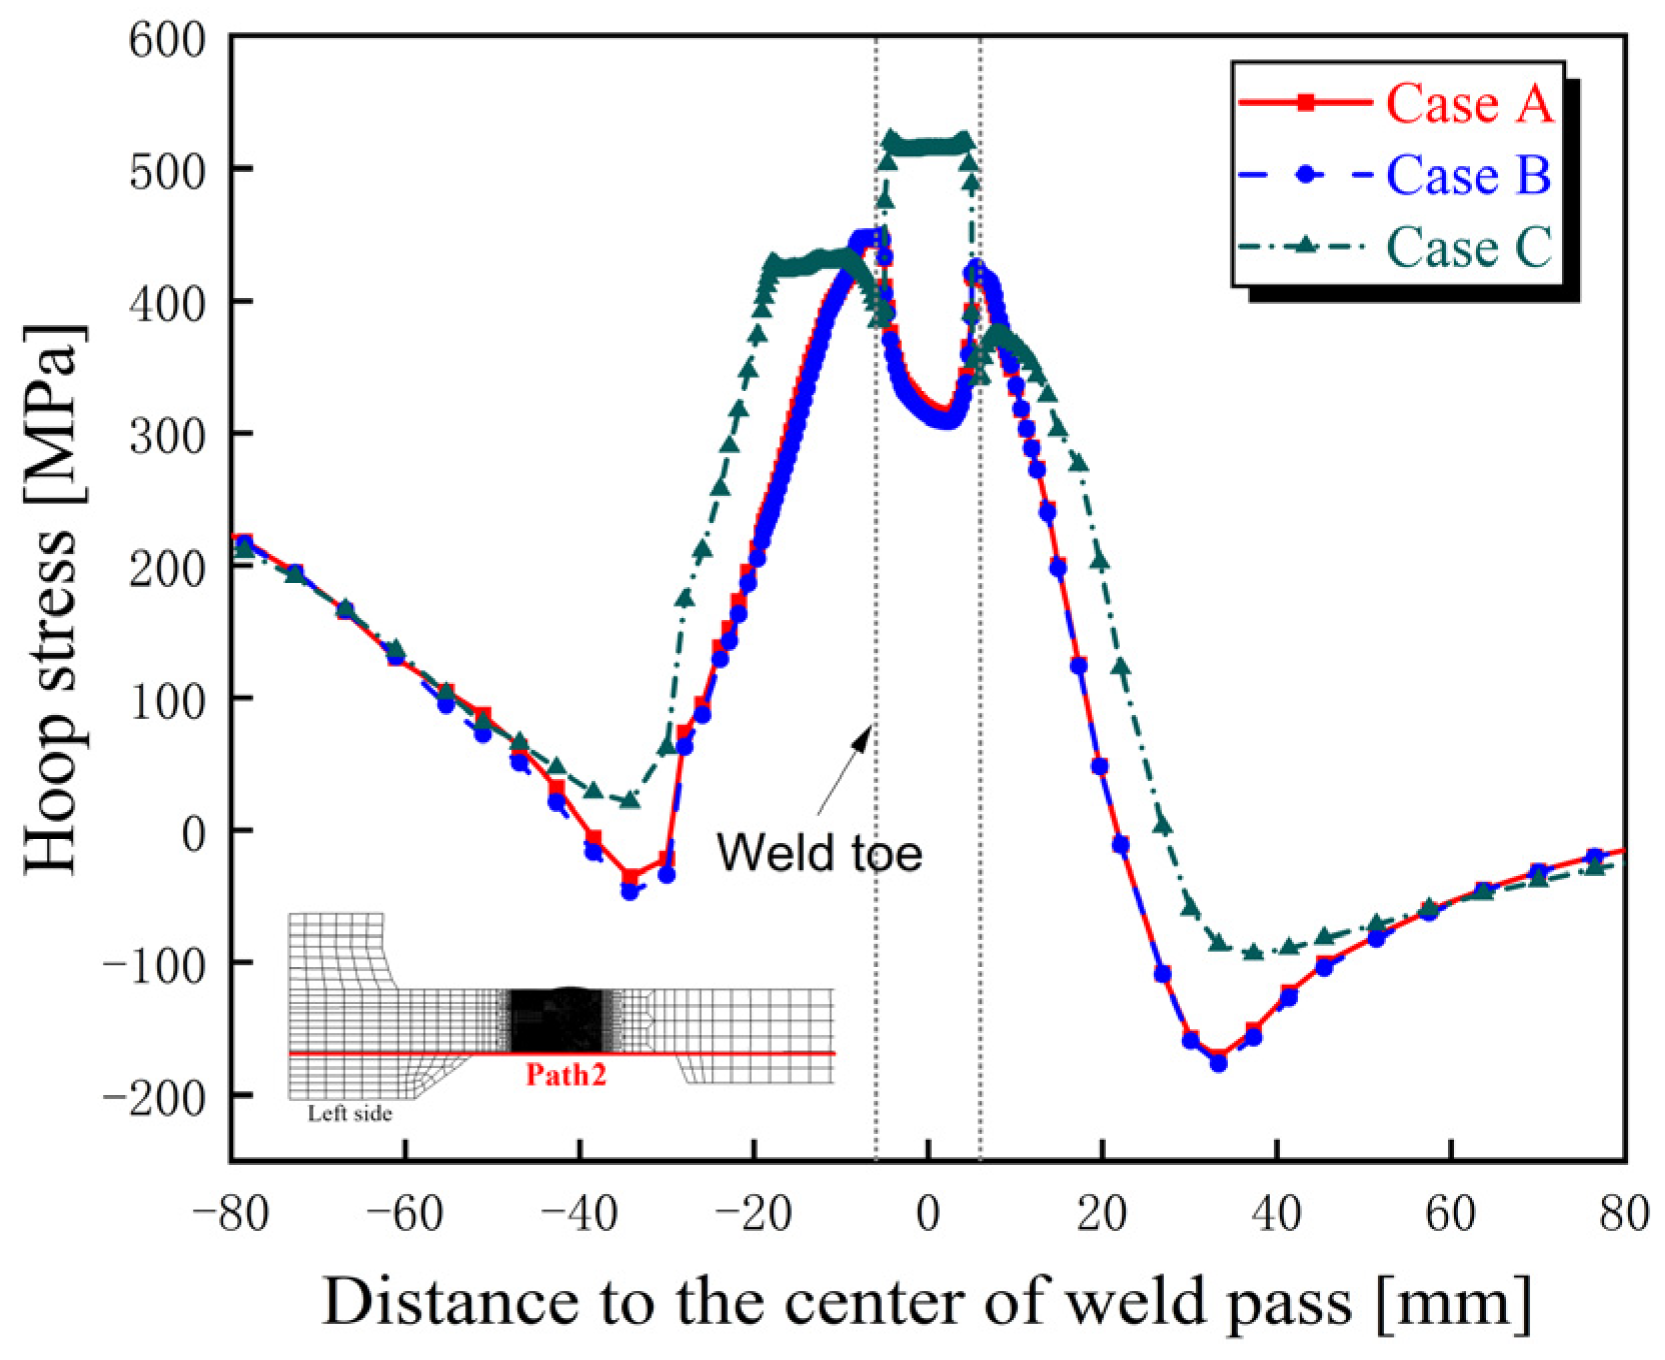
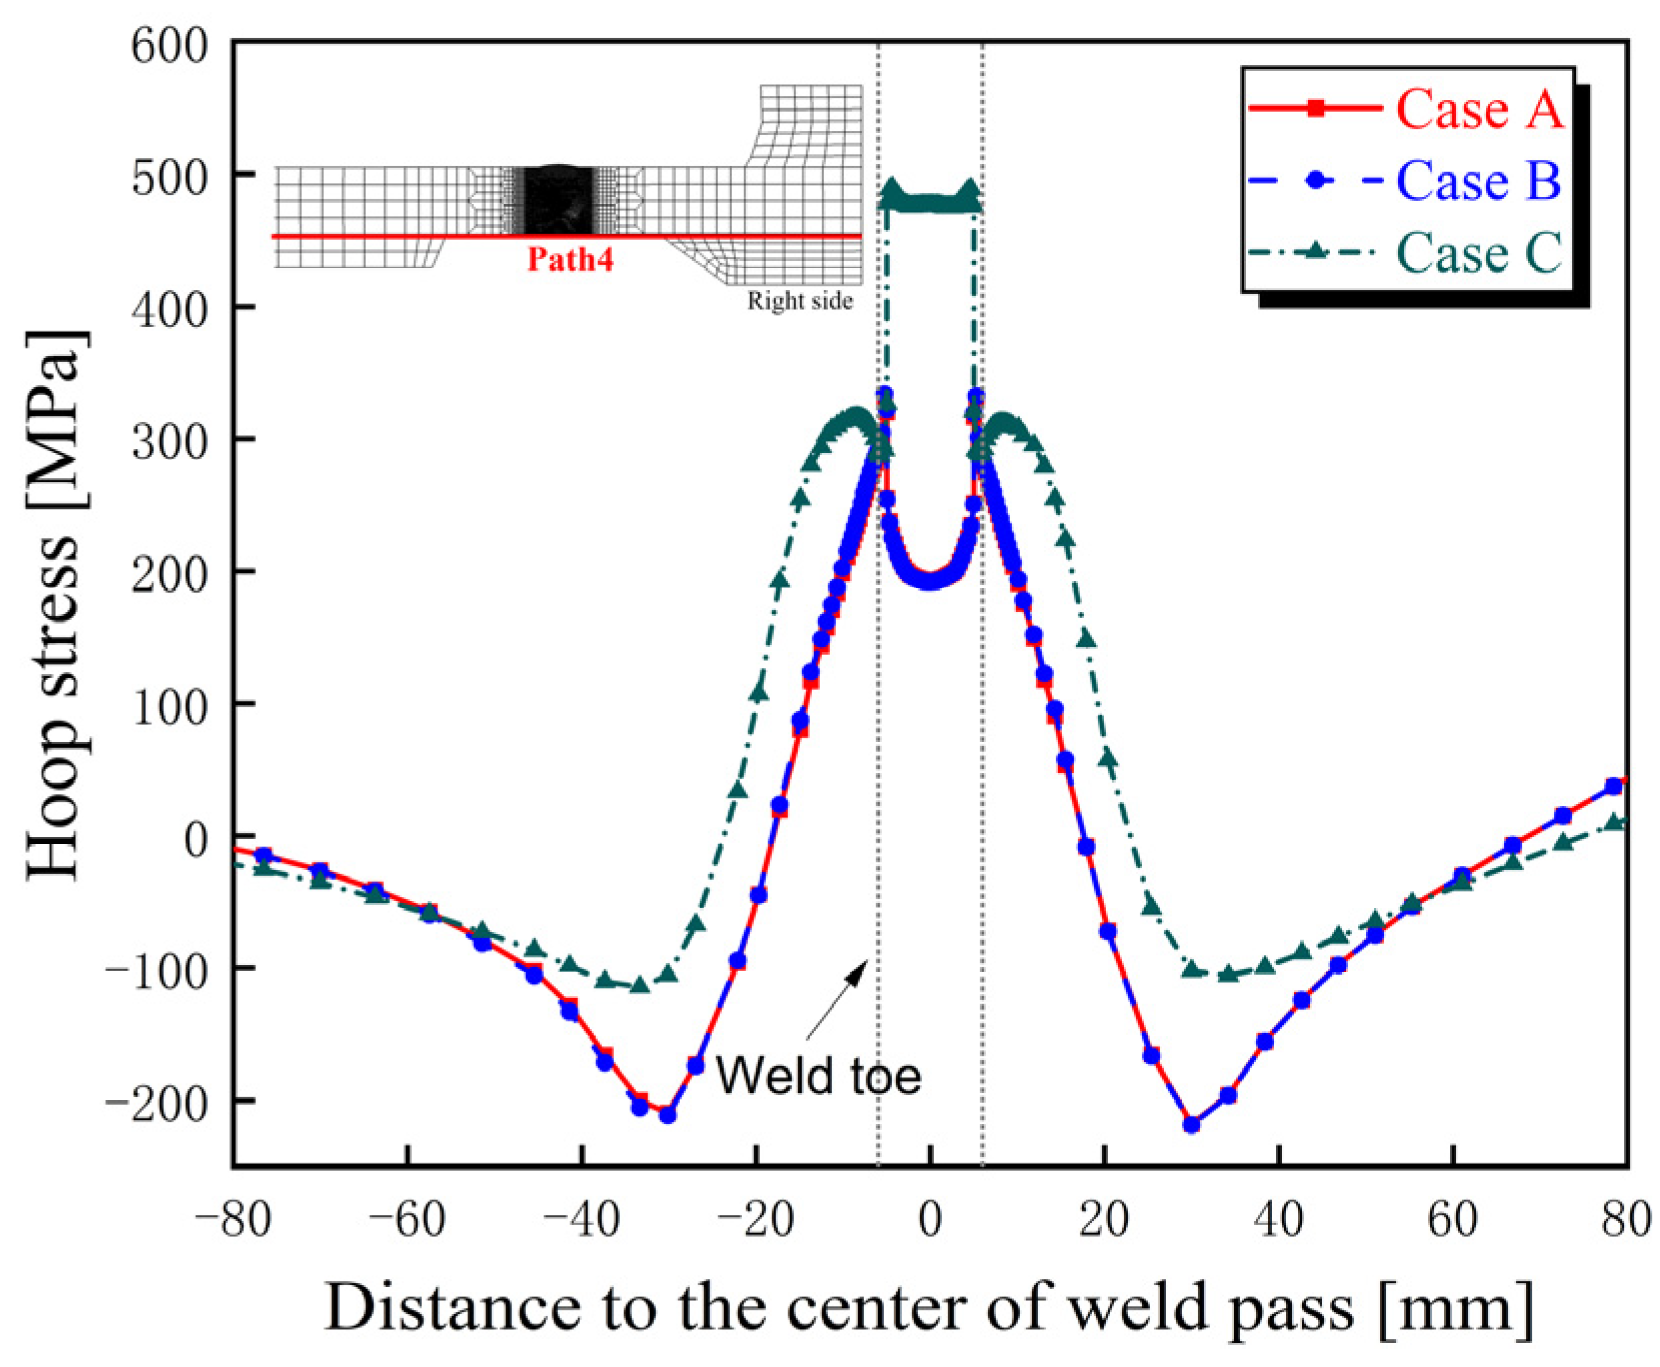
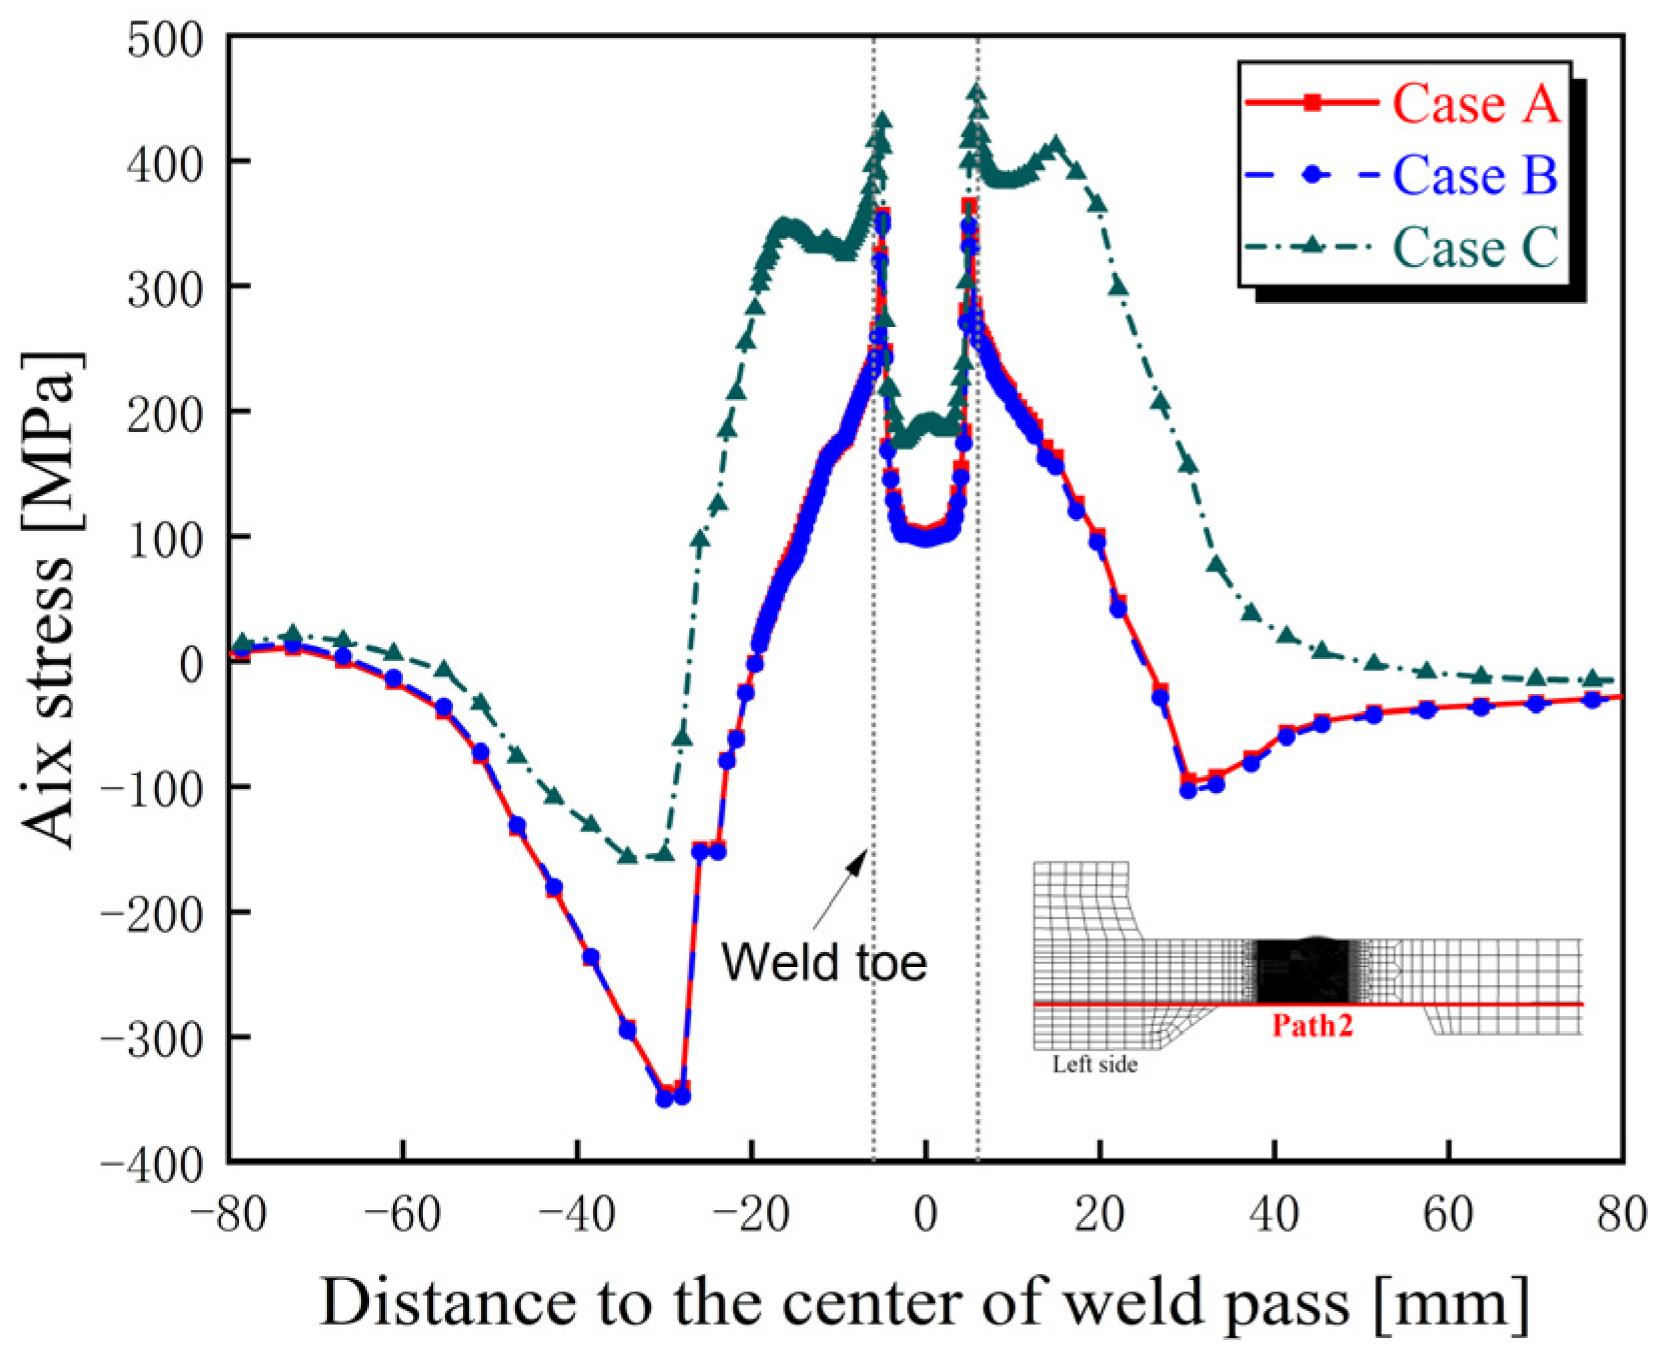
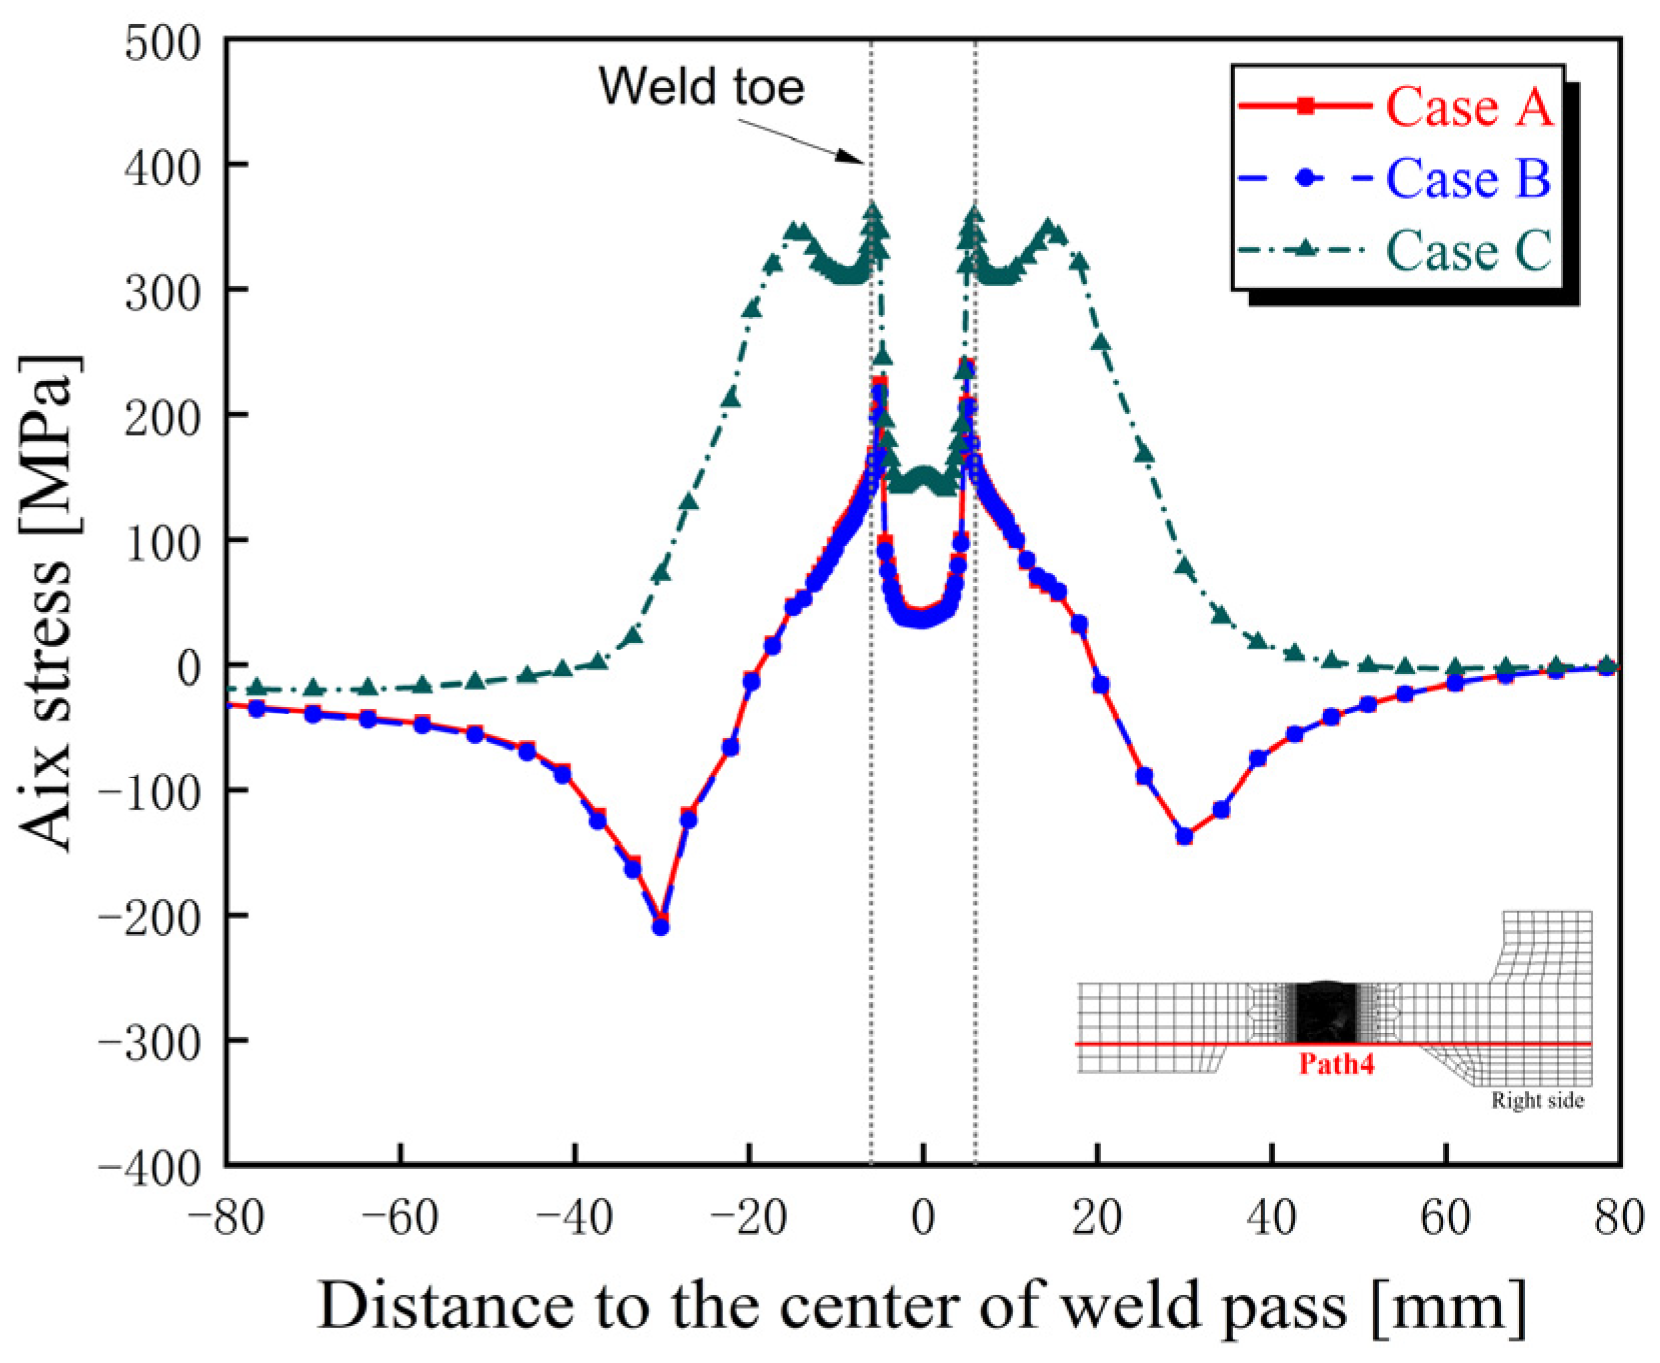
Figure 19 and Figure 20 provide a quantitative comparison of the hoop residual stress distribution on the inner surfaces of the left and right joints located on the beam. To illustrate the differences among the simulation results of the three cases, the hoop residual stress distribution on the inner surface of the right joint is selected as a representative example. As observed in the hoop residual stress distribution on the outer surface of the right joint, the variation between Case A and Case B is minimal and can be regarded as negligible. In contrast, Case C displays a markedly different stress profile. The hoop residual stress along Path 4 at the inner surface of the right joint is significantly higher than that in the other two cases, with peak stress values slightly surpassing the room-temperature yield strength of the weld metal. According to theoretical analysis, the welding sequence has a critical influence on both the residual stress distribution and the location of peak stress in welded joints. The numerical simulation results obtained for Case C are consistent with these theoretical predictions. The above comparative analysis clearly indicates that the sequence of weld beads significantly affects the hoop residual stress distribution on the inner surface of the welded joint.

4.3.2. Axial Residual Stress

Figure 21, Figure 22 and Figure 23 illustrate the contours of the axial residual stress distribution obtained from Cases A, B, and C, respectively. To further elaborate on the axial residual stress characteristics, Case A is selected as a representative example to analyze the axial residual stress distribution in the left and right welded joints. Figure 21a presents the overall axial residual stress distribution for Case A, while Figure 21b,c display the axial residual stress distributions of the left and right joints, respectively. As depicted in Figure 21b, compressive axial stress is predominant on the outer surface of the weld and its adjacent region, whereas tensile axial stress is observed on the inner surface, with the peak stress located at the weld toe on the inner surface.
It is evident that the maximum axial residual stress is lower than both the hoop residual stress and the material’s yield strength. Moreover, the axial residual stress distribution through the plate thickness exhibits bending stress characteristics, as indicated by the tensile stress on the inner surface and compressive stress on the outer surface. As shown in Figure 21c, the axial residual stress in the right welded joint is generally lower than that in the left joint, although the overall distribution patterns remain consistent. This discrepancy in axial stress levels between the two joints can be attributed to differences in their respective constraint conditions.
Figure 22 shows the contours of axial residual stress distribution for Case B. Similarly to the hoop residual stress, there is negligible variation in either the distribution pattern or magnitude of axial residual stress between Cases A and B.
Figure 23 presents the contours of axial residual stress distribution for Case C. In this case, due to the later application of the two inner weld beads, a high tensile axial residual stress was generated near the inner weld surface, while a significant compressive axial residual stress occurred on the outer surface of the weld.
A comparative analysis of Figure 21 and Figure 23 reveals that the weld bead sequence significantly influences the axial residual stress distribution. Specifically, the sequence not only alters the shape of the stress distribution profile but also affects the location of the peak stress.
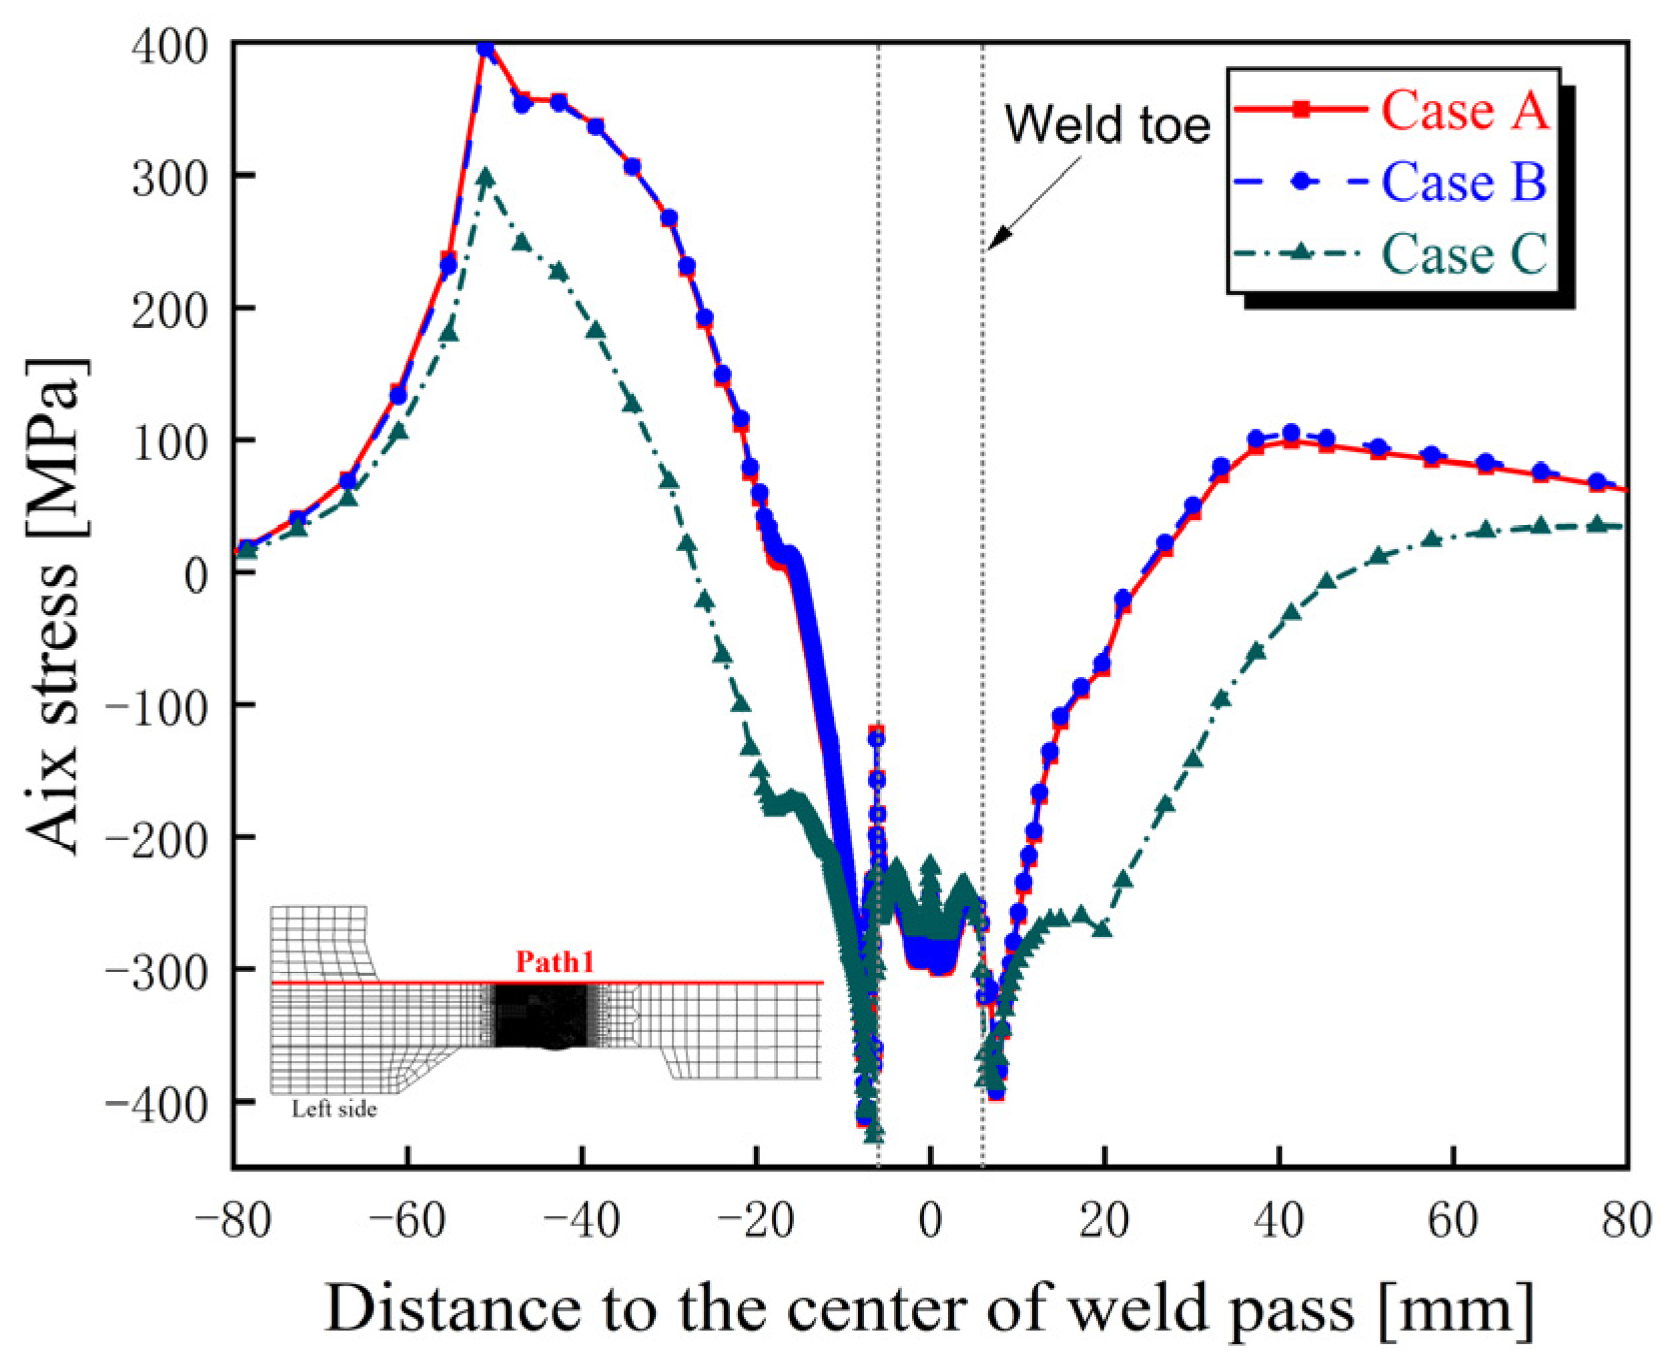
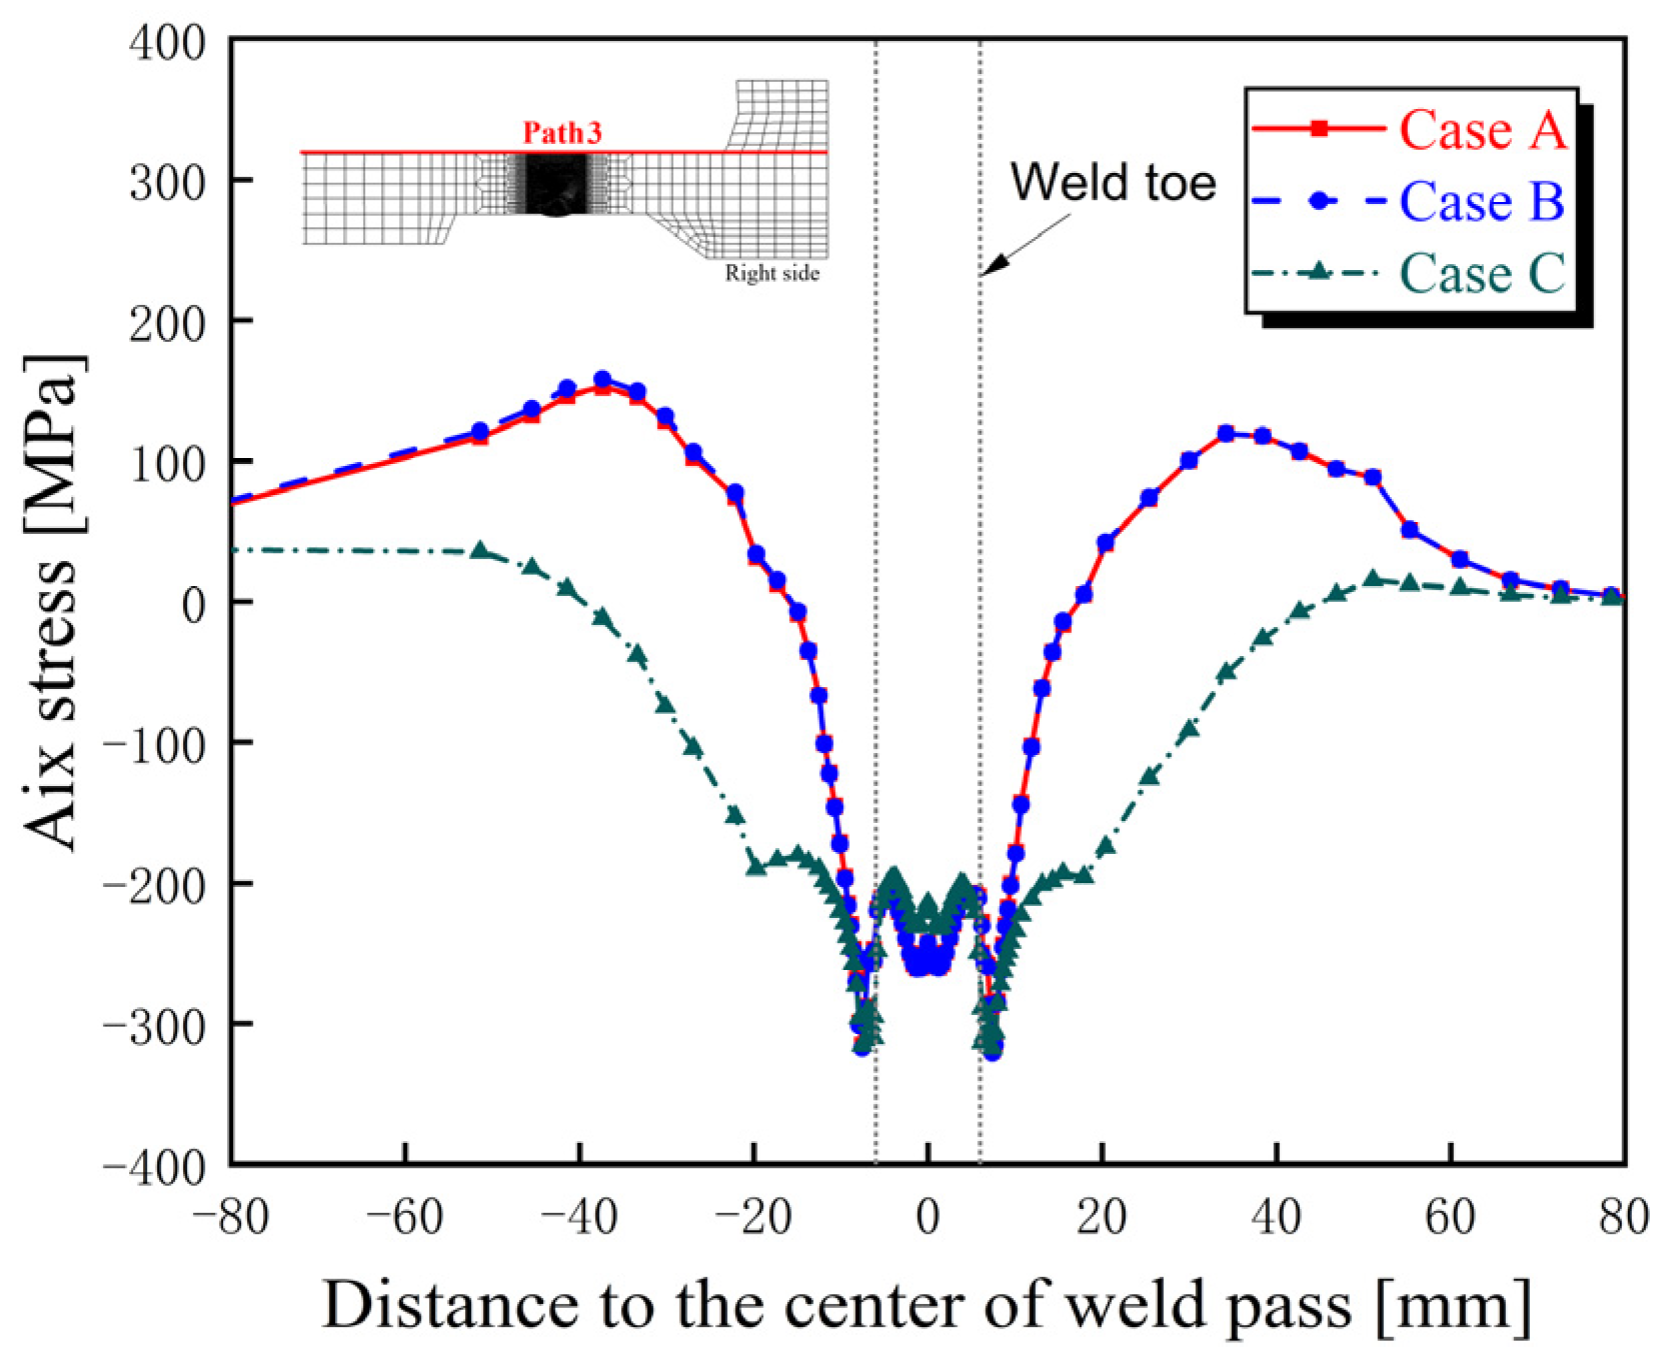
Figure 24 and Figure 25 present a quantitative comparison of the axial residual stress distribution on the outer surfaces of the left and right joints located on the beam. As shown in the figures, the stress levels of Case A and Case B are nearly identical along Path 1 and Path 3, with negligible differences. For the right joint along Path 3, the compressive peak stress occurs at the weld toe, approximately −320 MPa; the tensile peak stress is located about 40 mm from the weld center, with a relatively low magnitude of approximately 150 MPa. In contrast, the left joint exhibits an asymmetric stress distribution due to fixture-induced constraints, resulting in significantly elevated tensile stresses on the constrained side, with peak values reaching approximately 400 MPa.
Compared to Case A, Case C shows a similar axial residual stress distribution and magnitude in the fusion zone and its adjacent regions. However, in regions farther from the weld, the axial residual stress in Case C is considerably lower, with the peak tensile stress reduced by approximately 100 MPa.
These results indicate that the effect of the weld bead sequence on the axial residual stress on the outer surface of the welded joint is mainly reflected in the areas far from the weld, while having a relatively minimal impact on the stress distribution in the weld and its near zone.
Figure 26 and Figure 27 provide a quantitative comparison of the axial residual stress distribution on the inner surfaces of the left and right joints of the beam. To highlight the differences among the three cases, the axial residual stress distribution on the inner surface of the right joint is selected as a representative example for analysis. The stress distributions of Cases A and B are nearly indistinguishable, with differences that can be considered negligible. In contrast, although Case C shows a similar stress distribution trend, with the peak stress still located near the weld toe, there is a significant difference in the stress magnitude. Specifically, the axial tensile residual stress on the inner surface of the beam in Case C is substantially higher than that in Cases A and B, with a peak stress of 350 MPa, compared to approximately 200 MPa in Cases A and B.
Compared with the right joint, the stress at the weld toe of the left joint is higher in all three cases, about 70 MPa higher than that of the right joint. Consequently, the peak stress of the left joint of Case C exceeds 420 MPa, approaching the yield strength of the weld metal at room temperature.
The above comparative analysis results indicate that the arrangement sequence of the weld beads has a significant impact on the magnitude of the axial residual stress on the inner surface of the welded joint.

4.3.3. Discussion

Based on the contours of residual stress distribution in the bogie beam derived from the 2D axisymmetric model, along with the quantitative analysis of residual stress distributions on the outer and inner surfaces of the left and right butt-welded joints, it was observed that in all simulation cases, the peak value of hoop residual stress exceeded the room-temperature yield strength of both the base metal and the weld metal, while the peak value of axial residual stress remained below the material’s yield strength. Nevertheless, the tensile stresses on the inner surface of the butt-welded joint, particularly at the weld toes, were still significantly high. The differences in weld bead sequences between Case A and Case C resulted in variations in the peak positions of hoop residual stress and the distribution patterns of high tensile residual stress. With respect to axial residual stress, the weld bead sequence also exerted a notable influence on its spatial distribution and the location of peak stress. Specifically, on the outer surface of the beam, the hoop and axial residual stress values at the weld and weld toes were found to be relatively close across all three cases. In contrast, on the inner surface of the beam, the tensile residual stresses, both axial and hoop, at the weld toes were approximately 150 MPa higher in Case C (where the inner weld pass was completed last) than in Cases A and B (where the inner weld pass was completed first). Simulation results indicate that different welding sequences can lead to distinct residual stress distributions, thereby providing a foundation for selecting an appropriate weld bead sequence to effectively regulate residual stress.
The bogie is a critical structural component in high-speed trains, primarily tasked with supporting both static and dynamic loads. Consequently, the fatigue life of beams is of particular significance. The fatigue life of welded structures is influenced by multiple factors, among which welding residual stress plays a pivotal role. Fatigue crack initiation typically originates at the surface of the welded joint [22,23]; therefore, the residual stress on the joint surface has a significant impact on the initiation of fatigue cracks and, subsequently, on the overall fatigue life of the welded component. Moreover, residual stresses within the joint also affect the propagation behavior of fatigue cracks [24].
According to the numerical simulation results, from the perspective of fatigue performance, Case A exhibits a more favorable residual stress distribution compared to Case C. First, both the hoop and axial residual stresses on the inner surface of the welded joint in Case C are higher than those in Case A. Second, due to spatial constraints, the inner surface of the tubular beam is not easily accessible for post-weld treatments such as high-frequency impact methods [25], which limits the feasibility of residual stress mitigation. In contrast, although the outer surface residual stresses in Case A are slightly higher than those in Case C, they can be effectively controlled through surface treatments such as high-frequency impact or hammering, particularly at critical locations like the weld toe. This facilitates the enhancement of fatigue strength.
Welding not only induces residual stresses but also leads to welding deformation, which can significantly affect the dimensional accuracy and structural integrity of fabricated components. Theoretically, the extent of welding deformation is primarily governed by structural configuration, material properties, and manufacturing-related factors. In this study, the beam was fabricated from low-alloy steel with a relatively large plate thickness, and external constraints were applied during the welding process. As a result, welding deformation of the beam was small. Consequently, welding residual stress control was prioritized as the primary optimization objective, while welding deformation was considered a secondary factor in the sequencing of weld passes. This study demonstrates that by designing an appropriate weld bead sequence, welding residual stress in the bogie beam can be effectively regulated to a certain extent. Therefore, the welding sequence involving the prior completion of weld passes near the inner surface, followed by the remaining welds, is recommended as the preferred strategy for controlling residual stress in the beam structure and enhancing its fatigue resistance.
Although the numerical simulation methodology developed in this study provides a robust tool for controlling residual stresses during the fabrication of bogie structures, several limitations remain. First, the use of a two-dimensional model does not account for thermal end effects at the weld start and end positions, thereby limiting the accurate representation of complex stress distributions in these regions. Second, solid-state phase transformations—such as martensitic transformation—are not included in the current model, which may lead to inaccuracies in predictions under rapid cooling conditions. Third, experimental validation through fatigue testing has not yet been performed. These limitations will be addressed in future research efforts.

5. Conclusions

(1)
Compared with the moving heat source model, the two-dimensional plane strain model demonstrates superior capability in simulating welding residual stresses in the weathering steel butt-welded joint, while significantly reducing computing time. A comparison between numerical simulation results and experimental measurements confirms that the computational method based on the two-dimensional plane strain model proposed in this study is suitable for the numerical simulation of welding residual stresses in large-scale welded structures, such as high-speed train bogies.
(2)
The distribution characteristics of residual stress in the bogie beam welds obtained through numerical simulation are as follows: (1) Hoop residual stresses in the weld zones of both inner and outer surfaces and their adjacent regions are predominantly tensile. (2) The peak tensile stress on the outer surface occurs at the weld toe and exceeds the yield strength of the material at room temperature. (3) On the inner surface, axial tensile stress near the weld toe is present but remains below the yield strength, whereas the corresponding axial stress on the outer surface is compressive, indicating a significant contribution of bending-induced stress to the overall axial residual stress distribution.
(3)
The sequence of weld beads has a notable influence on the magnitude and distribution of welding residual stresses within the beam, particularly on the inner surface. Specifically, when the inner surface weld is performed later (Case C), the hoop and axial tensile residual stresses at the weld toes on the inner surface of the beam are higher than those observed when the inner weld is completed first (Case A), with a difference of approximately 150 MPa.
(4)
From the perspective of fatigue performance, the welding sequence involving the prior completion of weld passes near the inner surface, followed by the remaining welds, proves more effective in optimizing the distribution and magnitude of residual stresses. Therefore, this sequence of weld beads is recommended as the preferred strategy for controlling residual stress in the beam structure and enhancing its fatigue resistance.

Author Contributions

Conceptualization, D.D. and G.W.; methodology, D.D., Z.M., Y.W. and G.W.; software, D.D. and Z.M.; validation, D.D., Z.M. and Y.W.; formal analysis, C.Z., Z.Y. and Z.M.; investigation, G.W.; resources, D.D.; data curation, G.W. and Z.M.; writing—original draft preparation, G.W.; writing—review and editing, D.D.; visualization, C.Z. and Z.Y.; supervision, D.D.; All authors have read and agreed to the published version of the manuscript.

Funding

This research received no external funding.

Data Availability Statement

The original contributions presented in this study are included in the article. Further inquiries can be directed to the corresponding authors.

Conflicts of Interest

Author Gaojian Wang was employed by the company Sichuan Kexin Electromechanical Co., Ltd. The remaining authors declare that the research was conducted in the absence of any commercial or financial relationships that could be construed as a potential conflict of interest.

Nomenclature

ρ density
c specific heat
λ thermal conductivity
Q s heat generation rate of the internal heat source
q c convective heat loss
h c convective heat transfer coefficient
T s ambient temperature
T 0 initial temperature of the workpiece
q r radiative heat loss
ε emissivity coefficient
σ Stefan–Boltzmann constant
q 1 heat flux densities of the front portions
q 2 heat flux densities of the rear portions
f f , f r distribution coefficients
vwelding speed
twelding start time
U w arc voltage
I w welding current
a f , a r , b, cshape parameters of the heat source
q v heat flux density per unit volume and per unit time
t h assumed heating duration
ηarc efficiency coefficient
Ltotal length of the welding line
Vtotal volume of the weld metal
ε t o t a l total strain
ε e l a s t i c elastic strain
ε p l a s t i c plastic strain
ε t h e r m a l thermal strain

References

  1. Wang, B. Overall Design and Bogie of High-Speed EMU, 2nd ed.; Southwest Jiaotong University Press: Chengdu, China, 2014; p. 143. (In Chinese) [Google Scholar]
  2. Gao, Y. Research on Load Characteristics of Bogie Frame of High-Speed EMU in Severe Cold Conditions. Ph.D. Thesis, Beijing Jiaotong University, Beijing, China, 2017. (In Chinese). [Google Scholar]
  3. Webster, G.A.; Ezeilo, A.N. Residual stress distributions and their influence on fatigue lifetimes. Int. J. Fatigue 2001, 23, 375–383. [Google Scholar] [CrossRef]
  4. Fang, X.Y.; Zhang, H.N.; Ma, D.W.; Wu, Z.J.; Huang, W. Influence of welding residual stress on subsurface fatigue crack propagation of rail. Eng. Fract. Mech. 2022, 271, 108642. [Google Scholar] [CrossRef]
  5. Hu, W.; Lu, F.; Zhang, X. Research on Residual Stress of Welding for High-Speed EMU Bogie Frame (Part I). Weld. Technol. 2018, 47, 71–74. (In Chinese) [Google Scholar]
  6. Yu, Z.; Hu, W.; Liu, Y.; Yang, X. Optimization of Welding Sequence for the Beam Tube of EMU Based on Numerical Simulation. Weld. Technol. 2018, 47, 42–46. (In Chinese) [Google Scholar]
  7. Kendall, O.; Paradowska, A.; Abrahams, R.; Reid, M.; Qiu, C.; Mutton, P.; Yan, W. Residual stress measurement techniques for metal joints, metallic coatings and components in the railway industry: A review. Materials 2022, 16, 232. [Google Scholar] [CrossRef] [PubMed]
  8. Xiao, X.; Liu, Q.; Hu, M.; Li, K.; Cai, Z. Effect of welding sequence and the transverse geometry of the weld overlay on the distribution of residual stress in the weld overlay repair of T23 tubes. Metals 2021, 11, 568. [Google Scholar] [CrossRef]
  9. Deng, D.; Kiyokuni, S. Influence of welding sequence on residual stress distribution in thick plate welding. Trans. China Weld. Inst. 2011, 32, 55–58. (In Chinese) [Google Scholar]
  10. Deng, D. Influence of deposition sequence on welding residual stress and deformation in an austenitic stainless steel J-groove welded joint. Mater. Des. 2013, 49, 1022–1033. [Google Scholar] [CrossRef]
  11. Zheng, X.; Li, D.; Liao, W.; Zhang, H. Residual Stress and Fatigue Strength Analysis of Stiffener Welds of Steel-Plate Composite Girder Bridge Considering Welding Sequence. Buildings 2024, 14, 1801. [Google Scholar] [CrossRef]
  12. Radaj, D. Heat Effects of Welding; Springer: New York, NY, USA, 1992; pp. 23–26. [Google Scholar]
  13. Goldak, J.; Chakravarti, A.; Bibby, M. A new finite element model for welding heat sources. Metall. Trans. B 1984, 15, 299–305. [Google Scholar] [CrossRef]
  14. Pu, X.; Zhang, C.; Li, S.; Deng, D. Simulating welding residual stress and deformation in a multi-pass butt-welded joint considering balance between computing time and prediction accuracy. Int. J. Adv. Manuf. Technol. 2017, 93, 2215–2226. [Google Scholar] [CrossRef]
  15. Deng, D. FEM prediction of welding residual stress and distortion in carbon steel considering phase transformation effects. Mater. Des. 2009, 30, 359–366. [Google Scholar] [CrossRef]
  16. LU, S.; Wang, H.; Dai, P.; Deng, D. Effect of creep on prediction accuracy and calculating efficiency of residual stress in post weld heat treatment. Acta Met. Sin 2019, 55, 1581–1592. Available online: https://www.ams.org.cn/EN/10.11900/0412.1961.2019.00208 (accessed on 10 August 2025).
  17. ISO 16834:2025; Welding Consumables—Wire Electrodes, Wires, Rods and Deposits for Gas Shielded Arc Welding of High Strength Steels—Classification. International Organization for Standardization: Geneva, Switzerland, 2025.
  18. ISO 5178:2019; Destructive Tests on Welds in Metallic Materials—Longitudinal Tensile Test on Weld Metal in Fusion Welded Joints. International Organization for Standardization: Geneva, Switzerland, 2019.
  19. ISO 6892-2:2018; Metallic Materials—Tensile Testing—Part 2: Method of Test at Elevated Temperature. International Organization for Standardization: Geneva, Switzerland, 2018.
  20. da Silva, L.O.P.; Lima, T.N.; Júnior, F.M.d.S.; Callegari, B.; Folle, L.F.; Coelho, R.S. Heat-Affected Zone Microstructural Study via Coupled Numerical/Physical Simulation in Welded Superduplex Stainless Steels. Crystals 2024, 14, 204. [Google Scholar] [CrossRef]
  21. Deng, D.; Kiyoshima, S. FEM prediction of welding residual stresses in a SUS304 girth-welded pipe with emphasis on stress distribution near weld start/end location. Comput. Mater. Sci. 2010, 50, 612–621. [Google Scholar] [CrossRef]
  22. Coules, H.E. Contemporary approaches to reducing weld induced residual stress. Mater. Sci. Technol. 2013, 29, 4–18. [Google Scholar] [CrossRef]
  23. McClung, R.C. A literature survey on the stability and significance of residual stresses during fatigue. Fatigue Fract. Eng. Mater. Struct. 2007, 30, 173–205. [Google Scholar] [CrossRef]
  24. Macdonald, K. Fracture and Fatigue of Welded Joints and Structures; Elsevier: Leiden, The Netherlands, 2011; pp. 124–128. [Google Scholar]
  25. Gkatzogiannis, S. Finite Element Simulation of Residual Stresses from Welding and High Frequency Hammer Peening; KIT Scientific Publishing: Karlsruhe, Germany, 2022; pp. 15–20. [Google Scholar]
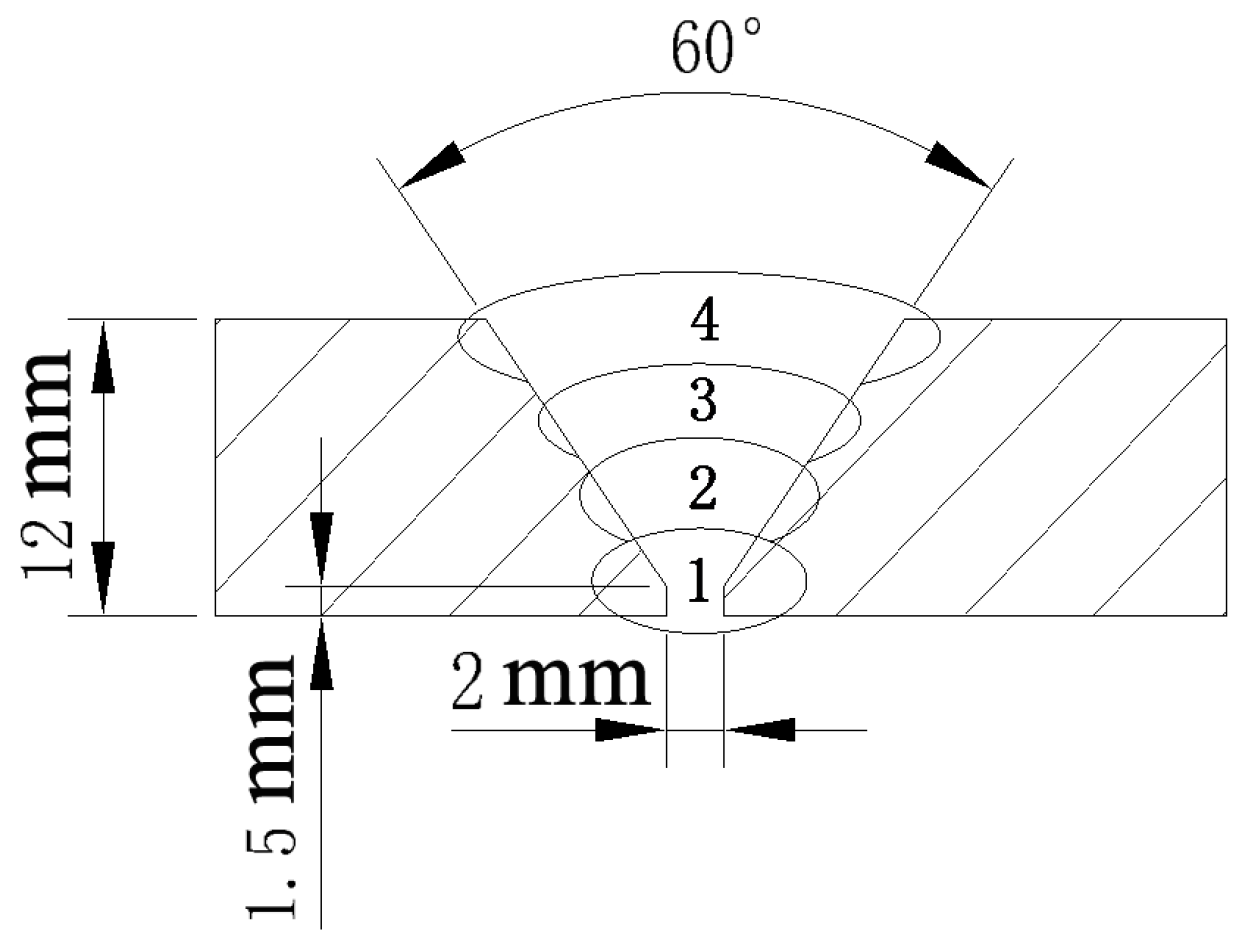
Figure 1. Joint type and weld pass arrangement of the butt joint.
Metals 15 01225 g001
Figure 2. Arrangement of strain gauges on the flat plate butt joint.
Metals 15 01225 g002
Figure 3. Thermal properties of materials.
Metals 15 01225 g003
Figure 4. Temperature-dependent mechanical properties of materials, (a) SMA490BW steel, (b) weld metal.
Metals 15 01225 g004
Figure 5. Finite element mesh model of the butt joint, (a) CASE1, (b) CASE2.
Metals 15 01225 g005
Figure 6. Contour of longitudinal residual stress distribution of the butt joint, (a) CASE1, (b) CASE2.
Metals 15 01225 g006
Figure 7. Contour of transverse residual stress distribution of the butt joint, (a) CASE1, (b) CASE2.
Metals 15 01225 g007
Figure 8. Longitudinal residual stress distributions along Path 1.
Metals 15 01225 g008
Figure 9. Transverse residual stress distributions along Path 1.
Metals 15 01225 g009
Figure 10. Beam structure and its welded joint in the bogie frame: (a) schematic illustration of the beam, (b) welding of the beam, (c) inner surface of welded joint, (d) outer surface of welded joint.
Metals 15 01225 g010
Figure 11. Joint type, groove and arrangement of weld beads.
Metals 15 01225 g011
Figure 12. Two-Dimensional Finite Element Mesh Model of the beam.
Metals 15 01225 g012
Figure 13. Boundary conditions of the 2D finite element model.
Metals 15 01225 g013
Figure 14. Contours of hoop residual stress distribution for Case A, (a) overall, (b) left joint, (c) right joint.
Metals 15 01225 g014
Figure 15. Contours of hoop residual stress distribution for Case B, (a) overall, (b) left joint, (c) right joint.
Metals 15 01225 g015
Figure 16. Contours of hoop residual stress distribution for Case C, (a) overall, (b) left joint, (c) right joint.
Metals 15 01225 g016
Figure 17. Hoop residual stress distributions along Path 1.
Metals 15 01225 g017
Figure 18. Hoop residual stress distributions along Path 3.
Metals 15 01225 g018
Figure 19. Hoop residual stress distributions along Path 2.
Metals 15 01225 g019
Figure 20. Hoop residual stress distributions along Path 4.
Metals 15 01225 g020
Figure 21. Contours of the axial residual stress distribution for Case A, (a) overall, (b) left joint, (c) right joint.
Metals 15 01225 g021
Figure 22. Contours of the axial residual stress distribution for Case B, (a) overall, (b) left joint, (c) right joint.
Metals 15 01225 g022
Figure 23. Contours of the axial residual stress distribution for Case C, (a) overall, (b) left joint, (c) right joint.
Metals 15 01225 g023
Figure 24. Axial residual stress distributions along Path 1.
Metals 15 01225 g024
Figure 25. Axial residual stress distributions along Path 3.
Metals 15 01225 g025
Figure 26. Axial residual stress distributions along Path 2.
Metals 15 01225 g026
Figure 27. Axial residual stress distributions along Path 4.
Metals 15 01225 g027
Table 1. Chemical composition of base metals and weld metals (wt %).
MaterialsCSiMnCrNiCuTi
SMA490BW0.0800.221.350.510.130.32
Weld metal0.0560.391.03 0.800.350.028
Table 2. Welding parameters for each pass of flat plate butt joint.
Weld PassWelding Current [A]Voltage [V]Welding Speed [cm·min−1]Heat Input [kJ·cm−1]
117022376.1
220024309.6
3240262415.6
42402621.617.3
Table 3. Simulation cases for welding of flat plate butt joint.
CaseMesh ModelHeat Source Model
CASE13DMoving Heat Source
CASE22D Plane StrainInstantaneous Heat Source
Table 4. Parameters of heat source models for each weld pass of the butt joint.
PassCASE1CASE2
a f a r b c q f [W/mm3] t h [s]
11.31.31.61.65.811
24.04.54.35.818.12
35.06.06.56.810.652
45.06.08.05.311.652
Table 5. Comparison of calculation time and accuracy for residual stress of the butt joint.
CaseMesh ModelHeat Source ModelCalculation TimeStress Field Accuracy
TransverseLongitudinal
CASE13DMoving Heat Source14 h 40 minModerateBetter
CASE22D Plane StrainInstantaneous Heat Source21 minAcceptableGood
Table 6. Welding process parameters for each weld pass of the beam.
Weld PassWelding Current [A]Voltage [V]Welding Speed [cm·min−1]Heat Input [kJ·cm−1]
B122022368.1
B2250253311.4
F127027548.1
F2290294212.0
F3290293912.9
F4250253012.5
Table 7. Welding sequence cases for beams.
CaseWelding SequenceDescription
Case AB1L→B2L→F1L→F2L→F3L→F4L
B1R→B2R→F1R→F2R→F3R→F4R
Welding on each side, first the inner weld bead then the outer weld bead
Case BB1L→B2L→B1R→B2R→F1L→F2L
F3L→F4L→F1R→F2R→F3R→F4R
Alternating welding on both sides, first the inner weld bead then the outer weld bead
Case CF1L→F2L→F3L→F4L→B1L→B2L
F1R→F2R→F3R→F4R→B1R→B2R
Welding on each side, first the outer weld bead then the inner weld bead
Disclaimer/Publisher’s Note: The statements, opinions and data contained in all publications are solely those of the individual author(s) and contributor(s) and not of MDPI and/or the editor(s). MDPI and/or the editor(s) disclaim responsibility for any injury to people or property resulting from any ideas, methods, instructions or products referred to in the content.