Abstract
This study investigates the surface characteristics and corrosion behavior of a high-C martensitic stainless steel (AISI 440C) at different stages of its manufacturing process. As a class, these steels prioritize high mechanical properties and wear resistance over superior corrosion resistance. Hot working operations, such as rolling, create a surface oxide scale that must be removed via pickling to restore the material’s inherent corrosion resistance. This process also eliminates the underlying Cr-depleted layer, allowing for the re-establishment of a protective passive film. Using potentiodynamic polarization curves and micrographic analysis, the material’s behavior in different conditions, as-rolled, with a post-heat treatment oxide scale, and in a bare, oxide-free state, has been assessed. The results showed that the material lacks stable passive behavior under all conditions. The as-rolled and heat-treated conditions both exhibited active behavior and formed thick, non-adherent corrosion products. The oxide layer formed after heat treatment performed the worst, showing a significant increase in corrosion current density. These findings confirm the material’s susceptibility to corrosion in Cl− ion-rich environments, highlighting the need for limited storage in such conditions and rapid pickling after thermal processing to mitigate surface damage.
1. Introduction
Stainless steels are Fe-based alloys distinguished by a minimum Cr content of 10.5 wt.%, a threshold that imparts superior corrosion resistance relative to other steel classes. Owing to the remarkable alloying flexibility of the Fe-based system, stainless steels can also incorporate additional alloying elements, such as Mo, Mn, Ni, and N, that further tailor their microstructural features and performance. Based on the stabilizing effects of these elements on the different phases within the Fe-Cr system, stainless steels are conventionally categorized into five main classes: austenitic, ferritic, martensitic, duplex (ferritic-austenitic), and precipitation-hardening (PH) grades. PH steels are further subdivided into austenitic, martensitic, and semi-austenitic, as shown in Figure 1 [1].
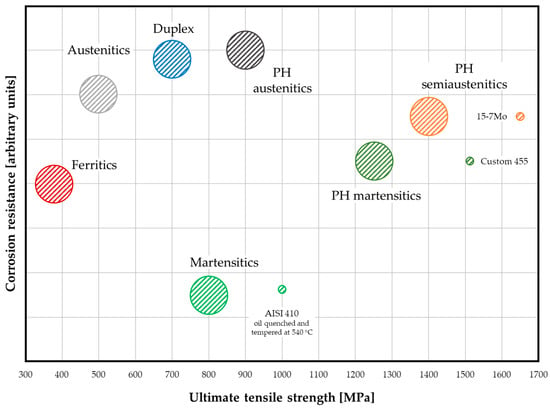
Figure 1.
Qualitative diagram illustrating corrosion resistance versus ultimate tensile strength for stainless steels. Note that super- and hyper-grades, are excluded. The circles represent the most common combinations; however, some peculiar exceptions are included for completeness, though they are not exhaustive.
The enhancement of corrosion resistance has historically represented the primary impetus for the development of stainless steels. This property is chiefly attributed to the spontaneous formation of a thin, protective Cr-rich passive oxide film, which significantly improves their resistance to corrosion across a wide range of environments.
In this context, as illustrated by Figure 1, PH stainless steels exhibit enhanced corrosion resistance compared to their traditional counterparts. This effect is observed in both austenitic and martensitic PH steels, although it is particularly pronounced in the latter. The significant improvement in corrosion resistance in martensitic PH steels is primarily a function of their chemical composition. In fact, these alloys are defined by a very low C content and the addition of Ni, typically in the 3–8 wt.% range. This unique composition results in the formation of a different martensitic structure (essentially the one of the Fe-Ni system) which, coupled with the beneficial effects of low C and increased Ni on corrosion resistance, provides a substantial improvement in the overall corrosion performance. Beyond their corrosion resistance, the various classes of stainless steel exhibit significant differences in processability and mechanical properties. This outcome stems from factors including phase transitions and precipitation hardening induced by heat treatment, in addition to strain hardening resulting from cold working. These capabilities for property customization, in conjunction with corrosion resistance, enable a broad spectrum of property combinations, as illustrated in Figure 1. Due to their inherent durability and wide range of properties, which are provided by countless possible combinations of alloying elements, stainless steels have found widespread application across virtually all industrial sectors, including aerospace and defense, architecture and construction, automotive and transportation, chemical and process industries, household and commercial products, marine engineering, and oil and gas sector, as well as the pulp and paper industry [2].
Although stainless steels represent a relatively small segment of the global steel industry, accounting for approximately 3% of total production, they play a strategically important role in high-performance applications. From a product typology perspective, flat products constitute the largest share of stainless steel output (around 60%), followed by long products, including coils and bars (approximately 20%), while the rest comprises castings and miscellaneous components [2]. Among these, long products are of particular interest due to the complexity of their manufacturing routes and the specific metallurgical and mechanical characteristics imparted by downstream processing following hot working operations. Irrespective of the specific stainless steel grade, hot rolling remains the main forming method for long products, conducted either in single-stand configurations or through continuous rolling mills [3].
Following hot rolling, the subsequent processing route for stainless steel long products depends on the specific alloy type. In some cases, direct heat treatment is performed immediately after hot working, whereas in others, the material is stored, either indoors or outdoors, prior to undergoing thermal treatment at a later stage, upon retrieval from the warehouse. Frequently, long products are further processed via cold working processes such as cold drawing or cold forging, enabling the production of cold-drawn bars, coils, fasteners, and various other components. In preparation for these operations, however, the surface condition of the material must be addressed, as it is typically covered by a tightly adherent oxide scale formed during hot rolling and further developed during subsequent thermal treatments. This oxide layer consists of complex oxides derived from alloying elements, that diffuse from the bulk to the surface at elevated temperatures. As a consequence of selective oxidation, a depleted layer forms beneath the scale, exhibiting jeopardized properties and, usually, reduced corrosion resistance. Importantly, the composition, morphology, and adherence of the oxide scale, and, correspondingly, the characteristics of the underlying depleted region, are highly sensitive to a multitude of processing parameters. As emphasized by Li and Celis [4], key factors influencing oxide scale development include the conditions within the reheating furnace prior to hot rolling, the nature and extent of surface contaminants prior to heat treatment, and the specific thermal treatment parameters employed. Not only the treatment temperature, but also the air-to-fuel ratio and soaking time critically affect the kinetics and thermodynamics of scale formation, thereby modulating the final structure and composition of both the oxide layer and the substrate [4].
Oxide scale removal from the surface of stainless steel long products is essential for ensuring adequate surface quality and restoring corrosion resistance and is commonly achieved through chemical pickling. Pickling is a surface treatment process that employs acidic solutions, to eliminate oxide scale and surface contaminants formed during high-temperature processing. In the case of long products, this procedure is typically carried out by immersing the material in a series of acid baths. For Stainless steels characterized by a total alloying element concentration above approximately 6 wt.%, the pickling sequence generally involves immersion in multiple tanks containing various combinations of acids, including hydrochloric acid (HCl), hydrofluoric acid (HF), nitric acid (HNO3), phosphoric acid (H3PO4), and sulfuric acid (H2SO4) [2]. The process serves a dual purpose: not only does it effectively remove the surface oxide scale, but it also eliminates the eventual underlying Cr-depleted layer. This enables the spontaneous reformation of a uniform, Cr-rich passive film, thereby reinstating the material’s inherent corrosion resistance [2]. Pickling removes a surface layer that eventually settles at the bottom of the pickling tanks, forming sludge that accumulates over time and must be managed as special waste in compliance with local regulations. Additionally, as pickling cycles continue, the pickling solutions tend to become exhausted. The management of pickling sludge and exhausted solutions is an imperative requirement for companies performing this process. Of course, disposal of pickling sludge is not necessarily the only way forward. As pointed out by Rögener et al. [5], membrane electrolysis can be valuably employed to recover Cr, Fe and Ni from industrial stainless steels pickling waste. Pickling solutions are calibrated based on the materials being processed, and their effectiveness depends on the composition of the substances present on the surface that need to be removed. Moreover, to achieve the same surface appearance, the life of the pickling solution is shorter if the surface layer on the material is thicker, more adherent, and harder to remove. Therefore, characterizing the oxides on the material’s surface is of particular interest for both developing the correct pickling mixture and predicting its service life [4,5]. Furthermore, quantifying the difference in corrosion resistance behavior between the as-rolled or as-treated condition and the oxide-free material is important for optimal material storage management, which is often performed outdoors, exposing semi-finished products to more or less corrosive environments. The characteristics of the high-temperature oxide scale on the surface will determine its corrosion-related behavior and how the corrosion resistance evolves due to interaction with the environment. Finally, studies characterizing the surface of long products across various production steps, in terms of morphology, composition, and corrosion behavior; are notably rare in the literature.
To investigate these aspects, a high-C martensitic stainless steel grade (AISI 440C) usually produced in wire and wire rod form was selected for laboratory-scale testing. Although classified within the broader family of stainless steels, this particular grade does not exhibit outstanding corrosion resistance, as its alloy design prioritizes alternative performance criteria, i.e., high mechanical properties and wear resistance [2]. This study aims to assess and compare the surface characteristics of the selected martensitic stainless steel grade through potentiodynamic polarization testing at different stages of its manufacturing process. The investigation focuses on evaluating the material’s passive behavior and corrosion response as a function of surface condition and related thermal history.
Initially, the corrosion resistance of the as-rolled material was examined via potentiodynamic polarization in sulfuric acid. Potentiodynamic polarization in 0.5 M H2SO4 solution was employed to investigate the formation of the passive layer on the freshly exposed, oxide-free surface after polishing of the transverse section. This is because H2SO4 is a strong oxidizing agent, making it suitable for promoting passivity. In the following, the bare, oxide-free cross-sectional surface has been designated as the bulk (sometimes simply cross-section to avoid repetition in the same sentence). This designation is justified because the term bulk typically refers to the internal portion of a material that is unexposed to the external environment and thus free of any corrosion products from process conditions. The bulk is therefore the part of the material that can express its inherent corrosion resistance in response to the external environment. This terminology is deliberately chosen to differentiate it from the external surface, which refers to the lateral part of the samples and is characterized by the presence of various corrosion products from both manufacturing and experimental sessions.
Subsequently, the material was tested in 3.5 wt.% NaCl solution. This solution was selected to simulate a chloride-rich corrosive environment, allowing for evaluation of the material’s behavior under aggressive conditions that are able to damage the Cr-rich passive layer typical of stainless steels. In fact, in presence of Cl− ions, stainless steels are susceptible to passivity breakdown, leading to localized corrosion phenomena such as pitting and crevice corrosion. Breakdown occurs when the protective passive film is compromised, exposing the underlying metal to further corrosive attack. The extent of the breakdown is influenced by factors including Cl− concentration, temperature, and pH [6,7]. The same NaCl-based polarization test was then performed on samples featuring the high-temperature oxide scale typically formed during heat treatment, representing the material’s most common supply condition. Finally, potentiodynamic polarization curves were carried out on heat-treated specimens after oxide removal, i.e., in a bare but thermally processed state. In parallel with each of the aforementioned characterization steps, micrographic analyses were conducted for each condition and correlated with the electrochemical test results to elucidate the relationship between surface state, microstructure, and corrosion behavior.
2. Materials and Methods
2.1. Materials
As previously indicated, this study focuses on the long product category. Accordingly, samples of the stainless steel grade under investigation were obtained from hot-rolled material in coil form and selected for subsequent analysis. AISI 440C is a commercial high-C stainless steel belonging to the group of martensitics, also popular with the EN 1.4125 nomenclature and whose chemical composition is given in Table 1.

Table 1.
Chemical composition of AISI 440C according to EN 10088-1: 2023. Product deviations are allowed. Element content is expressed in wt.%.
The alloy is characterized by relatively high tensile properties in the annealed condition and by even higher characteristics in the quenched and tempered supply condition (Table 2).

Table 2.
Mechanical properties of AISI 440C. Adapted from [2]
Typically, the microstructure after quenching consists of martensite and a non-negligible amount of retained austenite (more than 30% in volume in some cases) along with primary and secondary carbides finely dispersed in the martensitic matrix [8,9]. The production sequence (Figure 2) is usually determined by the availability of facilities in the production plant and allows for several possibilities. After hot working, quenching and tempering can be carried out directly. Alternatively, if the supply condition is the annealed one, annealing should be carried out immediately after hot working. In case heat treatment facilities are not available after hot working, furnace recovery becomes necessary to prevent the material from cracking due to internal stresses. This latter is the reason why the material must be handled immediately after high-T processing. As specified in Figure 2, furnace recovery takes place at temperatures compatible with the early stages of tempering [2].
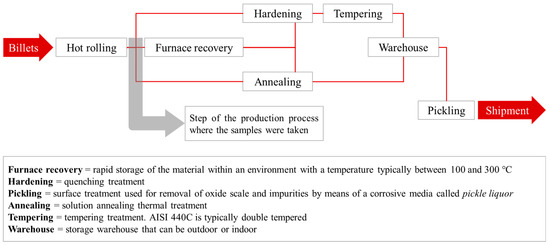
Figure 2.
Typical production sequence of hot-rolled wires and wire-rods made of AISI 440C.
Despite the Cr content, the corrosion resistance of AISI 440C is lower than that of ferritic grades (see Figure 1). This is mainly due to the high C content (Table 1). Finally, due to its characteristics, AISI 440C is employed when mechanical strength, wear resistance, and acceptable corrosion resistance are required. Possible applications include: ball bearings and races, cutlery, molds and dies, pump parts [2].
2.2. Experimental
As previously mentioned, the experimental campaign on the material under investigation was carried out through potentiodynamic polarization tests conducted in both 0.5 M H2SO4 and 3.5 wt.% NaCl solutions, according to the following sequence:
- Sample cutting from the as-rolled material received.
- Microstructure of the as-rolled material in the transverse section.
- Potentiodynamic polarization in H2SO4 0.5 M of the bulk.
- Potentiodynamic polarization in 3.5 wt.% NaCl solution of the bulk.
- Potentiodynamic polarization in 3.5 wt.% NaCl solution of the external surface.
- Heat-treatment simulation.
- Microstructure of the as-rolled material in the transverse section.
- Potentiodynamic polarization in H2SO4 0.5 M of the heat-treated bulk.
- Potentiodynamic polarization in 3.5 wt.% NaCl solution of the heat-treated bulk.
- Potentiodynamic polarization in 3.5 wt.% NaCl solution of the external surface.
After sample cut from the original material, specimens were prepared in a geometry suitable for optical microscopy and compatible with the suite of subsequent characterization techniques selected for the study. Specifically, samples from hot-rolled round coil were cut into cylinders with 7.61 mm average diameter and 6.40 mm length. The sample diameter corresponds to that of the hot-rolled wire. This resulted in a cross-sectional area of 37.42 mm2 and a lateral surface area of 153.01 mm2.
In this study, potentiodynamic tests were performed using a Gamry Reference 600+ (Gamry Instruments Inc., Warminster, PA, USA) with a standard setup for potentiodynamic testing. In fact, an Ag/AgCl (+0.197 V vs. SHE) reference electrode (RE) was employed, while Pt wire was used as counter-electrode (CE). The sample functions as the working electrode (WE). All the potentiodynamic tests performed in aerated 0.5 M H2SO4 and 3.5 wt.% solutions were characterized by a scan rate of 0.2 mV/s was set, with an initial potential of −50 mV vs. EOC (open circuit potential). In the context of the electrochemical tests carried out, it is important to note that all electrochemical tests were performed at 25 °C ± 1 °C.
Regarding heat treatment simulation, and with reference to Figure 2 and Table 2, a laboratory heat treatment was performed to simulate the hardened and tempered (Q + T) condition. This cycle was chosen because it maximally exposes the material’s surface to a high-temperature oxidizing atmosphere, thus being expected to significantly alter its characteristics. The samples were subjected to a heat treatment cycle to intentionally alter their microstructure and surface characteristics. Following the typical quenching and double tempering procedure for AISI 440C [10], the material was processed within a TGA STA Netzsch 409 Lux (Netzsch, Selb, Germany), where the uncontrolled atmosphere was intended to replicate the conditions of an industrial furnace. The thermal cycle began with austenitization at 1050 °C for 5 h, temperature reached at a heating rate of 50 °C/h. This was followed by air cooling at the maximum rate achievable by the TGA (free cooling of the furnace equipment), leveraging the self-hardening nature of the AISI 440C steel. Finally, two tempering cycles were performed at 300 °C for 3 h, each with a heating rate of 50 °C/h. This simulates a cycle frequently employed in industry for products of this type.
Both optical and electron microscopy were employed to characterize the material’s surface. Specifically, optical microscopy was used to characterize both the surface and the microstructure of the material’s cross-section in both the as-rolled condition and after heat treatment. A Nikon SMZ 25 (Nikon Instruments, Tokyo, Japan) stereomicroscope was used for low-magnification surface inspection. On the other hand, an Olympus DSX 1000 (Olympus Corp., Tokyo, Japan) microscope was used for optical microscopy at higher magnification. In this regard, the cross-section of the samples was polished and etched with Vilella reagent. This etching procedure is able to highlight the presence of secondary phases, such as carbides. Furthermore, Vilella reagent is also capable of etching martensite, thereby allowing for a higher possibility of detecting retained austenite, which, in this steel, is expected to be present in significant quantities [8,9,11].
Scanning electron microscope (SEM) analyses were performed in secondary electrons (SE) and in backscattered electrons (BSE) modes. Some instruments refer to these modes as SED and BED, respectively. Additionally, elemental maps of the analyzed areas were executed to provide further information for the interpretation of the results and the material’s behavior under the test conditions. SEM analyses were conducted using a JSM IT300LW microscope (JEOL, Tokyo, Japan) equipped with EDXS Quantax (Bruker Corp., Billerica, MA, USA) and XFLASH 630 M detector (Bruker Corp., Billerica, MA, USA).
Finally, to better support the interpretation of the microstructure and of the results, thermodynamic calculations based on the chemical composition were conducted using Thermo-Calc software V5.0 (Thermo Calc Software AB, Råsundavägen, Sweden) with the TCFE12 database for predicting the types and fractions of equilibrium phases in the material.
3. Results and Discussion
This section reports the results of the experimental activity detailed in Section 2.2. The discussion is structured by material condition, with an initial focus on the as-rolled one and a subsequent analysis of the heat-treated condition.
3.1. As-Rolled Material
3.1.1. Microstructure of As-Rolled Samples
To support the interpretation of the microstructural results, thermodynamic calculations were performed using Thermo-Calc software to predict the type and fraction of the material’s equilibrium phases. The simulation results are shown in the volume fraction vs. temperature plot in Figure 3.
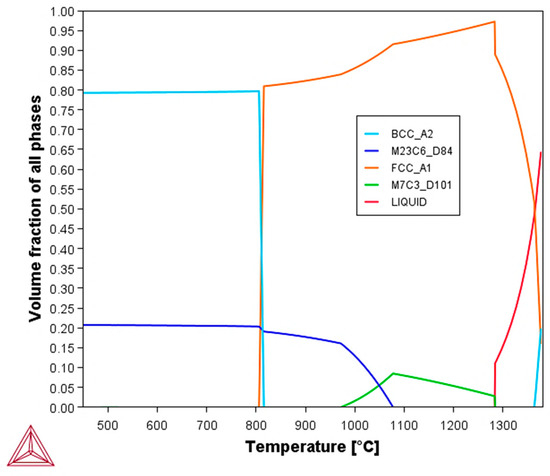
Figure 3.
Volume fraction of all phases vs. temperature plot at equilibrium based on the chemical composition of AISI 440C martensitic stainless steel.
After etching with Vilella’s reagent, the material’s microstructure was analyzed using optical microscopy, as shown in Figure 4. The as-rolled microstructure shown in Figure 4 exhibits a very fine grain, observable only at high magnifications, which is consistent with dynamic recrystallization of the material during hot rolling [12].
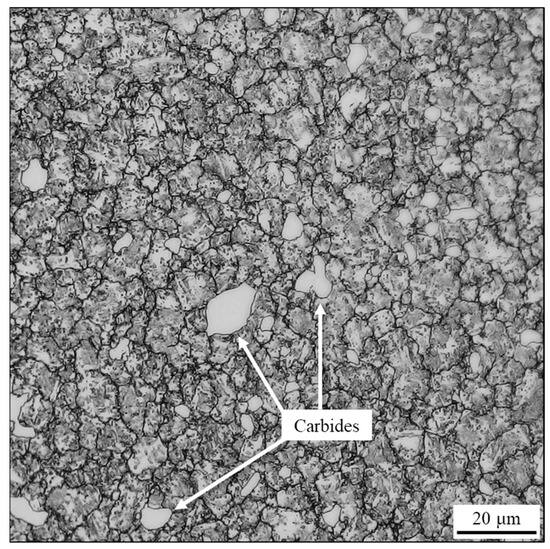
Figure 4.
Optical micrograph of the as-rolled AISI 440C sample’s cross-section, etched with Vilella reagent.
The microstructural analysis further highlights a considerable volume fraction of carbides, with some exceeding 10 μm in maximum extension. This observation, coupled with the morphology (suggesting primary precipitation from the liquid) and the equilibrium simulation given in Figure 3, strongly suggests that these phases are M7C3 carbides. Although M23C6 carbide is also predicted by equilibrium simulation and literature [13], its precipitation typically occurs from the solid at grain boundaries (GBs) with a morphology different from that observed in Figure 4. Therefore, it is believed that, under the actual conditions of the real production process, the volumetric phase fraction ratio deviates from equilibrium, resulting in a preponderance of M7C3 carbide and the non-detectability or absence of M23C6. The SEM analysis in BSE mode (Figure 5) shows some polishing lines, dark branched lines indicating the grain boundary of the microstructure and carbides (dark gray spots). This evidence, together with EDXS elemental mapping, also suggest that the carbides are predominantly Cr7C3; although the Mn signal apparently evidences a hybrid composition. Given the steel’s chemical composition, which includes up to 1 wt.% Mn, it is likely that Mn participates in carbide formation. This finding aligns with the assumption that the carbides are of the M7C3 type, where M represents a combination of metallic elements. Mn, Cr and Fe are neighbor transition metals in the periodic table, which explains their similar chemical behavior and ability to substitute for one another in crystal structures. In particular, the literature supports the existence of Mn7C3 carbide and provides crystallographic data for it. Its formation is considered plausible because the atomic positions in Mn7C3 and Fe7C3 carbides are identical. This isomorphism seems to allow Mn to readily substitute for Fe or Cr in the carbide lattice, thus making formation of a mixed metal carbide (Cr,Mn)7C3 possible [13].

Figure 5.
Backscattered electrons SEM micrograph and EDXS Cr and Mn elements mapping of the as-rolled AISI 440C sample’s cross-section. Please note that the backscattered electrons image shows some polishing lines, carbides (dark gray spots), and dark branched lines indicating the grain boundary of the microstructure.
3.1.2. Potentiodynamic Polarization in H2SO4 0.5 M Solution
Figure 6 shows the potentiodynamic curve in H2SO4 0.5 M solution.
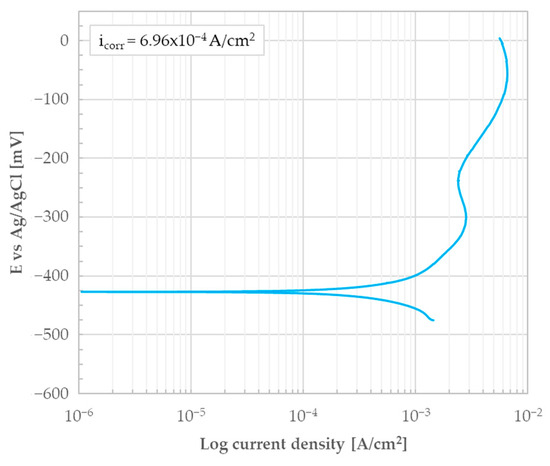
Figure 6.
Potentiodynamic polarization curve of the as-rolled AISI 440C sample’s bulk (i.e., the bare, oxide-free cross-section) in 0.5 M H2SO4.
It can be observed that the current densities are in the order of milliamps and there is no tendency for the material to passivate. This is evidenced by a non-noble potential and the shape of the curve typical of an active state behavior. The corrosion current density (icorr) determined using Tafel lines was found to be 6.96 × 10⁻⁴ A/cm2 and the associated corrosion potential (Ecorr) was −427 mV. After the test, the surface was found to be completely covered with black corrosion products.
3.1.3. Potentiodynamic Polarization in 3.5 wt.% NaCl Solution
The bulk (i.e., bare, oxide-free material’s cross-section) of the as-rolled material was subjected to potentiodynamic test in 3.5 wt.% NaCl solution. The potentiodynamic curve resulting from the test is shown in Figure 7. No obvious stable passive behavior was detected considering the shape of the curve while increasing the anodic polarization. The icorr determined using Tafel lines was found to be 4.94 × 10⁻⁷ A/cm2 and the associated Ecorr was −277 mV.
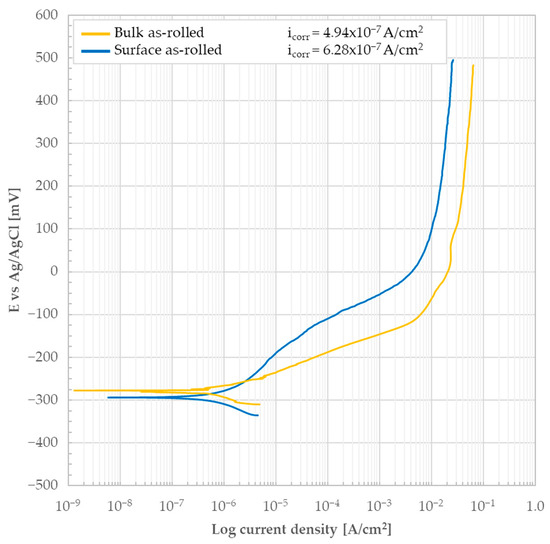
Figure 7.
Potentiodynamic polarization curve of the as-rolled AISI 440C sample’s bulk (i.e., the bare, oxide-free cross-section) and external surface in 3.5 wt.% NaCl solution.
The surface of the sample was completely covered with apparently porous corrosion products of moderate thickness (see Figure 8). Some areas of the corrosion products exhibited damage, including craters and cracks. The formation of cracks in the corrosion products (some of which are visible between the grains in Figure 8 and Figure 9) is attributed to a combination of three factors: the high volume of the corrosion products, the resulting internal stress state, and the brittle nature of the products themselves. Based on the surface morphology, a correlation between the microstructure and oxide growth in an epitaxial-like process could be hypothesized. The comparison between the microstructures shown in the optical micrograph (Figure 4) and the SEM micrograph (Figure 5) with the SEM images of the corrosion products (Figure 8) suggests a correlation between the material’s microstructure and the growth of corrosion products on its surface. Specifically, a correspondence seems to exist between the grains and the crystalline structure of the corrosion products, as their boundaries (GB) seem to align. This latter finding suggests that the underlying GBs of the metal may play some role, which then dictates the morphology of the resulting corrosion products layer.
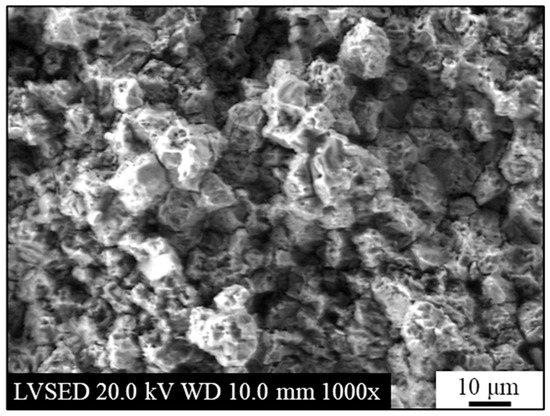
Figure 8.
Secondary electrons SEM micrograph of the as-rolled AISI 440C sample’s bulk (i.e., the bare, oxide-free cross-section) after potentiodynamic polarization in 3.5 wt.% NaCl solution.
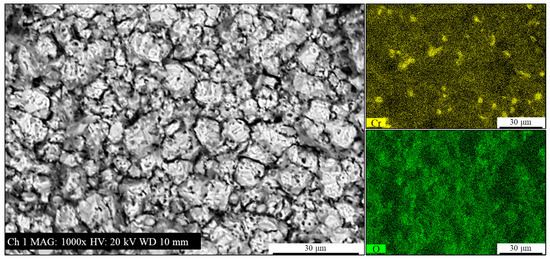
Figure 9.
Backscattered electrons SEM micrograph and EDXS Cr and O elements mapping of the as-rolled AISI 440C sample’s bulk (i.e., the bare, oxide-free cross-section) after potentiodynamic polarization in 3.5 wt.% NaCl solution.
The analysis shown in Figure 9, seems to indicate that the corrosion products are primarily composed of Fe oxides. However, the Cr signal presence and distribution potentially suggest that carbides could play a role in determining the surface morphology. The Cr signal appears to be located at specific, discrete points, often far from the main grain boundaries of the corrosion products. This distribution is consistent with the carbide locations observed in Figure 5. As a consequence of this, it is hypothesized that the corrosion product formation could be directly influenced by the presence of these carbides, which may act as nucleation sites or alter the local electrochemical environment. As a complement to the observations in Figure 8, Figure 9 provides a more detailed view of the crystalline morphology and the porous or apparently cracked surface of the corrosion products.
To evaluate the behavior of the external surface (i.e., lateral surface of the sample) of the as-rolled material, potentiodynamic polarization tests were conducted on the lateral surface of cylindrical samples in 3.5 wt.% NaCl solution. The surface of hot-rolled products typically features a compact and highly adherent Fe3O4-based oxide layer formed at high temperatures during the hot rolling process. The name by which this type of compound is often identified in industry is calamine, also known as mill-scale [14]. It is of interest to determine the behavior of this oxide layer, whether it is protective or not. The results of the potentiodynamic test are shown in Figure 7 to allow for a direct comparison with the findings from the bulk analysis. No obvious passive behavior is detected; instead, the material exhibits an active response to the corrosive process. icorr determined using Tafel lines was found to be 6.28 × 10⁻⁷ A/cm2 and the associated Ecorr was −294 mV. A comparison of the curves in Figure 7 highlights that for potentials lower than about −250 mV, the bulk exhibits slightly better behavior. This is indicated by its lower icorr and slightly higher Ecorr. At potentials greater than −250 mV, a sort of reversal in behavior occurs. Given the absence of obvious passive behavior, this type of response could be explained by the action of calamine. As previously stated, calamine is a ceramic material that, by its very nature, does not participate in the electrochemical processes associated with corrosion phenomena. Its presence typically involves covering most of the material’s surface with a layer characterized by high adhesion. However, this layer is generally uneven and discontinuous, with areas of reduced thickness or sections that expose the underlying substrate. Consequently, it is reasonable to assume that the behavior described by the surface curve in Figure 7 (i.e., material covered by calamine) is the result of a shielding action by the calamine itself. In fact, calamine appears to offer a physical barrier against the electrochemical phenomenon. However, due to its discontinuous nature, it does not entirely prevent the process. As a result, the exposed area is reduced, and so is the corrosion-affected region.
After the potentiodynamic test, the outer surface exhibited localized attack morphology, with raised corrosion products that seemingly developed at pre-existing defects from the rolling process (likely overfilling or seams) and due to the presence of defects in the calamine layer. The formation of these corrosion products resulted in an increase in volume, and Figure 10 suggests that fragments have spalled from the surface.
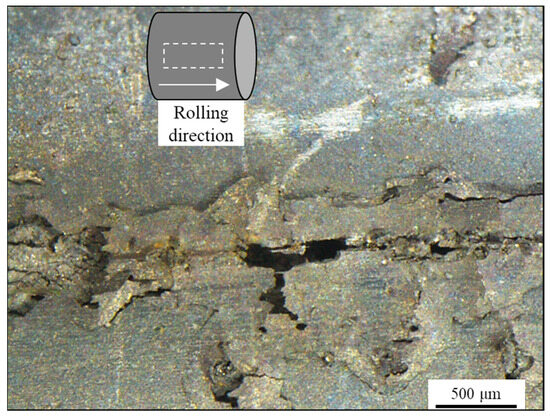
Figure 10.
Aspect of the external surface of the sample observed through stereomicroscopy with a schematic representation of the observation region in relation to the rolling direction after potentiodynamic polarization in 3.5 wt.% NaCl solution.
In fact, Figure 10 shows the surface of the calamine following damage from potentiodynamic testing in 3.5 wt.% NaCl solution. To further investigate the role of calamine in the electrochemical process, in addition to the evidence provided by the results of the potentiodynamic test, the sample was subsequently cleaned using ultrasonic cleaning. A LIARRE Ultrasonic Cleaner Starsonic 60 (Sysmatec, Eyholz, Switzerland) was employed.
This process effectively removed both the calamine and the corrosion products, revealing areas of the underlying surface, as shown in Figure 11. The surface of the material has numerous craters. Some of these are interconnected, while others are isolated and of various sizes. The morphology described seems to be consistent with hypothesis made regarding the shielding action of calamine. As already stated, the calamine layer, being an oxide, is not affected by the corrosive process in NaCl solution. However, defects within this layer, such as cracks or discontinuities, allow the corrosive environment to penetrate and interact with the metallic surface. This enables the anodic reaction to take place at the bottom of the defect where the alloy substrate is present. The varied sizes of the craters further support a process of random nucleation and subsequent growth.
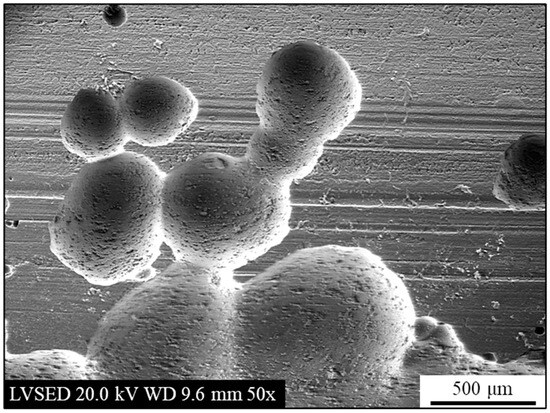
Figure 11.
Secondary electrons SEM micrograph of the external surface after potentiodynamic polarization in 3.5 wt.% NaCl solution and after removal of surface corrosion products.
3.2. Heat-Treated Material
As mentioned, the laboratory heat treatment had a twofold objective. The first was to modify the microstructure to produce tempered martensite, thereby enabling a comparative evaluation of the bulk’s behavior against that of the as-rolled material. The second objective was to intentionally alter the external surface to study the evolution of the outer scale calamine layer and to understand its subsequent response to corrosion.
3.2.1. Microstructure of Heat-Treated Samples
The bulk (i.e., the bare, oxide-free cross-section) of the heat-treated samples was polished and etched with Vilella reagent. As shown in Figure 12, the resulting microstructure is tempered martensite containing numerous carbides with jagged edges. The maximum size observed for these carbides was approximately 20 µm in the analyzed sample. These changes in carbide morphology and size provide additional confirmation for the hypotheses presented in Section 3.1.1 concerning their nature and type (M7C3).
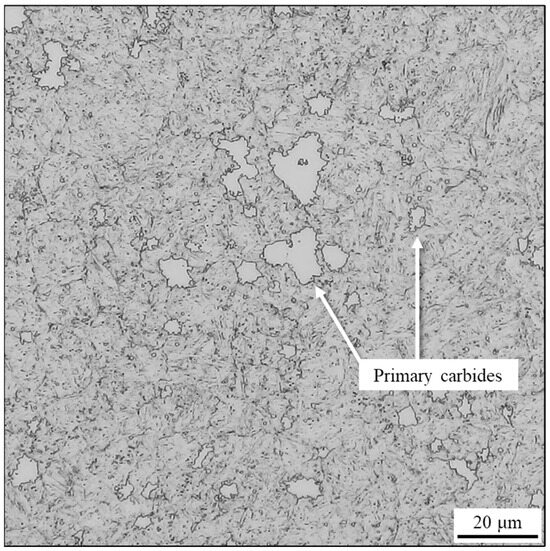
Figure 12.
Optical micrograph of the heat-treated AISI 440C sample’s cross-section, etched with Vilella reagent.
3.2.2. Potentiodynamic Polarization in H2SO4 0.5 M Solution
The potentiodynamic test in a 0.5 M H2SO4 solution on the sample’s cross-section was performed and the test result is shown in Figure 13. Similarly to Figure 6, the potentiodynamic curve in Figure 13 reveals an active electrochemical behavior.
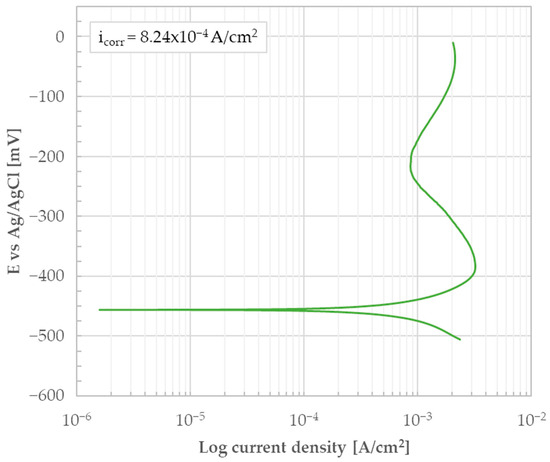
Figure 13.
Potentiodynamic polarization curve of the heat-treated AISI 440C sample’s bulk (i.e., the bare, oxide-free cross-section) in 0.5 M H2SO4.
icorr determined using Tafel lines was found to be 8.24 × 10⁻⁴ A/cm2 and the associated Ecorr was −456 V. Like the as-rolled material, the surface was completely covered with black corrosion products after the test. The results allow a comparison of the behavior of the bulk in H2SO4 for both the as-rolled and heat-treated conditions. In this regard, Figure 14 shows the overlay of the results presented in Figure 6 and Figure 13. The analysis of Figure 14 confirms that the material is characterized by an active behavior. The observed behavior aligns with the existing literature for the heat-treated state of this material [15]. Conversely, no comparable literature data could apparently be found for the as-rolled condition. This is likely because the material is industrially exclusively supplied in a heat-treated condition. From a production process perspective, maintaining the as-rolled condition is unfeasible due to the high risk of cracking caused by the internal stresses associated with the martensitic transformation, which occurs upon air cooling [2].
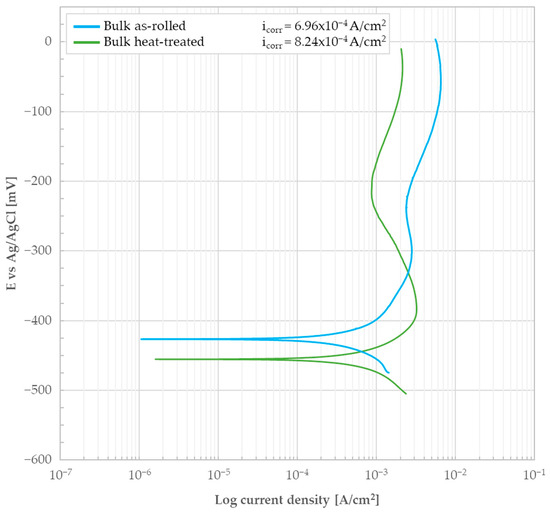
Figure 14.
Potentiodynamic polarization curve of the as-rolled and heat-treated AISI 440C samples bulk (i.e., the bare, oxide-free cross-section) in 0.5 M H2SO4.
The heat treatment was found to have no positive impact on the material’s corrosion resistance. The icorr value increased from 6.96 × 10⁻⁴ A/cm2 to 8.24 × 10⁻⁴ A/cm2 from the as-rolled to the heat-treated condition. Correspondingly, the Ecorr decreased slightly. This difference is not significant enough to state that the as-rolled material is superior to the heat-treated one. The small difference between the two conditions could be due to microstructural factors. The retained austenite present in the as-rolled sample may be responsible for the shift observed in Figure 14. The material’s passivity and corrosion resistance is dependent on the Cr content within the parent austenite and the ability of the post-treatment structure to retain the maximum possible Cr content in solid solution. Therefore, the obtained results could indicate that the corrosion resistance of the tempered martensite microstructure is compromised, possibly due to a Cr imbalance induced by microstructural transformations and solid-state diffusion of the element during the heat treatment process. The incomplete transformation of the parent austenite into martensite may therefore have influenced this condition. A complete transformation for this specific stainless steel grade is typically achieved only with cryogenic treatments that involve cooling to −96 °C [16]. These treatments, while technically feasible, are rarely employed in industrial settings and, as such, do not represent the material’s standard supply condition. In any case, when comparing the behavior of AISI 440C to that of the standard austenitic reference steel AISI 304 (EN 1.4301), the results indicate that the martensitic steel has inferior corrosion resistance in a 0.5 M H2SO4 solution. This is supported by the fact that the corrosion current density for austenitic stainless steel is typically lower, with reported values in the 1.4−1.5 × 10⁻⁴ A/cm2 range [17].
3.2.3. Potentiodynamic Polarization in 3.5 wt.% NaCl Solution
The bulk (i.e., the material’s bare, oxide-free cross-section) of the heat-treated material was subjected to potentiodynamic test in 3.5 wt.% NaCl solution. The test result is shown in Figure 15 together with the curve related to the external surface. In this context, the potential of the bulk is more noble, suggesting the possible presence of a passivation layer on the surface, a hypothesis also supported by the current density. However, with anodic polarization, an immediate increase in current is observed, indicating that any passivation layer is unstable and that the corrosion process is progressing rapidly. Additionally, observing the curve, small current peaks are noted that could indicate the beginning of pitting attack. However, a return to the lower current due to surface repassivation is not observed. Consequently, no obvious passive behavior can be said to have been detected; instead, the material exhibits an active response to the corrosive process. icorr determined using Tafel lines was found to be 4.18 × 10⁻⁷ A/cm2 and the associated Ecorr was −241 mV.
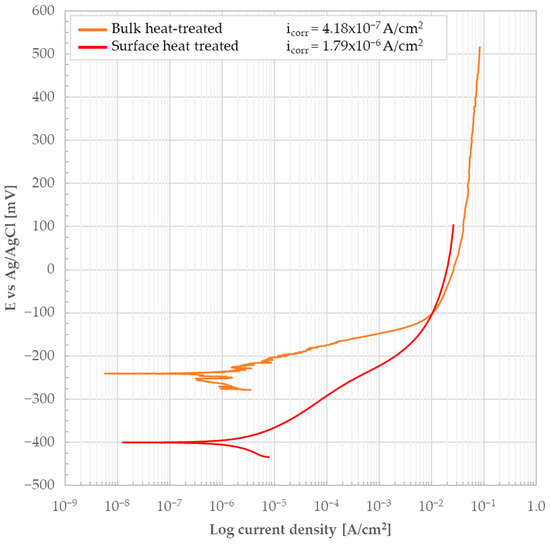
Figure 15.
Potentiodynamic polarization curve of the heat-treated 440C sample’s bulk (i.e., the bare, oxide-free cross-section) and external surface in 3.5 wt.% NaCl solution.
After the potentiodynamic polarization test, the cross-sectional surface of the heat-treated sample was completely covered with apparently porous corrosion products of moderate thickness, consisting mainly of Fe oxides. Some areas exhibited damage, including craters and cracks as shown in Figure 16a, displaying some corrosion products detached from the sample during drying, revealing the underlying substrate. This phenomenon is characteristic of corrosion products that exhibit poor adhesion and form in large quantities on the material’s surface. Figure 16a presents a view of the boundary region between the corrosion products and the substrate. This image distinctly reveals the grain boundaries of the underlying microstructure, previously highlighted in the optical micrography shown in Figure 12. A higher-magnification image of the boundary zone between the corrosion products and the substrate is shown in Figure 16b and reveals the presence of intergranular cracks. The morphology and distribution of the cracks presented in Figure 16b apparently do not suggest a link to the corrosion process. In fact, the crack morphology, with its sharp edges and a width of approximately 1 µm, suggests a separation of the crack flanks rather than selective intergranular corrosion.
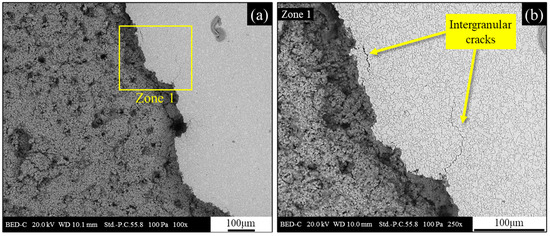
Figure 16.
Cross section of the heat-treated sample after potentiodynamic polarization in 3.5 wt.% NaCl solution; (a) backscattered electrons SEM micrograph with evidence of the boundary region between corrosion products and underlying substrate; (b) backscattered electrons SEM micrograph of zone 1.
This evidence allows for a correlation with residual stresses, possibly accumulated during the polishing process due to the combination of mechanical abrasion and rapid localized heating and subsequent cooling.
The lateral surface (i.e., oxide layer formed during heat treatment) was characterized by regions with distinct color variations. The original calamine layer was characterized by a dark gray color, adhesion and an almost glossy appearance. Following the heat treatment, the resulting surface oxide exhibited a distinct morphology: a light gray, opaque layer that appeared to have reduced adhesion. While the predominant surface layer appears to be an evolution of the original scale, the brown areas suggest the formation of different oxide compositions due to different oxidation states for Fe. These are likely secondary oxides that have grown in regions where the calamine was compromised or on top of the existing layer. A further analysis of the surface via electron microscopy is presented in Figure 17. Figure 17a shows areas where the oxide layer formed during the heat treatment process has detached, revealing the underlying substrate. A distinct pattern parallel to the rolling direction is clearly visible on the exposed substrate, as particularly evident in Figure 17b. The crystalline structure beneath the oxide layer formed after heat treatment likely corresponds to the original calamine formed during the hot rolling process. In fact, the pattern displayed in Figure 17b does not appear to represent the material’s microstructure, as the grains lack the typical elongation in the rolling direction. Their nearly equiaxed morphology is instead consistent with the orthogonal growth of a surface oxide from the underlying layer.
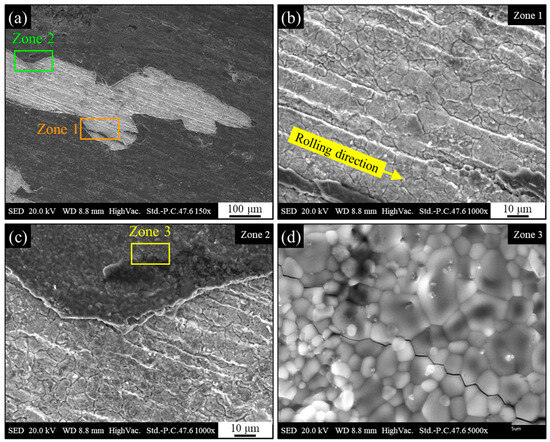
Figure 17.
Secondary electrons SEM micrograph of the heat-treated AISI 440C external surface (calamine) after heat treatment; (a) part of the surface where corrosion products have spalled; (b) zone 1 where corrosion products are detached, exposing the substrate; (c) zone 2 transition between substrate and corrosion products; (d) zone 3 with detail of the crystalline morphology of corrosion products and presence of intergranular cracking.
As highlighted in Figure 17c, at the interface between the oxide layer and the substrate the crystalline nature of the oxide formed during heat treatment is evident. Higher-magnification analysis in Figure 17d provides further confirmation of this crystalline nature, showing straight grain boundaries consistent with a ceramic material. The presence of intergranular cracks is also observed within the oxide layer.
The sample of the heat-treated material was then subjected to potentiodynamic test in 3.5 wt.% NaCl solution to evaluate the consequences on the lateral surface (i.e., oxide layer formed during heat treatment). The test result is shown by the red curve in Figure 15. No obvious passive behavior was detected and the material exhibits an active response to the corrosive process. icorr was determined using Tafel lines and its value was found to be 1.79 × 10⁻⁶ A/cm2 and the associated Ecorr was −400 mV. A comparison between the curves for the bulk and the external surface in Figure 15 highlights the non-protective nature of the oxide layer present on the external surface. This finding is markedly different from the hypothesized shielding behavior observed with calamine in Figure 7. The oxide produced by the evolution of calamine during heat treatment is definitely non-protective, as evidenced by its higher icorr value (4.18 × 10⁻⁷ A/cm2 compared to 1.79 × 10⁻⁶ A/cm2 for the heat-treated bulk). Furthermore, Ecorr is more negative (−400 mV compared to −241 mV), further indicating its worst performance in the corrosive environment of the test.
The seemingly less compact and more porous appearance of the oxide formed on the surface after heat treatment confirms its poorer performance in corrosive environments. This is supported by the potentiodynamic test results and highlights how post-heat treatment exposure of the material to the external environment can severely compromise the surface of the semi-finished product (Figure 18a).
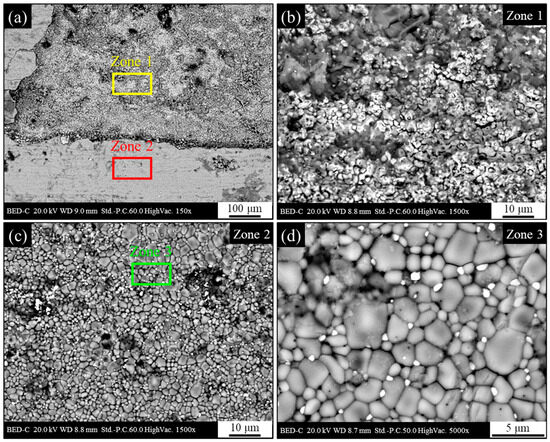
Figure 18.
Backscattered electrons SEM micrograph of the heat-treated AISI 440C external surface after potentiodynamic polarization in 3.5 wt.% NaCl solution; (a) part of the surface where corrosion products have spalled; (b) zone 1 where corrosion products have spalled away, exposing the underlying layer; (c) zone 2 corrosion products; (d) zone 3 with detail of the crystalline morphology of corrosion products.
As shown in Figure 18b, the exposed substrate surface in regions where the oxide formed during heat treatment was removed during the potentiodynamic test is jagged and with apparently high roughness. This morphology appears to be associated with an abundance of non-adherent corrosion products. The surface composition in regions where the oxide was removed suggests an oxidized ferrous matrix containing localized Cr, similar to the findings shown in Figure 10. When compared to Figure 17, the surface with non-detached oxide (Figure 18c) seemed to have maintained its original morphology. However, a closer examination of the grain structure (Figure 18d) revealed that the grain boundaries were less defined and more separated, and there was a more significant presence of intergranular cracks. This last finding could indicate that the observed alteration of the oxide is not primarily due to the electrochemical process of the test, but rather to the typically destabilizing action of chloride ions present in the solution. In fact, analogous to the effect on the passive layer of stainless steels, the presence of chloride could have made the oxide layer less stable and thus more prone to deterioration.
3.3. Summary and Comparison of the Results
The experimental testing campaign produced a significant amount of data for material characterization, aligning with the requirements outlined in Section 1 and Section 2. Table 3 provides a summary of the quantitative results for each of the conditions tested.

Table 3.
Summary of the results of the potentiodynamic testing campaign.
With regard to the material’s performance in potentiodynamic polarization in 0.5 M H2SO4 solution test, Figure 14 highlighted differences between the as-rolled and heat-treated conditions. Tests revealed that AISI 440C fails to achieve stable passivity. Contrary to expectations, heat treatment did not improve corrosion resistance; in fact, it slightly increased the icorr value. This behavior was hypothesized to be likely due to microstructural factors related to the presence retained austenite in the as-rolled sample to the tempered martensite, whose different behavior may stem from a Cr imbalance caused by diffusion during the heat treatment process. In any case, the difference between the conditions is not substantial enough to demonstrate a clear and unambiguous change in behavior.
Potentiodynamic tests conducted in 3.5 wt.% NaCl solution revealed that the material consistently exhibits active behavior. As evidenced by the curves in Figure 7 and Figure 15, a passive region is not discernible at any potential value within the tested range.
The steel studied is definitively not suitable for applications in Cl-rich environments, such as marine settings, regardless of its as-rolled or heat-treated condition. This finding is supported by the results of the potentiodynamic curves, as well as by the corrosion products observed on the surface after testing for both the as-rolled and heat-treated conditions (thick, poorly adherent, porous, and brittle layer of corrosion products, composed primarily of Fe oxides). The material exhibited generalized corrosion, a result entirely analogous to that observed in carbon steels. Such behavior is incompatible with the demands of a marine environment, where materials must exhibit superior performance and minimize the onset of surface corrosion. As a result, AISI 440C is typically employed in non-marine applications requiring high wear resistance, such as in ball bearings, rather than high corrosion resistance [2,16].
The analysis of the response of the external surface of the cylindrical samples also highlighted some interesting findings. Both calamine (i.e., mill scale) and the oxide formed after heat treatment were tested in 3.5 wt.% NaCl solution. The heat treatment exposed the pre-existing calamine to a high-temperature oxidizing atmosphere within the TGA furnace. While mill scale is industrially recognized as an adherent oxide with sometimes attributed protective properties, its behavior under the specific test conditions was notably different, as it did not provide a protective barrier. Specifically, the mill scale exhibited a higher icorr than the bulk. Calamine was found to be ineffective in preventing corrosion, failing to offer protection comparable to that of a passive.
The heat treatment performed on the material in an uncontrolled (oxidizing) atmosphere resulted in significant alterations to the surface layer, which primarily manifested as a change in its visual appearance. The results from the potentiodynamic polarization tests in NaCl solution (Figure 15) clearly indicate that the new surface condition of the material is not protective. Consequently, it is believed that the oxide formed during heat treatment provides no protective properties against corrosion in humid, and especially chloride-containing, environments. Instead, its characteristics suggest that it actively participates in the corrosion process.
Consequently, the industrial practice of indoor storage for heat-treated material can mitigate the onset of surface corrosion. However, minimizing the time between heat treatment and pickling is clearly beneficial, as it reduces the risk of additional corrosion product formation on the surface, which would increase deposits in the pickling baths. In this context, considering the composition of the surface corrosion products (Fe-based with traces of Cr), the management of pickling sludge must be handled accordingly. This is also important to consider when other types of martensitic stainless steels are processed in the same baths.
4. Conclusions
The corrosion behavior of high-carbon martensitic stainless steel was characterized using potentiodynamic polarization. After the initial microstructural characterization, the results were analyzed by examining the potentiodynamic curves, evaluating the corrosion current (icorr) and potential (Ecorr), and performing a microscopic analysis of the material’s surface. Based on these findings and in relation to the purpose of this work, the following conclusions can be drawn:
- Tests in H2SO4 revealed that AISI 440C steel lacks stable passive behavior in all tested conditions.
- Tests on the bulk in a 3.5 wt.% NaCl solution showed active behavior in both conditions. However, a slight improvement, was observed for the heat-treated condition.
- The corrosion products formed on the bare surface of the bulk following the NaCl tests were consistently thick, porous, brittle, and had low adhesion. This suggests that in humid environments, particularly in the presence of chlorides, the material may be susceptible to generalized corrosion.
- The mill scale (i.e., calamine) formed during the hot-rolling process exhibits no protective properties in either NaCl or an oxidizing atmosphere. However, its presence appears to promote a shielding action against the corrosive process.
- The exposure of the oxide formed after heat treatment and grown on calamine to a 3.5 wt.% NaCl solution during the potentiodynamic test highlights its inferior corrosion behavior compared to all the other conditions tested.
- The results confirm that storage of this steel grade in humid environments, particularly those containing chlorides, must be limited.
- For AISI 440C, the corrosion products that pickling must remove are mainly Fe oxides, with possible minimal Cr contamination.
Author Contributions
Conceptualization, A.M.; methodology, A.M., S.R. and C.M.; validation, A.M., S.R. and C.M.; formal analysis, A.M.; investigation, A.M.; resources, S.R. and C.M.; data curation, A.M.; writing—original draft preparation, A.M.; writing—review and editing, A.M.; supervision, S.R. and C.M. All authors have read and agreed to the published version of the manuscript.
Funding
This research received no external funding.
Data Availability Statement
The original contributions presented in this study are included in the article material. Further inquiries can be directed to the corresponding author.
Acknowledgments
The authors would like to acknowledge the exceptional support and cooperation provided by Luca Benedetti, Department of Industrial Engineering, University of Trento.
Conflicts of Interest
The authors declare no conflicts of interest.
Abbreviations
The following abbreviations are used in this manuscript:
| BSE | Backscattered electrons |
| DC | Direct current |
| EDXS | Energy-dispersive X-ray spectroscopy |
| EN | EuroNorm |
| GB | Grain boundary |
| PH | Precipitation-hardening |
| Q + T | Quenched and tempered |
| SE | Secondary electrons |
| SHE | Standard hydrogen electrode |
| TGA | Thermogravimetric analysis |
References
- ASM International. ASM Handbook Volume 1-Properties and Selection: Irons, Steels and High Performance Alloys; ASM International: Materials Park, OH, USA, 1990. [Google Scholar] [CrossRef]
- Malandruccolo, A. Superaustenitic Stainless Steels: A Comprehensive Overview; Springer: Cham, Switzerland, 2024. [Google Scholar] [CrossRef]
- Groover, M.P. Fundamentals of Modern Manufacturing-Materials, Processes and Systems, 7th ed.; Wiley: Hoboken, NJ, USA, 2019. [Google Scholar]
- Li, L.; Celis, J. Pickling of Austenitic Stainless Steels (a Review). Can. J. Metall. Mater. Sci. 2003, 42, 365–376. [Google Scholar] [CrossRef]
- Rögener, F.; Sartor, M.; Bán, A.; Buchloh, D.; Reichardt, T. Metal Recovery from spent Stainless Steel Pickling Solutions. Resour. Conserv. Recycl. 2012, 60, 72–77. [Google Scholar] [CrossRef]
- Yi, Y.; Cho, P.; Al Zaabi, A.; Addad, Y.; Jang, C. Potentiodynamic Polarization Behaviour of AISI type 316 Stainless Steel in NaCl Solution. Corros. Sci. 2013, 74, 92–97. [Google Scholar] [CrossRef]
- Li, H.-X.; Li, D.-P.; Zhang, L.; Wang, Y.-W.; Wang, X.-Y.; Lu, M.-X. Passivity Breakdown of 13Cr Stainless Steel under High Chlorine and CO2 Environment. Int. J. Miner. Metall. Mater. 2019, 26, 329–336. [Google Scholar] [CrossRef]
- Yang, J.; Yu, T.; Wang, C. Martensitic Transformations in AISI 440C Stainless Steel. Mater. Sci. Eng. A 2006, 438–440, 276–280. [Google Scholar] [CrossRef]
- McGuire, M.F. Stainless Steels for Design Engineers; ASM International: Materials Park, OH, USA, 2008. [Google Scholar]
- Totten, G.E. Steel Heat Treatment–Metallurgy and Technologies, 2nd ed.; CRC Press: Boca Raton, FL, USA, 2007. [Google Scholar]
- ASM International. ASM Handbook Volume 9-Metallography and Microstructures; ASM International: Materials Park, OH, USA, 2004. [Google Scholar]
- Straffelini, G. Ductility and Formability of Metals—A Metallurgical Engineering Perspective; Academic Press: Cambridge, MA, USA, 2023. [Google Scholar]
- Ernst, F.; Li, D.; Kahn, H.; Michal, G.M.; Heuer, A.H. The Carbide M7C3 in Low-temperature-carburized Austenitic Stainless Steel. Acta Mater. 2011, 59, 2268–2276. [Google Scholar] [CrossRef]
- Cabrini, M.; Lorenzi, S.; Pastore, T.; Bucella, D.P. Effect of Hot Mill Scale on Hydrogen Embrittlement of High Strength Steels for Pre-Stressed Concrete Structures. Metals 2018, 8, 158. [Google Scholar] [CrossRef]
- Walzak, T.L.; Sheasby, J.S. Effect of Heat Treatment Parameters on the Anodic Polarization Behavior of 440C Stainless Steel. Corrosion 1983, 39, 502–507. [Google Scholar] [CrossRef]
- Gialanella, S.; Malandruccolo, A. Aerospace Alloys; Springer: Berlin/Heidelberg, Germany, 2020; pp. 237–245. [Google Scholar]
- Yen, C.C.; Tsai, T.L.; Wu, B.W.; Lo, Y.C.; Tsai, M.H.; Yen, S.K. Dynamic Polarization Behaviors of Equimolar CoCrFeNi High-Entropy Alloy Compared with 304 Stainless Steel in 0.5 M H2SO4 Aerated Aqueous Solution. Materials 2022, 15, 6976. [Google Scholar] [CrossRef]
Disclaimer/Publisher’s Note: The statements, opinions and data contained in all publications are solely those of the individual author(s) and contributor(s) and not of MDPI and/or the editor(s). MDPI and/or the editor(s) disclaim responsibility for any injury to people or property resulting from any ideas, methods, instructions or products referred to in the content. |
© 2025 by the authors. Licensee MDPI, Basel, Switzerland. This article is an open access article distributed under the terms and conditions of the Creative Commons Attribution (CC BY) license (https://creativecommons.org/licenses/by/4.0/).