Article

Predictive Modeling of Shear Strength for Lotus-Type Porous Copper Bonded to Alumina

1
Department of Materials Science and Engineering, Inha University, Incheon 22212, Republic of Korea
2
R&D Center, Lotus Materials Co., Ltd., Incheon 22212, Republic of Korea
3
Department of Manufacturing Innovation School, Inha University, Incheon 21999, Republic of Korea
4
Department of Electronic Materials Engineering, Hoseo University, Asan 31499, Republic of Korea
*
Authors to whom correspondence should be addressed.
Metals 2025, 15(10), 1103; https://doi.org/10.3390/met15101103
Submission received: 3 September 2025 / Revised: 26 September 2025 / Accepted: 28 September 2025 / Published: 3 October 2025
(This article belongs to the Special Issue Fracture Mechanics of Metallic Materials—the State of the Art)

Abstract

This study investigates the shear strength of lotus-type unidirectional porous copper bonded to alumina substrates using the Direct Bonded Copper (DBC) process. Porous copper specimens with various porosities (38.7–50.9%) and pore sizes (150–800 μm) were fabricated and joined to alumina discs. Shear testing revealed that both porosity and pore size significantly affect the interfacial strength. While higher porosity led to reduced shear strength, larger pore sizes enhanced the maximum shear strength owing to increased local contact areas and crack coalescence in the alumina substrate. Fractographic analysis using optical microscopy and SEM-EDS confirmed that failure mainly occurred in the alumina, with local fracture associated with pore distribution and size. To improve strength prediction, a modified model was proposed, reducing the error from 12.3% to 7.5% and increasing the coefficient of determination (R2) from 0.43 to 0.74. These findings highlight the necessity of considering both porosity and pore size when predicting the shear strength of porous copper/alumina DBC joints, and they provide important insights for optimizing metal structures in metal–ceramic bonding for high-performance applications.

1. Introduction

Direct bonding of metals and ceramics offers the advantage of combining high thermal and electrical conductivity with mechanical stability, making it widely utilized in power electronics packaging and structural applications [1,2]. Among various metal–ceramic systems, the copper–alumina interface has attracted particular attention due to the excellent thermal conductivity of copper and the high fracture strength of alumina [3,4]. However, the mechanical performance of such bonded systems is often limited by the presence of defects, such as stress concentrations at the interface and porosity within the metallic phase [5,6,7].
Porous metals have been extensively studied due to their lightweight nature and enhanced mechanical energy absorption characteristics [8,9,10]. Previous studies on porous metals have primarily focused on bulk tensile or compressive loading, where the overall porosity significantly affects the effective cross-sectional area, while pore size is generally considered a secondary factor [11,12]. Similarly, the strength of porous ceramics is largely governed by porosity rather than pore morphology [13,14]. Despite these insights, investigations on the shear strength of metal–ceramic joints containing porous metals remain limited, highlighting the need for predictive models that account for both porosity and pore size.
In this study, unidirectional lotus-type porous copper was bonded to alumina substrates using a modified direct bonded copper (DBC) process. In particular, lotus-type porous copper was selected in this study because its unidirectional pore channels differ from randomly distributed open pore found in conventional porous metals. Unlike conventional porous metals with randomly distributed open pores, which generally exhibit weak mechanical support, lotus-type porous copper possesses aligned pores that provide enhanced strength along the pore direction. This anisotropic reinforcement is particularly advantageous in vertically stacked power semiconductor modules, where strong out-of-plane support is required in addition to thermal conduction [15]. The aligned pores can maintain effective thermal conduction pathways along the longitudinal direction while simultaneously influencing stress distribution and crack propagation at the metal–ceramic interface [16,17,18]. Such unique characteristics make lotus-type porous copper a promising candidate for enhancing both the thermal management and mechanical reliability of power electronic substrates [19].
The observed dependence of shear strength on pore size has direct implications for power electronic packaging [20,21,22]. In practical modules, local stress concentrations and interfacial fracture often govern device reliability [23,24,25]. By tuning the pore architecture of copper, it becomes possible to control crack initiation and improve bonding strength, thereby optimizing both electrical/thermal performance and long-term durability of power modules.
The shear strength of the bonded specimens was systematically evaluated as a function of both pore size and porosity. Fractographic analysis revealed that both porosity and pore size act as independent variables influencing interfacial and bulk fracture behavior. Therefore, this work aims to provide a comprehensive understanding of the mechanical behavior of lotus-type porous copper/alumina DBC joints and to establish an empirical model for predicting shear strength based on porosity and pore size. These findings are expected to contribute to the reliable design of metal–ceramic interfaces for high-performance applications.
While the present work focuses on monotonic shear testing, future studies should address reliability issues under service-like conditions. In particular, thermal cycling and long-term mechanical loading are expected to significantly influence interfacial degradation in porous copper to alumina joints. Extending the current model to account for such factors would provide further insights into the durability of metal–ceramic interfaces for high-performance applications.

2. Materials and Methods

2.1. Preparation of Materials

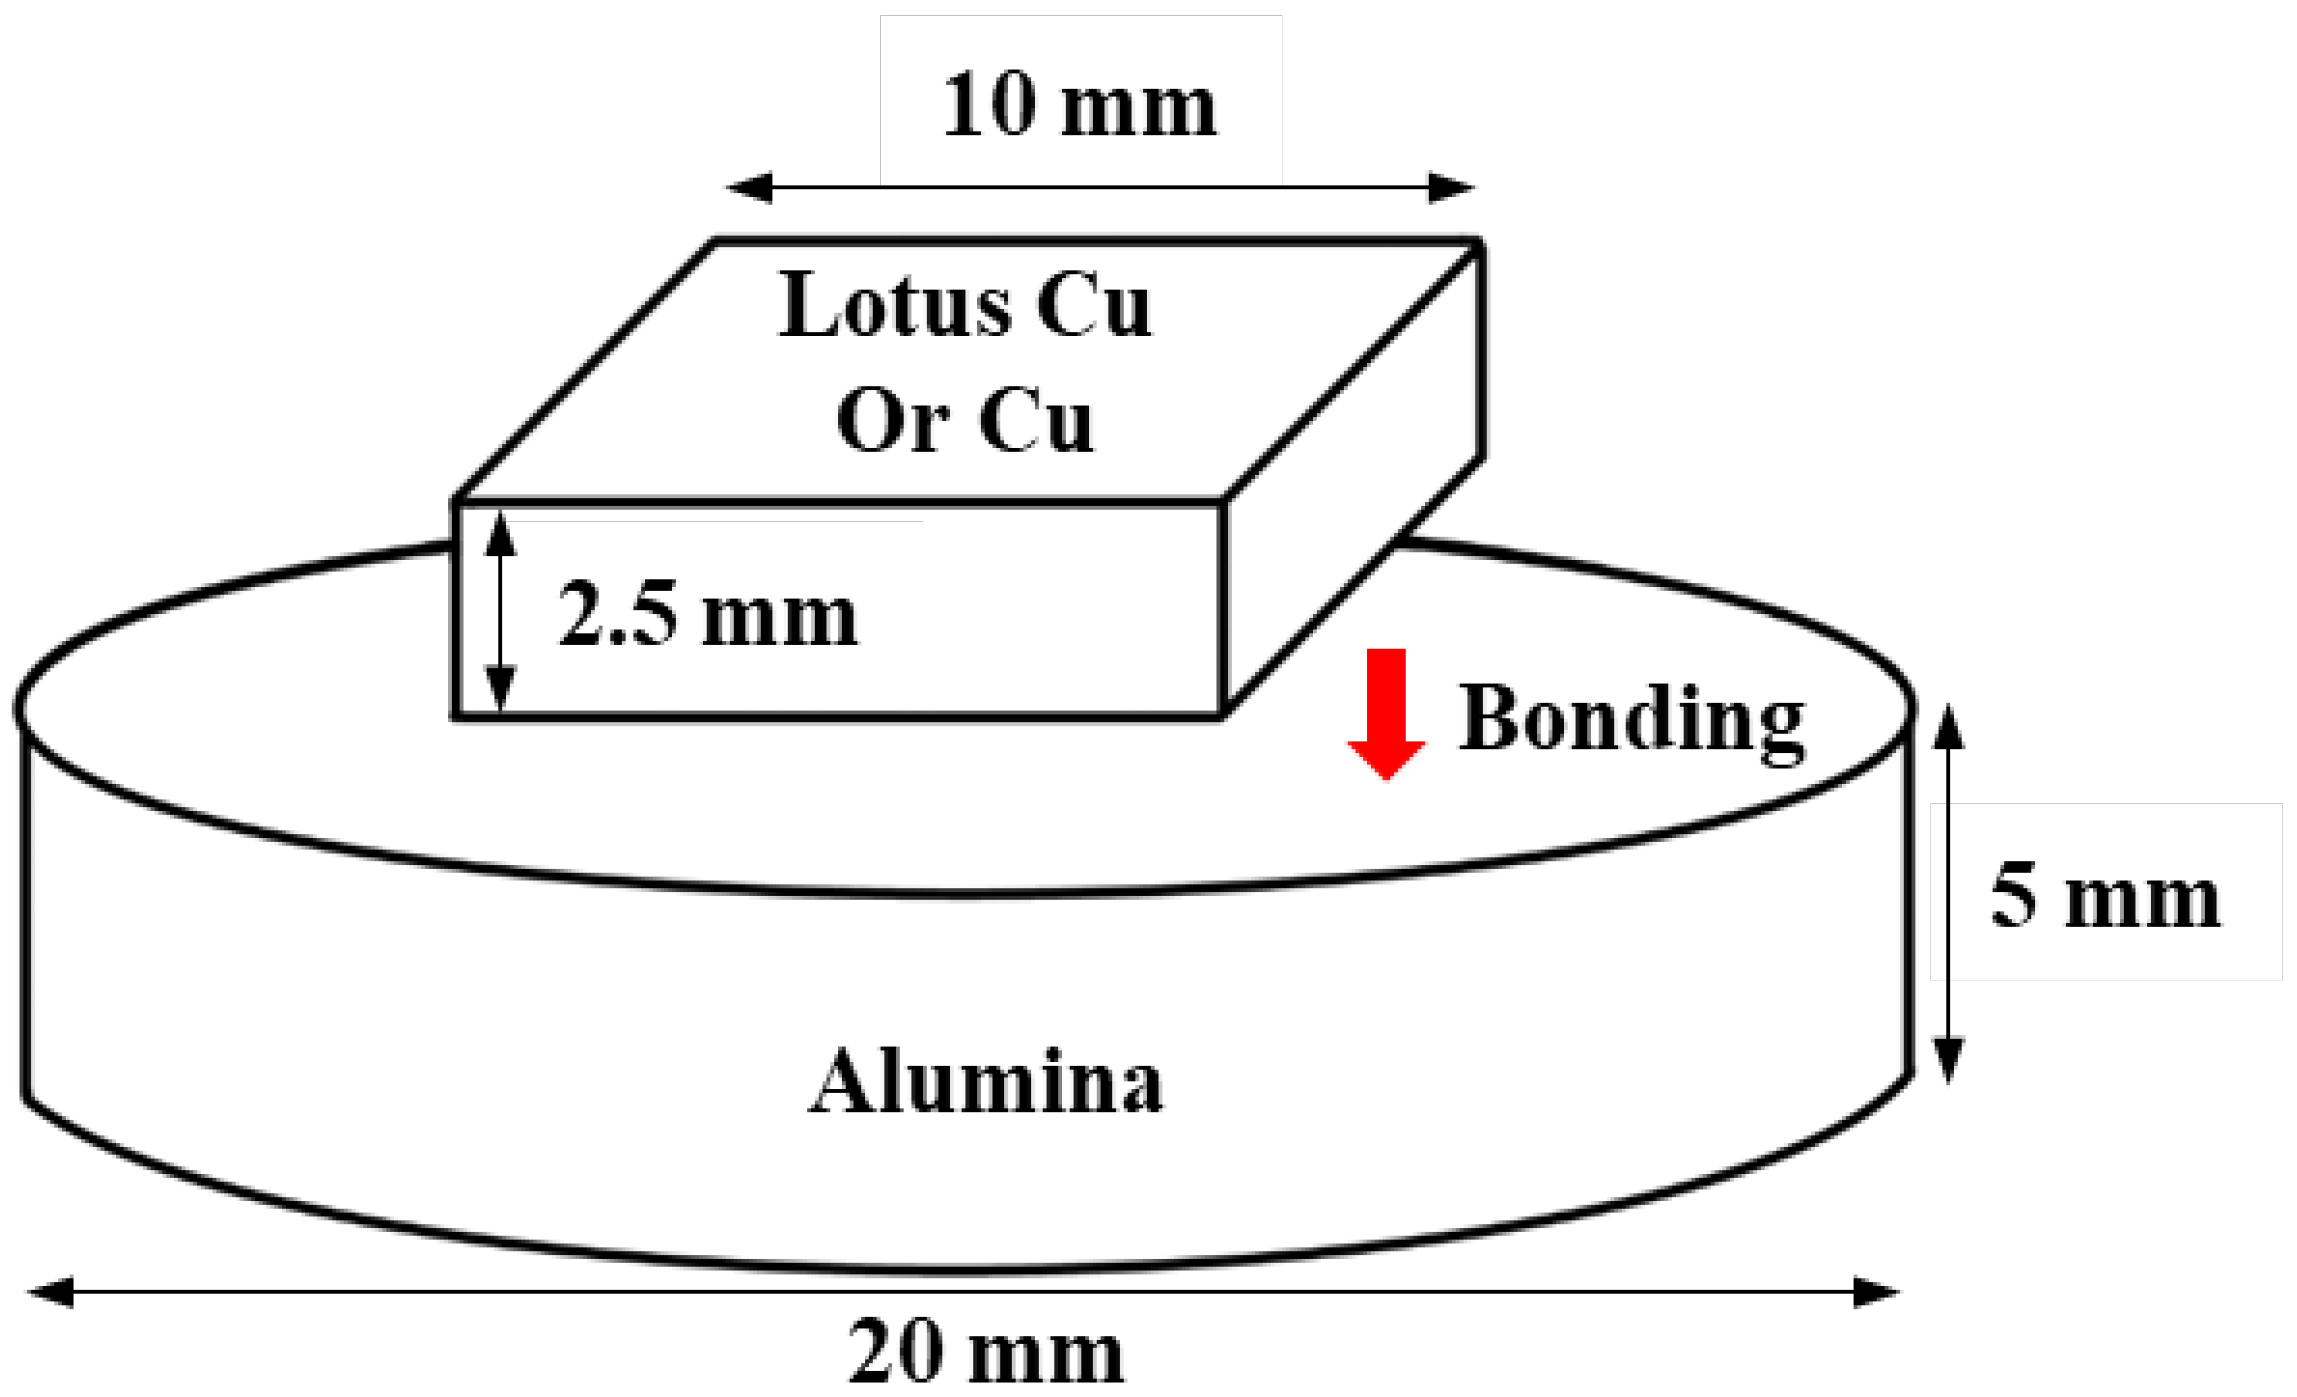
In this study, two types of bonding con urations were investigated, consisting of high-purity bulk polycrystalline alumina (99.7%) ceramic substrates joined with either oxygen-free high-conductivity (OFHC) copper foil or unidirectionally porous copper (hereafter referred to as lotus copper). Prior to bonding, the alumina substrates were annealed at 1000 °C for 30 min under high vacuum (1.0 × 10⁻⁵ torr), followed by furnace cooling. The alumina specimens were fabricated in the form of discs with a diameter of 20 mm and a thickness of 5 mm, while the copper foil and lotus copper were machined into square plates of 10 mm × 10 mm × 2.5 mm.
Lotus copper was produced from electrolytic copper (99.99% purity) by a continuous casting process under a hydrogen–nitrogen atmosphere, resulting in the formation of elongated cylindrical pores aligned with the solidification direction. The as-cast ingots (30 mm × 40 mm × 200 mm) were sectioned by electrical discharge machining (EDM, Robofil 4000, Charmilles Technologies, Lincolnshire, IL, USA) such that the pore alignment was oriented perpendicular to the specimen cross-section. The typical morphology of lotus copper, showing well-aligned unidirectional pores, is presented in Figure 1.
The porosity p of lotus copper was calculated using the following relation:
p = ( 1 ρ / ρ 0 ) × 100 ( % )
where ρ is the density of the lotus copper and ρ 0 is the density of copper foil. Density was measured via Archimedes’ principle. The average pore diameter and length were measured using optical microscopy (OM, VHX-7000, Keyence, Osaka, Japan). Lotus copper specimens used in the DBC bonding process exhibited porosities ranging from 38.7% to 50.9% and average pore diameters between 150 μm and 800 μm. Detailed dimensions and porosity of each specimen are summarized in Table 1.
Prior to bonding, all copper surfaces were carefully treated to ensure consistent wettability and minimize contamination. The surfaces were first mechanically polished using 600-grit sandpaper, followed by chemical pickling in a nitric acid and ethanol solution mixed at a volume ratio of 1:3. After pickling, ultrasonic cleaning was performed in ethanol for 10 min. Although mechanical polishing is generally the most effective and reliable method for removing the oxide layer on copper, it has inherent structural limitations when applied to porous copper, as the oxide films located within the pores cannot be eliminated. To address this issue, a chemical etching process was introduced to achieve more thorough removal of the oxide layer. Finally, the prepared copper plates (either lotus copper or copper foil) were bonded to the alumina discs using the direct bonded copper (DBC) process, as schematically illustrated in Figure 2.

2.2. DBC Process and Experimental Design

A new integrated bonding process was designed to join lotus-type porous copper to alumina. The conventional DBC process consists of two main steps [26]. First, an oxide layer is formed on the copper foil surface by annealing under conditions that promote Cu2O formation. The thickness of this oxide layer must be precisely controlled, as it strongly affects the bonding quality, with an optimal range of 4–10 μm for achieving the highest shear strength [27]. Oxygen is incorporated into the copper surface through the formation of a Cu2O oxide layer, leading to the establishment of a Cu–O binary eutectic point [28]. The eutectic lowers the melting temperature, and during the heating of copper, a Cu–O eutectic liquid is formed between 1065 °C and 1083 °C. This liquid phase promotes interfacial wetting and chemical bonding with alumina, thereby facilitating the joining process.
For lotus copper, an integrated DBC process was applied, allowing simultaneous surface oxidation and bonding. The bonding was conducted at 1070 °C under a pressure of 3.0 × 10⁻¹ torr. During heating, a thin oxide layer developed on the lotus copper surface, while a transient liquid phase formed at the interface, thereby facilitating bonding. The heating rate was controlled at 8 °C/min. After holding at 1070 °C for 10 min, the bonded specimens were subjected to an additional dwell at 1000 °C for 30 min, followed by furnace cooling. All bonding experiments were performed in a high-purity alumina tube furnace to ensure uniform thermal and atmospheric conditions.

2.3. Shear Strength Test and Characterization

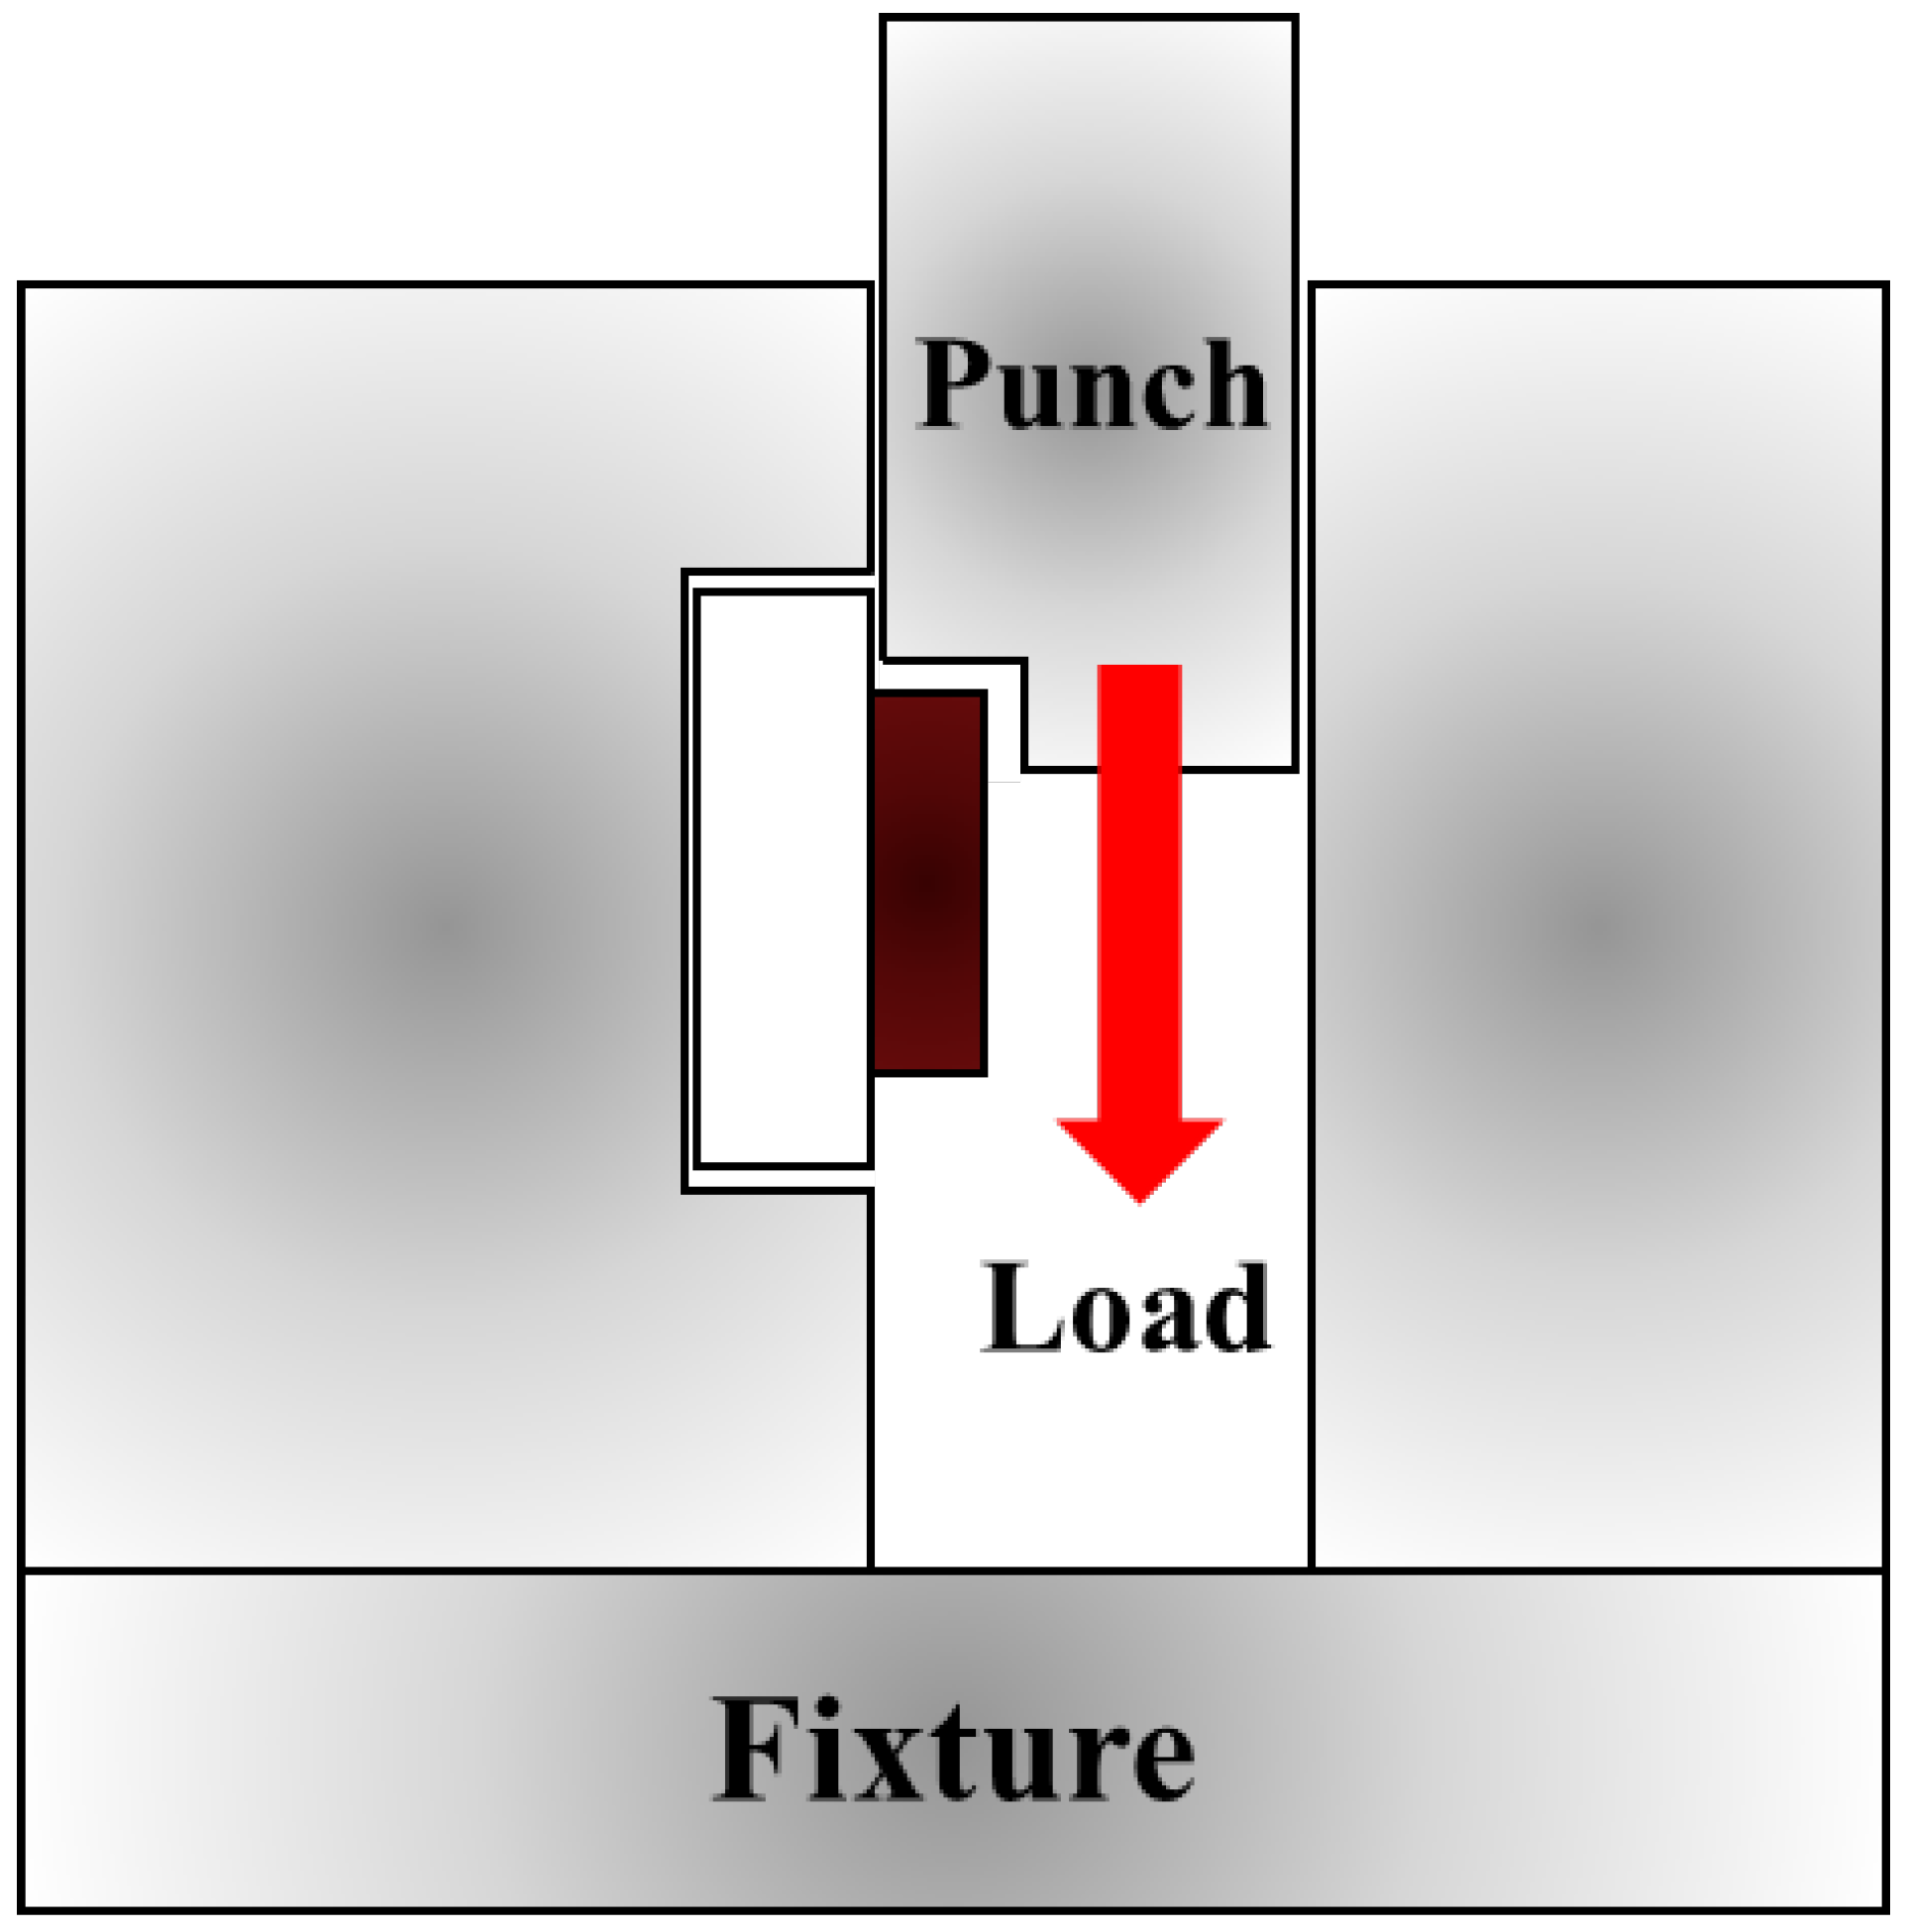
The bonding strength of the joints was evaluated by shear testing. The alumina substrates were fixed in a custom-designed jig, and load was applied on the copper side until complete separation of the joint occurred. For each porosity condition of lotus copper, five specimens were tested.
The tests were performed using a universal testing machine (AGS-X, Shimadzu, Kyoto, Japan) operated at a constant crosshead speed of 1 mm/min. The maximum load at fracture was recorded, and shear strength was determined by dividing this load by the apparent bonded area (100 mm2). All specimen dimensions and strength data are consistently reported in millimeters (mm) and megapascals (MPa). A schematic of the shear test configuration is shown in Figure 3.

3. Results and Discussion

3.1. Shear Strength Test

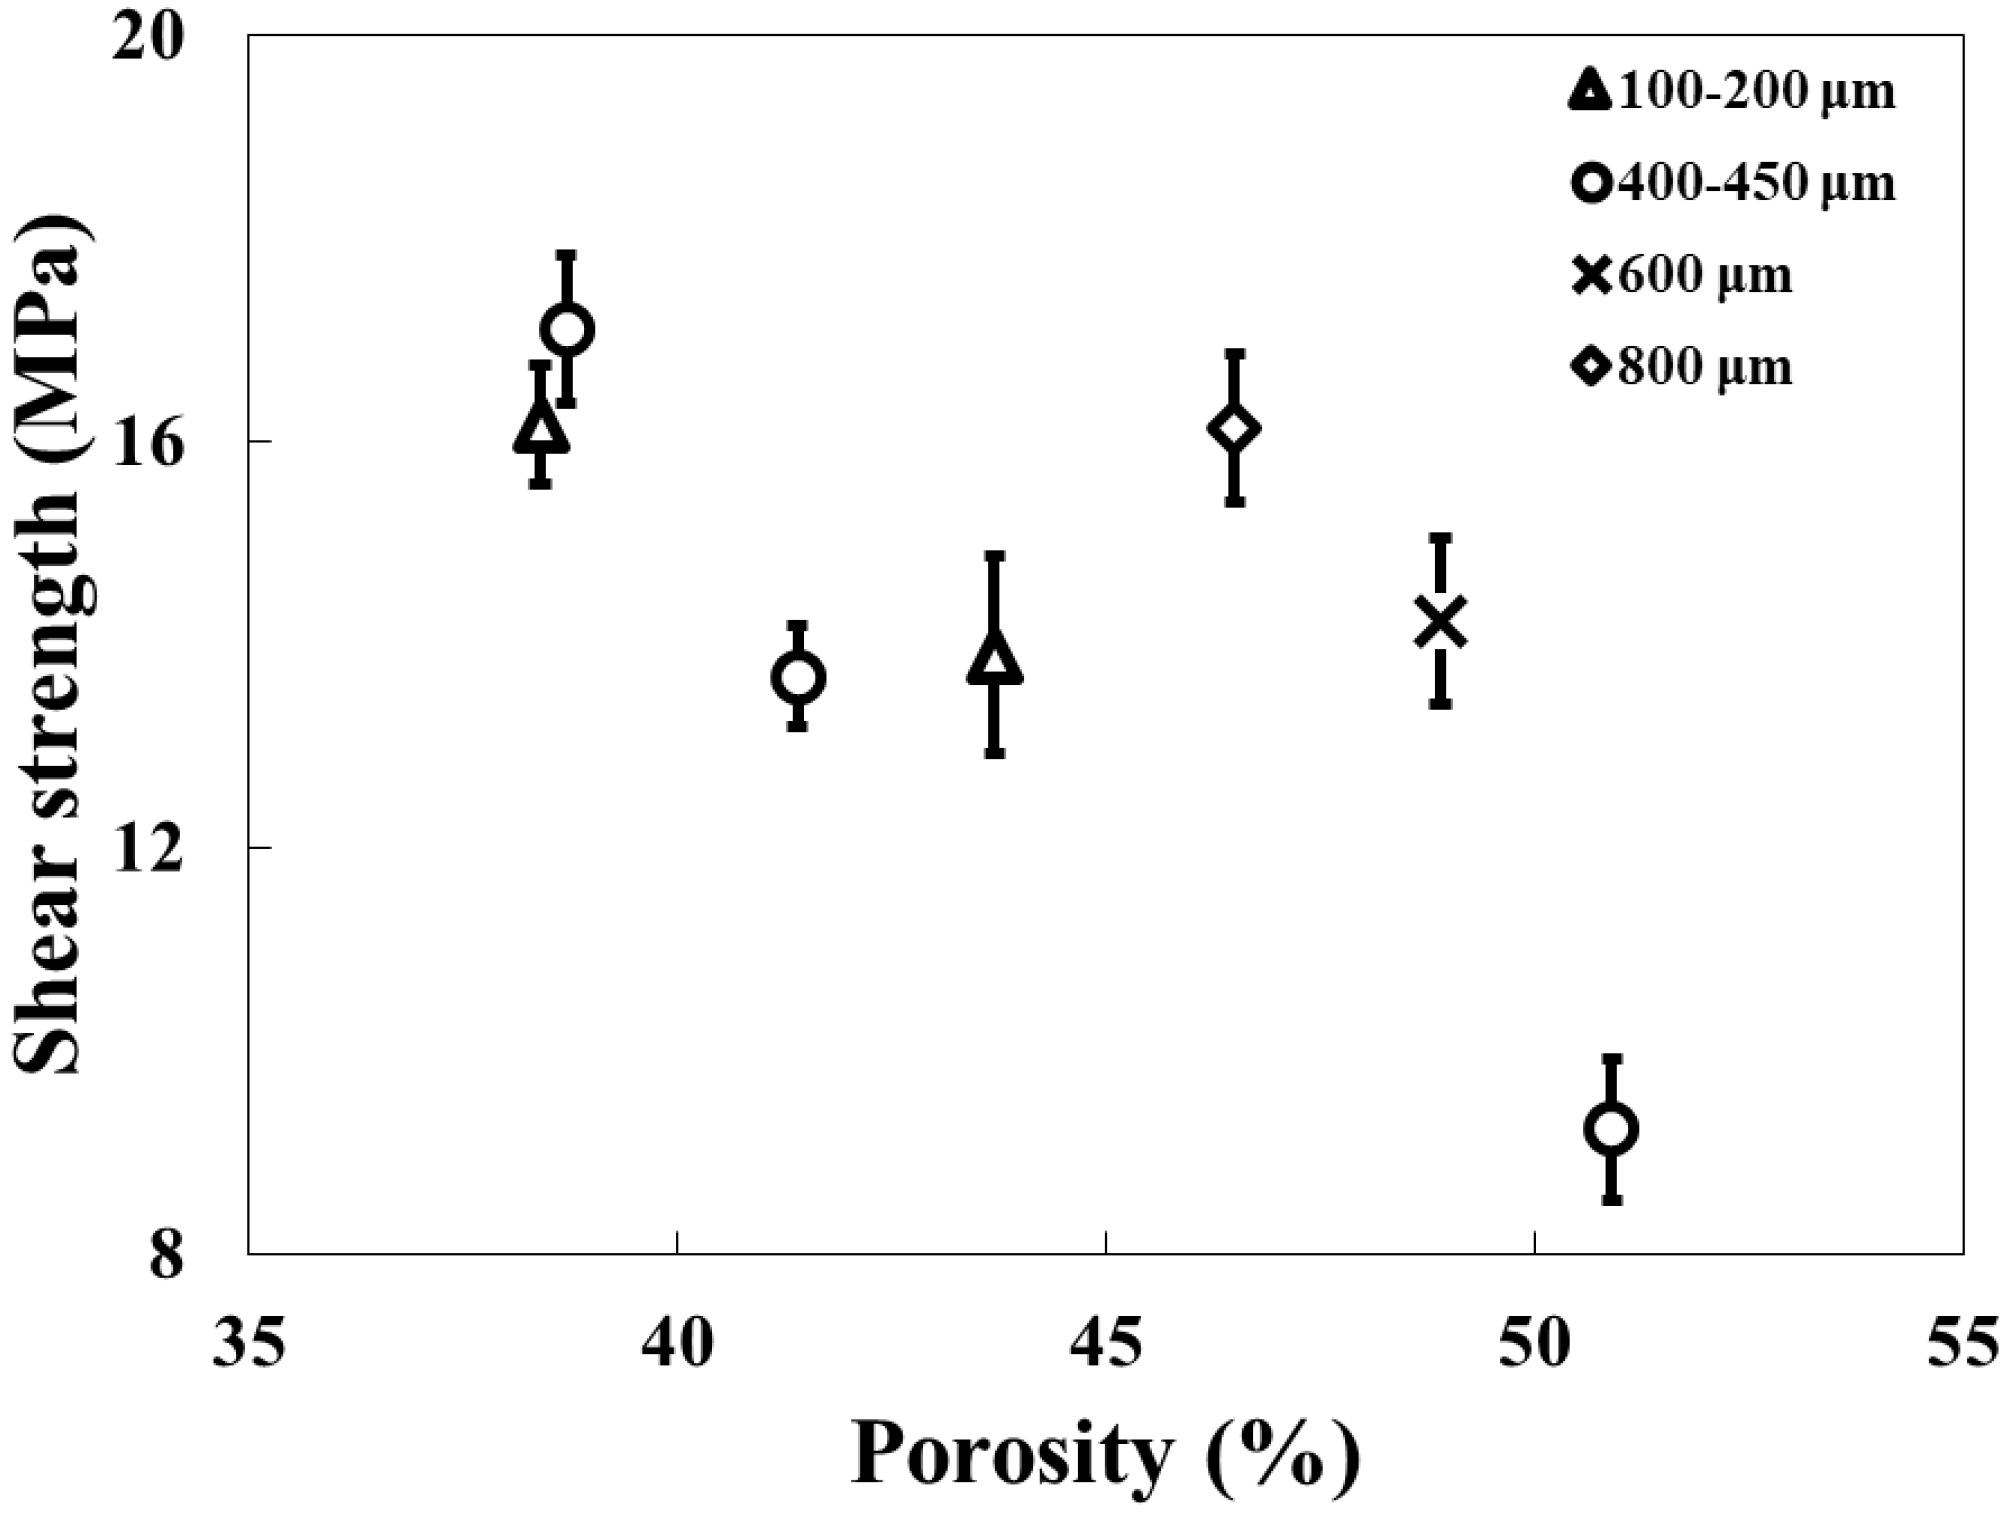
Figure 4 shows the shear strength of DBC specimens in which lotus-type porous copper with various porosities and pore sizes was bonded to alumina. For specimens with small pore diameters (150–400 μm), shear strength decreased as porosity increased. Specifically, reducing porosity from 50% to 35% increased shear strength from 8 MPa to 20 MPa. Specimens with larger pore diameters (600–800 μm) exhibited higher shear strength than smaller-pore specimens, with the 600 μm specimen showing approximately 4 MPa higher strength than the 400 μm specimen. These results indicate that shear strength of porous copper bonded to a ceramic substrate is influenced by two independent variables: porosity and pore size.
To provide a mechanistic understanding of the observed shear strength dependence on pore size, the Griffith fracture model was applied to the porous copper/alumina DBC joints [29]. According to the Griffith criterion, the critical stress for crack initiation (σ) is inversely proportional to the square root of the initial defect size a:
σ c = 2 E γ / π a
where E is the elastic modulus, γ is the surface energy, and a represents the effective flaw length, which, in this study, is approximated by the pore diameter.
For specimens with small pores (150 μm), the effective flaw size is minimal, leading to localized stress concentrations and rapid crack coalescence within the alumina substrate, thereby resulting in relatively low shear strength. In the 400 μm specimens, the larger pore size allows slight redistribution of stress around the pores, moderately increasing the resistance to crack initiation. For the 600 μm and 800 μm pores, the Griffith model predicts a further increase in σ c due to the broader stress redistribution and larger contact areas at the metal–ceramic interface. In these cases, the aligned pore channels facilitate both enhanced interfacial wetting during the DBC process and more gradual crack propagation, which together contribute to higher measured shear strength.
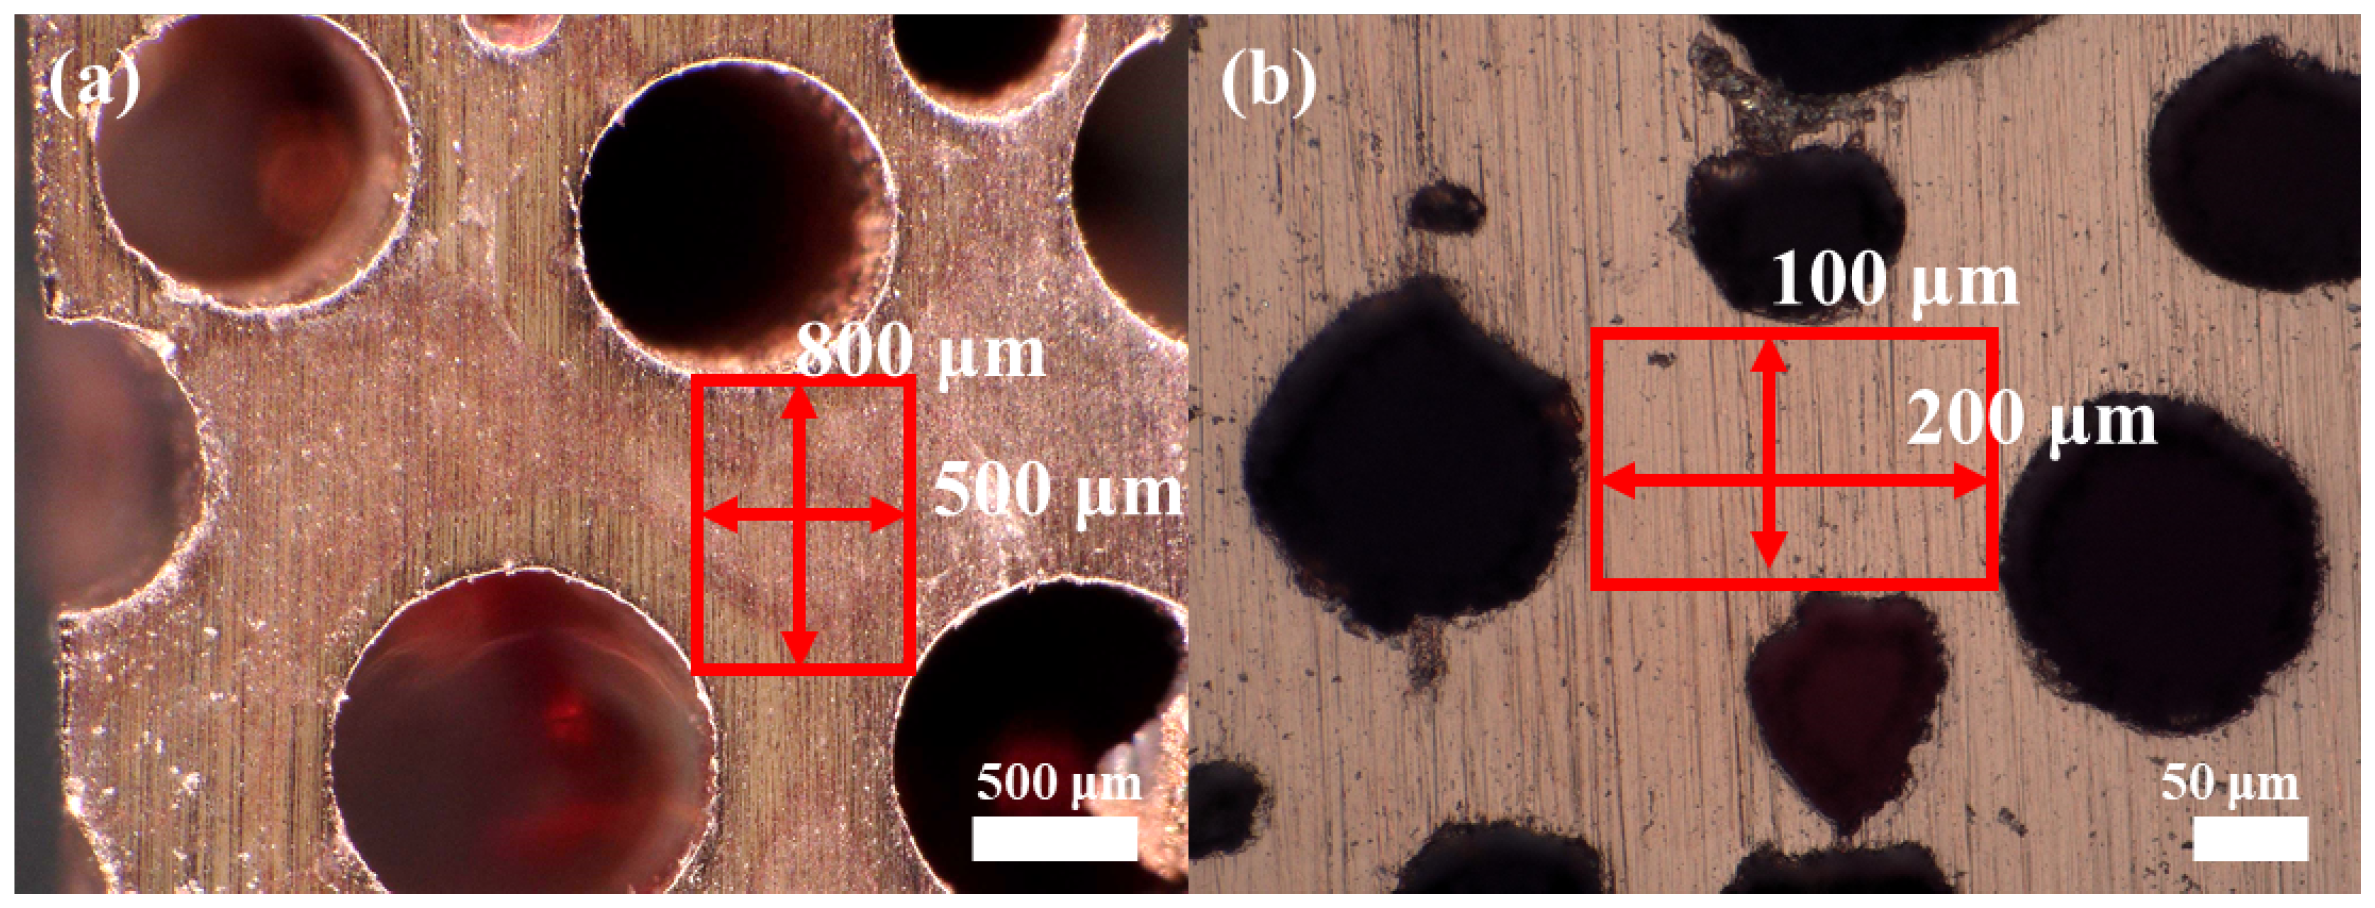
Figure 5 schematically illustrates the effect of pore size on crack length in lotus-type porous copper DBC joints based on the Griffith fracture model. Small pores (150 μm) reduce the copper ligament area between adjacent pores, thereby acting as local stress concentrators that promote rapid crack coalescence within the alumina substrate, ultimately leading to a decrease in shear strength. As the pore size increases (400–800 μm), stress redistribution occurs around the pores, improving the effective interfacial bonding area and allowing crack propagation to proceed more gradually. Larger pore sizes further increase the length and area that must be fractured according to Griffith fracture mechanics, which contributes to enhanced shear strength.

3.2. Analysis of Fracture Surfaces According to Pore Diameter

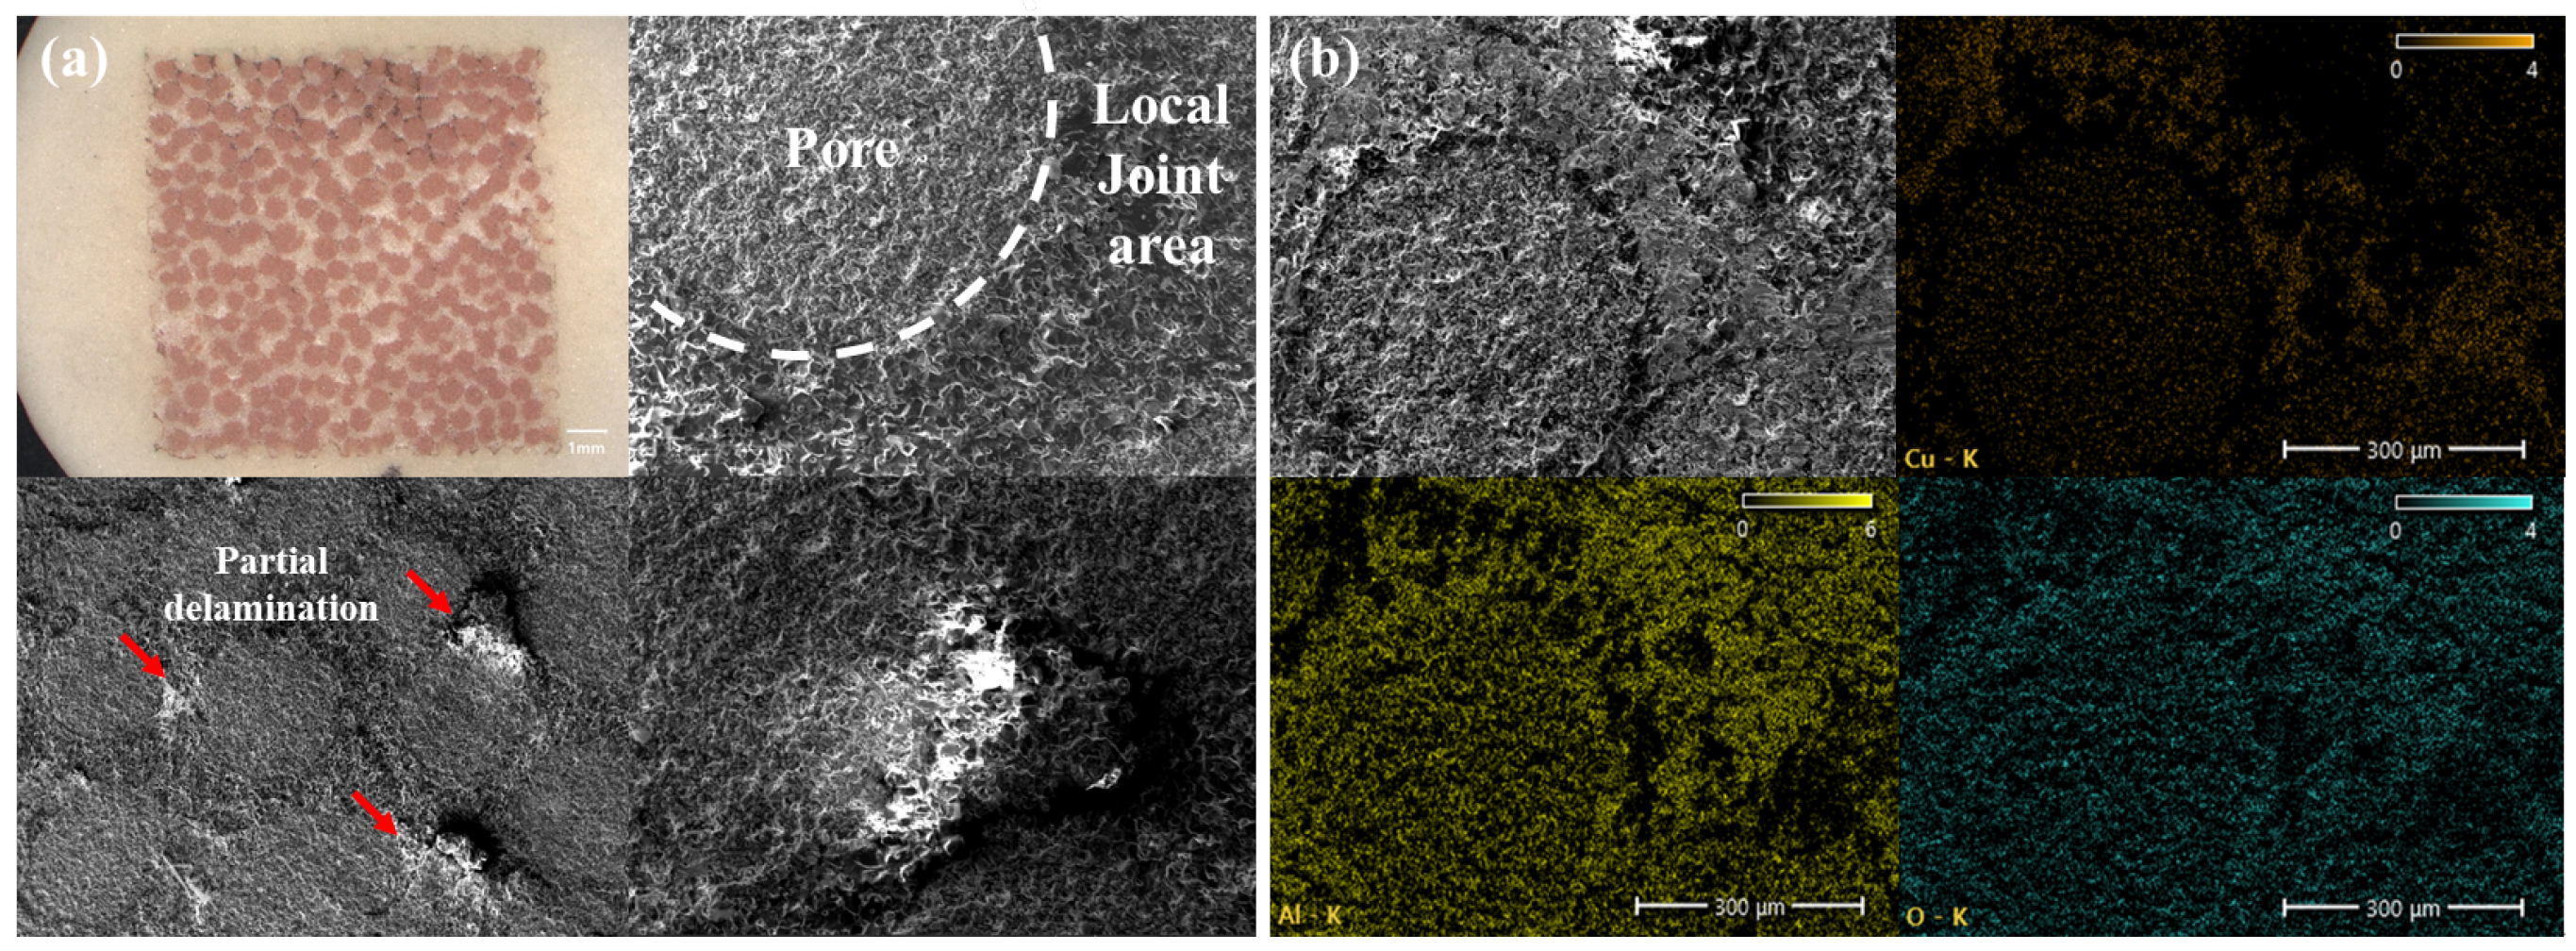
Figure 6a presents OM and SEM images of the alumina fracture surface for the 400 μm pore specimen. Circular regions are observed on the surface, surrounded by two white areas. The circular features correspond to the pores in the porous copper, showing the original alumina surface, while the surrounding areas display delamination traces where alumina has been torn away. The regions between pores reveal rough alumina surfaces due to mechanical tearing. Some alumina fragments on partially bonded areas are visible just before complete delamination. Because the bonded area is small, full delamination did not occur under the applied shear load.
Figure 6b shows EDS analysis of the alumina fracture surface. As expected, Al and O are uniformly distributed across the surface. Minor Cu signals are detected at the former pore sites and surrounding areas, indicating that copper near the pores remained adhered to the alumina surface during shear testing. This phenomenon can also be visually confirmed in the OM images, where copper remains between pores at the initial loading interface.
Figure 7 presents SEM images of the copper fracture surface after shear testing of the 400 μm pore specimen. White alumina fragments are observed at copper ligaments. Some of these fragments are partially detached and adhere to the copper fracture surface, with their size limited by the area of copper ligaments between pores. Small, angular alumina particles appear on the copper fracture surface, with some regions exhibiting scraping along the load direction. Severe plastic deformation in narrow copper ligaments causes adjacent pores to deform, and this process progresses continuously, promoting alumina delamination. EDS results show Al and O in angular alumina regions, while surrounding exposed areas indicate Cu.
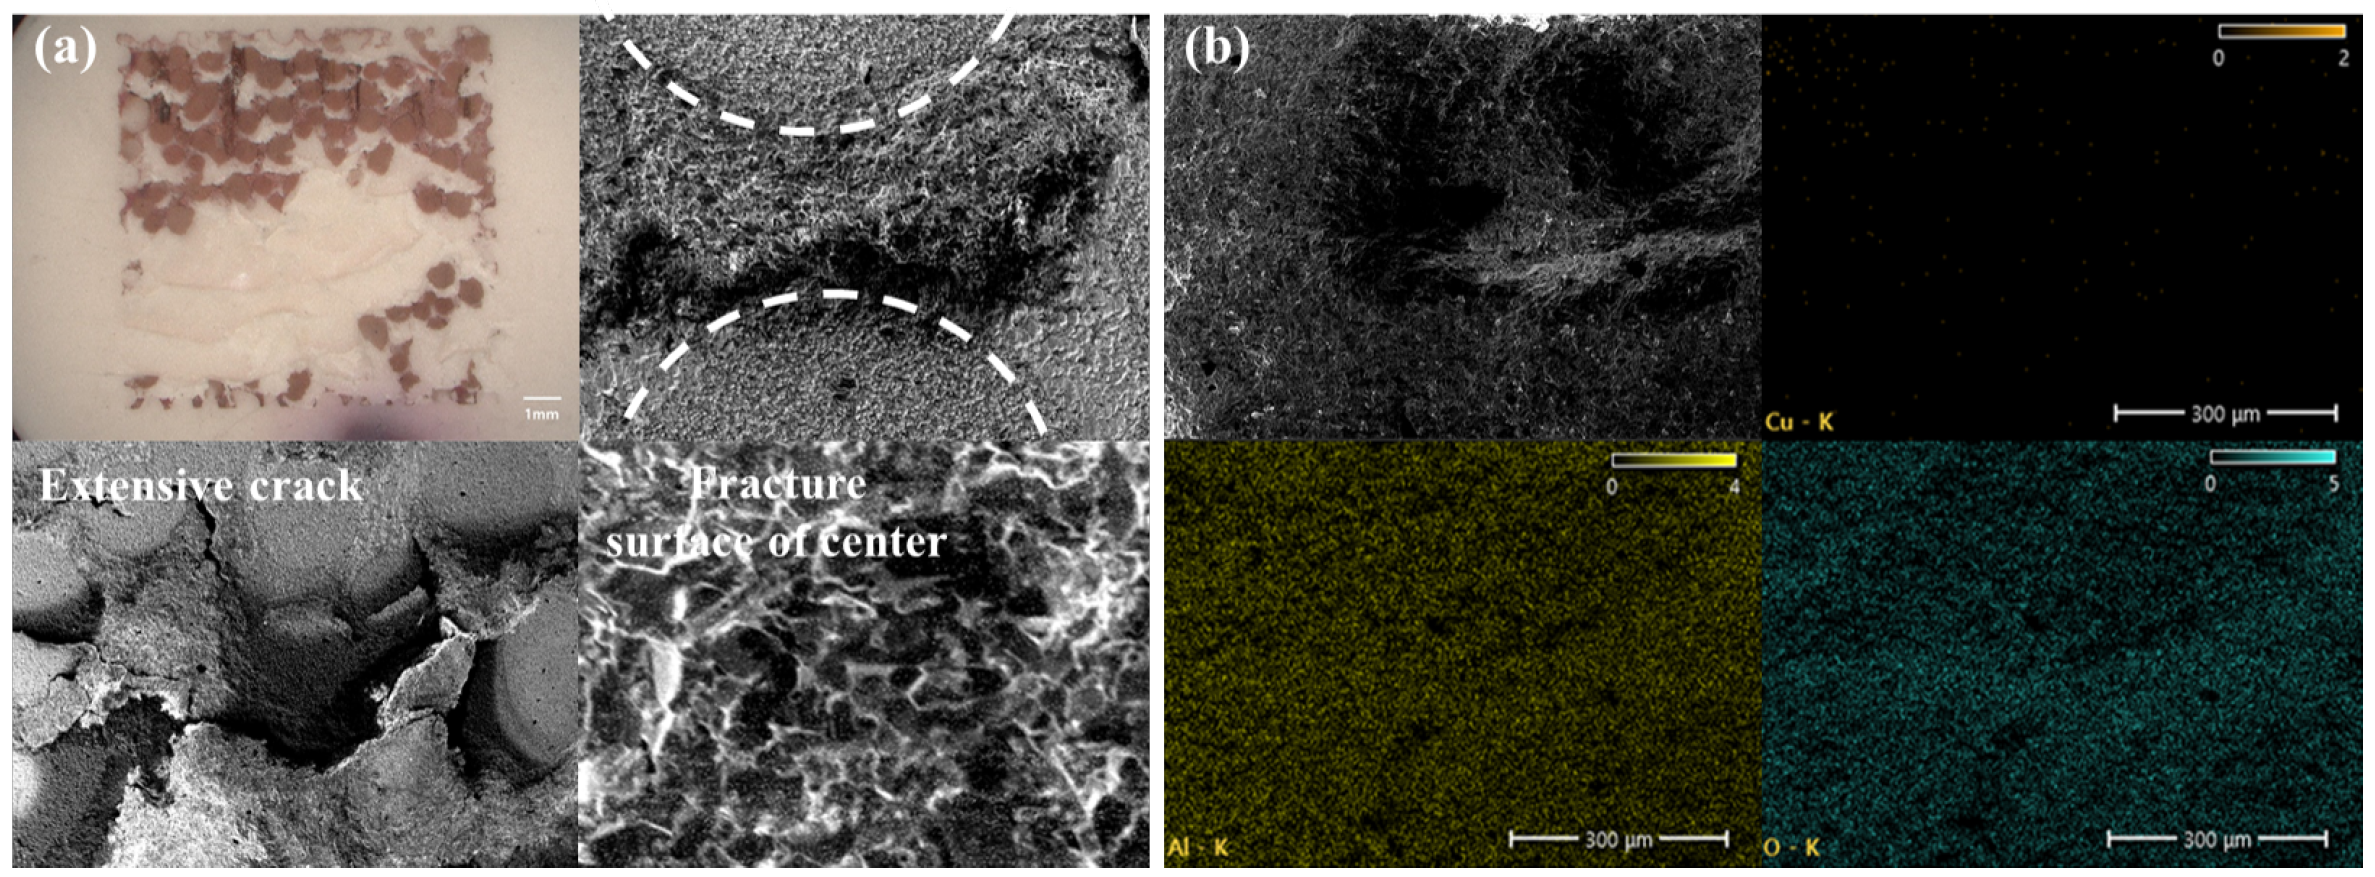
Figure 8a shows OM and SEM images of the alumina fracture surface for the 600 μm pore specimen. Similar to the 400 μm specimen, circular regions are observed with two surrounding white areas. However, delaminated regions are deeper and wider. In the central fracture area, wave-like patterns indicate progressive fracture under increased load, connecting adjacent pores and promoting crack growth. Regions without circular traces indicate deep delamination into the alumina, showing only rough alumina particles in SEM images. Figure 8a EDS analysis shows only Al and O, with no Cu detected.
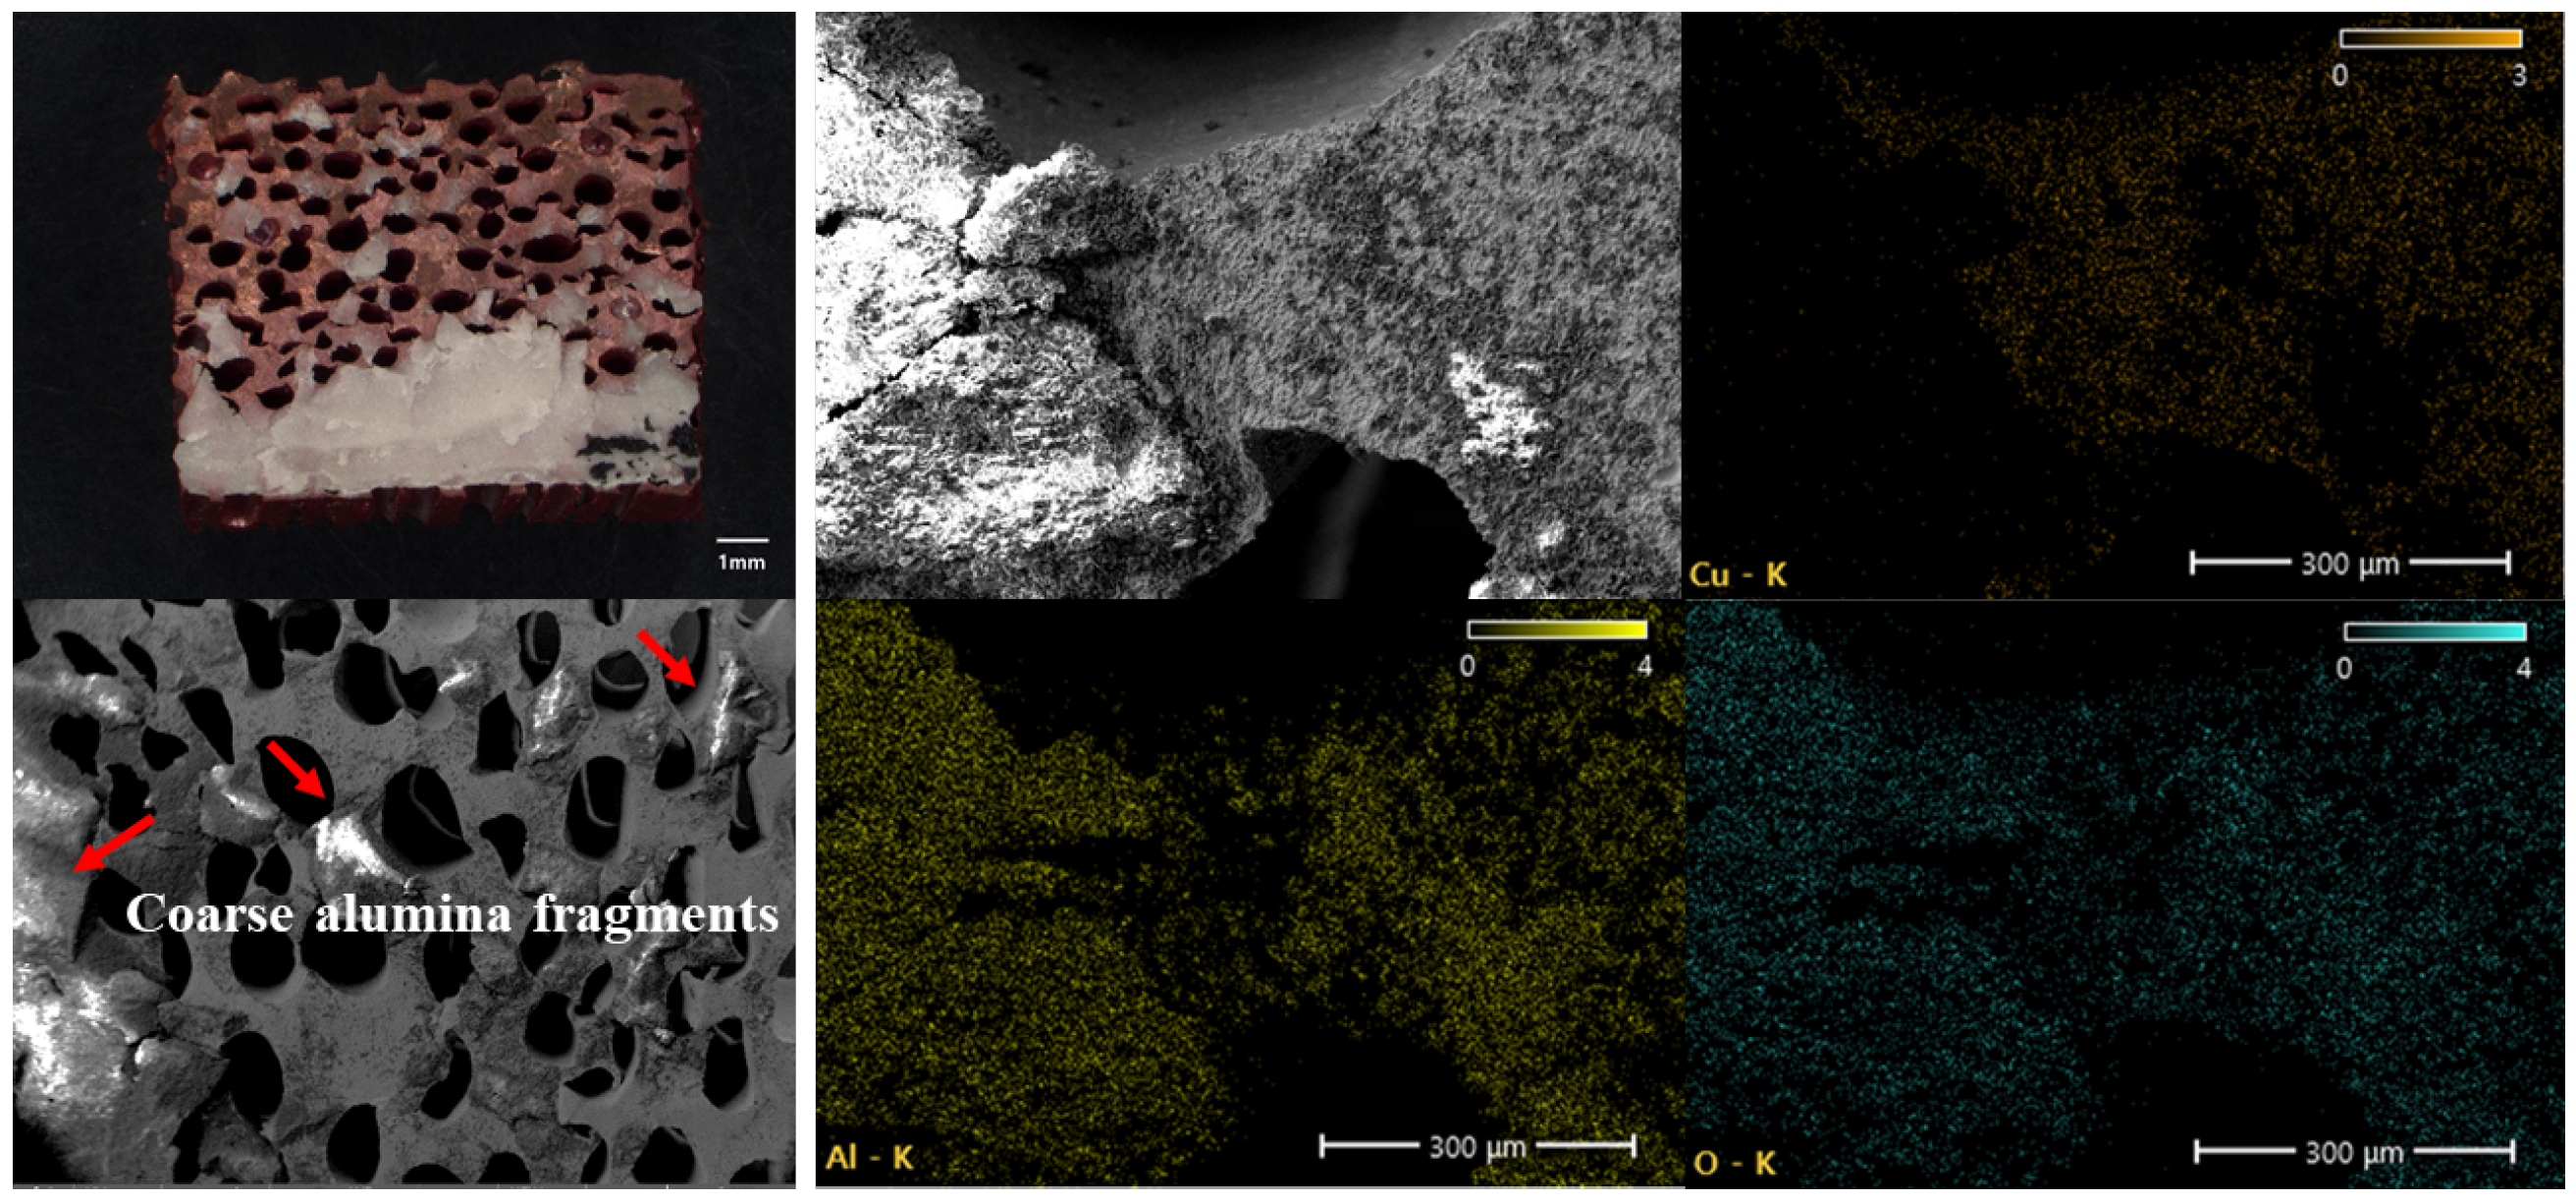
Figure 9 presents the copper fracture surface for the 600 μm pore specimen after shear testing. White alumina fragments are again observed at the copper ligaments. Their size is roughly ten times larger than in the 400 μm specimen. The strength of ceramics is known to increase with the fracture energy required as the fractured surface area increases [30]. At the bottom of the fracture surface, enormous alumina fragments corresponding to those removed from the alumina surface are still attached. These fragments exceed the area of the copper ligaments between pores and contribute to higher shear strength. As in the 400 μm specimen, severe plastic deformation occurs in narrow copper ligaments, deforming surrounding pores. EDS analysis shows Al and O in the angular alumina fragments, while Cu is detected in the surrounding exposed regions. This process continues, leading to progressive delamination of the alumina surface.

3.3. Modeling of Shear Strength Considering Porosity and Pore Diameter

In conventional porous metals and ceramics, pore size has generally not been considered a critical factor due to the underlying mechanical mechanisms. In porous metals, the effective cross-sectional area subjected to stress during tensile testing primarily governs the mechanical response. Since the cross-sectional area in a porous structure is determined by porosity rather than pore size, pore size has minimal influence on tensile strength [11]. Similarly, studies on porous ceramics have demonstrated that shear strength varies predominantly with porosity [13]. However, prior research has not investigated the shear strength of structures in which a porous metal is bonded to a ceramic substrate, highlighting the need for a novel strength prediction model.
Although copper and alumina are bonded, the ultimate failure occurs in the ceramic. Therefore, the Ryshkewitch–Duckworth (R–D) model, commonly used for predicting the strength of porous ceramics, was applied to estimate the fracture strength. The model is expressed as follows:
σ = σ 0 exp ( b P )
where σ is the strength of the ceramic specimen containing pores, σ 0 is the strength of a fully dense specimen of the same material, and b and P are the experimentally determined porosity sensitivity coefficient and volumetric porosity, respectively. Figure 10 presents the predicted strength based on the R–D model. When calculated using the R–D model, σ 0 was determined as 80 MPa, which corresponds to the average of the experimental results ranging from 50 to 120 MPa. At this value, the porosity sensitivity constant was calculated to be 0.043, providing the most accurate prediction. The porosity sensitivity constant reported for conventional porous ceramics typically lies in the range of 0.02–0.06 [31,32,33]. Therefore, it can be concluded that the conventional R–D model, originally developed to predict the fracture strength of porous ceramics, is also applicable to the prediction of shear strength in cases where porous metals are bonded to ceramic substrates. Specimens with pore sizes between 150 and 400 μm reasonably captured the trend of strength variation with porosity, and the predictions exhibited high accuracy. However, for specimens with larger pore sizes of 600 and 800 μm, the measured strength deviated from the R–D predictions by 5 and 4 MPa, respectively. The overall error rate was 12.3%, and the coefficient of determination was 0.43. This indicates that, in the novel fracture behavior where porous metals are bonded to ceramic substrates, applying a prediction model that considers only the porosity of the ceramic is insufficient, and that the pore size must also be taken into account.
To improve the predictive accuracy for porous metals bonded to ceramic substrates, a fracture strength model incorporating pore size was developed. The additional term was formulated using the softplus function [34], which is characterized by nonlinear behavior: it outputs near zero for small input values and increases once a threshold is exceeded. The softplus function and the modified predictive model are expressed as follows:
S o f t P l u s ( x ) = ln ( 1 + exp ( x ) )
σ = σ 0 exp ( b P ) + ln ( 1 + exp ( c ( d d 0 ) )
where c is the experimentally determined pore size sensitivity coefficient, d is the pore size, and d 0 is the critical pore size beyond which fracture depth increases significantly, leading to coalescence of adjacent cracks. The softplus function was incorporated because experimental observations showed a sharp increase in strength for pore sizes above 300 μm, corresponding to deeper crack propagation and extensive alumina fracture. In this study, c and d 0 were set to 10, 0.3. Since no evidence of interaction between porosity and pore size was found within the tested ranges, the two contributions were combined additively.
Predicted shear strengths using this model are shown in Figure 11. For pore sizes ≤400 μm, the effect of pore size was negligible, resulting in narrow prediction bands. For pore sizes ≥500 μm, the influence became significant, producing wider prediction bands that closely matched experimental measurements. The error rate decreased from 12.3% to 7.5%, and R-square increased from 0.43 to 0.74, indicating improved predictive capability. Although some deviations were observed due to factors affecting fracture, such as the randomness of pore location and size in the porous metal, bonding conditions between metal and ceramic, and the sintering conditions of the ceramic, the results indicate that, for lotus-type DBC substrates, both porosity and pore size must be considered to predict shear strength accurately.

4. Conclusions

This study investigated the shear strength of lotus-type porous copper bonded to alumina substrates via the DBC process, focusing on the effects of porosity and pore size. Based on the experimental results and predictive modeling, the following conclusions can be drawn:
1.
Effect of Porosity and Pore Size: Shear strength of the DBC specimens decreased with increasing porosity. Conversely, larger pore sizes (600–800 μm) exhibited higher shear strength even at elevated porosities. Fractography revealed that the extent and depth of alumina fracture increased with pore size, indicating that larger copper ligaments between pores increase the fracture area.
2.
Fracture Mechanism: Initial deformation occurred within the porous copper, with localized plastic strain concentrating around pore regions. Progressive separation of narrow copper ligaments led to detachment of alumina particles and eventual complete fracture. SEM and EDS analyses confirmed copper residues and alumina detachment consistent with the observed fracture process.
3.
Predictive Modeling: The Ryshkewitch–Duckworth (R–D) model provided reasonable predictions for smaller pore sizes but showed limited accuracy for larger pore sizes when only porosity was considered. The model incorporating pore size demonstrated significantly improved predictive performance, with the prediction error decreasing from 12.3% to 7.5% and the coefficient of determination (R2) increasing from 0.43 to 0.74.

Author Contributions

Conceptualization, S.-G.C. and S.H.; methodology, S.-G.C.; validation, S.K.; formal analysis, S.K.; investigation, J.L.; data curation, J.L.; Resources, S.H.; writing—original draft preparation, S.-G.C.; writing—review and editing, K.-S.K.; visualization, S.K.; supervision, S.H.; project administration, K.-S.K. and S.H.; All authors have read and agreed to the published version of the manuscript.

Funding

This research was supported by Korean Institute for Advancement of Technology (KIAT) grant funded by the Korea Government(MOTIE) (RS-2024-00433985, Industrial Innovation Infrastructure Construction Project).

Data Availability Statement

The original contributions presented in this study are included in the article. Further inquiries can be directed to the corresponding authors.

Conflicts of Interest

Author Sangwook Kim is currently employed by company Lotus Materials Co., Ltd. The remaining authors declare that the research was conducted in the absence of any commercial or financial relationships that could be construed as a potential conflict of interest.

References

  1. Sanchez, J.L. State of the art and trends in power integration. In Proceedings of the 1999 International Conference on Modeling and Simulation of Microsystems (MCM), San Juan, Puerto Rico, 19–21 April 1999; pp. 20–29. [Google Scholar]
  2. Sanchez, J.L.; Bourennane, A.; Breil, M.; Austin, P.; Brunet, M.; Laur, J.P. Evolution of the classical functional integration towards a 3D heterogeneous functional integration. In Proceedings of the 2007 14th International Conference on Mixed Design of Integrated Circuits and Systems, Ciechocinek, Poland, 21–23 June 2007; pp. 23–34. [Google Scholar]
  3. Schulz-Harder, J. Advantages and new development of direct bonded copper substrates. Microelectron. Reliab. 2003, 43, 359–365. [Google Scholar] [CrossRef]
  4. Liu, Y. Power Electronic Packaging: Design, Assembly Process, Reliability and Modeling; Publishing House: Springer Science & Business Media: Berlin, Germany, 2012. [Google Scholar]
  5. Smet, V.; Forest, F.; Huselstein, J.J.; Richardeau, F.; Khatir, Z.; Lefebvre, S.; Berkani, M. Ageing and failure modes of IGBT modules in high-temperature power cycling. IEEE Trans. Ind. Electron. 2011, 58, 4931–4941. [Google Scholar] [CrossRef]
  6. McCluskey, P. Reliability of power electronics under thermal loading. In Proceedings of the 2012 7th International Conference on Integrated Power Electronics Systems (CIPS), Nuremberg, Germany, 6–8 March 2012; pp. 1–8. [Google Scholar]
  7. Squiller, D.; Greve, H.; Mengotti, E.; McCluskey, F.P. Physics-of-failure assessment methodology for power electronic systems. Microelectron. Reliab. 2014, 54, 1680–1685. [Google Scholar] [CrossRef]
  8. Karageorgiou, V.; Kaplan, D. Porosity of 3D biomaterial scaffolds and osteogenesis. Biomaterials 2005, 26, 5474–5491. [Google Scholar] [CrossRef]
  9. Goodall, R.; Mortensen, A. Porous metals. In Physical Metallurgy; Elsevier: Amsterdam, The Netherlands, 2014; pp. 2399–2595. [Google Scholar]
  10. Lee, J.W.; Hyun, S.K.; Kim, M.S.; Kim, M.G.; Ide, T.; Nakajima, H. Ductility improvement of intermetallic compound NiAl by unidirectional pores. Mater. Lett. 2012, 74, 213–216. [Google Scholar] [CrossRef]
  11. Liu, P.; Fu, C.; Li, T.; Shi, C. Relationship between tensile strength and porosity for high porosity metals. Sci. China Ser. E Technol. Sci. 1999, 42, 100–107. [Google Scholar] [CrossRef]
  12. Wei, X.I.E. Effects of porosity on tensile mechanical properties of porous FeAl intermetallics. Trans. Nonferrous Met. Soc. China 2020, 30, 2757–2763. [Google Scholar] [CrossRef]
  13. Ryshkewitch, E. Compression strength of porous sintered alumina and zirconia: 9th communication to ceramography. J. Am. Ceram. Soc. 1953, 36, 65–68. [Google Scholar] [CrossRef]
  14. Duckworth, W. Discussion of ryshkewitch paper by winston duckworth. J. Am. Ceram. Soc. 1953, 36, 68–69. [Google Scholar] [CrossRef]
  15. Nakajima, H. Mechanical, thermal and electrical properties of lotus-type porous metals. Mater. Sci. Appl. 2018, 9, 258. [Google Scholar] [CrossRef]
  16. George, A.J.; Breitenbach, M.; Zipprich, J.; Klingler, M.; Nowottnick, M. Nonconchoidal fracture in power electronics substrates due to delamination in baseplate solder joints. In Proceedings of the 2018 7th Electronic System-Integration Technology Conference (ESTC), Dresden, Germany, 18–21 September 2018; pp. 1–6. [Google Scholar]
  17. Chen, Y.; Wang, N.; Ola, O.; Xia, Y.; Zhu, Y. Porous ceramics: Light in weight but heavy in energy and environment technologies. Mater. Sci. Eng. R Rep. 2021, 143, 100589. [Google Scholar] [CrossRef]
  18. Wang, A.; Hu, P.; Zhao, X.; Wang, Z.; Zhang, C.; Wang, Y. Modelling and experimental investigation of pore-like flaw-strength response in structural ceramics. Ceram. Int. 2020, 46, 14431–14438. [Google Scholar] [CrossRef]
  19. Wijaya, A.; Wagner, J.; Sartory, B.; Brunner, R. Analyzing microstructure relationships in porous copper using a multi-method machine learning-based approach. Commun. Mater. 2024, 5, 59. [Google Scholar] [CrossRef]
  20. Borwornpiyawat, P.; Juntasaro, E.; Aueviriyavit, S.; Juntasaro, V.; Sripumkhai, W.; Pattamang, P.; Jeamsaksiri, W. Effects of porous size and membrane pattern on shear stress characteristic in gut-on-a-chip with peristalsis motion. Micromachines 2022, 14, 22. [Google Scholar]
  21. Duckworth, W. Statistical effects of pore features on mechanical properties and fracture behaviors of heterogeneous random porous materials by phase-field modeling. Int. J. Solids Struct. 2023, 264, 112098. [Google Scholar]
  22. Cui, Z.; Jia, Q.; Zhang, H.; Wang, Y.; Ma, L.; Zou, G.; Guo, F. Review on shear strength and reliability of nanoparticle sintered joints for power electronics packaging. J. Electron. Mater. 2024, 53, 2703–2726. [Google Scholar] [CrossRef]
  23. Park, J.W.; Eagar, T.W. Strain energy release in ceramic-to-metal joints with patterned interlayers. Scr. Mater. 2004, 50, 555–559. [Google Scholar]
  24. Paret, P. Power Electronics Materials and Bonded Interfaces-Reliability and Lifetime; No. NREL/PR-5400-76672; National Renewable Energy Lab. (NREL): Golden, CO, USA, 2020. [Google Scholar]
  25. Li, L.; Du, X.; Chen, J.; Wu, Y. Thermal fatigue failure of micro-solder joints in electronic packaging devices: A review. Materials 2024, 17, 2365. [Google Scholar] [CrossRef]
  26. Hansen, M.; Anderko, K. Constitution of Binary Alloys; McGraw-Hill: New York, NY, USA, 1958. [Google Scholar]
  27. Honjo, G. Electron diffraction studies on oxide films formed on metals and alloys part 1. Oxidation of pure copper. J. Phys. Soc. Jpn. 1949, 4, 330–333. [Google Scholar] [CrossRef]
  28. Jeffes, J.H.E. Ellingham diagrams. In Encyclopedia of Materials, Science and Technology; Elsevier: Amsterdam, The Netherlands, 2001; pp. 2751–2753. [Google Scholar]
  29. Griffith, A.A., VI. The phenomena of rupture and flow in solids. Philos. Trans. R. Soc. Lond. 1921, 221, 163–198. [Google Scholar]
  30. Sbaizero, O.; Pezzotti, G.; Nishida, T. Fracture energy and R-curve behavior of Al2O3/Mo composites. Acta Mater. 1998, 46, 681–687. [Google Scholar]
  31. Hoepfner, T.P.; Case, E.D. The influence of the microstructure on the hardness of sintered hydroxyapatite. Ceram. Int. 2003, 29, 699–706. [Google Scholar] [CrossRef]
  32. Datta, S.K.; Mukhopadhyay, A.K.; Chakraborty, D. Porosity Dependence of Strength of Si3N4 Ceramics. J. Mech. Behav. Mater. 1990, 3, 35–42. [Google Scholar] [CrossRef]
  33. Hattiangadi, A.; Bandyopadhyay, A. Strength degradation of nonrandom porous ceramic structures under uniaxial compressive loading. J. Am. Ceram. Soc. 2010, 83, 2730–2736. [Google Scholar] [CrossRef]
  34. Nair, V.; Hinton, G.E. Rectified linear units improve restricted boltzmann machines. In Proceedings of the 27th International Conference on Machine Learning, Haifa, Israel, 21–24 June 2010; pp. 807–814. [Google Scholar]
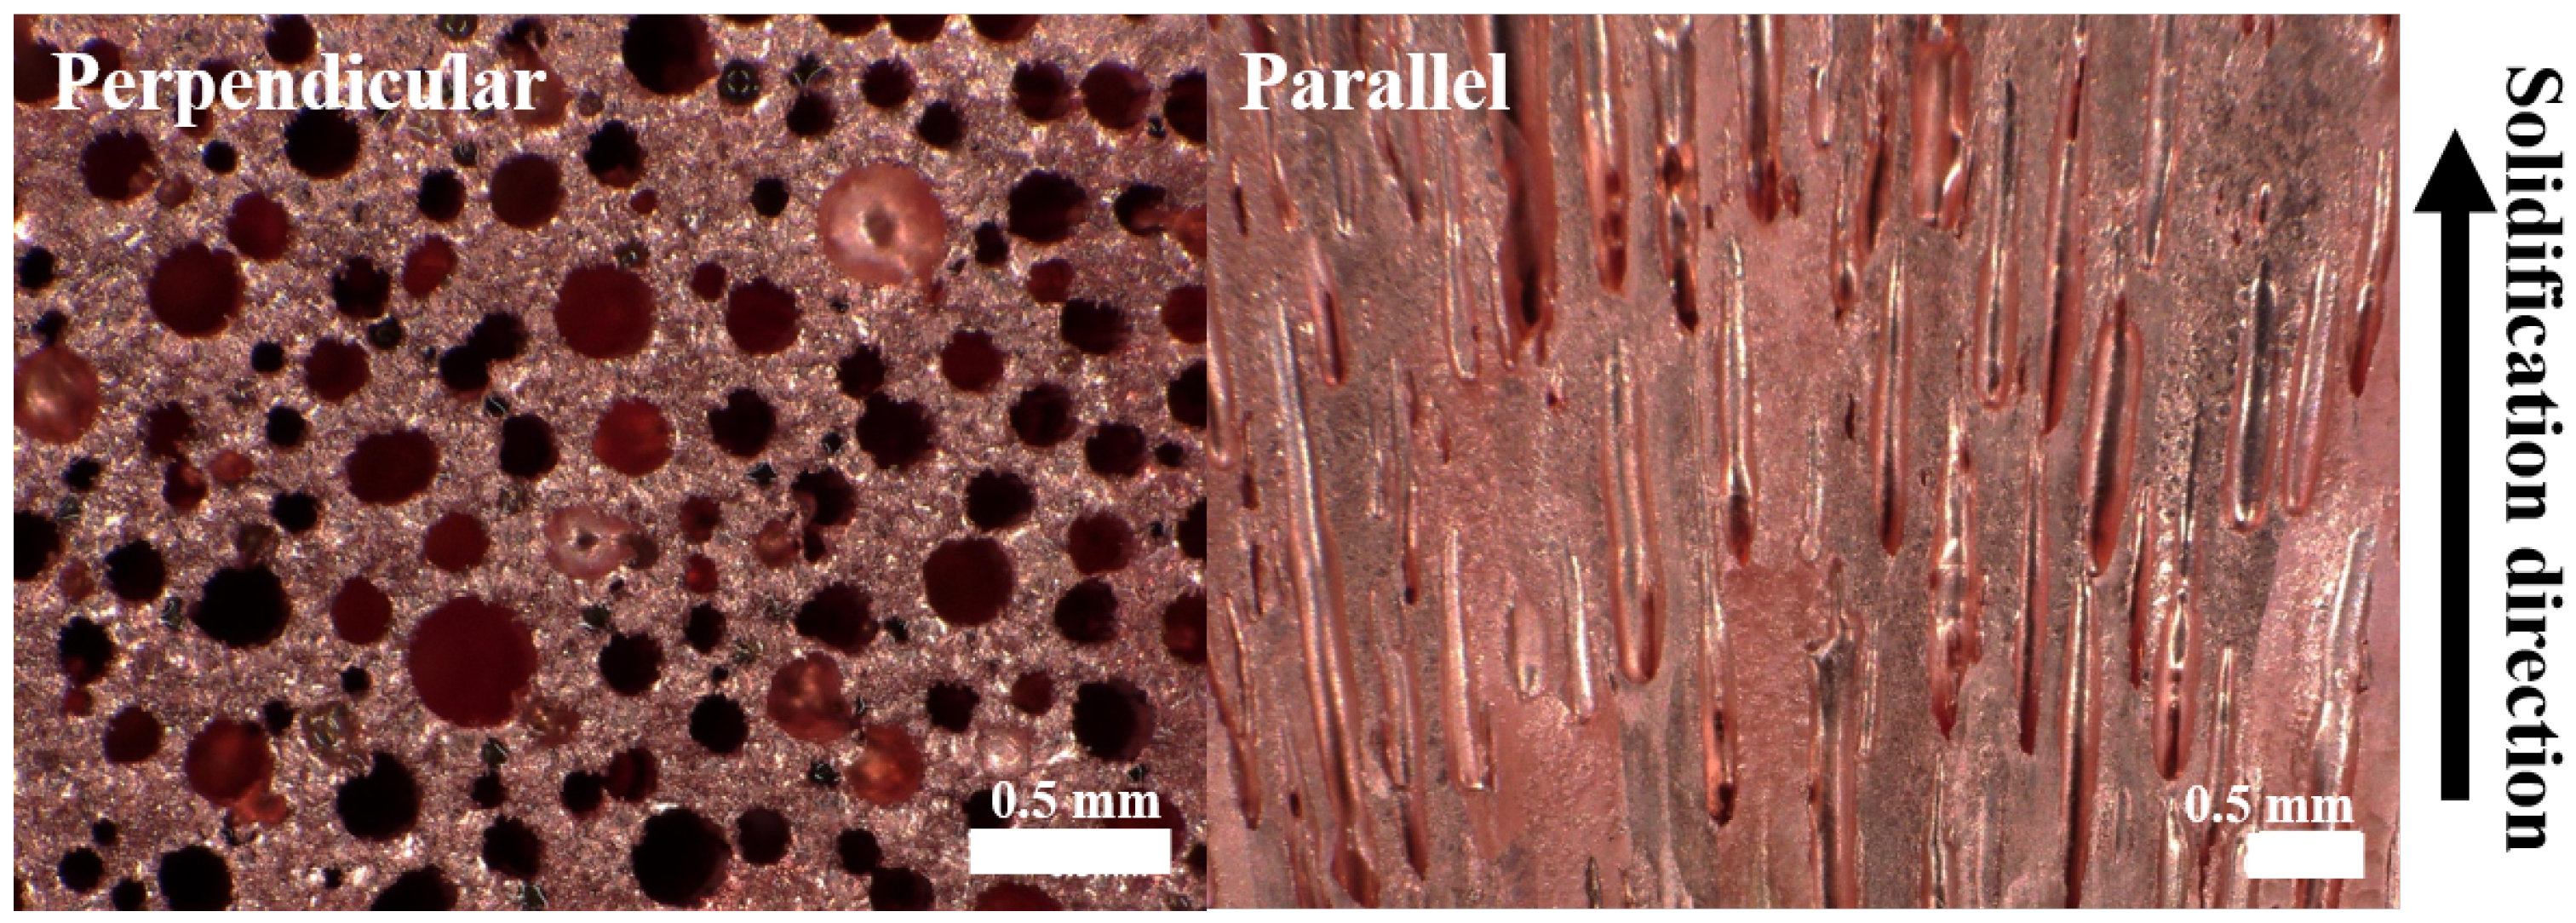
Figure 1. Optical cross-section image showing the unidirectional pore alignment in lotus copper.
Metals 15 01103 g001
Figure 2. Schematic of the DBC joint assembly.
Metals 15 01103 g002
Figure 3. Schematic diagram of the shear test jig.
Metals 15 01103 g003
Figure 4. Shear strength values of DBC specimens with lotus-type porous copper of various morphologies joined to alumina.
Metals 15 01103 g004
Figure 5. Copper/alumina joint interfaces with pore sizes of (a) 800 μm and (b) 150 μm, illustrating crack propagation paths between adjacent pores.
Metals 15 01103 g005
Figure 6. Alumina fracture surfaces of specimen with a pore size of 400 μm: (a) OM and SEM images; and (b) EDS elemental analysis.
Metals 15 01103 g006
Figure 7. SEM Images and EDS analysis of copper fracture surfaces with a pore size of 400 μm.
Metals 15 01103 g007
Figure 8. Alumina fracture surfaces of specimen with a pore size of 600 μm: (a) OM and SEM images; and (b) EDS elemental analysis.
Metals 15 01103 g008
Figure 9. SEM Images and EDS analysis of copper fracture surfaces with a pore size of 600 μm.
Metals 15 01103 g009
Figure 10. Shear strength values of DBC specimens with lotus-type porous copper of various morphologies joined to alumina with (R–D) prediction line.
Metals 15 01103 g010
Figure 11. Predicted shear strength using the pore-size-adjusted model compared with experimental results.
Metals 15 01103 g011
Table 1. Lotus-type porous copper specimens with various pore morphologies used in this study.
Pore diameter (μm)160137443425413583811
Porosity (%)43.539.038.741.450.948.946.5
Disclaimer/Publisher’s Note: The statements, opinions and data contained in all publications are solely those of the individual author(s) and contributor(s) and not of MDPI and/or the editor(s). MDPI and/or the editor(s) disclaim responsibility for any injury to people or property resulting from any ideas, methods, instructions or products referred to in the content.