Abstract
Sinter is the main raw material of blast furnaces, and its strength influences its running condition. Nevertheless, there is no comprehensive definition of the influencing mechanisms of the strength of the sinter. In this paper, the influences of the quantity and quality of the bonding phase on the strength of the sinter were investigated by changing the sintering parameters, such as the maximum sintering temperature, the binary basicity of adhering fines, holding time at high temperature, and types of core ores. As the maximum temperature increased from 1240 °C to 1320 °C and the binary basicity of the adhering fines increased from 5.0 to 9.0, and the strength of the sinter increased first and then decreased. The strength of the sinter was improved by increasing the holding time at high temperatures and reducing the melt absorbability of core ores. The strength of the sinter was comprehensively influenced by the strength of the bonding phase, the fluidity of the original melt, and the melt absorbability of core ores. There is a multivariate linear relationship between them. Moreover, the strength of the bonding phase had the greatest effect on the strength of the sinter, followed by the fluidity of the original melt, and the melt absorbability of core ores was the smallest.
1. Introduction
Sinters are a primary raw material used in blast furnace iron-making in Asia. The strength of the sinter not only affects the operations of the blast furnace but also influences the energy consumption and CO2 emissions during the iron-making process [1]. During the iron ore sintering process, the adhering fines in the sinter mixture are melted at temperatures above 1200 °C, and the un-melted large particles of core ores are bonded by the original melts. After this, they are cooled to form sinter cakes. The quantity of the bonding phase impacts the bonding range among the un-melted particles, while the quality of the bonding phase is determined by its strength [2,3]. Therefore, the quantity and quality of the bonding phase play essential roles in the strength of the sinter.
The quantity of the bonding phase was directly determined by the original melt and the melting absorbability of core ores. When the fluidity of the original melt became higher, the range of the un-melted particles was largely bonded, leading to the strength of the sinter increase [4]. The formation of the original melt was influenced by the characteristics of iron ore fines and the binary basicity of adhering fines [5,6,7]. Hence, some methods were proposed to control the original melt, e.g., optimizing blending ores [8,9,10,11,12,13,14,15,16], the proportions of fluxes [17,18,19], and segregating granulation [20,21,22,23]. The core ores reacted with the original melts in the formation of the melt zone. At the same time, the secondary melt formed between the original melts and core ores [5,24,25,26,27]. Limonite has high melt absorbability, leading to effective melting and the strength of the sinter decreases [28,29,30,31,32,33]. To decrease the melt absorbability of limonite, several studies have been conducted to realize effective sintering, known as the protective layer forming method [34,35,36,37,38] and MEBIOS method [39,40], which weaken the contact condition between the original melts and limonite to decrease the melt absorption reaction. In addition, the yield and tumble index of the sinter increased with the strength of the bonding phase [41,42,43]. The strength of the bonding phase was dependent on the concentrations of calcium ferrite, hematite, silicate, and the size distribution of pores [44,45,46,47,48,49,50,51].
In general, all the above studies just focused on a single influencing factor of the strength of the sinter, while the influencing mechanism of the strength of the sinter is not yet sufficiently clarified. Hence, in this paper, a comprehensive influence of quantity and quality of the bonding phase on the strength of the sinter was investigated by changing the sintering parameters, such as the binary basicity of adhering fines, maximum sintering temperature, holding time over 1150 °C, and types of core ores.
2. Materials and Methods
2.1. Materials
Six types of iron ores were used in the experiments. Ore-A was limonite ore, the main mineral of it was goethite, Ore-B was combined hematite and goethite ore types, and Ore-C was hematite ore, from Australia. Ore-D and Ore-E were Brazilian hematite iron ores. The main minerals of Ore-C, Ore-D, and Ore-E were hematite. The chemical compositions of iron ores were determined by X-ray fluorescence spectrometry, which referred to the chemical composition analysis methods of iron ore (GB/T 6730 series) and the results are shown in Table 1. It shows that the limonite Ore-A has the highest contents of SiO2 and loss on ignition, while it has the lowest content of the total Fe element (T. Fe). The loss of the ignition content of Ore-A was the highest. The T. Fe content of other iron ores was over 60%. The SiO2 contents of Ore-A~Ore-E were between 1.78% and 5.40%, while CaO and MgO contents were below 0.02% and 0.07%, respectively, which resulted in a basicity (CaO + MgO/SiO2) for both below 0.03. Ore-F was less than 0.25 mm of blending ores, which was a mixture of various iron ores from a steelwork in China. The CaO and MgO contents of Ore-F were higher than those of other iron ores and its basicity was about 0.4.

Table 1.
Chemical composition of iron ores/mass%.
2.2. Methods
2.2.1. Strength of the Sinter
The basicity of sinter is usually 1.5~2.5, while the basicity of iron ore is very low, usually less than 0.1 [13,52,53]. To increase the basicity of the sintering mixtures, some basic fluxes such as quicklime, limestone, and dolomite are usually added to the mixed iron ores. Since the size of those fluxes is small, they will mix with the iron ore fines (less than 1 mm) to form a high basicity of adhering fines. During the granulating process, the core ores (more than 1 mm) were coated with adhering fines [22,54,55,56]. Ore-A~Ore-E was screened to be 1.8 to 2.0 mm as core ores, while the mixture of Ore-F and CaO pure reagents acted as adhering fines. The mass fractions of the adhering fines are usually between 20% and 50%. The bonding phase is the melting formed by the adhering fines at high temperatures. To form a more bonding phase, the mass ratio of the cores to the adhering fines was 1.5 in this paper. They were granulated in a disk pelletizer to be quasi-particles (between 2.0 and 2.5 mm), which were sintered in micro-sinter equipment. The schematic diagram of the strength of the sinter is shown in Figure 1. Figure 2 shows the schematic representation of the micro-sinter equipment, and Figure 3 shows the change in temperature and atmosphere during the strength of the sinter test. During the actual iron ore sintering process, the coke breezes in the sintering mixture begin to burn over 600 °C, which leads to a decrease in the volume fraction of oxygen in the sintered bed. After the coke breezes burn off, the atmosphere returns to the air. Since there were no coke breezes in the experiment materials in this study, the energy was supplied by electric heating. To simulate the actual iron ore sintering process, the atmosphere was set as nitrogen between 600 °C and the highest temperature, and air in other stages. The systems of experimental temperature and atmosphere in the paper were referred to the method by Wu [27,31,41,57]. The experimental conditions of all schemes are shown in Table 2. The sintering parameters of the base scheme were set as follows: core ore was Ore-A, ore type of adhering fine was Ore-F, the binary basicity of adhering fine was 7.0, the maximum sintering temperature was 1280 °C, and the holding time over 1150 °C was 7.0 min. In this paper, when the binary basicity of the sinter is 1.5, 2.0, and 2.5 for B1, base, and B2 schemes, respectively, it can be calculated that the binary basicity of the adhering fines is about 5.0, 7.0, and 9.0. Based on the base scheme, the influences of maximum sintering temperature, binary basicity of adhering fines, and type of core ores on the strength of the sinter were investigated. According to ISO 8263: 1992 (Iron ore fines—method for presentation of the results of sintering tests), sinters with a size larger than 5 mm were considered qualified products, while sinters with a size smaller than 5 mm were sintered again as raw materials. After sintering, the original weight of the sintered body was measured first, and then free fell the sintered body from 2 m high down to a steel plate with a thickness of 5 mm and screened the pieces with a 5 mm perforated screen. The Shatter Index (SI) of sinter was defined as the mass factions of the sinter pieces above 5 mm after five fell times and used to evaluate the yield of sinter products [58].
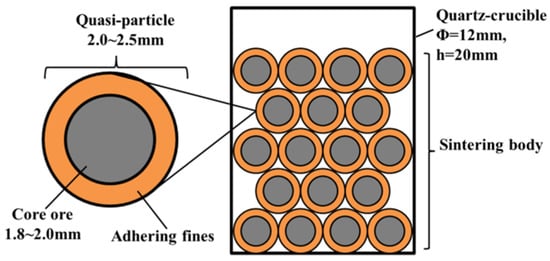
Figure 1.
Schematic diagram of the strength of the sinter tests.
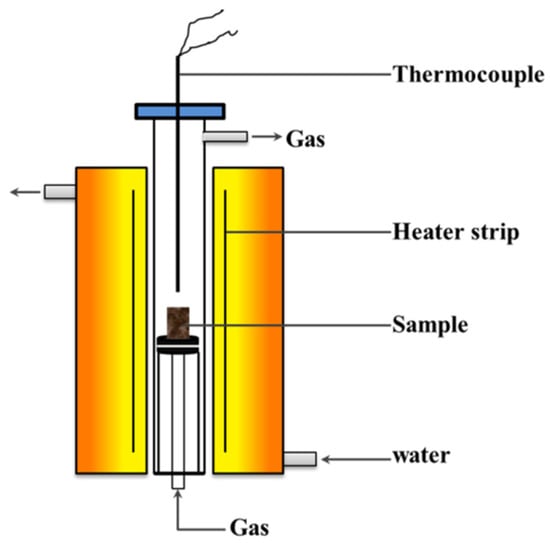
Figure 2.
Schematic representation of the micro-sinter equipment.
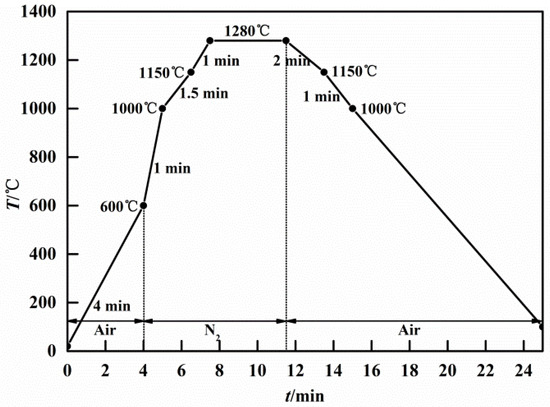
Figure 3.
Temperature and atmosphere of the strength of the sinter test.

Table 2.
Experimental conditions of all schemes.
2.2.2. Fluidity Characteristic
The adhering fines in the strength of the sinter tests (about 0.8 g) were shaped into cylindrical tablet (φ 8 mm × h 6 mm) under a pressure of 15 MPa for approximately 2 min. Figure 4 shows the schematic diagram of fluidity of melt, where the tablet was placed on a 50 mm diameter of an iron–chromium–aluminum alloy. The equipment, temperature, and atmosphere were identical to the strength of the sinter tests. Fluidity of Melt Index (FMI) was defined by the area of the melt before and after sintering tests [59,60]. The FMI was calculated by Equation (1) and used to evaluate the bonding range of the original melt.
in which, FMI is the Index of Fluidity of Melt, FA is the Flowing Area after the sintering test, mm2, and OA is the Original Area before the sinter test, mm2.
FMI = (FA − OA)/OA
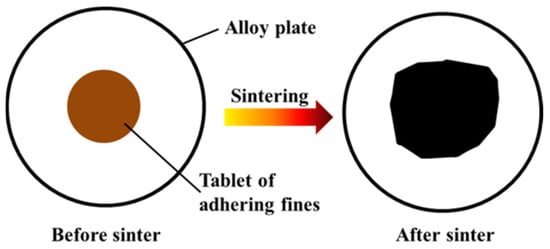
Figure 4.
Schematic diagram of the fluidity of melt.
2.2.3. Melt Absorbability
To simulate the reaction behavior between the original melts and the dense core ores, some large and dense iron ore particles with a size of more than 30 mm were directly selected from the raw materials. Then, they were cut into a cube (H 20 mm × W 20 mm × H 10 mm) and polished its surface with 60# emery. Then, 0.8 g of adhering fines were shaped into a cylindrical tablet (φ 8 mm × h 6 mm), which was placed on the surface of the above-mentioned polished cube. Then, they were sintered in the micro-sinter equipment. The equipment, temperature, and atmosphere were identical to the strength of the sinter tests. After sintering, the polished surface in the vertical direction of samples was observed by the microscope and the absorption depths h1 to h7 were measured to calculate the average melt absorption depth h′. Then, the ratio of h′/H was defined as the Melt Absorption Index (MAI) [31], which represented the melt absorbability of core ores. It can be used to indirectly evaluate the effective bonding phase. Figure 5 shows the schematic diagram of the melt absorption process.

Figure 5.
Schematic diagram of the melt absorbability of core ores of melt.
2.2.4. Strength of the Bonding Phase
Adhering fines to the strength of the sinter tests (about 2.4 g) were shaped into a cylindrical tablet (φ 8 mm × h 20 mm) under a pressure of 15 MPa for approximately 2 min, then sintered in micro-sinter equipment. The equipment, the temperature, and the atmosphere were like those in the strength of the sinter tests. After sintering, the bonding phase was polished into a cube (a = 6 mm), and then the compressive strength of the bonding phase was measured by a compressive strength tester. Figure 6 shows the schematic illustration of the strength of the bonding phase. Compressive Strength (CS) was adopted to characterize the strength of the bonding phase, which was the combined strength of the mineral components and pores in the bonding phase [41].
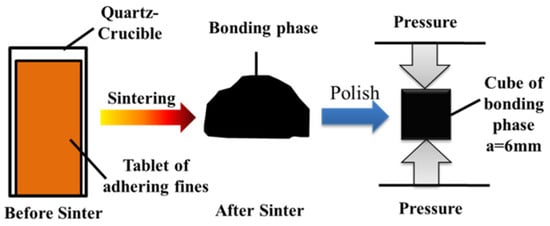
Figure 6.
Schematic diagram of the strength of the bonding phase.
3. Results
Figure 7a shows the results of the strength of the sinters at different sintering parameters. As the maximum sintering temperatures increased from 1240 °C to 1320 °C, and the binary basicity of the adhering fines increased from 5.0 to 9.0, the strength of the sinter increased first and then decreased, which reached the highest value at 1280 °C and the binary basicity of 7.0. Moreover, the strength of the sinter increased with the increase in the holding time over 1150 °C. In addition, when hematites such as Ore-C, Ore-D, and Ore-E, were used as core ores, the strength of the sinters was the lowest while limonite ore-A was used as core ore, the strength of the sinter was the highest, followed by goethite Ore-B.
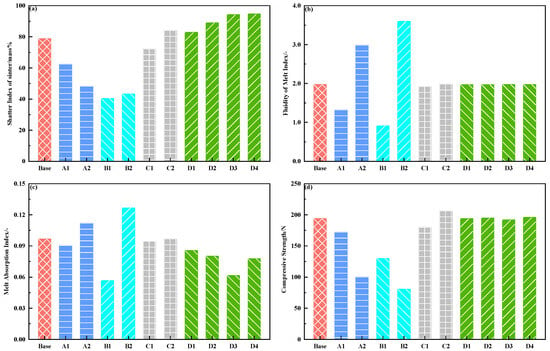
Figure 7.
Results of high-temperature characteristics such as shatter index of sinter (a), fluidity of melt index (b), melt adsorption index (c), and compressive strength of the bonding phases (d) at different sintering parameters.
Figure 7b shows the results of the fluidity of the original melts at different sintering parameters. FMI increased rapidly with the increase in the maximum sintering temperatures and the binary basicity of the adhering fines. Since the binary basicity of the adhering fines in the B1 scheme was very low (5.0), few of the original melts formed. Due to the shrinkage of the fresh cylinder of adhering fines at high temperatures, the MFI was slightly less than unity for the B1 scheme. The viscosity of the original melts decreased with increasing temperature, which improved its flow behavior and bonded more un-melted core ores. Moreover, the formations of silico-ferrite of calcium and aluminum (SFCA) increased as the CaO content of the adhering fines increased [61,62], which resulted in a decrease in the melting point of the original melts. In addition, the fluidity of the original melts was slightly affected by the holding time over 1150 °C.
Figure 7c shows the results of the melt absorbability of core ores at different sintering parameters. When limonite Ore-A was used as core ore, MAI increased with the increase in the maximum sintering temperature and the binary basicity of adhering fines. It may be that the fluidity of the original melts increased, which promoted the contact dynamics between the original melts and Ore-A. The melt absorbability was influenced by the lowest assimilation temperature of core ores, which represented the reaction temperature between the core ores and CaO pure reagent [31,57,63]. Due to the slight influence of holding time over 1150 °C on the fluidity of the original melt, the melt absorbability of core ores was also little affected by the holding time over 1150 °C. In addition, the MAI of limonite Ore-A was the highest, followed by goethite Ore-B, and that of hematites such as Ore-C, Ore-D, and Ore-E was the lowest. Furthermore, for the three hematites, the MAIs of Ore-C and Ore-E were higher than that of Ore-D. This may be related to the gangue composition, either SiO2 or Al2O3 in core ores [27].
Figure 7d shows the results of the strength of the bonding phases at different sintering parameters. It can be seen that the influences of sintering parameters such as the maximum sintering temperatures, binary basicity of the adhering fines, and the holding time over 1150 °C on the strength of the bonding phase were similar to their influences on the strength of the sinters. The strength of the bonding phase highly depends on the properties of pores and minerals [50,53,61,64]. The bonding phases were mounted in epoxy resin and ground to expose the viewing surface. Samples were then polished to a mirror finish and viewed using a microscope. Figure 8 shows the morphology of the bonding phase at different sintering parameters. The morphology of SFCA was platy at 1240 °C, and 1280 °C with the low basicity of adhering fines. As the maximum temperatures (Figure 8a–c) and binary basicity (Figure 8a,d,e) of adhering fines were increased, the morphology of SFCA was needle shaped. The size and number of pores gradually decreased with increasing of the maximum temperatures. When the binary basicity of the adhering fines was five (Figure 8d) and nine (Figure 8e), the size and number of the pores were very large, especially at the binary basicity of nine. A comparison of bonding phases with the same maximum temperature and binary basicity, but longer holding time over 1150 °C (Figure 8f,g) suggests that the morphology of SFCA was a mixture of needle-shaped and columnar, and the size and number of the pores decreased.
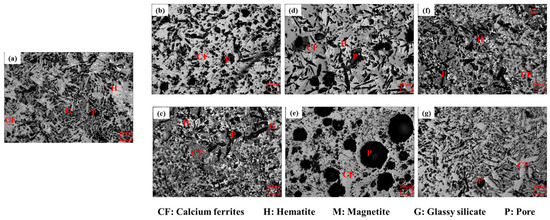
Figure 8.
Morphology of the bonding phase at different sintering parameters: (a) Base scheme-1280 °C; (b) A1 scheme-1240 °C; (c) A2 scheme-1320 °C; (d) B1 scheme-basicity of five; (e) B2 scheme-basicity of nine; (f) C1 scheme-6 min; (g) C2 scheme-9 min.
In addition, quantitative textural data were collected using point counting following the mineral classification scheme detailed in Honeyands [53,64]. Figure 9 shows the mineral composition of the bonding phase at different sintering parameters. When the maximum sintering temperature increased from 1240 °C to 1280 °C, the SFCA contents increased and pore decreased, resulting in the strength of the bonding phase increased. Moreover, the SFCA content decreased at 1320 °C. The formed melts were more fluid, which increased the expulsion of bubbles from the melt before solidification, and SFCA was decomposed to hematite, resulting in the strength of the bonding phase decreasing significantly [50,51,53,65]. At the same time, with increasing the binary basicity of adhering fines, the SFCA content increased while the hematite and magnetite contents decreased. However, since there were many large pores at the bonding phases with the binary basicity of five and nine, the strength of the bonding phase decreased sharply. In addition, as the holding time over 1150 °C was increased, the SFCA content increased, while both the contents of glassy silicate and pores decreased, which increased the strength of the bonding phase.
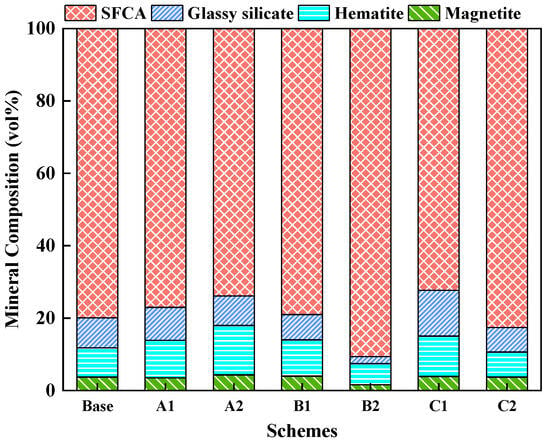
Figure 9.
Mineral composition of the bonding phase in different sintering parameters.
4. Discussion
4.1. Influence of Fluidity of Effective Melt on the Strength of the Sinter
The quantity of the bonding phase was influenced by the original melt and the melt absorbability of core ore. To clarify the influence of the original melt on the strength of the sinter, the relationship between them was analyzed and the result is shown in Figure 10. By increasing the fluidity of the original melt, the strength of the sinter increased first and then decreased, and it reached the maximum value when the fluidity of original melt was about 2.15. When the fluidity of the original melt was excessively over 3.0 (e.g., scheme A2 and B2), the strength of the sinter was lower than 40%. Although the melt could effectively bond the un-melt core ores, the strength of the bonding phase was low, which also finally led to a decrease in the strength of the sinter [6]. Furthermore, the influence of the strength of the bonding phase on the strength of the sinter is discussed in the next section.
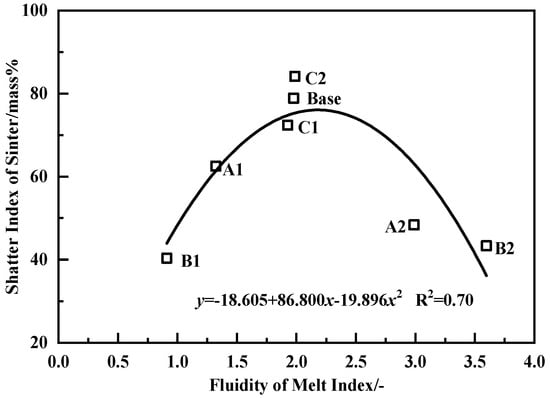
Figure 10.
Correlativity of the fluidity of the original melt with the strength of the sinter.
Figure 11 shows the relationship between the melt absorbability of core ores and the strength of the sinter. As the MAIs of core ores increased, the strength of the sinter decreased linearly. Due to the formation of the secondary bonding phases between the original melts and core ores, the quantity of the effective bonding phase decreased by the higher MAI of core ore decreased. The iron oxide, SiO2, and Al2O3 compositions of core ores fused into the secondary bonding phase, which resulted in its lower fluidity. The influencing factors of the melt absorbability of core ores were iron mineral type, and the gangue compositions, such as SiO2 or Al2O3. They inhibited melt penetration depth, and the impact of Al2O3 content was larger [27,31,45,66,67,68,69]. These factors weakened the effective bonding zone of the bonding phase, which resulted in decreasing the strength of the sinter.
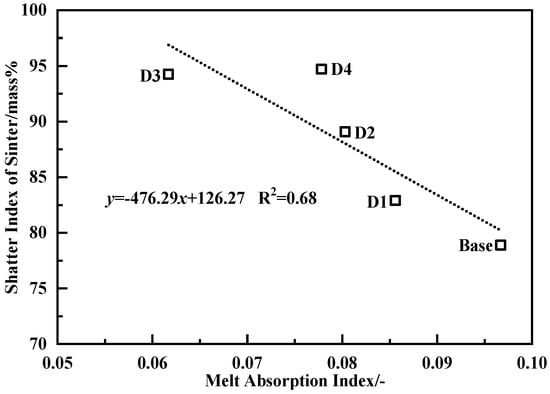
Figure 11.
Correlativity of melt absorbability of core ores with the strength of the sinter.
4.2. Influence of Strength of the Bonding Phase on the Strength of the Sinter
To clarify the influence of the quality of the bonding phase on the strength of the sinter, the relationship between the strength of the bonding phase and the strength of the sinter was analyzed, and the result is shown in Figure 12. It indicated that there was an exponential relationship between the strength of the sinter and the strength of the bonding phase. When the binary basicity of adhering fines was 5.0, the strength of the bonding phase was higher. However, the fluidity of the original melt was insufficient, which led to bonding weakly among the un-melted core ores. Sufficient melts were an indispensable condition to ensure the high strength of the sinter [50]. Nevertheless, when the un-melted core ores were effectively bonded, the strength of the bonding phase was the main influencing factor in the strength of the sinter [26,31]. In the A2 and B2 schemes, though the fluidity of the original melt was great, the strength of the bonding phase was low, which led to a decrease in the strength of the sinter.
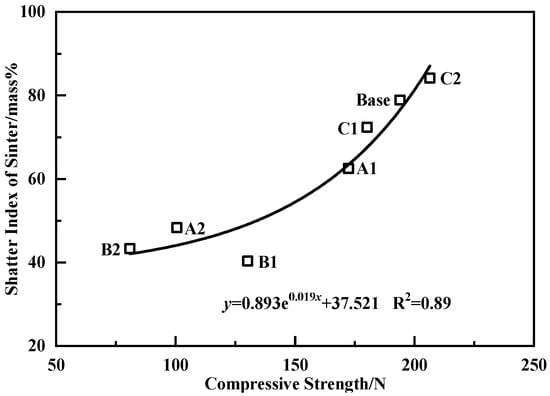
Figure 12.
Correlativity of the strength of the bonding phase with the strength of the sinter.
4.3. Multivariable Linear Regression Analysis
From the above results, it was found that the strength of the sinter was influenced by the strength of the bonding phase, fluidity of the original melt, and melt absorbability of core ores. To clarify the influence degree of the above variables on the strength of the sinter, the independent variables were regressed with the ordinary least square model using the SPSS statistical analysis software. The strength of the sinter, fluidity of original melt, melt absorbability of core ore, and strength of the bonding phase were, respectively, expressed as the dependent variable SI and dependent variables FMI, MAI, and CS. After running the SPSS linear regression procedure [70], obtain the results of Table 3. It shows the value of Durbin–Waston was 1.661. The Durbin–Waston test was used to check the presence of autocorrelation in the residuals, which has a statistical impact on decreasing the significance of a trend. The Durbin–Waston value was between 1.5 and 2.5, which means no autocorrelation among residuals. The R Square was 0.98. The regression coefficients of three independent variables (FMI, MAI and CS) were highly significant (p < 0.005). In addition, SPSS provides collinearity statistics: tolerance and variance inflation factor (VIF). VIF is reciprocal of tolerance. When the value of tolerance is small (close to 0), the variable is almost a linear combination of the other variables. Variables with low tolerance tend to have large VIF, so variables with low tolerance and large VIF suggest that they have collinearity [25,26]. Table 3 shows that the tolerances of three independent variables (FMI, MAI, and CS) were between 0.3 and 0.7, and the VIFs were less than 5 (3.156, 2.901, 1.460). It suggests that there is no collinearity among the three independent variables. The unstandardized and standardized regression equations are shown in Equation (2) and Equation (3), respectively.
SI = −19.354 + 20.847 FMI − 421.034 MAI + 0.513 CS
0.90 ≤ FMI ≤ 3.00, 0.06 ≤ MAI ≤ 0.13, 80 ≤ CS ≤ 206
0.90 ≤ FMI ≤ 3.00, 0.06 ≤ MAI ≤ 0.13, 80 ≤ CS ≤ 206
SI= 0.739 FMI − 0.422 MAI + 1.094 CS

Table 3.
Results of linear regression.
Due to the small number of samples in this paper, it is difficult to cover the entire range of MAI, FMI, and CS. Therefore, Equation (2) is only applicable to FMI, MAI, and CS in the range of 0.90~3.00, 0.06~0.13, and 80~206 N, respectively, which has some limitations. According to Equation (2), we can obtain the calculated SI. The fitting results of the calculated and measured SI are shown in Figure 13. It suggests that the calculated and measured SI is in good agreement. The relationship between SI and FMI, MAI, and CS can be quantified by Equation (2). It indicates there is a negative correlation between the melt absorbability of core ore and the strength of the sinter. However, both the strength of the bonding phase and the fluidity of the original melt have a negative correlation with the strength of the sinter. Equation (3) shows that the regression coefficients of three independent variables (CS, FMI, and MAI) were 1.094, 0.739, and −0.422, respectively. It suggests that the strength of the bonding phase was the main influencing factor in the strength of the sinter. Moreover, compared to the melt absorbability of core ores, the fluidity of the original melts had a greater influence on the strength of the sinter.
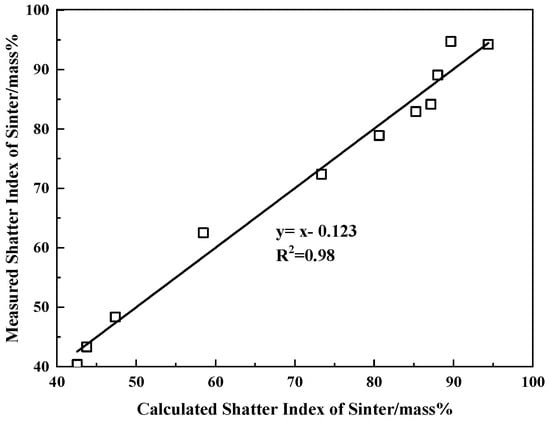
Figure 13.
Relationship between measured and calculated shatter index of sinter.
5. Conclusions
(1) Although the fluidity of the initial melt increased by increasing the maximum sintering temperature and the binary basicity of the adhering fines, the mineral composition and pore structure of the bonding phase also changed, thereby affecting the strength of the bonding phase and the strength of the sinter. The strength of the bonding phase increased by prolonging the holding time at the high temperature and the quality of the effective bonding phase improved by reducing melt absorbability of core ores, which improved the strength of the sinter.
(2) The quantity of the bonding phase was influenced by the fluidity of the original melt and melt absorbability of core ores, and the quality of the bonding phase was affected by the mineral compositions and pore structure. There was an inverted V-shaped and an exponential function relationship between the fluidity of the original melt and the strength of the bonding phase with the strength of the sinter. The melt absorbability of core ore had a negative linear correlation with the strength of the sinter.
(3) There is a multivariate linear relationship between the strength of the sinter (SI) with the strength of the bonding phase (CS), fluidity of original melt (FMI), and melt absorbability of core ores (MAI). The strength of the sinter can be calculated by the following equation: SI = −19.354 + 20.847 FMI − 421.034 MAI + 0.513 CS, with the FMI, MAI, and CS in the range of 0.90~3.00, 0.06~0.13, and 80~206 N, respectively. Moreover, there was no collinearity among FMI, MAI, and CS, and the standardized multivariable linear regression coefficients were 0.739, −0.422, and 1.094, respectively.
Author Contributions
Conceptualization, L.W. and Z.Q.; literature search, F.G., Y.F. and Z.Q.; methodology, F.G., Y.F. and L.W.; software, F.G. and Y.F.; validation, L.W. and Z.Q.; formal analysis, J.S.; investigation, L.W. and Z.Q.; data collection: F.G., Y.F., and L.W.; data curation, J.S. and Z.Q.; writing—original draft preparation, Y.F. and Z.Q.; writing—review and editing, J.S. and Z.Q.; visualization, F.G., Y.F. and Z.Q.; supervision, J.S.; project administration, Z.Q. and J.S.; funding acquisition, Z.Q. and J.S. All authors have read and agreed to the published version of the manuscript.
Funding
This research was funded by the Pilot Demonstration Project for the Contract Responsibility System of the Provincial Science and Technology Plan Project of Jiangxi Academy of Sciences (no. 2022YSBG50010, no. 2022YSBG21011 no. 2022YSBG21013 and no. 2023YSBG21009), the Provincial Basic Research Project of Jiangxi Academy of Sciences (no. 2023YSTZX02, no.2022YJC1003 and 2023YRCS002).
Data Availability Statement
All data are available and can be shared upon request.
Acknowledgments
We are grateful to Jiahao Liu and Jinsheng Wang from Fangda Special Steel of Science and Technology Co., Ltd. for providing some helps for this study. The authors acknowledge the financial support from the Voyage Engineering Project of Jiangxi Province.
Conflicts of Interest
The author Laixin Wang was employed by the company MCC Huatian Engineering & Technology Corporation. The remaining authors declare that the research was conducted in the absence of any commercial or financial relationships that could be construed as a potential conflict of interest.
References
- Mohammad, S.; Patra, S.; Harichandan, B. Reductants in Iron Ore Sintering: A Critical Review. Fuel 2023, 332, 126194. [Google Scholar] [CrossRef]
- Lu, L.; Ishiyama, O.; Higuchi, T.; Matsumura, M.; Higuchi, K. Iron Ore Sintering. In Iron Ore, 2nd ed.; Lu, L., Ed.; Woodhead Publishing Series in Metals and Surface Engineering; Woodhead Publishing: Cambridge, UK, 2022; Chapter 15; pp. 489–538. ISBN 978-0-12-820226-5. [Google Scholar]
- Fernández-González, D.; Ruiz-Bustinza, I.; Mochón, J.; González-Gasca, C.; Verdeja, L.F. Iron Ore Sintering: Process. Miner. Process. Extr. Met. Rev. 2017, 38, 215–227. [Google Scholar] [CrossRef]
- Park, J.; Kim, E.; Suh, I.-K.; Lee, J. A Short Review of the Effect of Iron Ore Selection on Mineral Phases of Iron Ore Sinter. Minerals 2022, 12, 35. [Google Scholar] [CrossRef]
- Liu, D.; Loo, C.E. Importance of Melt Generation and Properties in Iron Ore Sintering. ISIJ Int. 2016, 56, 527–536. [Google Scholar] [CrossRef]
- Umadevi, T.; Brahmacharyulu, A.; Roy, A.K.; Mahapatra, P.C.; Prabhu, M.; Ranjan, M. Influence of Iron Ore Fines Feed Size on Microstructure, Productivity and Quality of Iron Ore Sinter. ISIJ Int. 2011, 51, 922–929. [Google Scholar] [CrossRef]
- Yang, S.; Yu, C.; He, S.; Zhao, Y.; Yang, S.; Liu, H. Influence of chemical composition in iron ore powder on basic characteristics of sintering at high temperature. China Met. 2023, 33, 47–54. [Google Scholar] [CrossRef]
- Li, Y.; Wang, B.; Zhou, Z.; Yang, A.; Bai, Y. Research Progress of Intelligent Ore Blending Model. Metals 2023, 13, 379. [Google Scholar] [CrossRef]
- Chen, L.; Gu, Q.; Wang, R.; Feng, Z.; Zhang, C. Comprehensive Utilization of Mineral Resources: Optimal Blending of Polymetallic Ore Using an Improved NSGA-III Algorithm. Sustainability 2022, 14, 10766. [Google Scholar] [CrossRef]
- Yang, S.; Liu, H.; Sun, H.; Zhang, T.; Liu, S. Study on Influencing Factors of High-Temperature Basic Characteristics of Iron Ore Powder and Optimization of Ore Blending. Materials 2022, 15, 3329. [Google Scholar] [CrossRef]
- Huang, X.; Fan, X.; Chen, X.; Gan, M.; Ji, Z.; Zheng, R. A Novel Blending Principle and Optimization Model for Low-Carbon and Low-Cost Sintering in Ironmaking Process. Powder Technol. 2019, 355, 629–636. [Google Scholar] [CrossRef]
- Tang, J.; Wang, M.; Chu, M.; Shi, Q.; Zhang, Z. Process of ore blending optimization in sintering at home and abroad. Iron Steel 2024, 59, 102–113. [Google Scholar] [CrossRef]
- Bao, G.; Liu, L.; Han, X.; Duan, B.; Qin, L. Optimization of sintering raw material blending scheme based on RDI>3.15 mm response surface methodology. Iron Steel 2023, 58, 31–38. [Google Scholar] [CrossRef]
- Bao, G.; Liu, L.; Han, X.; Duan, B.; Qin, L.; Liu, Y. Optimization of sintering ore blending by response surface-satisfaction function method. Iron Steel 2023, 58, 41–50. [Google Scholar] [CrossRef]
- Hou, J.; Bai, C.; Hu, M.; Liu, X.; Huang, X.; Guo, L. Optimization on ore-blending of PMC concentrate and two typical limonite ores. Iron Steel 2023, 58, 45–52+60. [Google Scholar] [CrossRef]
- Donskoi, E.; Manuel, J.R.; Clout, J.M.F.; Zhang, Y. Mathematical Modeling and Optimization of Iron Ore Sinter Properties. Isr. J. Chem. 2007, 47, 373–379. [Google Scholar] [CrossRef]
- Li, H.; Pinson, D.J.; Zulli, P.; Lu, L.; Longbottom, R.J.; Chew, S.J.; Monaghan, B.J.; Zhang, G. Interaction between Mineral Phases in a Hematite Iron Ore and Fluxing Materials during Sintering. Met. Mater. Trans. B 2021, 52, 267–281. [Google Scholar] [CrossRef]
- Li, H.; Pinson, D.J.; Zulli, P.; Lu, L.; Longbottom, R.J.; Chew, S.J.; Monaghan, B.J.; Zhang, G. Interaction between Mineral Phases in a Goethitic Iron Ore and Fluxing Materials during Sintering. Met. Mater. Trans. B 2021, 52, 996–1011. [Google Scholar] [CrossRef]
- Umadevi, T.; Bandopadhyay, U.K.; Mahapatra, P.C.; Prabhu, M.; Ranjan, M. Influence of Limestone Particle Size on Iron Ore Sinter Properties and Productivity. Steel Res. Int. 2010, 81, 419–425. [Google Scholar] [CrossRef]
- Niu, L.; Zhang, J.; Wang, Y.; Kang, J.; Li, S.; Shan, C.; Li, Z.; Liu, Z. Iron Ore Granulation for Sinter Production: Developments, Progress, and Challenges. ISIJ Int. 2023, 63, 601–612. [Google Scholar] [CrossRef]
- You, Y.; Guo, J.; Zheng, Z.; Li, G.; Li, Y.; Lv, X.; Yang, R. Comparisons of Iron Ore Granulation and Sintering Performance between Horizontal High-Shear Granulators and Drum Granulators. Powder Technol. 2022, 402, 117367. [Google Scholar] [CrossRef]
- Wu, S.; Que, Z.; Li, K. Strengthening Granulation Behavior of Specularite Concentrates Based on Matching of Characteristics of Iron Ores in Sintering Process. J. Iron. Steel Res. Int. 2018, 25, 1017–1025. [Google Scholar] [CrossRef]
- Umadevi, T.; Deodhar, A.V.; Mahapatra, P.C.; Prabhu, M.; Ranjan, M. Influence of Coating Granulation Process on Iron Ore Sinter Quality and Productivity. Steel Res. Int. 2010, 81, 716–723. [Google Scholar] [CrossRef]
- Cores, A.; Babich, A.; Muñiz, M.; Ferreira, S.; Mochon, J. The Influence of Different Iron Ores Mixtures Composition on the Quality of Sinter. ISIJ Int. 2010, 50, 1089–1098. [Google Scholar] [CrossRef]
- Otomo, T.; Takasaki, Y.; Kawaguchi, T. Properties of Core Ore in Quasi-Particle Required for Large Amounts Usage of Limonitic Ores in Iron Ore Sintering Process. ISIJ Int. 2005, 45, 532–537. [Google Scholar] [CrossRef]
- Okazaki, J.; Higuchi, K.; Hosotani, Y.; Shinagawa, K. Influence of Iron Ore Characteristics on Penetrating Behavior of Melt into Ore Layer. ISIJ Int. 2003, 43, 1384–1392. [Google Scholar] [CrossRef]
- Wu, S.-L.; Su, B.; Qi, Y.-H.; Kou, M.-Y.; Li, Y.; Zhang, W.-L. Melt Absorbability of Iron Ore Nuclei and Its Influence on Suitable Liquid Content of Sintered Body. Met. Mater. Trans. B 2017, 48, 2469–2480. [Google Scholar] [CrossRef]
- Li, B.; Zhou, H.; Huang, J.; Zhang, Z.; She, X.; Wang, J.; Wu, S.; Kou, M. Optimization of Iron Ore Blending Based on Replacing Australian Low Alumina Limonite. J. Iron Steel Res. Int. 2023, 30, 1675–1686. [Google Scholar] [CrossRef]
- Liang, Z.; Chen, J.; Huang, Z.; Huang, B. Characteristics and Sintering Mechanisms of Iron Ores with a High Proportion of High-Al2O3 Limonite. ACS Omega 2023, 8, 15951–15959. [Google Scholar] [CrossRef]
- He, H.; Lv, X.; Wang, J. Characteristics Evaluation and High Effective Utilization of Limonite Ores in Sintering Process. Min. Met. Explor. 2021, 38, 2271–2283. [Google Scholar] [CrossRef]
- Wu, S.; Zhang, G. Liquid Absorbability of Iron Ores and Large Limonite Particle Divided Adding Technology in the Sintering Process. Steel Res. Int. 2015, 86, 1014–1021. [Google Scholar] [CrossRef]
- Liu, D.; Liu, H.; Zhang, J.; Liu, Z.; Xue, X.; Wang, G.; Kang, Q. Basic Characteristics of Australian Iron Ore Concentrate and Its Effects on Sinter Properties during the High-Limonite Sintering Process. Int. J. Miner. Met. Mater. 2017, 24, 991–998. [Google Scholar] [CrossRef]
- Zhang, G.; Luo, G.; Chai, Y.; Song, W. Effect of limonite on morphology and micro-area composition of sinter calcium ferrite. Iron Steel 2024, 59, 22–32. [Google Scholar] [CrossRef]
- Chen, T.; Wan, J.; Hu, M.; Zhou, X.; Luo, Y.; Liu, J. Mineralization Behavior and Strengthening Mechanism of Limonitic Laterite Ore Sintering Process Enhanced by Calcined Lime Coating. JOM 2024, 76, 875–884. [Google Scholar] [CrossRef]
- Zhang, G.; Luo, G.; Chai, Y.; Tian, S.; Hao, S.; Ren, Q. Optimal allocation of limonite in sintering process. Chin. J. Eng. 2022, 44, 39–49. [Google Scholar] [CrossRef]
- Liu, D.; Zhang, J.; Liu, Z.; Li, K.; Wang, Y.; Wang, G. Effects of Liquid Infiltration Characteristics of Iron Ores with a High Proportion of Limonite on Sinter Strength. Met. Res. Technol. 2016, 113, 301. [Google Scholar] [CrossRef]
- Zhao, Q.; Xue, J. Sintering Test Research of High Proportion Limonite. In Proceedings of the 10th International Symposium on High-Temperature Metallurgical Processing; Jiang, T., Hwang, J.-Y., Gregurek, D., Peng, Z., Downey, J.P., Zhao, B., Yücel, O., Keskinkilic, E., Padilla, R., Eds.; Springer International Publishing: Cham, Switzerland, 2019; pp. 189–198. [Google Scholar]
- Chen, S.; Zhang, X.; Liang, J.; Wang, D.; Pan, W.; Zhang, Y. Experimental analysis on ultra-deep bed sintering in Shougang Jingtang. China Met. 2023, 33, 94–102. [Google Scholar] [CrossRef]
- Hayashi, N.; Komarov, S.V.; Kasai, E. Heat Transfer Analysis of the Mosaic Embedding Iron Ore Sintering (MEBIOS) Process. ISIJ Int. 2009, 49, 681–686. [Google Scholar] [CrossRef]
- Matsumura, M.; Yamaguchi, Y.; Hara, M.; Kamijo, C.; Kawaguchi, T.; Nakagawa, Y. Improvement of Sinter Productivity by Adding Return Fine on Raw Materials after Granulation Stage. ISIJ Int. 2013, 53, 34–40. [Google Scholar] [CrossRef]
- Zhang, G.; Wu, S.; Su, B.; Que, Z.; Hou, C.; Jiang, Y. Influencing Factor of Sinter Body Strength and Its Effects on Iron Ore Sintering Indexes. Int. J. Miner. Met. Mater. 2015, 22, 553–561. [Google Scholar] [CrossRef]
- Cheng, Z.; Yang, J.; Zhou, L.; Liu, Y.; Wang, Q. Sinter Strength Evaluation Using Process Parameters under Different Conditions in Iron Ore Sintering Process. Appl. Therm. Eng. 2016, 105, 894–904. [Google Scholar] [CrossRef]
- Zhang, B.; Zhou, J.; Li, M. Prediction of Sinter Yield and Strength in Iron Ore Sintering Process by Numerical Simulation. Appl. Therm. Eng. 2018, 131, 70–79. [Google Scholar] [CrossRef]
- Li, H.; Zhang, J.; Pei, Y.; Zhao, Z.; Ma, Z. Melting Characteristics of Iron Ore Fine during Sintering Process. J. Iron Steel Res. Int. 2011, 18, 11–15. [Google Scholar] [CrossRef]
- Webster, N.A.S.; Pownceby, M.I. Exploring the Relationship Between Fe-Rich SFCA and SFCA-III and Their Presence in Sinter Strand and Pot-Grate Sinter. ISIJ Int. 2024, 64, 803–807. [Google Scholar] [CrossRef]
- Chen, X.; Wang, W.; Yang, D.; Zheng, H.; Wang, B. Mineralization Characteristics of Iron Ore Sinter and the Effects of Cooling Rate on Mineral Phase Structure. ISIJ Int. 2023, 63, 261–270. [Google Scholar] [CrossRef]
- Wu, Y.; Gao, L. Effect of high-silicon iron ore on sintered on ore sintering process and metallurgical properties. Iron Steel 2024, 59, 25–35. [Google Scholar] [CrossRef]
- Ding, C.; Yang, T.; Long, H.; Han, F.; Qiu, J.; Luo, Y. Effect of w(MgO)/w(Al2O3) on sintered ore mineralization characteristics and metallurgical properties. Iron Steel 2023, 58, 25–33. [Google Scholar] [CrossRef]
- Shen, F.; An, H.; Jiang, X.; Ni, J.; Zheng, H.; Gao, Q. Research progress on sillico-ferrite of calcium and aluminum (SFCA) bonding phase in sintering process. Iron Steel 2024, 59, 1–12. [Google Scholar] [CrossRef]
- Nguyen, T.B.T.; Singh, T.; O’Dea, D.; Matthews, L.; Honeyands, T. Experimental Analysis of the Melt Fraction—Mechanical Strength Relationship for Iron Ore Sinter Analogues. Powder Technol. 2024, 439, 119698. [Google Scholar] [CrossRef]
- Hapugoda, S.; Lu, L.; Donskoi, E.; Manuel, J. Mineralogical Quantification of Iron Ore Sinter. Miner. Process. Extr. Met. 2016, 125, 156–164. [Google Scholar] [CrossRef]
- Clout, J.M.F.; Manuel, J.R. Mineralogical, Chemical, and Physical Metallurgical Characteristics of Iron Ore. In Iron Ore, 2nd ed.; Lu, L., Ed.; Woodhead Publishing Series in Metals and Surface Engineering; Woodhead Publishing: Cambridge, UK, 2022; Chapter 2; pp. 59–108. ISBN 978-0-12-820226-5. [Google Scholar]
- Honeyands, T.; Manuel, J.; Matthews, L.; O’Dea, D.; Pinson, D.; Leedham, J.; Zhang, G.; Li, H.; Monaghan, B.; Liu, X.; et al. Comparison of the Mineralogy of Iron Ore Sinters Using a Range of Techniques. Minerals 2019, 9, 333. [Google Scholar] [CrossRef]
- Wu, S.; Que, Z.; Zhai, X.; Li, K. Effect of Characteristics of Fine Iron Ores on the Granulation Behavior of Concentrate in Sintering Granulation Process. Met. Res. Technol. 2018, 115, 202. [Google Scholar] [CrossRef]
- Que, Z.; Wu, S.; Zhai, X.; Li, K. Effect of Characteristics of Coarse Iron Ores on the Granulation Behaviour of Concentrates in the Sintering Process. Ironmak. Steelmak. 2019, 46, 246–252. [Google Scholar] [CrossRef]
- Yuan, L.; Fan, X.; Can, M.; Yang, G.; Wang, Y. Structure Model of Granules for Sintering Mixtures. J. Iron Steel Res. Int. 2014, 21, 905–909. [Google Scholar] [CrossRef]
- Wu, S.; Zhang, G.; Chen, S.; Su, B. Influencing Factors and Effects of Assimilation Characteristic of Iron Ores in Sintering Process. ISIJ Int. 2014, 54, 582–588. [Google Scholar] [CrossRef]
- Que, Z.; Ai, X.; Wu, S. Reduction of NOx Emission Based on Optimized Proportions of Mill Scale and Coke Breeze in Sintering Process. Int. J. Miner. Met. Mater. 2021, 28, 1453–1461. [Google Scholar] [CrossRef]
- Oliveira, D.; Wu, S.; Dai, Y.; Xu, J.; Chen, H. Sintering Properties and Optimal Blending Schemes of Iron Ores. J. Iron Steel Res. Int. 2012, 19, 1–5. [Google Scholar] [CrossRef]
- Que, Z.; Ai, X. Effects of Iron Ores on the Combustion Behavior of Coke and NOx Emission during Sintering Process. ISIJ Int. 2021, 61, 1412–1422. [Google Scholar] [CrossRef]
- Honeyands, T.; Nguyen, T.B.T.; Pinson, D.; Connolly, P.R.J.; Pownceby, M.I.; Manuel, J.; Matthews, L.; Leedham, J.; Singh, T.; O’Dea, D.P. Variation in Iron Ore Sinter Mineralogy with Changes in Basicity. Minerals 2022, 12, 1249. [Google Scholar] [CrossRef]
- Webster, N.A.S.; Pownceby, M.I.; Madsen, I.C.; Studer, A.J.; Manuel, J.R.; Kimpton, J.A. Fundamentals of Silico-Ferrite of Calcium and Aluminum (SFCA) and SFCA-I Iron Ore Sinter Bonding Phase Formation: Effects of CaO:SiO2 Ratio. Met. Mater. Trans. B 2014, 45, 2097–2105. [Google Scholar] [CrossRef]
- Zhu, J.; Wu, S.; Fan, J.; Zhang, G.; Que, Z. Effect of the Separation of Large Limonite Ore Particles in the Granulation Process of Sinter Raw Materials. ISIJ Int. 2013, 53, 1529–1537. [Google Scholar] [CrossRef][Green Version]
- Harvey, T.; Pownceby, M.I.; Chen, J.; Webster, N.A.S.; Nguyen, T.B.T.; Matthews, L.; O’Dea, D.; Honeyands, T. Effect of Temperature, Time, and Cooling Rate on the Mineralogy, Morphology, and Reducibility of Iron Ore Sinter Analogues. JOM 2021, 73, 345–355. [Google Scholar] [CrossRef]
- Pownceby, M.I.; Webster, N.A.S.; Manuel, J.R.; Ware, N. The Influence of Ore Composition on Sinter Phase Mineralogy and Strength. Miner. Process. Extr. Met. 2016, 125, 140–148. [Google Scholar] [CrossRef]
- Han, H.; Shen, F.; Jiang, X.; Bi, C.; Zheng, H.; Gao, Q. Fundamental Mechanism of Effects of MgO on Sinter Strength. J. Iron Steel Res. Int. 2019, 26, 1171–1177. [Google Scholar] [CrossRef]
- Xin, R.; Guo, X. Effect of SiO2 on Crystallization of Calcium Ferrites in Fe2O3–CaO–SiO2–Al2O3 System in Cooling Process. Met. Mater. Trans. B 2022, 53, 1904–1919. [Google Scholar] [CrossRef]
- Ding, X.; Guo, X. The Sintering Characteristics of Mixing SiO2 with Calcium Ferrite at 1473 K (1200 °C). Met. Mater. Trans. B 2015, 46, 1742–1750. [Google Scholar] [CrossRef]
- Yang, D.; Wang, W.; Li, J.; Xu, R.; Wang, X.; Wang, G. Effect and Mechanism of Alumina on the Morphology and Mechanical Properties of Calcium Ferrite. Met. Mater. Trans. B 2020, 51, 776–785. [Google Scholar] [CrossRef]
- Pallant, J. SPSS Survival Manual: A Step by Step Guide to Data Analysis Using IBM SPSS, 7th ed.; Routledge: London, UK, 2020; ISBN 978-1-003-11745-2. [Google Scholar]
Disclaimer/Publisher’s Note: The statements, opinions and data contained in all publications are solely those of the individual author(s) and contributor(s) and not of MDPI and/or the editor(s). MDPI and/or the editor(s) disclaim responsibility for any injury to people or property resulting from any ideas, methods, instructions or products referred to in the content. |
© 2025 by the authors. Licensee MDPI, Basel, Switzerland. This article is an open access article distributed under the terms and conditions of the Creative Commons Attribution (CC BY) license (https://creativecommons.org/licenses/by/4.0/).