Article

Digital Model of Plan View Pattern Control for Plate Mills Based on Machine Vision and the DBO-RBF Algorithm

State Key Laboratory of Rolling and Automation, Northeastern University, Shenyang 110819, China
*
Authors to whom correspondence should be addressed.
Metals 2024, 14(1), 94; https://doi.org/10.3390/met14010094
Submission received: 10 December 2023 / Revised: 4 January 2024 / Accepted: 8 January 2024 / Published: 12 January 2024
(This article belongs to the Special Issue Metal Rolling and Heat Treatment Processing)

Abstract

:
Plan view pattern control (PVPC) is a highly effective means to improve the rectangularization of products and increase the yield of plate mills. By optimizing the parameters of PVPC, the effect of PVPC can be further improved. In this paper, a digital model for predicting and controlling crop patterns of plates is proposed based on the radial basis function (RBF) neural network optimized by the dung beetle optimizer (DBO) algorithm. Machine vision technology is used to obtain a digital description of the crop pattern of the rolled plates. An automatic threshold adjustment algorithm is proposed for the image processing of plate pattern photos during the rolling process. The error between the pattern data calculated through machine vision technology and the measured pattern data does not exceed 3 mm. The spread parameters of the RBF are optimized using DBO, and the digital model structure is established. The goodness of fit (R2) and the mean absolute error (MAE) are used as evaluation indicators. The results show that the digital model established based on DBO-RBF has good predictive and control performance, realizing intelligent prediction of the crop pattern of plates and the parameter optimization of PVPC. In practical applications, the crop cutting loss area of irregular deformation at the end of the plate can be reduced by 31%.

1. Introduction

Plate products are essential key materials for national economic construction. At present, the competition in the iron and steel industry is becoming increasingly fierce, so improving product yield and reducing resource loss are key to enhancing the competitiveness of plate enterprises [1,2]. In the plate rolling process, the crop cutting loss has a great influence on the yield of the product. This is because plate rolling is a typical three-dimensional deformation process, where the metal flows along the rolling direction and the vertical rolling direction. The deformation law of the crop is more complicated, resulting in irregular crop patterns on the rolled plate. The plan view pattern is the core quality indicator of plates and affects the yield and production efficiency of the plate product.
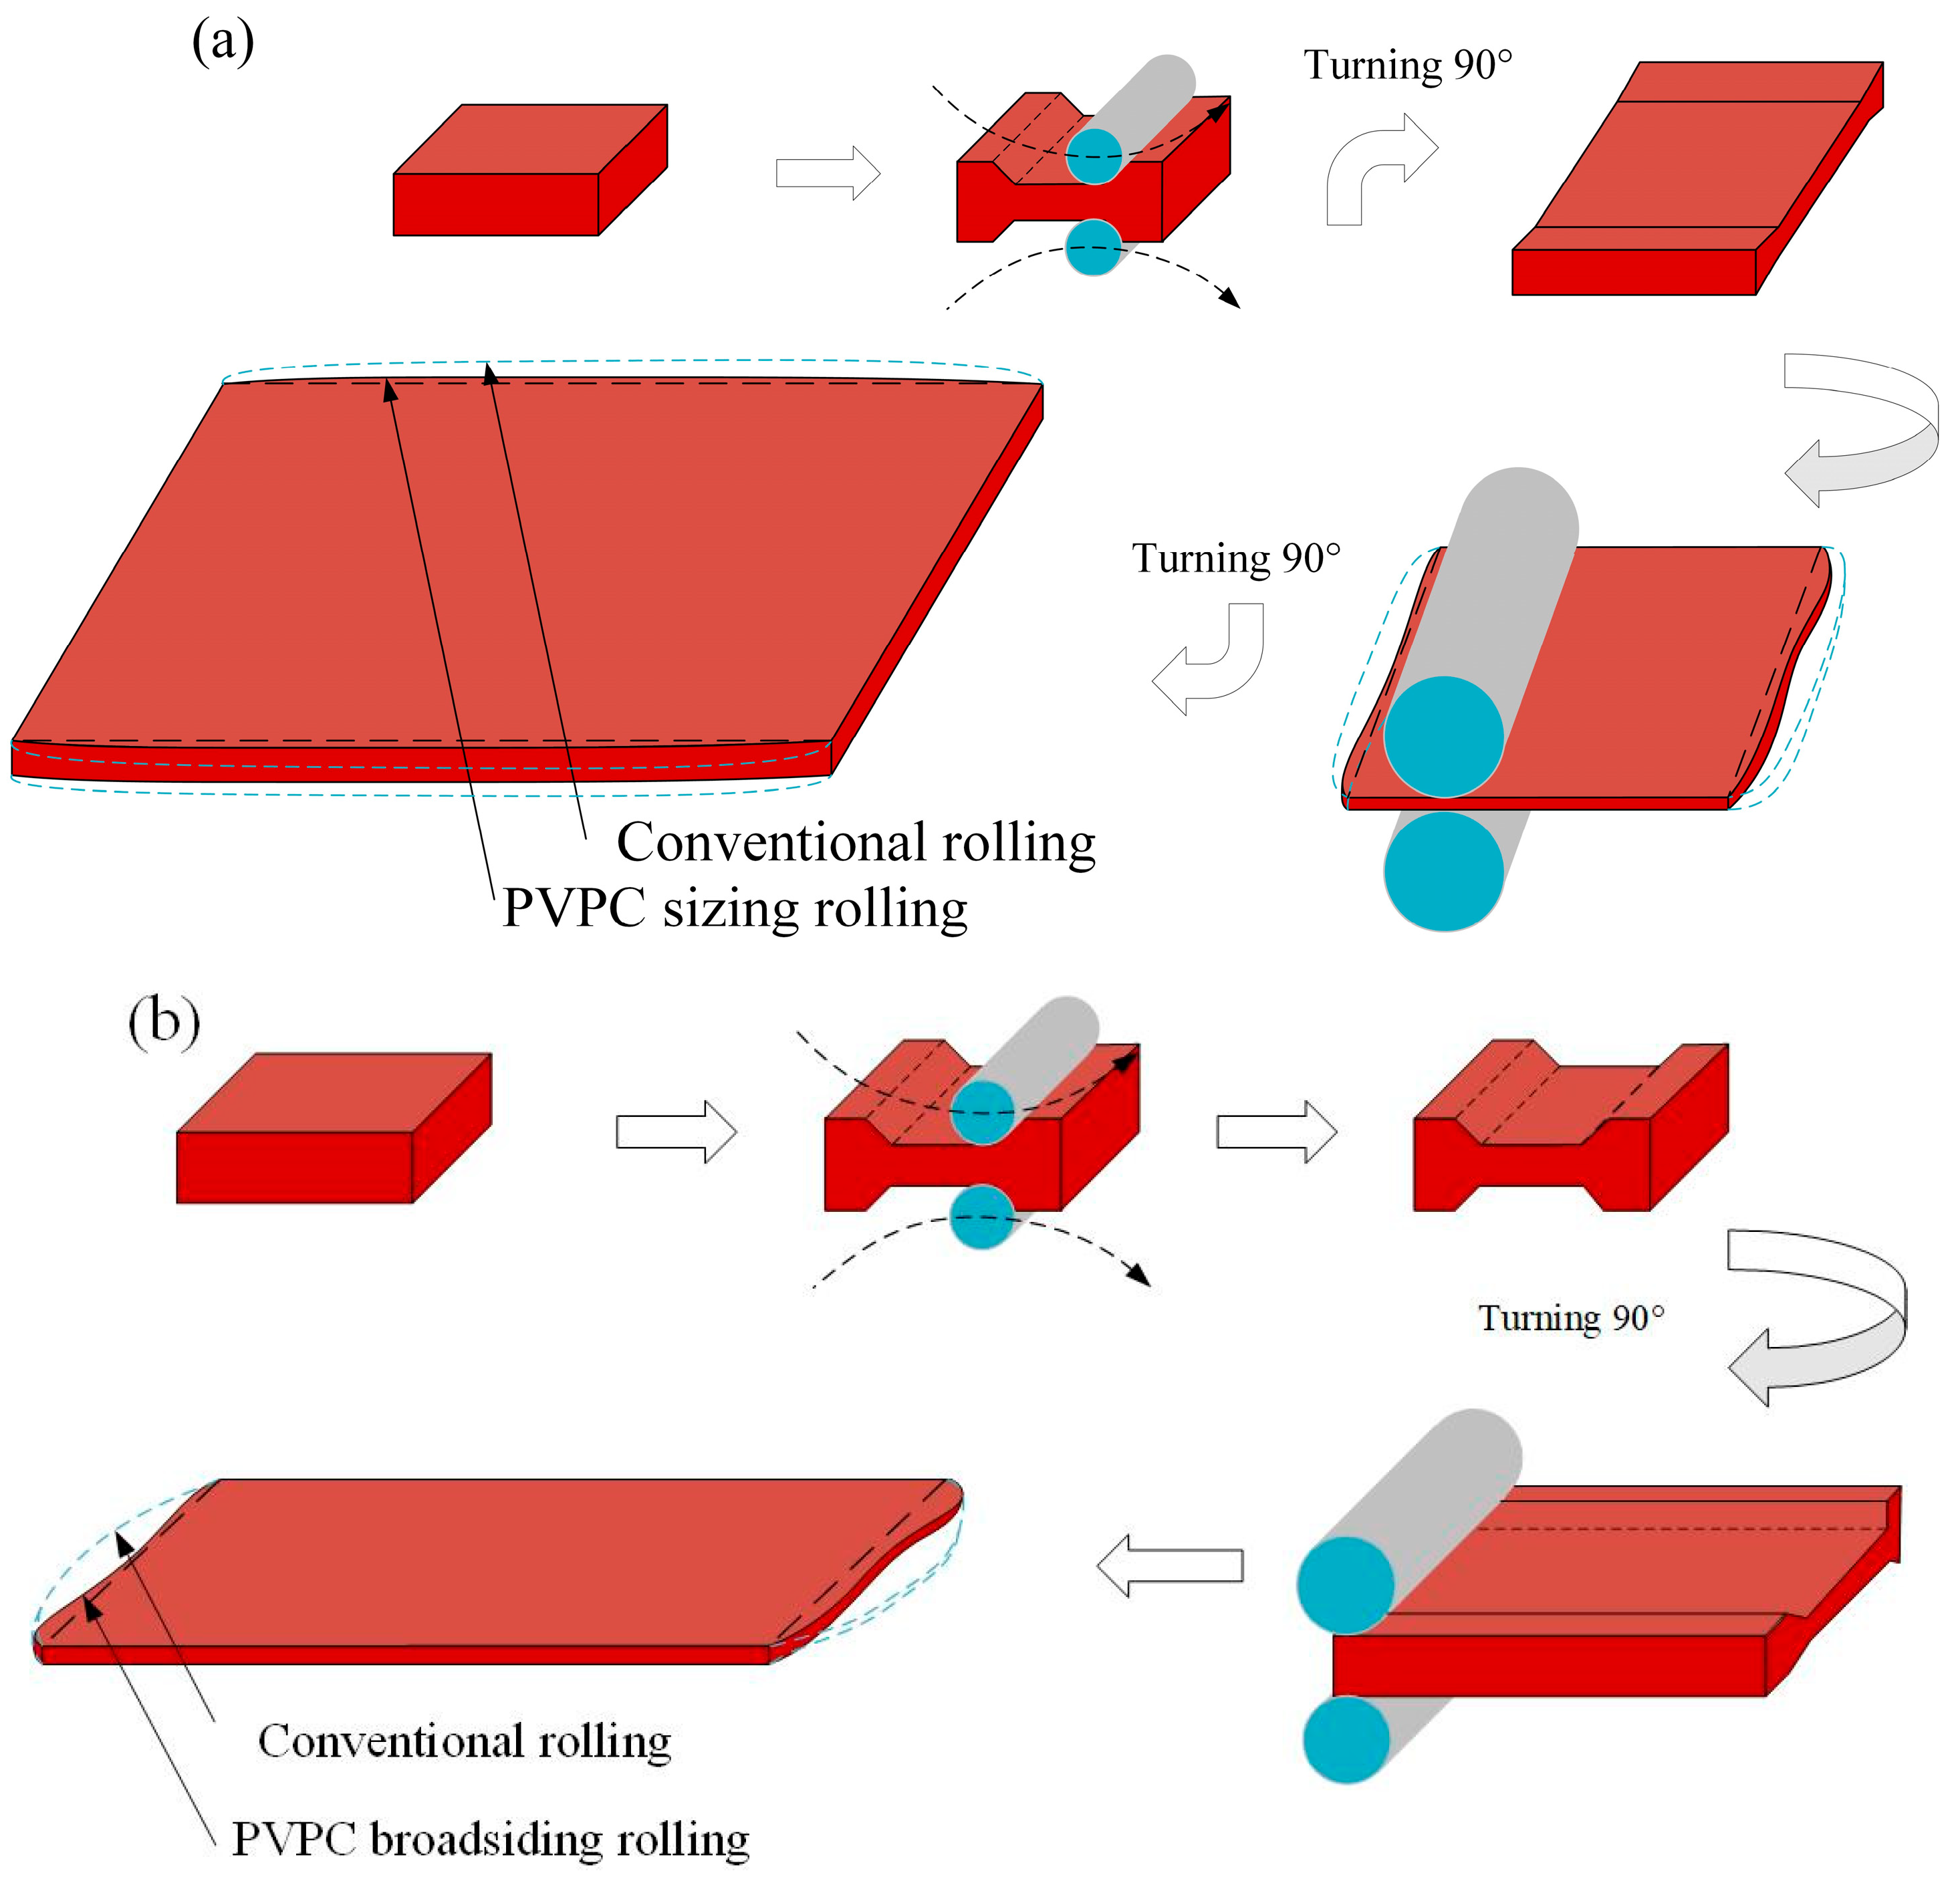
The basic principle of the plan view pattern control (PVPC) process is to quantitatively predict the pattern of the rolled plate and then convert it into the abnormal distribution of the plate thickness given at the last pass of the sizing or broadsiding phase according to the “constant volume principle”. This abnormal thickness distribution is used to improve the rectangularity of the rolled parts in the later rolling stages, as shown in Figure 1.
There are roughly three research methods for controlling the plan pattern of plates. The first is the analytical method, which is the earliest method of studying the deformation process of plate patterns. On the basis of the law of minimum resistance and the constant volume principle, the theoretical equation for three-dimensional metal flow can be obtained, which lays a foundation for the study of plan view pattern prediction of plates. However, in the derivation of these equations, it is necessary to make assumptions and simplifications, which will inevitably increase the model’s error. Moreover, in the plate rolling process, the irregular deformation regions of plates are difficult to express by strict theoretical models.
The second method is physical simulation and industrial testing. Based on theoretical models, this method involves carrying out physical simulation experiment in the laboratory and industrial experiments. The simulations and experimental results are used to improve the accuracy of the model. Hiroyasu Shigemori et al. [3] proposed a technique that uses a locally weighted regression model and performs parameter identification, and applied this method to plan view pattern control of plates. Yao et al. [4] established a prediction model and a control model, which reduced the shear loss of the product. Han [5] optimized the regression model of plan view pattern margin prediction and plan view pattern control and reduced the loss of head, tail, and edge. Deng [6] improved the prediction and control model of plan view pattern control of plates. Ni [7] combined the sequential quadratic programming (SQP) optimization algorithm with prediction models and control models of plan view pattern control. These studies improved the online application of PVPC function. Shen et al. [8] developed a mathematical model of PVPC and achieved good results in actual production.
In recent years, with the development of computer science, finite element simulation technology has become increasingly advanced, and it has been widely used in rolling process simulation. Liu [9] proposed the mathematical model of plan pattern prediction and control, based on finite element simulation. This model provides a theoretical basis for plate production. Liu [10] verified that the finite element simulation method can be used to study the PVPC process. The calculation results can provide a theoretical reference for the selection of rolling parameters. He [11] verified the accuracy of single-pass simulation using finite element tools. Zhao et al. [12] developed a full restart method based on the capabilities of the finite element software ANSYS LS-DYNA (https://www.ansys.com/products/structures/ansys-ls-dyna, accessed on 7 January 2024), and built a PVPC model to predict the plan view pattern of each roll pass. Gu [13] established the simulation rolling model of vertical–horizontal rolling. Yao et al. [4]. established a prediction and control model of plan view patterns. Ruan et al. [14,15]. developed a 3D rigid plastic thermomechanical finite element model to study the nonuniform plans of plates during hot rolling and improved the rectangularity of plates. Horie et al. [16] investigated the effect of dog bone width on the end profile of plan view patterns of plates in DBR. This study further explained the effects of plate size and dog bone height on the length of ‘fish tails‘. Ruan et al. [17]. established a three-dimensional rigid plastic finite element model of vertical–horizontal (V–H) hot rolling and elucidated the formation law of dog bone plans during vertical rolling and of width expansion behavior during horizontal rolling. Jiao et al. [18]. simplified the finite element simulation results, accurately calculating the forward slip and the time of the rolling process for the online application. Ding et al. [19] used the controllable point setting method to control the plan view patterns and used the finite element method to analyze the influence of different setting points and setting distances on the rectangularity of the finished product. However, the accuracy and reliability of the finite element simulation method often depend on the setting of rolling process parameters, modeling level, and boundary conditions, and whether the simulation conditions of load conditions are in accordance with the reality. Therefore, the accuracy of the model varies greatly.
In the context of Made in China 2025 and Industry 4.0, digitalization is in an important position. Digital Twins are thought of as a digital counterpart to physical production artefacts. Therefore, to be useful for every purpose in their environment they have a high resolution [20]. However, the realism of a digital twin benefits from data streams sampled at a sufficiently high frequency. This is especially true if the models used in the virtual replica are of the black box data driven type. These models are often based on machine learning algorithms with neural networks, thus, requiring rich data for training [21]. Gasiyarov, V.R. et al. [22] proposed a method for defining the two-mass system model parameters using the oscillograms obtained in the operating and emergency modes. The method was developed for the horizontal stand drives of a 5000 mm plate mill and is supported by numerical examples which have been applied to the development of an observer of the elastic torque of the rolling stand’s electromechanical system. Bassi, A et al. [23] developed a predictive model using a feed-forward neural network to determine the hardness values and phase fraction percentages of steel during heat treatment under specific cooling conditions. Their study enhanced the quality and performance of the resulting product.
The digitization of the iron and steel industry also provides a new idea for the research of plan view pattern control of plates. It is necessary to solve the problem that the traditional mechanism model of PVPC has reached a bottleneck. Some researchers have studied the plan view pattern control of plates by using machine learning algorithms. Zhao [24] applied the extreme learning machine algorithm to predict the length of different sections of the head curve of rolled pieces and optimized the intelligent prediction of the plan view pattern of plates. Based on a large quantity of simulation data from finite element simulation, Wang [25,26] established an intelligent prediction model of metal flow in the rolling process with the BP neural network, which has considerable accuracy and effectiveness. However, the data come from a large quantity of simulation results. Dong [27] developed an ISSA-ANN (BP) plan pattern prediction model based on actual production data from the field. An improved Sparrow search algorithm is used to optimize the initialization of weights and biases in BP. However, the number of hidden layers and nodes in the BP neural network is artificially set, so lacks the theoretical support of a model.
At present, there have been few studies on the application of machine learning algorithms to predict the plan view patterns of plates. This is because machine learning algorithms require a large number of data samples and the quality requirements for data samples are very high. Machine vision technology can effectively solve the above two problems. At present, machine vision technology has been applied in the rolling field. Schausberger et al. [28] proposed a way to track plates using cameras. Kim et al. [29]. proposed a plate plan view pattern measurement system based on a plan array camera and corresponding image mosaic algorithm. Kong et al. [30] proposed a method for measuring the lateral bending of plates using a line array camera.
At present, the image detection devices of plate production lines are normally situated at the finishing area, which cannot provide timely feedback regarding the effect of PVPC. Therefore, because the detection conditions of mill areas are complicated, it is necessary to study the development of image recognition algorithms.
In this paper, according to the requirements of the digitization of plan view pattern control, a machine vision detection device is installed near the mill area and an image processing algorithm is developed to obtain high-quality data according to the actual conditions of plate pattern detection image processing. A combinational optimization machine learning algorithm is proposed for a digital model of plan view pattern control and the digital model is applied to the actual production for verification. In the second section, the development of machine vision detection and image processing algorithms are introduced and the data sets of digital models are established. In the third section, a digital model of PVPC is established by combining DBO and RBF neural network machine learning algorithms. In the fourth section, the influence of plan view pattern control parameters on the irregular pattern of the crop is analyzed, and the PVPC control model is established. Also, the digital model effect is verified at the production site.
2. Plan View Pattern Detection and Actual Data Acquisition

2.1. Detection Device

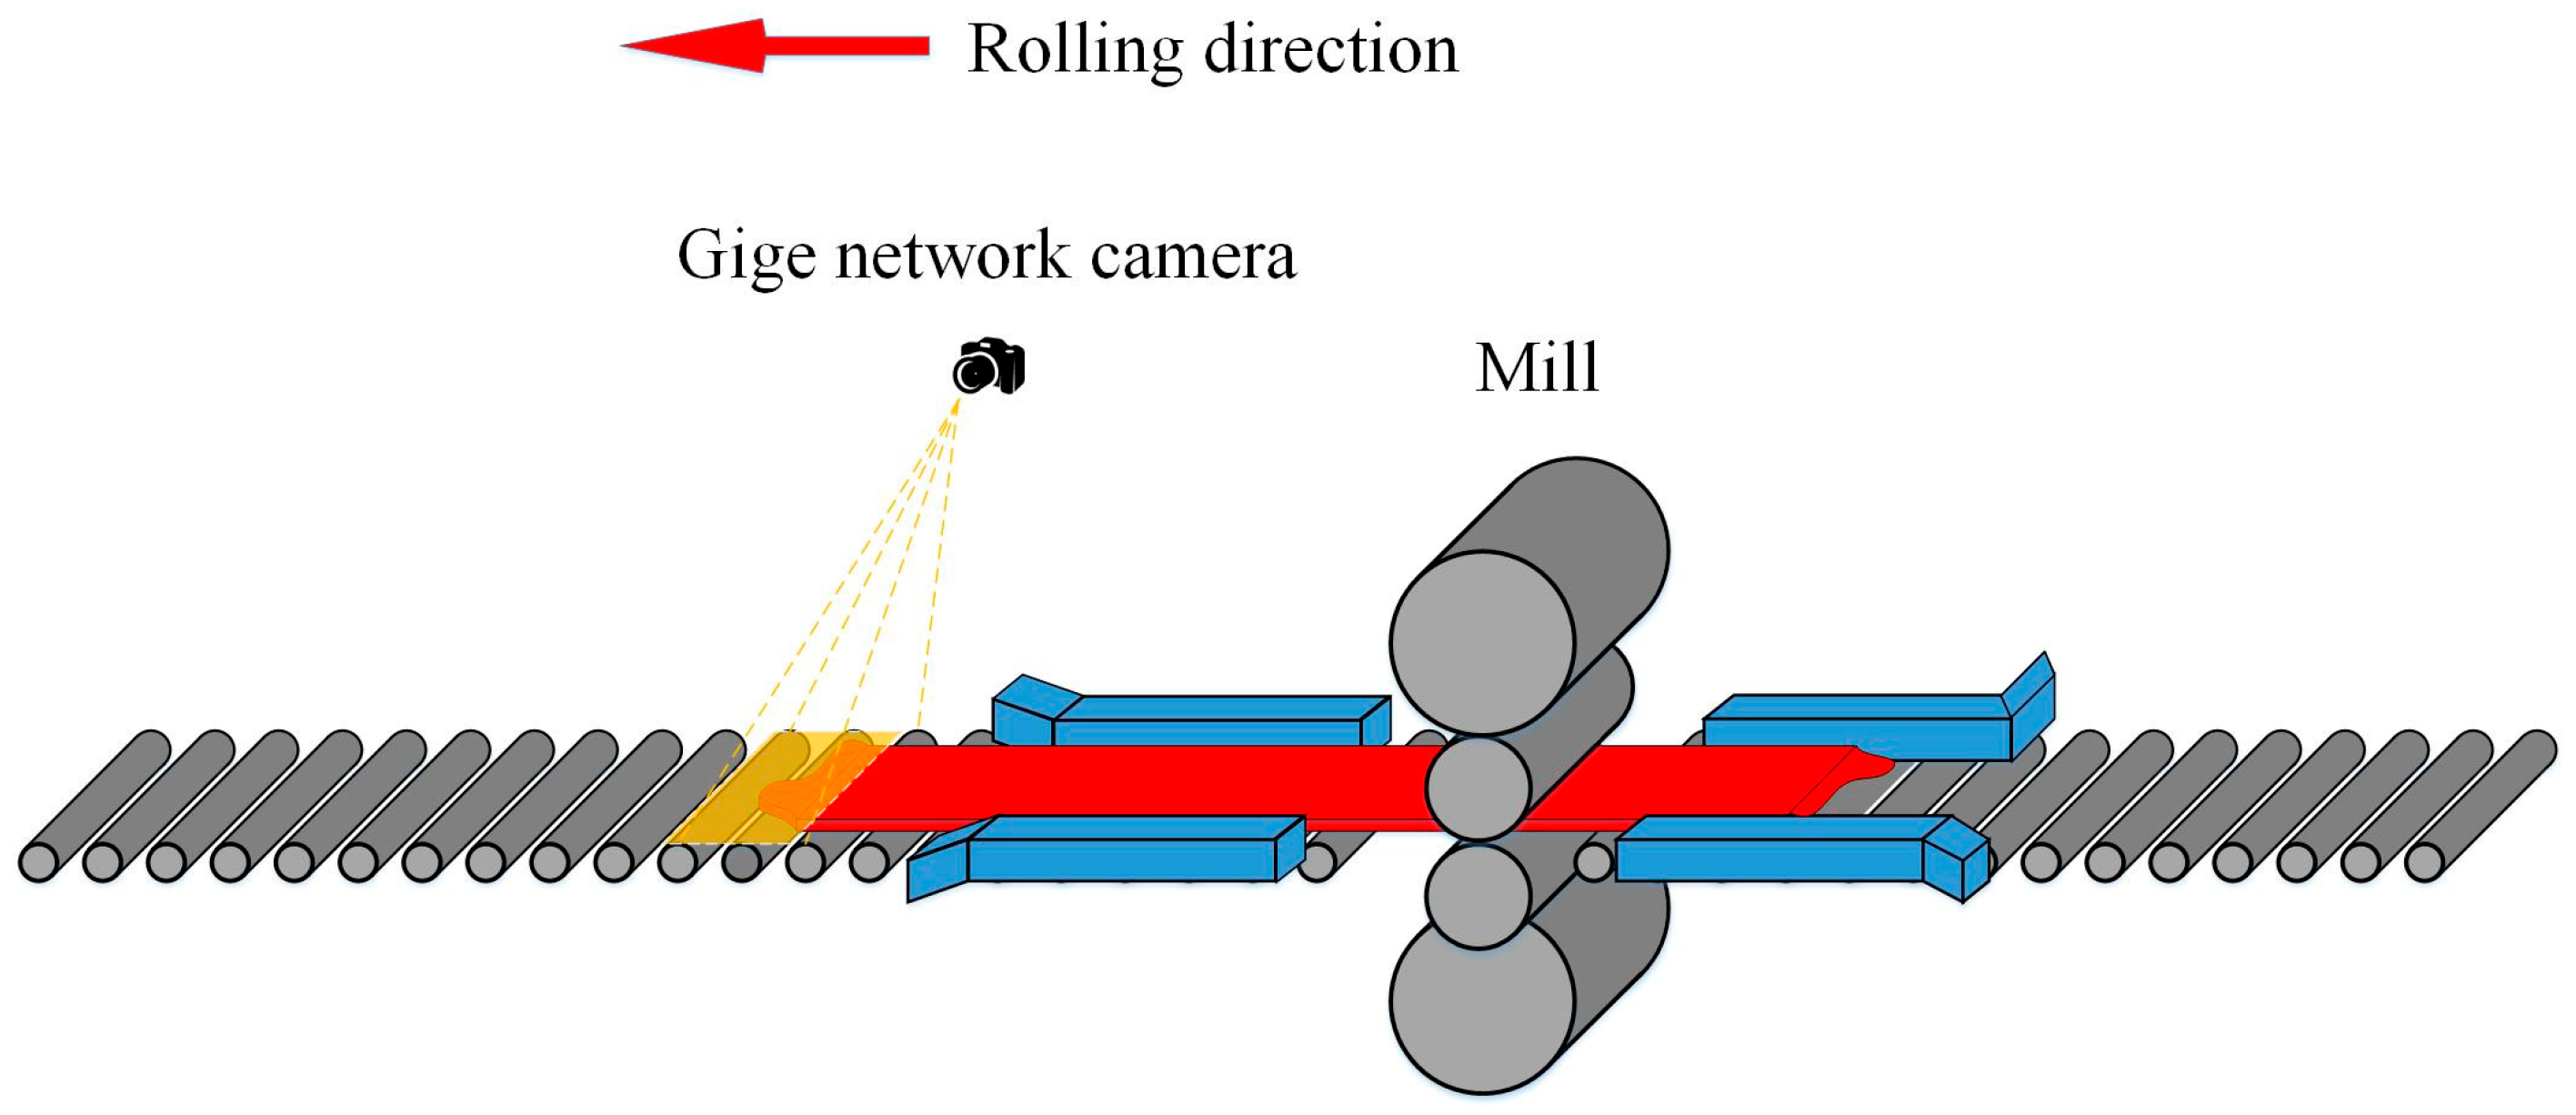
In order to provide timely feedback on the plan view pattern control effect of the rolled plate, a Gige network camera was installed at the exit of the rolling mill for image acquisition, as shown in Figure 2. Through the LAN and Gige camera link, the plate image data is obtained. Image recognition technology is used to obtain the edge data of the crop pattern of the plate and the recognition results are stored in the local disk.

2.2. Image Processing Algorithm

A harsh rolling environment due to water vapor, dust, and light interference, will affect the clarity of the image acquired by the measuring device, so it is necessary to use the image processing algorithm to treat the acquired image and obtain an accurate plate profile. In this process, an established and widely used image processing algorithm is selected, allowing gray-scale transform, projection transform, threshold processing, contour extraction, and the complete contour point coordinates to be obtained, as shown in Figure 3.
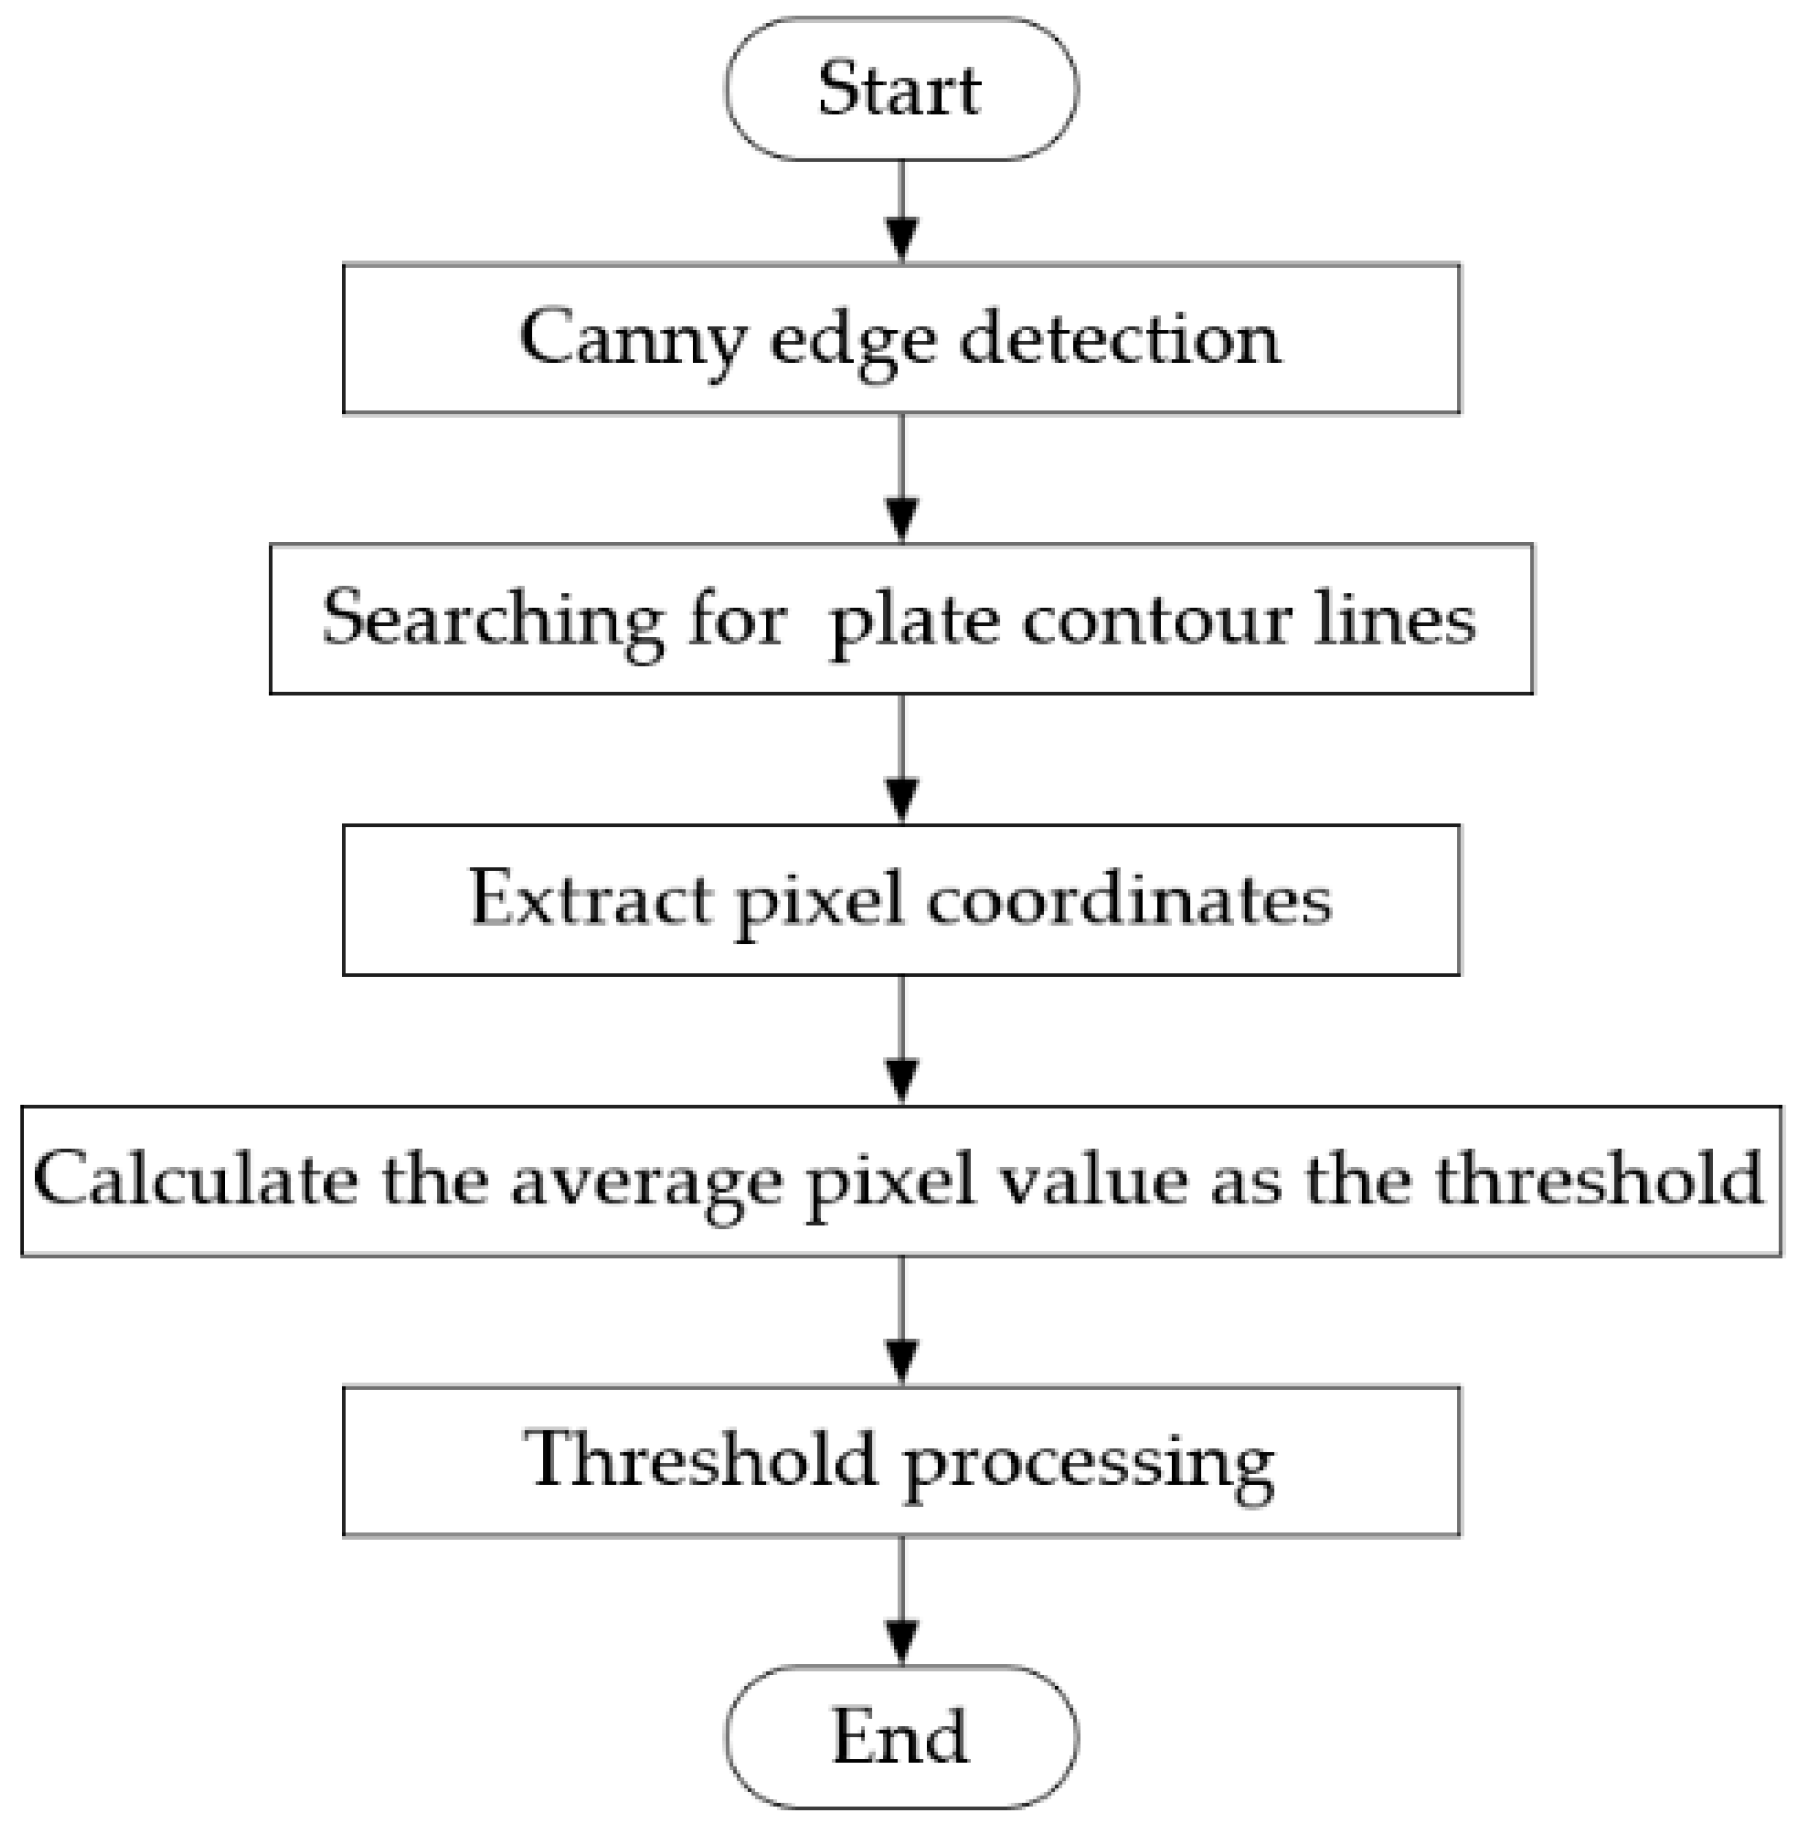
However, in the actual process of extracting contour points of plate images, due to the different temperature of plates at different passes and the different brightness and darkness of workshop light at different times, the values of image pixels will be affected. If a fixed threshold is selected for threshold processing, it is impossible to segment each plate image accurately, thus affecting the extraction of contour points. Therefore, an adaptive threshold adjustment method for plan view pattern image detection of plates is proposed. The algorithm flow is shown in Figure 4.
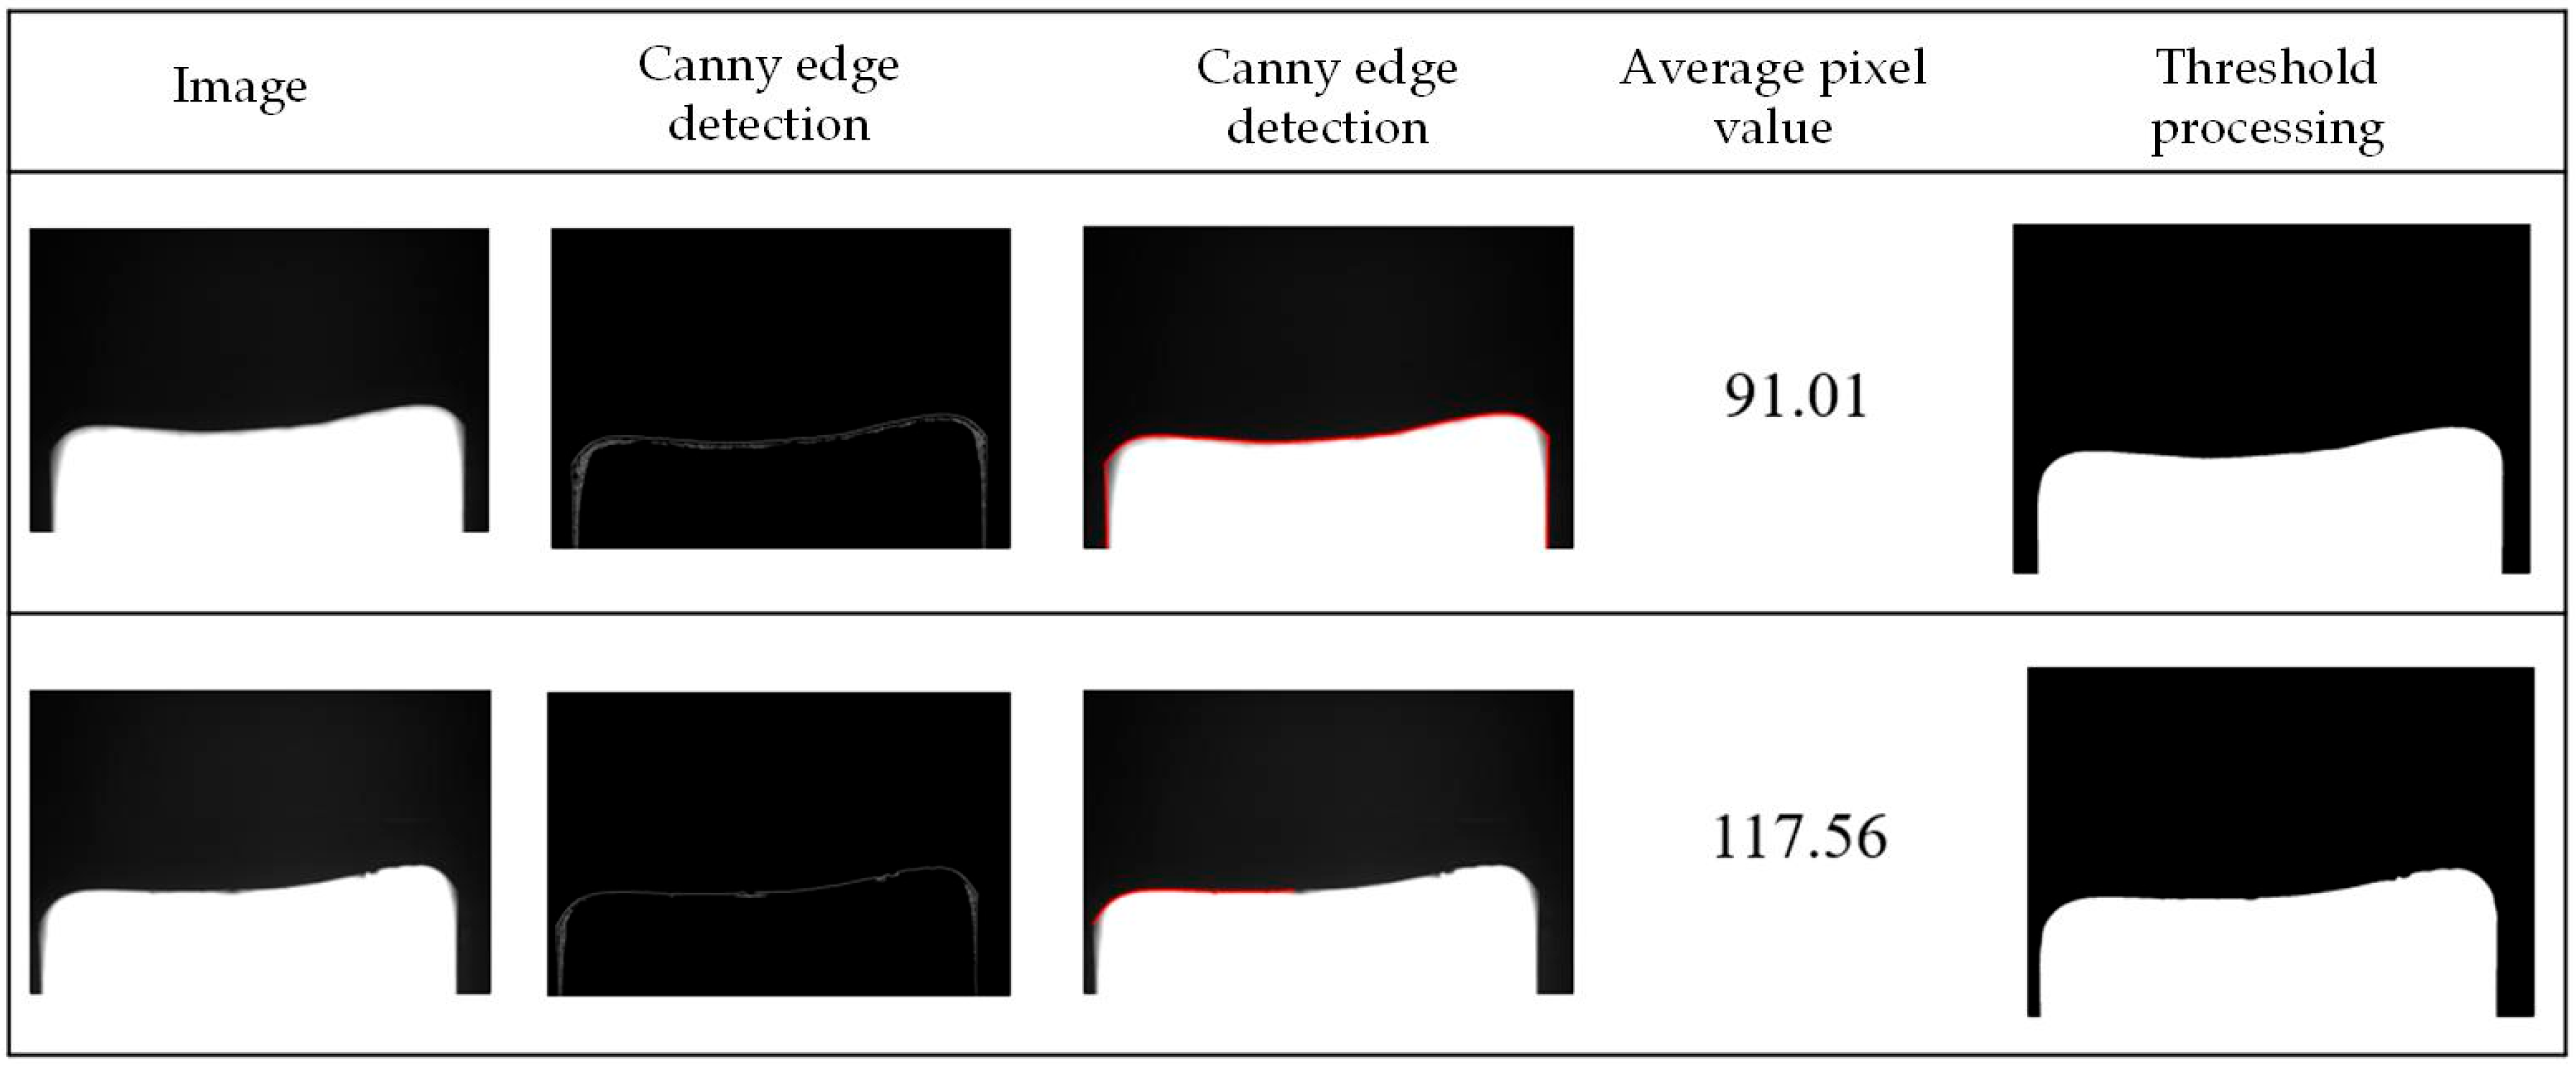
The principle of this algorithm is to find the outline point coordinates of the plate through the Canny edge detection algorithm, project them into the original plate image, calculate the average pixel value of the point set, and set it as a threshold value for threshold processing, so that each plate image can be automatically adjusted for binarization processing, as shown in Figure 5.
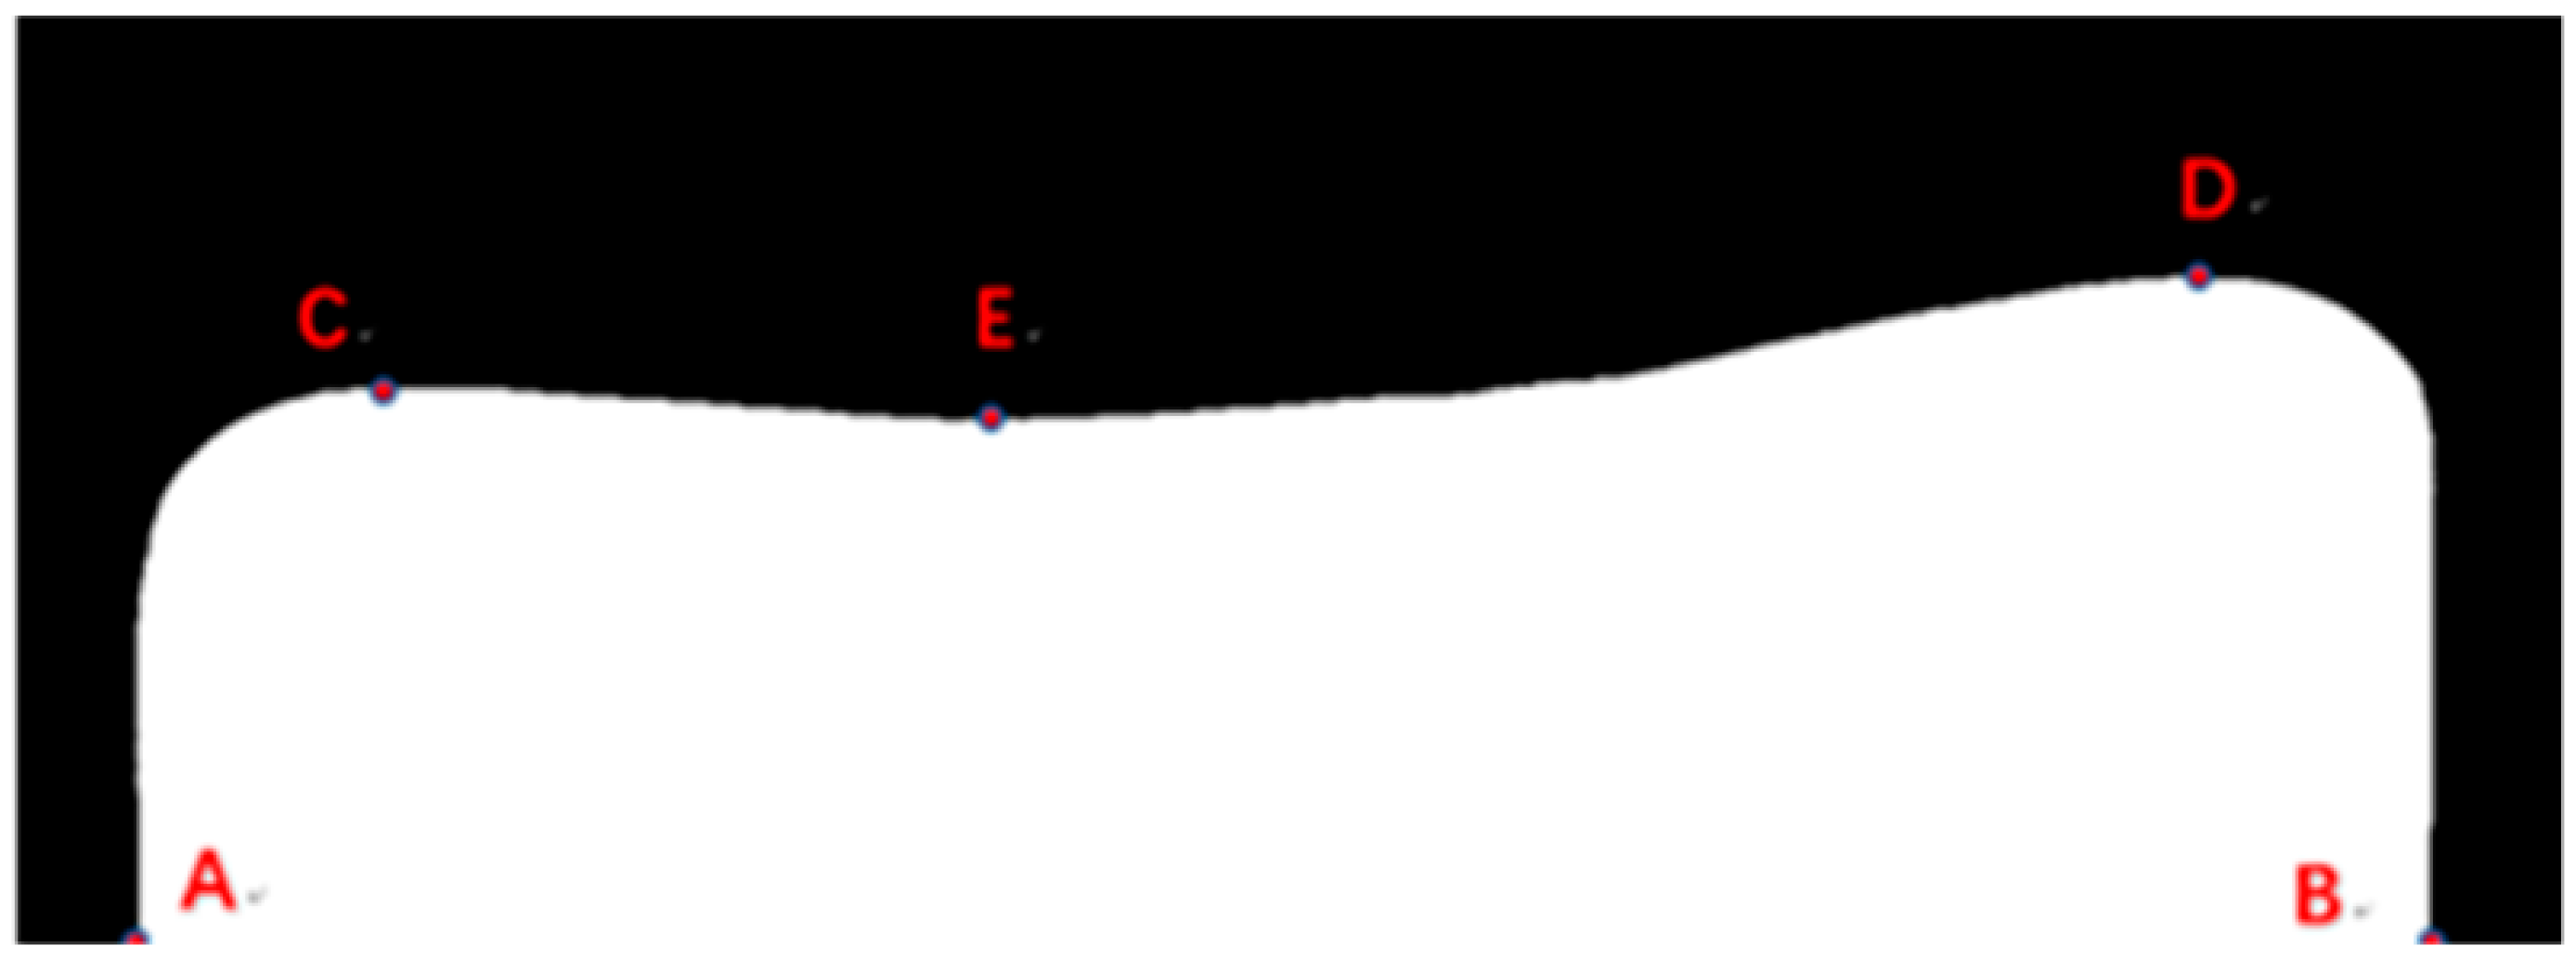
In order to verify the detection accuracy of the algorithm, five images processed by the algorithm are randomly selected. Five edge feature points, A, B, C, D, and E in the plate image, are defined, as shown in Figure 6. Where A is the lower left end point of the plate, B is the lower right end point of the plate, C is the left peak point of the plate, D is the right peak point of the plate, and E is the valley value point of the middle region of the plate. Taking the upper left corner of the plate image as the origin, a rectangular coordinate system plan is established, and the internal midpoint of the five edge feature pixels corresponding to each image is selected as the ideal edge coordinate point and compared with the five edge feature coordinate points extracted by the above image detection algorithm. The comparison results of the first image are shown in Table 1. The deviations of the five images are shown in Table 2. It can be seen that the image detection algorithm is more accurate in locating the edge of the plate, and the final accuracy can be controlled within one pixel.
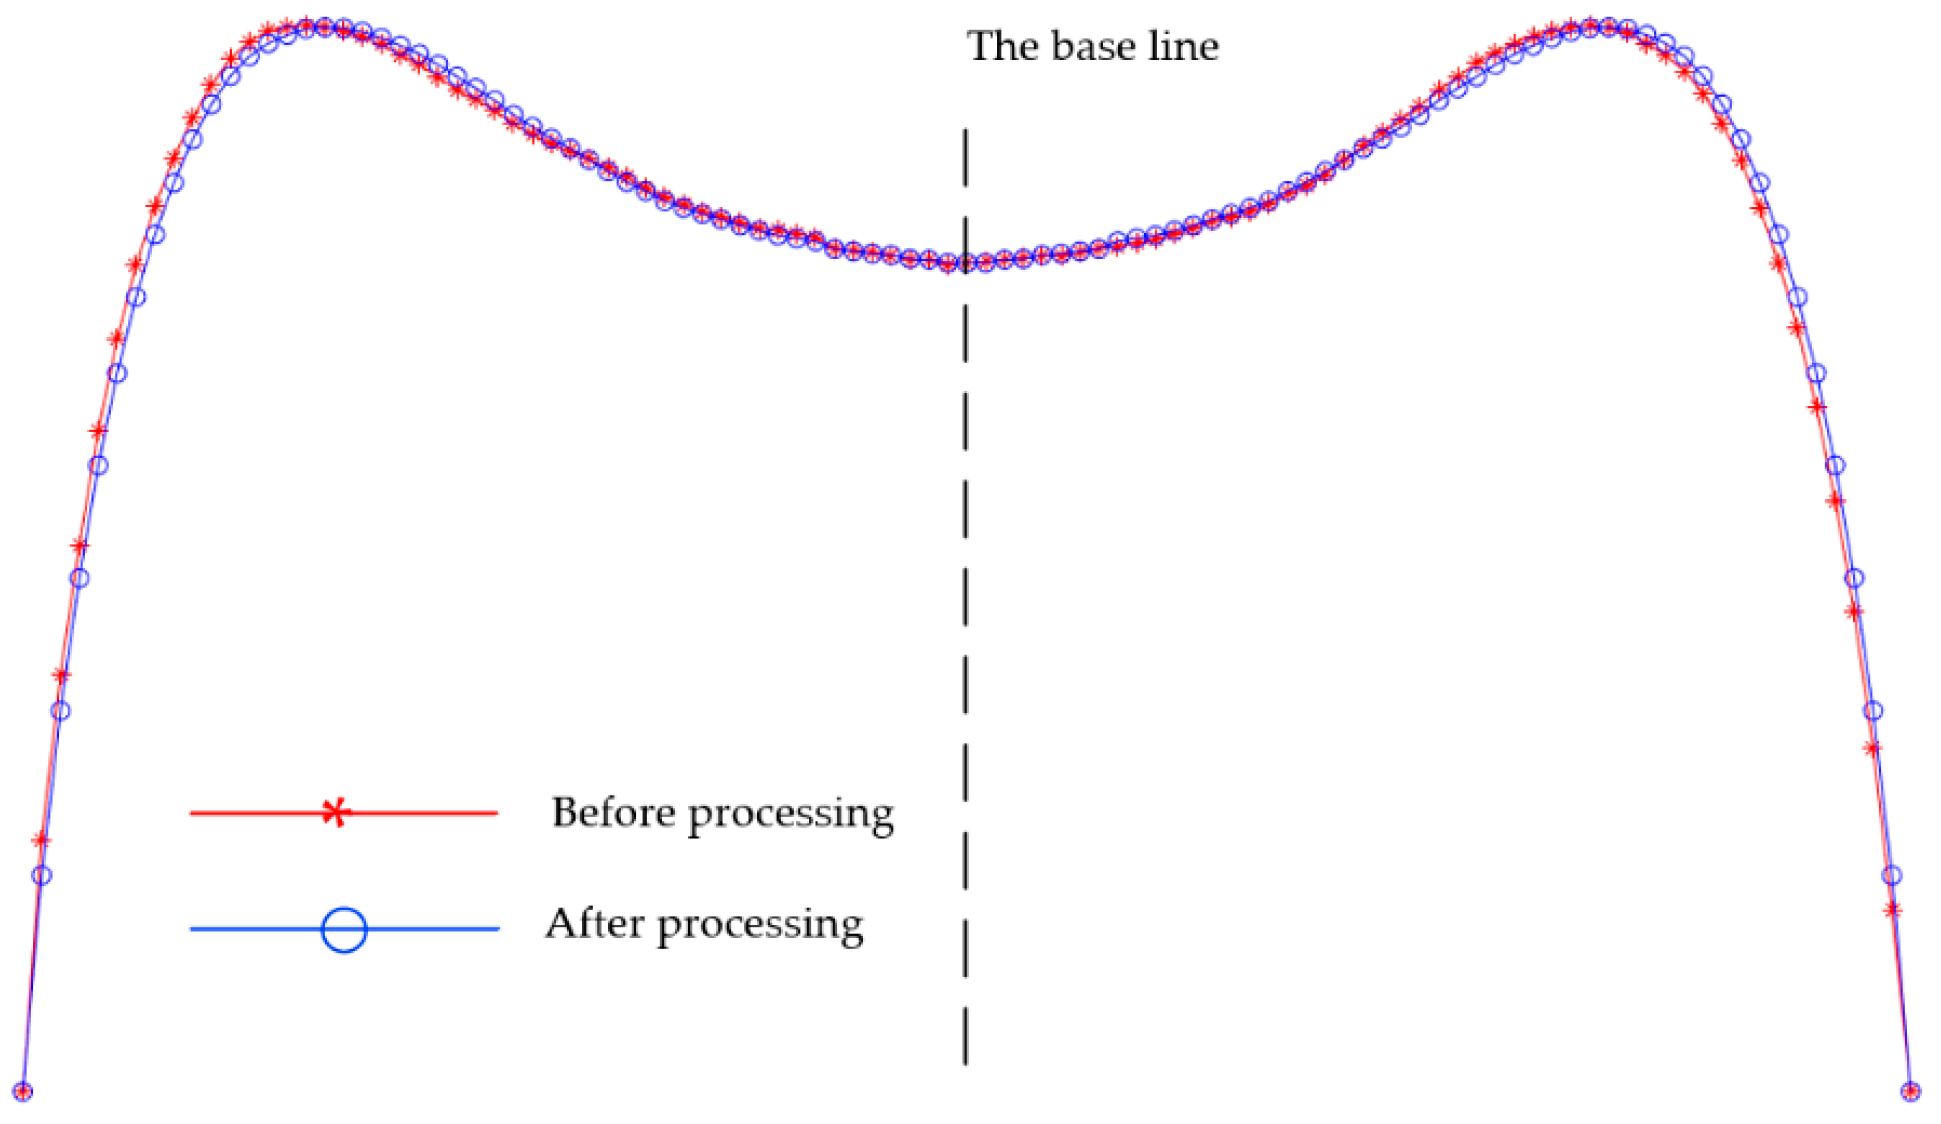
In the actual rolling process, the crop will show irregular asymmetry, which is because the plate in the rolling process is affected by transverse asymmetric factors, such as the stiffness difference on both sides of the mill, the transverse temperature of the plate, and the deviation of the center line of the plate. Therefore, in the actual collection of 101 contour points in the head–tail deformation area, the middle point is taken as the benchmark and the y values of the left and right symmetrical points are treated as the mean value, as shown in Figure 7.
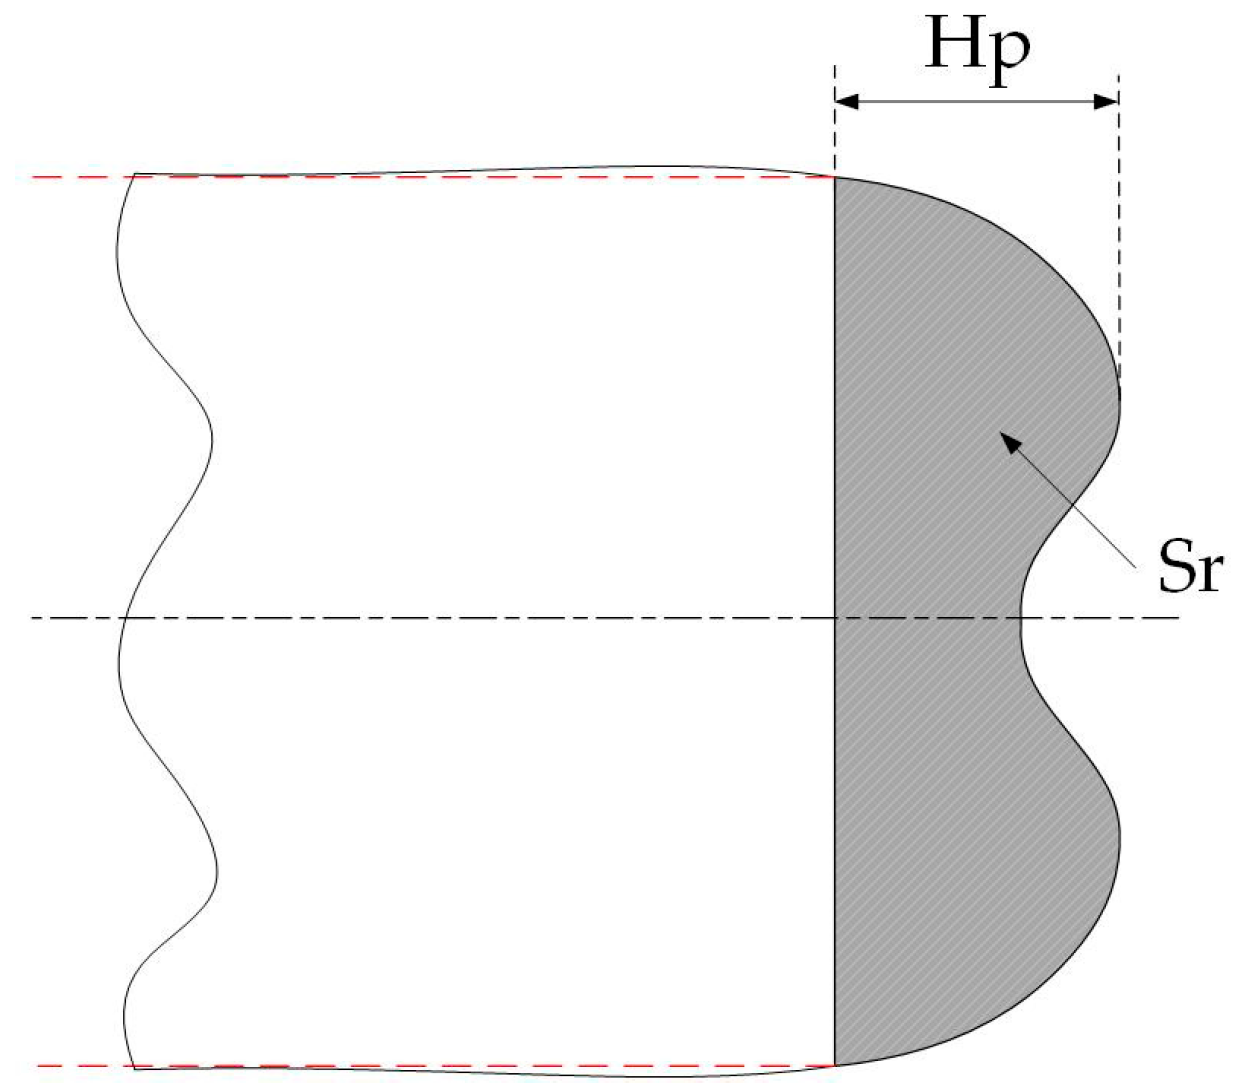
The actual coordinate data of 51 contour points can be obtained by converting the pixel coordinate system to the actual coordinate system. Match the data obtained from image processing with the plate ID and rolling process data and summarize it into a database for easy selection when establishing a neural network prediction model in the future. In this paper, the data from 1150 plates are selected as the sample for the neural network prediction model for the plan view pattern. Considering the physical model and the actual production situation, 12 main variables were selected and combined with the head–tail contour points of the rolled plate as the data set used, as shown in Table 3. V7, V8, V9, and V10 are the parameters of PVPC. In the actual rolling process, the theoretical model is simplified to a seven-point control method in order to ensure control accuracy, as shown in Figure 8. V11 and V12 can be used as two indexes to evaluate the irregular region of the crop pattern, as shown in Figure 9. The smaller V11 and V12 are the smaller the crop cutting loss area of irregular deformation.

2.3. Data Preprocessing

The contour coordinate data of 1150 plates and the corresponding rolling schedule parameters were collected from the hot rolling site as the original data. The main equipment of the plate production line is a two stand four high mill. The main process parameters are shown in Table 4.
Machine learning has high requirements for sample quality, which requires further sample screening. In order to make the data more real and objective, the samples with irregular patterns and breakpoints are eliminated, and only the samples with smooth contour coordinates of head and tail are retained. Finally, 1096 samples were selected for subsequent machine learning modeling. In addition, different variables often have different data distributions, so it is necessary to normalize each feature of the sample to make each variable have the same metric scale. In this paper, the min–max processing method [31] is adopted to uniformly transform the data values into the interval [0,1] and normalize the variables according to Equation (1). The sample set is then randomly shuffled and divided into two parts: the training set (80%) and the test set (20%).
Yi = (Xi − Xmin)/(Xmax − Xmin)
where, Xmin and Xmax are the minimum and maximum values in the input feature vector, respectively.

3. Establishment of Digital Model for PVPC Based on DBO-RBF

3.1. Neural Network Algorithm

An artificial neural network (ANN), also known as a neural network, is a mathematical model based on the basic principles of neural networks in biology. It simulates the processing mechanism of the human brain’s nervous system for complex information by understanding and abstracting the brain’s structure and external stimulus–response mechanism [32,33]. The theoretical basis of network topology knowledge is used. This model has the advantages of parallel distributed processing, high fault tolerance, intelligence, and self-learning, and combines information processing and storage together. It is actually a complex network composed of a large number of simple elements interconnected with each other, with high nonlinearity, and can perform complex logical operations and nonlinear relationship implementation systems.
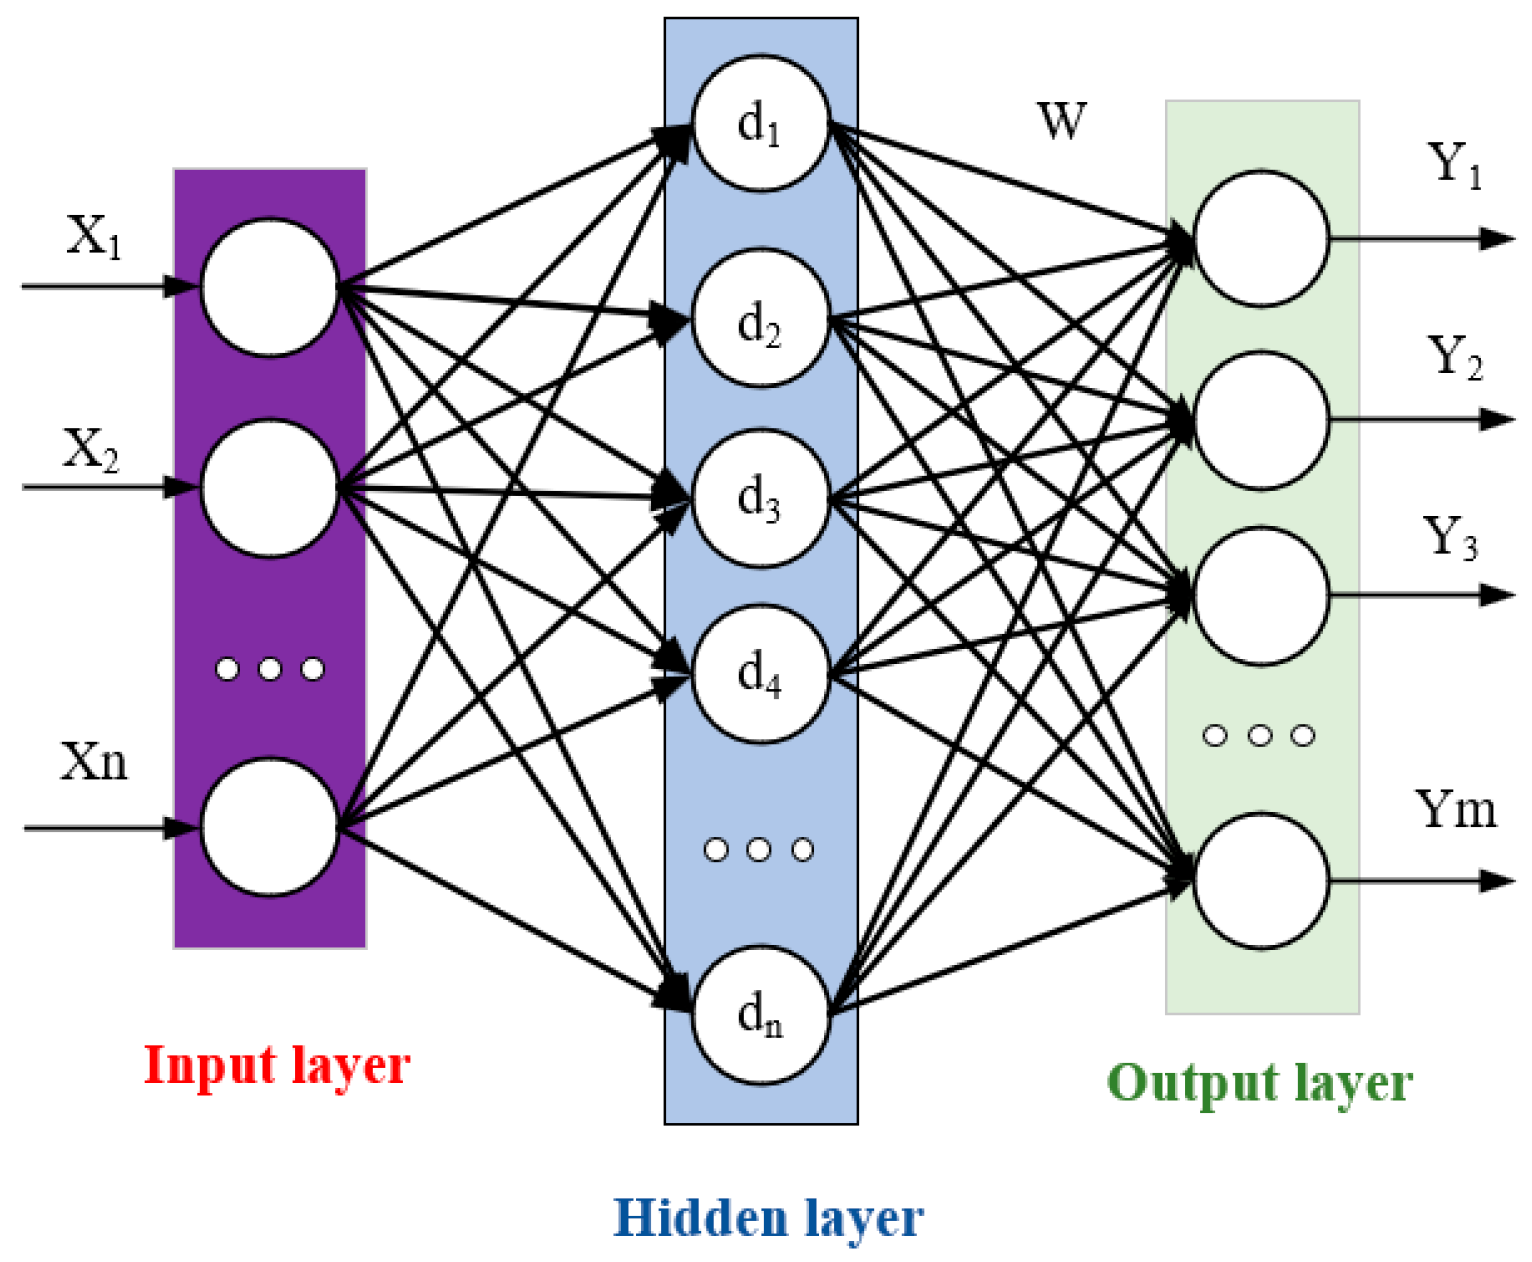
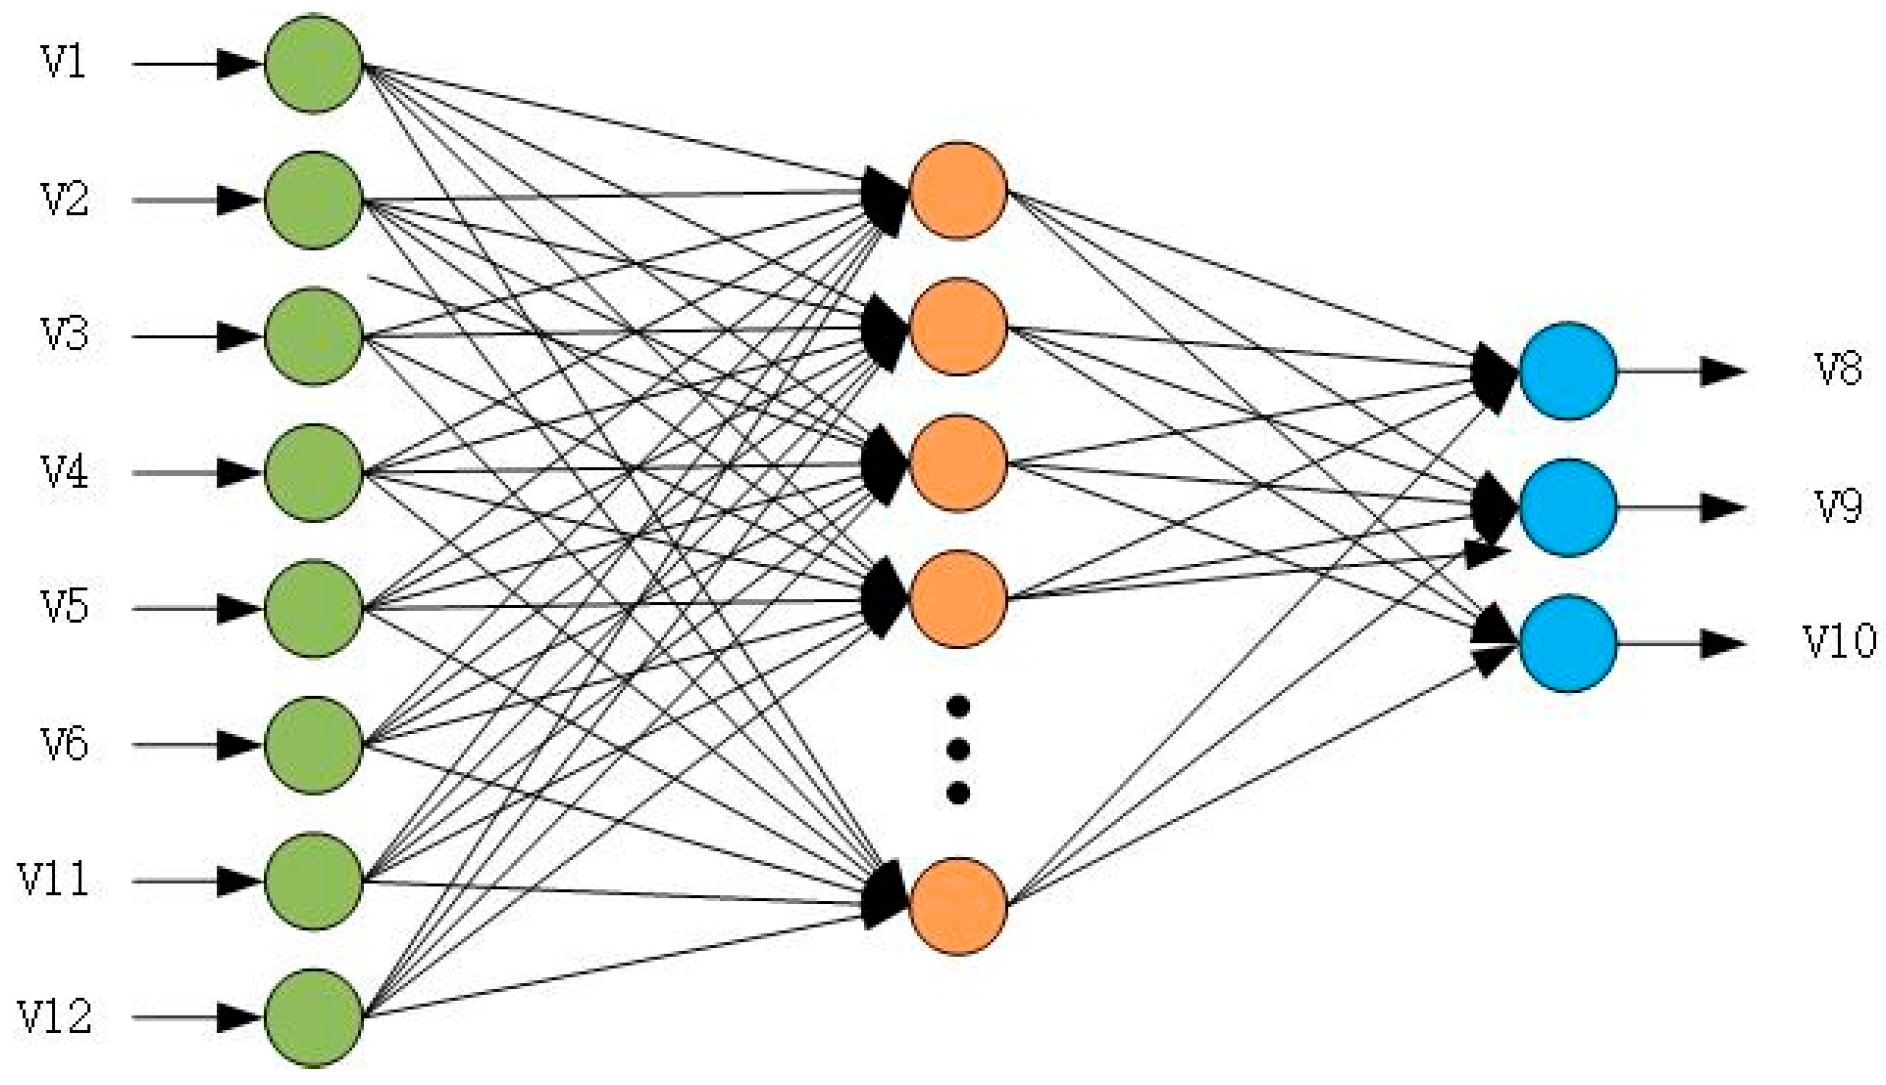
A radial basis function (RBF) network is a three-layer feedforward neural network with a single hidden layer that can approximate any nonlinear function. It is one of the most widely used and well-performing models [34]. The structure of the RBF is shown in Figure 10.
In the figure, X is the input feature vector, Y is the output feature value, 𝑛 is the number of hidden layer nodes, d is the center in the hidden layer, and W represents the weights from the hidden layer to the output layer. The model consists of an input layer, a hidden layer, and an output layer. The transformation from the input layer to the hidden layer is nonlinear, while the transformation from the hidden layer to the output layer is linear. In this paper, the RBF neural network selects the Gaussian function [35] as the radial basis function in the hidden layer, as shown in Equation (2):
φ r = r 2 2 σ 2
A strict radial basis function neural network is established using the newrbe function. This network model is a feedforward neural network with a single-layer hidden layer, and the number of hidden layer neurons is equal to the number of samples (1096 hidden layer neurons in this article). Use the input layer feature matrix of the nth sample as the clustering center value of the nth neuron of hidden layer. The transpose matrix of the input feature matrix is set as the weight matrix between the input layer and the hidden layer. The structure of the newrbe function is shown in Equation (3):
net = newrbe (P, T spread)
where, P is an RQ-dimensional matrix composed of Q input vectors, T is an SQ-dimensional matrix composed of Q target classification vectors, and spread is the spread rate of the radial basis function.

3.2. Dung Beetle Optimizer

The dung beetle optimizer (DBO) is a novel swarm optimization algorithm. The DBO algorithm simulates the behaviors of dung beetles, including rolling, breeding, foraging, and stealing, to form an optimization process for finding the optimal solution of a target function. In benchmark function tests, the DBO algorithm has demonstrated better capability in finding optimal solutions compared to other swarm intelligence algorithms [36,37].
The algorithm starts by randomly initializing the positions and fitness values of dung beetle individuals in the search space. After each iteration, individuals of different types of dung beetles update their positions according to their respective position update rules. The fitness values of all individuals are compared, and the information of the current best dung beetle is recorded. This process is repeated until the termination condition is met. Finally, the algorithm outputs the information of the globally best dung beetle individual, obtaining the global optimal solution and its corresponding fitness value. The algorithm flowchart is shown in Figure 11.
In this paper, the RBF network is combined with the DBO algorithm to find the optimal smoothing coefficient for the RBF neural network with the current samples and network structure, in order to obtain a model with the highest accuracy and smoothness. The larger the spread of the radial basis function, the smoother the fitted function and the stronger the network’s generalization ability. However, a large spread means that a large number of neurons are required to adapt to rapid changes in the function. If the spread is set too small, it means that many neurons are needed to adapt to slow changes in the function, which can result in poor network performance. The combination with the dung beetle optimization algorithm can effectively solve this problem.

3.3. Establishment of the Plan Pattern Prediction Model

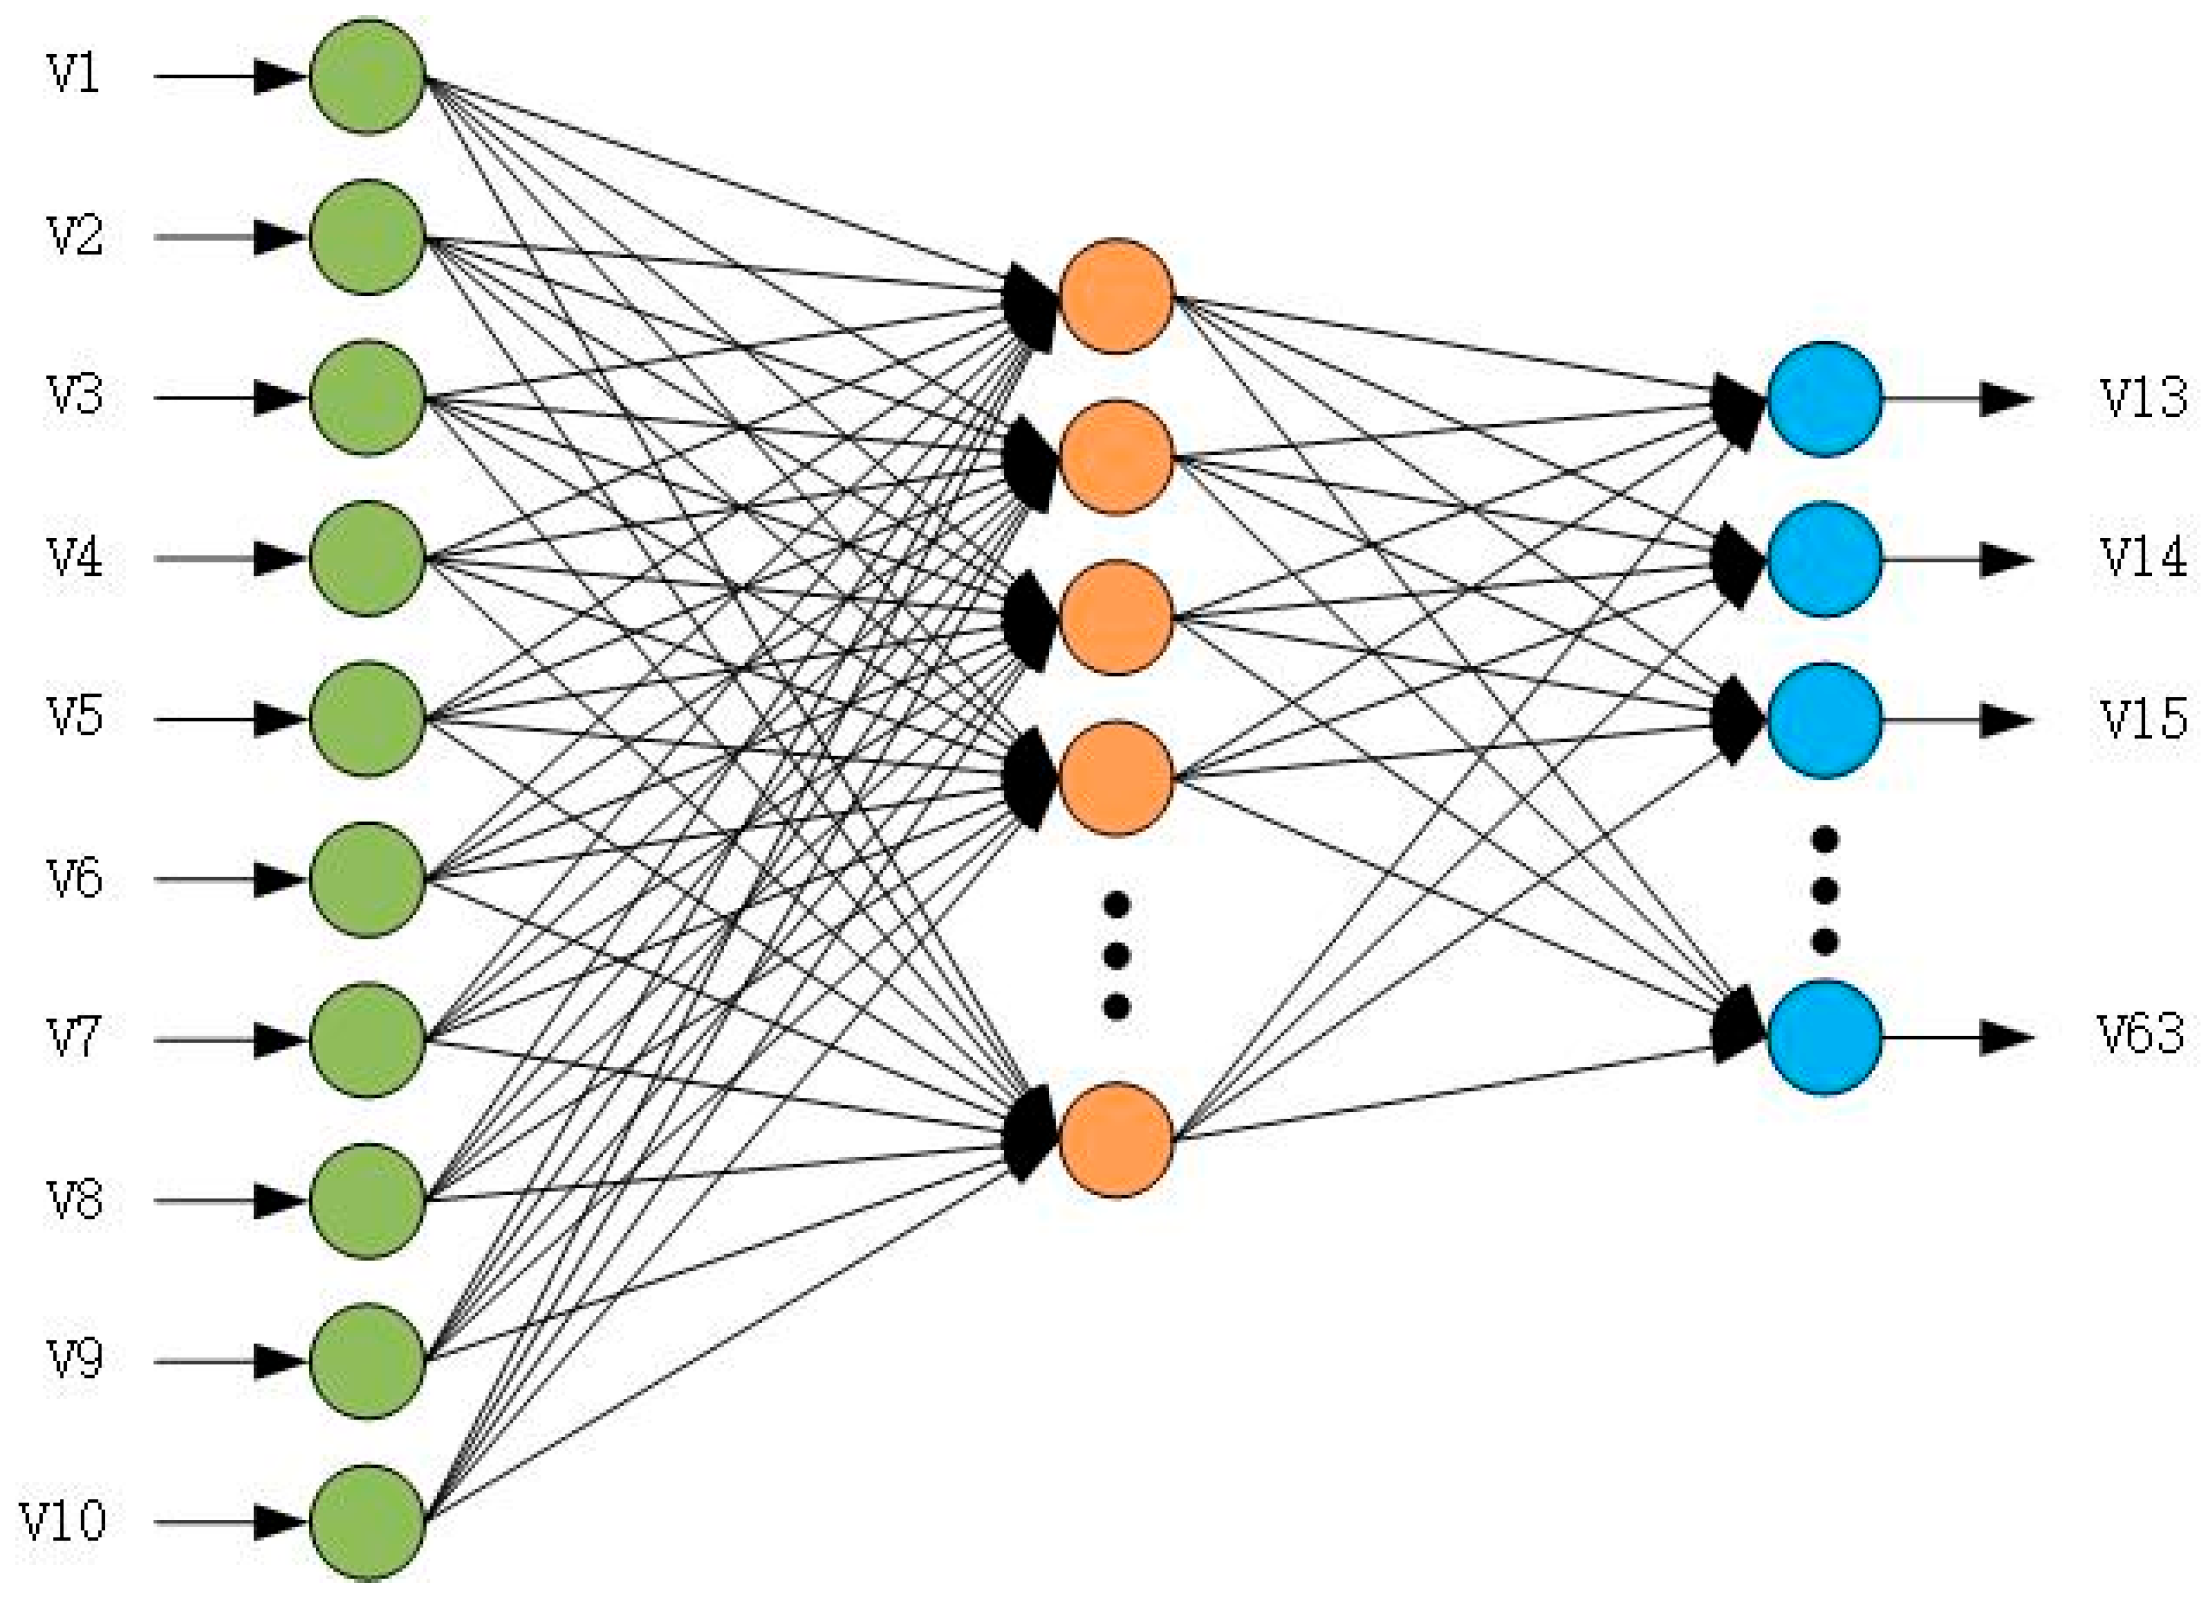
The structure of the RBF neural network is simpler compared to deep learning network structures, allowing for the design of minimal structure models that meet accuracy requirements and making it highly applicable in industrial settings. In order to obtain a robust prediction model for the plan pattern of plates, 10 feature variables that are relevant to the physical model and have a significant impact on the plan pattern of plates are selected as input variables for the plan pattern prediction model. The corresponding coordinates of the plate’s crop pattern contour points are combined as the output variable for the plan pattern prediction model. The model structure of RBF is shown in Figure 12.
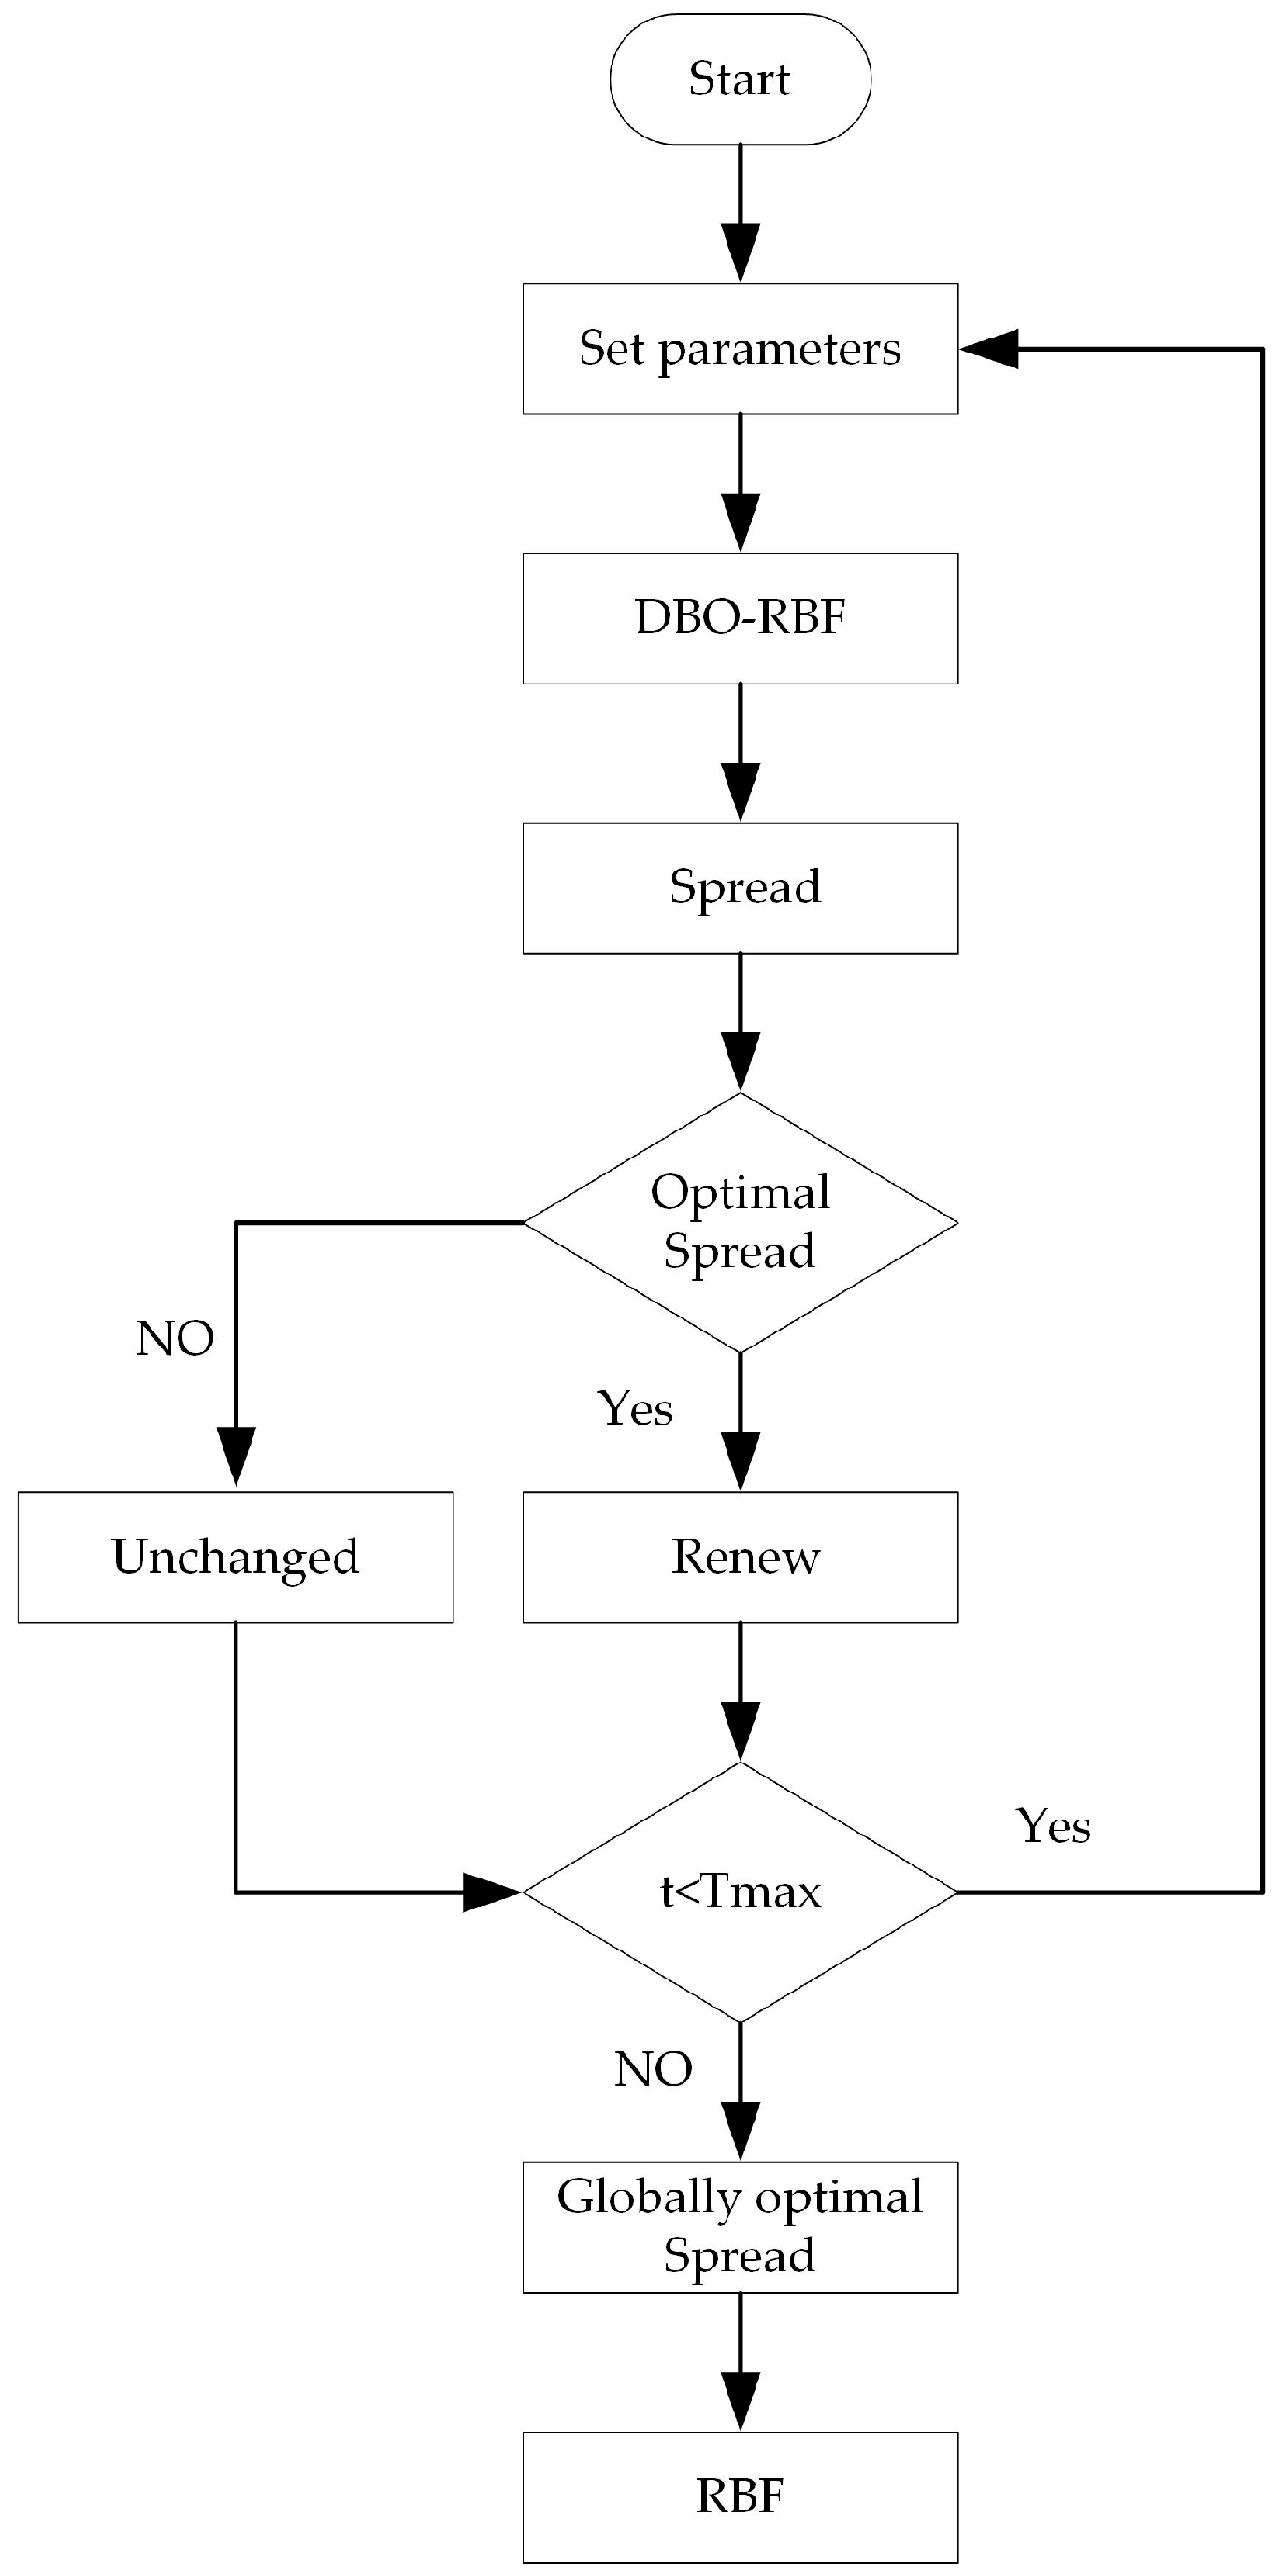
DBO can achieve fast convergence by gradually obtaining the optimal solution to the problem in the entire population through the local behavior optimization of individuals. By using DBO to optimize the spread parameter of the RBF neural network, the DBO-RBF model has better generalization and learning abilities. It can improve the predictive accuracy of the model. The algorithm flow of DBO-RBF is shown in Figure 13.
In order to obtain a DBO-RBF model with fast convergence speed and high computational efficiency, it is necessary to determine the appropriate range interval, population size, and number of iterations. During the evaluation process of the RBF prediction model, MAE (mean absolute error) and R2 (goodness of fit) can be chosen as performance metrics for the model [38]. By evaluating these metrics, adjustments can be made to the parameters. The equations for calculating MAE and R2 are as follows:
MAE = 1 n i = 1 n y i y i
R 2 = 1 Σ i y i y i ¯ 2 Σ i y i y i ¯ 2
where n is the number of samples in the dataset, y i   is the actual value of the predicted variable, y i is the predicted value of the established model, and y i ¯ is the mean in the sample.
From the evaluation index Equations (4) and (5), it can be seen that the smaller the MAE value, the higher the prediction accuracy of the model. The closer R2 is to one, the better the descriptive power of the established prediction model on the dataset.
The hidden layer of the RBF neural network created based on Equation (2) is a single hidden layer, and the number of neurons in the single hidden layer is equal to the number of input samples, so there is no need to discuss the hidden layer and hidden layer neurons. But in order to obtain the most efficient model, it is necessary to discuss the relevant parameters of DBO. We tested the RBF with spread parameters ranging from 10 to 600 to determine the most suitable DBO search range. The average R2 (v.R2) and average MAE (v.MAE) of the test set with 51 output values are used as evaluation indicators, and the test results are shown in Table 5.
From Table 5, it can be seen that the prediction performance of RBF gradually improves with the increase of the spread parameter. However, when the spread parameter reaches a certain level, the increase of the spread parameter will actually decrease the prediction accuracy. Overall, the optimal spread parameter search interval for the model is between 200 and 250. After determining the search interval, it is necessary to discuss and test the population size and iteration times. Although increasing the number of populations and iterations can avoid the possibility of falling into a local optimal solution due to a small population or failing to find the optimal solution due to a small number of iterations, setting the number of populations and iterations too high may lead to slow convergence speed and a significant increase in calculation time.
The test of the prediction model based on DBO-RBF is carried out without changing the training set samples through the commonly used collocation method of multiple population numbers and iteration times, so as to determine the most suitable collocation parameters. The v.R2, v.MAE and training time of the test set with 51 output values were used as evaluation indicators, and the results are shown in Table 6.
From the results in the table, it can be seen that when the population size is 50 and the number of iterations is 150, the prediction accuracy has reached its maximum. So, the population size of the DBO-RBF model was set to 50 and the iteration number was set to 150.
In addition, we have also obtained the optimal parameters of the BP neural network through experiments, as shown in Table 7.

3.4. Establishment of the Plan Pattern Control Model

In order to establish a neural network model between the deformation area and the plan view pattern control parameters, and adjust the plan pattern parameters to obtain the most suitable control parameters, eight feature variables that are relevant to the physical model and have a significant impact on the PVPC parameters are selected as input variables for the plan pattern control model, which also combines the corresponding control data as the output variables of the model. The model structure of the RBF network is shown in Figure 14.
The parameter optimization for the PVPC control model is similar to the prediction model. The search range interval, population size, and iteration number of DBO-RBF are determined first. The results are shown in Table 8 and Table 9.
Finally, the search range was determined to be 50–70, and the combination of population size and iteration number was 50–100.
In addition, we have also obtained the optimal parameters of the BP neural network through experiments, as shown in Table 10.

4. Results and Discussion

4.1. Results of the PVPC Prediction Model

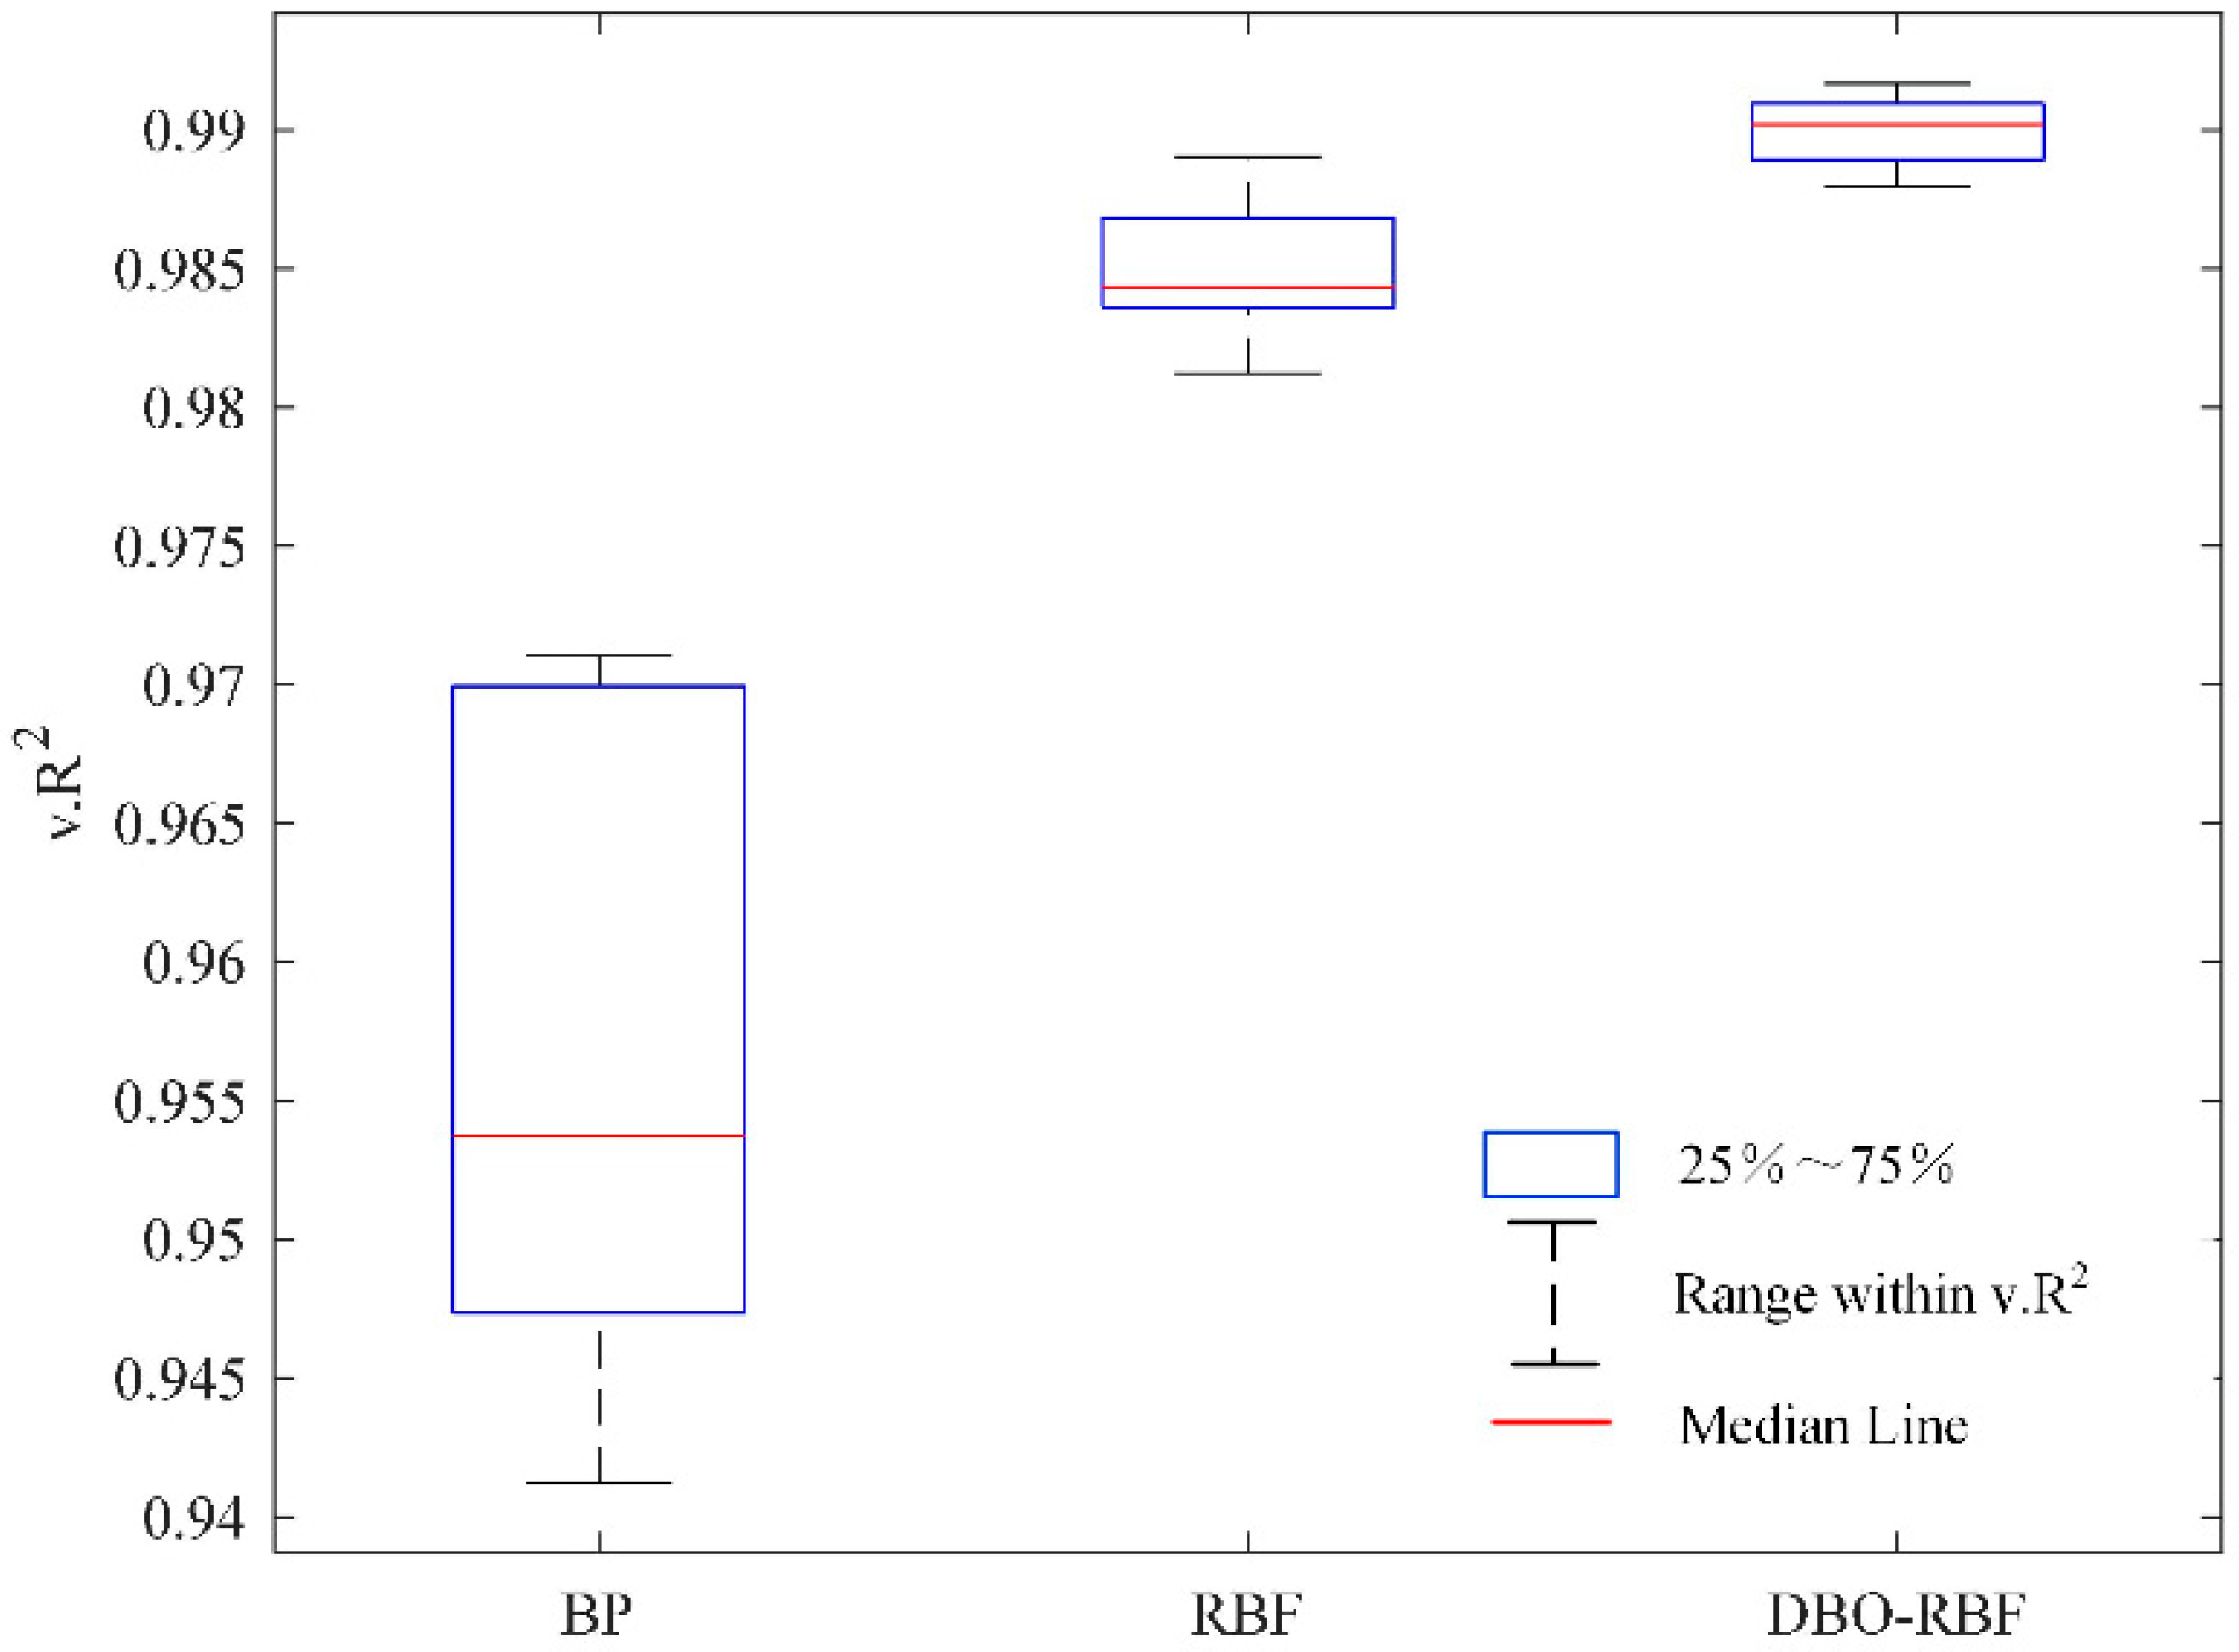
Three algorithms—BP, RBF, and DBO-RBF—were used to train the prediction model of the plate head. The three models were trained after randomly scrambling the dataset samples to generate the training set samples for a total of nine times. Figure 15 shows the distribution of v.R2 in the test set of three different network models, and the median result was selected as the stable prediction result. The results indicate that the DBO-RBF model has the best predictive performance and generalization ability. Figure 16 shows the R2 distribution of 51 output values for three different neural network models. From the R2 distribution of the three models, it can be seen that the predictive performance of the middle contour point is better than that of the edge contour point, and DBO-RBF shows the highest predictive performance. In addition, from Table 11, it can be further seen that the average absolute error distribution of DBO-RBF is more concentrated. From this perspective, DBO-RBF has better predictive performance.
After the same prediction analysis, the predictive results of the tail plan pattern prediction model and the head model are summarized in Table 12. It shows that the DBO-RBF has the best predictive performance. The v.R2 and v.MAE of the head section prediction model were 0.9902 and 10.54 mm. The v.R2 and v.MAE of the tail part prediction model were 0.9894 and 10.57 mm.

4.2. Analysis Based on the PVPC Prediction Model

In previous studies, the influence of PVPC parameters on the irregular deformation of the plate crop pattern was mostly explored through experiments based on physical model calculations and finite element simulation analysis. Due to the complex coupling effect between process parameters, it is difficult for physical models to cumulatively predict the head and tail deformation after multiple passes of rolling. Also, finite element simulation requires high modeling levels and parameter settings, and the calculation time is long. This section investigates the influence of PVPC parameters on the deformation of the plate head based on the developed neural network model. The conventional slab was selected and its slab size and rolling schedule are shown in Table 13.
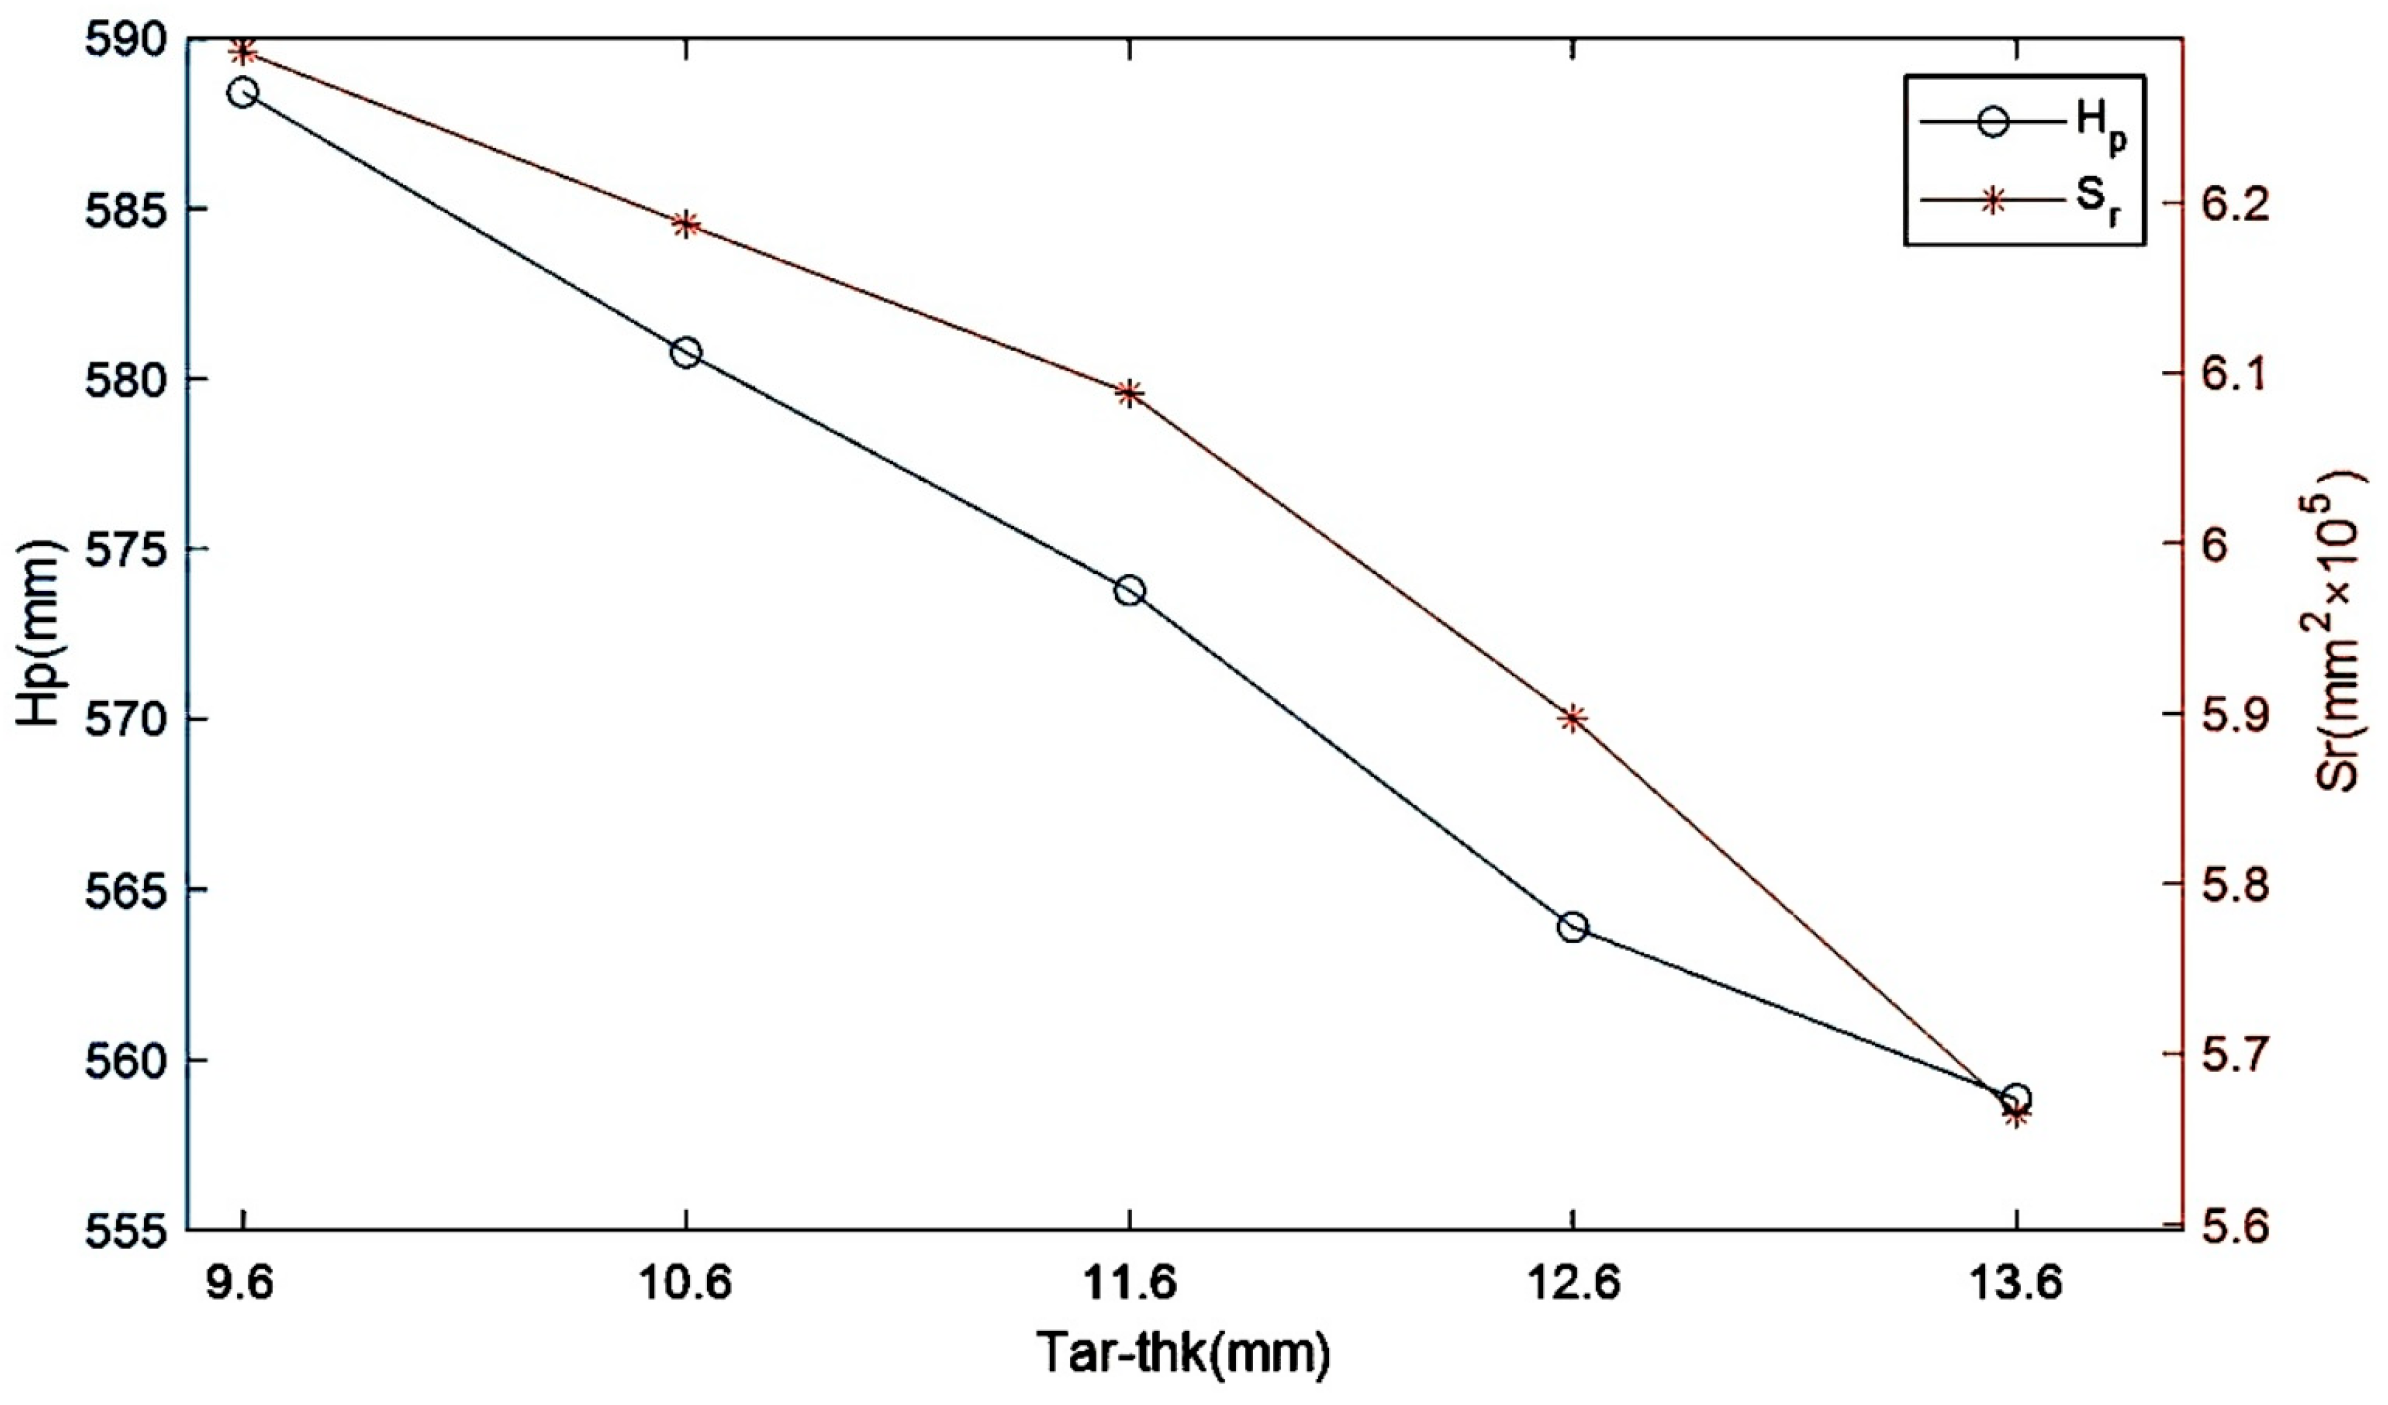
Firstly, verify the correctness of the model. Use the target thickness (V4) as the sole variable for prediction. The values of Hp and Sr as a function of the target thickness are shown in Figure 17. As the target thickness decreases, the total amount of metal flowing to the head part during the rolling process will increase, and Hp and Sr will also increase, which is consistent with the physical phenomenon of the rolling process.
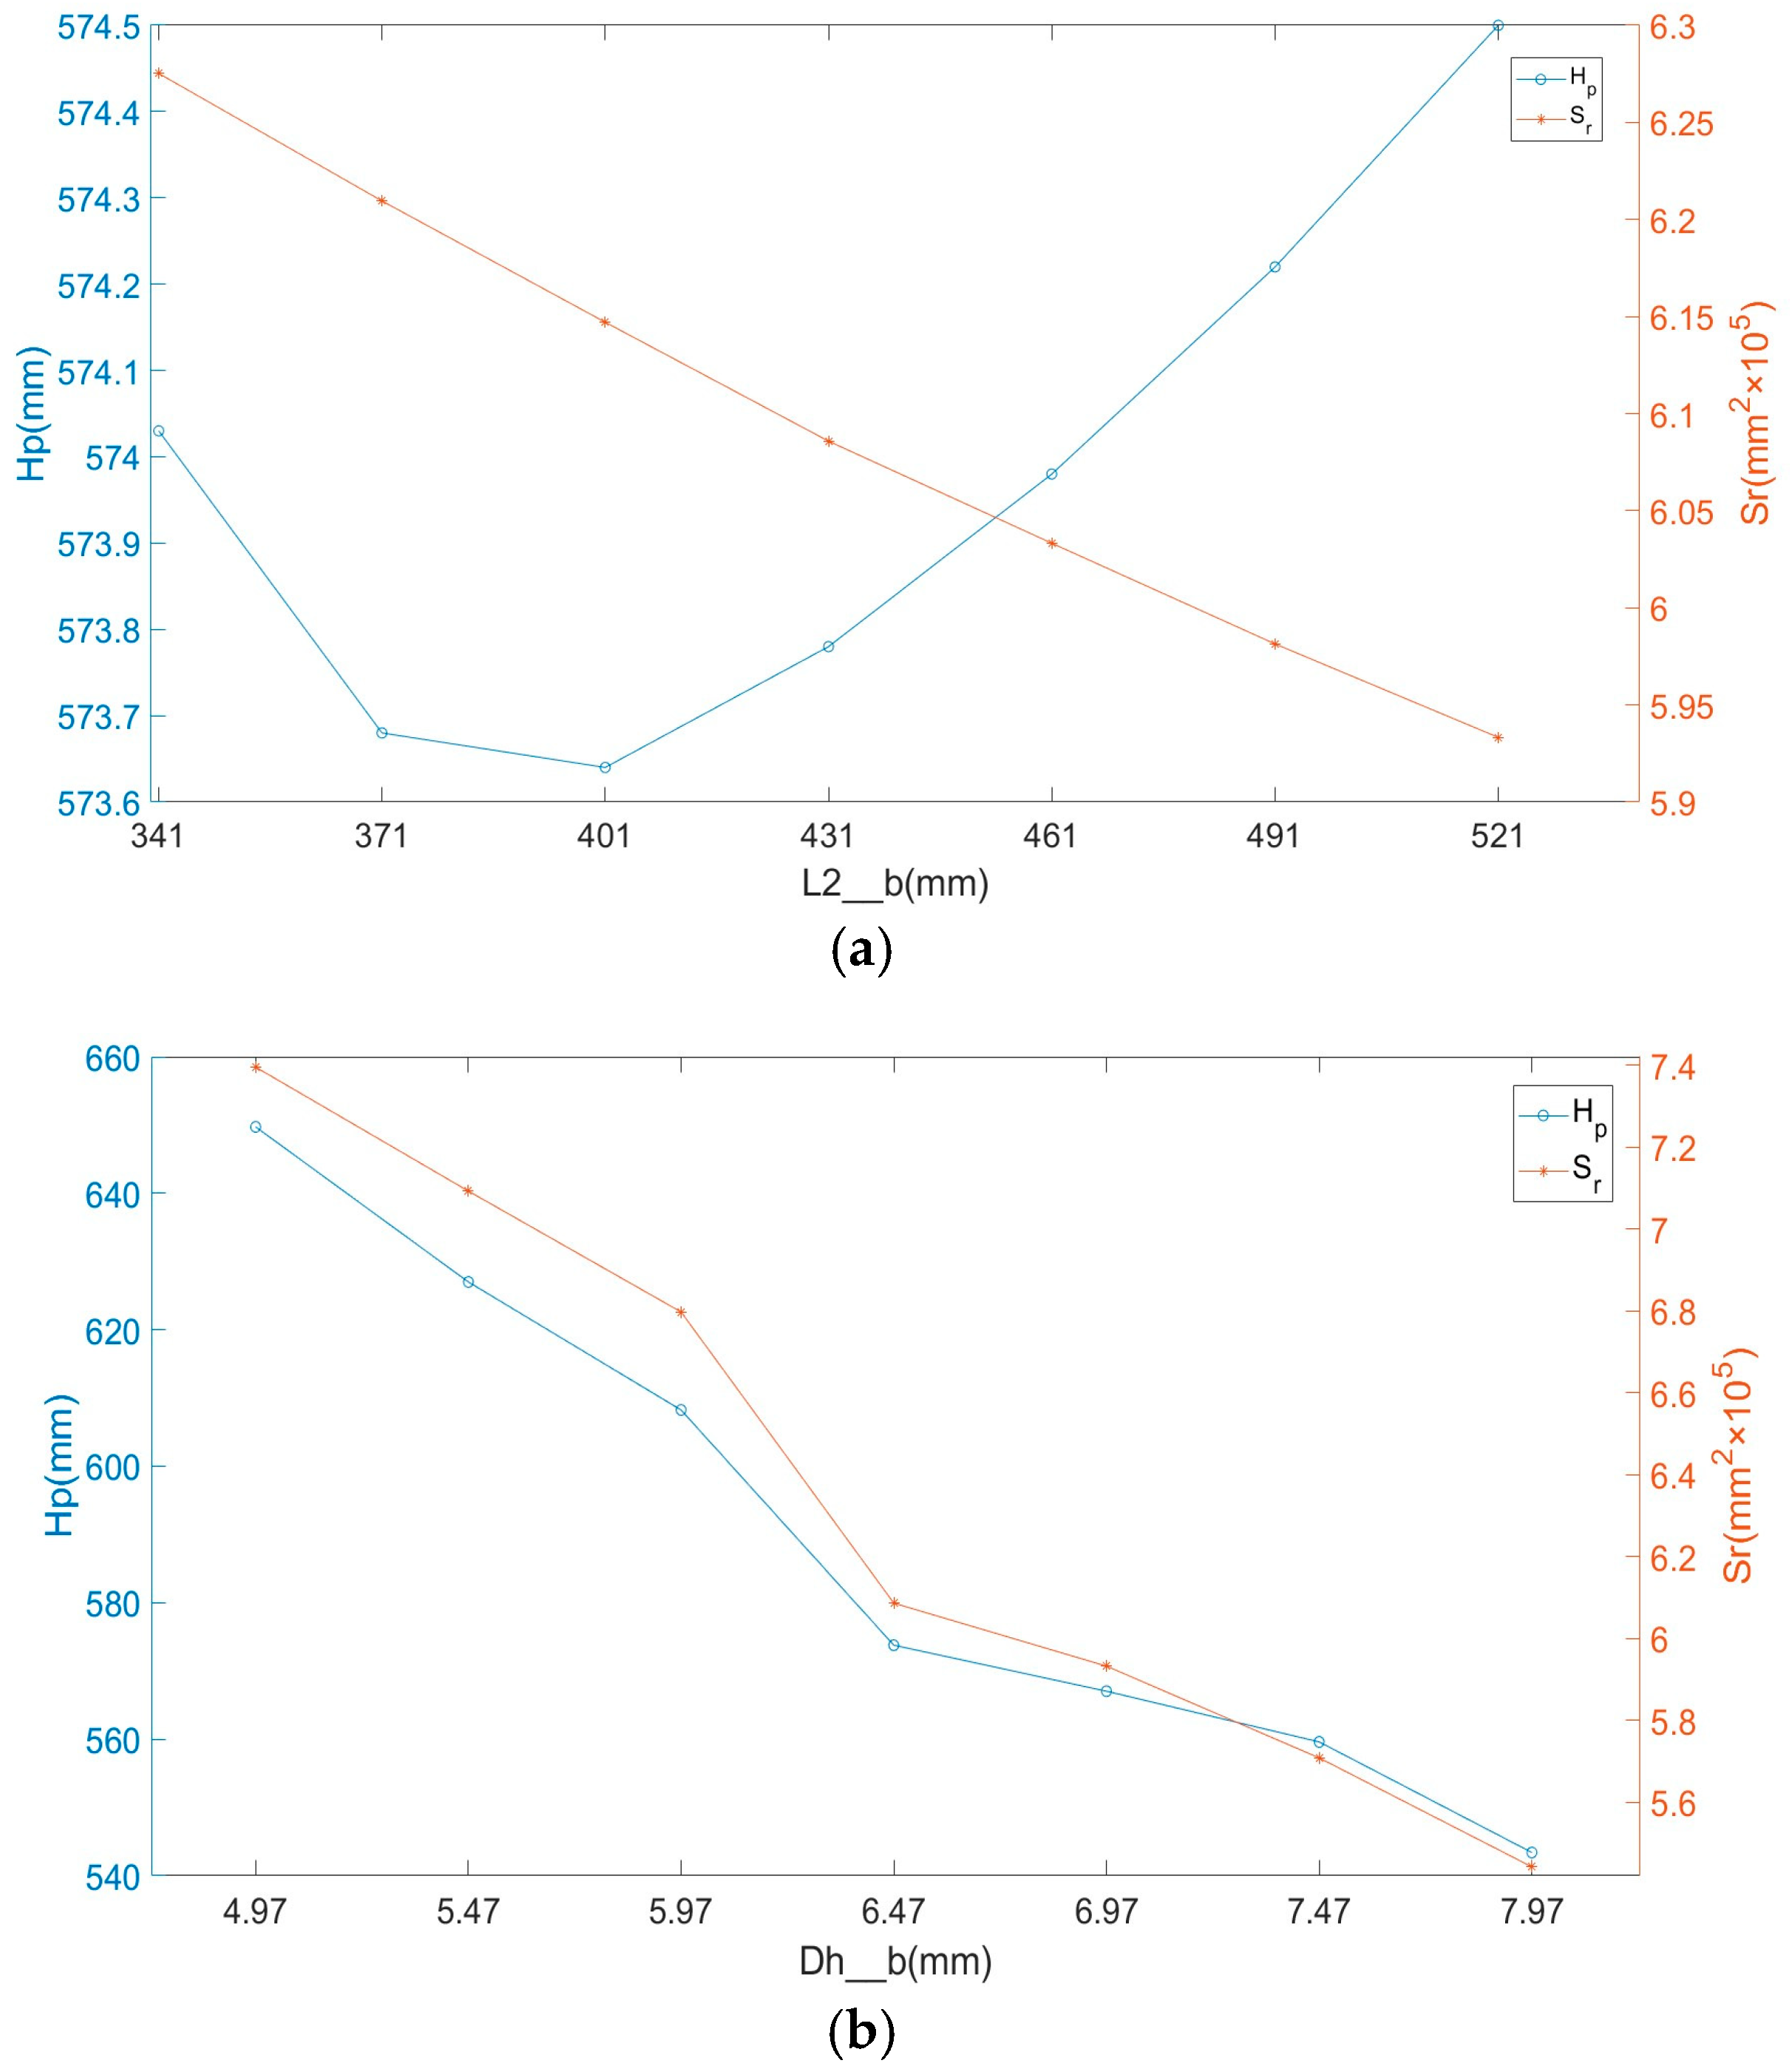
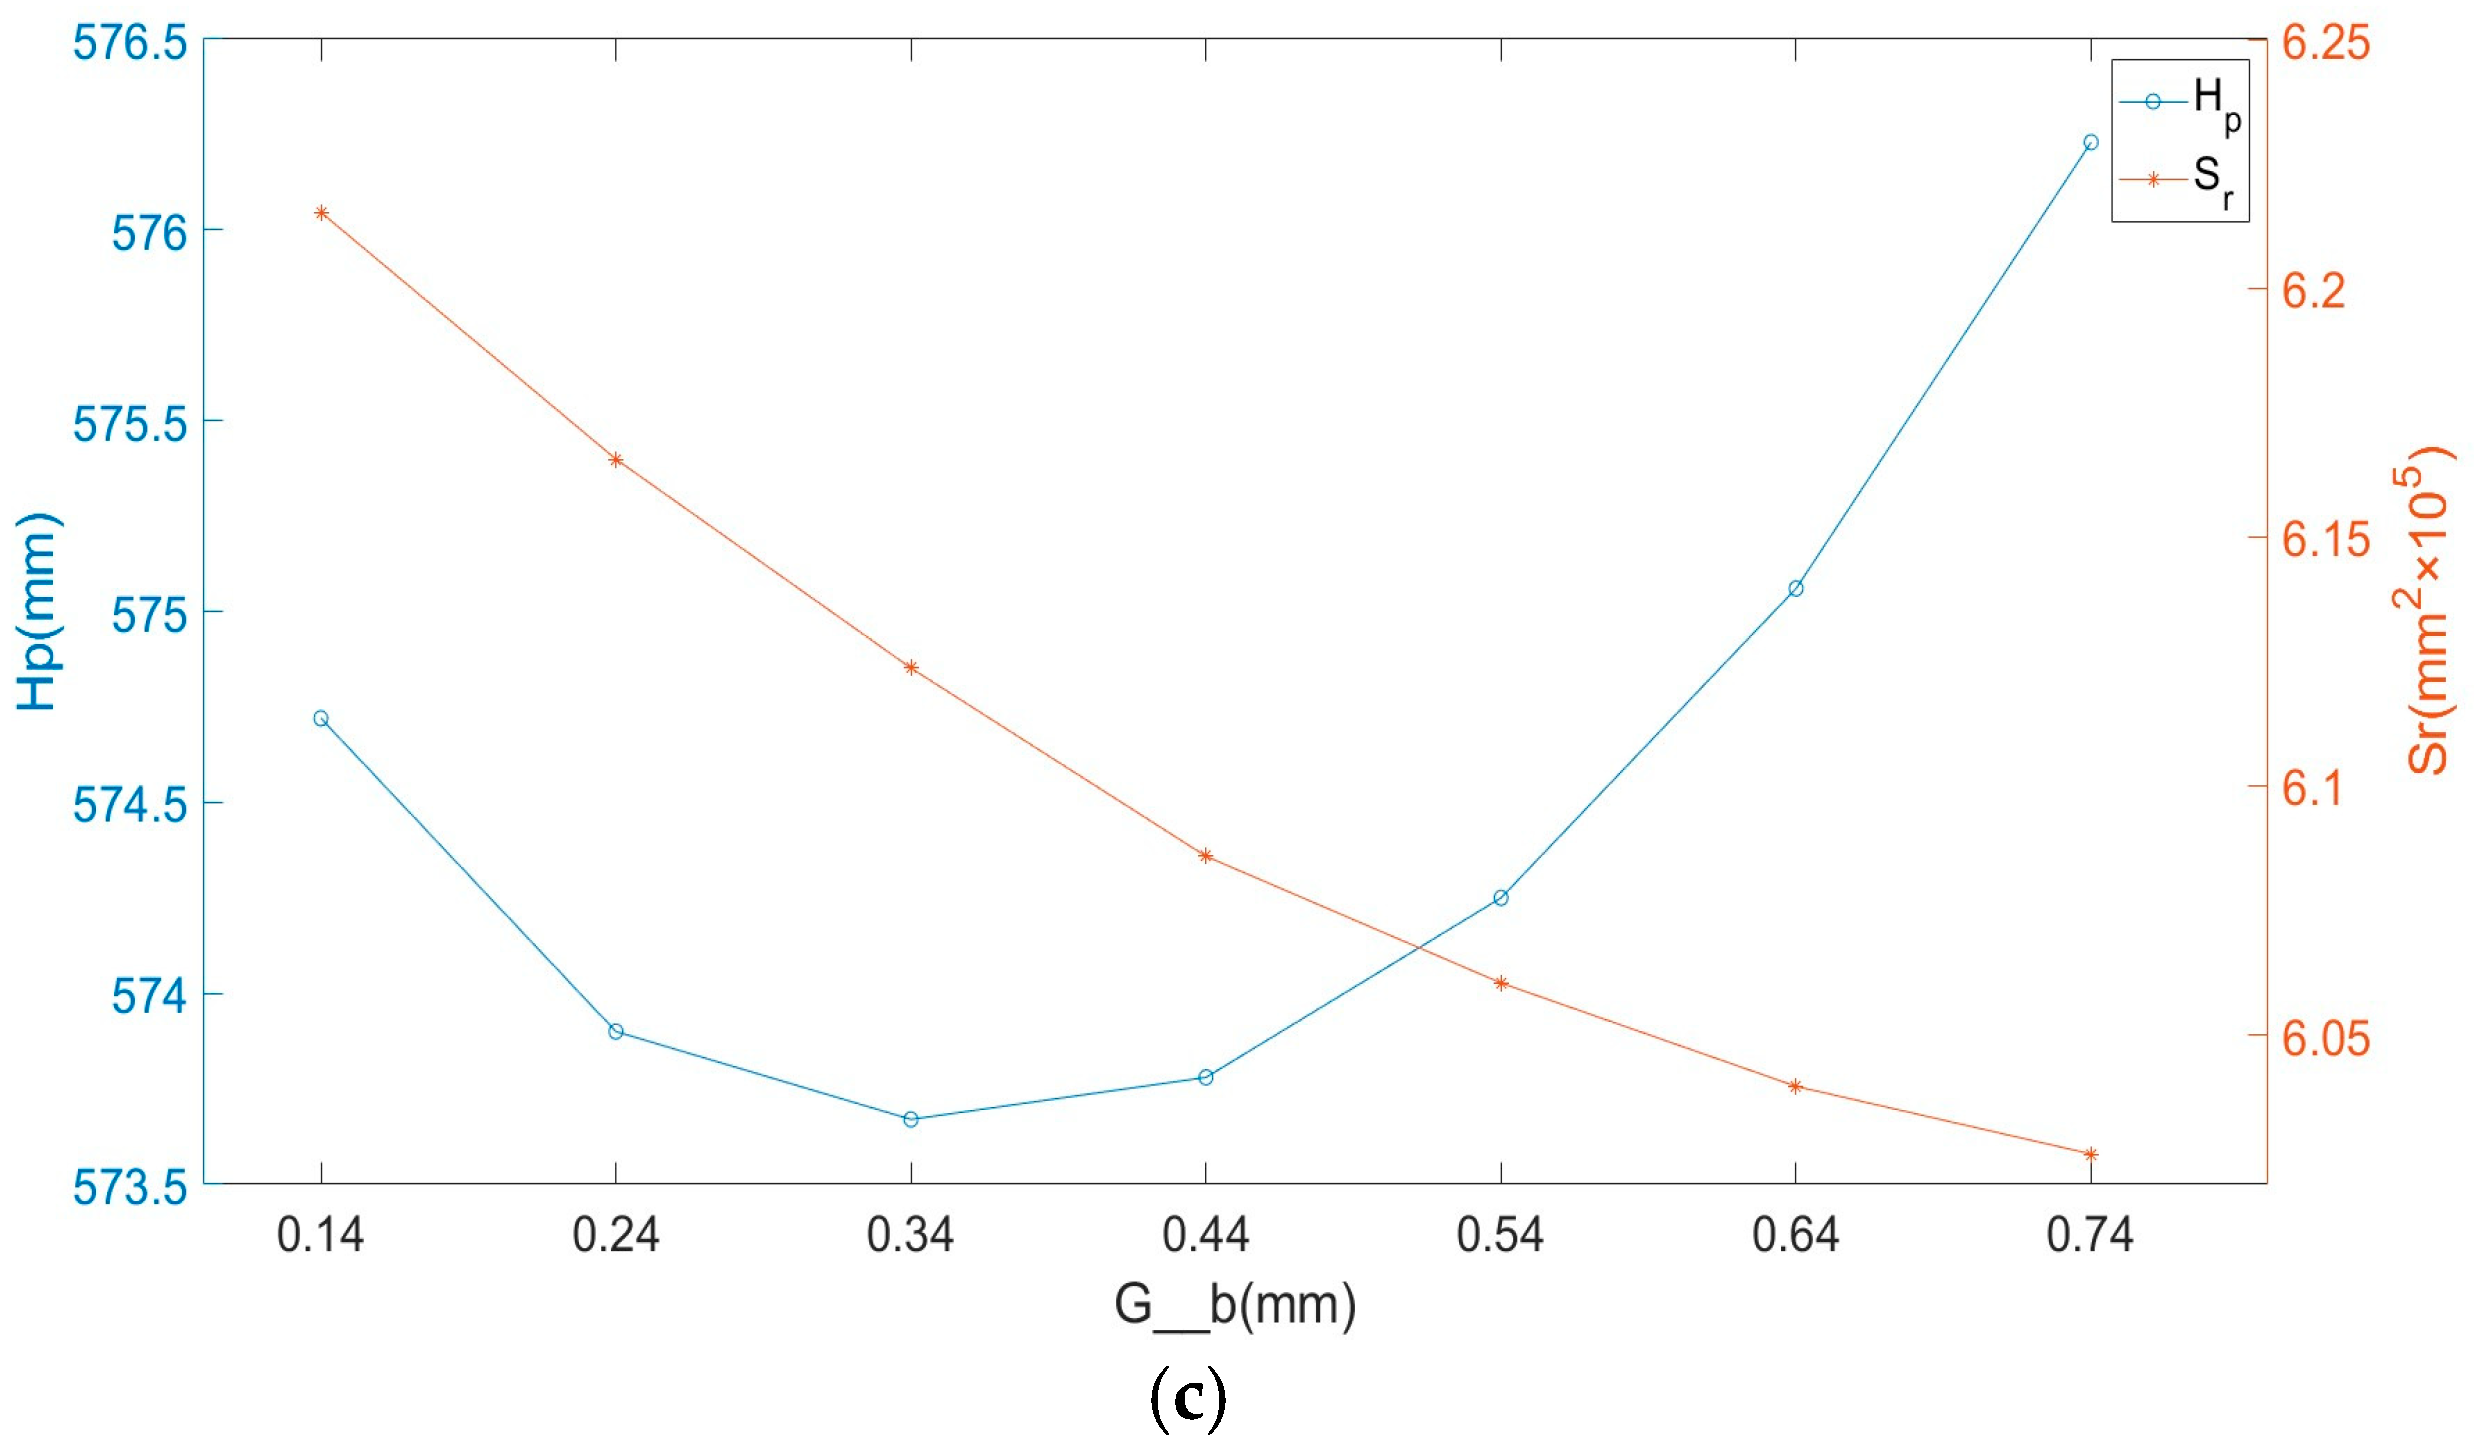
Here we discuss the influence of PVPC parameters on the crop pattern of rolled plates, with reference to the control method. Due to the need to consider the judgment of steel biting signals, V7 is usually set as a fixed value, so only V8, V9, and V10 parameters are adjusted appropriately. As shown in Figure 18, V8, V9, and V10 all have an impact on the crop pattern. Among them, as V8 and V10 gradually increase, Hp shows a trend of first decreasing and then increasing, while Sr shows a trend of gradually decreasing. As V9 gradually increases, Hp shows a decreasing trend, while Sr also shows a decreasing trend. Therefore, for plates with poor head plan view patterns, it is possible to appropriately increase the parameters of V8, V9, and V10 while meeting the equipment requirements to reduce the deformation area at the head end. It can be seen that optimizing the PVPC parameters can effectively reduce the deformation area of the crop pattern.

4.3. Prediction Results of the PVPC Control Model

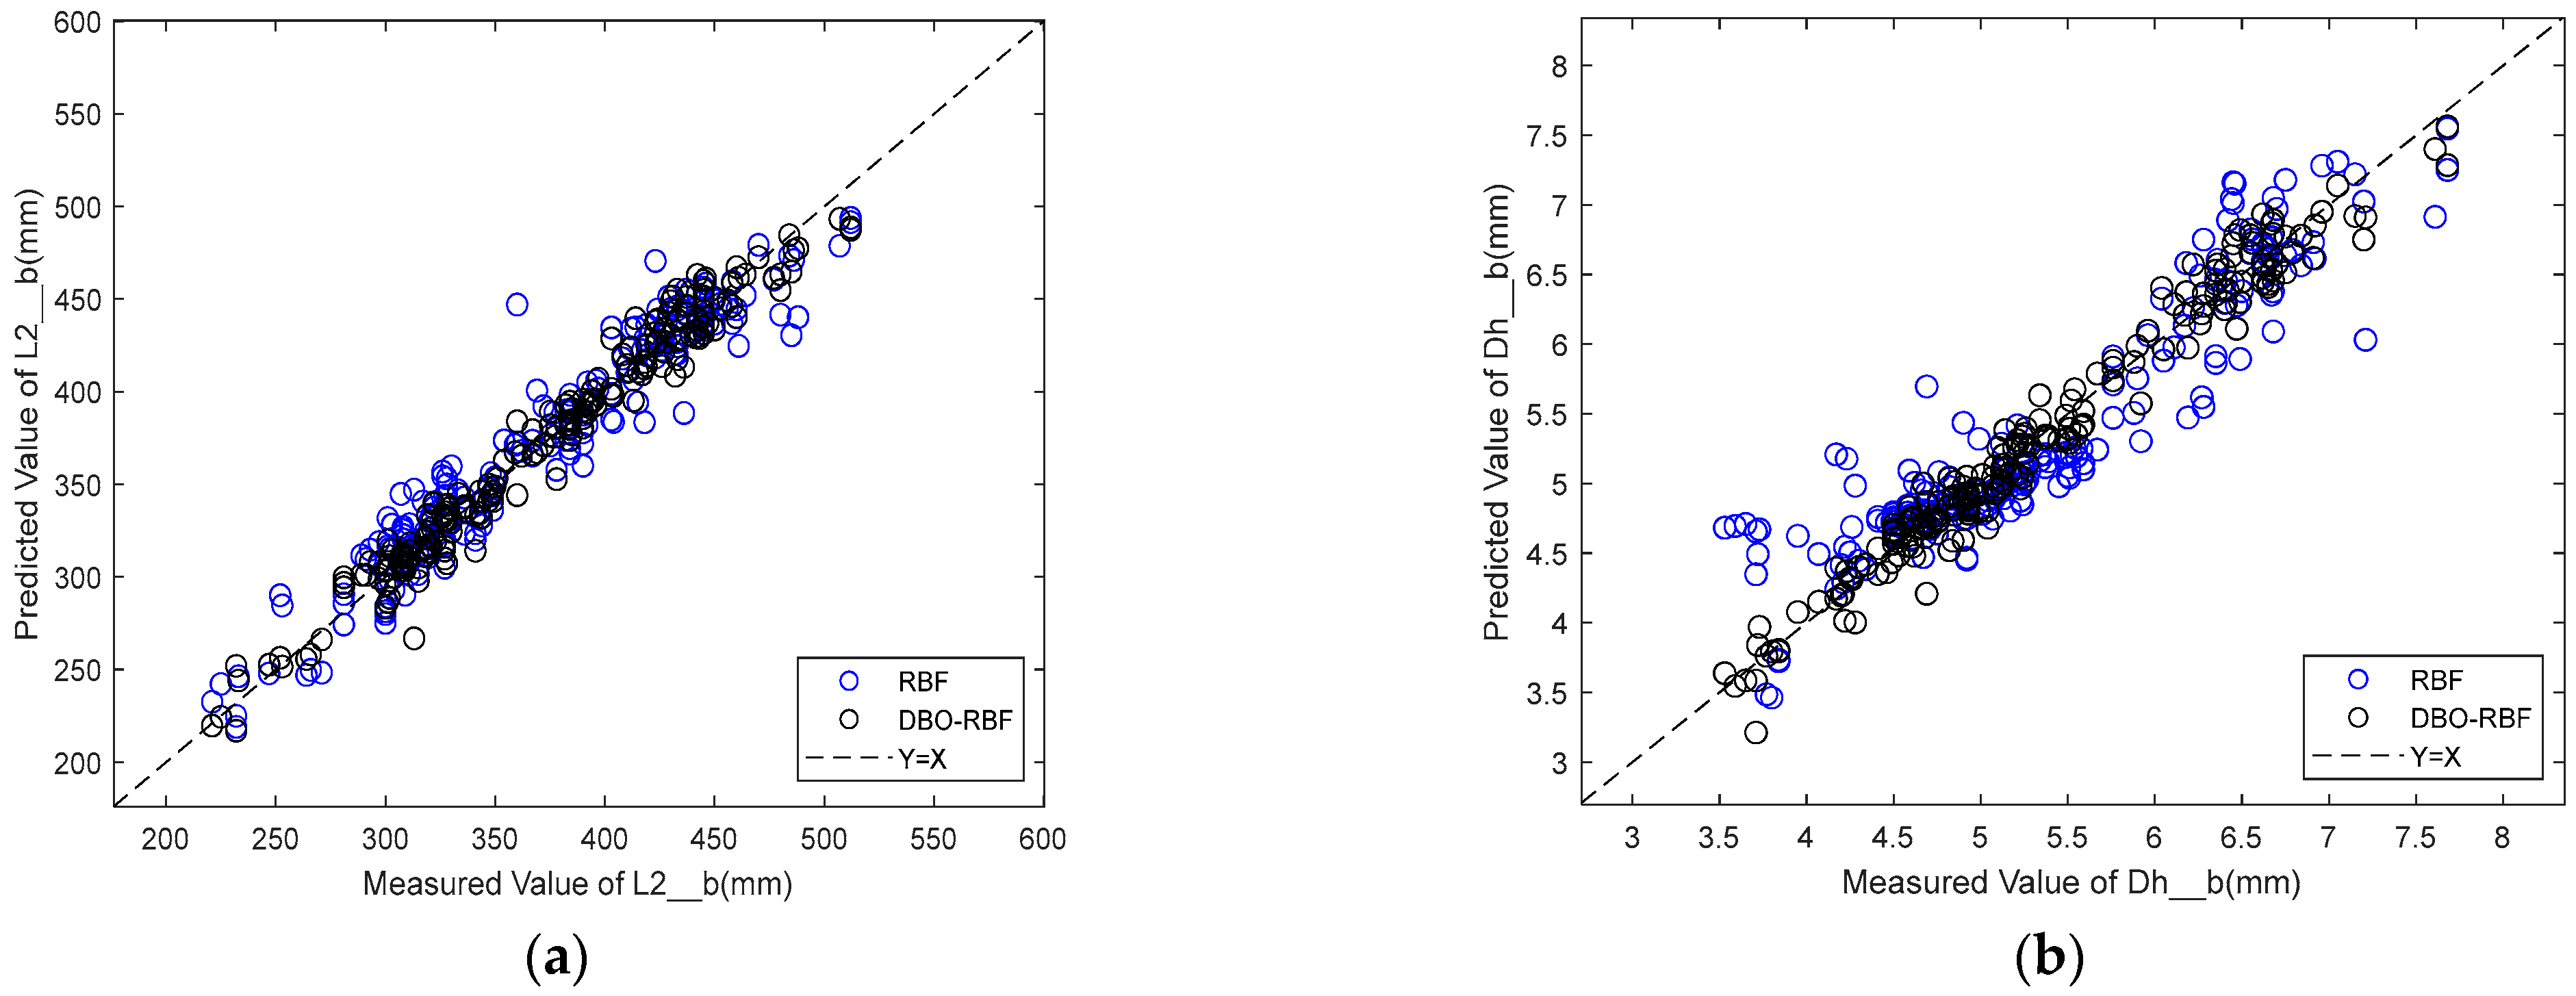
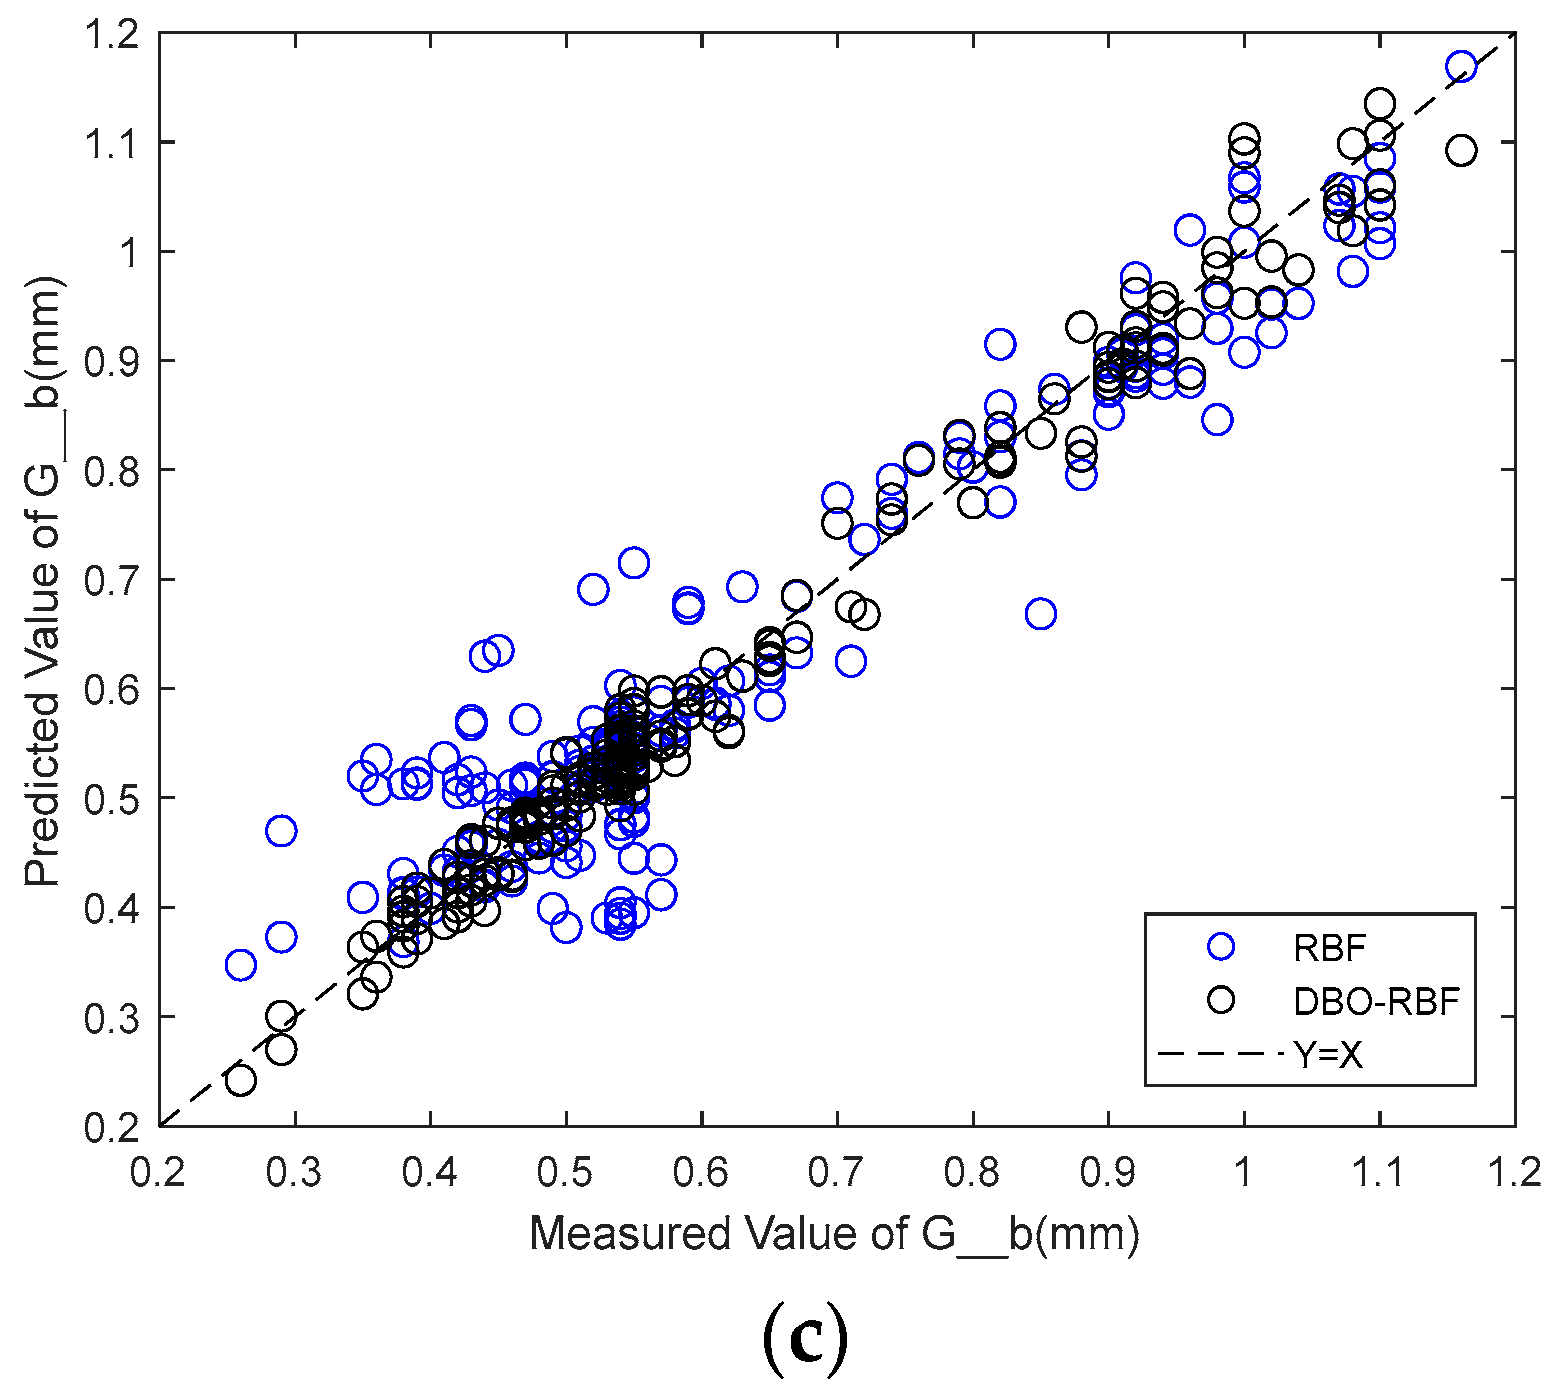
Three algorithms—BP, RBF, and DBO-RBF—were used to train the PVPC control model. The three models were trained together a total of nine times after randomly scrambling the dataset samples to generate training set samples each time. The median result was selected as the stable prediction result. Figure 19 shows the scatter plots of the results predicted by the different neural networks. From the graph, it can seen that the sample results predicted by DBO-RBF are closer to the standard line. The stable prediction results of the three neural networks are summarized in Table 14. Among them, DBO-RBF showed the best predictive performance. The R2 and MAE of L2_b were 0.96679 and 9.0289 mm; the R2 and MAE of Dh_b were 0.97014 and 0.1294 mm; and the R2 and MAE of G_b were 0.98642 and 0.0201 mm.

4.4. Data Analysis Based on PVPC Control Model

The digital control model was applied in order to verify the actual optimization performance. A group of seven slabs with the same specifications were selected from the same batch and the specific parameters are shown in Table 15.
The seven slabs were divided into three groups as shown in Table 16. The first group of slabs were rolled with the original PVPC parameters settings; The second group of slabs were rolled with the PVPC parameters optimized based on experience; The third group of slabs were rolled with optimized PVPC parameters calculated through the developed PVPC control model. The parameters are shown in Table 16.
We collected images of the head of each rolled plate using the image acquisition device, used the proposed image processing algorithm to extract the coordinates of irregular contour points, and performed corresponding calculations. We also measured the two characteristic lengths of the irregular area of the plate after crop shearing, and deviation is within 3 mm between the measured results and image processing results. The irregular area values of seven rolled plates are shown in Table 17.
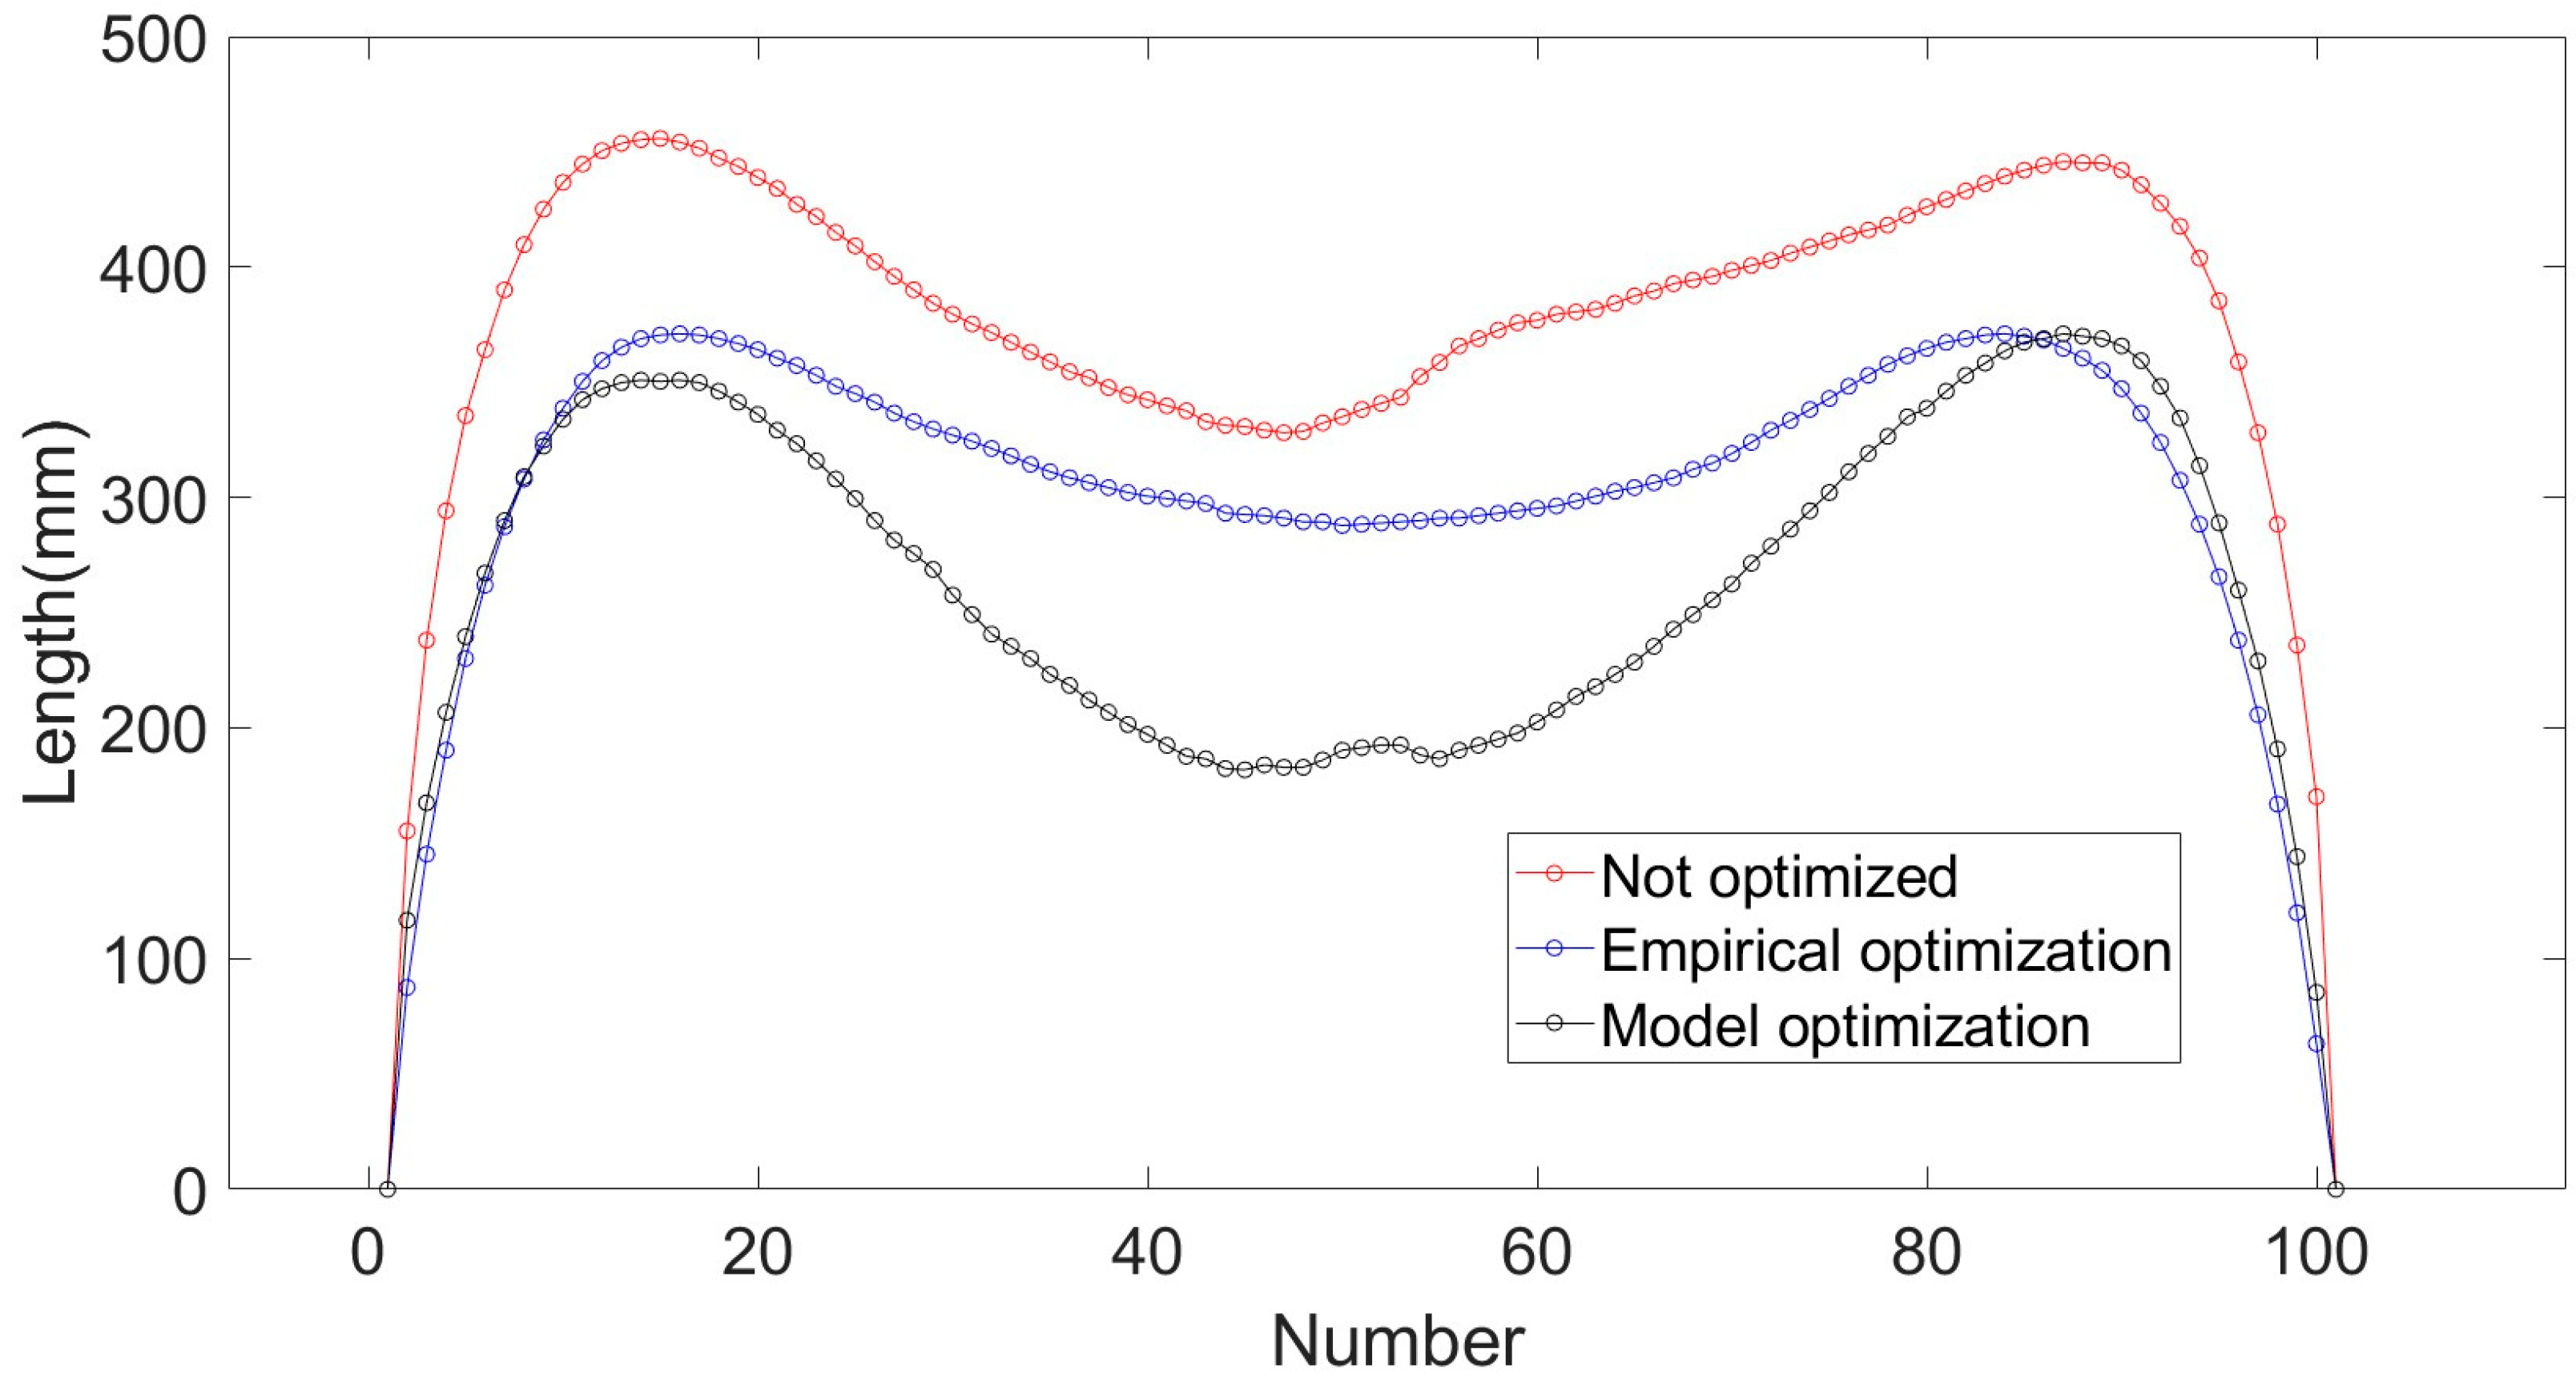
The table shows the best optimization effects on the irregularly cropped areas after rolling with the developed digital model. Figure 20 shows the control results of the irregular areas with different control methods. The irregularly cropped areas can be reduced by 31% with the digital control model.

5. Conclusions

In this paper, machine vision is used as a significant tool to accurately measure the plan view pattern data of plates. Using this dataset, a neural network-based model for predicting the plan view pattern of plates and a control model were proposed and improved using the dung beetle optimization algorithm. The main results of this article are as follows:
(1)
An automatic threshold adjustment algorithm is proposed for image processing of plates’ pattern photos during the rolling process. It can accurately perform binary processing to obtain accurate edge contour point data. The error between the pattern data calculated through machine vision technology and the measured pattern data does not exceed 3 mm.
(2)
Compared to the radial basis function model, the digital twin model proposed in this paper has higher prediction accuracy. For the prediction of head part contour points, the average goodness of fit increased from 0.98532 to 0.99021, and the average mean absolute error decreased from 11.03 mm to 10.54 mm. For the prediction of tail contour points, the average goodness of fit increased from 0.98103 to 0.98949, and the average mean absolute error decreased from 11.29 mm to 10.57 mm. In the PVPC control model, for the prediction results of PVPC parameters, the DBO-RBF model delivers the best performance. The goodness of fit of short stroke projection length, dynamic reduction, and further dynamic reduction are 0.96679, 0.97014, and 0.98462, respectively. The mean absolute error of short stroke projection length, dynamic reduction, and further dynamic reduction are 9.1007 mm, 0.1294 mm, and 0.0217 mm, respectively.
(3)
The developed digital PVPC control model has been applied to practical production. Compared to traditional empirical optimization, the PVPC control model reduces the irregularly cropped pattern by 31%.

Author Contributions

Conceptualization, Z.J. and C.H.; methodology, Z.J., S.G. and C.L.; software, S.G. and G.L.; validation, S.G., C.L., J.L. and Z.W.(Zhiqiang Wang); formal analysis, C.L., J.L. and Z.W. (Zhiqiang Wang); investigation, Z.Z. and Z.W. (Zhiqiang Wu); data curation, S.G. and C.L.; writing—original draft preparation, Z.J., S.G., J.L. and Z.W. (Zhiqiang Wang); writing—review and editing, Z.J., S.G., Z.Z. and Z.W. (Zhiqiang Wu); visualization, C.L., J.L. and Z.W. (Zhiqiang Wang); supervision, Z.J., C.H., Z.Z. and Z.W. (Zhiqiang Wu) All authors have read and agreed to the published version of the manuscript.

Funding

This research was funded by the Fundamental Research Funds for the Central Universities (N160704003, N170708020, N2107007).

Data Availability Statement

The data presented in this study are available on request from the corresponding author. The data are not publicly available due to privacy.

Conflicts of Interest

The authors declare no conflicts of interest.

References

  1. Wang, G.D.; Liu, Z.Y.; Zhang, D.H.; Chu, M.S. Transformation and development of materials science and technology and construction of iron and steel innovation infrastructure. J. Iron Steel Res. 2021, 33, 1003–1017. [Google Scholar] [CrossRef]
  2. Wang, G.D. Status and prospects of research and development of key common technologies for high-quality heavy and medium plate production. Steel Roll. 2019, 36, 1. [Google Scholar] [CrossRef]
  3. Shigemori, H.; Nambu, K.; Nagao, R. Plan View Pattern Control for Steel Plates through Constrained Locally Weighted Regression. Trans. Soc. Instrum. Control Eng. 2010, 46, 472–479. [Google Scholar] [CrossRef]
  4. Yao, X.L.; Yu, X.T.; Wu, Q.H.; Liang, Q.H. The application research of plan view pattern control in plate rolling. Kybernetes 2010, 39, 1351–1358. [Google Scholar] [CrossRef]
  5. Han, J. Research on theory and Strategy of PVPC during Plate Rolling Process. Master’s Thesis, Northeast University, Shenyang, Liaoning, China, 2012. [Google Scholar] [CrossRef]
  6. Deng, W.J. Research and Application of Process Control Model for Plan Pattern of Plates. Master’s Thesis, Northeast University, Shenyang, Liaoning, China, 2013. [Google Scholar] [CrossRef]
  7. Ni, K. Application of SQP Optimizing Algorithm for Plan View Pattern Control on Plate Mill. Master’s Thesis, Northeast University, Shenyang, Liaoning, China, 2013. [Google Scholar] [CrossRef]
  8. Shen, M.; Lu, C.N.; Li, L. Research and application of mathematical models for plan view pattern control of plate. Steel Roll. 2016, 33, 19–23+58. [Google Scholar]
  9. Liu, L.Z. Numerical Simulation and Mathematical Modeling of Plate Rolling Process. Ph.D. Thesis, Northeast University, Shenyang, Liaoning, China, 2022. [Google Scholar] [CrossRef]
  10. Liu, H. Experimental and Simulator Study on Plate Plan View Pattern Control. Ph.D. Thesis, Northeast University: Shenyang, Liaoning, China, 2005. [Google Scholar]
  11. He, Q.S. Finite-Element Simulation of Plan View Pattern Control During Plate Rolling Process. Master’s Thesis, Northeast University, Shenyang, Liaoning, China, 2009. [Google Scholar] [CrossRef]
  12. Zhao, Y.; Yang, Q.; He, A.R.; Wang, X.C.; Zhang, Y. Precision Plate Plan View Pattern Predictive Model. J. Iron Steel Res. Int. 2011, 18, 26–30. [Google Scholar] [CrossRef]
  13. Gu, S.F. Finite Element Simulation of the Vertical Roll and MAS Rolling in Plate Shape Control. Master’s Thesis, Northeast University, Shenyang, Liaoning, China, 2014. [Google Scholar]
  14. Zhang, L.W.; Gu, S.D.; He, W.B.; Chen, S.H. 3D FE modelling of plate pattern during heavy plate rolling. Ironmak. Steelmak. 2014, 41, 199–205. [Google Scholar]
  15. Ruan, J.H.; Zhang, L.W.; Gu, S.D.; He, W.B.; Chen, S.H. Regression models for predicting plate plan view pattern during wide and heavy plate rolling. Ironmak. Steelmak. 2014, 41, 656–664. [Google Scholar] [CrossRef]
  16. Horie, M.; Hirata, K.; Tateno, J.; Nakata, N. Influence of Dog-Bone Width on End Profile in Plan View Pattern Control Method in Plate Rolling. Mater. Trans. 2017, 58, 623–628. [Google Scholar] [CrossRef]
  17. Ruan, J.H.; Zhang, L.W. Finite element simulation based plate edging model for plan view pattern control during wide and heavy plate rolling. Ironmak. Steelmak. 2015, 42, 585–593. [Google Scholar] [CrossRef]
  18. Jiao, Z.J.; He, C.Y.; Ding, J.G.; Wang, J.; Zhang, K.B. Industrial popularization and application of plan view pattern control technology for plate mill. Iron Steel 2019, 54, 49–55. [Google Scholar]
  19. Ding, J.G.; Wang, Q.G.; He, Y.H.C.; Kong, L.P.; Zhao, Z. Controllable Points Setting Method for Plan View Pattern Control in Plate Rolling Process. Steel Res. Int. 2020, 91, 1900345. [Google Scholar] [CrossRef]
  20. Liebenberg, M.; Jarke, M. Information Systems Engineering with Digital Shadows: Concept and Case Studies. In Advanced Information Systems Engineering; Lecture Notes in Computer Science; Springer: Cham, Switzerland, 2020; Volume 12127. [Google Scholar] [CrossRef]
  21. De Kooning, J.D.M.; Stockman, K.; De Maeyer, J.; Jarquin-Laguna, A.; Vandevelde, L. Digital Twins for Wind Energy Conversion Systems: A Literature Review of Potential Modelling Techniques Focused on Model Fidelity and Computational Load. Processes 2021, 9, 2224. [Google Scholar] [CrossRef]
  22. Gasiyarov, V.R.; Radionov, A.A.; Loginov, B.M.; Zinchenko, M.A.; Gasiyarova, O.A.; Karandaev, A.S.; Khramshin, V.R. Method for Defining Parameters of Electromechanical System Model as Part of Digital Twin of Rolling Mill. J. Manuf. Mater. Process. 2023, 7, 183. [Google Scholar] [CrossRef]
  23. Bassi, A.; Bodas, S.T.; Hasan, S.S.; Sidhu, G.; Srinivasan, S. Predictive Modeling of Hardness Values and Phase Fraction Percentages in Micro-Alloyed Steel during Heat Treatment Using AI. Metals 2024, 14, 49. [Google Scholar] [CrossRef]
  24. Zhao, Z. Study on Dynamic Controllable Point Setting and Intelligent Optimization Strategy for Plan View Pattern Control of Plate. Ph.D. Thesis, Northeast University, Shenyang, Liaoning, China, 2018. [Google Scholar] [CrossRef]
  25. Wang, Y.Y. Research and Application of Intelligent Prediction Model for Plan View Pattern of Plate. Master’s Thesis, Northeast University, Shenyang, Liaoning, China, 2017. [Google Scholar] [CrossRef]
  26. Wang, S.J. Study on Optimal Setting of Control Parameters for Plan View Pattern of Plate. Master’s Thesis, Northeast University, Shenyang, Liaoning, China, 2019. [Google Scholar] [CrossRef]
  27. Dong, Z.S.; Li, X.; Luan, F.; Zhang, D.H. Prediction and analysis of key parameters of head deformation of hot-rolled plates based on artificial neural networks. J. Manuf. Process. 2022, 77, 282–300. [Google Scholar] [CrossRef]
  28. Schausberger, F.; Steinboeck, A.; Kugi, A.; Jochum, M.; Wild, D. Vision-based material tracking in heavy-plate rolling. IFAC-Pap. 2016, 49, 108–113. [Google Scholar] [CrossRef]
  29. Kim, M.; Lee, W.; Yao, J.; Park, P. Image stitching algorithm for camber measurement in hot rolling process: Cross-correlation approach (ICCAS 2015). In Proceedings of the 15th International Conference on Control, Automation and Systems (ICCAS), Busan, Republic of Korea, 13–16 October 2015; pp. 1577–1580. [Google Scholar] [CrossRef]
  30. Kong, N.; Yao, J.; Lee, J.; Yun, S.W.; Bae, J.; Park, P. Vision-based camber measurement system in the endless hot rolling process. Mater. Sci. 2011, 50, 107202. [Google Scholar] [CrossRef]
  31. Gauss, J.C.F. Theoria Motus Corporum Coelestium in Sectionibus Conicis Solem Ambientium; Cambridge University Press: Cambridge, UK, 2011. [Google Scholar]
  32. White, H. Learning in Artificial Neural Networks: A Statistical Perspective. Neural Comput. 1989, 1, 425–464. [Google Scholar] [CrossRef]
  33. Jiménez-Come, M.J.; González Gallero, F.J.; Álvarez Gómez, P.; Mena Baladés, J.D. Corrosion Behaviour Modelling Using Artificial Neural Networks: A Case Study in Biogas Environment. Metals 2023, 13, 1811. [Google Scholar] [CrossRef]
  34. Chen, S. Recursive Hybrid Algorithm for Nonlinear System Identification using Radical Basis Function Networks. Int. J. Control 1992, 55, 1051–1070. [Google Scholar] [CrossRef]
  35. Neumann, O. The Disquisitiones Arithmeticae and the Theory of Equations; Springer: Berlin/Heidelberg, Germany, 2007. [Google Scholar] [CrossRef]
  36. Zhu, F.; Li, G.; Tang, H.; Li, Y.; Lv, X.; Wang, X. Dung beetle optimization algorithm based on quantum computing and multi-strategy fusion for solving engineering problems. Expert Syst. Appl. 2024, 236, 121219. [Google Scholar] [CrossRef]
  37. Zhang, R.; Zhu, Y. Predicting the Mechanical Properties of Heat-Treated Woods Using Optimization-Algorithm-Based BPNN. Forests 2023, 14, 935. [Google Scholar] [CrossRef]
  38. James, G.; Witten, D.; Hastie, T.; Tibshirani, R. An Introduction to Statistical Machine Learning; Springer: New York, NY, USA, 2013. [Google Scholar] [CrossRef]
Figure 1. Rolling process of PVPC: (a) PVPC sizing rolling, and (b) PVPC broadsiding rolling.
Metals 14 00094 g001
Figure 2. Schema of camera installation position.
Metals 14 00094 g002
Figure 3. Image before and after image processing: (a) before image processing, and (b) after image processing.
Metals 14 00094 g003
Figure 4. Flow chart of automatic threshold adjustment algorithm.
Metals 14 00094 g004
Figure 5. Schema of image processing algorithm.
Metals 14 00094 g005
Figure 6. Schematic diagram of feature contour points.
Metals 14 00094 g006
Figure 7. Outline point coordinate processing diagram.
Metals 14 00094 g007
Figure 8. Cross section of plate. The red line in the picture represents the contour line of the steel plate after PVPC technology is applied, the black line represents the simplified contour line, and the red points are the feature points set in the seven point control method to define variables.
Metals 14 00094 g008
Figure 9. Parameter extraction of crop pattern deformation. The black line represents the actual contour of the edges of the rolled steel plate, while the red line represents the contour of the edges of the cut steel plate.
Metals 14 00094 g009
Figure 10. Schema of RBF network neural structure.
Metals 14 00094 g010
Figure 11. Flow chart of DBO algorithm.
Metals 14 00094 g011
Figure 12. Network structure of the plan pattern prediction model.
Metals 14 00094 g012
Figure 13. Flow chart of DBO-RBF algorithm.
Metals 14 00094 g013
Figure 14. Network structure of the plan pattern control model.
Metals 14 00094 g014
Figure 15. The boxplot for the v.R2 value in multiple training sessions.
Metals 14 00094 g015
Figure 16. The scatter plot for the R2 value in multiple training sessions.
Metals 14 00094 g016
Figure 17. The Tar_thk influence on the Hp and Sr.
Metals 14 00094 g017
Figure 18. PVPC parameters influence on the Hp and Sr: (a) L2_b, (b) Dh_b and (c) G_b.
Metals 14 00094 g018aMetals 14 00094 g018b
Figure 19. Prediction effect in RBF and DBO-RBF of PVPC parameters: (a) L2_b, (b) Dh_b, and (c) G_b.
Metals 14 00094 g019aMetals 14 00094 g019b
Figure 20. Comparison of head parts with different optimization methods.
Metals 14 00094 g020
Table 1. Contrast deviation of contour point coordinates.
IDIdeal Pixel CoordinatesTextual AlgorithmDeviation (pi)
A1(53, 599)(53, 599)0
B1(1063, 599)(1062, 599)1
C1(203, 377)(203, 378)1
D1(896, 391)(896, 391)0
E1(704, 399)(704, 398)1
Average deviation: 0.6
Table 2. Five groups of contour point deviation.
Group12345Average Deviation
Deviation (pi)0.6110.40.80.76
Table 3. Parameter description of the dataset.
IndexParameterDescriptionUnit
V1Plt_thkThe plate thickness before rollingmm
V2Plt_widThe plate width before rollingmm
V3Plt_lenThe plate length before rollingmm
V4Tar_thkTarget thicknessmm
V5Ratio_widthBroadening ratio after completion of rolling-
V6Ratio_lengthExtension ratio after completion of rolling-
V7L1_bPrestroke length (PVPC parameter)mm
V8L2_bShort stroke projection length (PVPC parameter)mm
V9Dh_bDynamic reduction (PVPC parameter)mm
V10G_bFurther dynamic reduction (PVPC parameter)mm
V11HpMaximum height of crop patternmm
V12SrIrregular area of crop patternmm2
V13-V63h1-h51Y-value of plate contour pointsmm
Table 4. Parameter description of the stand dataset.
ItemsRoughing MillFinishing MillUnit
Maximum rolling force50,00040,000kN
Work roll diameterΦ900/Φ850Φ850/Φ800mm
Work roll length28002690mm
Backup roll diameterΦ1800/Φ1700Φ1600/Φ1500mm
Backup roll length27402590mm
Rated speed of motor0-50-1200-60-145rpm
Main motor power2 × 42002 × 4200kW
Rated rolling torque2 × 17002 × 1470kN·m
Slab size range (Thick × Width × Length)150 − 260 × 1665 − 2570 × 1000 – 2700
6 − 60 × 1500 − 2500 × 6000 − 53,000
mm
Plate size range (Thick × Width × Length)mm
Table 5. Effect of spread of RBF.
Spreadv.R2v.MAE (mm)
100.9032216.7342
500.9358813.5319
1000.9565613.0510
1500.9778012.8796
2000.9823611.3574
2500.9822711.3587
3000.9810511.5419
3500.9755312.5201
4000.9672513.0107
5000.9568913.1065
6000.9272515.0107
Table 6. Effect of population size and iterations of Plan Pattern Prediction Model.
Population SizeIterationsv.R2v.MAE (mm)Training Time (s)
30500.9874711.1523353
301000.9879211.0967701
501000.9884111.03961112
501500.9895510.87621537
502000.9895510.87622196
1002000.9895510.87623914
1005000.9895510.87629894
Table 7. Plan Pattern Prediction Model parameters based on BP.
ParametersValue
Number of hidden layers2
Number of hidden neurons25–25
learning rate0.02
dropout ratio0.1
hidden layer activation functionsigmoid function
optimization functionoptimization function
loss functionMSE
Table 8. Effect of spread parameter of RBF.
Spreadv.R2v.MAE (mm)
100.869453.9413
200.951633.2748
300.955723.2124
400.966373.1471
500.968663.1293
600.96923.0974
700.968753.1264
800.967743.1486
1000.960253.1897
2000.956893.2103
3000.927253.4937
Table 9. Effect of population size and iterations of Plan Pattern Control Model.
Population SizeIterationsv.R2v.MAE (mm)Training Time (s)
30500.969755.1012141
301000.969755.1012274
501000.971045.0973409
501500.972165.0604613
502000.972165.0604837
Table 10. Plan Pattern Control Model parameters based on BP.
ParametersValue
Number of hidden layers2
Number of hidden neurons20–20
learning rate0.02
dropout ratio0.1
hidden layer activation functionsigmoid function
optimization functionoptimization function
loss functionMSE
Table 11. The value distribution of v.MAE in multiple training sessions.
v.MAE (mm)BPRBFDBO-RBF
≤12 mm132136145
12–18 mm656055
18–24 mm141715
24–30 mm654
>30 mm210
Table 12. Comparison of the different models.
Indexv.R2v.MAE (mm)
headBP0.9537413.35
RBF0.9853211.03
DBO-RBF0.9902110.54
tailBP0.9559012.12
RBF0.9810311.29
DBO-RBF0.9894910.57
Table 13. Slab data summary.
ParametersValues
Plt_thk/mm220
Plt_wid/mm2065
Plt_len/mm2447
Tar_thk/mm11.6
Ratio_width1.11
Ratio_length17.14
Table 14. Results comparison of models.
ParameterModelsR2MAE (mm)
L2_bDBO-RBF0.966799.0289
RBF0.955319.1007
BP0.935149.2986
Dh_bDBO-RBF0.970140.1294
RBF0.960380.1457
BP0.935070.1601
G_bDBO-RBF0.986420.0201
RBF0.978750.0217
BP0.941130.0243
Table 15. Summary table of slab data.
ItemsData
materialAISI-1045
Start rolling temperature/°C1100
Plt_thk/mm220
Plt_wid/mm2165
Plt_len/mm2522
Tar_thk/mm19
Ratio_width1.11
Ratio_length10.43
Table 16. PVPC parameters settings.
Optimization MethodNumberL2_b (mm)Dh_b (mm)G_b (mm)
Not optimized1-16056.20.35
Experience optimization2-16056.40.54
2-26056.40.54
2-36056.40.54
Model optimization3-1649.46.570.75
3-2649.46.570.75
3-3649.46.570.75
Table 17. The measurement results of Sr after rolling.
GroupNumberSr (mm2)
11-1903,271.99
22-1730,173.10
2-2749,710.71
2-3728,490.90
Average value736,124.90
33-1624,578.69
3-2609,294.65
3-3642,866.66
Average value625,580.00
Disclaimer/Publisher’s Note: The statements, opinions and data contained in all publications are solely those of the individual author(s) and contributor(s) and not of MDPI and/or the editor(s). MDPI and/or the editor(s) disclaim responsibility for any injury to people or property resulting from any ideas, methods, instructions or products referred to in the content.