1. Introduction
A recent transition in the automotive industry promotes continuous development and production of electricity-based vehicles, such as electric vehicles (EVs) and hydrogen fuel cell vehicles. They are characterized by a lack of emission of pollutants in line with the global movement toward sustainable and green growth. The increasing demand for these EVs leads to traction motors, which are a crucial component of EVs. The development of a system for automated joining of coils is necessary to achieve increased productivity in manufacturing of the motor cores of traction motors. In this process, there may be problems, such as compromised productivity and stability. Thus, a system that allows automated joining of electric steel coils is necessary [
1]. Laser welding technology is required to develop this system [
2,
3,
4].
Currently, the types of lasers used for laser welding in industrial applications include Arc, CO
2, Nd-YAG, and fiber lasers [
5]. These lasers, apart from fiber lasers, have considerable strong laser powers or a long wavelength, generating a lot of heat and adversely affecting the geometry and quality of the welding part when welding thin sheets or plates with a thickness of 0.27 mm. In the case of a thin sheet with a thickness less than 0.5 mm, welding deformation or distortion occurs because of the residual stress generated by the melt welded zone and heat during welding. In addition, for welding thin sheets, in the case of excessive input energy, full laser penetration occurs, resulting in a continuous increase in the size of the lower melt region. This leads to a difference in the surface tension between the top and bottom surfaces, which contributes to melt drops at the bottom due to Marangoni convection [
6]. In addition, side effects affecting the shape of the welding portion, such as undercuts, melting, voids, and spatters may occur. Accordingly, it is possible to identify process variables that may cause weld defects.
Welding beads are formed on the weld surface due to the heat input and other parameters applied to laser welding [
7]. For motor cores manufactured by lamination, the bead height must be minimized. The height and shape of the bead are the most important factors to consider when judging the overall weld. In this research, when an electric motor core is manufactured, an electric motor core is stacked, and electric steel sheet coils are stacked in a laminated form. Therefore, to stack in a laminated form, the height of the upper bead of the welding part must be lower than the complete penetration condition, hence preventing the presence of a gap in each layer and increasing the quality of the electric motor. In addition, it is possible to analyze the welding defects mentioned above through the bead shape.
Parameters applicable for laser welding include the laser power, wavelength, scan speed, and beam size. Developing a laser with an optimal energy density for welding thin sheets is achieved by controlling these parameters. In laser welding, the absorption rate of the laser beam varies depending on the material [
8]. Materials for welding have different material-specific thermophysical properties, such as thermal conductivity, thermal diffusivity, density, and specific heat capacity. In the case of metals, optical reflectance decreases when electrical conductivity decreases, increasing the absorption. The absorption rate varies depending on the material, and even if the material is irradiated with the same laser power, the heat input can be different. This results in differences in the geometry of the welding part. The material used for electric motors is Si–steel sheets. In the case of Si–steel sheets, their applications differ according to the Si content, and they are produced for electro-technical purposes. In general, for motors used in EVs, Si–steel sheets with non-oriented grains with a Si content less than 3% are used [
9]. Before conducting welding experiments with these materials, computational fluid dynamics (CFD) simulation allows for a fundamental understanding of the laser process. Using parameters adopted in the welding process, CFD simulations enable the investigation of the roles of these parameters in laser welding for various weld bead heights, surface morphologies, and melt pool conditions [
10,
11,
12]. FLOW-3D, a software used for CFD simulation, implements the fluid flow, heat transfer, laser melting, and recoil pressure and is suitable for the analysis of laser welding processes [
7].
In terms of laser modes used in laser welding, they can be divided into a conduction mode and a keyhole mode for analysis. The mode is selected depending on the thickness of the workpiece for welding. In the case of welding a thick base metal, the keyhole mode is used, and the conduction mode is selected for welding thin sheets. In this study, welding was performed with a thin sheet metal, and we selected the conduction mode for laser welding. Heat spreads to the inside of the irradiated interface when the metal surface temperature is increased above the melting point by laser irradiation, which contributes to a reduction in voids and melt drop phenomena caused by excessive input energy during welding [
13].
Several studies related to laser welding are in progress. Datta et al. investigated basic metallurgical studies related to laser welding of a Ni-Ti alloy sheet [
14]. He et al. conducted numerical simulations and experiments to investigate the welding deformation of a 1 mm thick 6061 aluminum alloy sheet. By adjusting the laser welding sequence, the effect on welding heat distribution and welding deformation was investigated [
15]. Zhao et al. reviewed the transition layer and filler wire to improve the mechanical properties of a steel–aluminum laser welding joint [
16]. Wallerstein et al. reviewed research work on laser welding between aluminum and steel. Joining aluminum to steel is a difficult task, mainly due to the formation of brittle intermetallic compounds (IMCs) at the joint interface. To overcome this, we studied IMC formation and growth and proposed various strategies to minimize it [
17]. Omoniyi et al. studied the effects of laser power and welding speed on the tensile strength, microhardness, and microstructure of the alloy during laser welding of a titanium alloy Ti
6Al
4V [
18]. Zhang et al. studied fiber laser butt welding of ALSI 304L and Q235 low-turn steels. Numerical simulation of the laser butt welding process was performed with an integrated heat source combining an asymmetrically shaped elliptical heat source and a cylindrical heat source [
19]. Tlili et al. investigated the effects of welding parameters on temperature distribution, weld bead dimensions, melt flow rate, and microstructure during fiber laser welding of a material reinforced with a deposition mechanism called Inconel 625 using finite volume method and experiments [
20].
In this study, the changes in weld shape that occur in electrical steel sheets in laser welding Si–steel sheets were investigated through simulation analysis. For comparative analysis of weld geometry and welding defects that occur by the laser power and scan speed in the welding process, simulation was performed by applying two different levels of laser power, 700 and 800 W, and increasing the scan speed from 0.1 to 0.15 m/s by an interval of 0.01 m/s for each laser power. In the case of laser welding, cooling rapidly occurs. Thus, the cooling rate was not separately considered [
21]. Three-dimensional (3D) modeling was performed for analysis of laser weld geometry, and meshing was required for setting the basis of analysis using the finite element method (FEM) [
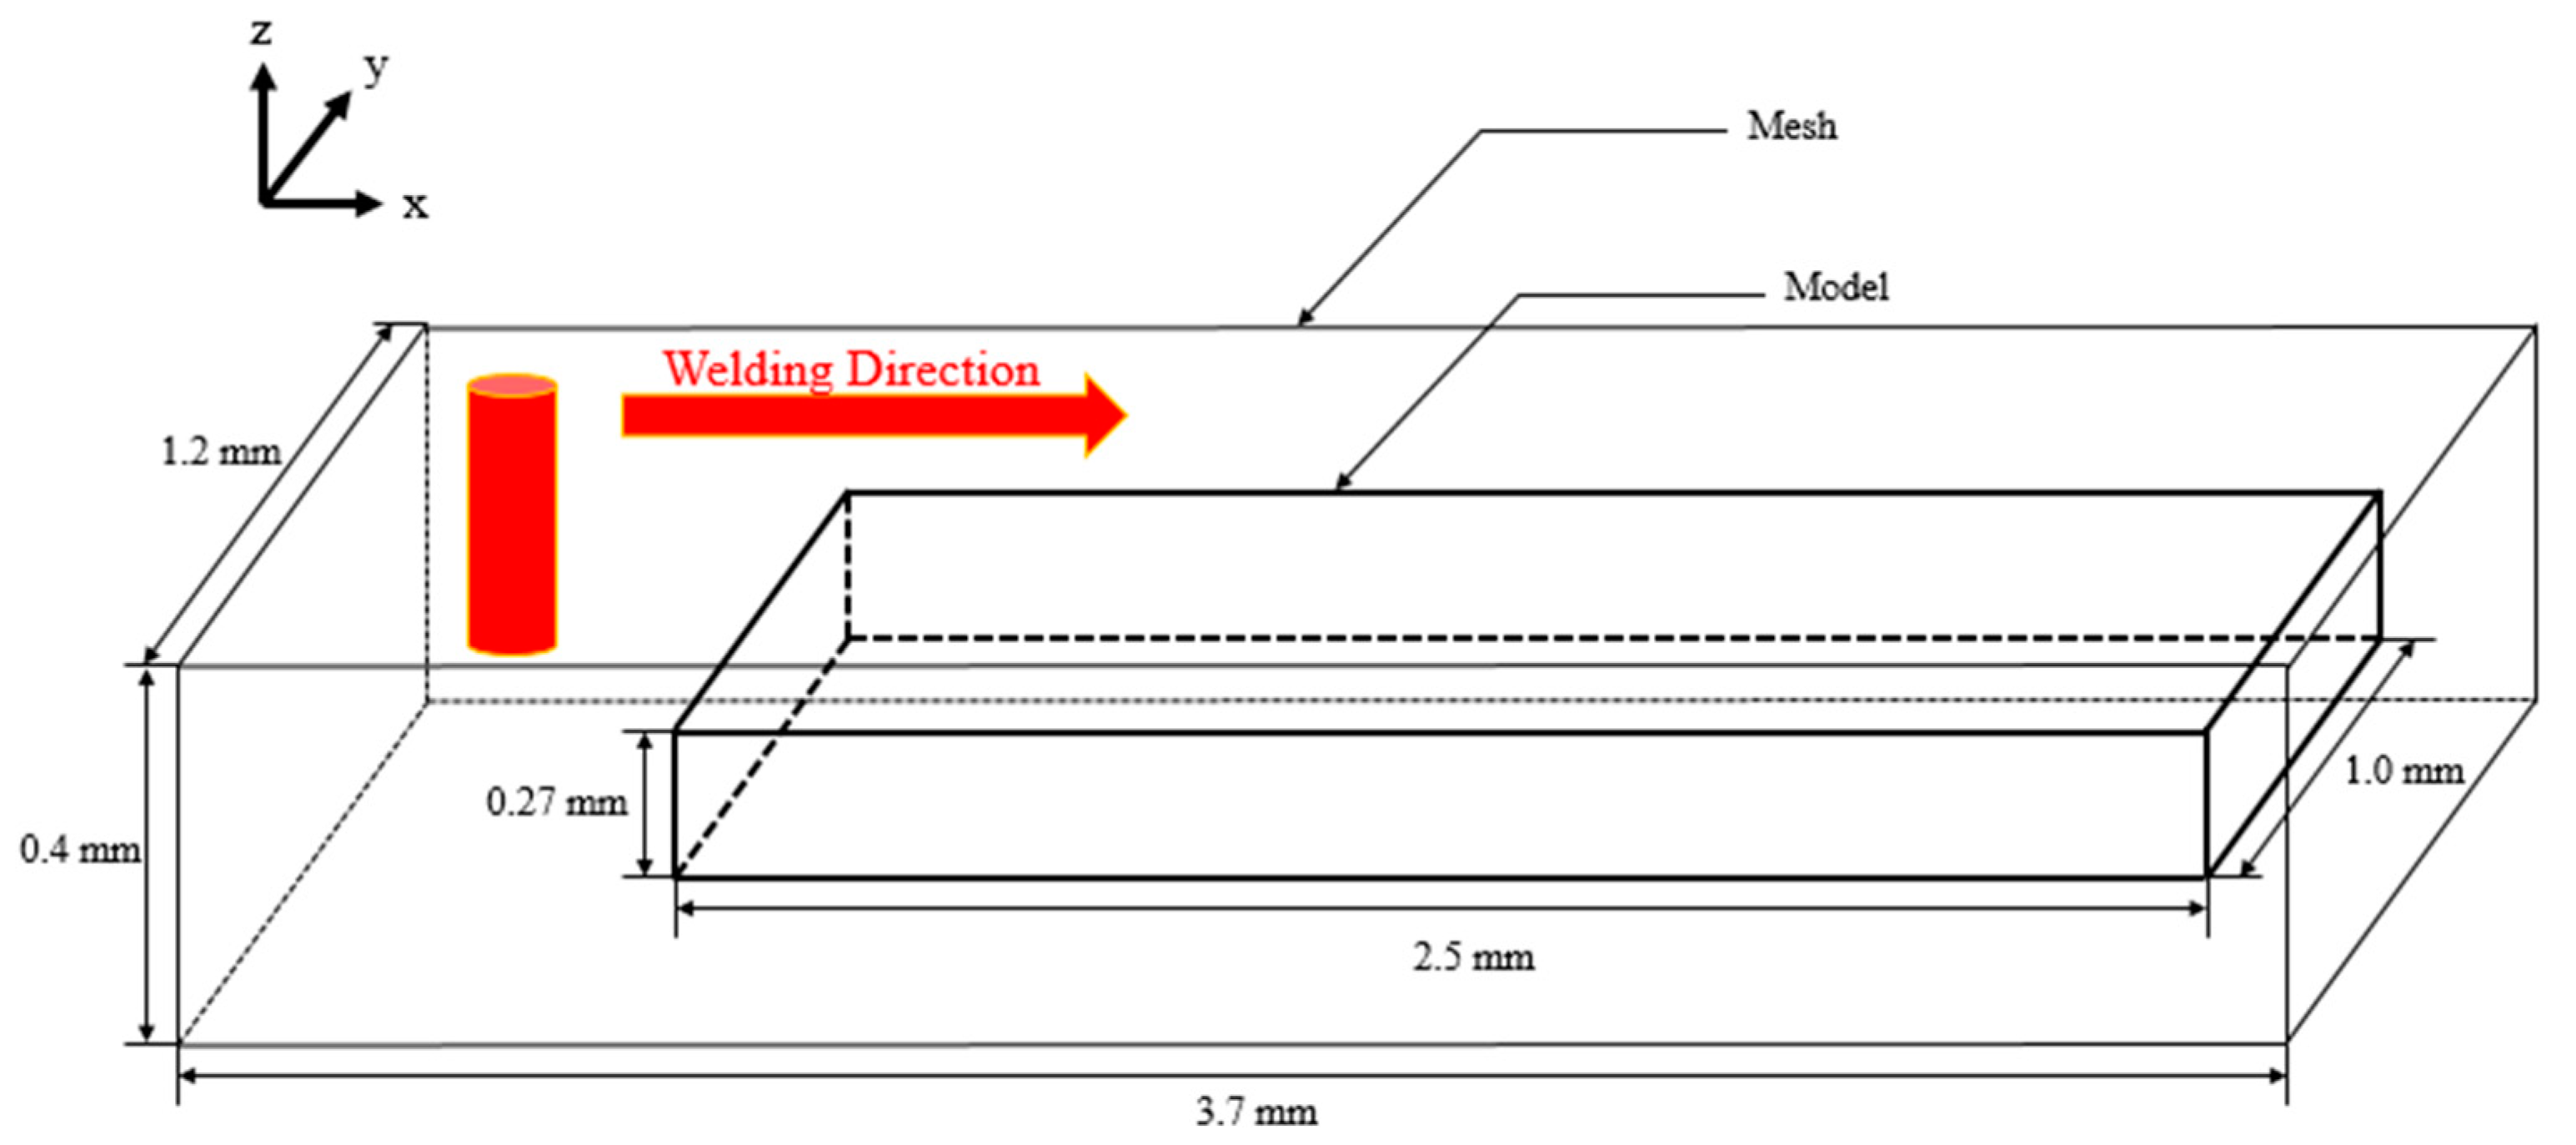
22]. The temperature distribution of the welding part was investigated using heat transfer equations. The resulting weld geometry was visualized and analyzed using FLOW-3D POST to examine the bead height and welding defects formed in the process of laser welding. The material properties required for the analysis were implemented using the material library in the software, and modeling was performed assuming that there was no shield gas.
3. Numerical Analysis Methods
For the thermal analysis, a 3D model for the laser welding process of the Si–steel was developed in FLOW-3D WELD. The parametric values used in the model are listed in
Table 3.
In this model, the heat transfer equation for the heat generated in the base metal by the laser power in conduction mode is expressed as follows [
28].
where
,
,
, and
are the temperature, heat generation, thermal conductivity, and thermal diffusivity, respectively. In Equation (1), the left term represents heat conduction in three dimensions. The modeling assumes a transient state condition, time-dependent heat source, and
represents the heat generated by laser power.
where
,
,
, and
denote the reflectance, laser penetration depth, laser heat source, and sample depth from the top surface of the base metal, respectively. The reflectance can be obtained through the reflectance introduced in
Figure 2a. The sample thickness was 0.27 mm. In Equation (3),
is the thermal diffusivity,
is the thermal conductivity,
is the density, and
c is the specific heat. The values presented in
Table 1 are used for the material properties.
The initial condition was set at 20 °C. The convection and radiation boundary condition were applied on the surface of Si–steel. The convection boundary condition was applied in the form of natural convection coefficient ().
Considering the advantage in terms of the computation time for numerical analysis and the use of central processing unit memory, the explicit method was adopted. The explicit method has the advantage of ease of programming and shorter computation time. Therefore, the explicit method takes a shorter time in terms of the total simulation end time in the numerical analysis method [
29].
The weld bead height model assumes that the weld pool geometry is symmetric and that the cooling rate is high enough to produce a solid weld bead. Because the variables are various in laser welding, the height can be predicted approximately, although not as a precise value.
where
,
,
,
,
, and
are the weld bead height, laser power, thermal conductivity of the material, density of material, welding speed, and specific heat of the material, respectively. To use this equation, the material properties and laser welding parameters should be known. The thermal conductivity, density, and specific heat of the material can be obtained from material data tables, and the laser power and welding speed can be specified. Once these values are known, the equation can be used to predict the weld bead height.
In laser welding, the internal energy equation is an important tool for understanding the thermodynamic behavior of the materials being welded [
30].
where
,
,
,
,
,
,
,
,
and
are the fractional volume open to flow, fluid density, velocity components, coordinate directions, fractional areas open to flow in
-direction, macroscopic fluid internal energy, density source term, turbulent diffusion, heat conduction, and energy source term, respectively. During laser welding, a high-intensity laser beam is used to heat the material, which causes it to melt and form a weld. The heat generated by the laser is transferred to the material, which causes a change in the material`s internal energy.
on the right side of Equation (5) is a density source term which refers to a term in the governing equations of fluid dynamics that accounts for the addition or removal of mass within a control volume. This term is often used in models of various physical processes.
where
, and
on the right side of Equations (7) and (8) are turbulent diffusion of
and thermal conduction, respectively, and they are expressed as follows:
where the coefficient
is equal to
in Equation (7). The
is a reciprocal turbulent Prandtl number. In the thermal conduction term of Equation (8), the thermal conductivity
can be directly specified and the Prandtl number
can be specified.
The last term,
, on the right side of Equation (5) is an energy source term. Specified net heat-flow rates for a structure are converted to local heat-flow rates by assuming a uniform heat flux over the surface of the heat structure. Optionally, the heat flux may be uniform on the wetted area of the heat structure. This results in an energy source rate for a computational mesh cell of the form as follows:
where
,
, and
are the heat structure under the surface area within the cell, the total structure heat flow rate, and the total structure surface area, respectively. This equation can also be expressed as a general heat transfer equation.
In this study, the dynamic behavior of the temperature of the thermal structure can be evaluated using FLOW-3D if the heat transfer option is selected for analysis. The thermal structure may be the mesh wall boundary. The general equation for the dynamic structure temperature is expressed as follows [
30].
where
,
,
,
,
,
,
,
,
,
,
,
, and
are the volume, density, specific heat, structural temperature, specific energy term, thermal conductivity, fluid fraction areas
, heat transfer coefficient, fluid surface temperature, radiation emissivity, and Stefan Boltzmann constant, respectively, in Equations (10) and (11). The term on the right side of Equation (10) is the specific energy term, which is composed of the convective and radiative heat transfer equation, as shown in Equation (11). In this simulation, the convective heat transfer coefficient at a room temperature of 20 °C was calculated as 5 W/m
2K.
4. Results and Discussion
For each case listed in
Table 2, the simulation analysis was performed, and the upper bead height formed in the welding part was compared for analysis. A chevron pattern, which is a typical pattern that appears in the welding part for laser welding, is observed in the results of the simulation. For each case, the upper bead height of the maximum height formed at the early stage of the welding and the height in the center of the welding part where the welding is performed at a constant level were measured.
Figure 3 shows the bead height depending on the laser power and scanning speed. As the scan speed is increased under the identical laser power condition, the formed weld bead height is decreased. In addition, under the same scan speed, the bead height decreased as the laser power increased. The bead height differences at a scan speed of 0.10 m/s with different laser powers were 19 and 10 μm at the maximum bead height and at the center, respectively. This is the largest difference among different values of the scan speed. When the scan speed was 0.11 m/s, the differences were 13 and 1 μm in the maximum bead height and in the center, respectively. This indicates the smallest difference. The bead height under a laser power of 800 W and a scan speed of 0.1 m/s shows a maximum upper bead height of 93 μm and a center bead height of 49 μm. The maximum height was obtained when the laser power was the strongest and the scan speed was the slowest. On the other hand, when the laser power was the weakest and the scan speed was the fastest (i.e., 700 W and 0.15 m/s), the maximum bead height and the center bead height were 56 and 32 μm, respectively. These are the minimum bead heights. When the laser power was 800 W with scan speeds of 0.13 m/s and 0.14 m/s, bead heights were formed without significant differences overall. However, when the scan speeds were 0.10 m/s and 0.15 m/s, under the same laser power, a large variation in the bead height formed was observed, compared with other cases. However, a large variation was observed in the maximum upper bead height when the scan speed changed from 0.12 m/s to 0.13 m/s and the laser power was 700 W. However, no difference was observed in the center bead height.
By comparing the maximum upper bead height between the laser powers of 800 and 700 W, a similar bead height was formed. With different laser power and scan speeds, a similar bead height was observed at scan speeds of 0.13 and 0.10 m/s. When the laser power was lowered, a similar level of bead height formation was observed. As the scan speed was reduced, the time of heat application to the welding part was increased. In the case of laser welding in the conduction mode, when the energy was below the vaporization threshold, the weld bead geometry was controlled by the power density and interaction time. The interaction time had a greater effect on the weld bead geometry between the two factors [
21].
Figure 4,
Figure 5,
Figure 6,
Figure 7,
Figure 8 and
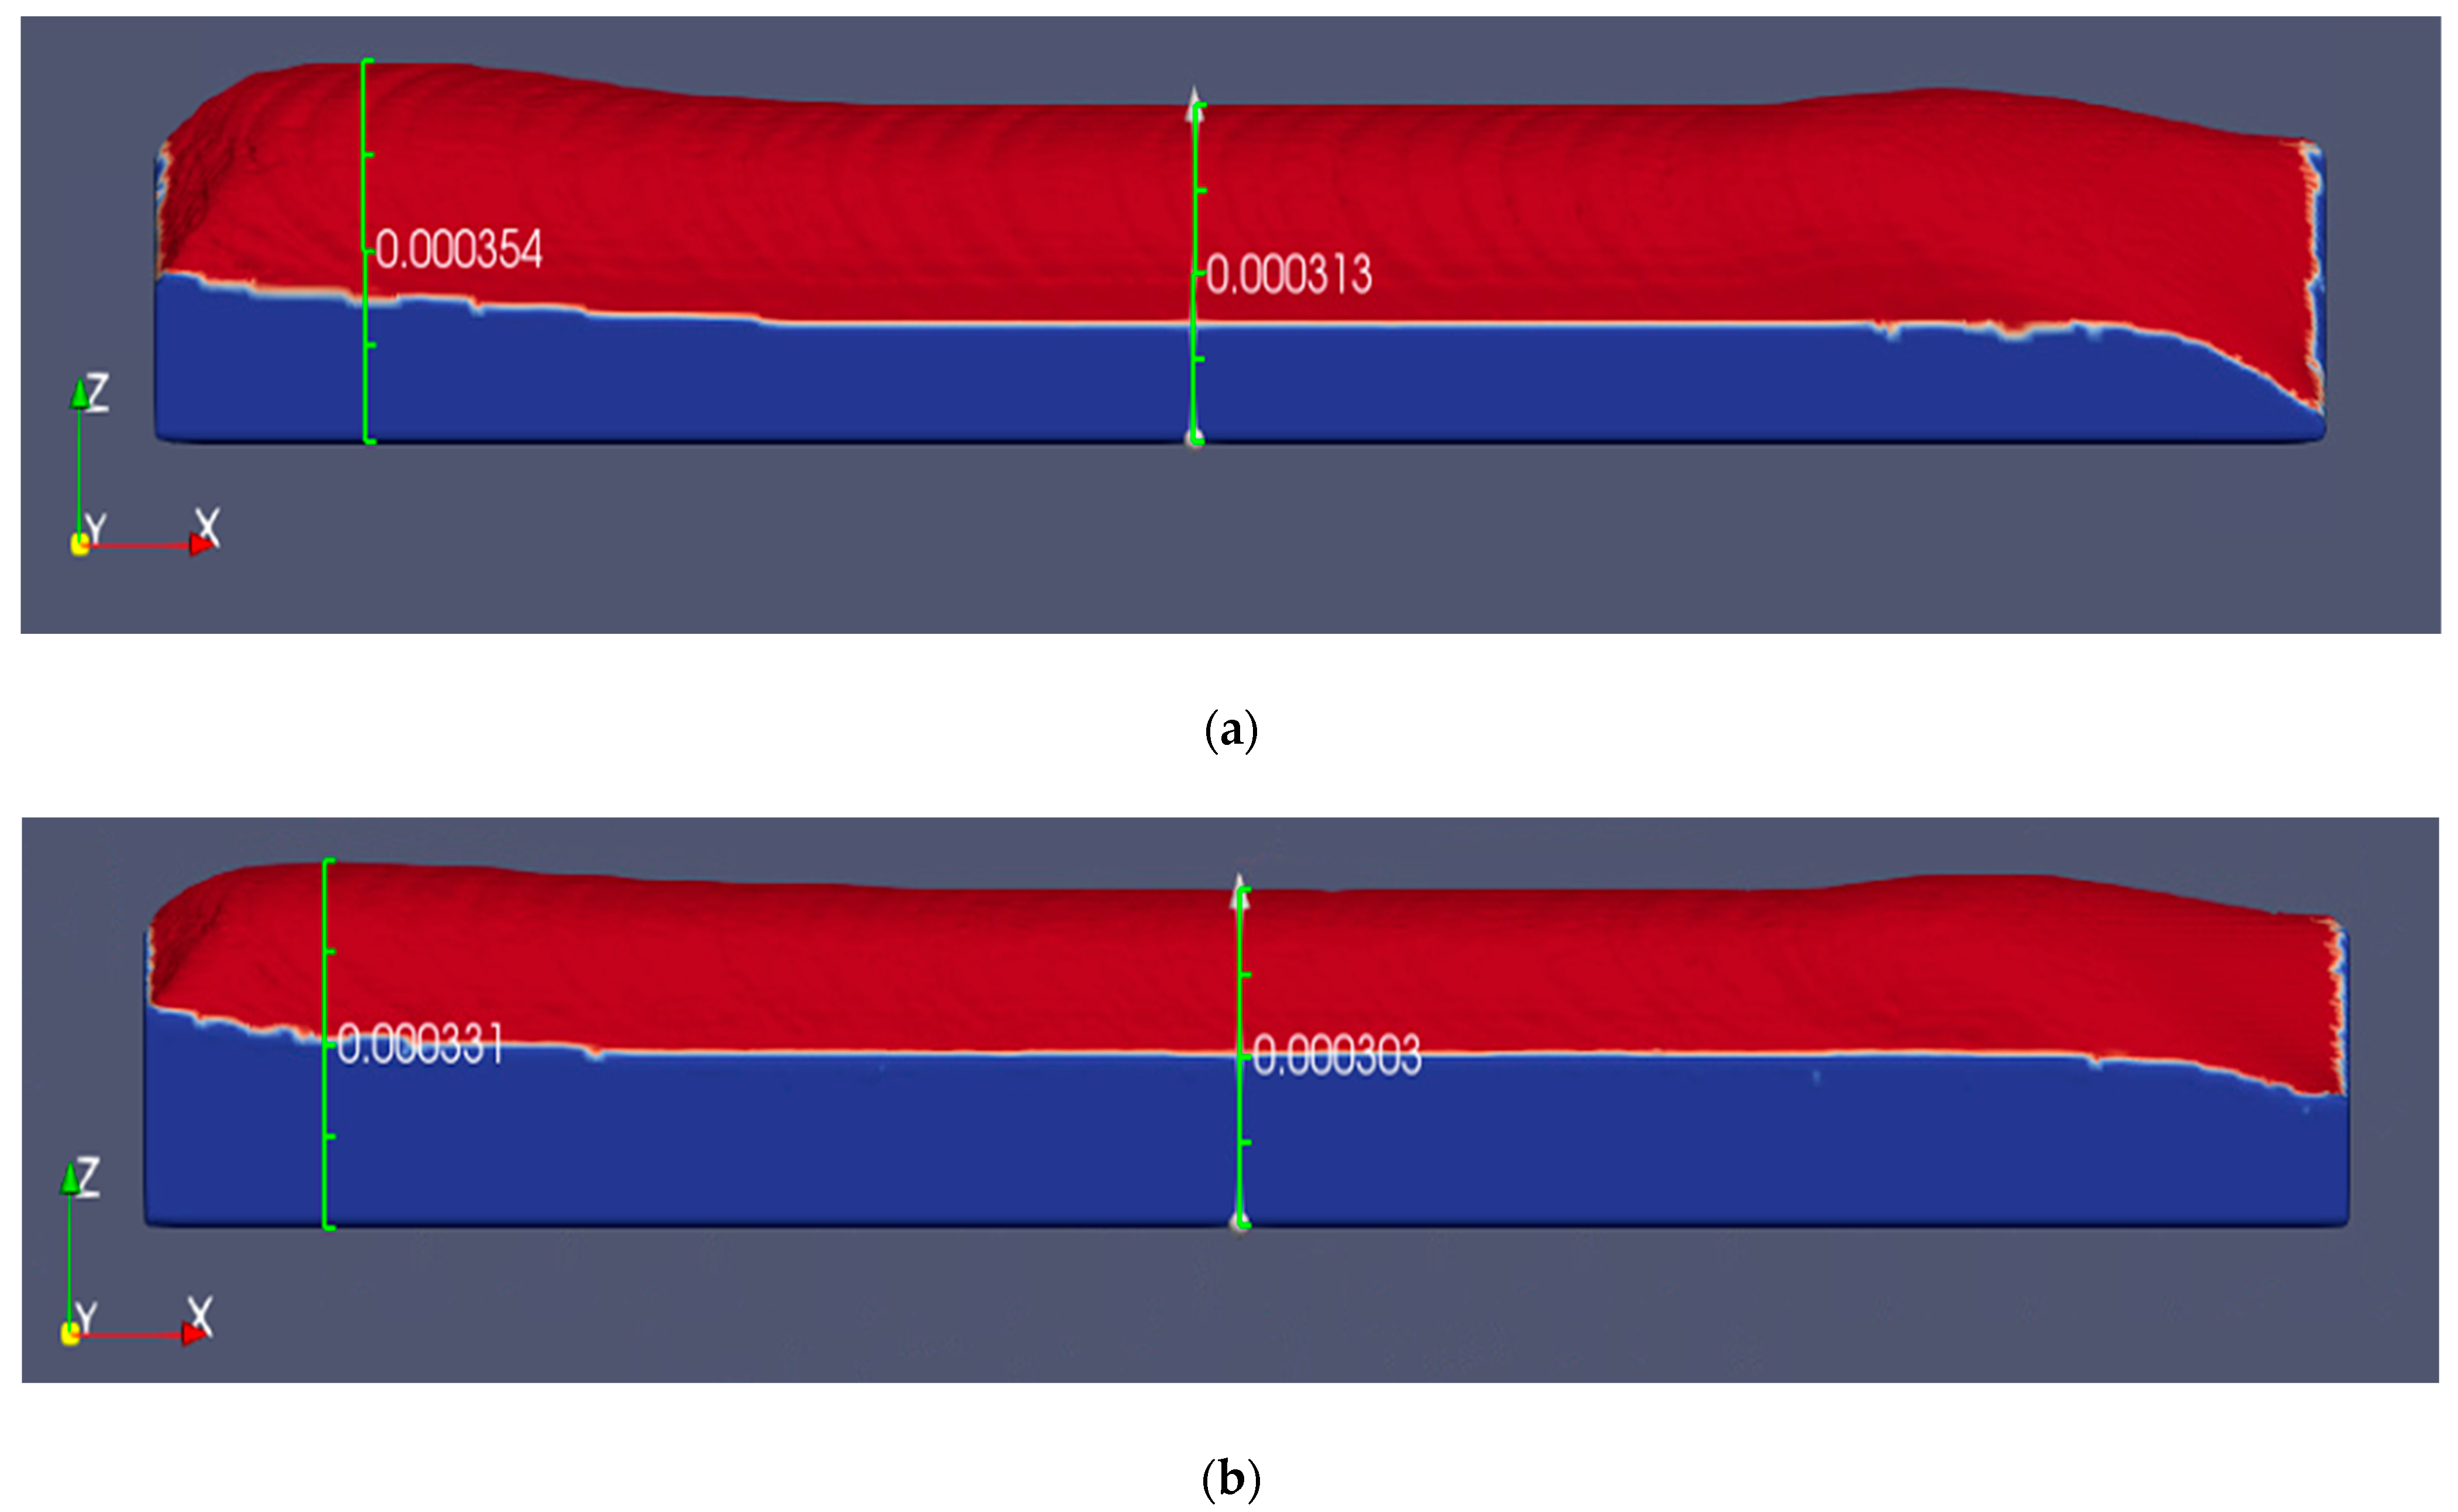
Figure 9 show the welding simulation results using the FLOW-3D POST program. Based on these figures, the geometries of the welding part with a laser power of 700 and 800 W and a scan speed of 0.10~0.15 m/s were shown. In each figure, (a) represents the results with a laser power of 800 W, and (b) represents the results with a laser power of 700 W. The relative height from the welded end position to the unwelded blue part was presented.
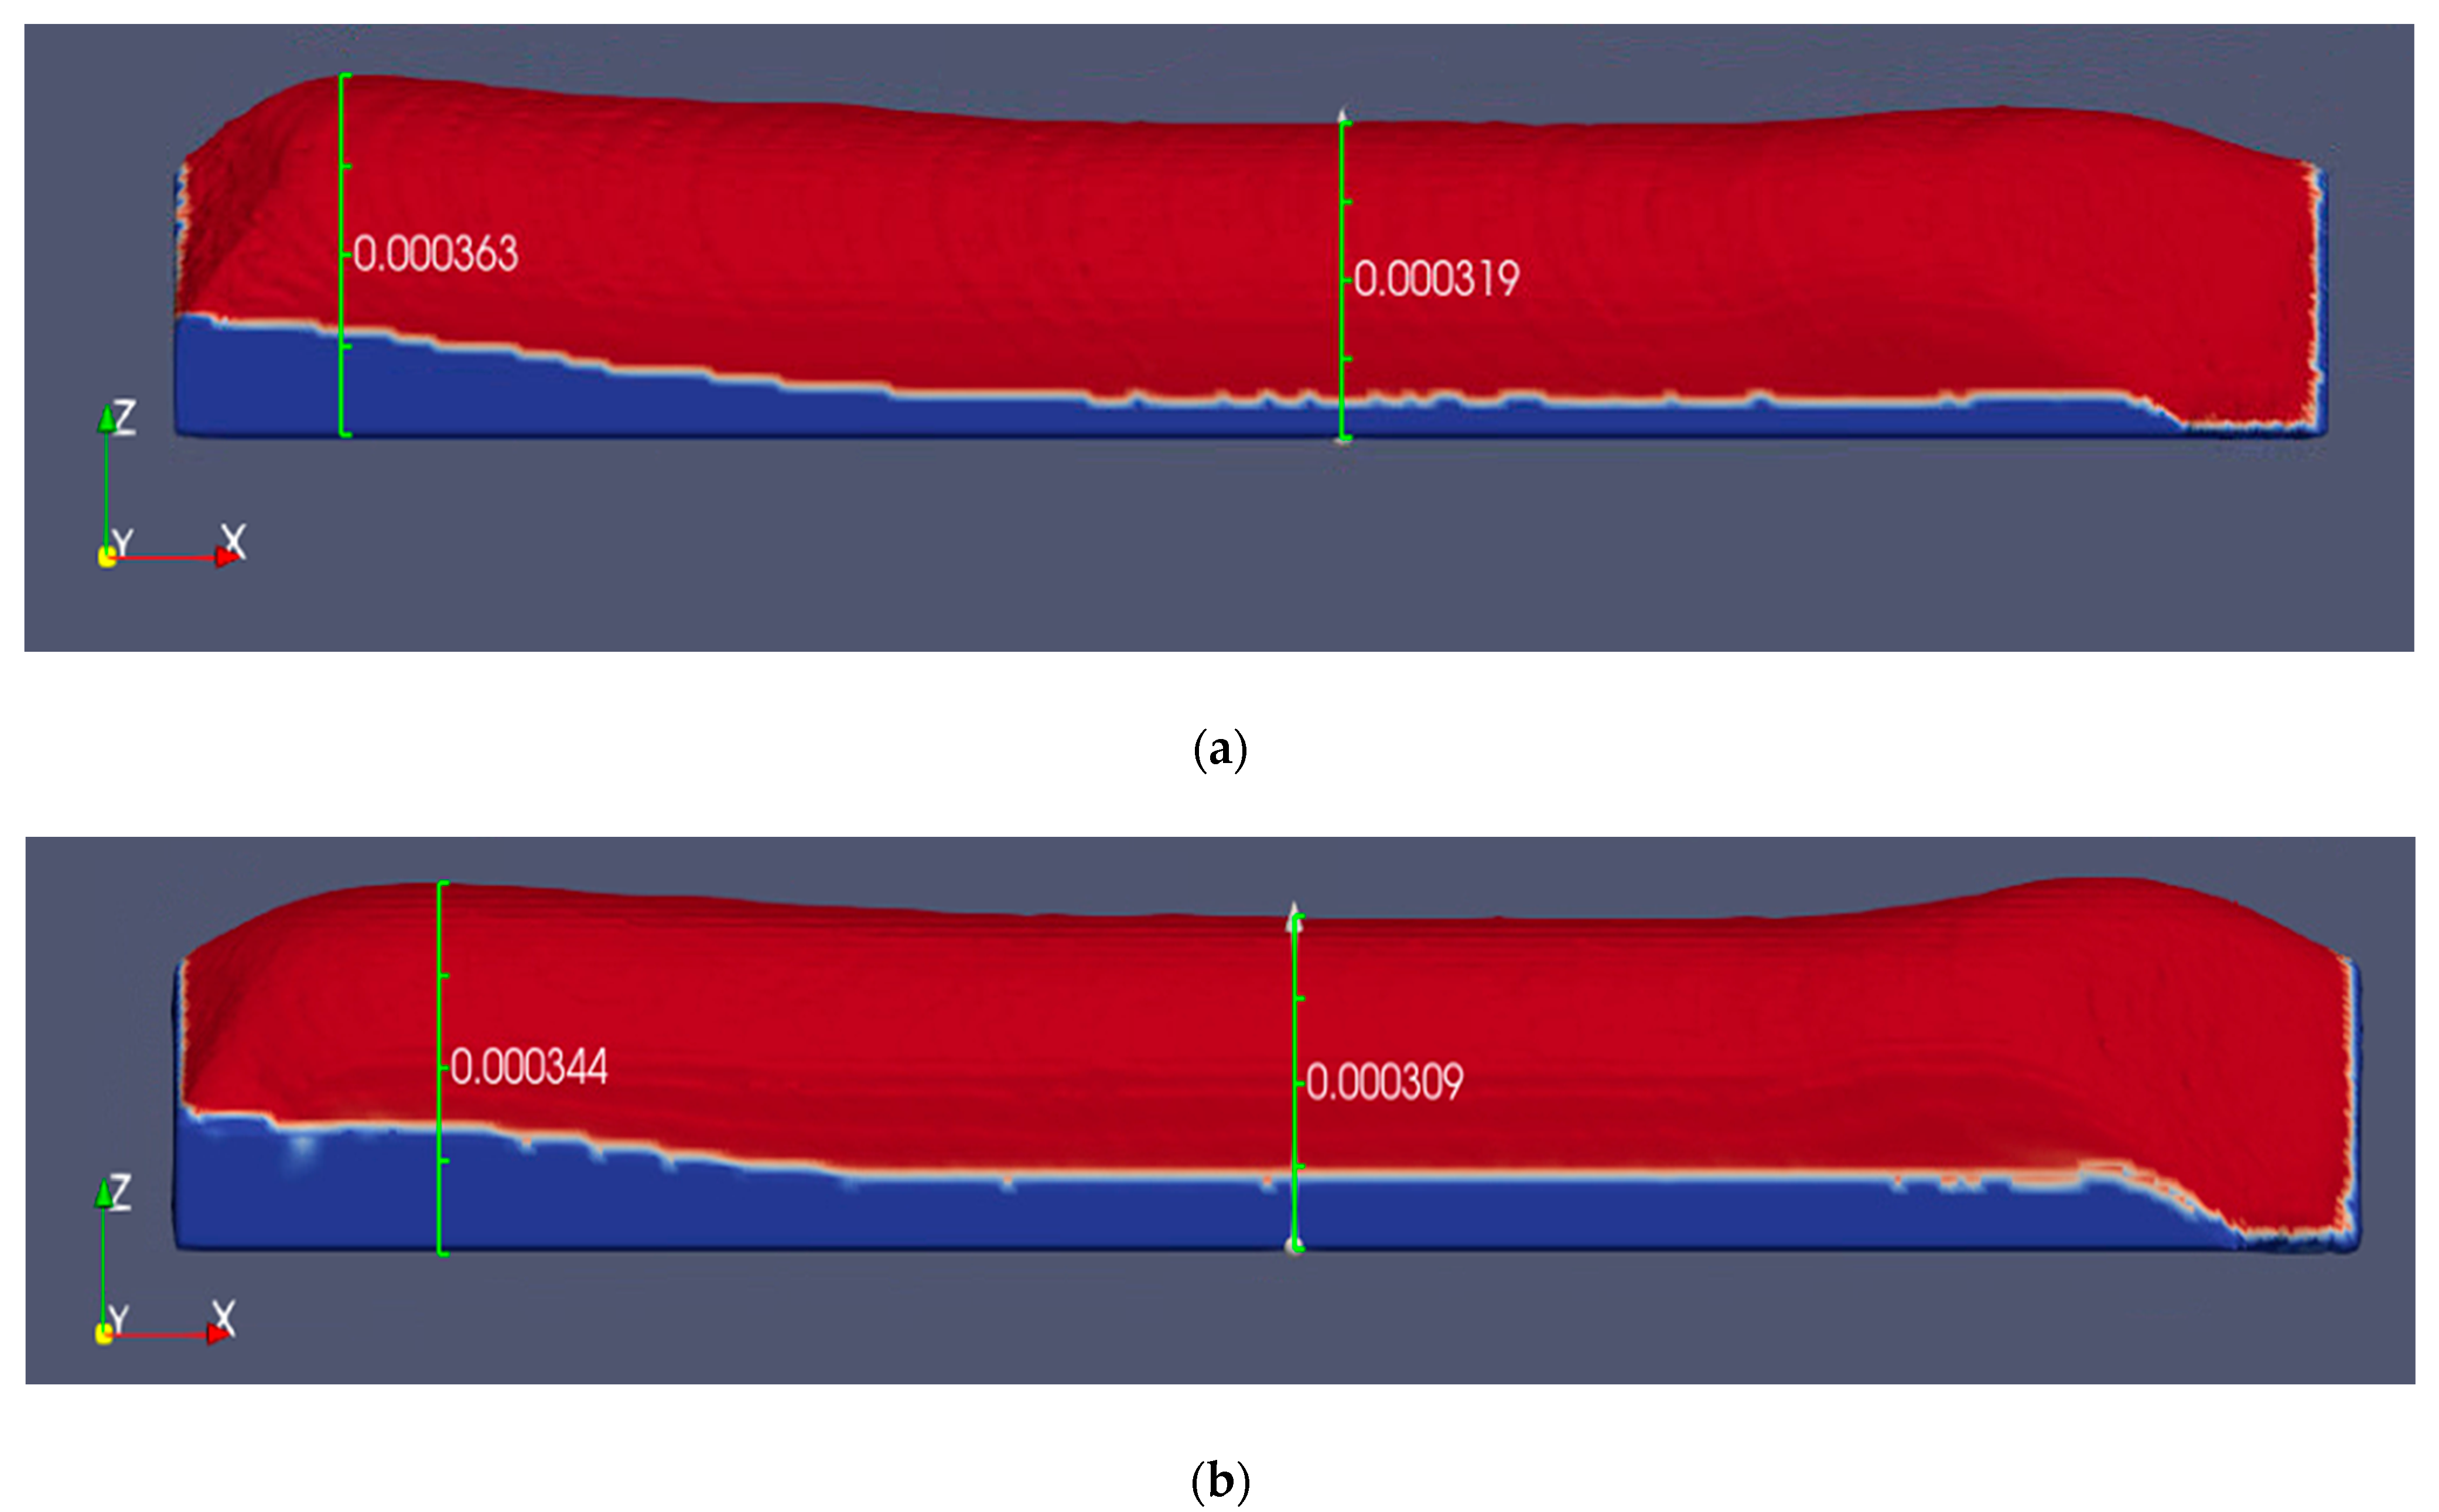
In
Figure 4a, the height of the starting part is 0.363 mm, and the height of the middle part is 0.319 mm with a laser power of 800 W. In
Figure 4b, the height of the starting part is 0.344 mm and the height of the middle part is 0.309 mm with a laser power of 700 W.
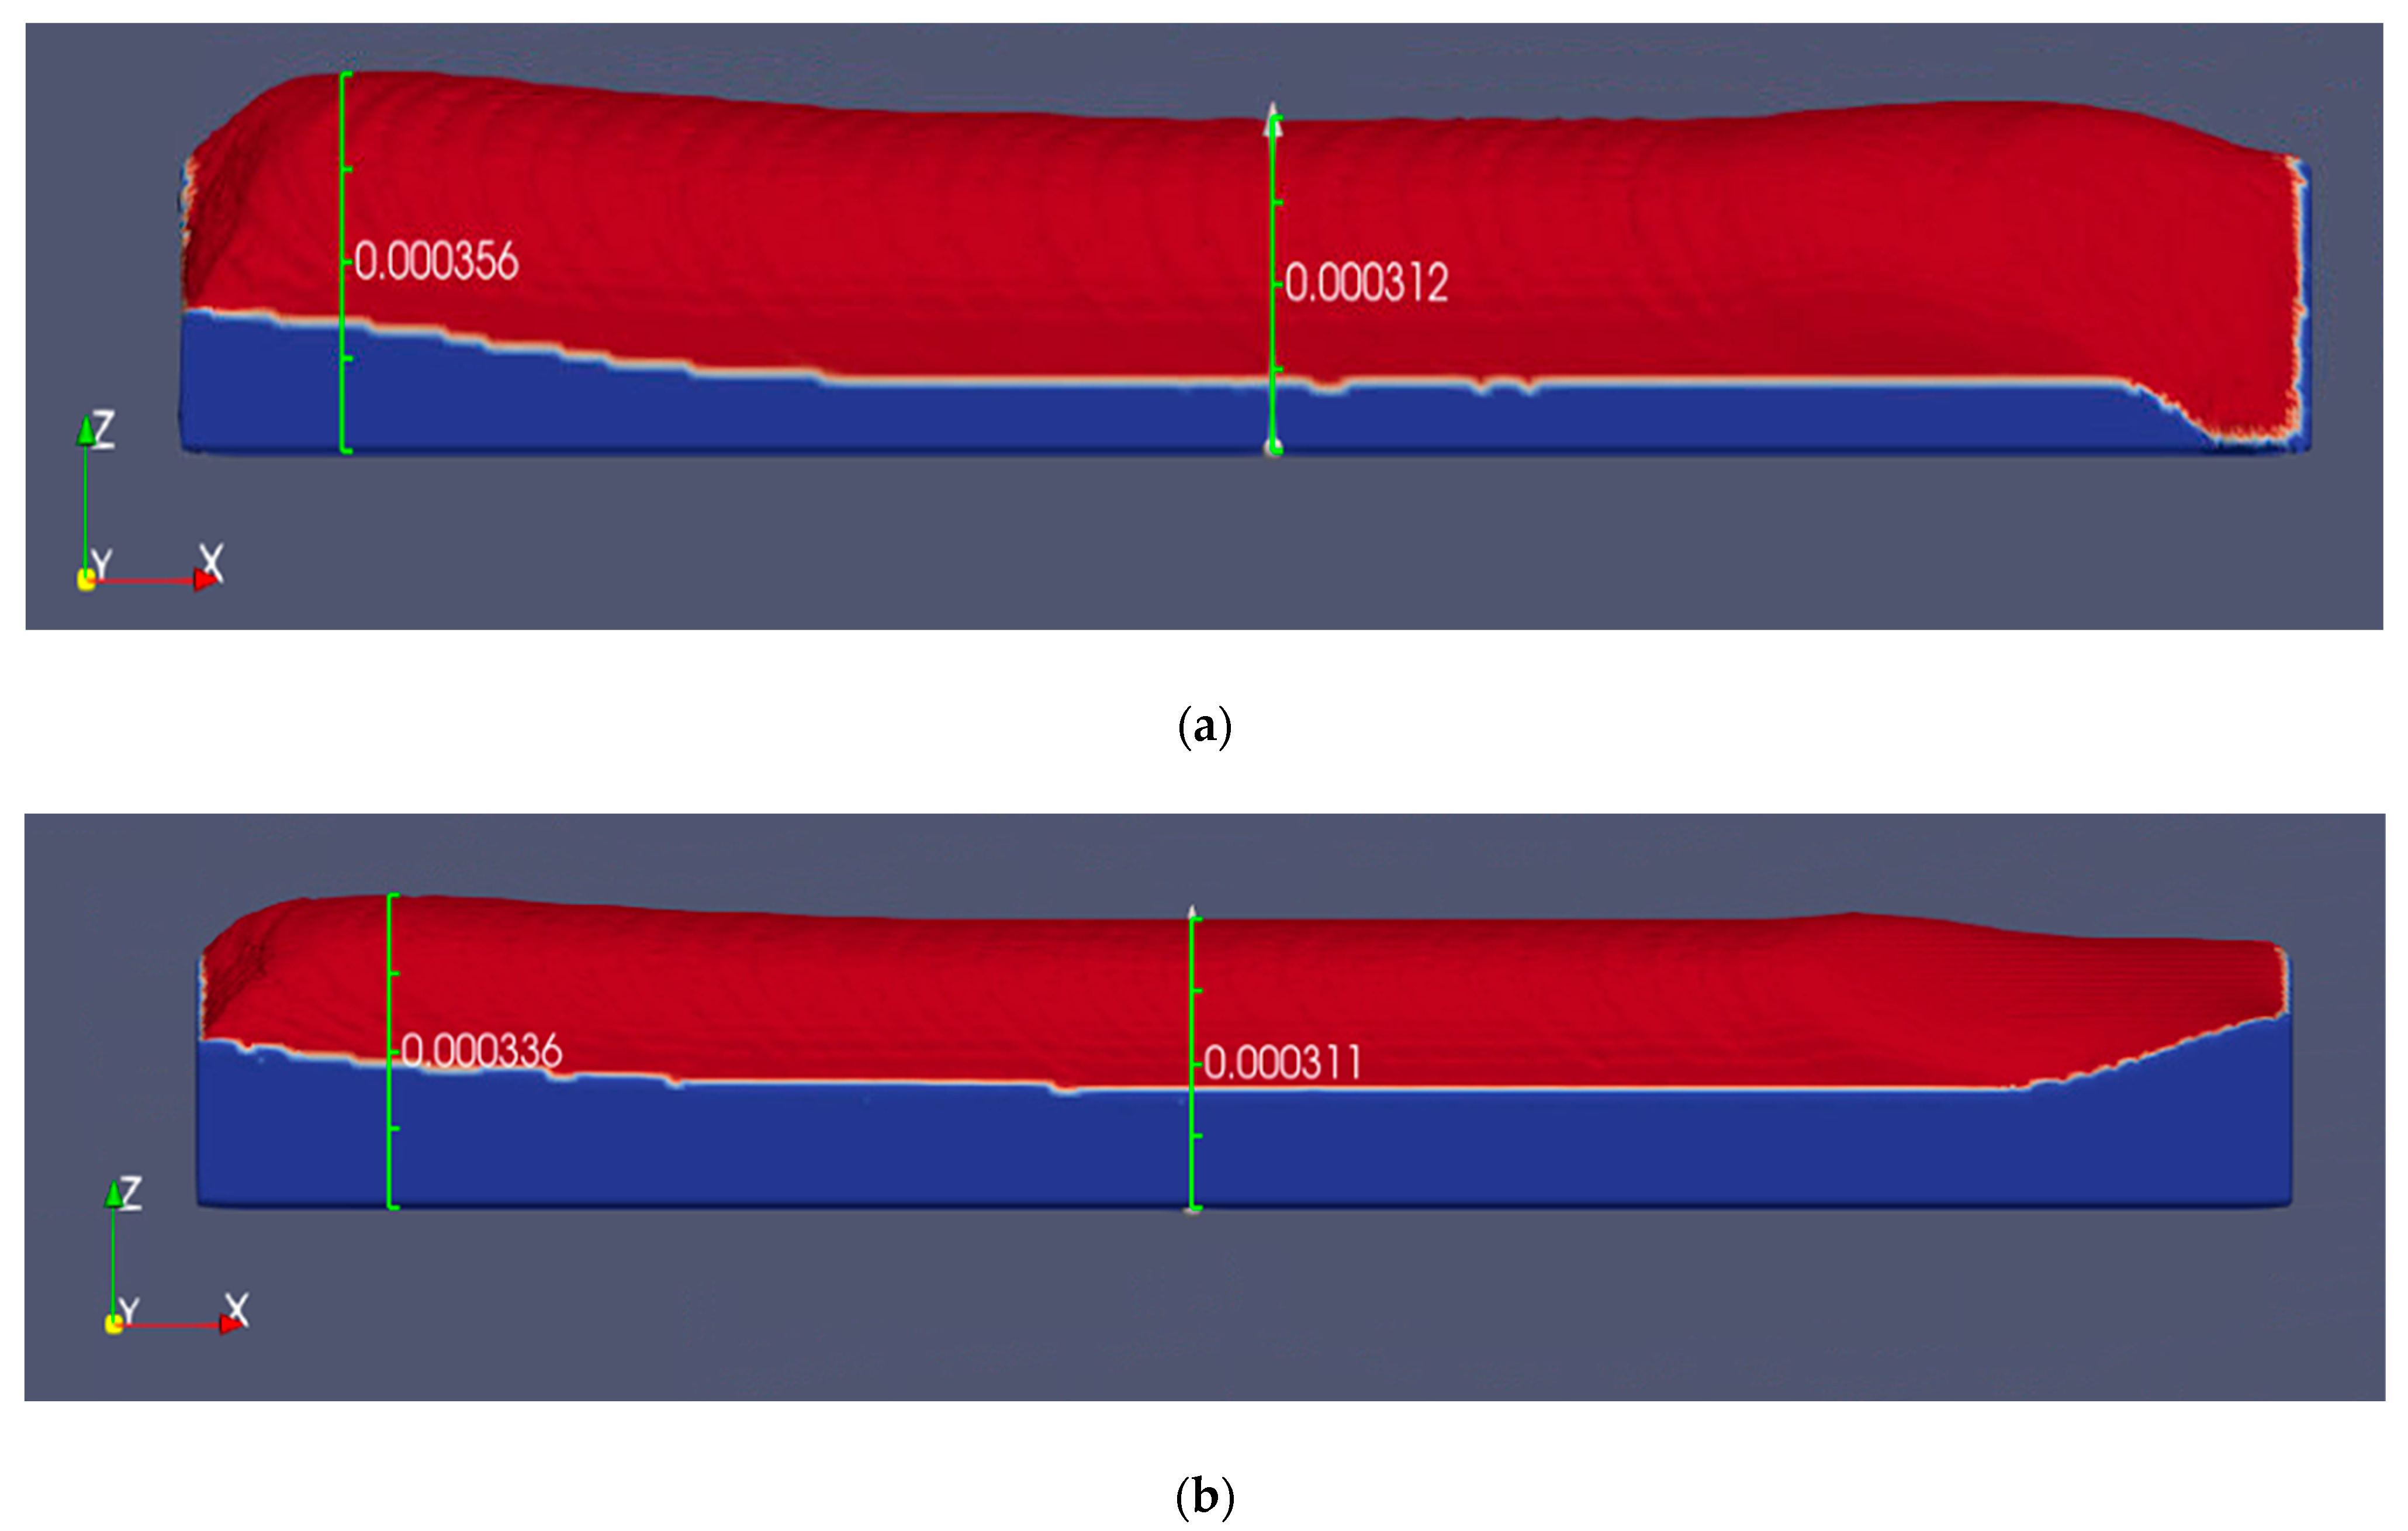
Figure 5 shows the simulation result at a scan speed of 0.11 m/s. In
Figure 5a, the height of the starting part is 0.356 mm and the height of the middle part is 0.312 mm. In
Figure 5b, the height is 0.336 mm at the beginning and 0.311 mm at the middle.
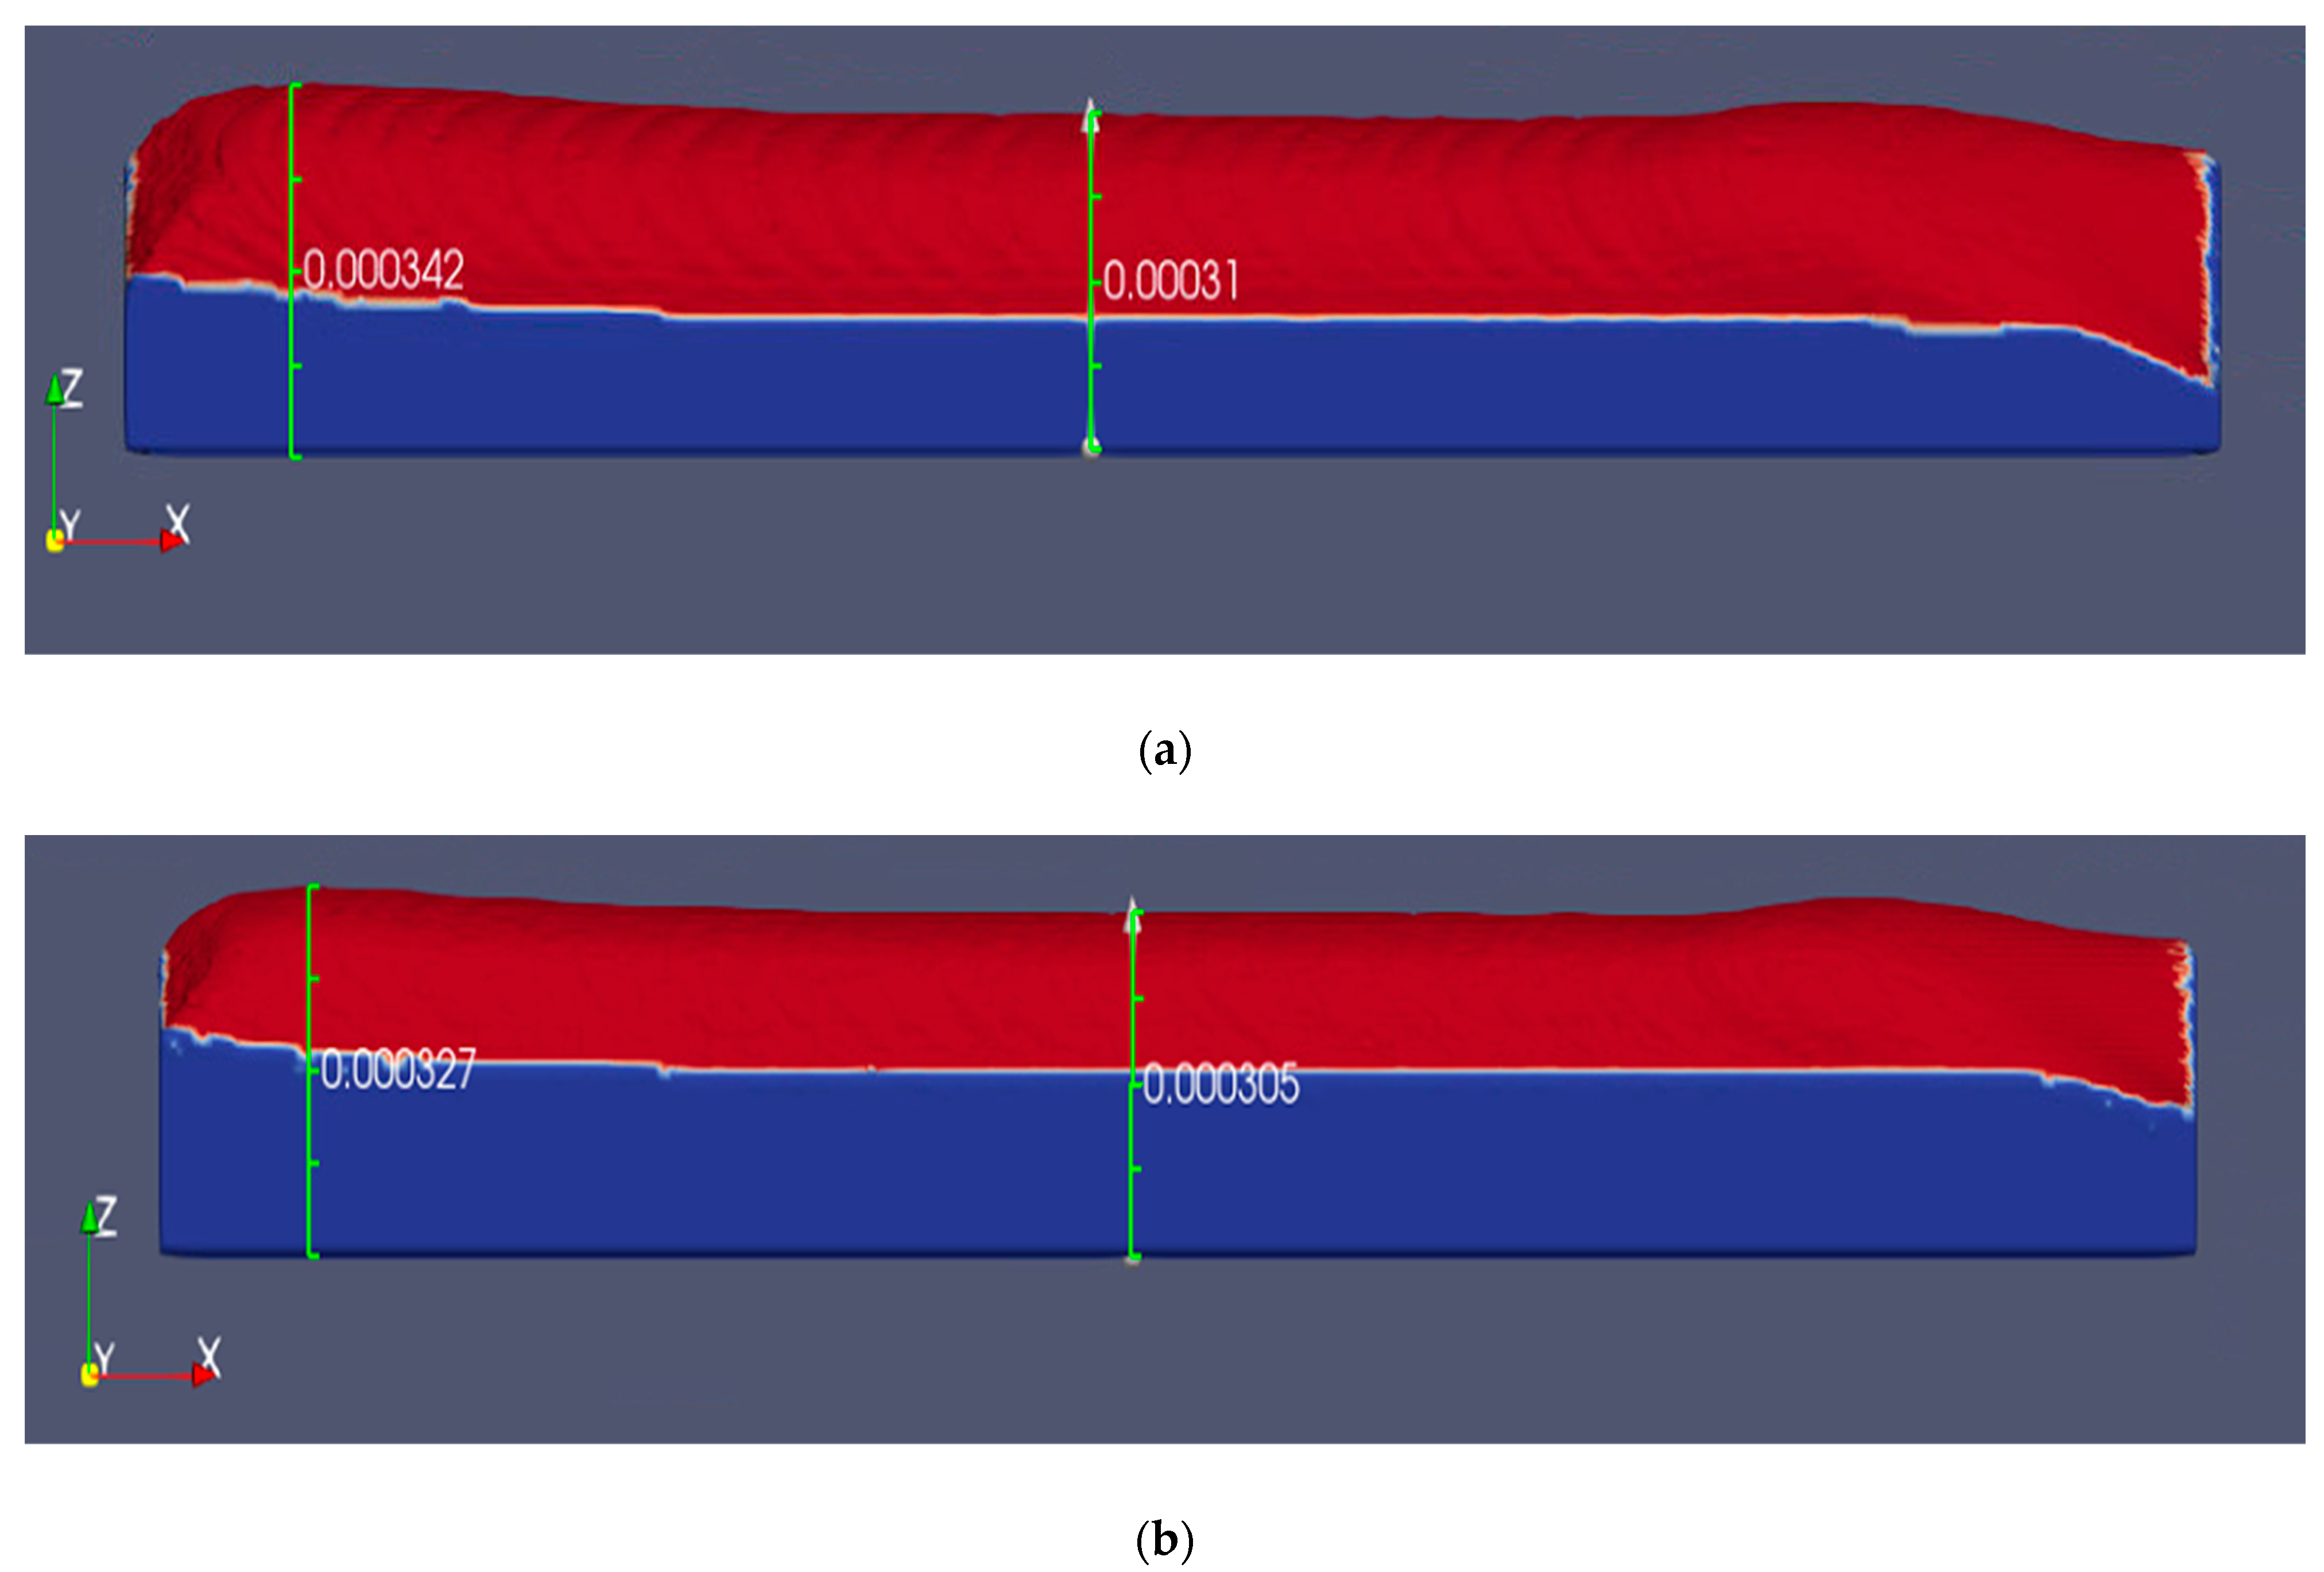
Figure 6 shows the welding simulation results at a scan speed of 0.12 m/s. In
Figure 6a, the height of the starting part is 0.358 mm, and the height of the middle part is 0.314 mm. In
Figure 6b, the height of the starting part is 0.334 mm, and the height of the middle part is 0.307 mm.
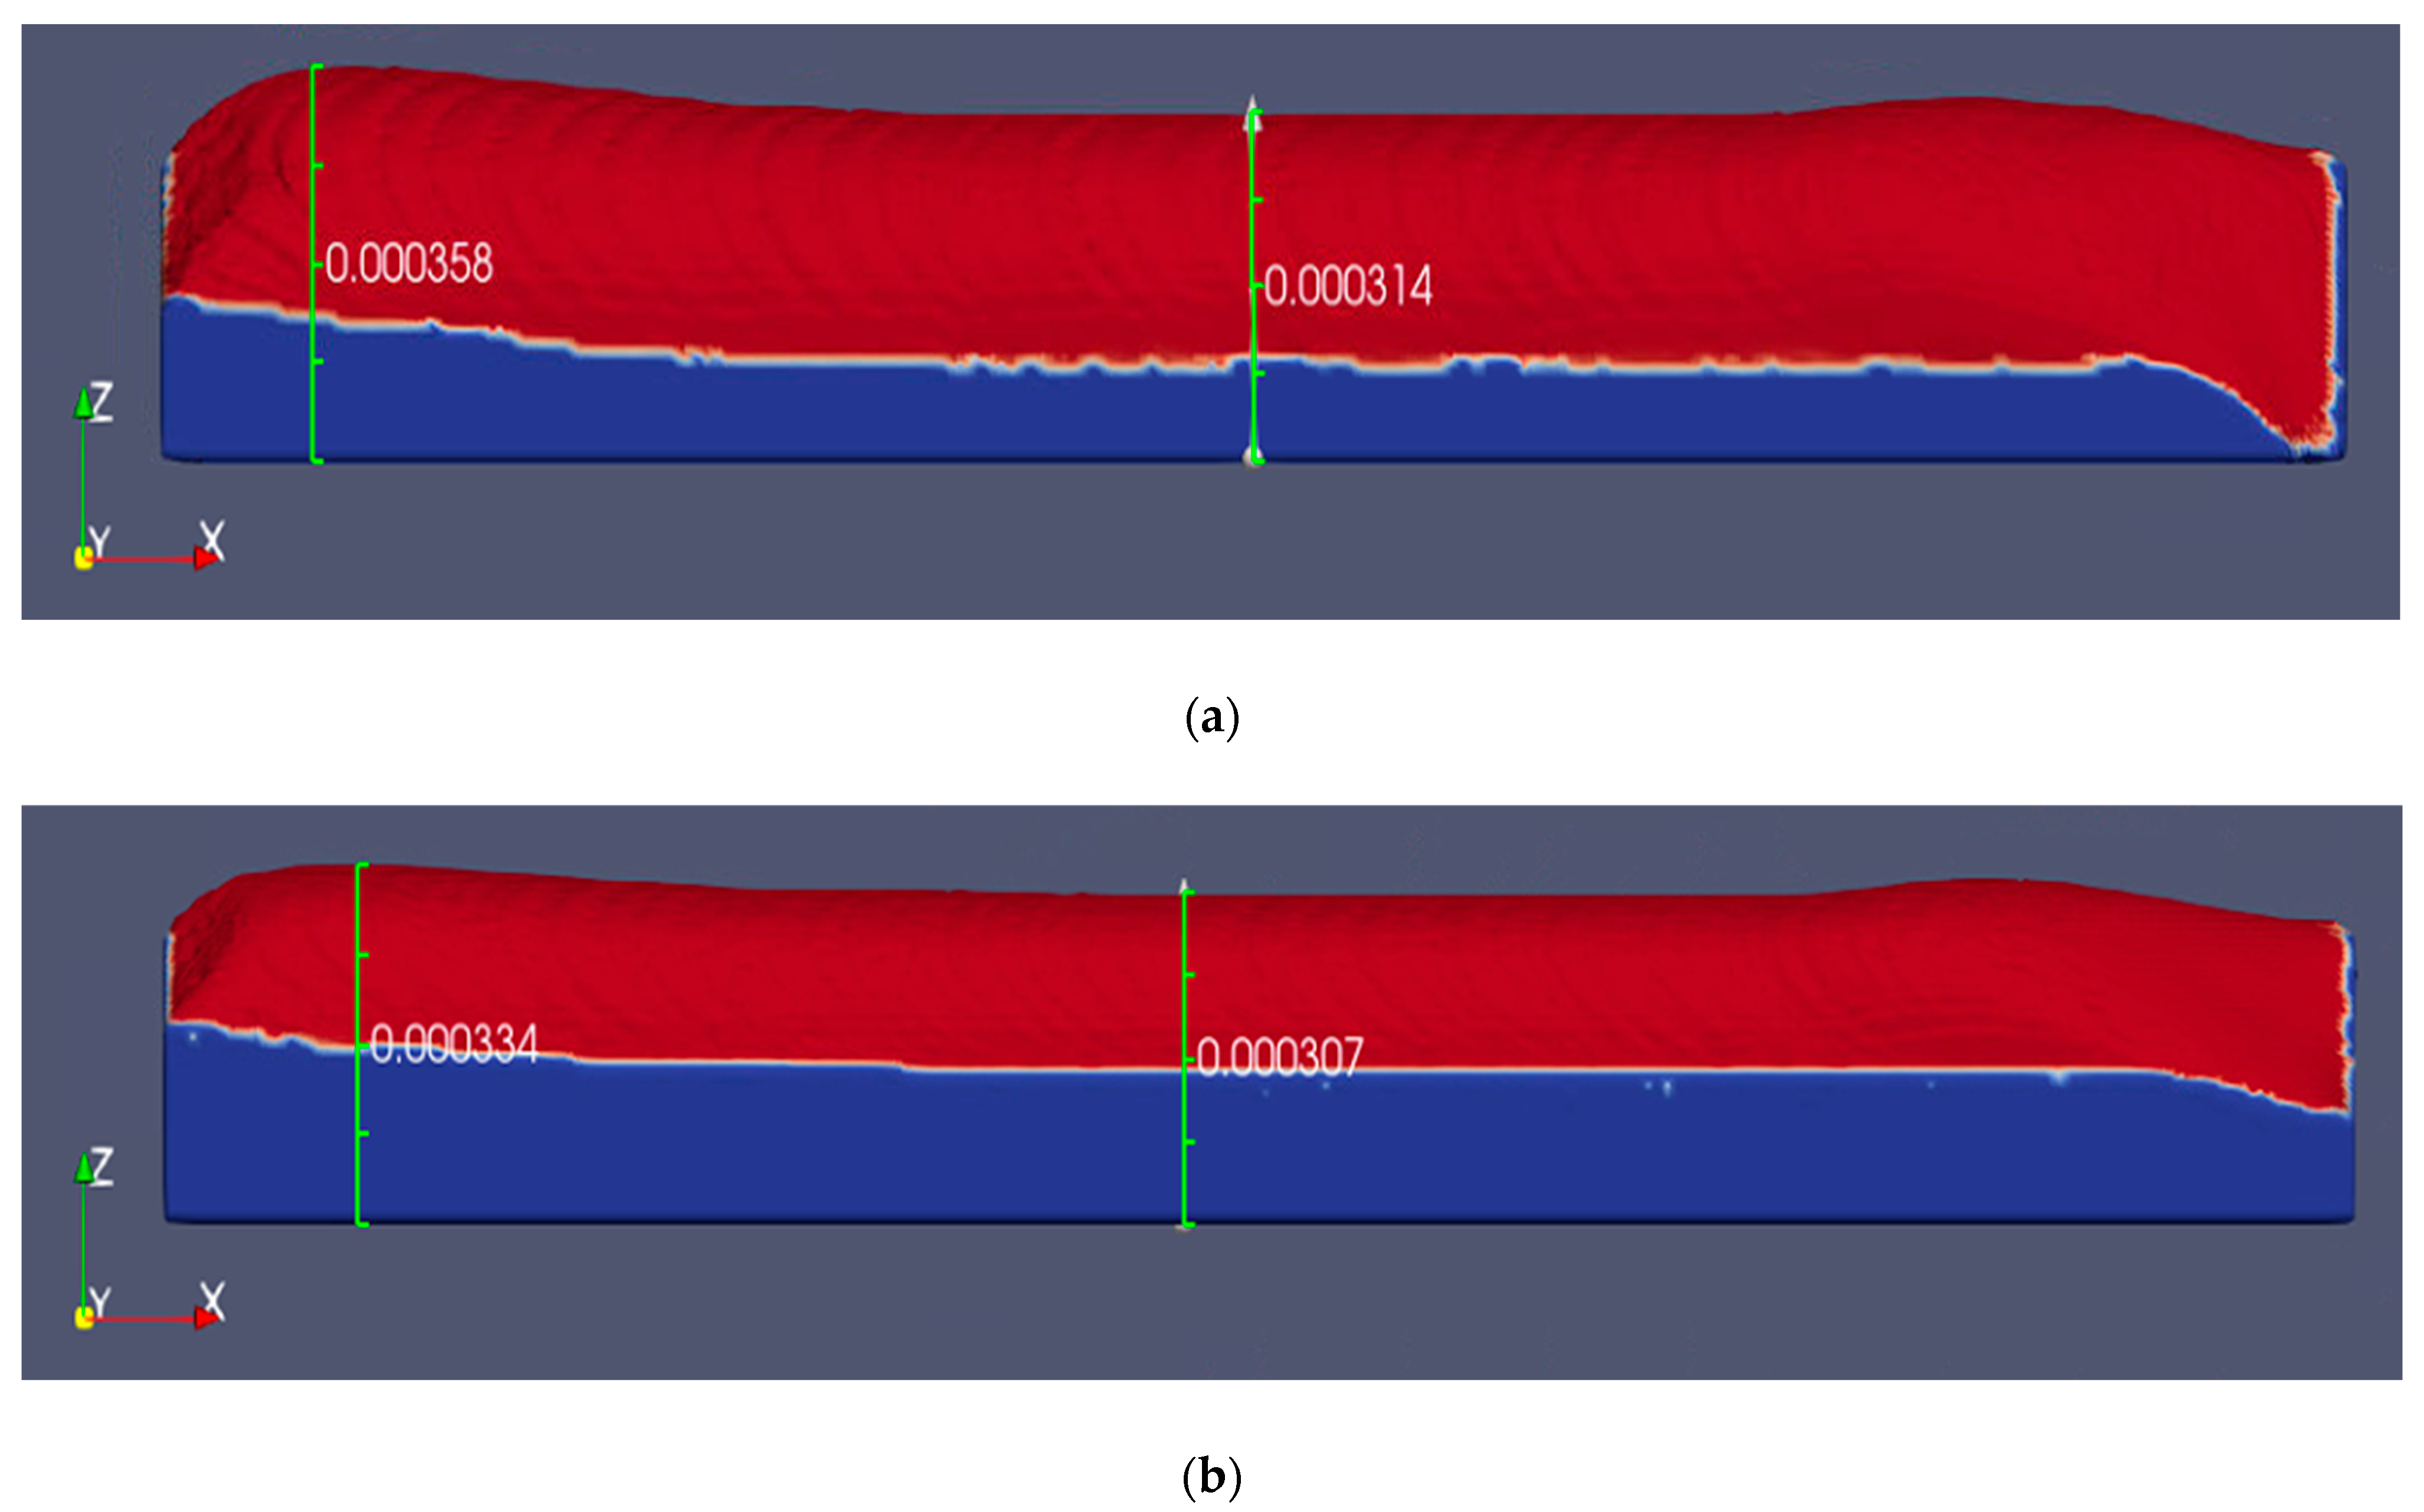
Figure 7 shows the simulation results at a scan speed of 0.13 m/s. In
Figure 7a, the height of the starting part is 0.354 mm, and the height of the middle part is 0.313 mm. In
Figure 7b, the height of the starting part is 0.331 mm, and the height of the middle part is 0.303 mm.
Figure 8 shows the simulation result at a scan speed of 0.14 m/s. In
Figure 8a, the height of the starting part is 0.342 mm, and the height of the middle part is 0.310 mm. In
Figure 8b, the height of the starting part is 0.327 mm, and the height of the middle part is 0.305 mm.
Figure 9 shows the welding simulation results at a scan speed of 0.15 m/s. In
Figure 9a, the height of the starting part is 0.341 mm, and the height of the middle part is 0.309 mm, with a laser power of 800 W. In
Figure 9b, the height of the starting part is 0.326 mm, and the height of the middle part is 0.302 mm, with a laser power of 700 W. It was confirmed that as the scan speed increased, the relative height difference decreased. When the laser power was high, the relative height was large.
When the laser encountered the base metal to start welding, the heat input was not sufficient, and the welding part appears to be pushed upward, thus failing to show a proper level of welding, and the penetration depth was not sufficient in this case. Welding was performed with the increased penetration depth. Welding was maintained at a constant level when the laser moved toward the center. In all cases, chevron patterns appear in laser welding. As the scan speed increases, welding is not sufficiently performed. The actual welding efficiency is reduced. From the visualization of the welding parts, welding defects were identified. There were defects caused by the shape of the weld metal, such as excessive protrusion or undercut. Undercuts are caused by a considerably strong laser power or fast welding speed.
The temperature distribution of the welding part was calculated in a total of two cases, 7 and 8, which showed the highest height change among the cases according to the estimations of the height of the upper bead for each case.
Figure 10 shows the simulation calculation results with a laser power of 700 W and a scan speed of 0.1 m/s. The temperature distribution over time from 0 to 33 ms is presented.
Figure 11 shows the simulation calculation results with a laser power of 700 W and a scan speed of 0.11 m/s. The temperature distribution over time from 0 to 36 ms is shown. The temperature ranges from 293 K to 2393 K. The temperature began to rise gradually after maintaining 293 K until 0.8 ms before the laser contacted the base material. After rising about 40 K for each time step, it rose to the highest temperature of 2393 K, and the temperature was then maintained at a constant level and welding proceeded. The height of the upper bead was generated to be the highest at the beginning of the welding process, and the temperature distribution rose to the highest temperature at the same point, cooled, and maintained a constant level. In addition, cooling occurred rapidly after the laser passed through the base material. In the case of the temperature distribution graph, the overall deformation is similar. As welding progresses, the temperature change shows a slighter change in the middle with a scan speed of 0.11 m/s than that with a scan speed of 0.1 m/s. This is due to the difference in cooling rate.


