Abstract
The low-temperature fracture toughness of double-V weld seams is a well-known challenge due to the essential increased heat input for heavy-wall pipelines. A thorough investigation was conducted to explore the impact of the heat input on the grain size and precipitate coarsening, correlating the microstructure with the heat-affected-zone (HAZ) toughness. The results indicated that the actual weldments showed a toughness transition zone at −20 °C, with considerable scattering in Charpy V-notch (CVN) tests. Gleeble thermal simulations confirmed the decreased toughness of the coarse-grained HAZ (CGHAZ) with increasing heat input and prior austenite grain size (PAGS). A specially designed thermal treatment demonstrated its potential for enhancing the toughness of the CGHAZ, with the recommended thermal cycle involving peak temperatures of 700 and 800 °C, holding for 1 s, and rapid cooling. The toughness of the intercritically reheated CGHAZ (ICCGHAZ) improved with higher intercritical reheating temperatures and the removal of necklace-type M–A constituents along the PAG. Despite various thermal treatments, no significant improvements were observed in the toughness of the ICCGHAZ. Future work was suggested for optimising the use of tack welds to reduce the effective heat input (HI) associated with double-sided submerged arc welding (SAW).
1. Introduction
In response to annually increasing energy consumption, pipeline steels have undergone development to achieve high strength, superior toughness, and excellent weldability for the efficient use of materials [1,2,3,4]. A well-known challenge arises in pipe welds, where the heat-affected zone (HAZ) often exhibits areas of low toughness, becoming the weakest link in the welded joint and influencing the overall pipeline performance. This primary concern, particularly at low temperatures (≤−20 °C), presents a significant obstacle to the widespread use of high-grade pipe steels in major infrastructure projects [5]. Therefore, understanding and addressing the toughening issues within the HAZ remain crucial for high-strength pipelines, with a specific focus on improving the low-temperature toughness.
In single-pass welds, the coarse-grained HAZ (CGHAZ) next to the fusion line typically exhibits the lowest toughness values owing to unfavourable microstructures, such as coarse granular bainite (GB) and bainitic ferrite (BF). In the case of the double-sided submerged arc welding (SAW) process under the current investigation, the first inner SAW pass creates a CGHAZ that is partially reheated by the subsequent outer SAW pass, further complicating the fracture behaviour in the intercritically reheated CGHAZ (ICCGHAZ). It is acknowledged that local brittle zones (LBZs) are small regions of a hard, brittle phase that form in the HAZ of multipass welds and can be either CGHAZ or ICCGHAZ [6,7]. The fracture mechanics of LBZs depend primarily on the steel chemistry, welding procedure, post-weld heat-treatment conditions, and fracture toughness test temperature. The extent of LBZs is a function of the welding heat input (HI) and coarsening behaviour of the steel.
The brittleness of the CGHAZ for different steels is caused by the thermal cycles from a wide range of HIs and has been widely investigated [8,9,10,11]. In general, a low or intermediate HI can achieve an acceptable CGHAZ toughness. Zhou et al. [12] studied the toughness properties in the CGHAZ of a 16 mm thick X90 pipe steel under different HIs varying from 1 to 5 kJ/mm. The highest toughness was obtained at an HI of 2.5 kJ/mm owing to the excellent combination of the GB and BF; however, the impact toughness sharply decreased from 267 J to 18 J when the HI was higher than 3 kJ/mm. For heavy-wall line pipe steels with a thickness above about 25 mm, the recommended HI generally exceeds 3 kJ/mm. As a result, the intention to maintain an acceptable toughness by applying a reduced HI becomes particularly challenging [13,14]. As the pipe thickness increases, the double-V seam welding, completed in only two passes, requires a significant high total HI reaching up to 6 kJ/mm or even higher. Thus, minimising the formation of LBZs and improving the HAZ toughness by reducing the HI is not always applicable.
It has been found that the initial fine-grained microstructure promotes the formation of more ductile phases, enhancing the impact toughness [15,16]. Our previous works [11,17,18,19] have demonstrated that a good low-temperature HAZ toughness can be achieved through grain growth and precipitate control. Numerous studies [20,21,22] have explored strategies for controlling the grain size by adding microalloying elements or encouraging non-metallic inclusions in the steelmaking process to improve the HAZ toughness. It has been scientifically concluded that achieving a very fine dispersion of precipitates is crucial to exert a grain boundary pinning action against the driving force for grain growth [23,24,25]. Typically, microalloying additions of Ti, V, and Nb are employed to control austenite grain coarsening at the peak temperature in the HAZ due to the formation of thermally stable carbonitrides [19,26,27]. These precipitates provide great potential in nucleating ferrite, leading to the refinement of the martensite–austenite (M–A) constituent with a consequent increase in toughness. Nevertheless, the addition of a large number of microalloying elements, especially Ni, V, Cr, Mo, and Cu, is a significant challenge for the weldability of pipeline steel owing to the increased equivalent carbon content (Ceq) [28,29].
Earlier investigations [30,31] have also highlighted a significant correlation between the prior austenite grain size (PAGS) and phase transformation during the decomposition of austenite. It is widely accepted that austenite tends to predominantly nucleate and grow along prior austenite grain (PAG) boundaries and bainite lath boundaries. Owing to the high diffusivity of carbon and its increased solubility in austenite, carbon-enriched austenite islands form and transform into hard and brittle M–A constituents along PAG boundaries during the subsequent cooling process. It has been proposed that the presence of the M–A constituent along PAG boundaries is the main factor contributing to the loss in toughness. This is highly related to the size, content, and distribution morphology of M–A constituents [32].
Furthermore, heat treatment after welding is the most famous and important method for microstructural improvement. The existing literature has extensively studied the control of the heating temperature, holding time, and cooling rate during the post-weld heat-treatment process. A recent study [33], in particular, focused on the influences of different protective atmospheres because choosing an appropriate protective gas is crucial. It impacts the cooling rate and prevents the formation of detrimental phases during heat treatment, ultimately contributing to the desired mechanical properties. However, to the best of the authors’ knowledge, the current post-weld heat-treatment processes are not able to effectively address the difficulties associated with the low-temperature HAZ toughness in the pipeline industry.
In the present research, our main emphasis is on improving the low-temperature impact performance of thick-walled line pipes, particularly in the context of double-V weld seams with extremely high HIs. The objective is to investigate the variation in the fracture behaviour at different locations within actual weldments and representative HAZ samples, correlating with the microstructure, including PAGs, and the percentage of M–A constituents. To address these challenges, various pre- and post-welding thermal treatment processes have been developed with the aim of enhancing the HAZ fracture toughness at low temperatures.
2. Materials and Methods
2.1. Materials and Welding Conditions
Commercial X70 line pipe steel used in the investigation was produced by Baoshan Iron & Steel Co., Ltd., Shanghai 201900, China, with a critical thickness of 28 mm, a diameter of 1422.4 mm, and a wall thickness of 28 mm. The chemical composition and tensile properties are presented in Table 1 and Table 2, respectively.

Table 1.
The chemical composition of the investigated X70 line pipe steel in wt.%.
Table 2.
The mechanical properties of the investigated X70 line pipe steel.
A double-sided SAW procedure was performed on the X70 steel pipe at Baosteel. Figure 1 presents a schematic diagram of this typical welding procedure. The procedure consisted of two welding processes: inner SAW and outer SAW. Each process employed four wires with diameter of 4 mm each. All the details for the welding procedure are provided in Table 3.
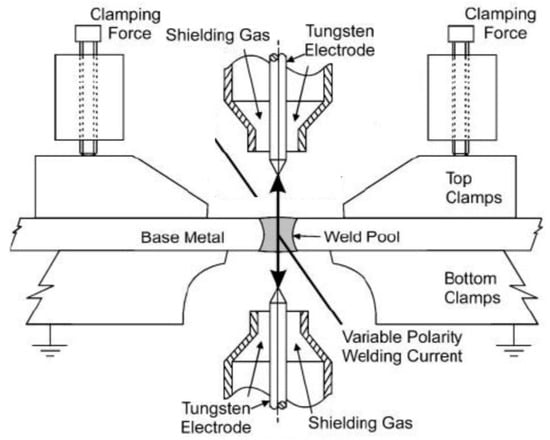
Figure 1.
Schematic diagram of a typical double-sided SAW procedure. Data from [34].
Table 3.
The double-sided SAW parameters for the investigated X70 line pipe steel.
2.2. Thermal Simulations
The mechanical properties of HAZ subzones were investigated using the Gleeble® 3500–GTC SYSTEM simulator (Dynamic Systems Inc, Poestenkill, NY, US), which is well known to reproduce a large volume of materials that are subjected to the same thermal cycles as real weld HAZs.
The specimens for the thermal simulations were extracted from the X70 pipe body with dimensions of 10 mm × 10 mm × 80 mm. The experimental parameters and setup in this study were determined based on our previous work [17] by employing different HIs or temperatures to better suit the current thick-walled pipe. All the thermal conditions were designed using the Rykalin-2D model in Gleeble to precisely reproduce the thermal histories of different HAZs during the actual double-sided SAW process.
2.2.1. Thermal Simulation of CGHAZ
Figure 2 and Table 4 elucidate the selected thermal cycles and simulation parameters to systematically investigate the influence of the HI on the CGHAZ.
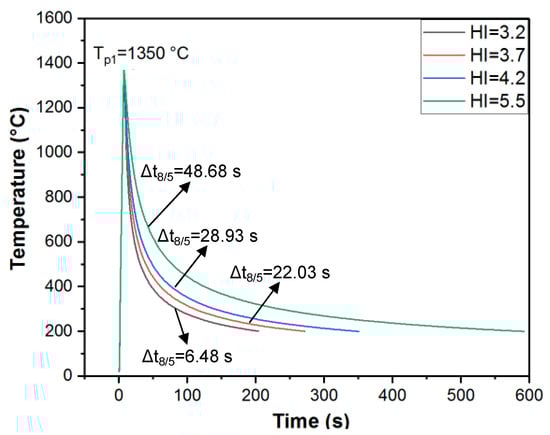
Figure 2.
Thermal cycle curves used for simulation of CGHAZ at different HIs.
Table 4.
Experimental parameters for thermal simulation of CGHAZ.
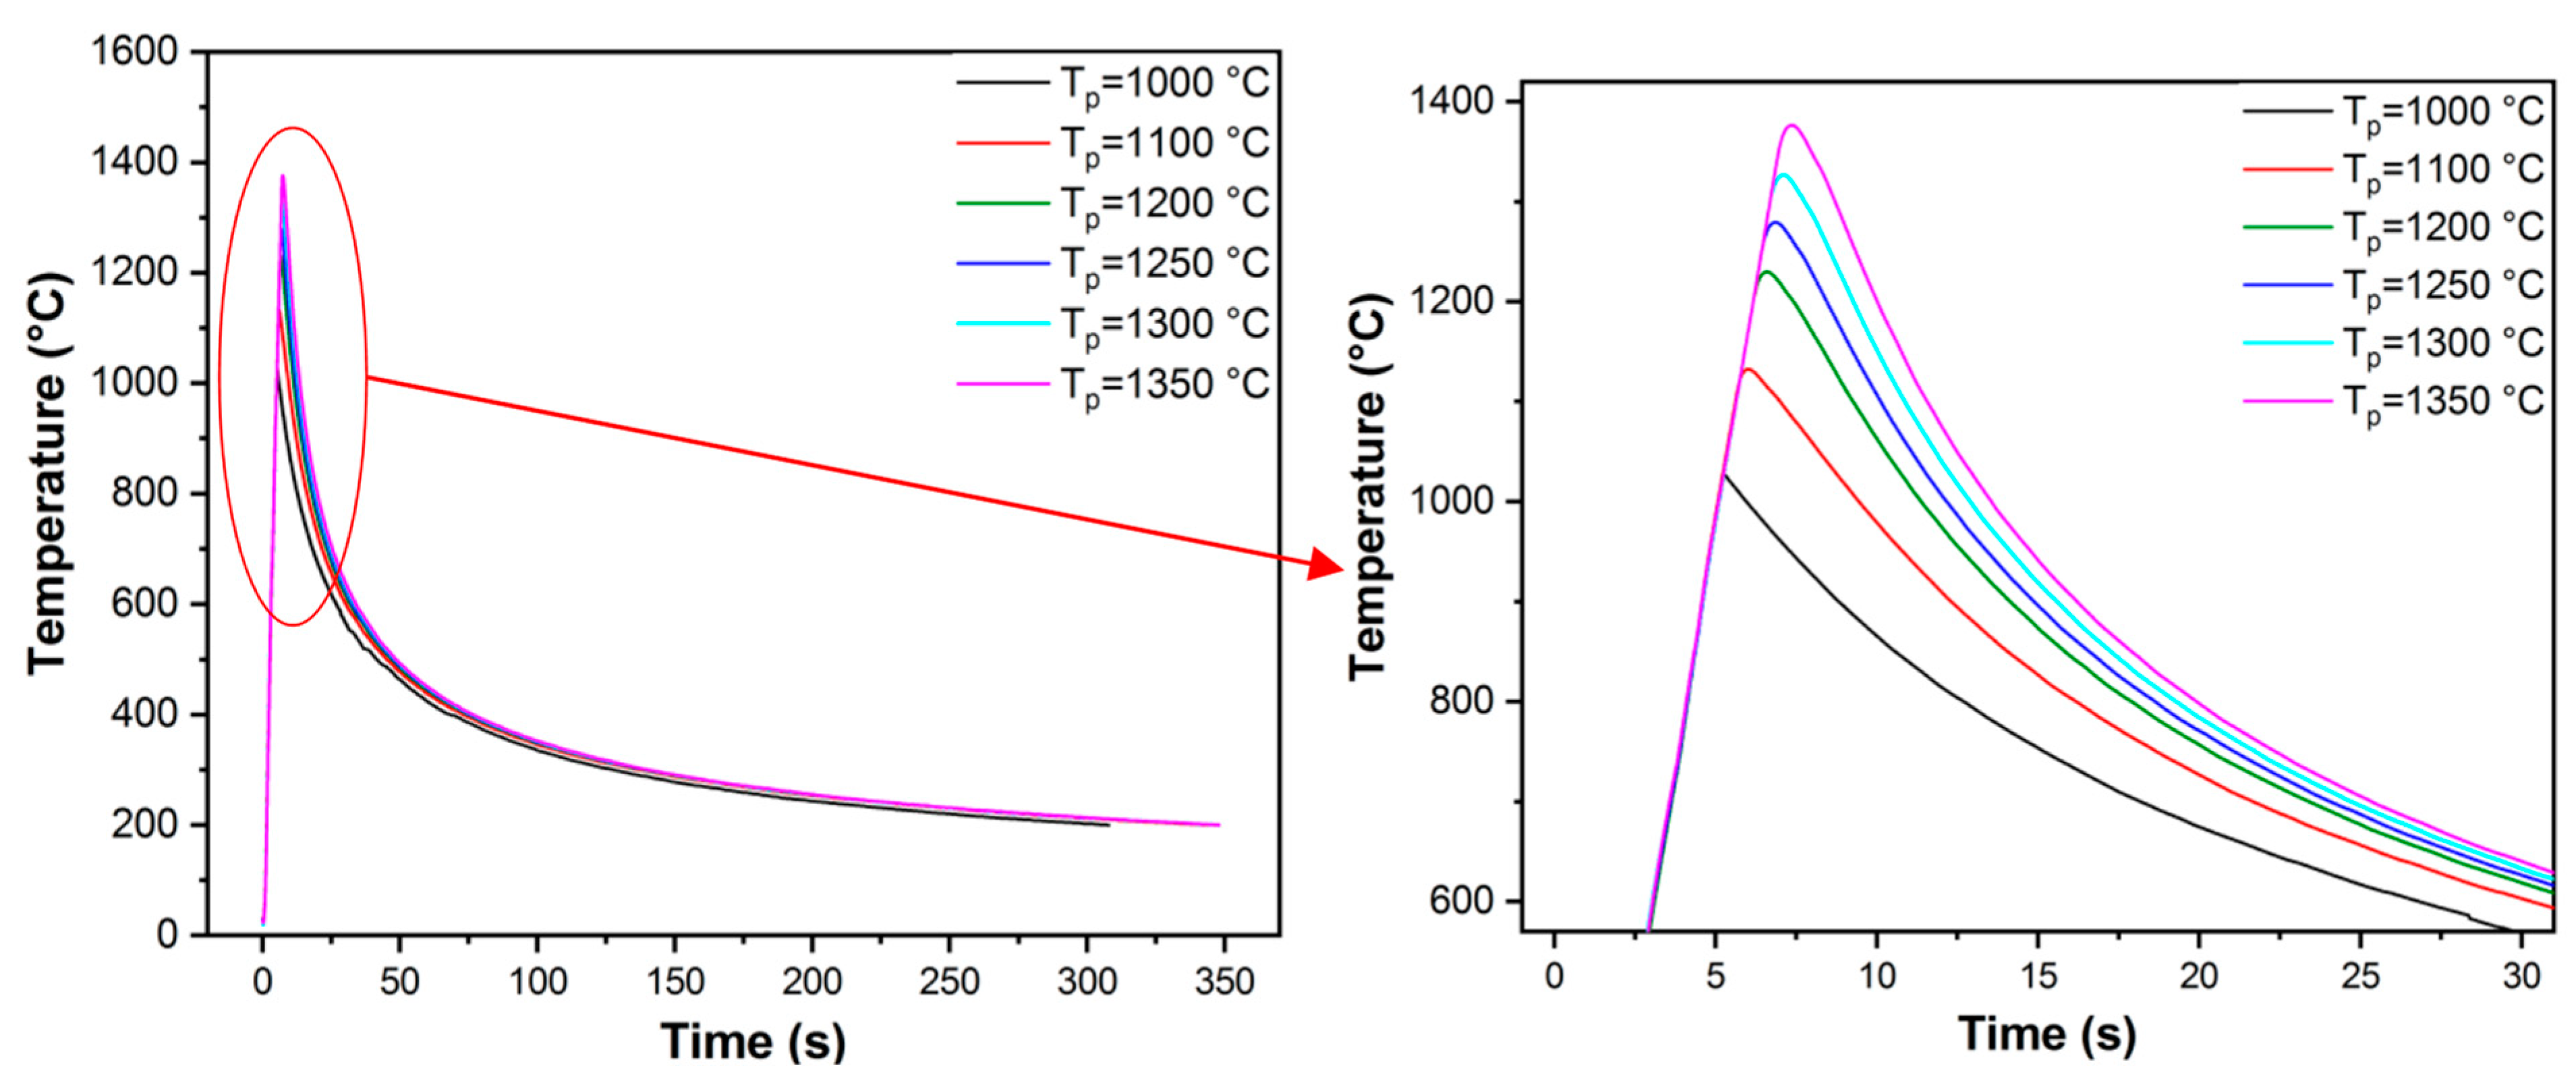
In addition to the HI, the PAGS is critical to the mechanical properties of HAZ subzones. Figure 3 presents the thermal cycles used by Gleeble to produce different PAGS. Six different temperatures were chosen: 1000 and 1100 °C for the fine grain region and 1200, 1250, 1300, and 1350 °C for the coarse grain region subjected to an actual welding heat input (HI = 4.2 kJ/mm). The other parameters were consistent with those used as above.
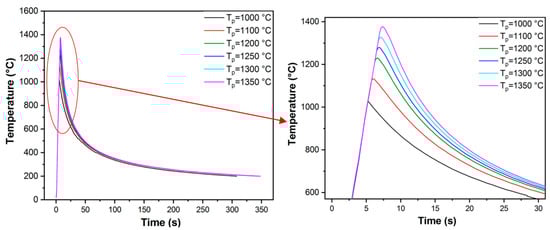
Figure 3.
Thermal cycle curves used for producing different PAGSs.
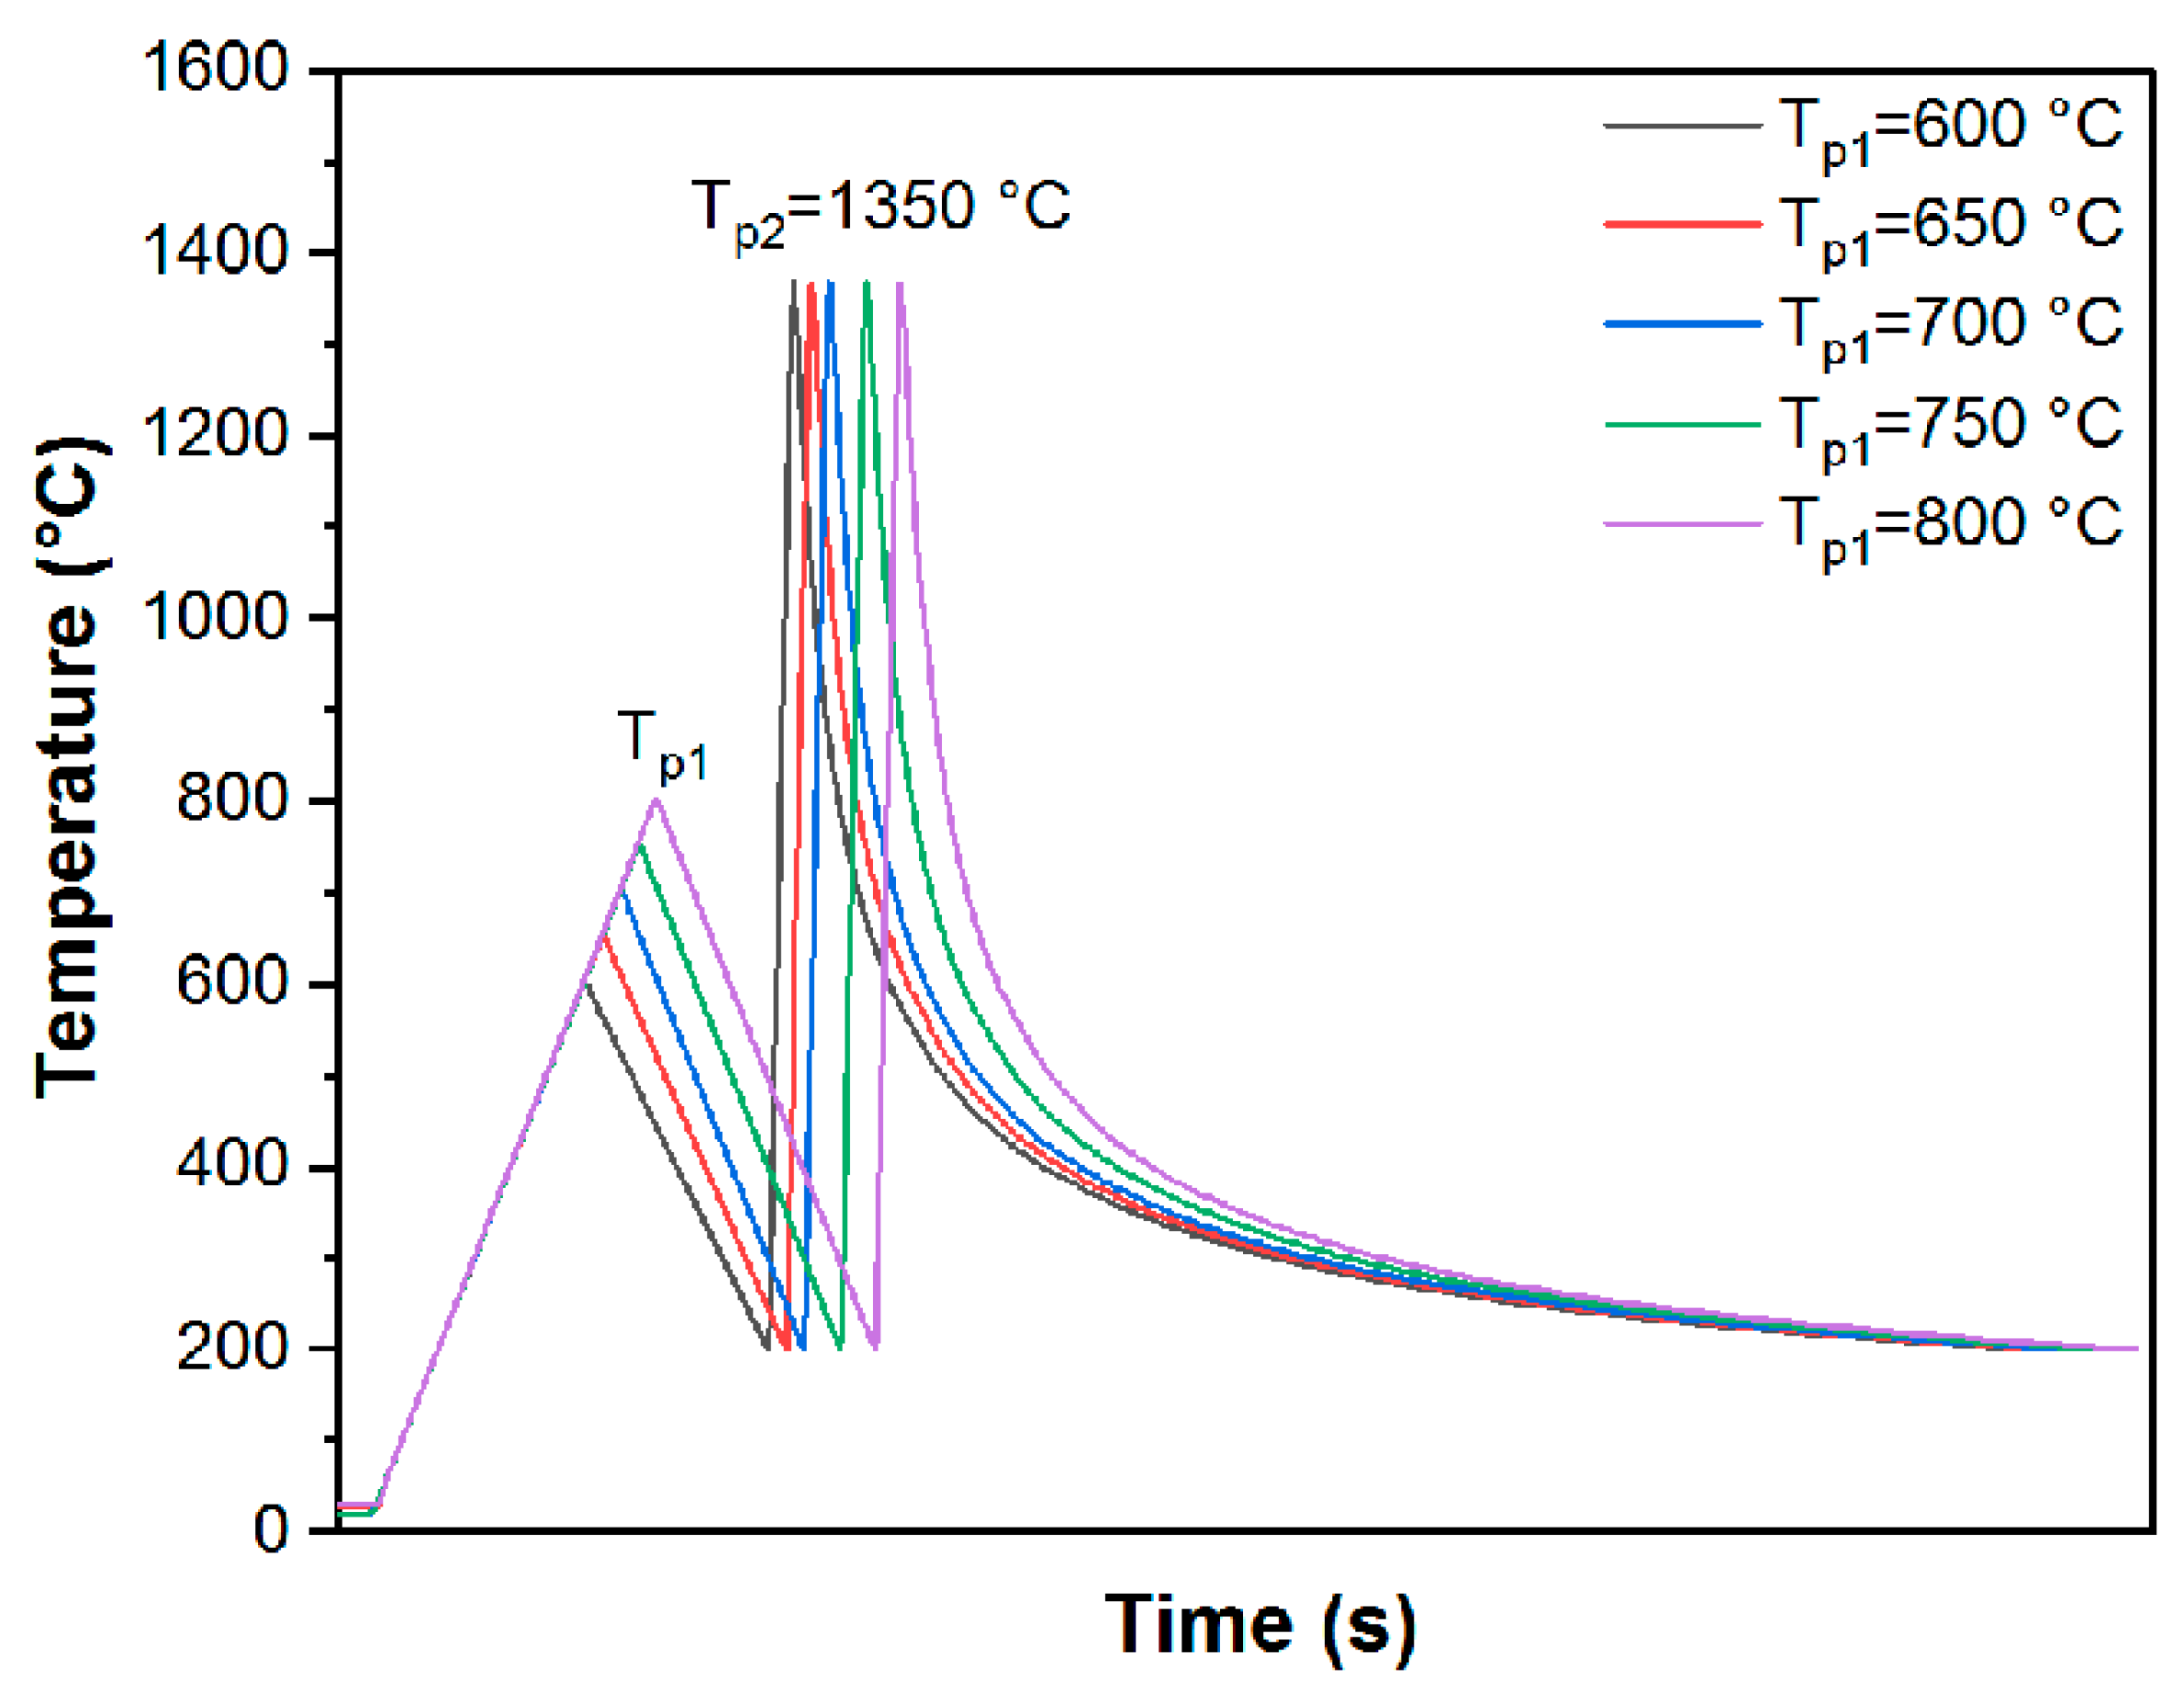
A special pre-welding thermal treatment was developed to improve the HAZ toughness. A two-pass thermal simulation was carried out to apply the thermal treatment to the CGHAZ, as shown in Figure 4. Five peak temperatures (Tp1 = 600, 650, 700, 750, and 800 °C) were selected in the first pass at a heating rate of 10 °C/s, holding for 1 s, followed by cooling to 200 °C at a cooling rate of 10 °C/s. The second pass is to produce the CGHAZ. The peak temperature was fixed at 1350 °C at a heating rate of 200 °C/s, holding for 0.5 s, followed by cooling to 200 °C at a cooling time of Δt8/5 = 28.93 s.
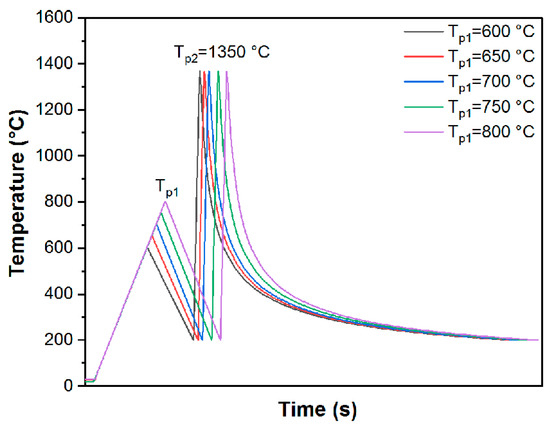
Figure 4.
Thermal cycle curves used for simulation of a special thermal treatment applied to the CGHAZ.
2.2.2. Thermal Simulation of ICCGHAZ
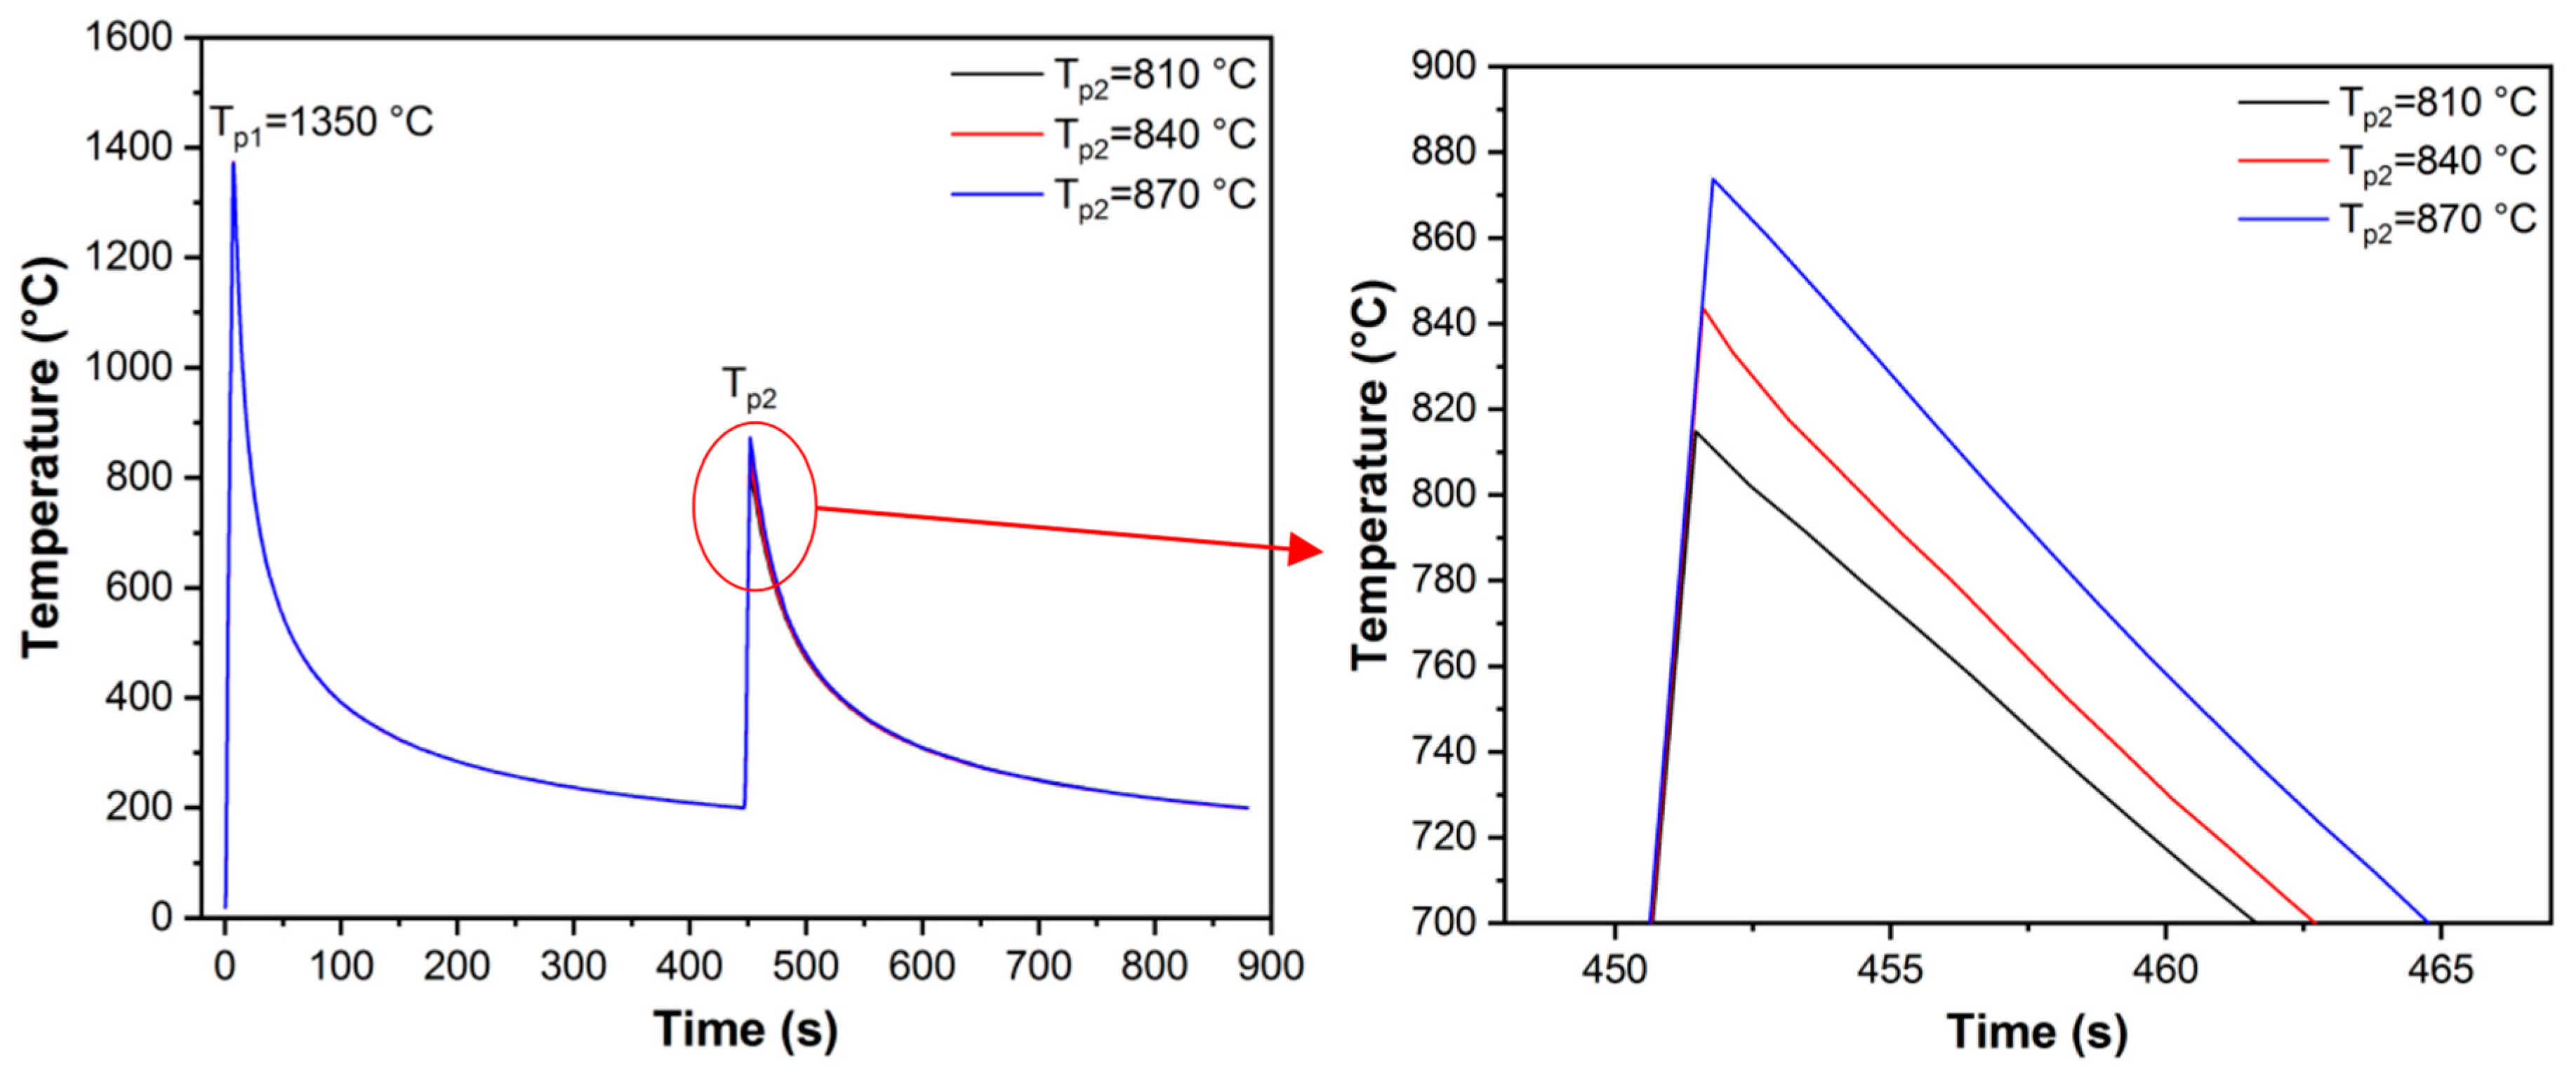
Figure 5 illustrates the thermal cycles applied to reproduce different ICCGHAZ samples using Gleeble. The cooling time for the first thermal cycle was set at Δt8/5 = 28.93 s, according to the actual mill-welding parameters, to accurately duplicate the real CGHAZ. The subsequent intercritical thermal cycle was determined based on the dilatometry curve of the current pipe steel (Figure 6). Various reheating temperatures were selected within the intercritical range to investigate their influences on the microstructure and mechanical properties of the ICCGHAZ.
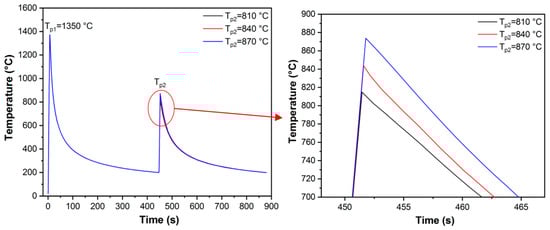
Figure 5.
Thermal cycle curves used for simulated ICCGHAZ at different intercritical reheating temperatures for all the investigated steels.
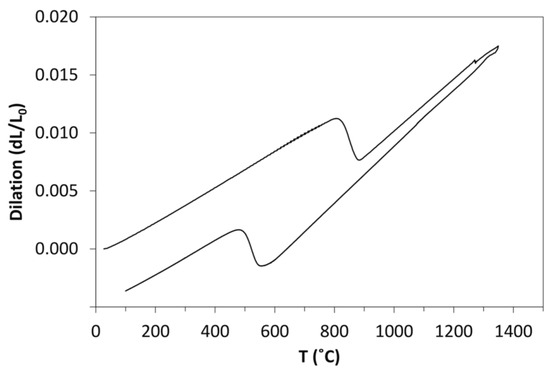
Figure 6.
Dilatometry curve of X70 line pipe steel with a 28 mm thickness.
A two-pass thermal simulation was conducted to investigate the influences of the PAGS on the M–A constituent and toughness in the ICCGHAZ. The corresponding thermal cycle is depicted in Figure 7. Three peak temperatures (Tp1 = 1100, 1250, and 1350 °C) were selected in the first pass at a heating rate of 200 °C/s, holding for 0.5 s, followed by cooling to 200 °C to obtain different PAGSs. The peak temperature of the second pass was fixed at 810 °C, which was about 10 °C above the Ac1 temperature. During the cooling stage for both passes, Δt8/5 = 28.93 s was selected to simulate a HI of 4.2 kJ/mm in a real weld.
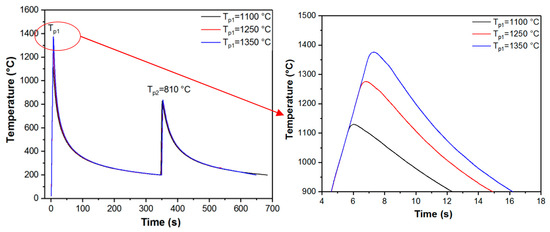
Figure 7.
Thermal cycle curves used for ICCGHAZ simulated at different Tp1 values.
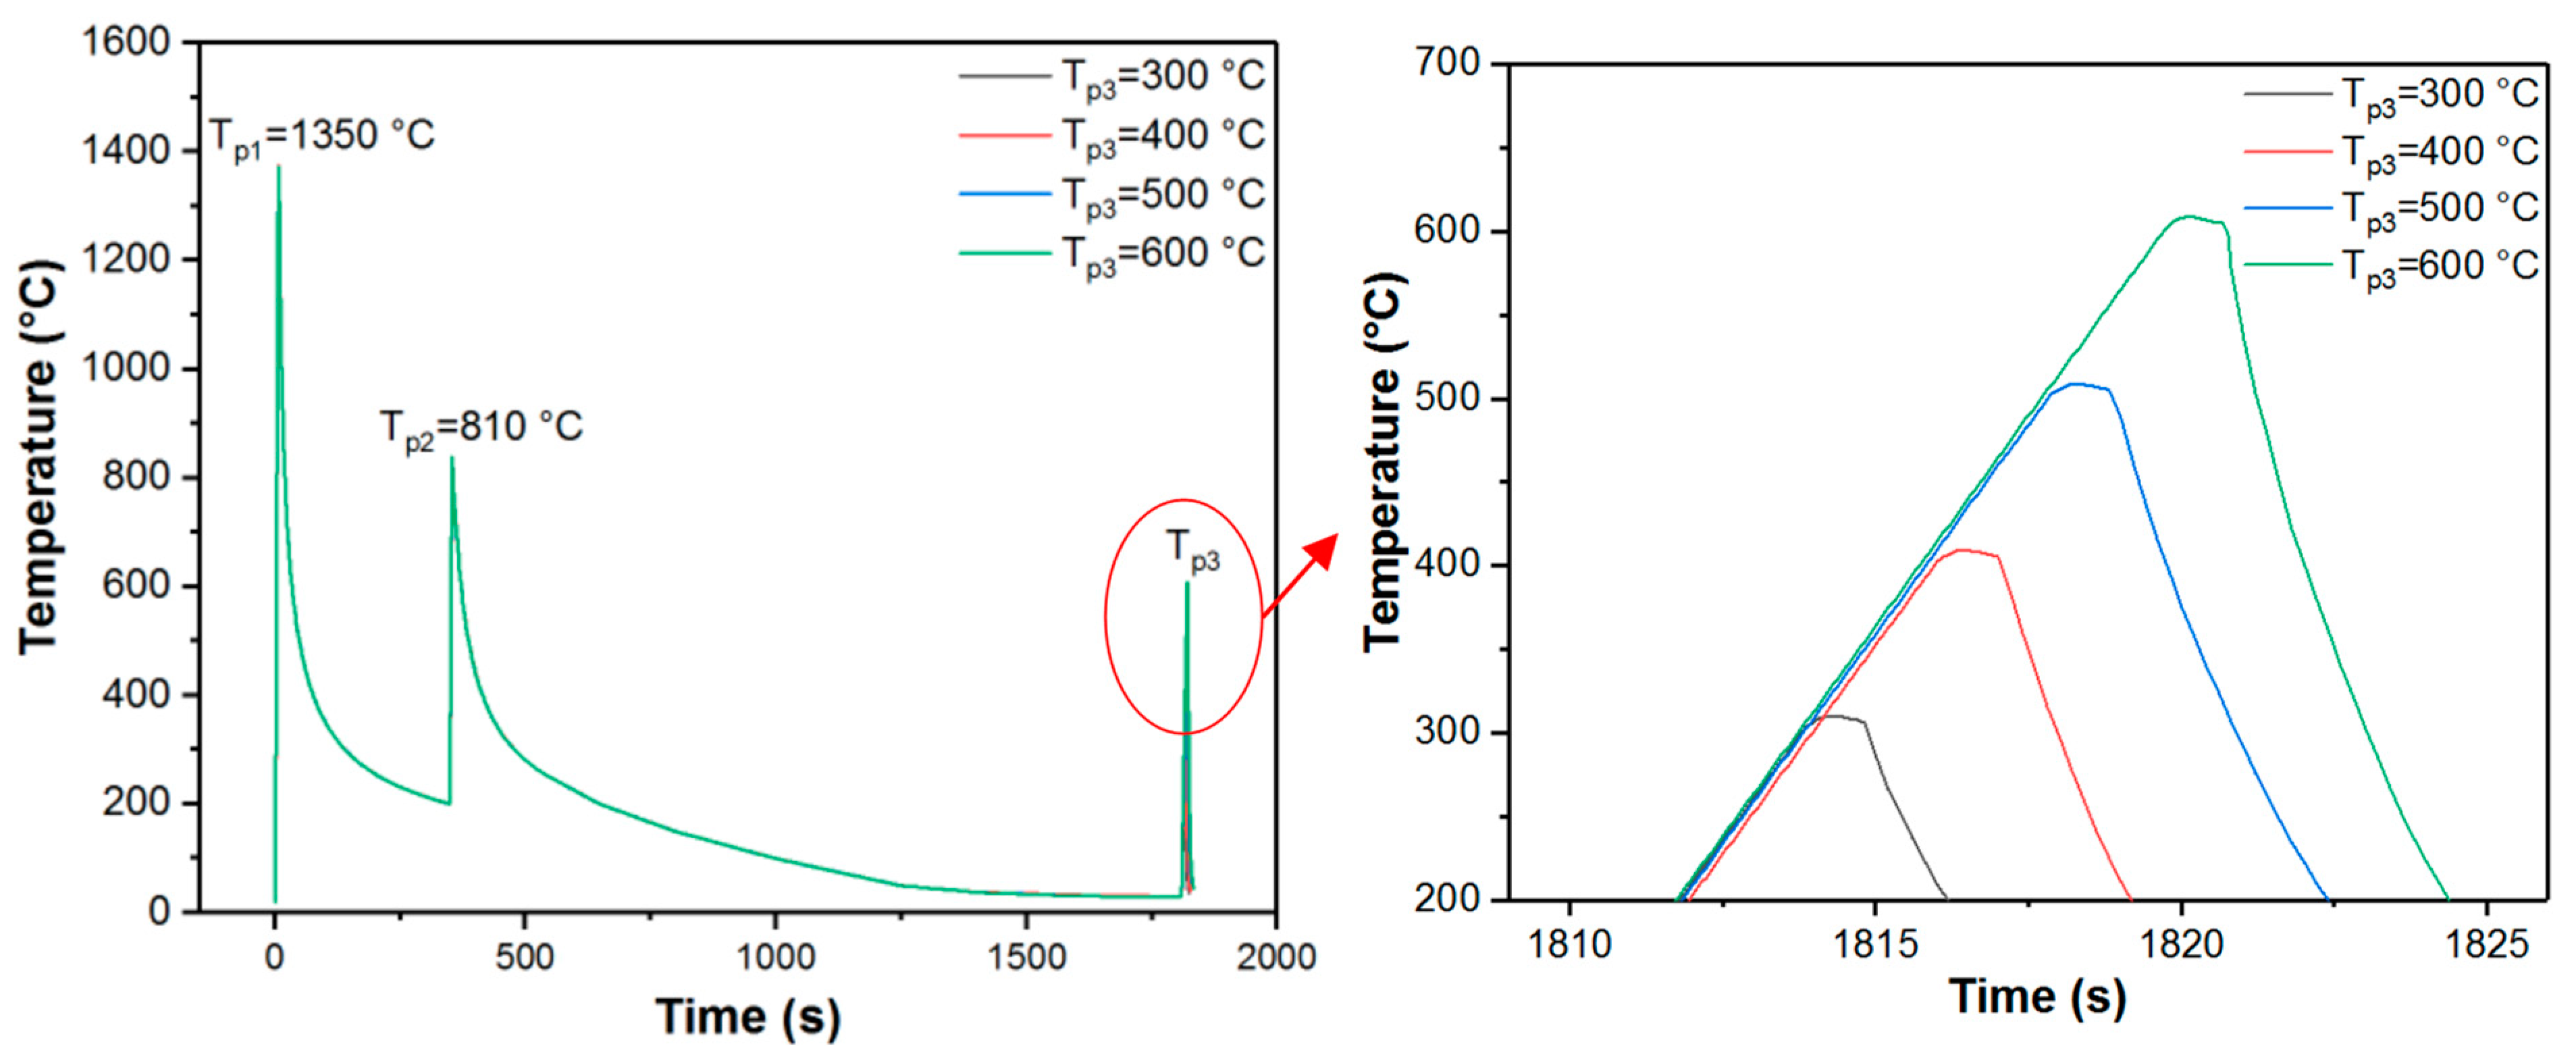
Three-pass thermal cycles were conducted to investigate the influences of a post-welding thermal treatment, as shown in Figure 8. The typical ICCGHAZ was reproduced by the first and second passes at peak temperatures of 1350 °C and 810 °C, correspondingly. Four peak temperatures were selected for the third pass, including 300, 400, 500, and 600 °C, with a tempering of 1 s, following by rapid cooling (quenching in helium). Then, the peak temperature of the third pass was fixed at 500 °C at different holding times and cooling rates. The specific rapid tempering conditions of the third pass are provided in Table 5.
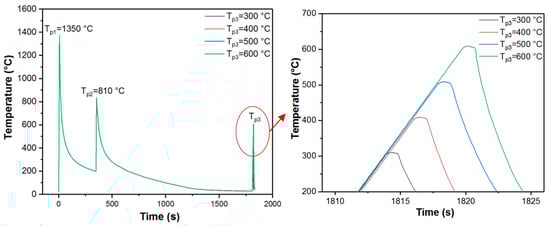
Figure 8.
Thermal cycle curves used for simulation of rapid tempering applied to the ICCGHAZ.
Table 5.
Parameters of rapid tempering applied to the ICCGHAZ.
2.3. Metallographic Examination
The original weldments and thermally simulated samples were sectioned, ground, polished, and etched according to the standard metallography procedures for microstructural observations. Optical micrographs were taken on a Nikon Eclipse LV100NDA optical microscope (Nikon Metrology NV).
After the standard optical observation, several simulated specimens were selected to re-polish and etch in supersaturated picric acid for analysis of the PAGS. The average grain size was determined from at least 500 PAGSs in more than 10 fields of view at a magnification of 200× using the standard linear intercept methods.
2.4. Mechanical Testing
Hardness can reflect the cold-cracking resistance, strength, ductility, toughness, and corrosion resistance. In this study, Vickers hardness measurements were carried out following the test procedure specified in ASTM E384 [35], at 0.5 mm indentation intervals using 1 kg load (HV1) on the cross-sections of both the original double-sided SAW welds and Gleeble-simulated samples. The location of the hardness mapping area is highlighted by the red square in Figure 9. For the Gleeble-simulated samples, an average value was obtained based on 10 indentations.
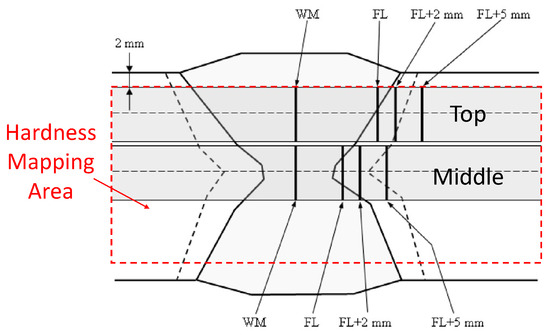
Figure 9.
Hardness mapping area (red square) and positions of Charpy V-notch impact test specimen for double-sided welds. Data from [36].
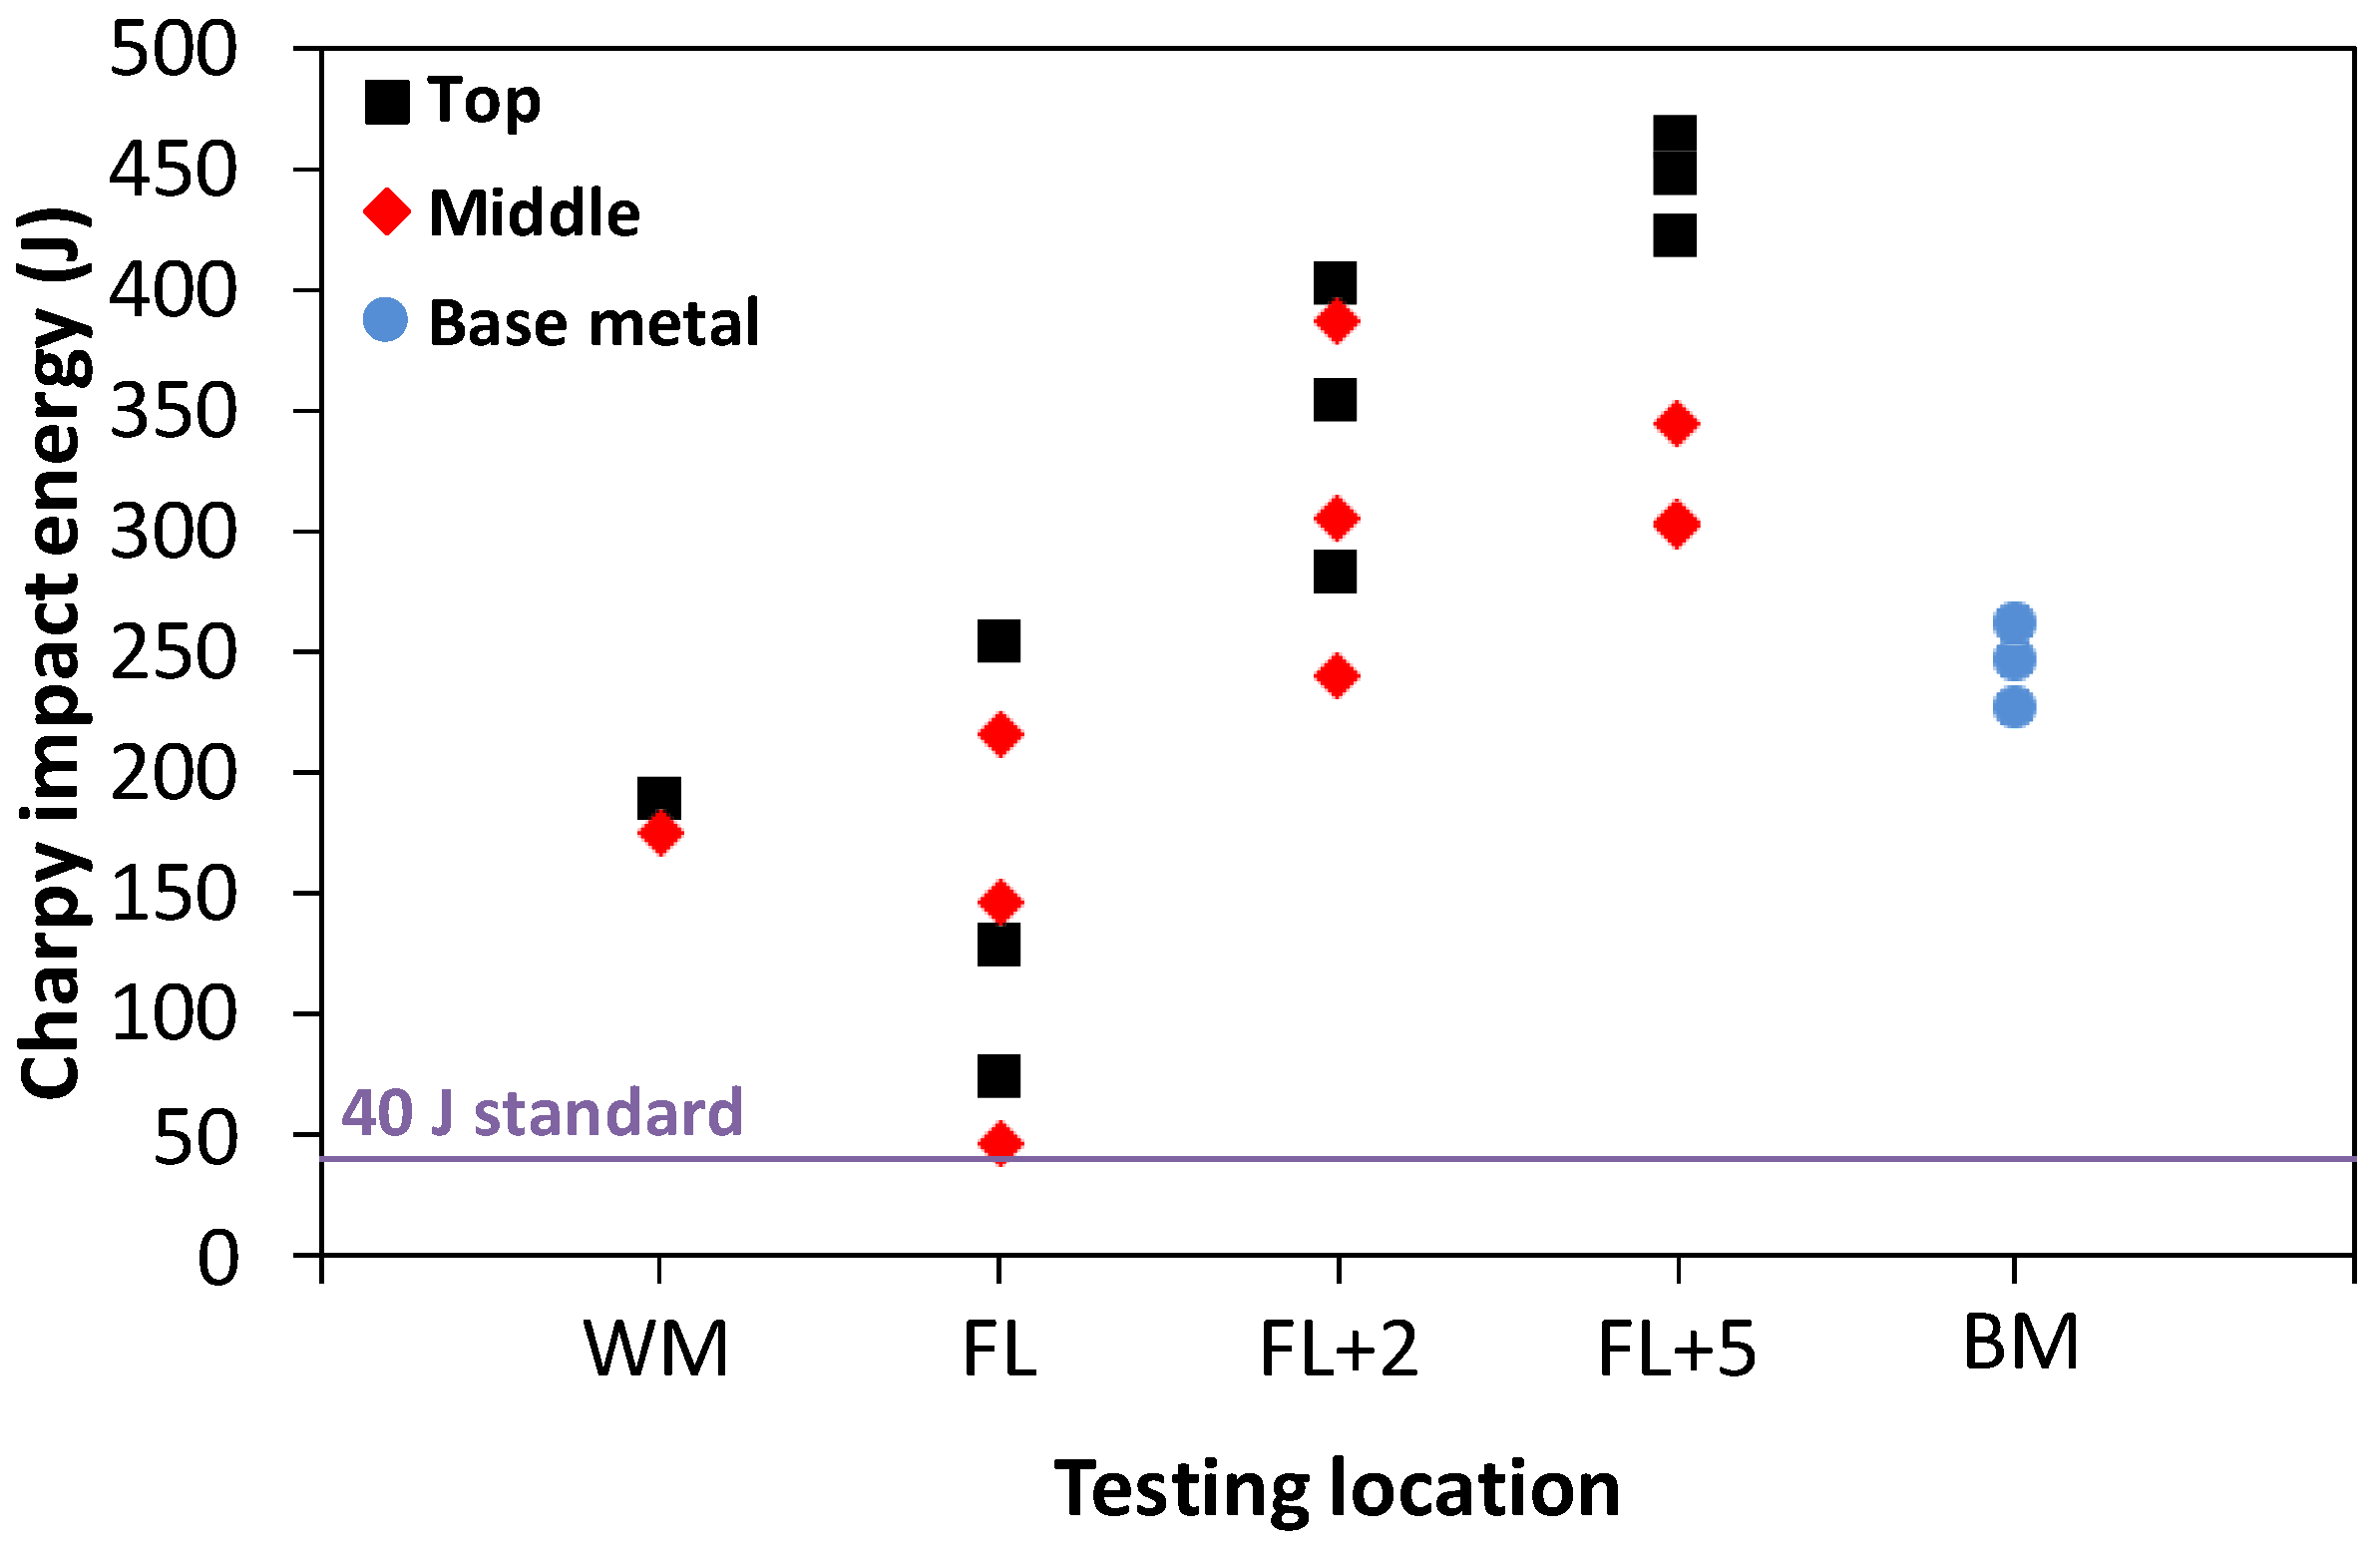
Toughness is the ability of a material to absorb energy and plastically deform in the process before the fracture. The Charpy V-notch (CVN) test, a standardised test, is a commonly used method to measure the amount of impact energy absorbed by materials. This test can also be carried out to study the behaviour of the temperature-dependent ductile–brittle transition. The ductile–brittle transition temperature (TB) can be identified through the CVN test by cooling samples at different temperatures. In double-sided SAW pipes, the HAZ from the second welding process (outer SAW) overlaps the HAZ from the first welding process (inner SAW), giving rise to a variety of partially and fully reheated zones. To compare the fracture toughness of different regions in the complicated HAZ and find the LBZ, the CVN impact test specimens were machined in accordance with DNV-OS-F101 owing to the specific requirements for Charpy V-notch specimen positions in double-sided welds [36]. As shown in Figure 9, two sets of specimens were taken from the locations of ¼ T (marked as “Top”, where T is the thickness of the welded pipe) and the mid thickness, ½ T (marked as “Middle”), respectively. The V-notches are located at the central WM, fusion line (FL), and at distances of 2 mm (FL + 2) and 5 mm (FL + 5) from the fusion line. All the tests on the original weldments were carried out at −20 °C using an Instron Charpy machine (MPX motorised impact tester).
The Gleeble-simulated samples were machined to full-sized (10 mm × 10 mm × 55 mm) CVN bars (refer to ASTM E23 [37]—the widely recognised standard to analyse impact properties) strategically notched at the position where the control thermocouple was attached in the thermal simulation. Then, Charpy impact testing was performed at temperatures of −60, −40, −20, −10, 0, and 20 °C.
The test temperature was achieved by mixing different proportions of methanol and liquid nitrogen to form a bath. The specimens were soaked at the desired temperature for at least 15 min before testing, and the bath temperature was maintained within ±2 °C using a thermocouple for monitoring the temperature. The time span between removing the specimens from the bath and the impact test was kept within 5 s for Charpy impact tests.
3. Investigation of Original Weldments
3.1. Microstructural Characteristics
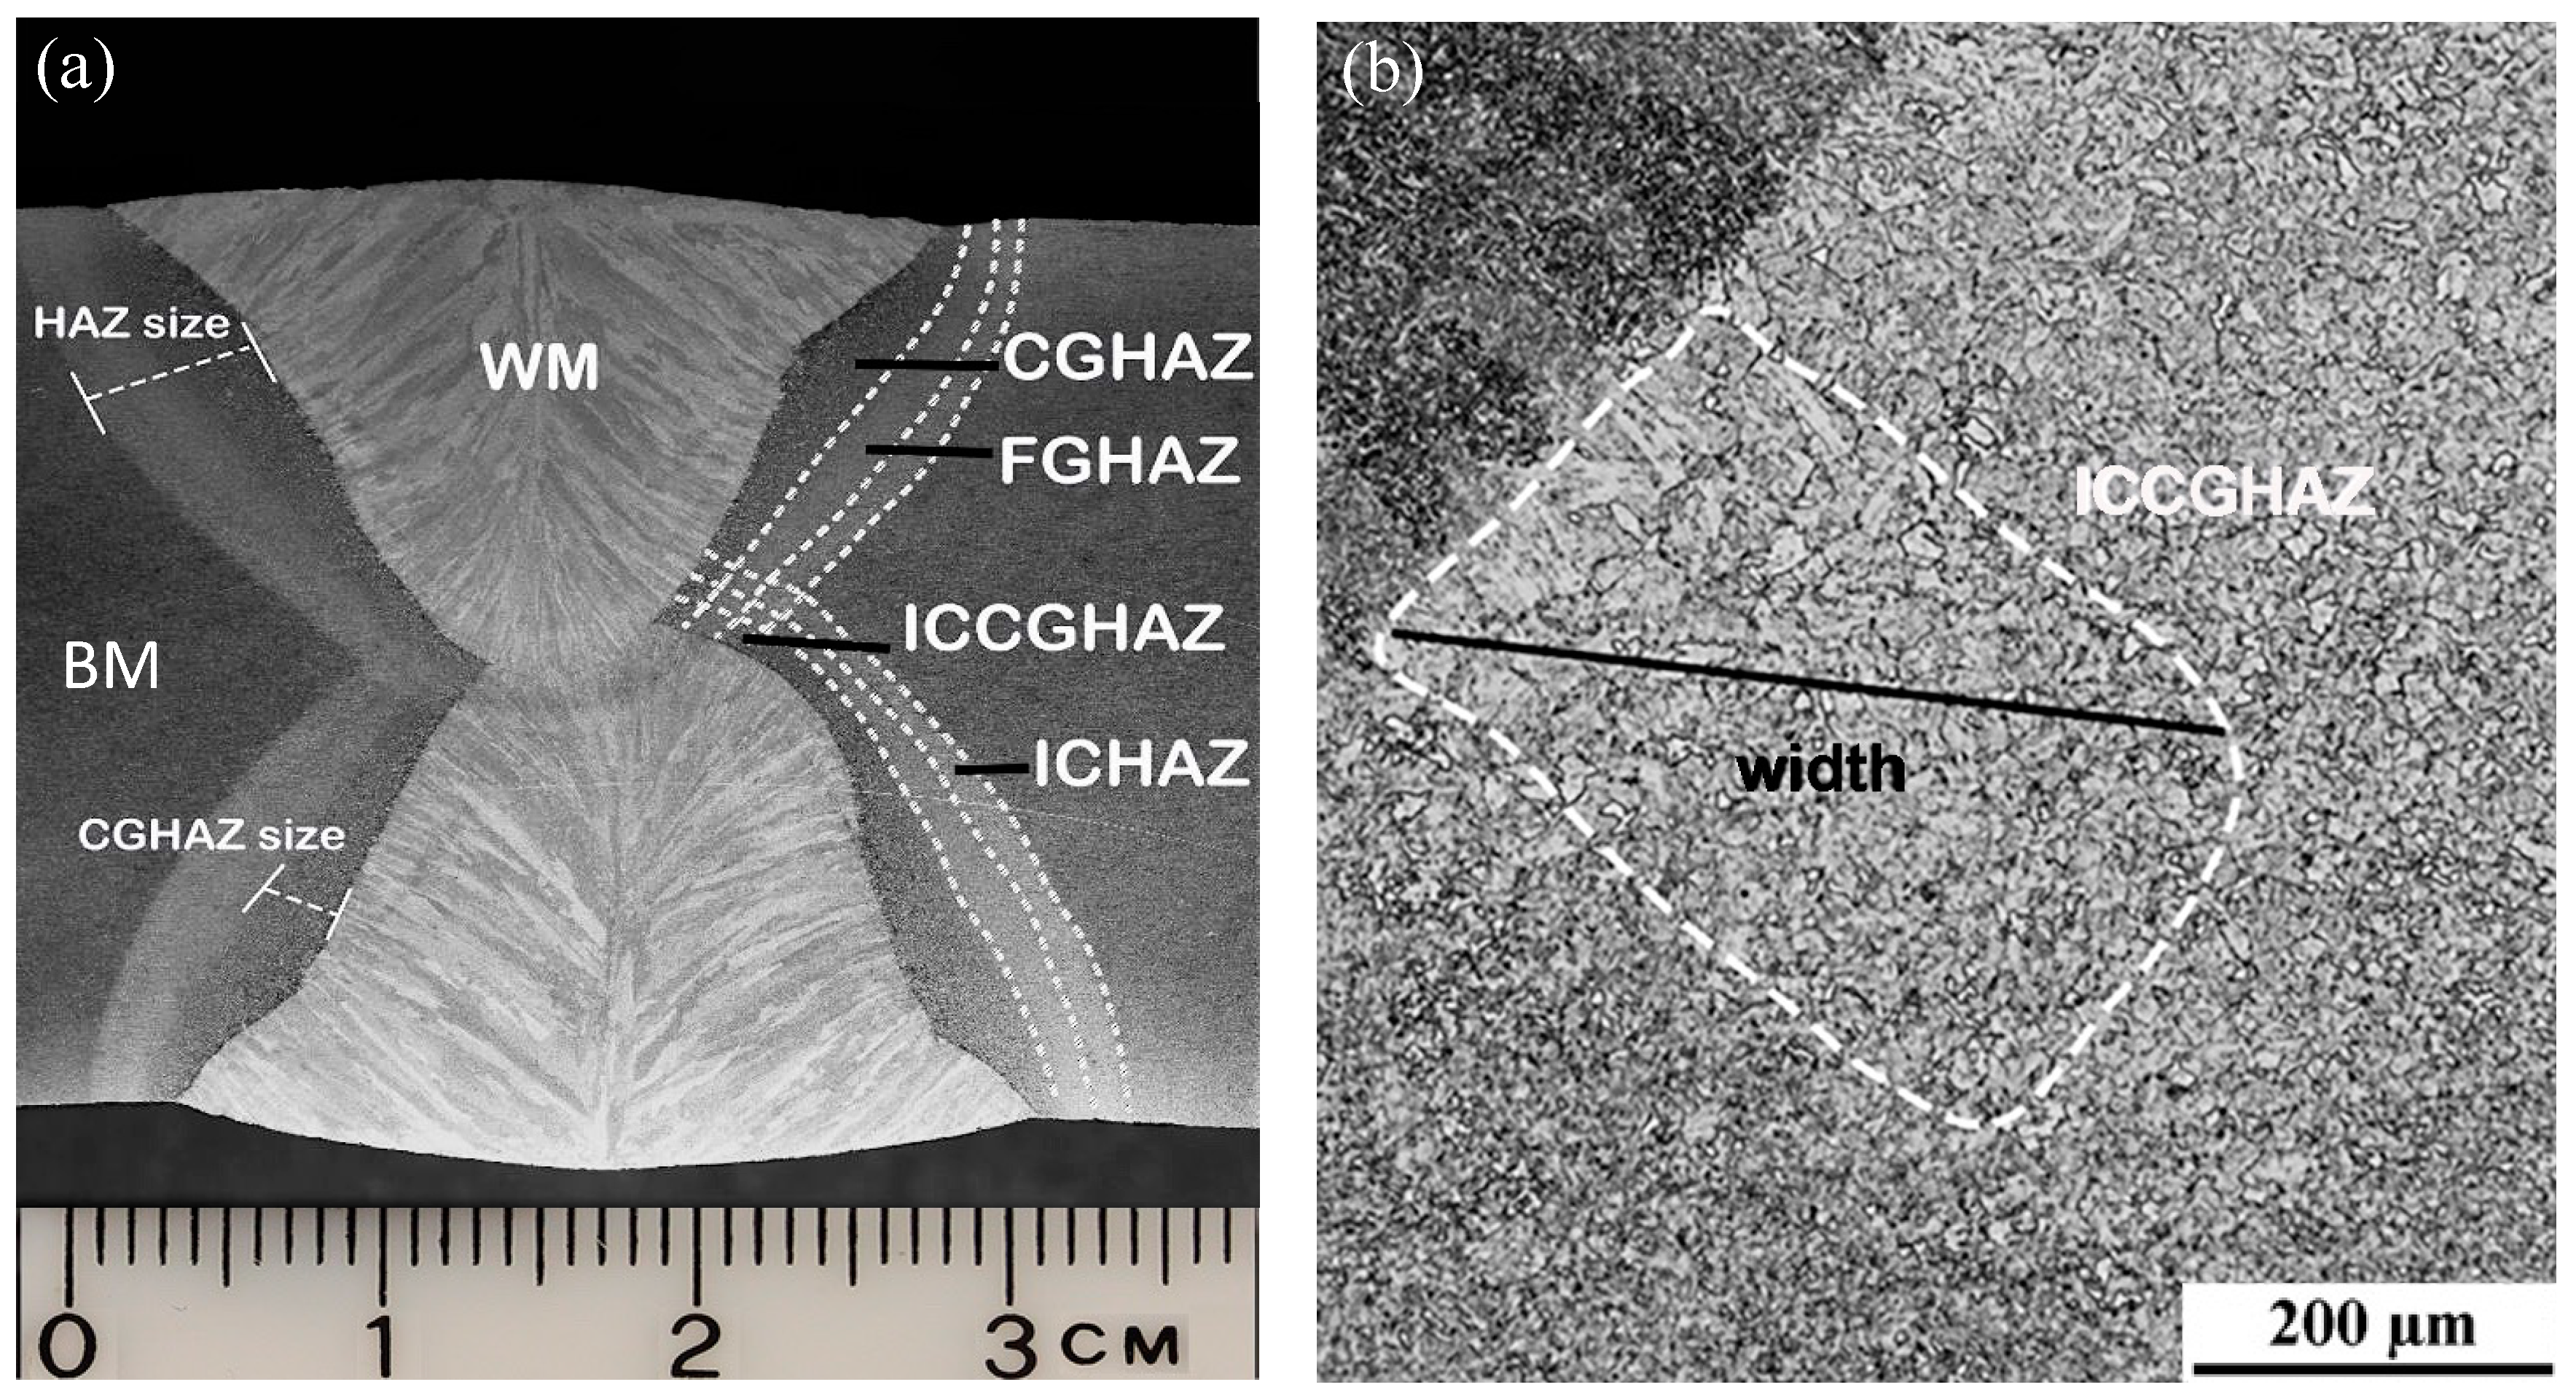
Macrographs of the typical weld in the current thick-walled pipe are shown in Figure 10. The inner SAW (bottom) was reheated by the outer SAW (top). The average widths of the HAZ, CGHAZ, and ICCGHA were measured, and the results are summarised in Table 6. It can be concluded that the CGHAZ accounted for more than 50% of the whole HAZ for the investigated steel. The proportion of the ICCGHAZ in the HAZ was only less than 10%, which is much lower than that of the CGHAZ. Therefore, the characteristic of the CGHAZ was recognised as one of the major contributors to the welding joint properties, while the influence of the ICCGHAZ needed further investigation.

Figure 10.
(a) Macrograph of a typical weld, showing different subzones in the HAZ; (b) high-magnification photo showing the dimensions of the ICCGHAZ.
Table 6.
Average widths of HAZ, CGHAZ, and ICCGHAZ in all the sourced steel pipes.
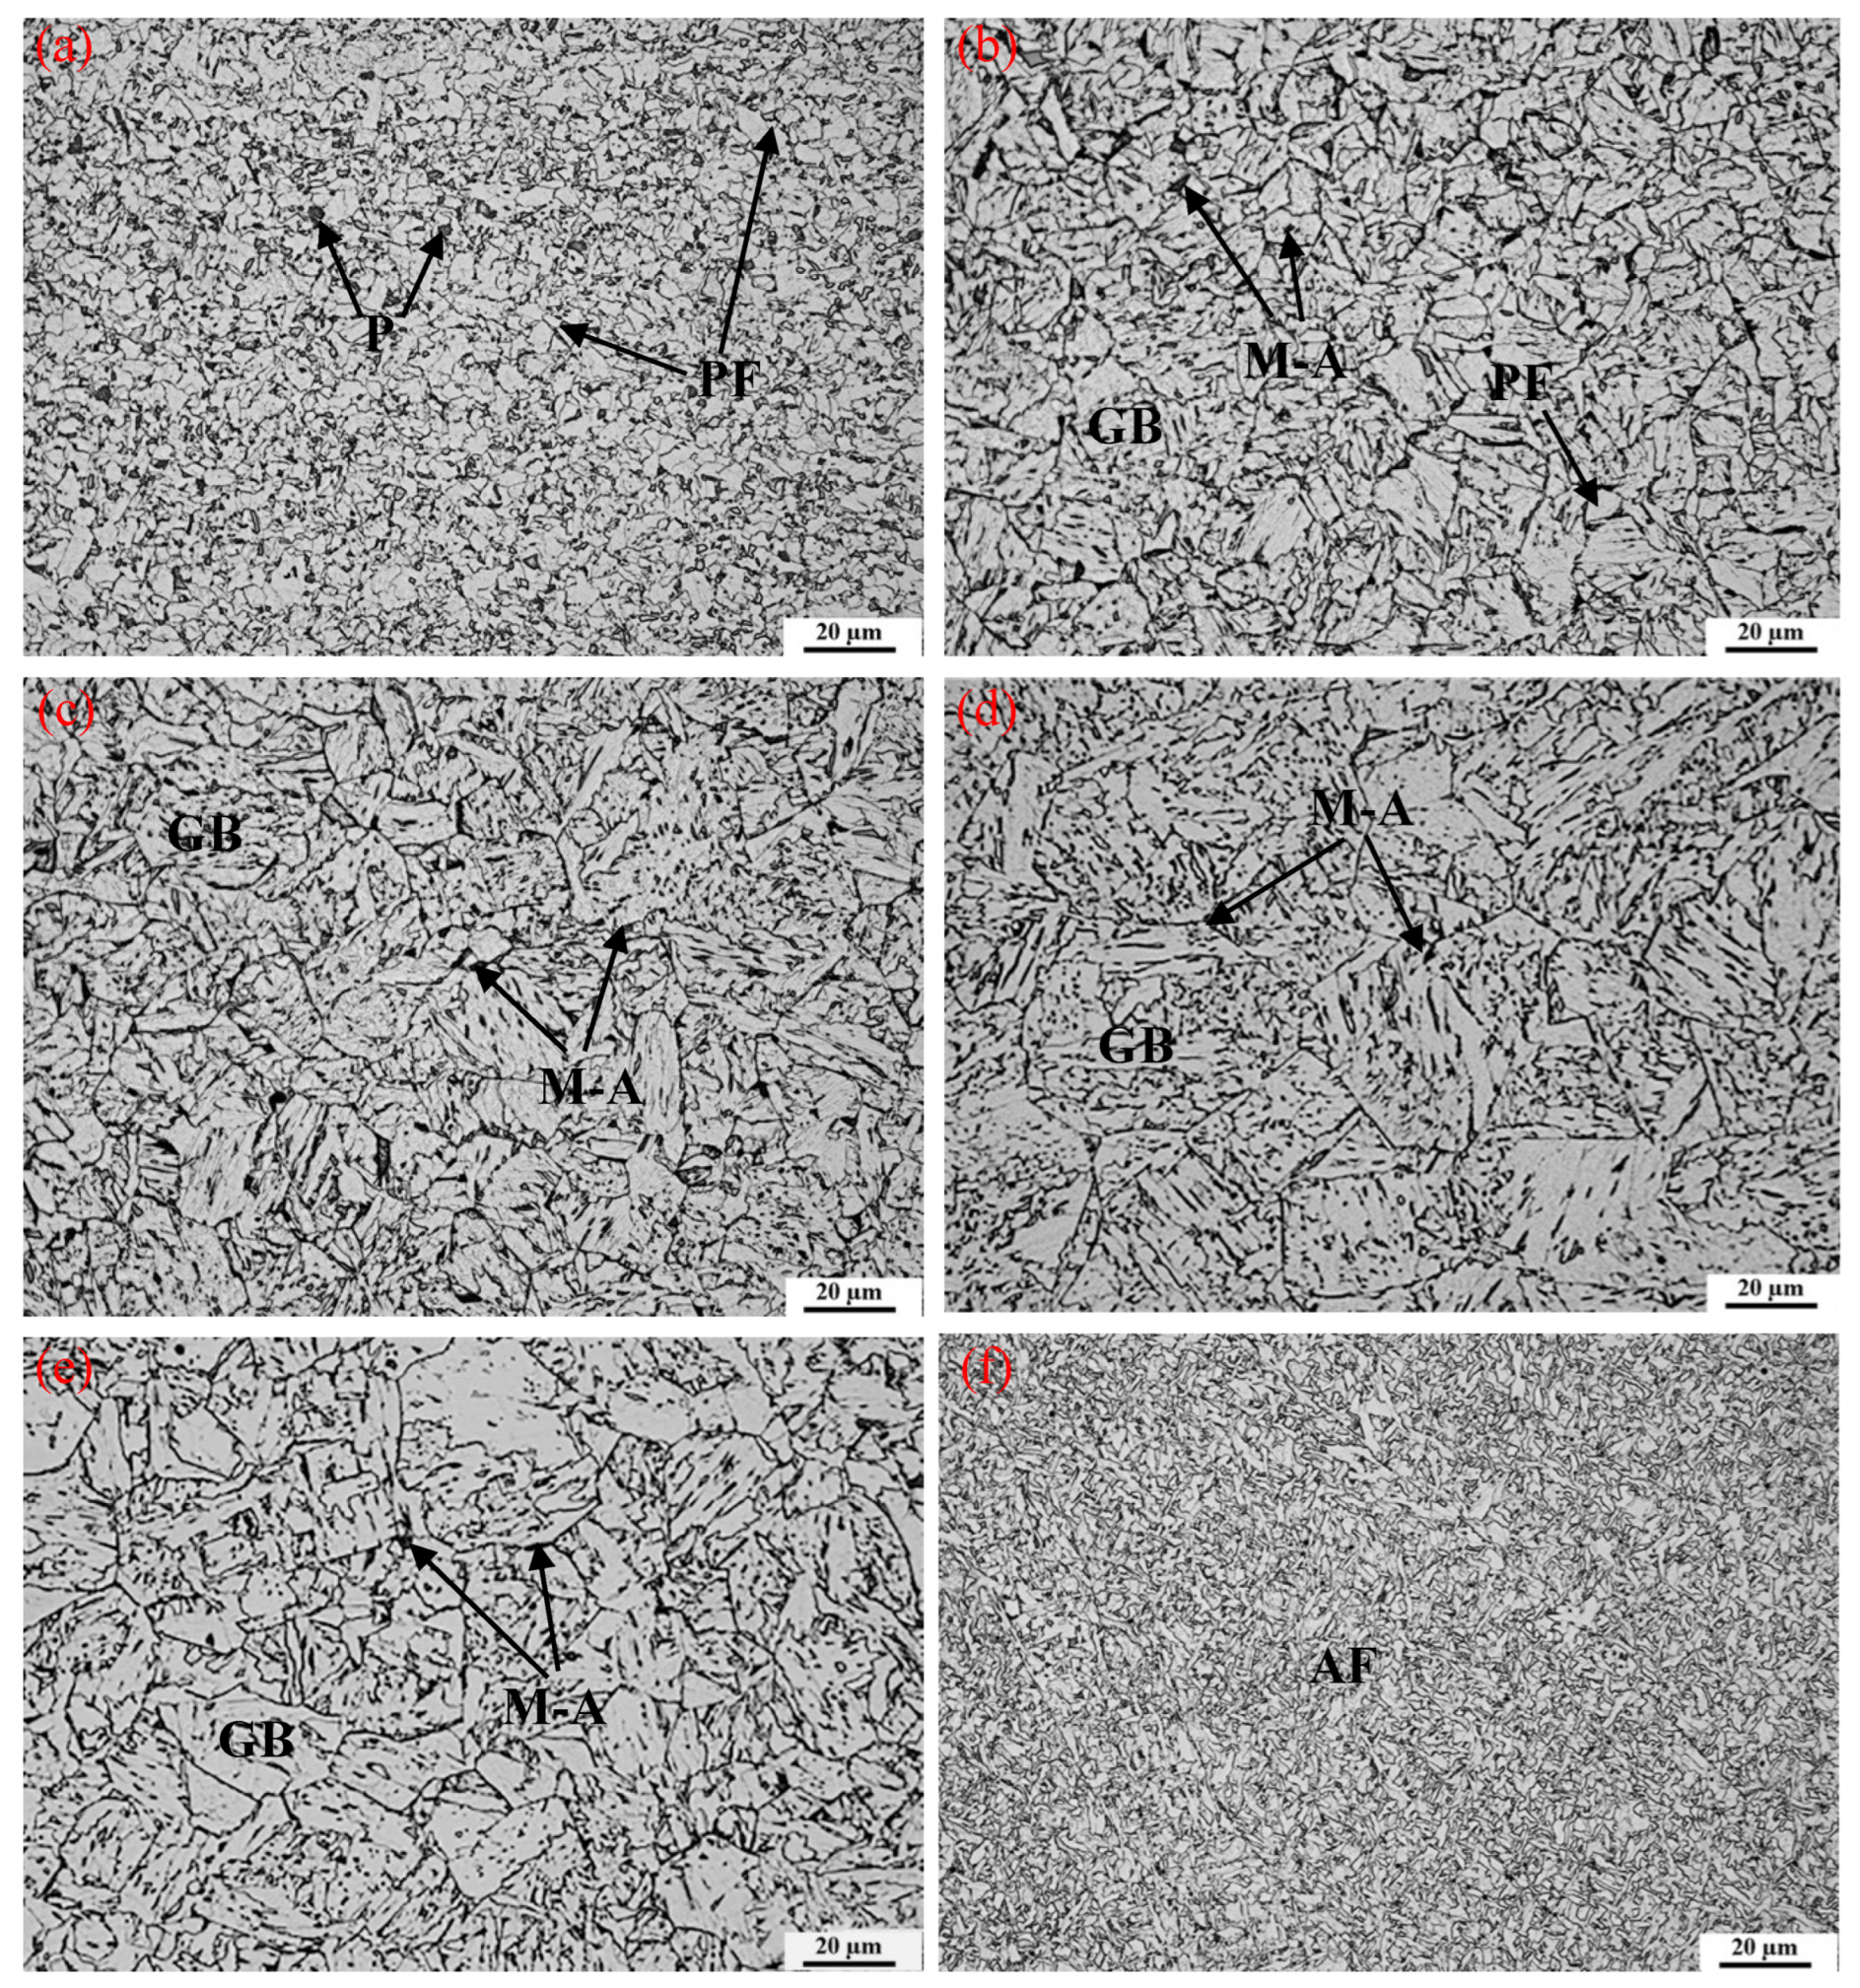
Optical microscopy (OM) was adopted to observe the microstructure in different subzones of the HAZ in the original weldment. The dominant microstructural constituents of the BM in Figure 11a were polygonal ferrite together with quasi-polygonal ferrite and fine islands of pearlite. The boundary of the quasi-polygonal ferrite exhibited a jagged and blurry appearance with variations in grain size. The polygonal ferrite nucleated from the prior austenite grain boundary; the growth could cross the prior austenite grain boundary, and the original austenite boundary profile was obscured. The polygonal ferrite could have a regular grain shape, isometric, or regular polygon. The boundary was smooth and flat.
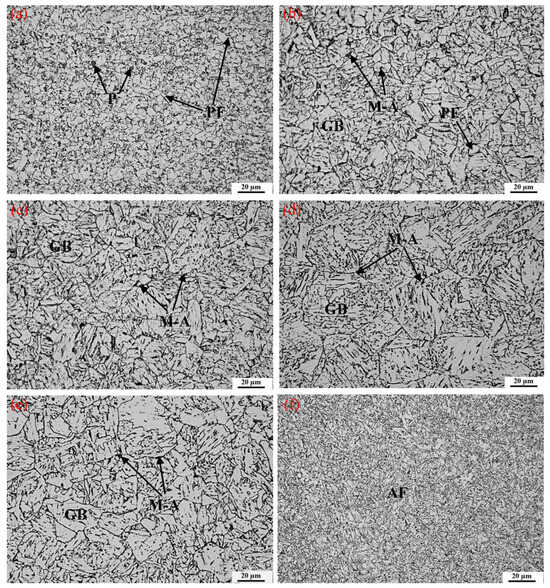
Figure 11.
Optical micrographs of different subzones of the HAZ region in Steel #1: (a) BM, (b) ICHAZ, (c) FGHAZ, (d) CGHAZ, (e) ICCGHAZ, and (f) WM. P: pearlite, PF: polygonal ferrite, GB: granular bainite, M–A: martensite–austenite constituent, and AF: acicular ferrite.
In the intercritical heat-affected zone (ICHAZ) (Figure 11b), the microstructure consisted of the untransformed bainite, the untransformed ferrite, and the island structures, which transformed from the austenite during the cooling process. The untransformed bainite and the ferrite grew constantly during the processes of heating and cooling, respectively, causing the coarsening of the bainite and the ferrite in the ICHAZ.
As shown in Figure 11c, the dominant constituents in the fine-grained heat-affected zone (FGHAZ) were refined recrystallised austenite. The grain size of the austenite was smaller than 20 μm. A small of amount of bainite and M–A islands also presented in this region.
The microstructure of the CGHAZ, as depicted in Figure 11d, was predominantly populated with bainitic ferrite. As expected, the grain size close to the fusion line was much larger than that in the remote area (FGHAZ). The feature of the bainitic ferrite was that ferrite grew from the prior austenite grain boundary towards the inner grain and formed parallel laths. The bainitic ferrite was the result of a mixture of shear and diffusion transformations at a high cooling rate. In addition, a small amount of linearly distributed M–A constituents was located between the laths of the bainitic ferrite.
The optical micrograph of the ICCGHAZ is shown in Figure 11e. The microstructure was composed of a mixture of bainitic ferrite and granular bainite. The prior austenite grain boundaries were clearly visible with a discontinuous dark phase, which has been identified by numerous researchers [7,18,38] as the M–A constituent.
The microstructure of the WM in Figure 11f displayed proeutectoid ferrite and acicular ferrite, typical features in low-alloy steel welds. The acicular ferrite in the WM generally nucleated on and grew from non-metallic inclusions, providing an optimal balance of strength and toughness.
3.2. Mechanical Properties
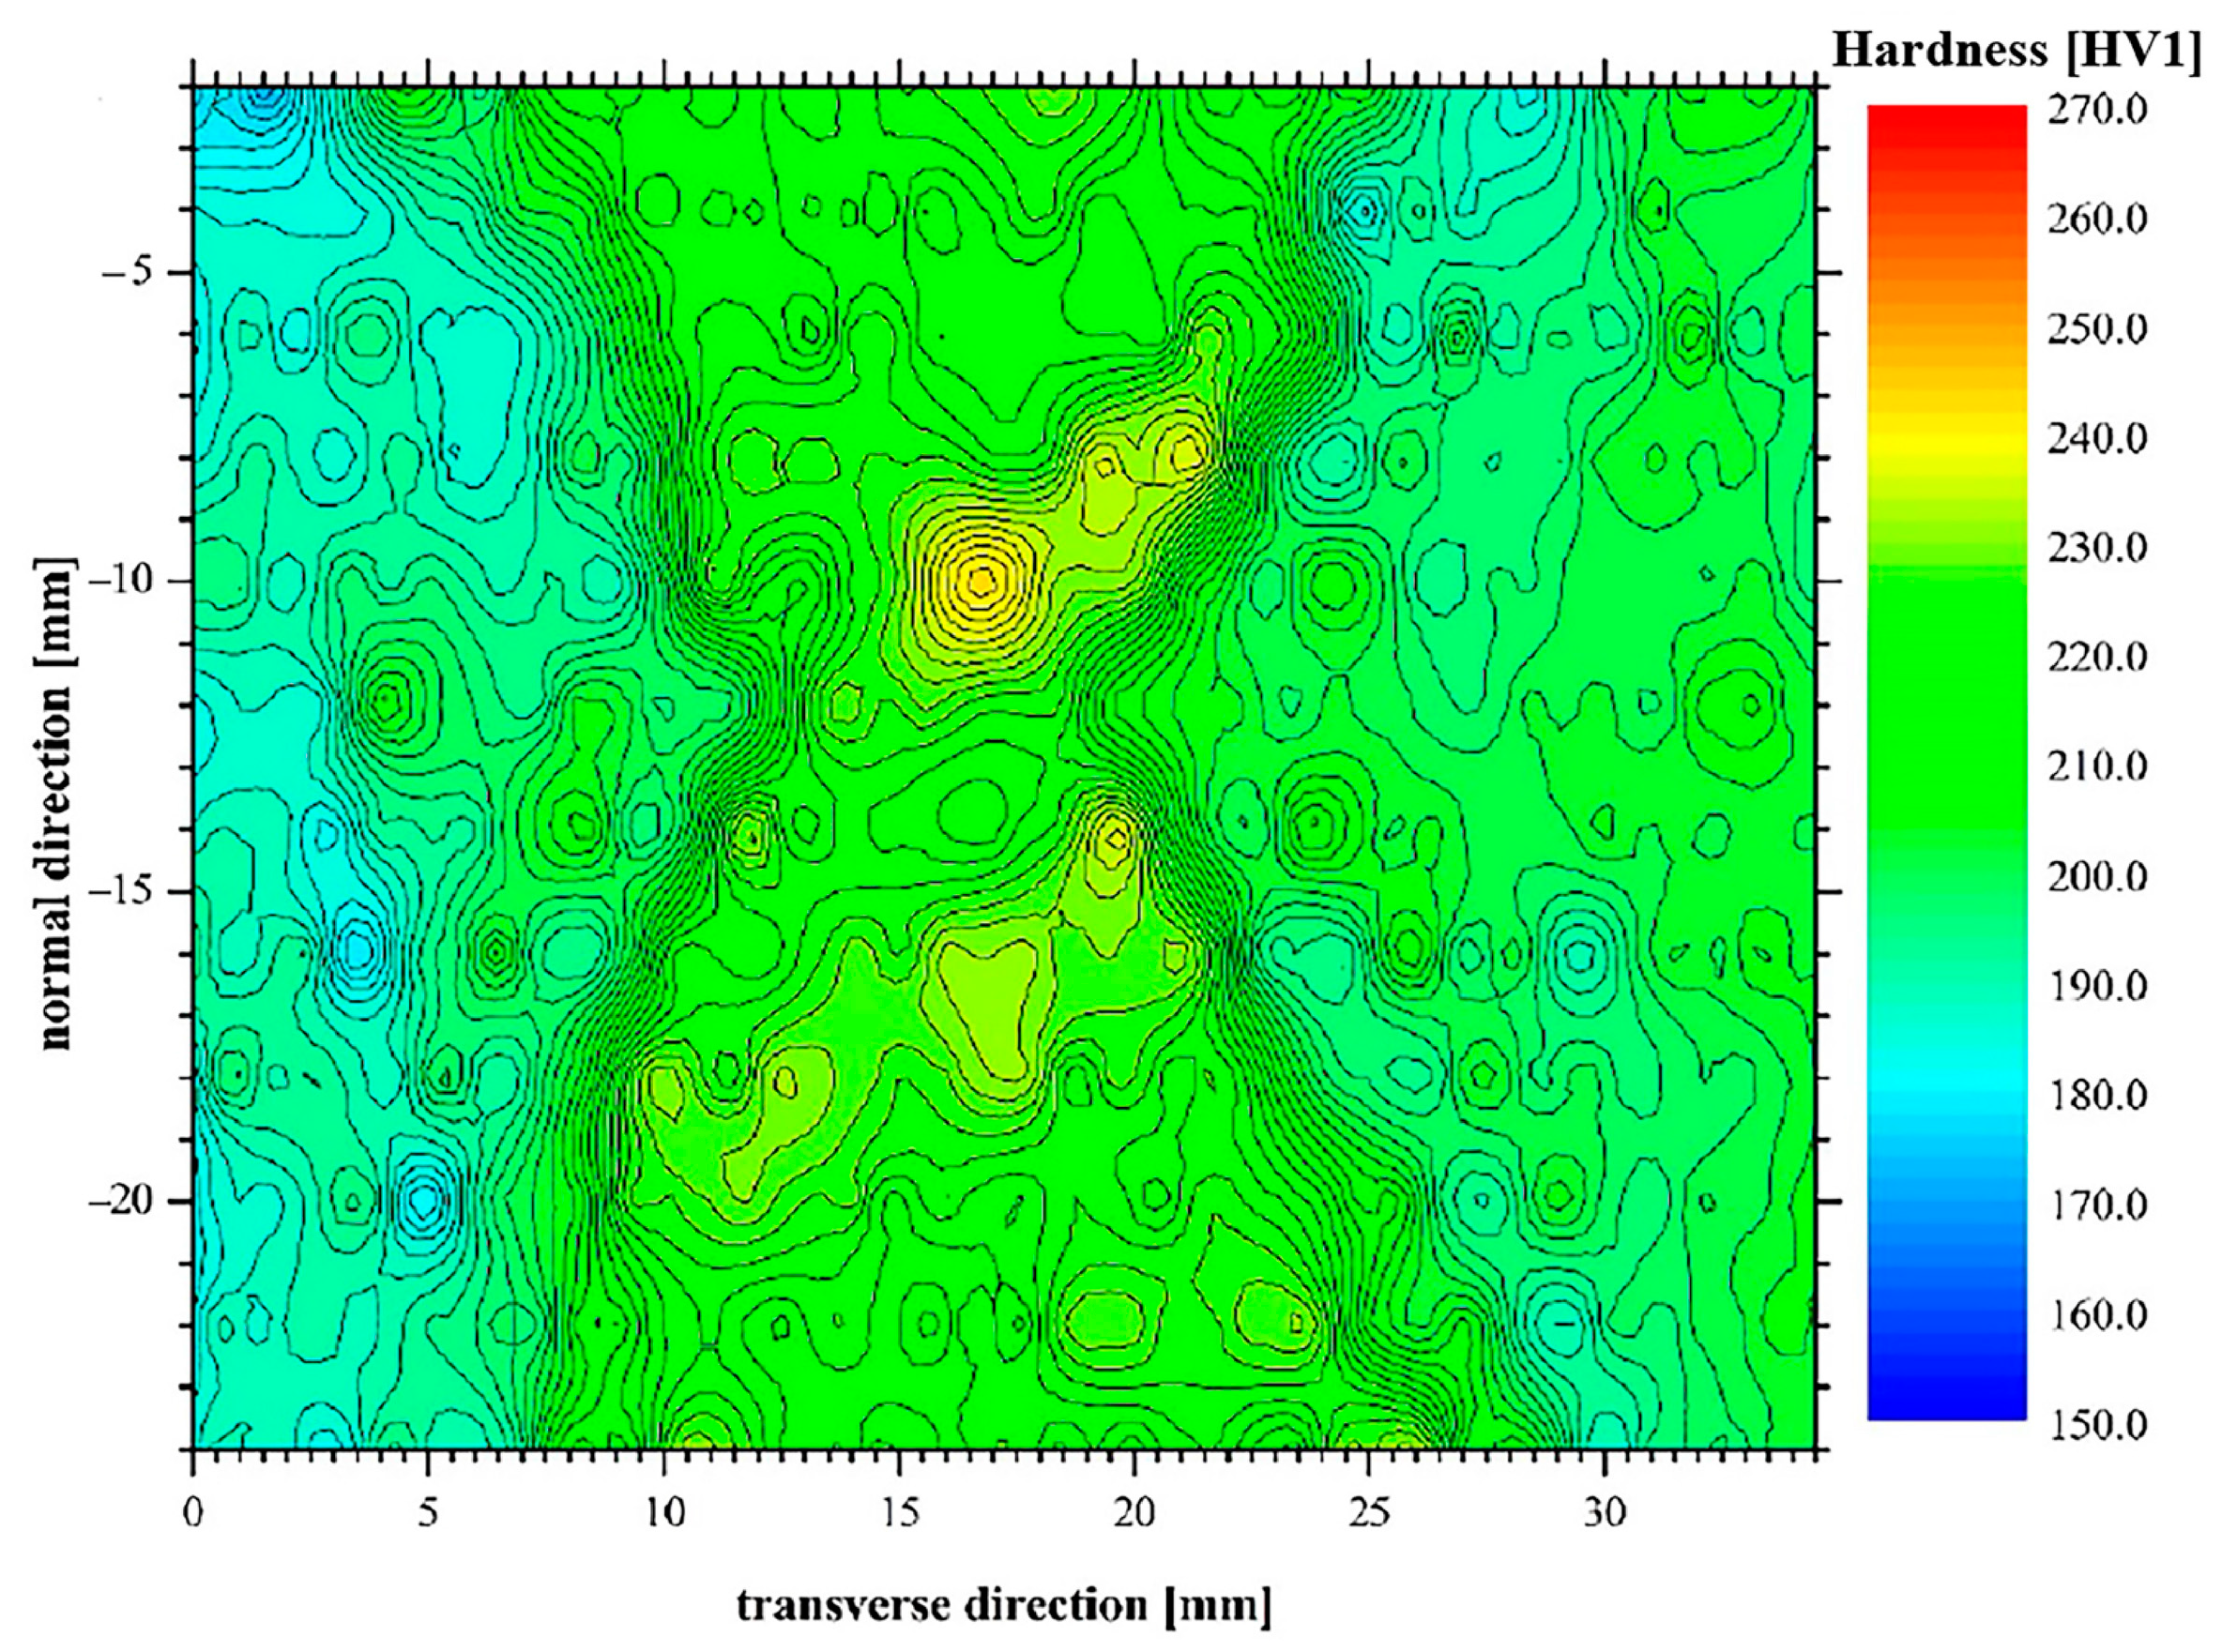
A hardness mapping was performed on the cross-section of the original weld. As shown in Figure 12, the hardness values are relatively symmetric from the left BM to the right BM. The hardness of the WM overmatched those of the HAZ and BM owing to the strength overmatching of the welding consumables.
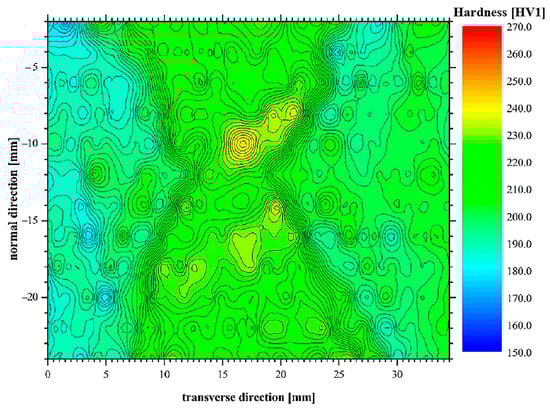
Figure 12.
Hardness mapping of original weld cross-section.
Figure 13 shows the distribution of the fracture toughness in the original weld. It is evident that the lowest fracture toughness at a test temperature of −20 °C was observed at the FL and that the great majority of the values for the FL were significantly above the minimum requirement of 40 J according to the ISO 3183 standard [39]. Only one test exhibited the 45 J impact energy at the FL, which was slightly higher than this lower limit. With increasing distance from FL to FL + 5, the fracture toughness increased drastically. In general, the distributions for the specimens with a notch located at FL + 2 shifted to higher values as the CGHAZ was sampled to a lesser extent. The absorbed impact energies at FL + 5 reached the highest value, indicating a relatively good resistance to fracture.
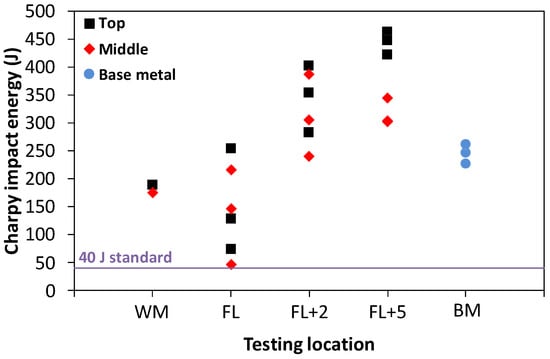
Figure 13.
Distribution of the fracture toughness in the original weld.
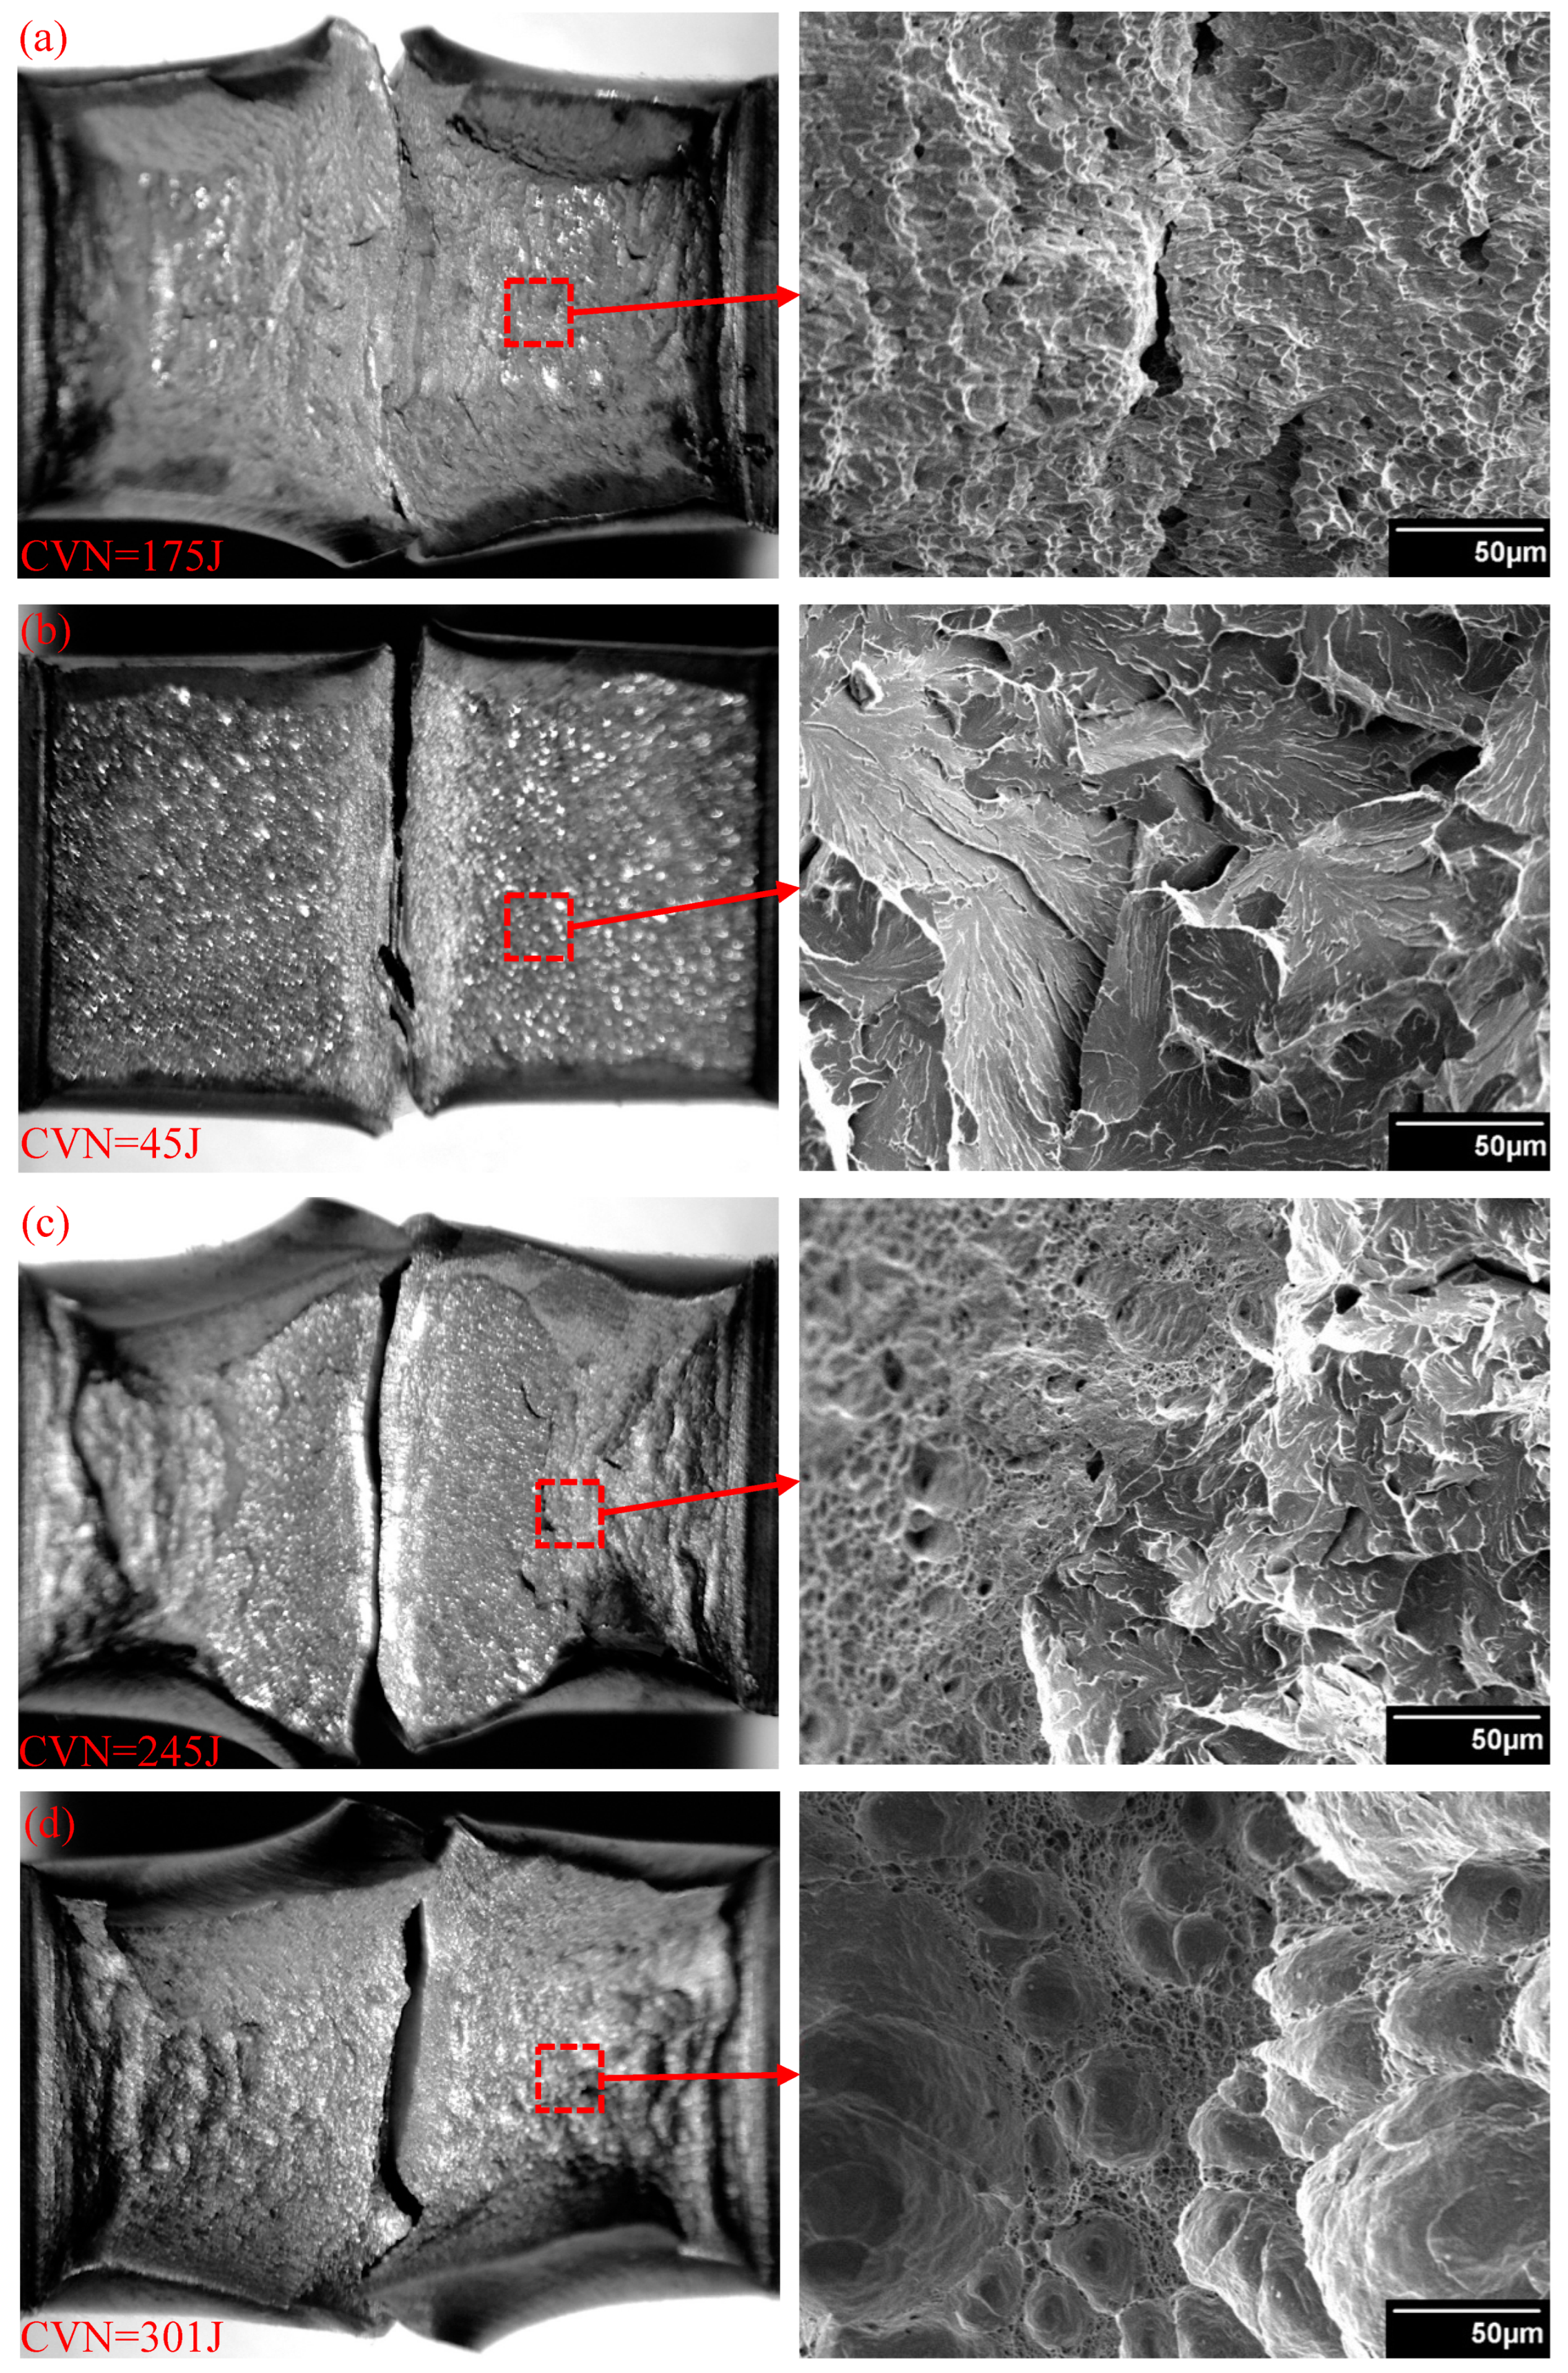
The macrographs of the broken Charpy samples with the lowest toughness values at different notch locations and the corresponding SEM fractography images are shown in Figure 14. The WM has undergone plastic deformation. Fine dimples are evident in Figure 14a for the ductile fracture, and the dimples have a small diameter and a shallow depth. At the same time, there are also river patterns in the fracture. These patterns originated in the grain interior and extended outwards, reflecting the characteristics of the quasi-cleavage fracture. A brittle cleavage fracture mainly occurred near the FL. As can be seen from Figure 14b, there are a large number of fan-shaped river patterns at the fractures; the patterns originate from the grain boundary, and a considerable part of the cleavage steps appear. These characteristics indicate that the FL was poorly shaped and was susceptible to fracture hazards. The main part of the HAZ penetrated 2 mm outside the FL. It can be observed from the SEM fracture analysis in Figure 14c that ductile fracture occurred first, followed by brittle fracture. A large number of dimples are distributed at the fracture; the density of the dimples is higher than that of the weld fracture, and the size and depth of the dimple are larger and greater than those of the dimples at the weld, respectively. Therefore, the toughness there was higher than those at the WM and FL. Figure 14d shows that ductile fracture also occurred mainly at FL + 5. Compared with the fracture surface at FL + 2, the dimples at FL + 5 had a pronounced tensile morphology, which was probably due to tear or shear stress. These dimples, which stretched in the direction of the stress, had a greater depth than the dimples at the previously measured position, so the toughness was higher there than at the other measured locations.
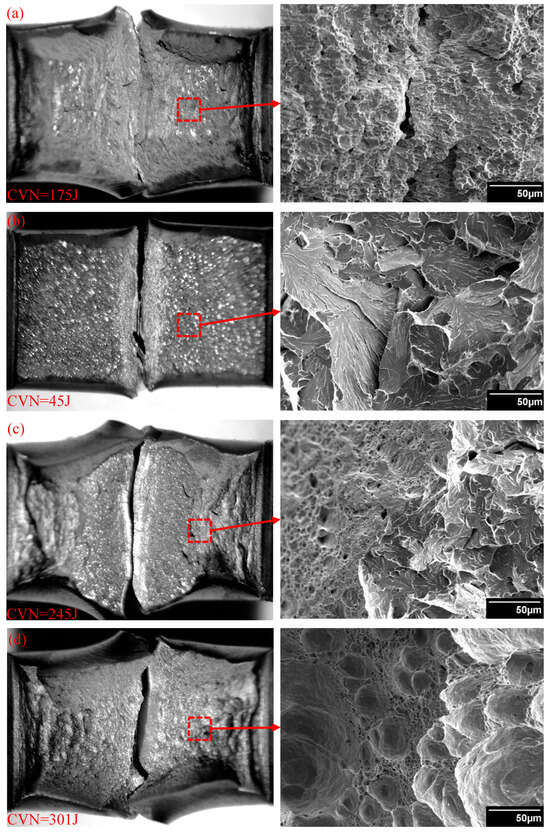
Figure 14.
Fracture surfaces at different notch locations of the original weld: (a) WM, (b) FL, (c) FL + 2, and (d) FL + 5.
4. Investigation of Thermally Simulated CGHAZ
4.1. Influence of Heat Input (HI) on Simulated CGHAZ
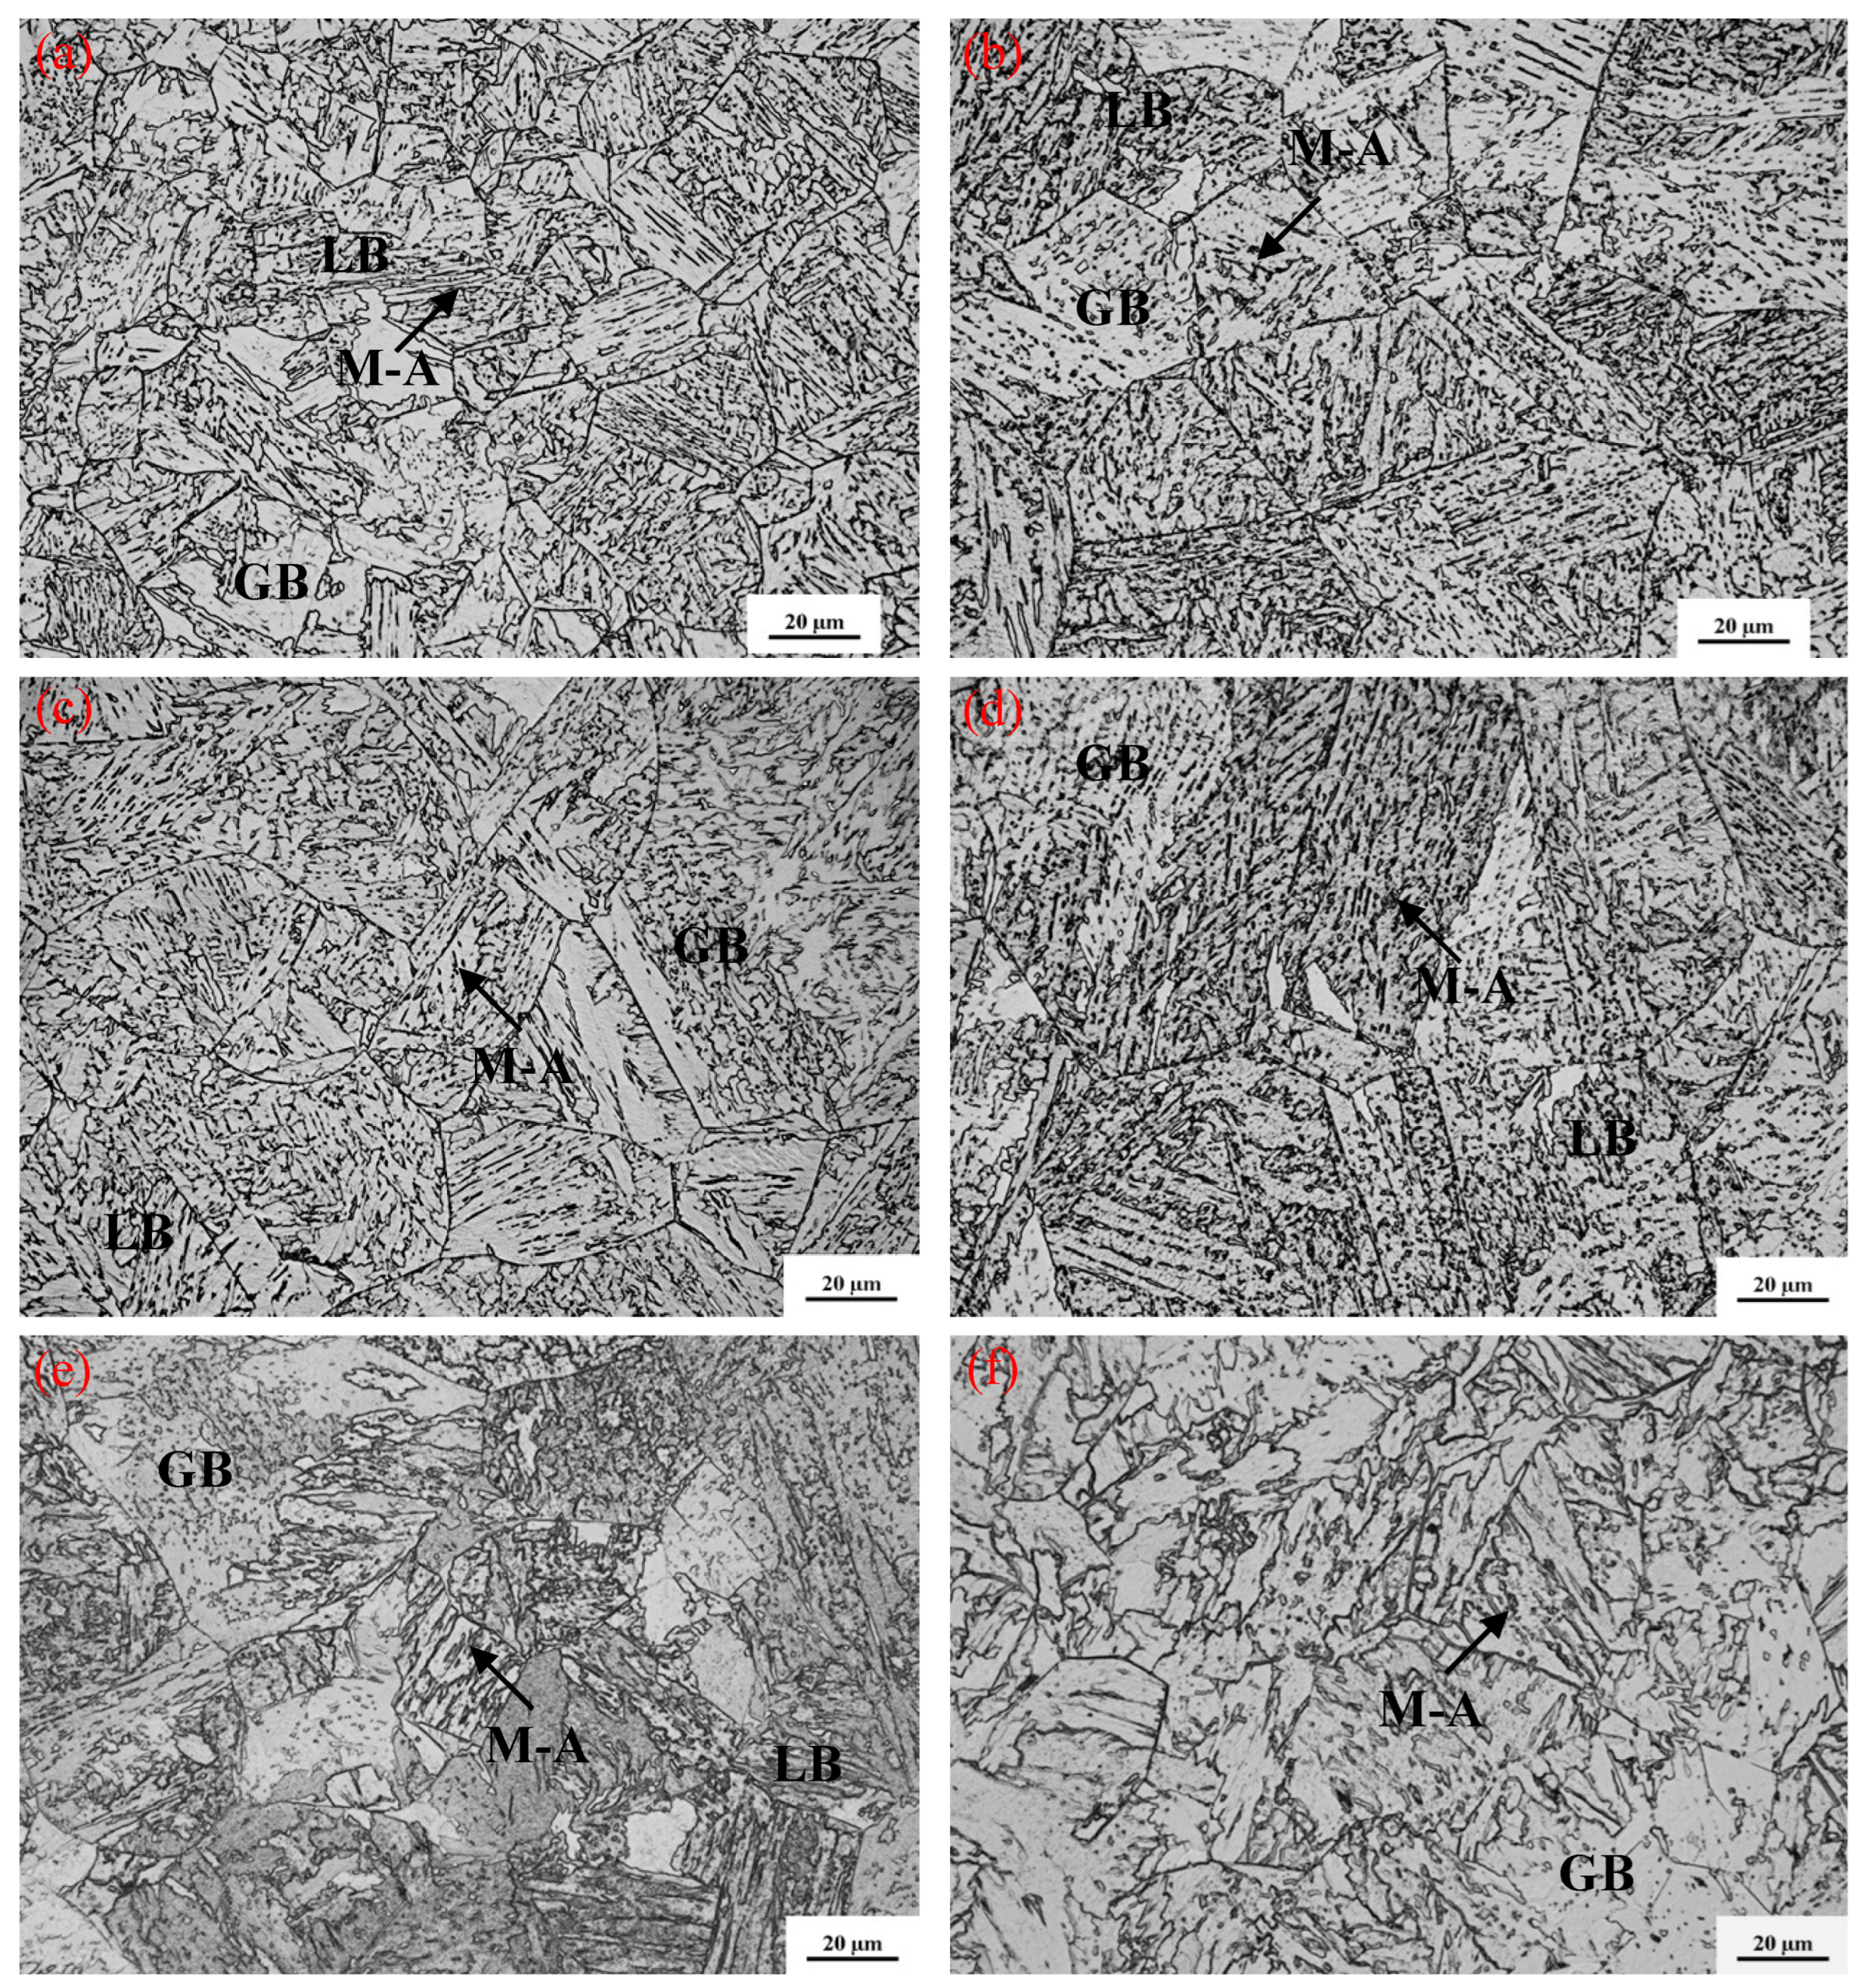
The micrographs of the CGHAZ simulated at different HIs, as shown in Figure 15, reveal the prior austenite grain boundaries. The microstructures of the simulated CGHAZ were composed of lath bainite (LB) and granular bainite (GB) and an aligned second phase was assumed to be M–A islands. The LB ferrite is mostly lath shaped, and the M–A constituent (black slender island) can be observed between the ferrite laths. The GB ferrite is very massive, and a large number of small black islands (the M–A constituent) are scattered in the massive GB ferrite. Figure 15c presents the identical microstructure with the actual weld CGHAZ (Figure 11d). During the cooling process, the carbon atoms diffused from the ferrite lath to the untransformed austenite. When the carbon concentration reached a critical value and the carbon-rich austenite cooled to a temperature below the martensite start temperature (Ms), the remaining austenite partially transformed to martensite. This combination of transformed martensite and untransformed austenite, commonly observed in the CGHAZ of these steels, is referred to as the M–A constituent.
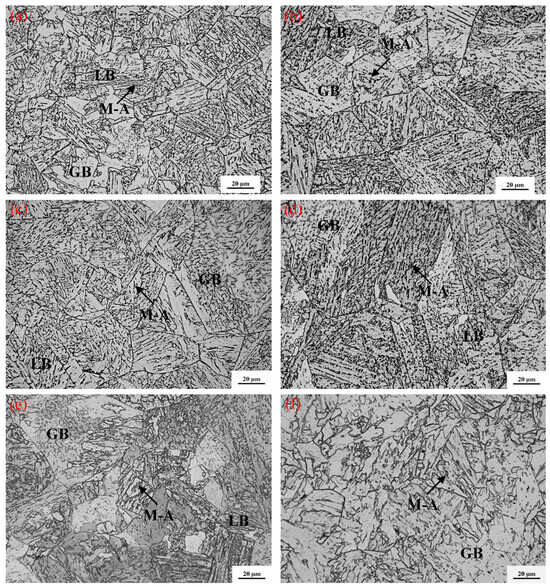
Figure 15.
Microstructures of CGHAZ samples simulated at different HIs: (a) 3.2 kJ/mm, (b) 3.7 kJ/mm, (c) 4.2 kJ/mm, (d) 5.5 kJ/mm, (e) 78.83 kJ/mm, and (f) 111.48 kJ/mm. GB: granular bainite, LB: lath bainite, and M–A: martensite–austenite constituent.
The bainite sheaf nucleated and grew from prior austenite grain boundaries, and some of the packets originating from different prior austenite grains were interconnected. With increasing heat input, the amount of LB decreased and that of GB increased drastically. At low heat-input parameters and accordingly high cooling rates, the phase transformation occurred in the simulated CGHAZ at a high degree of super cooling, and carbon diffusion was slowed owing to the low carbon content of the γ/α interface. This led to ferrite formation and the subsequent formation of lath bainite [40]. At high heat-input parameters and accordingly low cooling rates, granular bainite formed (after ferrite nucleation), possibly resulting from carbon diffusion into the austenite. This diffusion increased the carbon concentration of the austenite, leading to a decrease in the γ→α phase-transformation temperature [40,41]. It is also observed that the M–A constituent coarsened obviously, and the proportion of the M–A constituent increased continuously with increasing HI. At a HI of 111.48 kJ/mm, the microstructure of the simulated CGHAZ was composed of mainly GB and a large amount of the coarsening M–A constituent, as shown in Figure 15f.
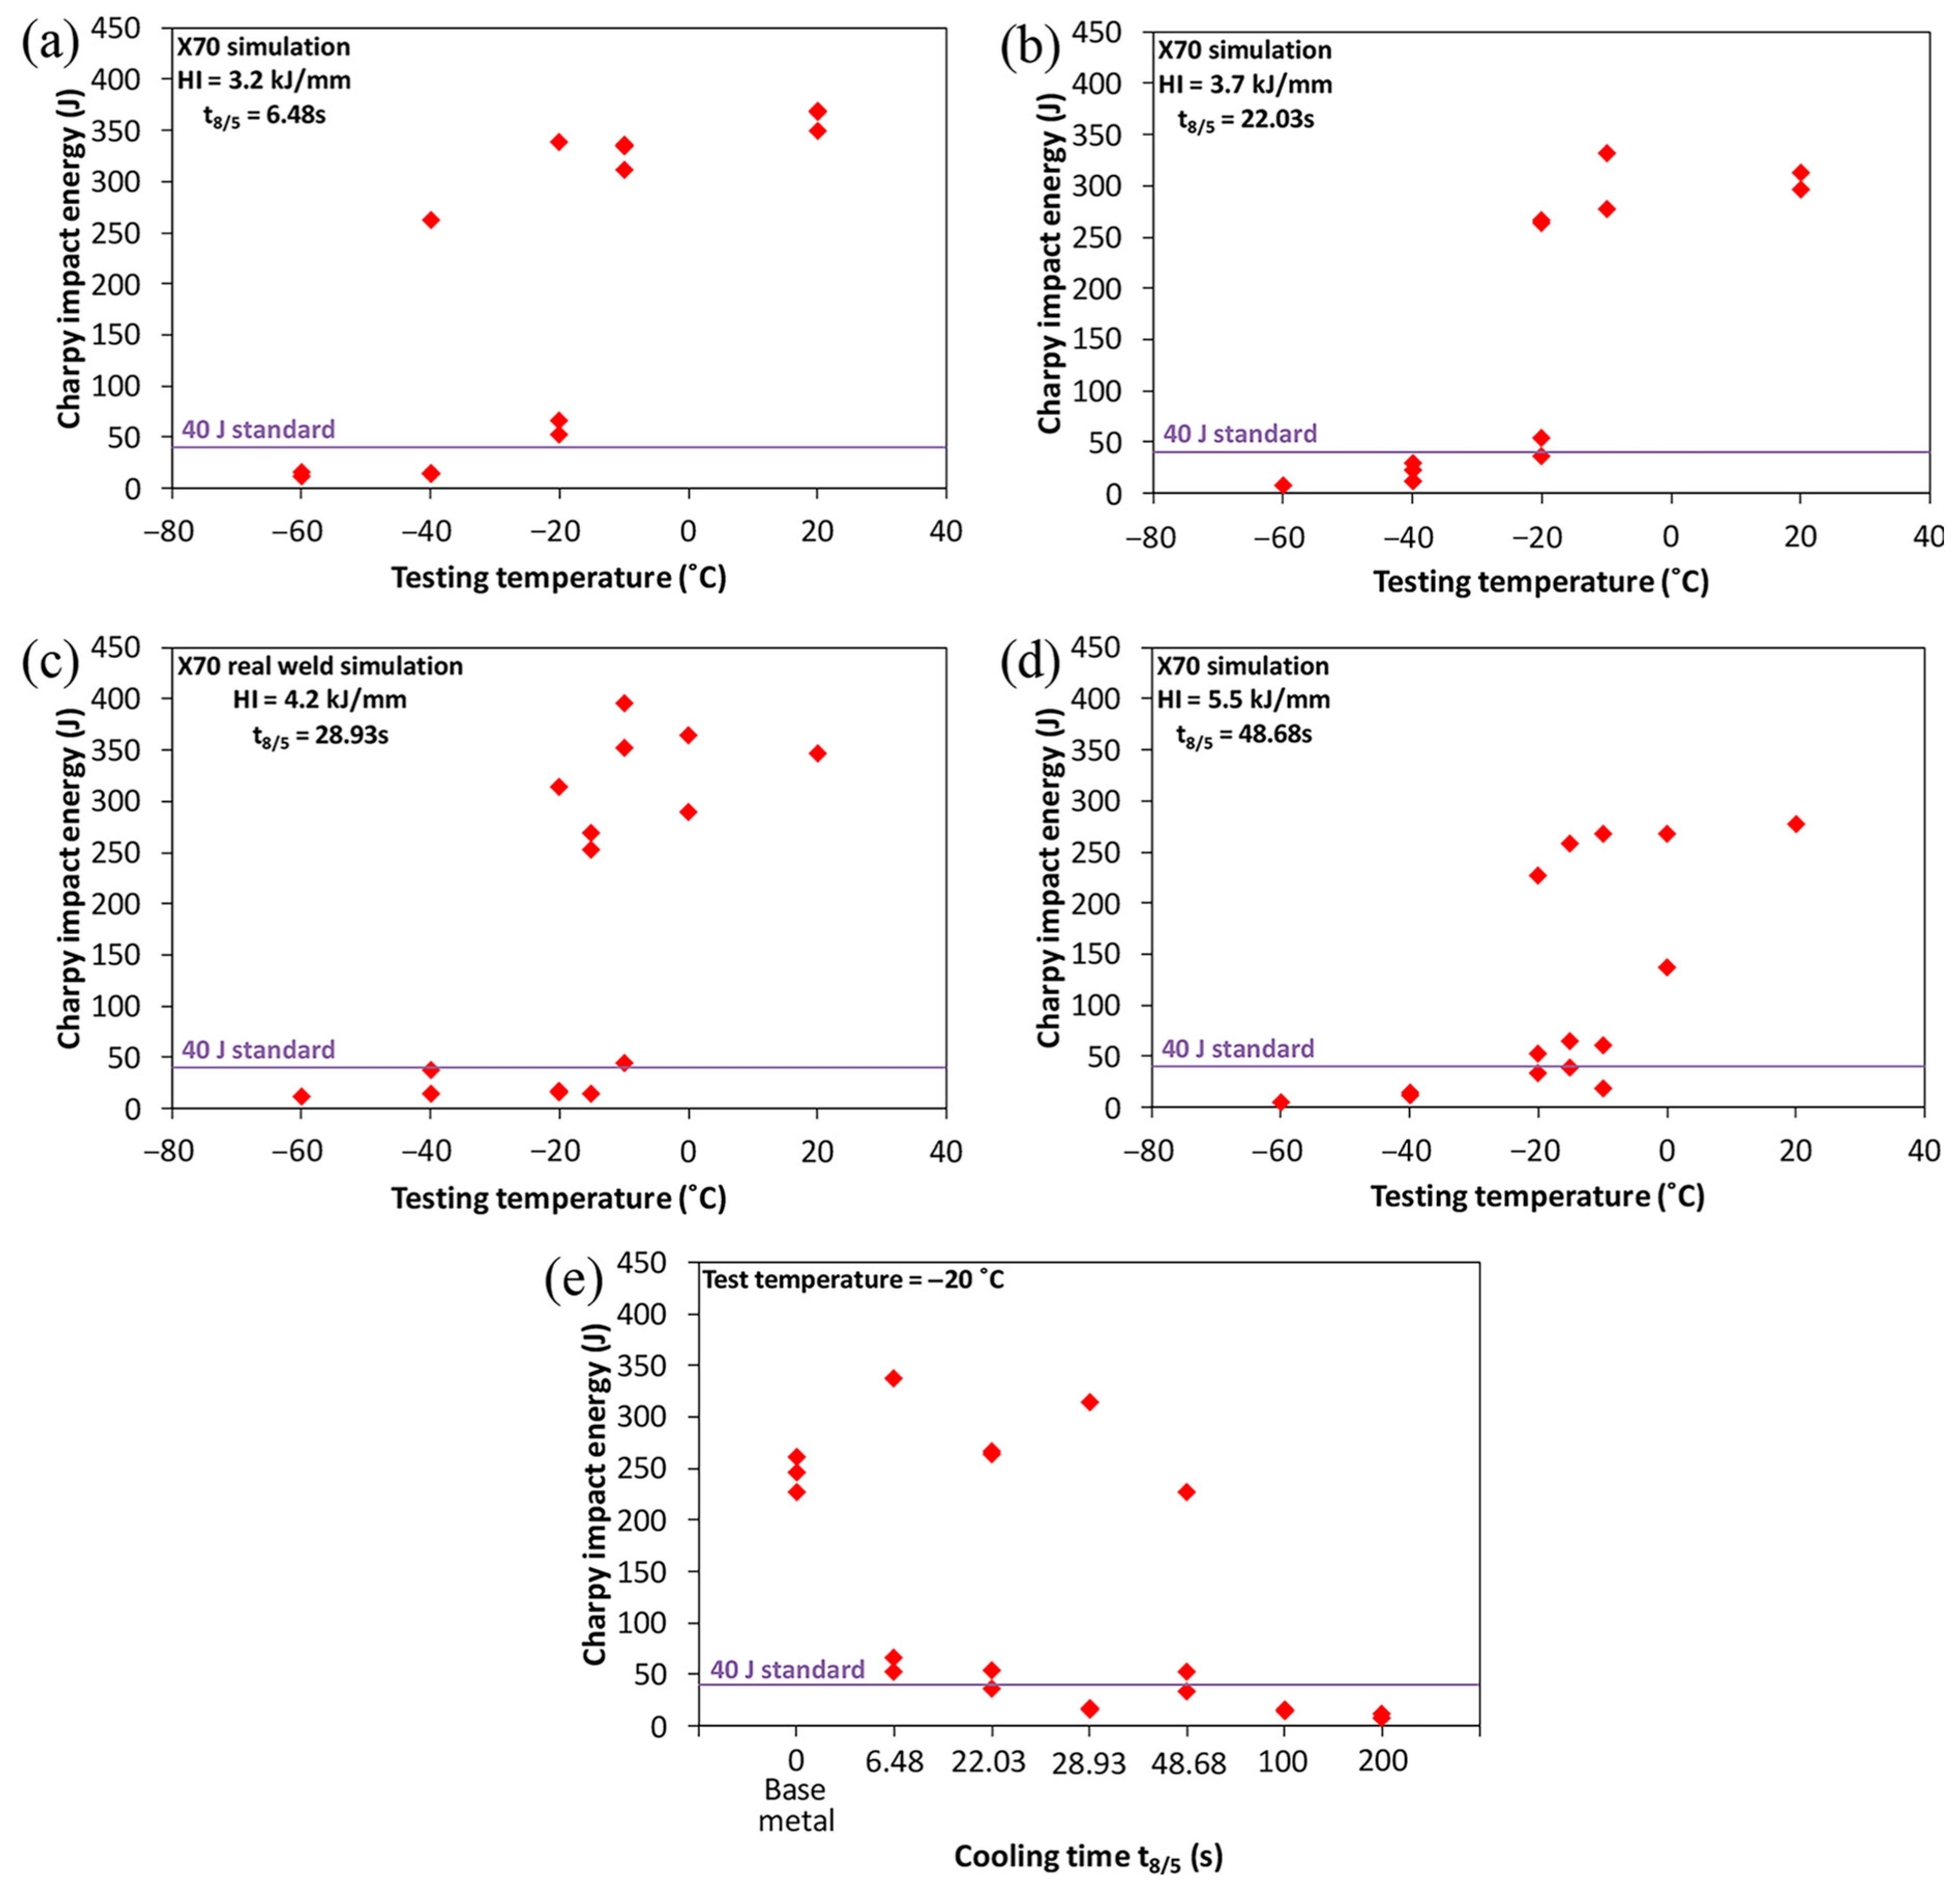
Figure 16 displays the variation in the Charpy impact energies for the CGHAZs simulated at various HIs measured at different testing temperatures. As expected, all the samples exhibited lower Charpy impact energies below −40 °C compared to values above −20 °C. However, the impact energy results in the temperature range from −20 to −10 °C were much more scattered than those at lower temperatures. This variability was attributed to the ductile–brittle transition temperature (TB) falling within the range from −20 to −10 °C. Some of the toughness values at a testing temperature of −20 °C were lower than the minimum requirement of 40 J. In addition, at temperatures above 0 °C, the toughness of all the tested samples was in the range of the upper shelf energy (USE), indicating excellent toughness.

Figure 16.
Impact toughness of CGHAZ samples simulated at different HIs and testing temperatures: (a) HI = 3.2 kJ/mm, (b) HI = 3.7 kJ/mm, (c) HI = 4.2 kJ/mm, and (d) HI = 5.5 kJ/mm. (e) Impact toughness of CGHAZ simulated at −20 °C and different heat inputs.
The difference in the fracture toughness at different heat inputs for each steel sample showed that the higher HI decreased the toughness when the temperature was above 0 °C. It was also observed from Figure 16e that the impact toughness of the CGHAZ simulated at −20 °C decreased with increasing HI. At higher HI values, a certain amount of bainite formed during the Δt8/5 cooling process, whereas following Δt8/5, the cooling rate was quite low and was equivalent to a long holding period. The bainite formed during Δt8/5 would be coarsened during a subsequent cooling process. The increase in the content of coarse stringers and the massive M–A constituent were also unfavourable to the fracture toughness.
4.2. Influence of PAGS on Simulated CGHAZ
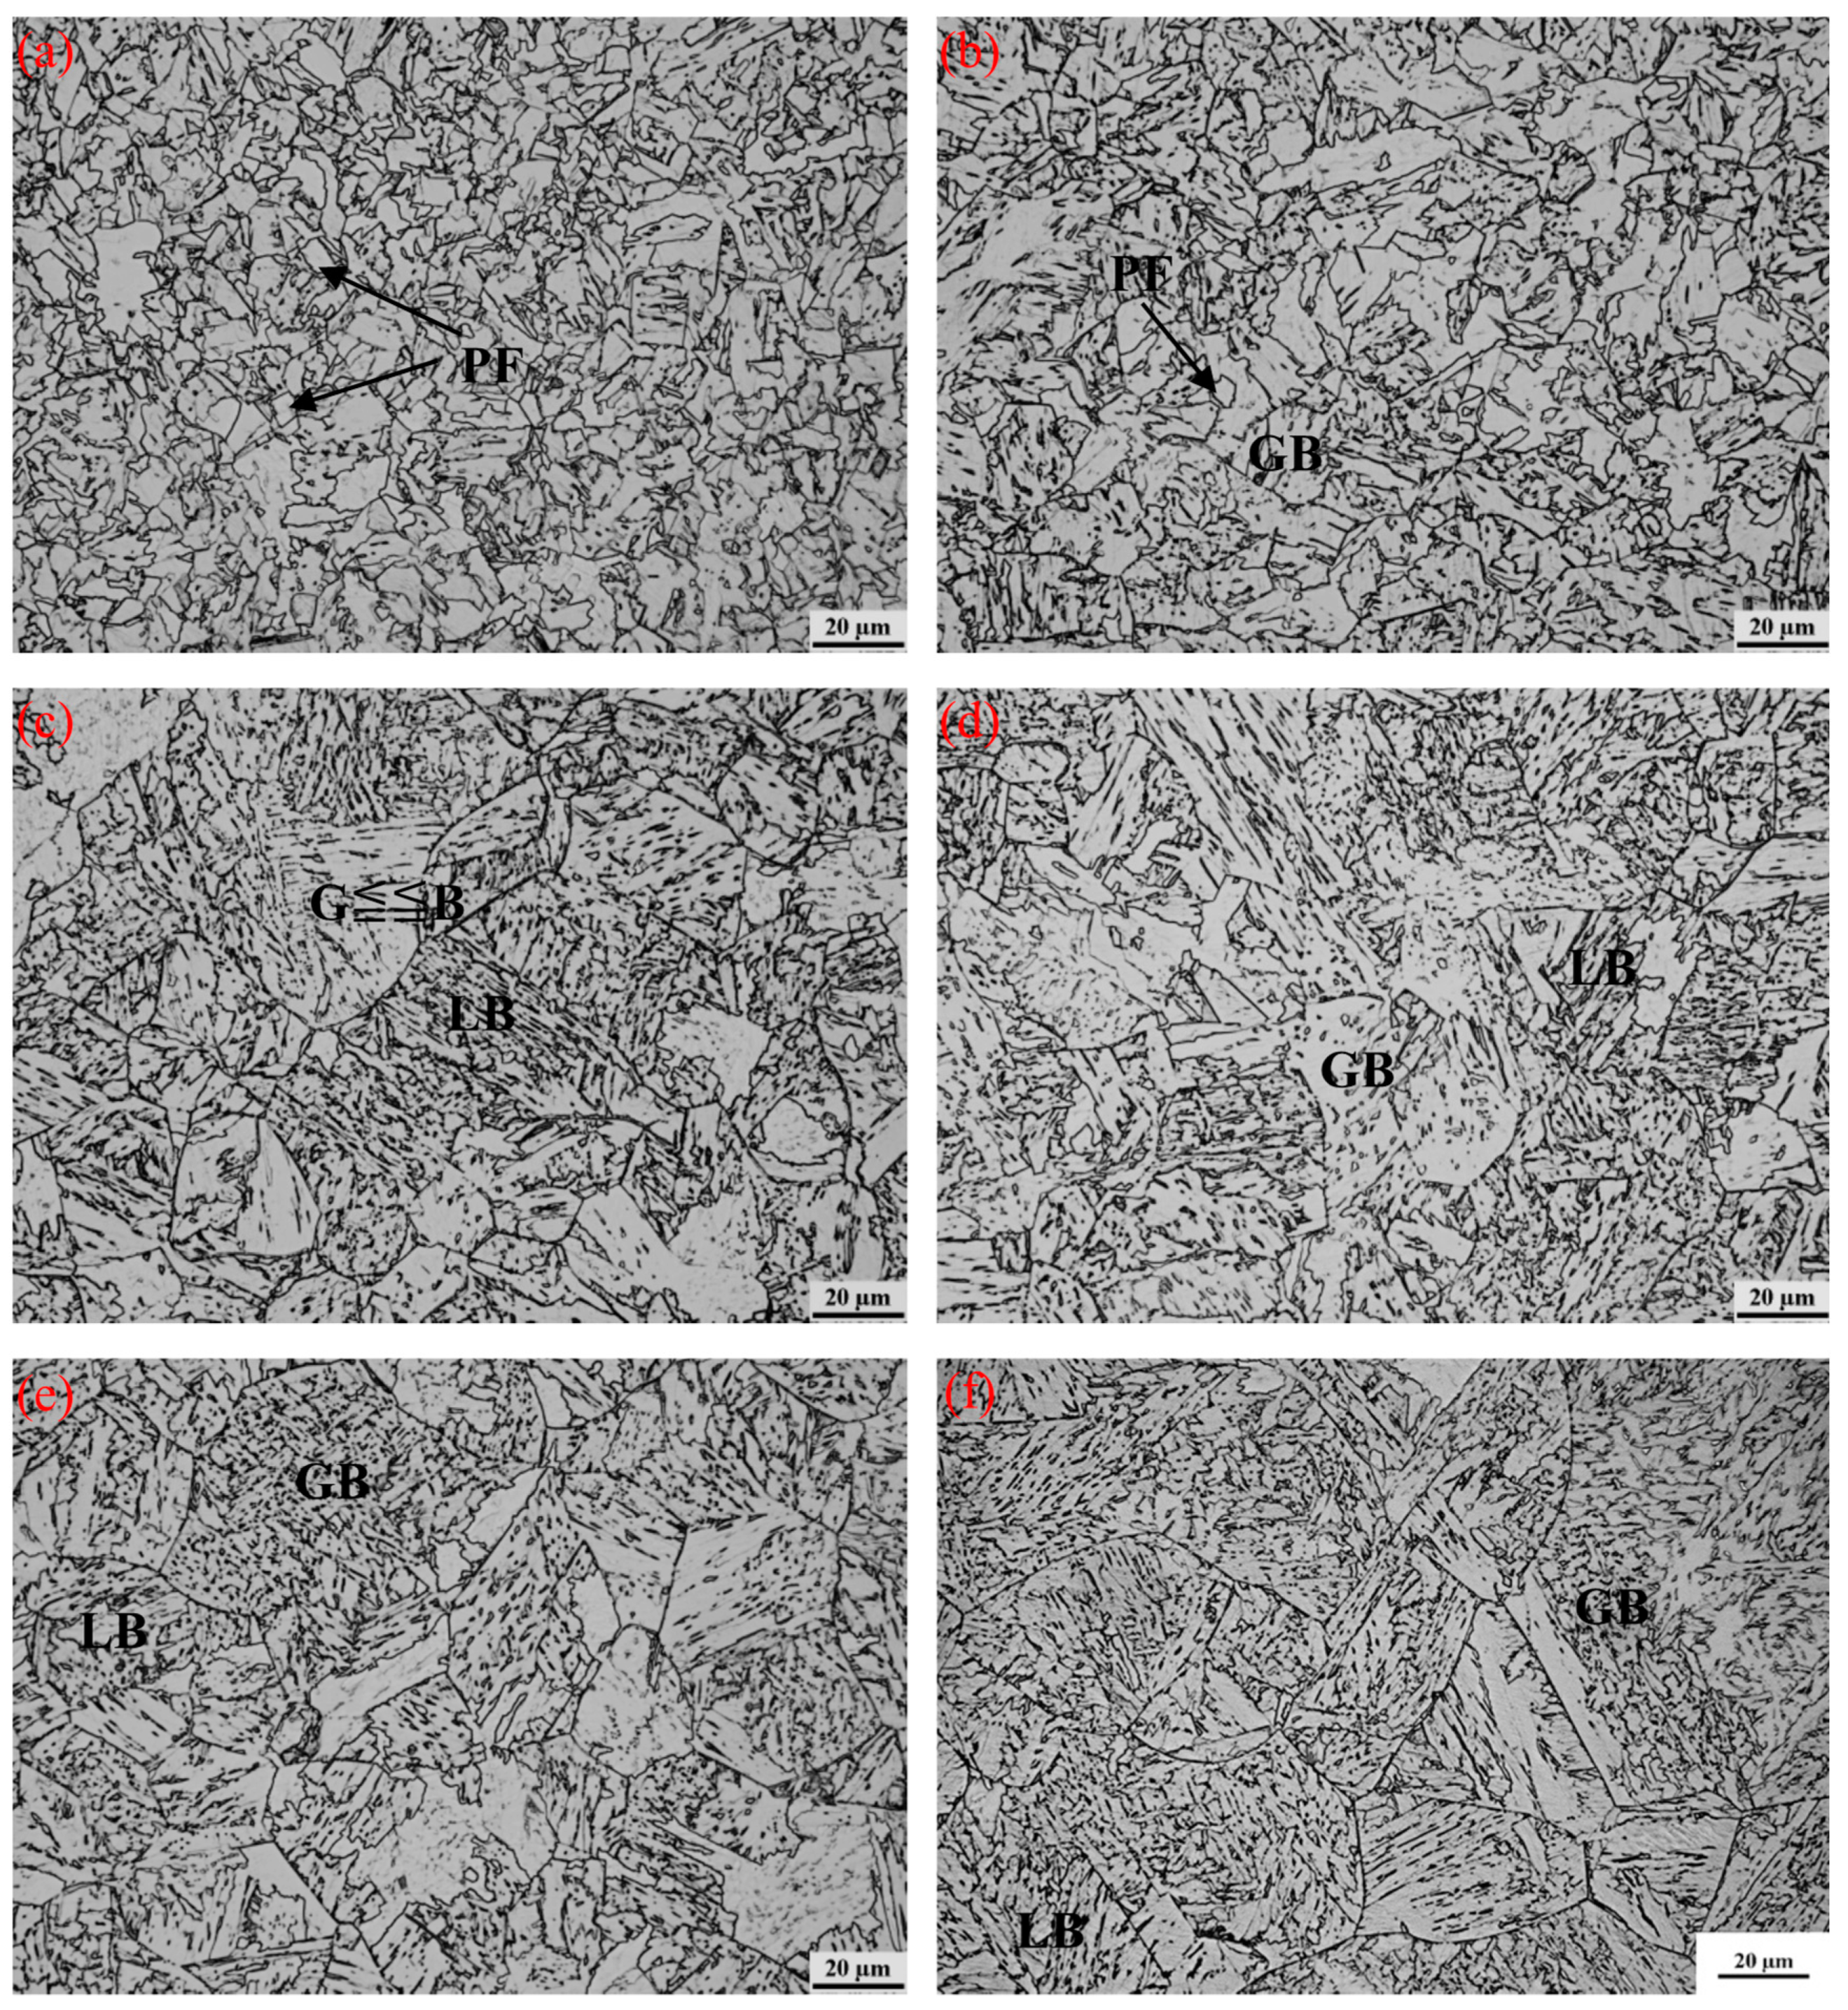
The microstructures of the HAZs simulated at different peak temperatures of 1000, 1100, 1200, 1250, 1300, and 1350 °C are shown in Figure 17. A thermal cycle with a peak temperature of 1000 °C resulted in an overall fine microstructure characterised by a mixture of polygonal ferrite and quasi-polygonal ferrite, along with the formation of some carbides. When the peak temperature was increased to 1100 °C, the current steel mainly consisted of fine bainitic ferrite with slight grain coarsening. At 1200 °C, there was a greater extent of austenite grain coarsening, leading to a predominant microstructure of large granular bainitic ferrite. Further increasing the peak temperature from 1250 to 1350 °C resulted in the continued growth of austenite grains and coarsening of microstructural features, while no significant changes in the microstructural constituents can be spotted.
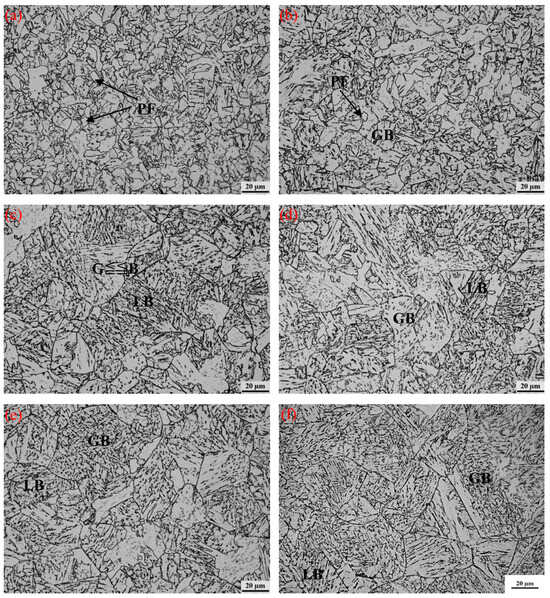
Figure 17.
Microstructures of samples thermally simulated using Gleeble at different peak temperatures (Tp1): (a) 1000 °C, (b) 1100 °C, (c) 1200 °C, (d) 1250 °C, (e) 1300 °C, and (f) 1350 °C. PF: polygonal ferrite, GB: granular bainite, LB: lath bainite.
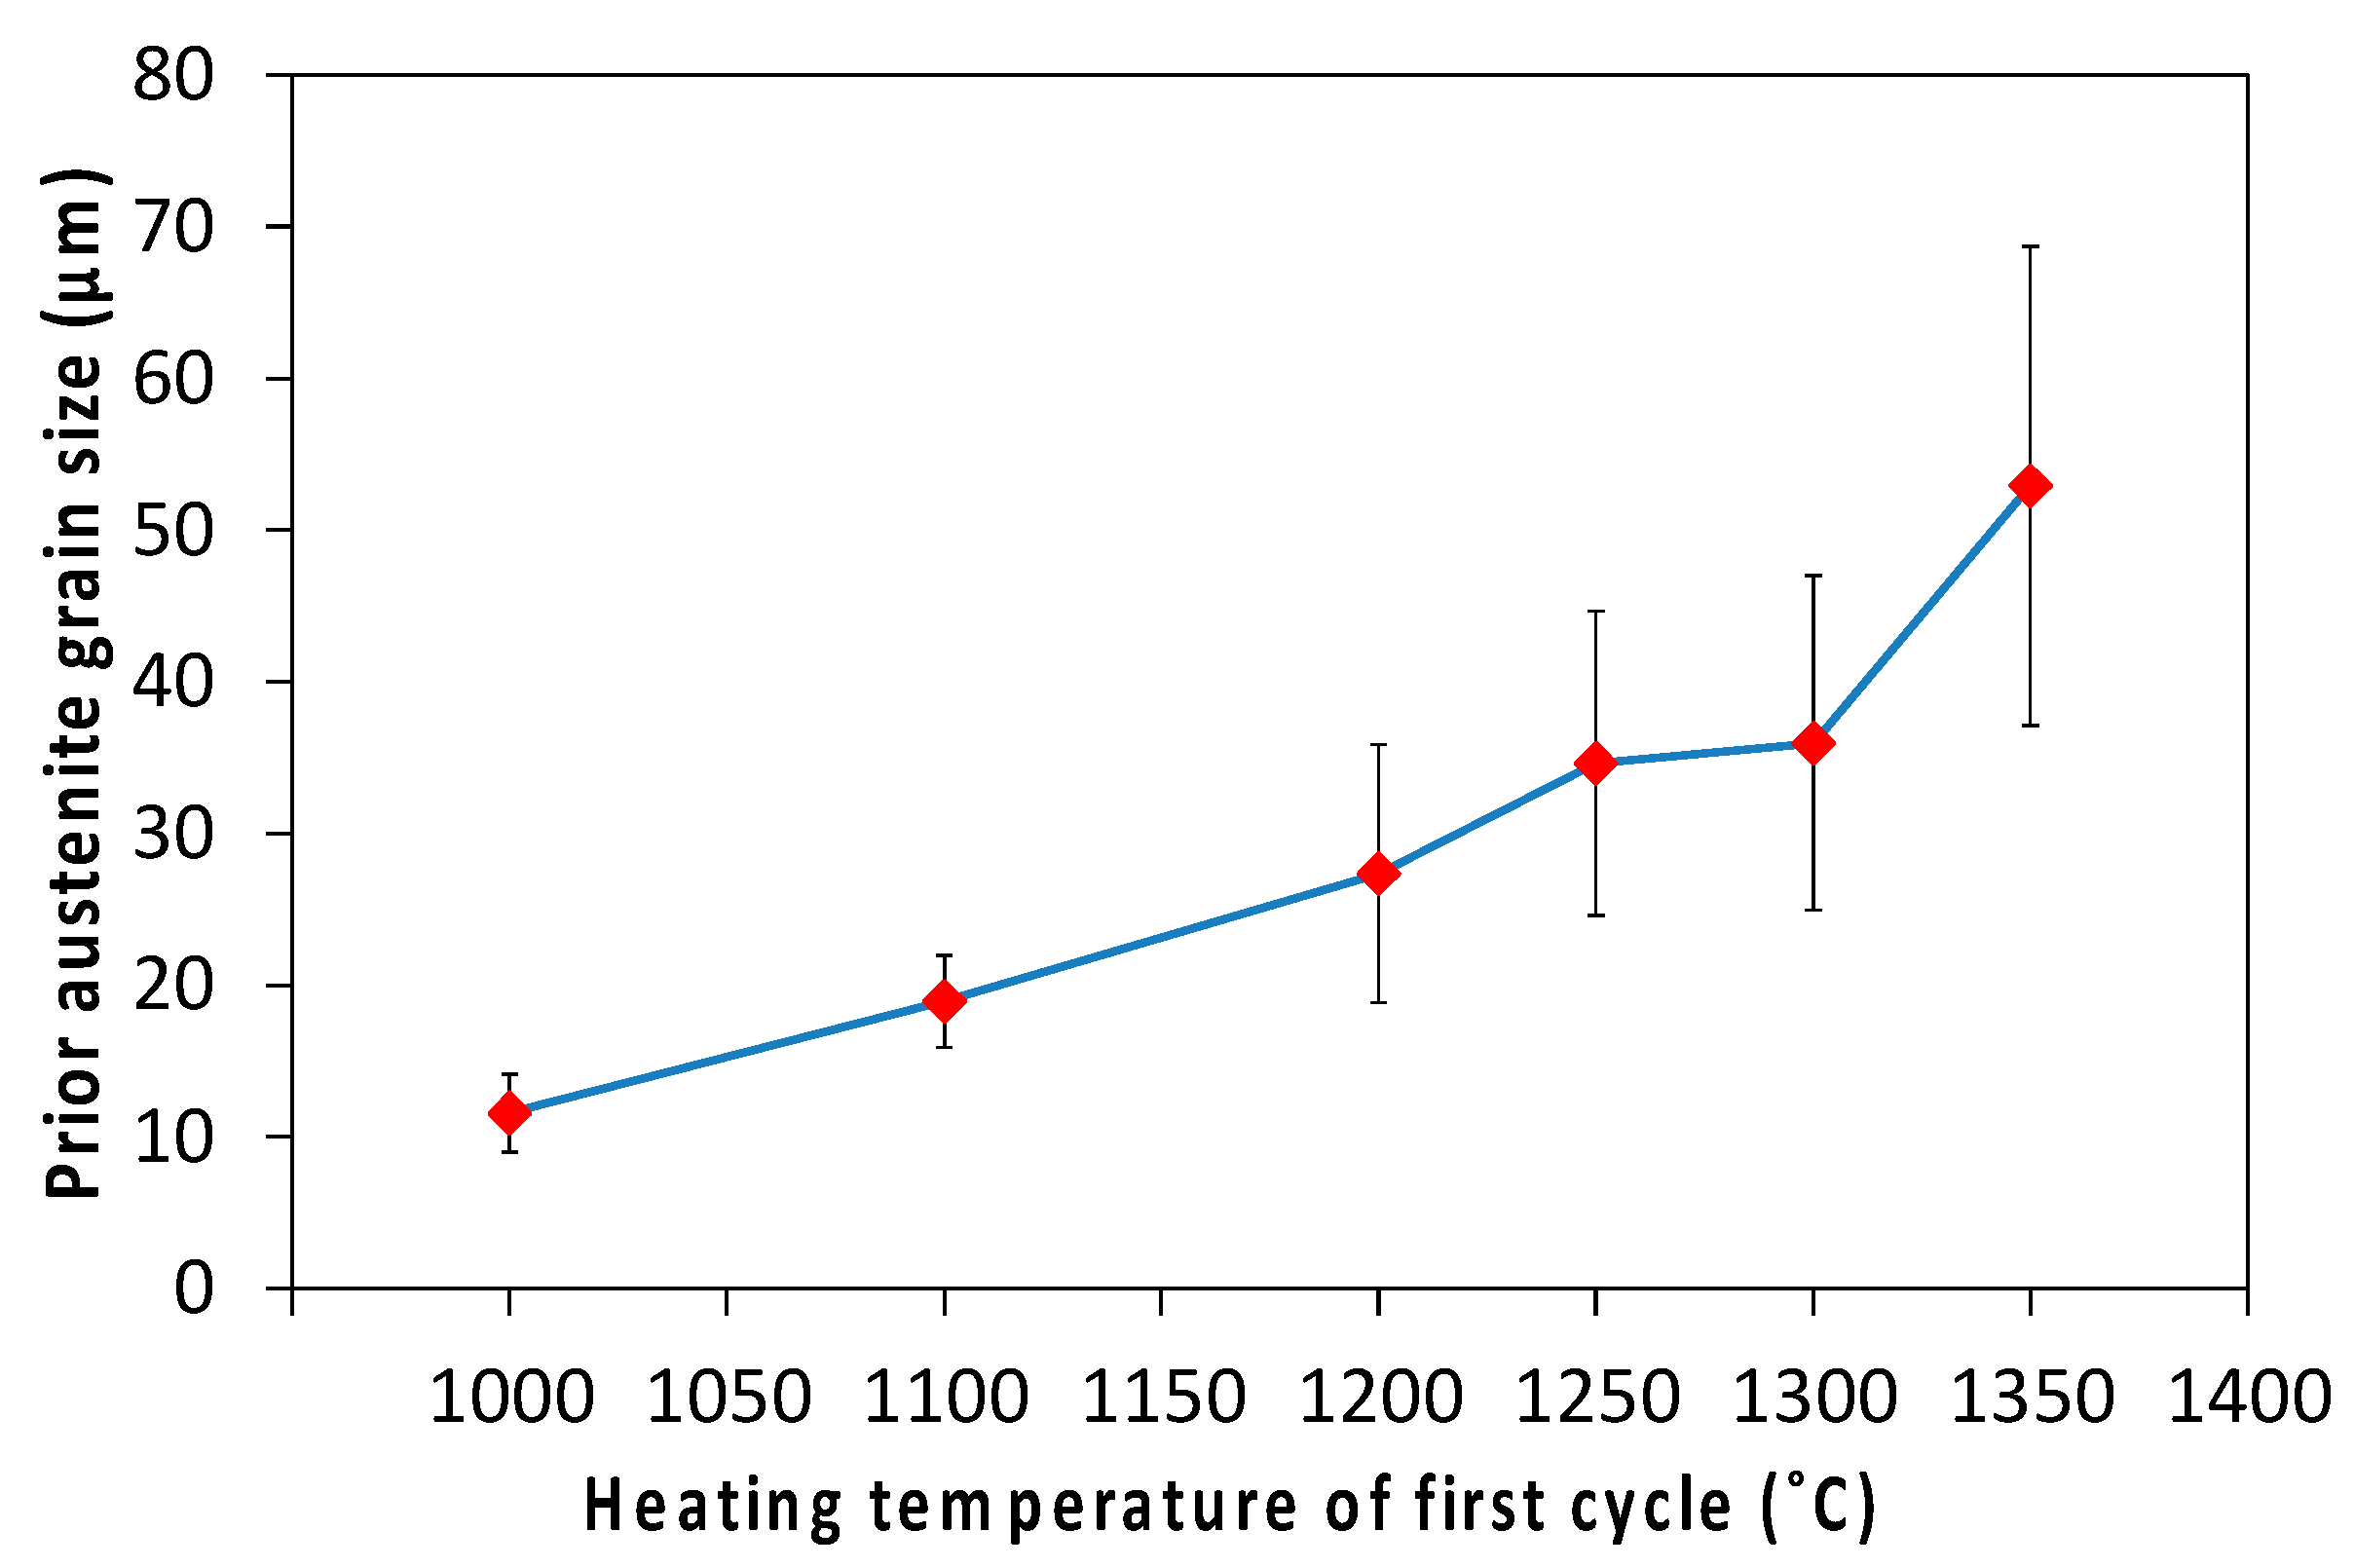
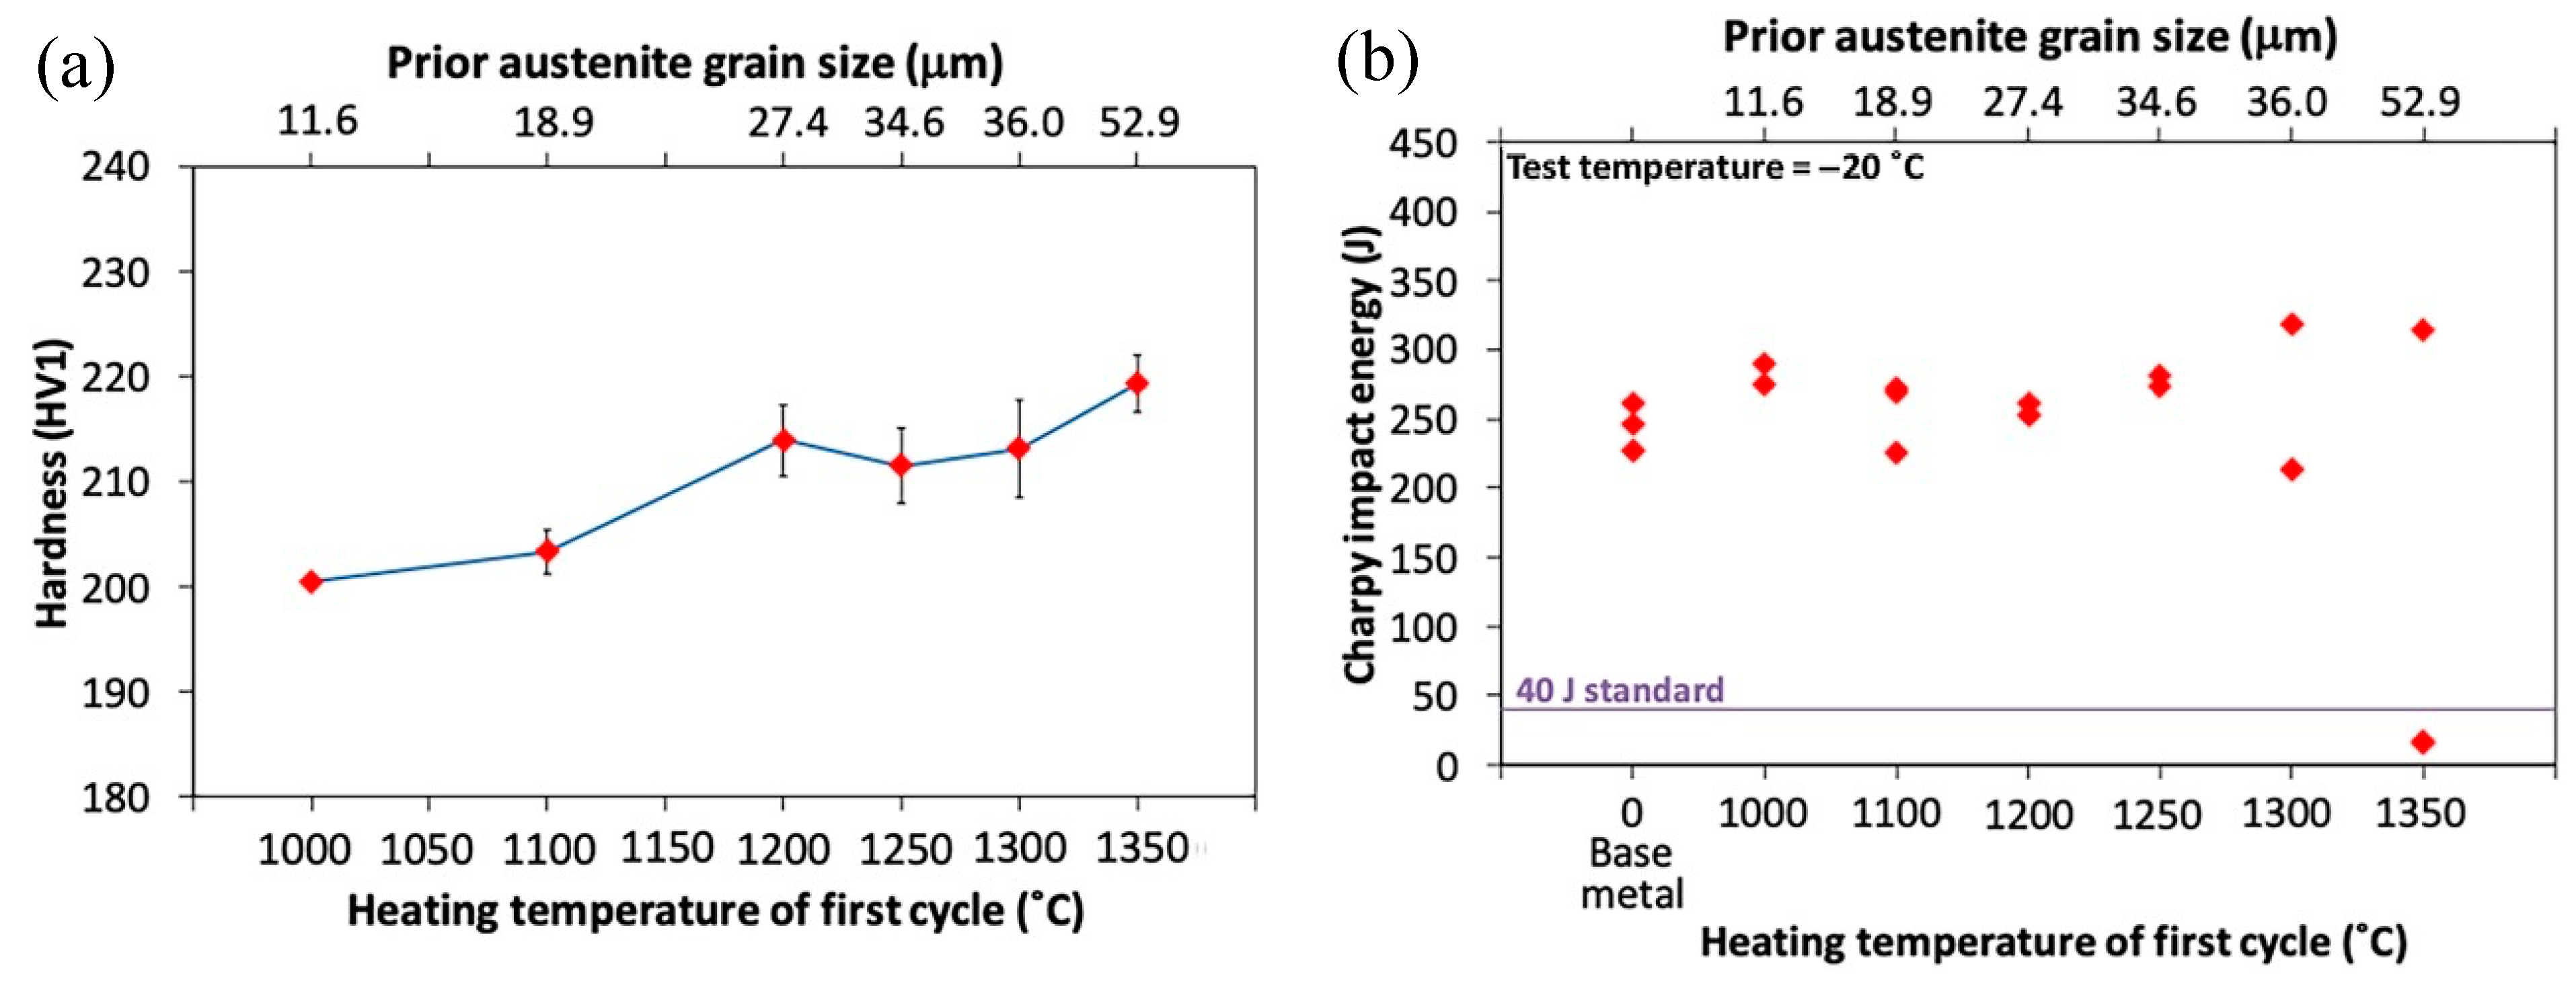
The average values of the PAGS are plotted in Figure 18, showing that this steel exhibited various degrees of grain coarsening with increasing peak temperature. The corresponding mechanical properties, including hardness and toughness, were also investigated. It is obvious from Figure 19a that the hardness values increased with increasing peak temperature from 1000 to 1200 °C owing to the corresponding increase in the PAGS and coarsening of the microstructural features. Interestingly, the further increase in the PAGS at peak temperatures of 1250−1350 °C had little effect on the hardness values. It should be noted that the microstructural constituents were apparently the same in this temperature range. It is also well known that hardness variations can reflect the microstructural constituents. Therefore, the hardness of the current steel slightly fluctuated in the range 210−220 HV1. Figure 19b shows the influences of different peak temperatures and the corresponding PAGSs on the toughness variation. The PAGSs of the samples subjected to a thermal cycle with a peak temperature from 1000 to 1250 °C gradually increased from 10 to 30 μm (Figure 18), leading to high impact toughness (220−290 J). When the peak temperature was increased to 1300 °C, the grain size remained virtually unchanged (Figure 18), while the toughness values were scattered. Increasing the peak temperature to 1350 °C promoted considerable grain coarsening (Figure 18), which resulted in one extremely low toughness value at −20 °C, below the standard of 40 J.
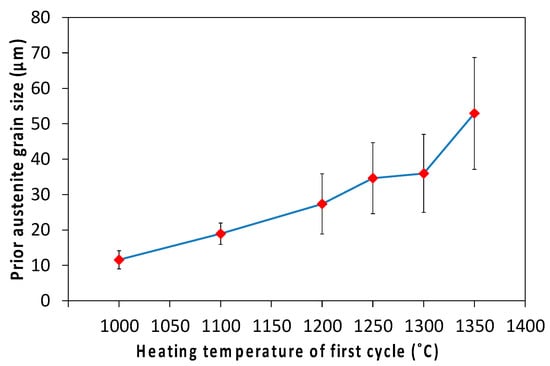
Figure 18.
Prior austenite grain size measurements at different peak temperatures.
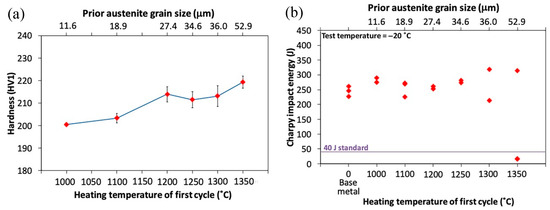
Figure 19.
Mechanical property variations as functions of peak temperature and PAGS in simulated CGHAZ samples: (a) Vickers hardness and (b) Charpy impact energy.
4.3. Influence of Thermal Treatment on Simulated CGHAZ
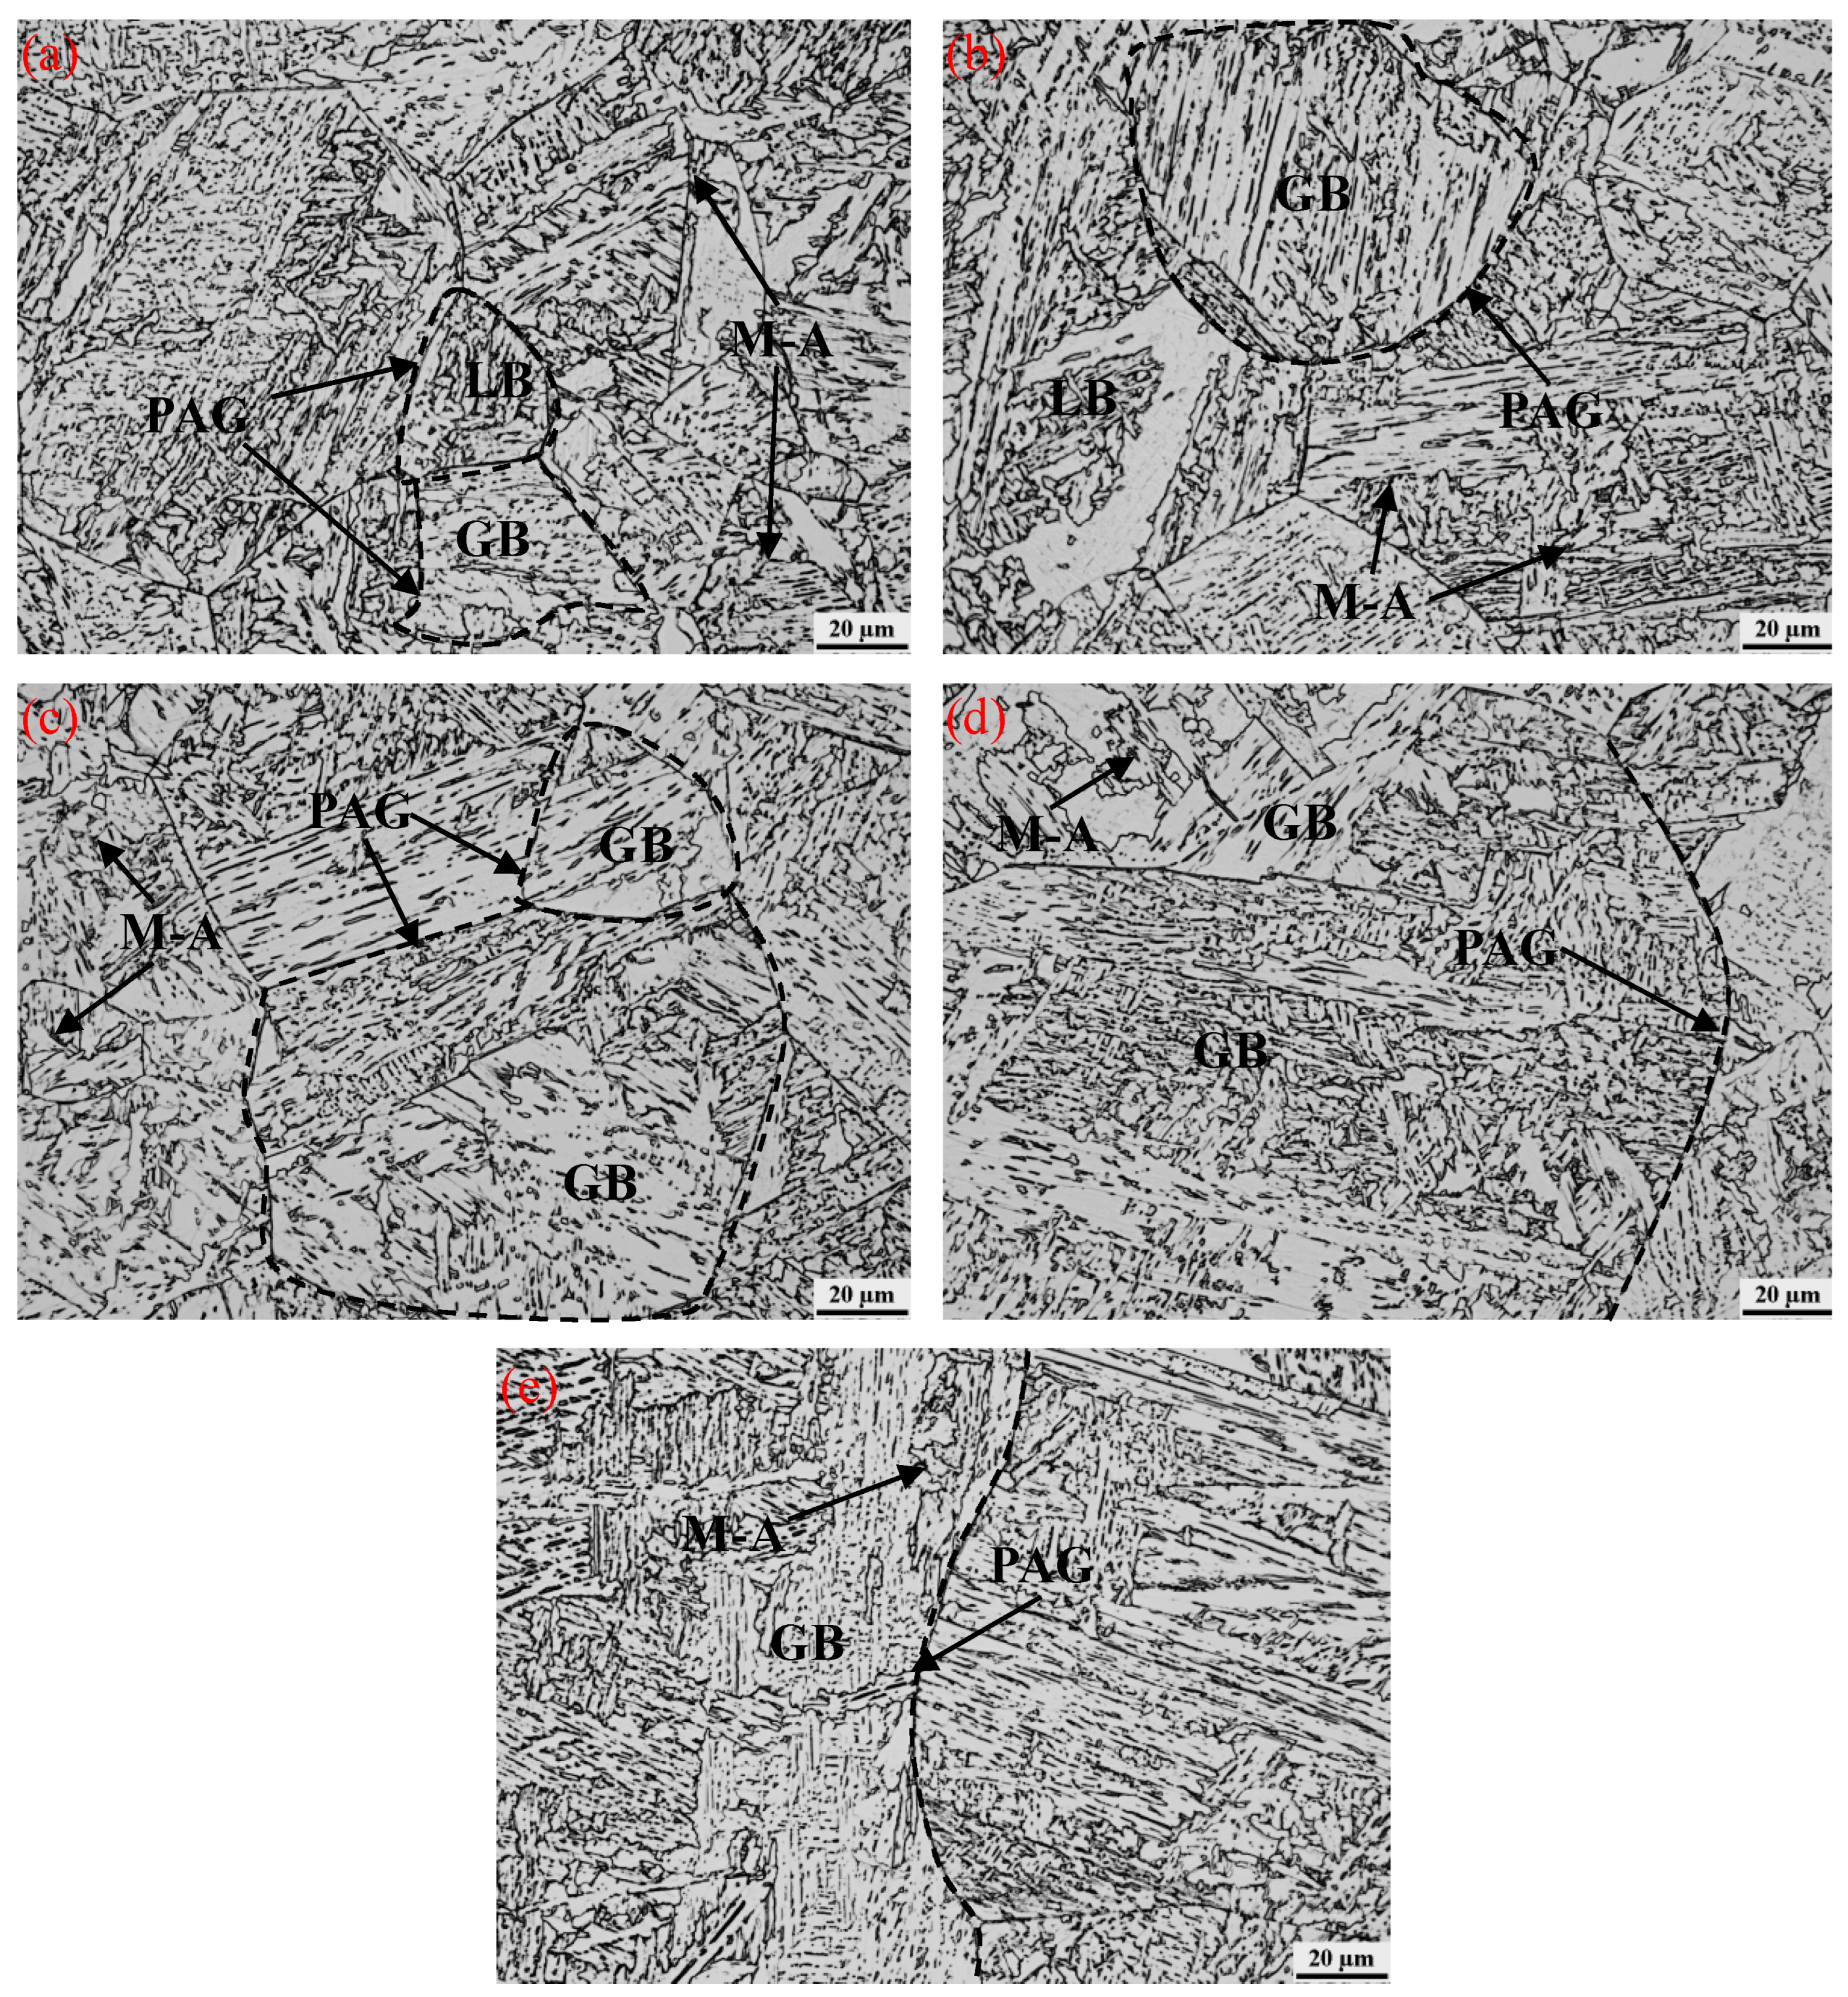
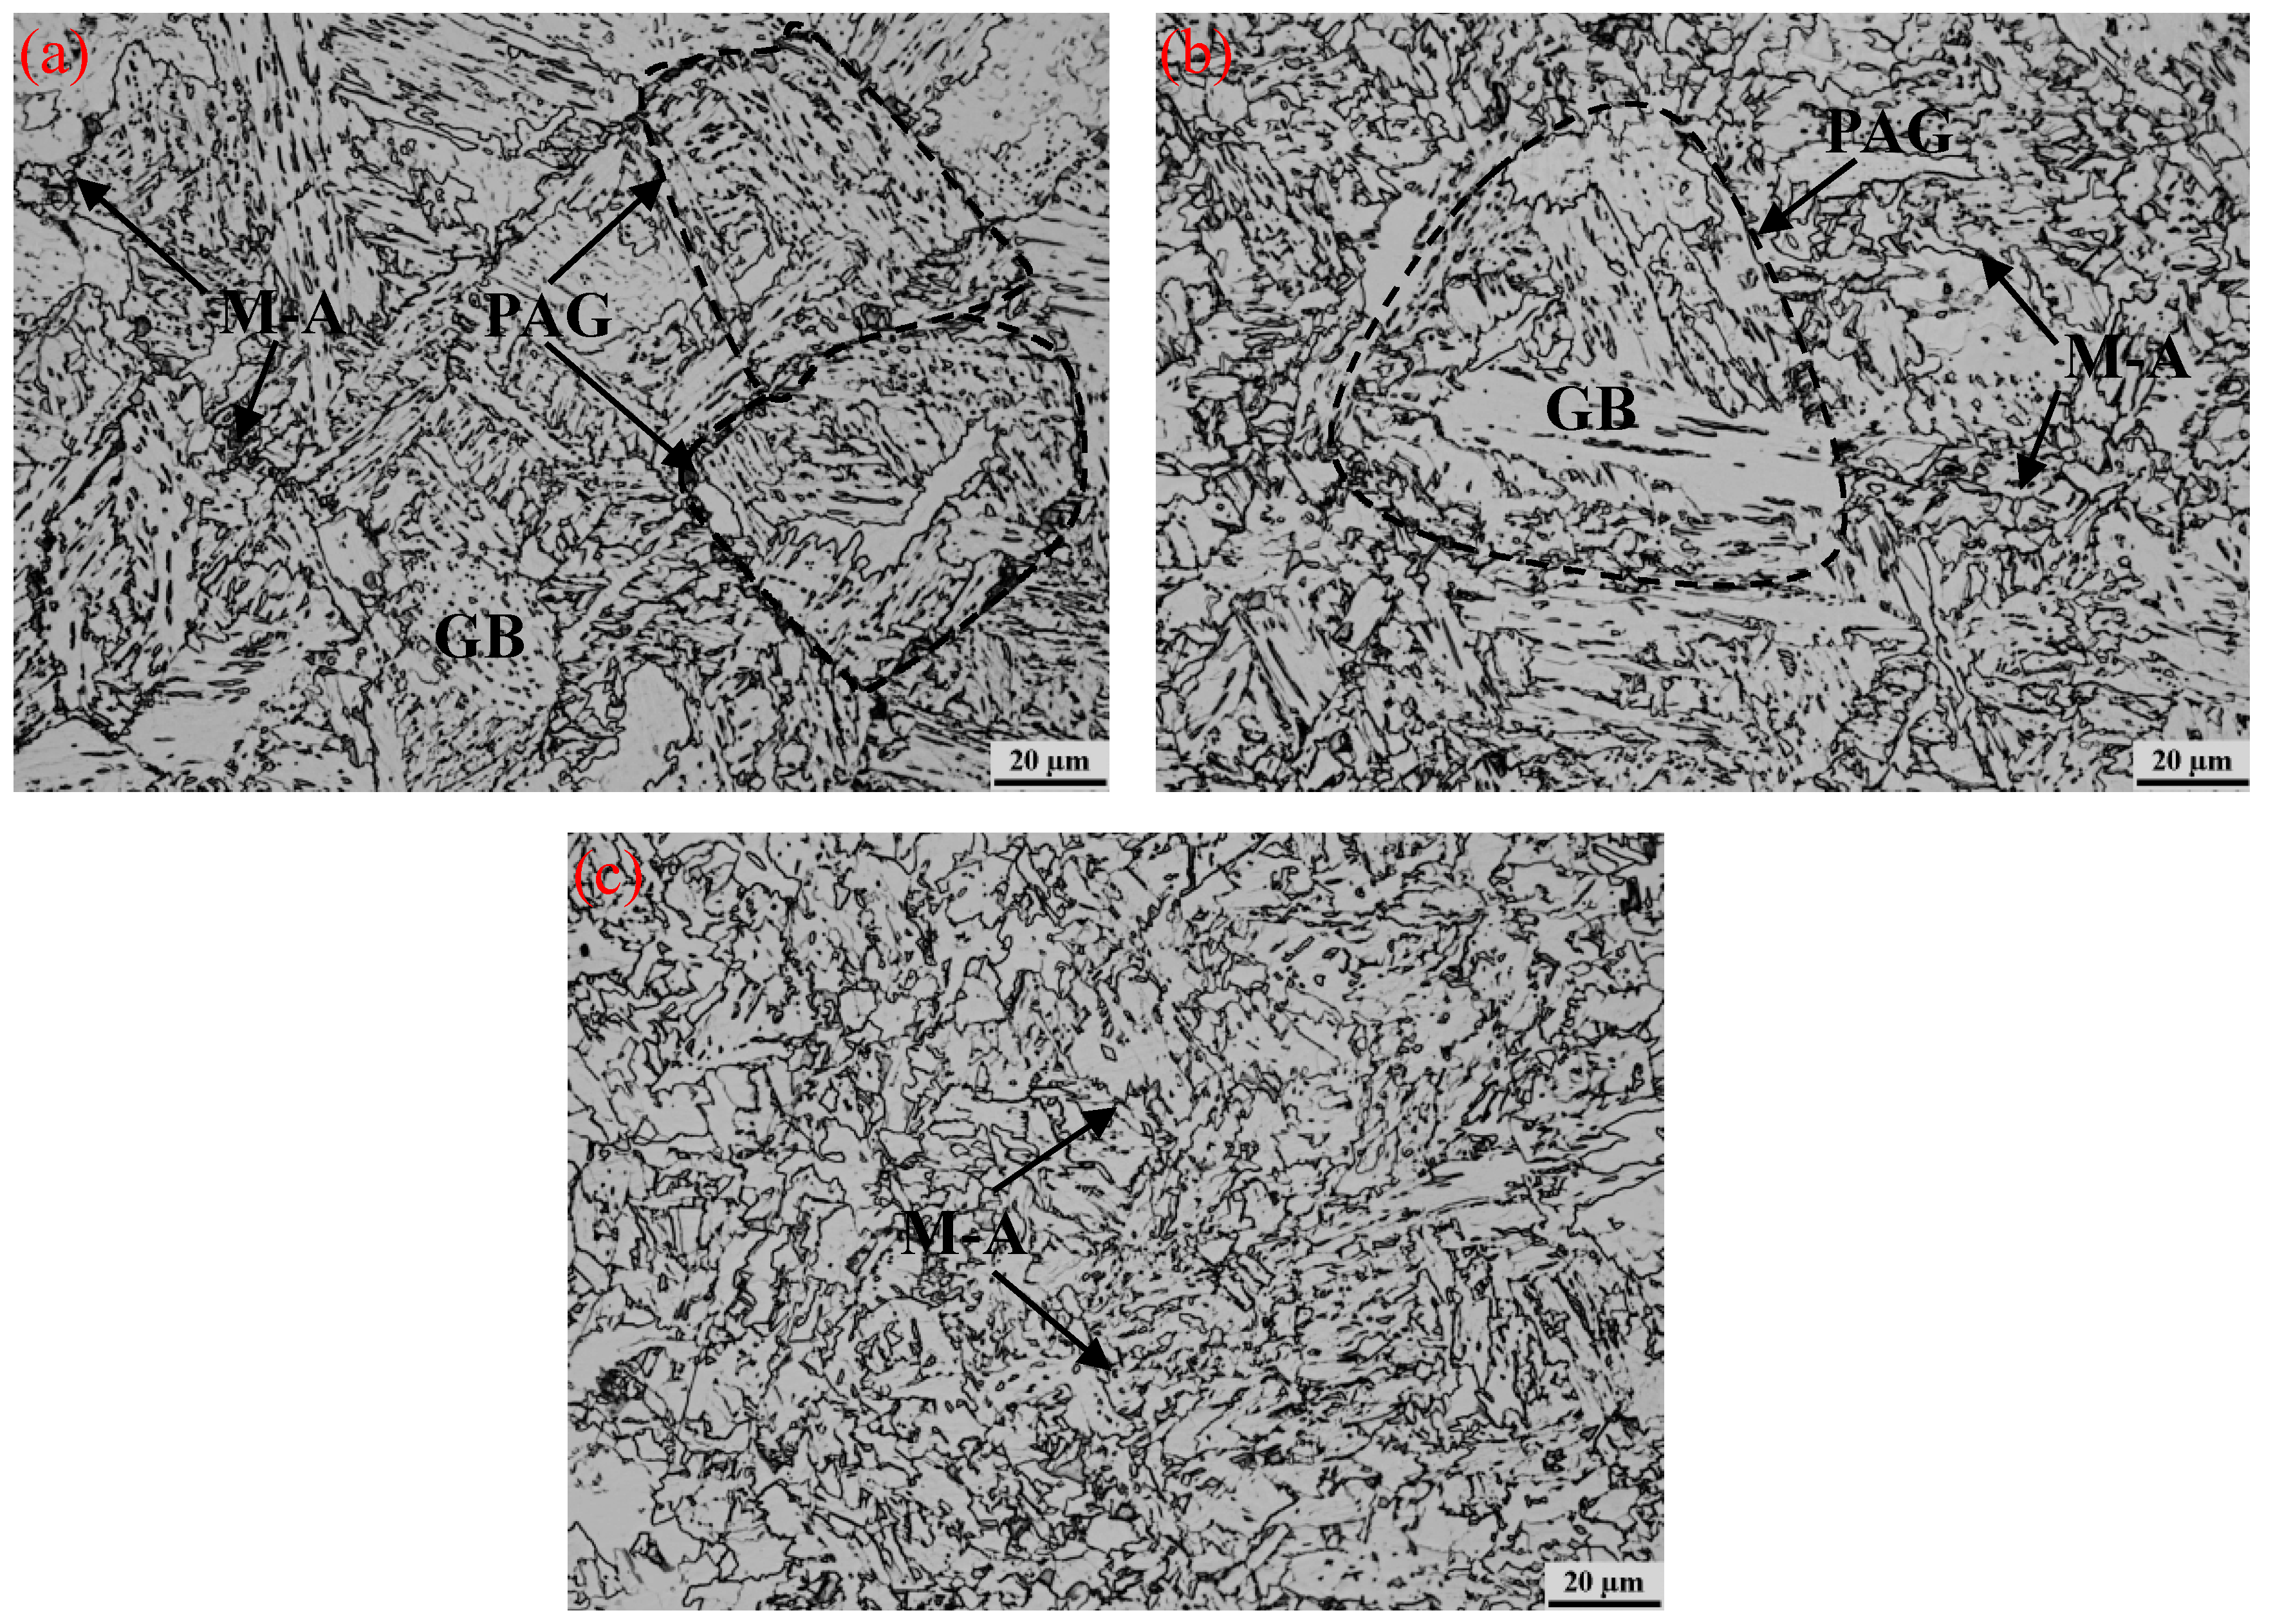
The microstructures of the CGHAZs at different peak temperatures of the thermal treatment are shown in Figure 20. The CGHAZs of all the specimens exhibited a typical bainitic structure with a mixture of lath bainite and granular bainite. These microstructural constituents remained unchanged as the thermal treatment peak temperature was increased from 600 to 800 °C. Moreover, increasing the peak temperature of the thermal treatment coarsened the microstructures of the CGHAZs in comparison to that observed in the original CGHAZ specimen with no thermal treatment (Figure 15c). Furthermore, the dispersed M–A constituent appeared to decrease with an elevation in the thermal-treatment peak temperature. An in-depth investigation into the fraction and size of the M–A constituent is critical to comprehensively understand its behaviour under varying thermal conditions.
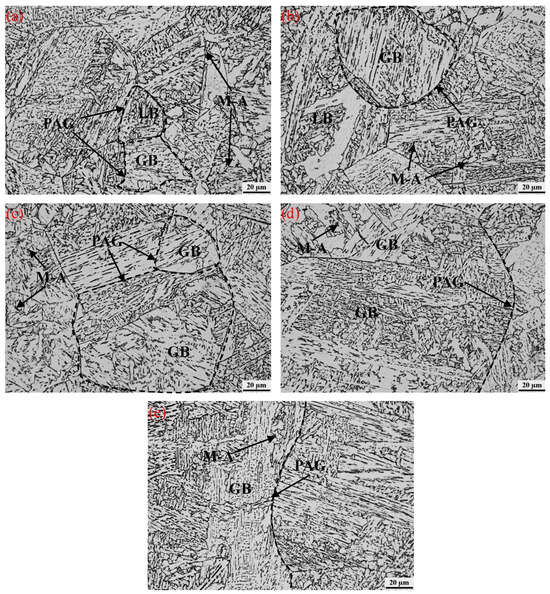
Figure 20.
Microstructures of simulated CGHAZ samples thermally treated at different peak temperatures: (a) 600 °C, (b) 650 °C, (c) 700 °C, (d) 750 °C, and (e) 800 °C. PAG: prior austenite grain, GB: granular bainite, LB: lath bainite, and M–A: martensite–austenite constituent.
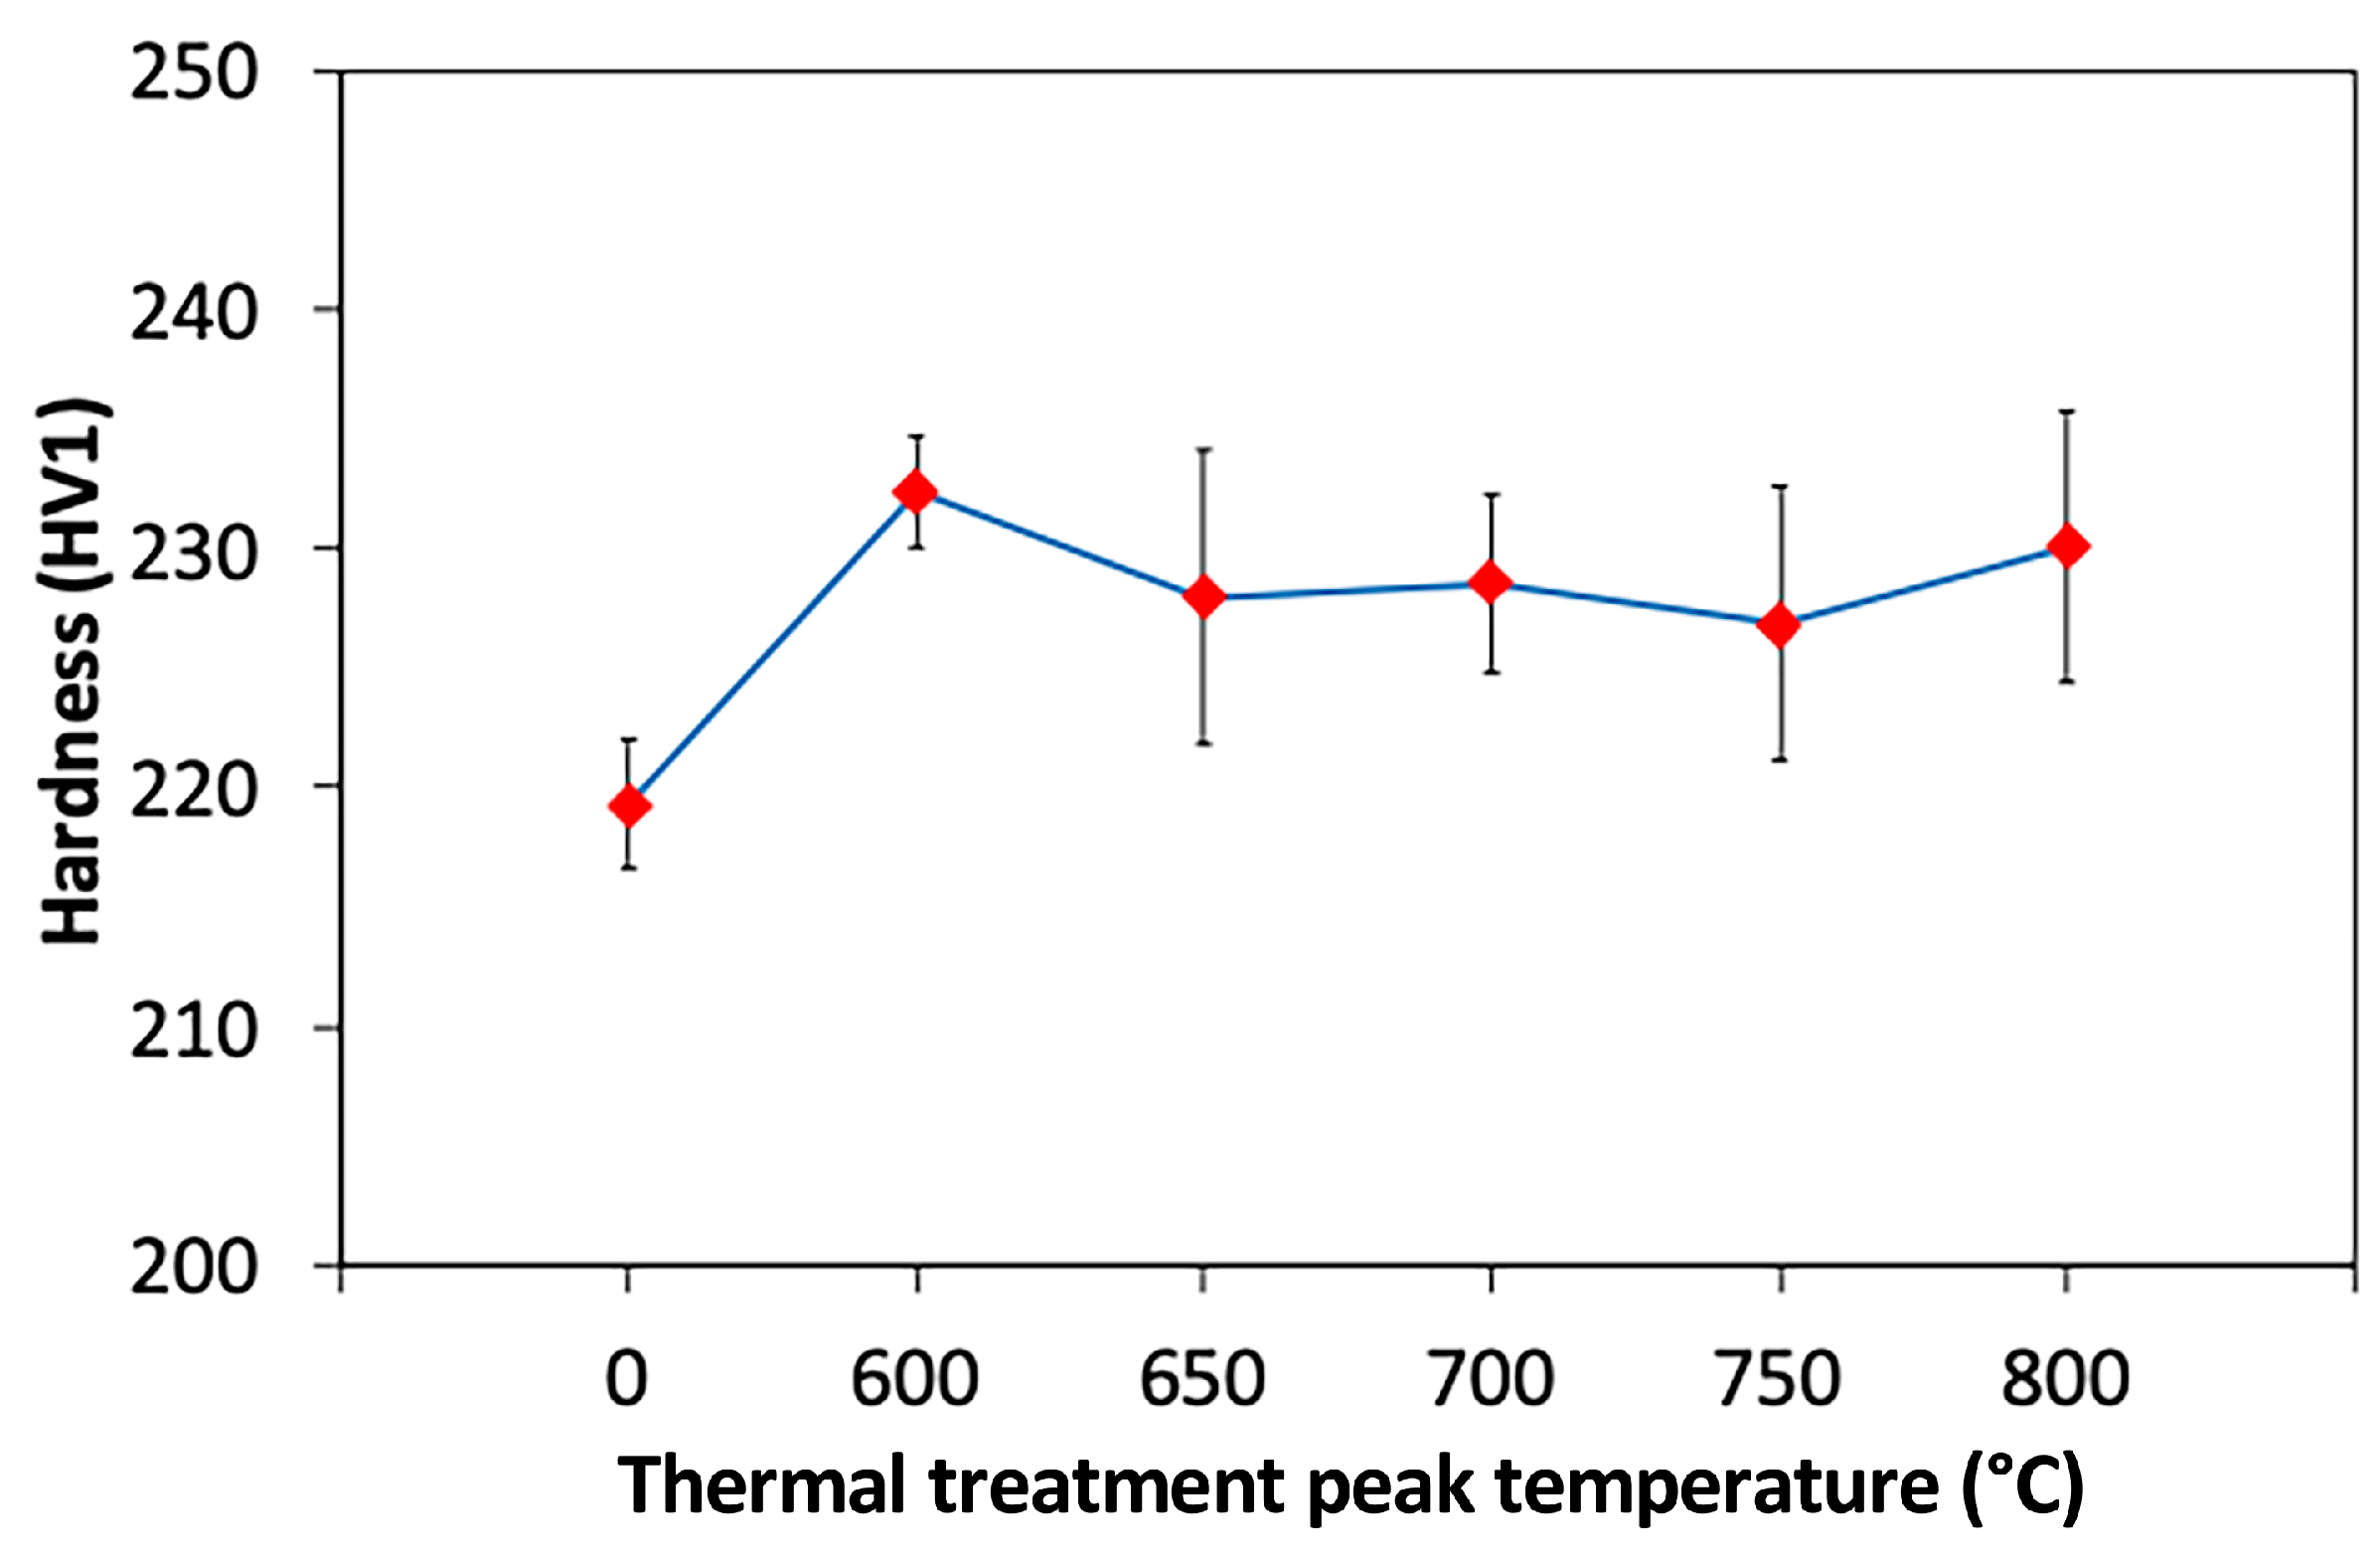
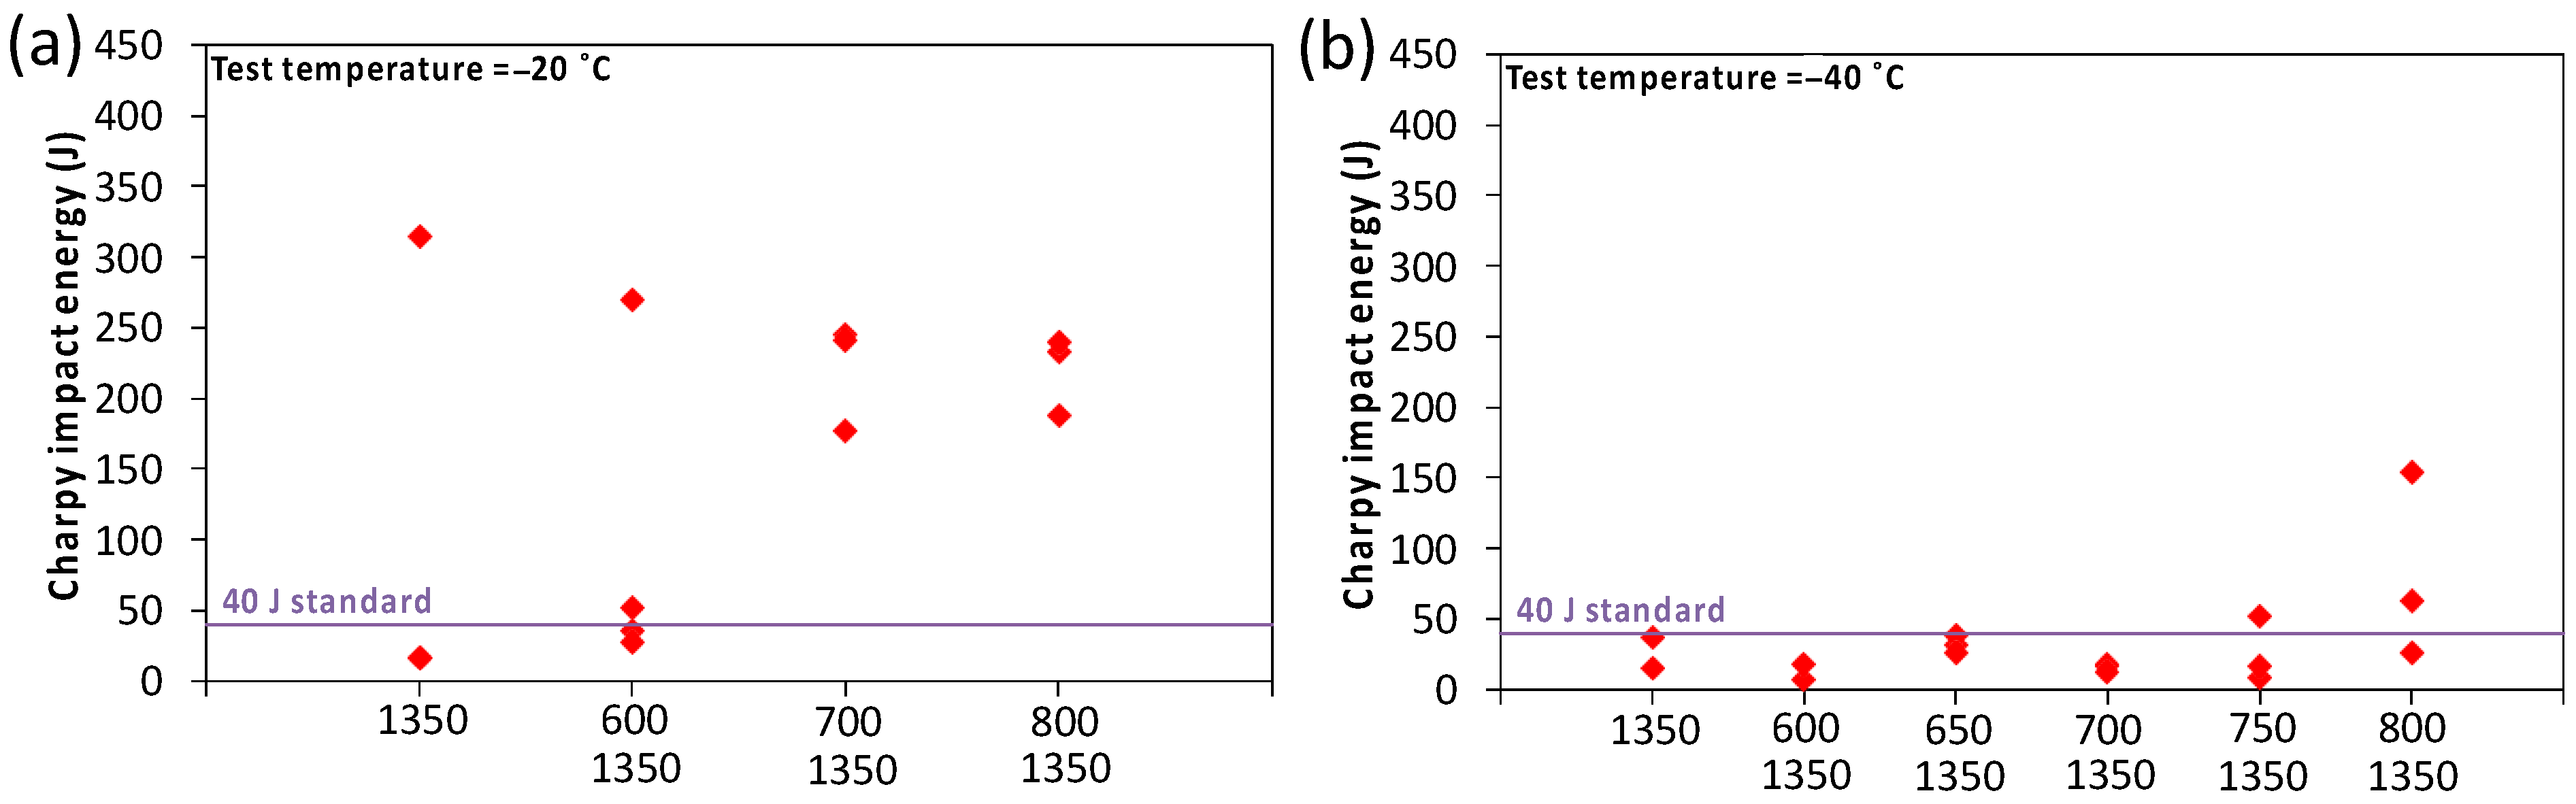
Figure 21 and Figure 22 present the average Vickers hardness values of the simulated CGHAZ samples after the thermal treatment. The thermally treated samples exhibited relatively higher HV1 values, as presented in Figure 21. After the thermal treatment, the hardness values of the CGHAZ presented a noticeable increase compared with those of the original CGHAZ without the thermal treatment. With increasing thermal-treatment peak temperature, the hardness slightly fluctuated in the range 225–233 HV1. The Charpy impact energies of the simulated samples with the thermal treatment are shown in Figure 22. The low-temperature (−20 °C) impact energies of the samples thermally treated at 600 °C were similar to those of the original CGHAZ samples when no thermal treatment was used. The scattered data mean that −20 °C was in the ductile–brittle transition-temperature range. As the peak temperature of the thermal treatment was increased to 700 °C, all the impact energy values with no scattering met the standard requirement of 40 J. Further increasing the peak temperature to 800 °C did not change the impact energy at −20 °C obviously. It is interesting to notice that the impact energy at −40 °C remained unchanged, showing extremely low values when the CGHAZ samples were thermally treated at a peak temperature of 700 °C. With further increasing the thermal-treatment peak temperature to 800 °C, the impact energy clearly improved although the data were scattered. The above results can be explained by the prevention of the M–A formation. The carbon enrichment was reduced by the thermal treatment during the bainitic ferrite transformation; thus, the M–A constituent was difficult to form. This has also been demonstrated by the experimental results in previous study [42,43].
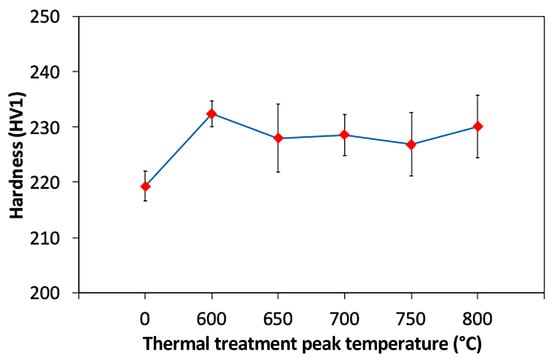
Figure 21.
Vickers hardness variation as a function of thermal-treatment peak temperature (thermal-treatment peak temperature “0” represents the original CGHAZ without the thermal treatment process).
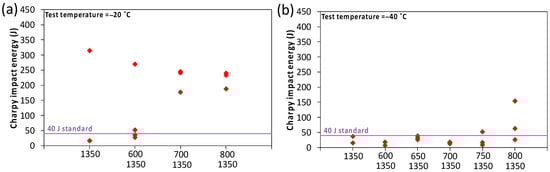
Figure 22.
The variation in the Charpy impact energies at different testing temperatures as functions of thermal-treatment temperature for simulated CGHAZ samples: (a) CVN at −20 °C and (b) CVN at −40 °C.
5. Investigation of Thermally Simulated ICCGHAZ
5.1. Influence of Intercritical Reheating Temperature on Simulated ICCGHAZ
This section is an extension of our earlier work [18], which focused on a typical thin-walled X70 pipe. The current investigation, however, was conducted on a thick-walled pipe. The welding of this type of line pipe is challenging owing to the high HI, leading to significant HAZ issues, particularly in the ICCGHAZ.
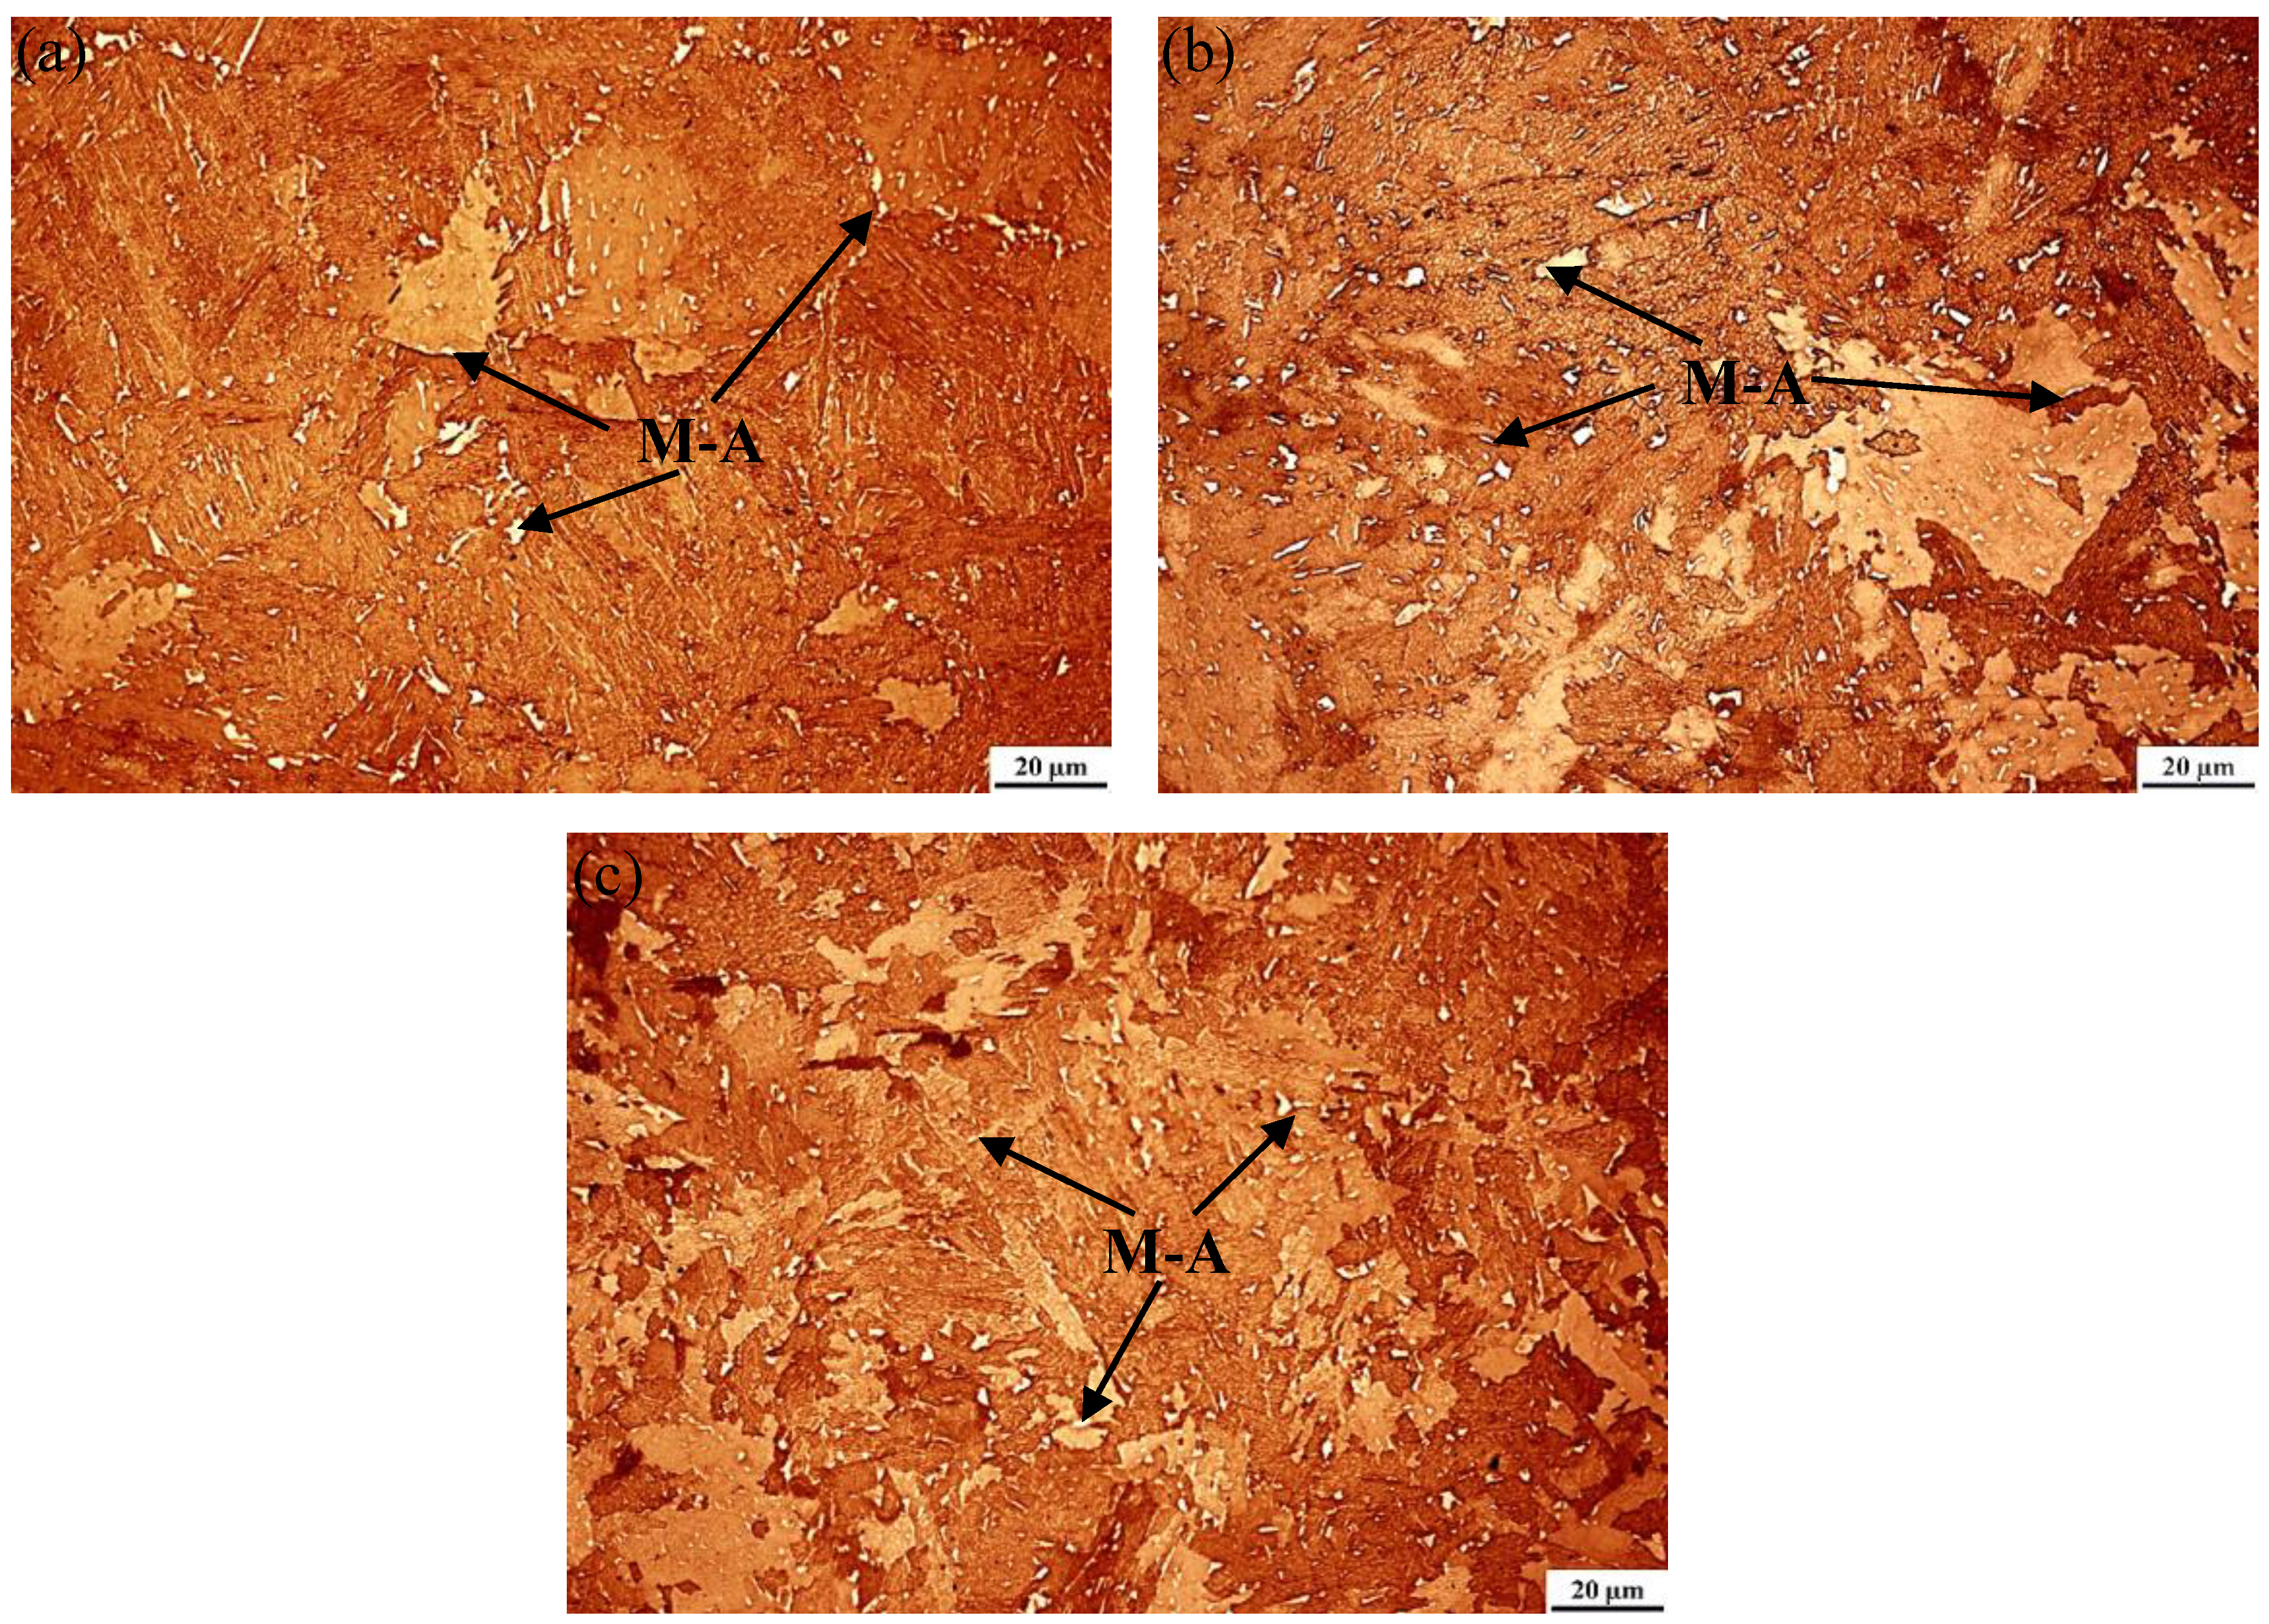
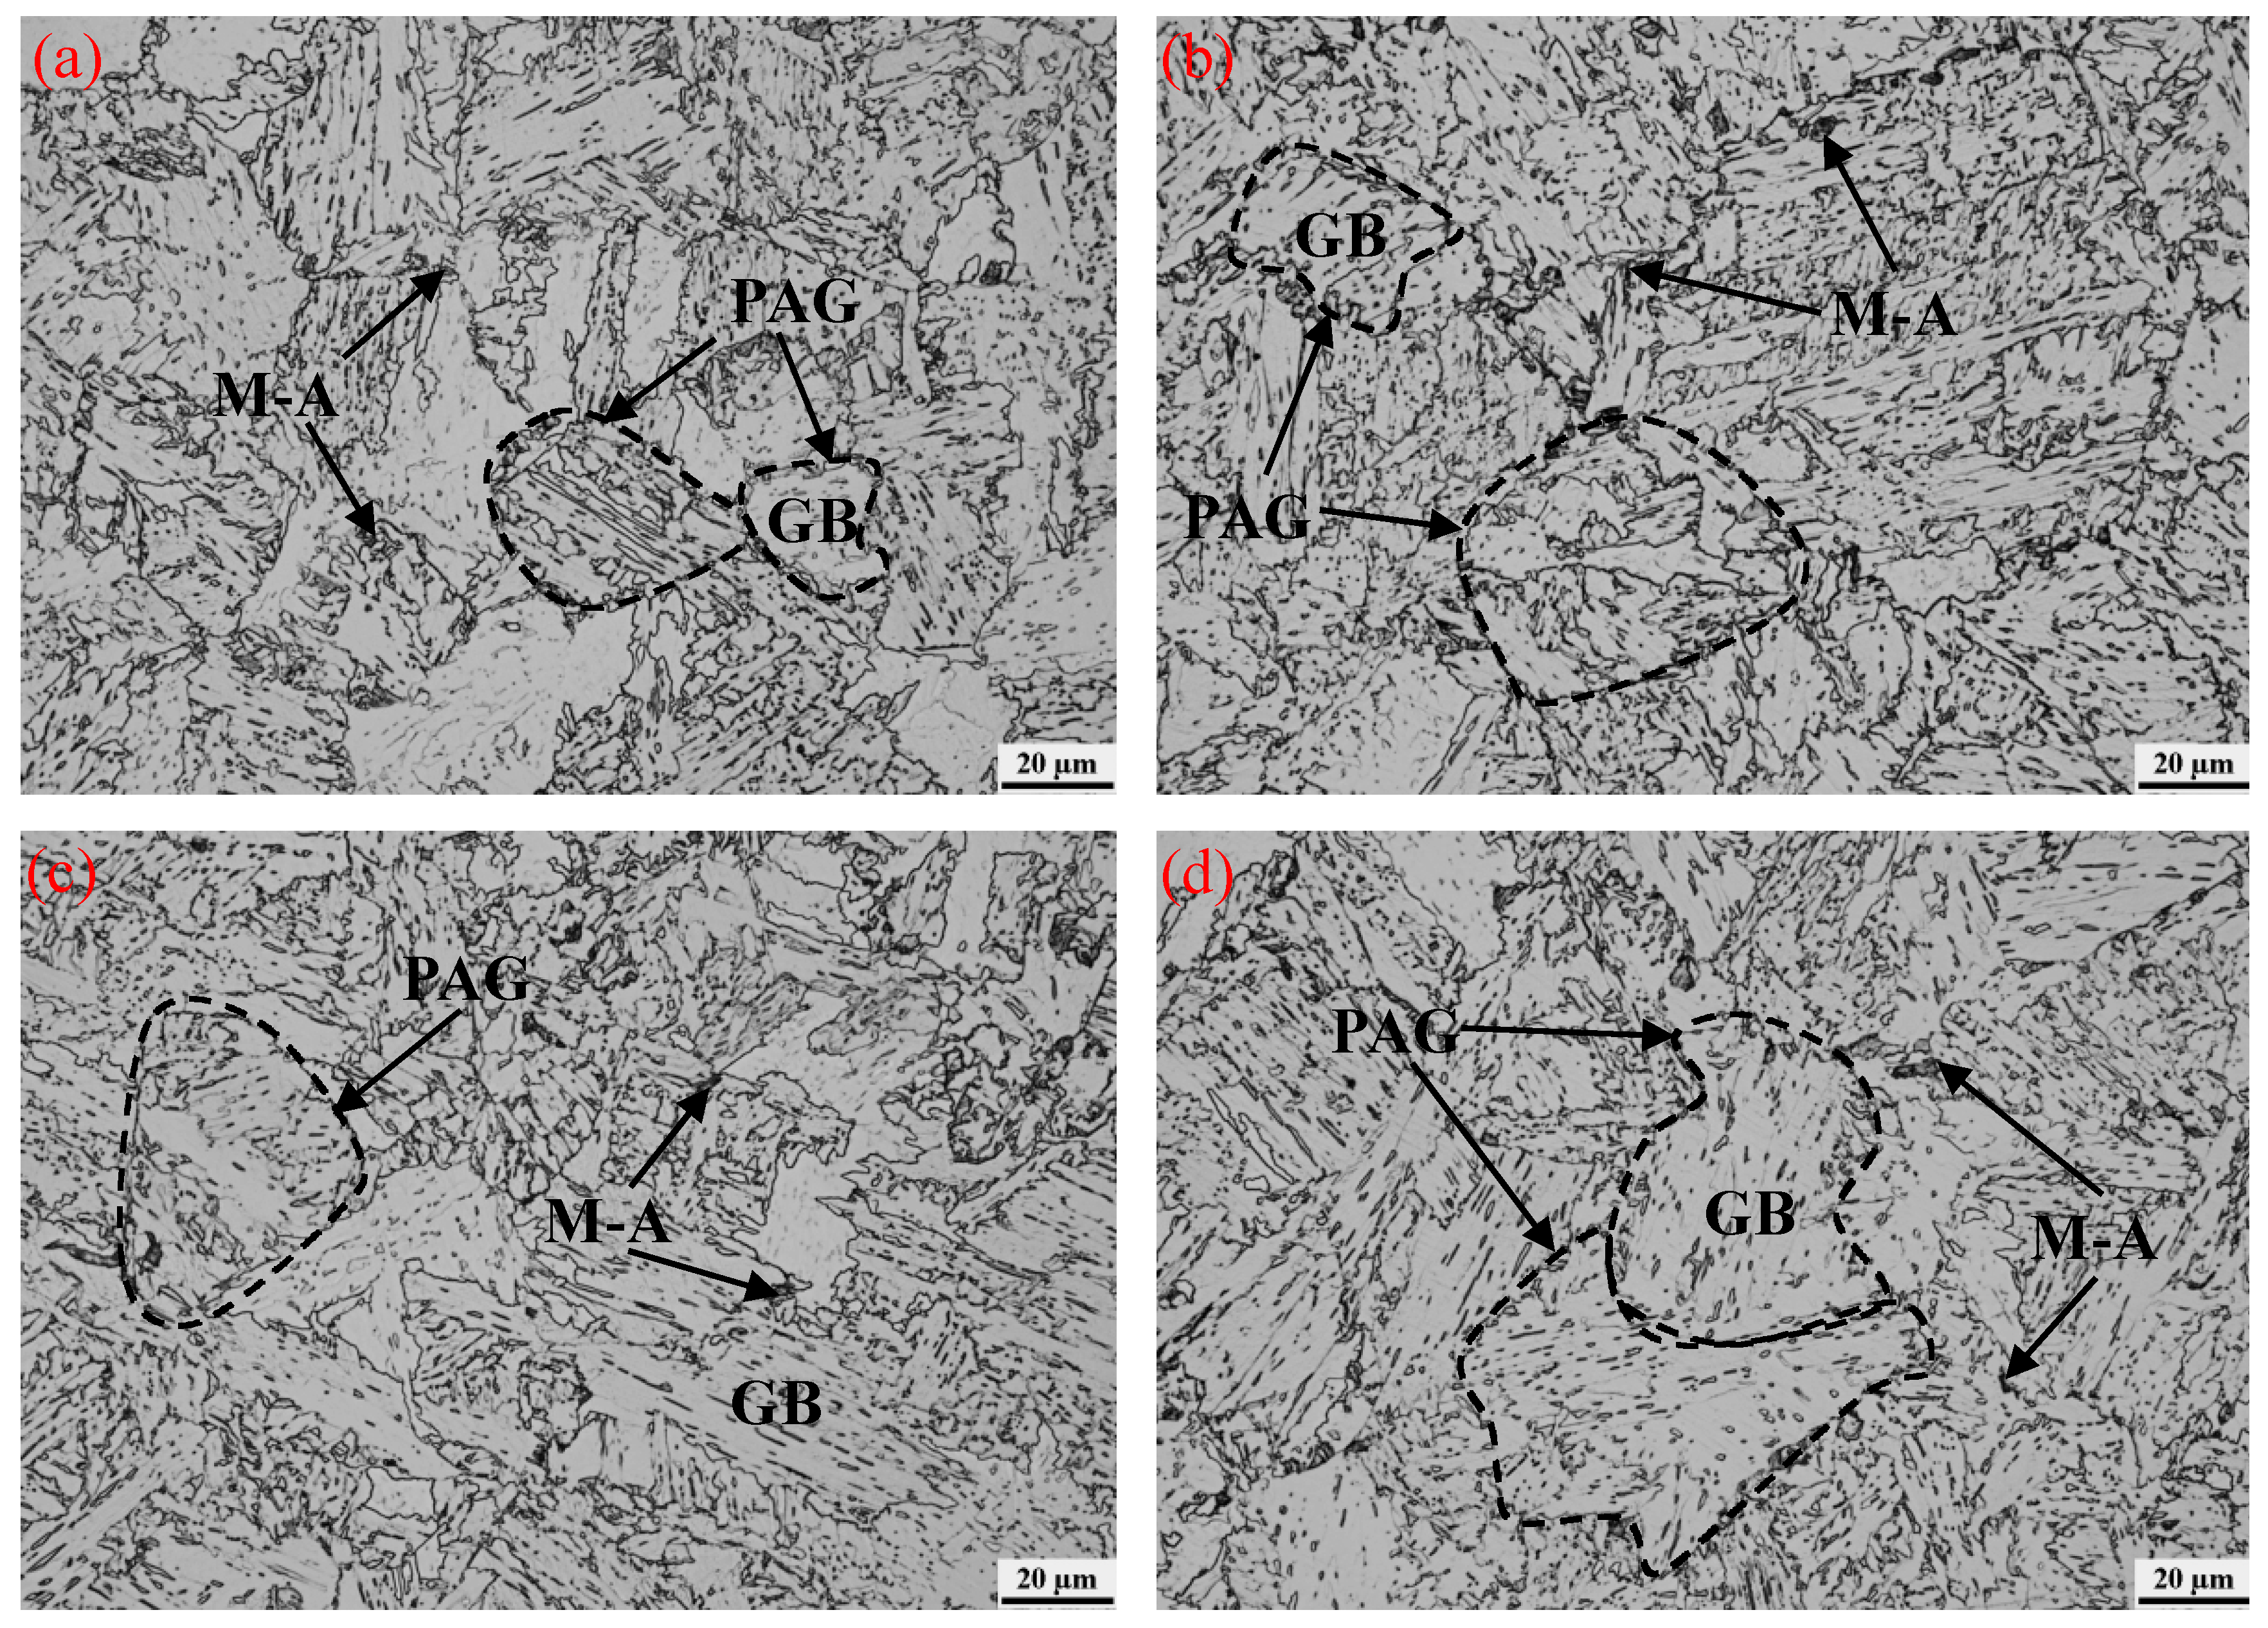
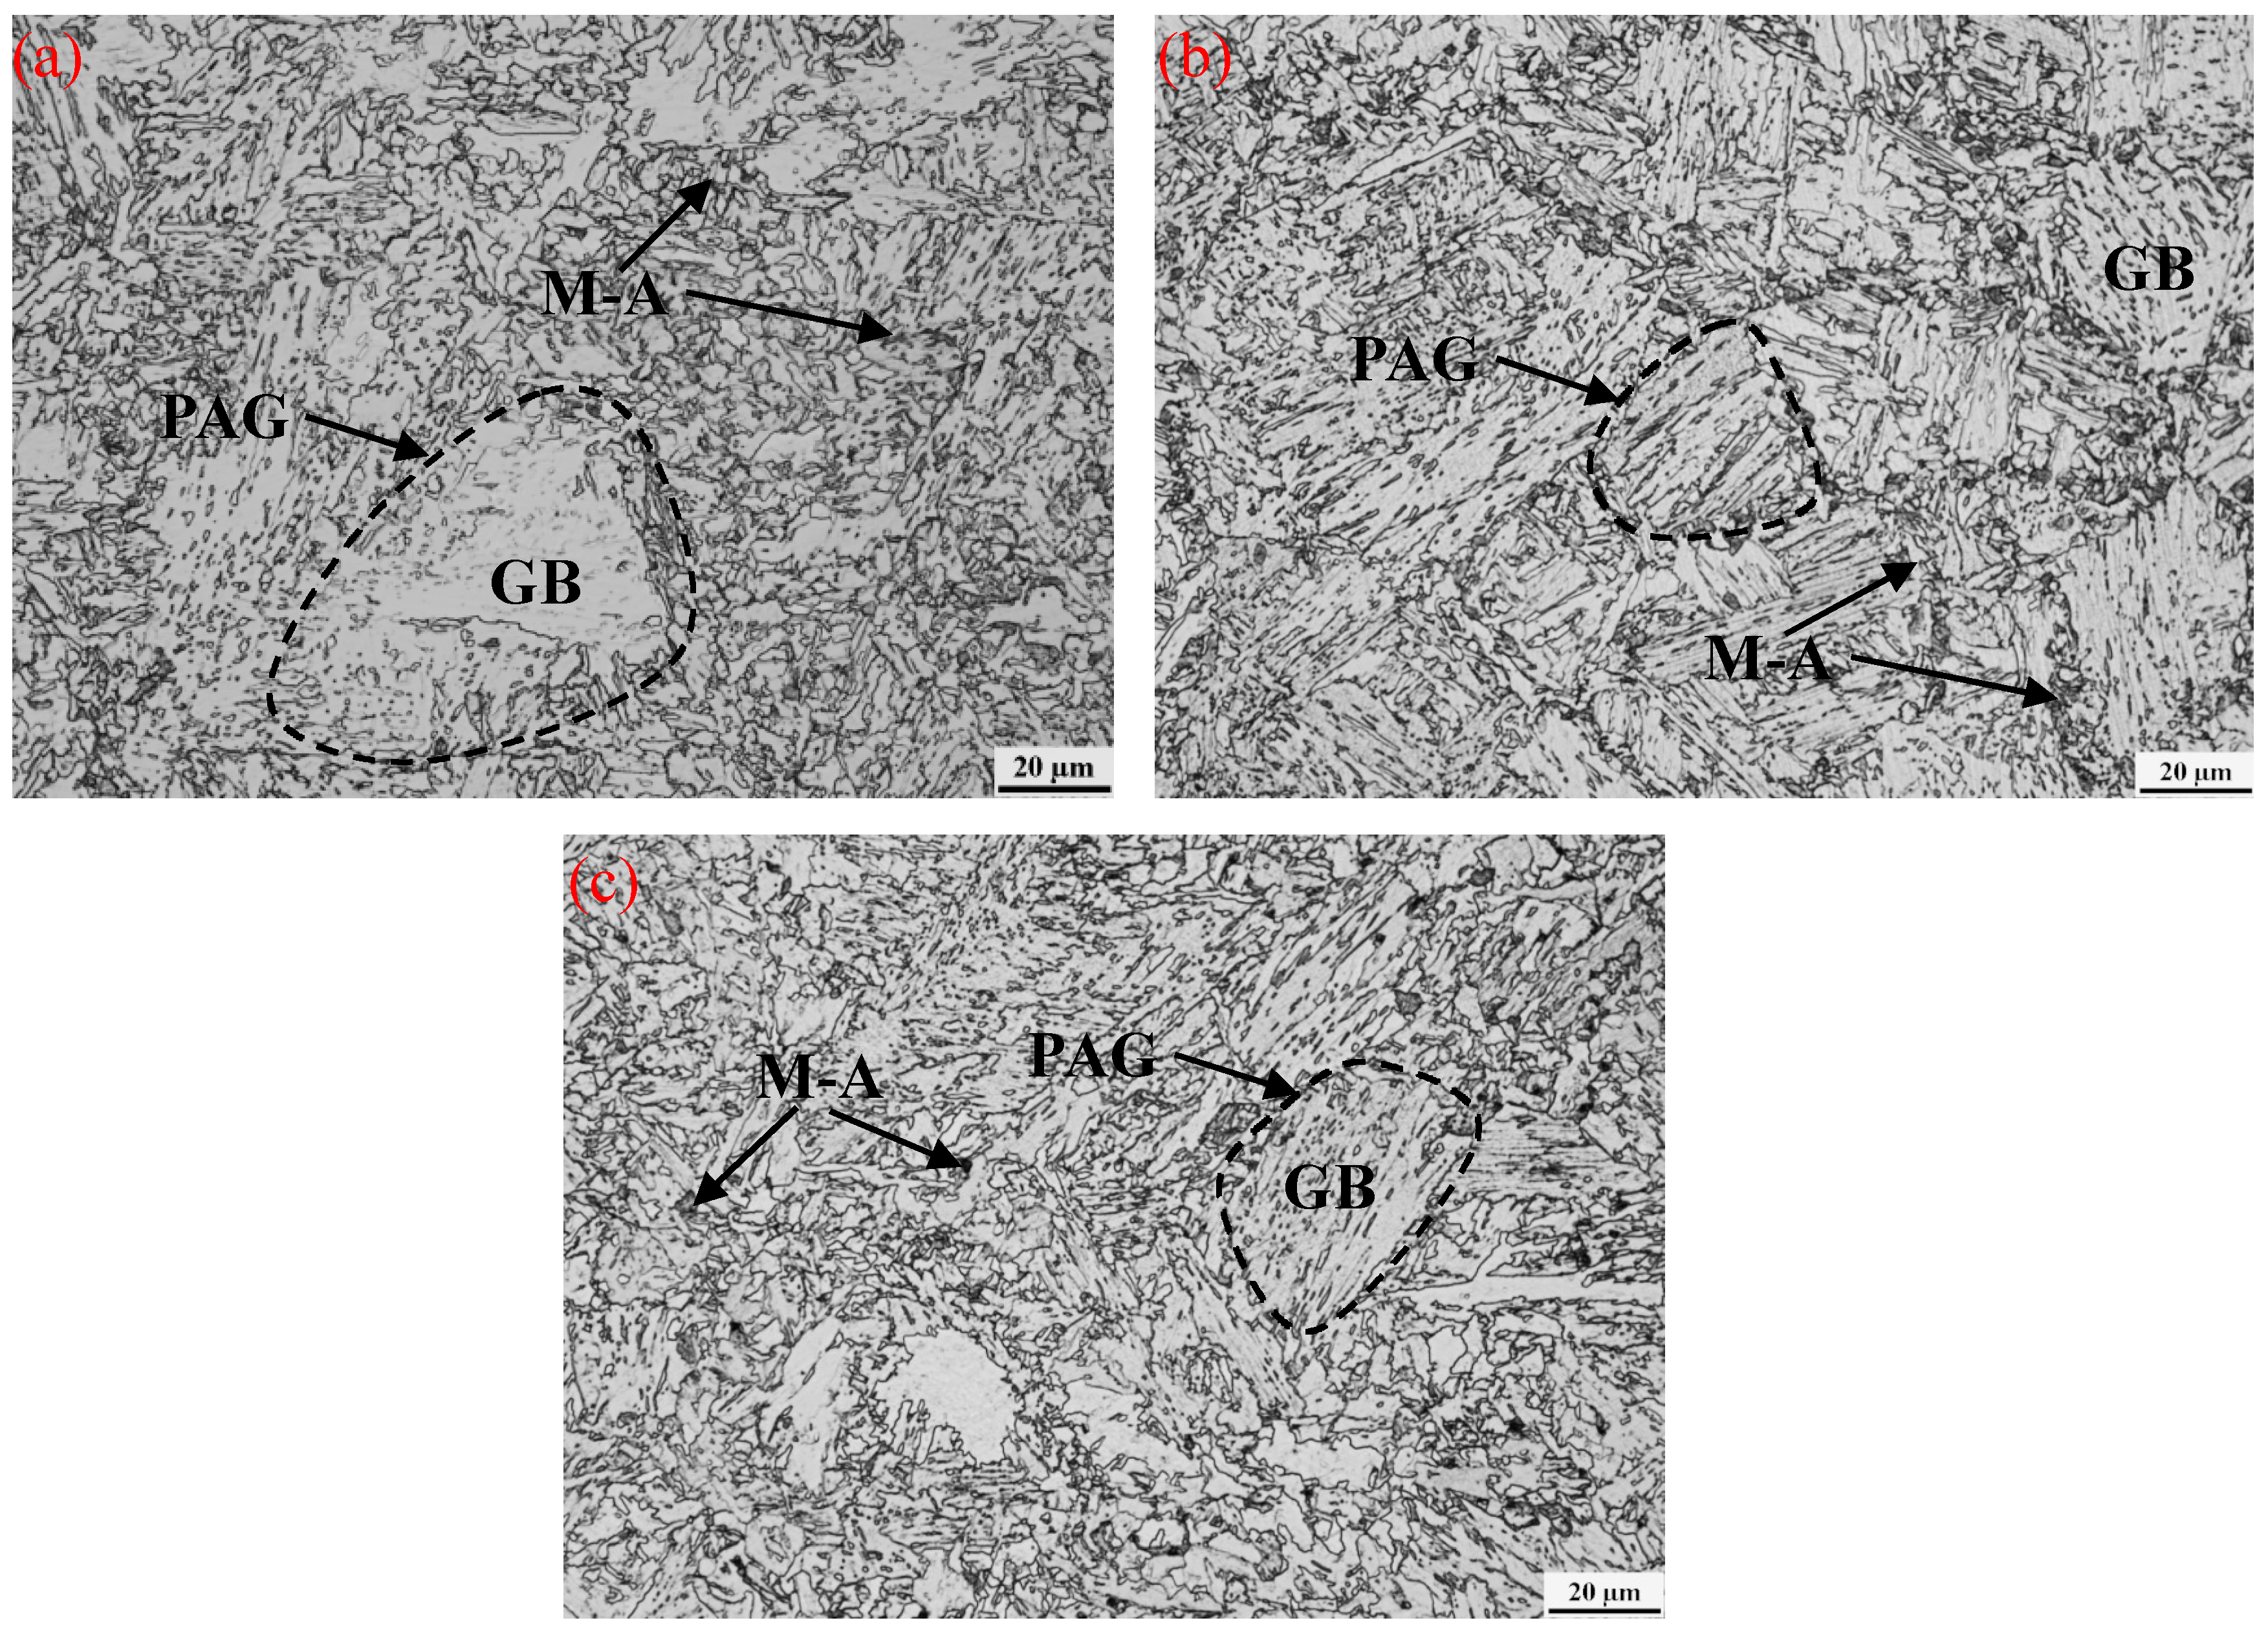
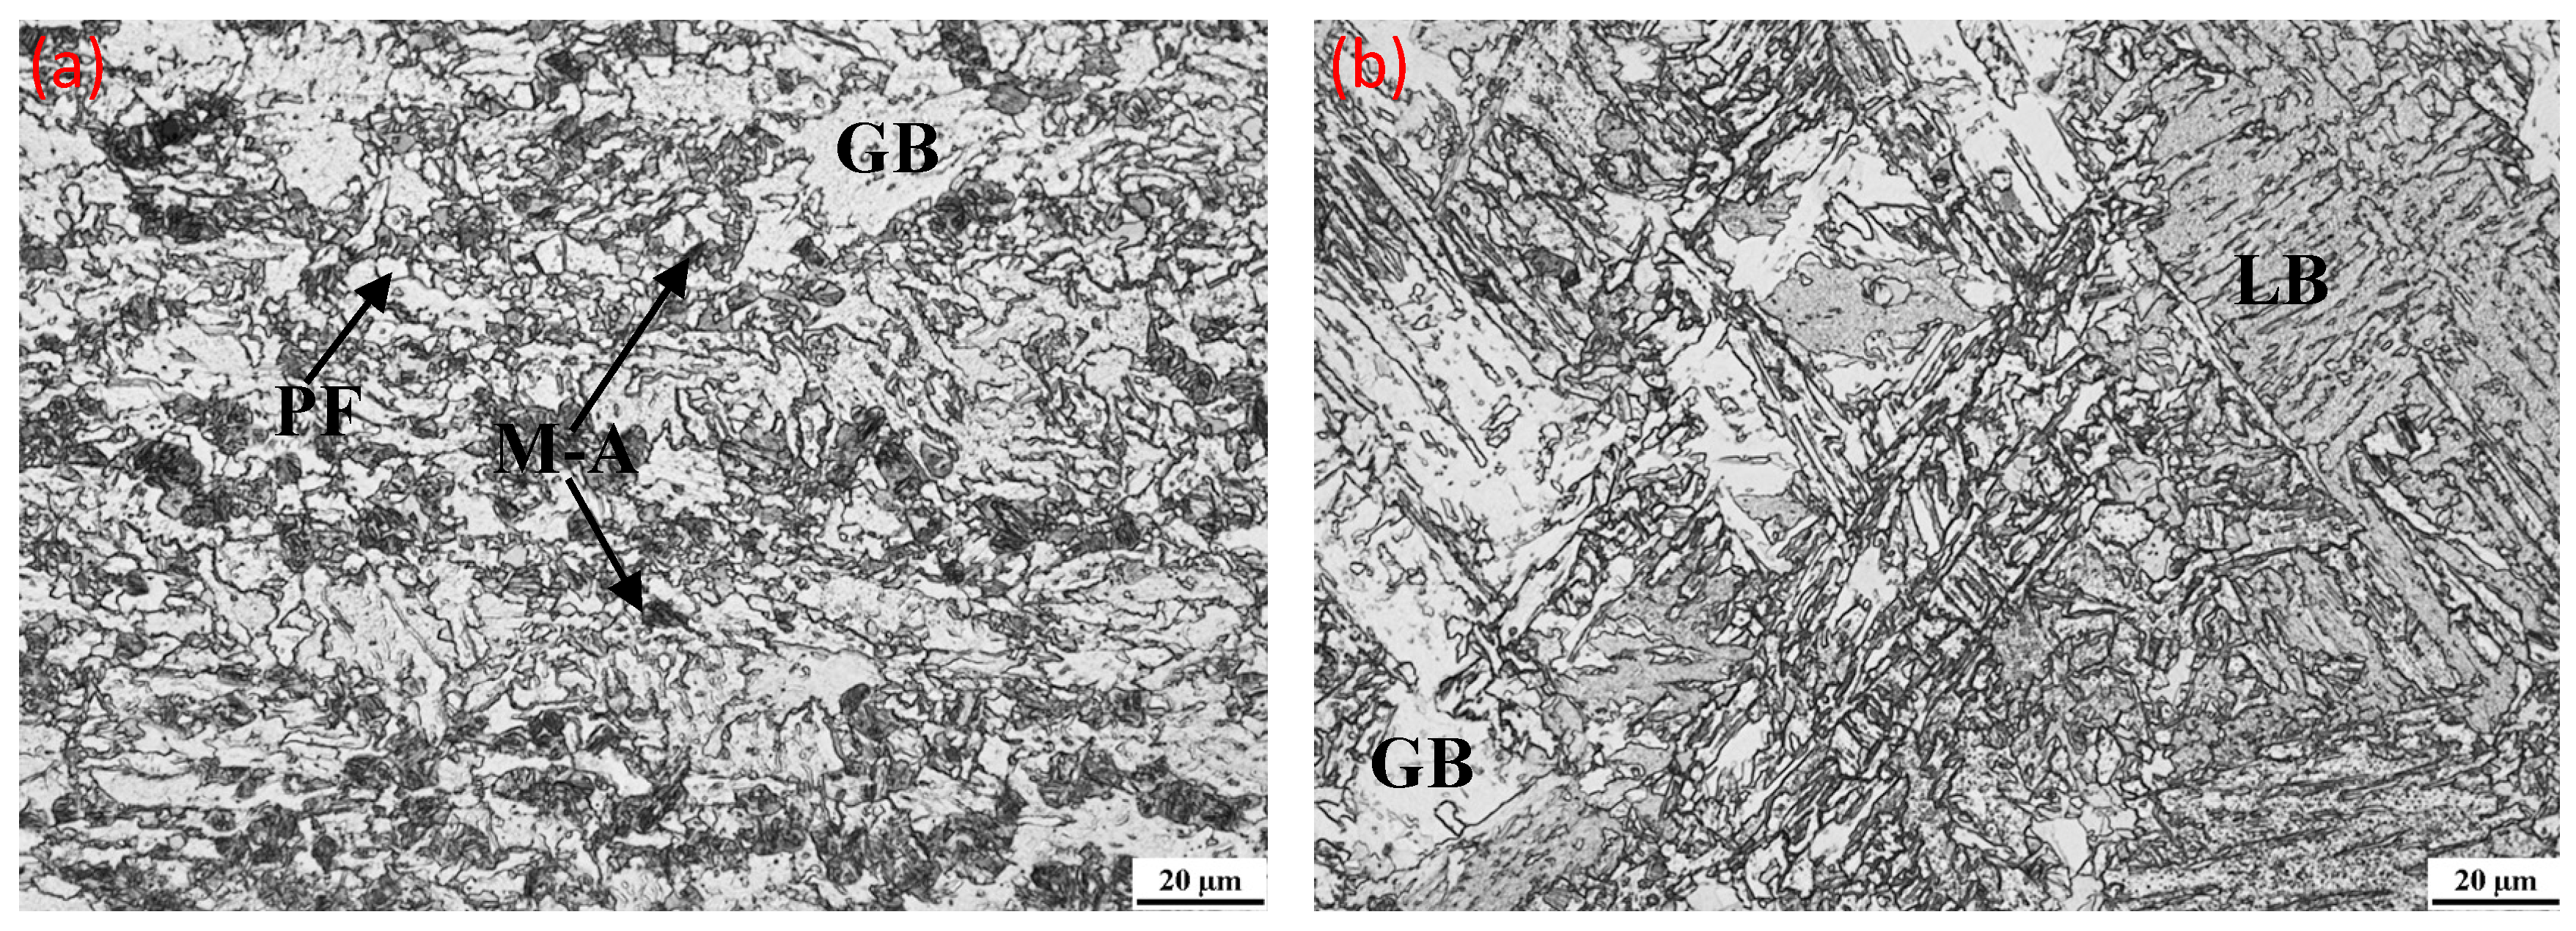
Figure 23 and Figure 24 present the optical micrographs of the ICCGHAZs simulated at three different intercritical reheating temperatures in the investigated thick-walled pipe. Compared with the thin-walled pipe in our previous work, the current thick-walled pipe samples exhibited ICCGHAZs that had a similar microstructure dominated by bainitic ferrite with a secondary M–A constituent. The fraction of the M–A constituent was quantitatively analysed, as shown in Table 7. The results indicate that the grain-boundary network of the M–A constituent in a necklace pattern was observed only at the lower end (just above Ac1) of the intercritical temperature range. With increasing intercritical reheating temperature, the M–A constituent dispersed intragranularly at the bainite and ferrite boundaries. Significant decreases were also observed in the total fraction and average size of the M–A constituent.
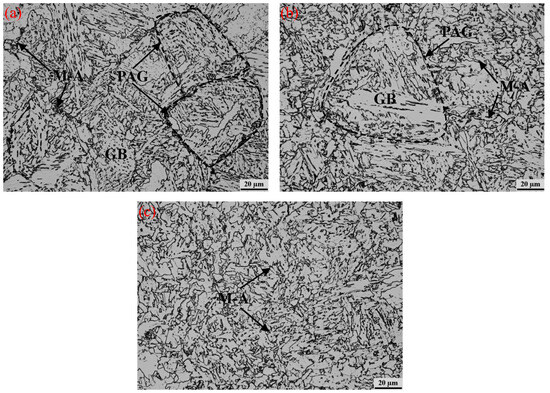
Figure 23.
Microstructures of ICCGHAZ samples simulated by employing different reheating temperatures: (a) 810 °C, (b) 840 °C, and (c) 870 °C compared with that of the original CGHAZ sample. PAG: prior austenite grain, GB: granular bainite, and M–A: martensite–austenite constituent.

Figure 24.
Optical images of microstructures revealed using LePera etchant for simulated ICCGHAZ samples produced using different reheating temperatures: (a) 810 °C, (b) 840 °C, and (c) 870 °C. M–A: martensite–austenite constituent.
Table 7.
Fraction (Vf) of the M–A constituent present in the ICCGHAZs simulated at different reheating temperatures.
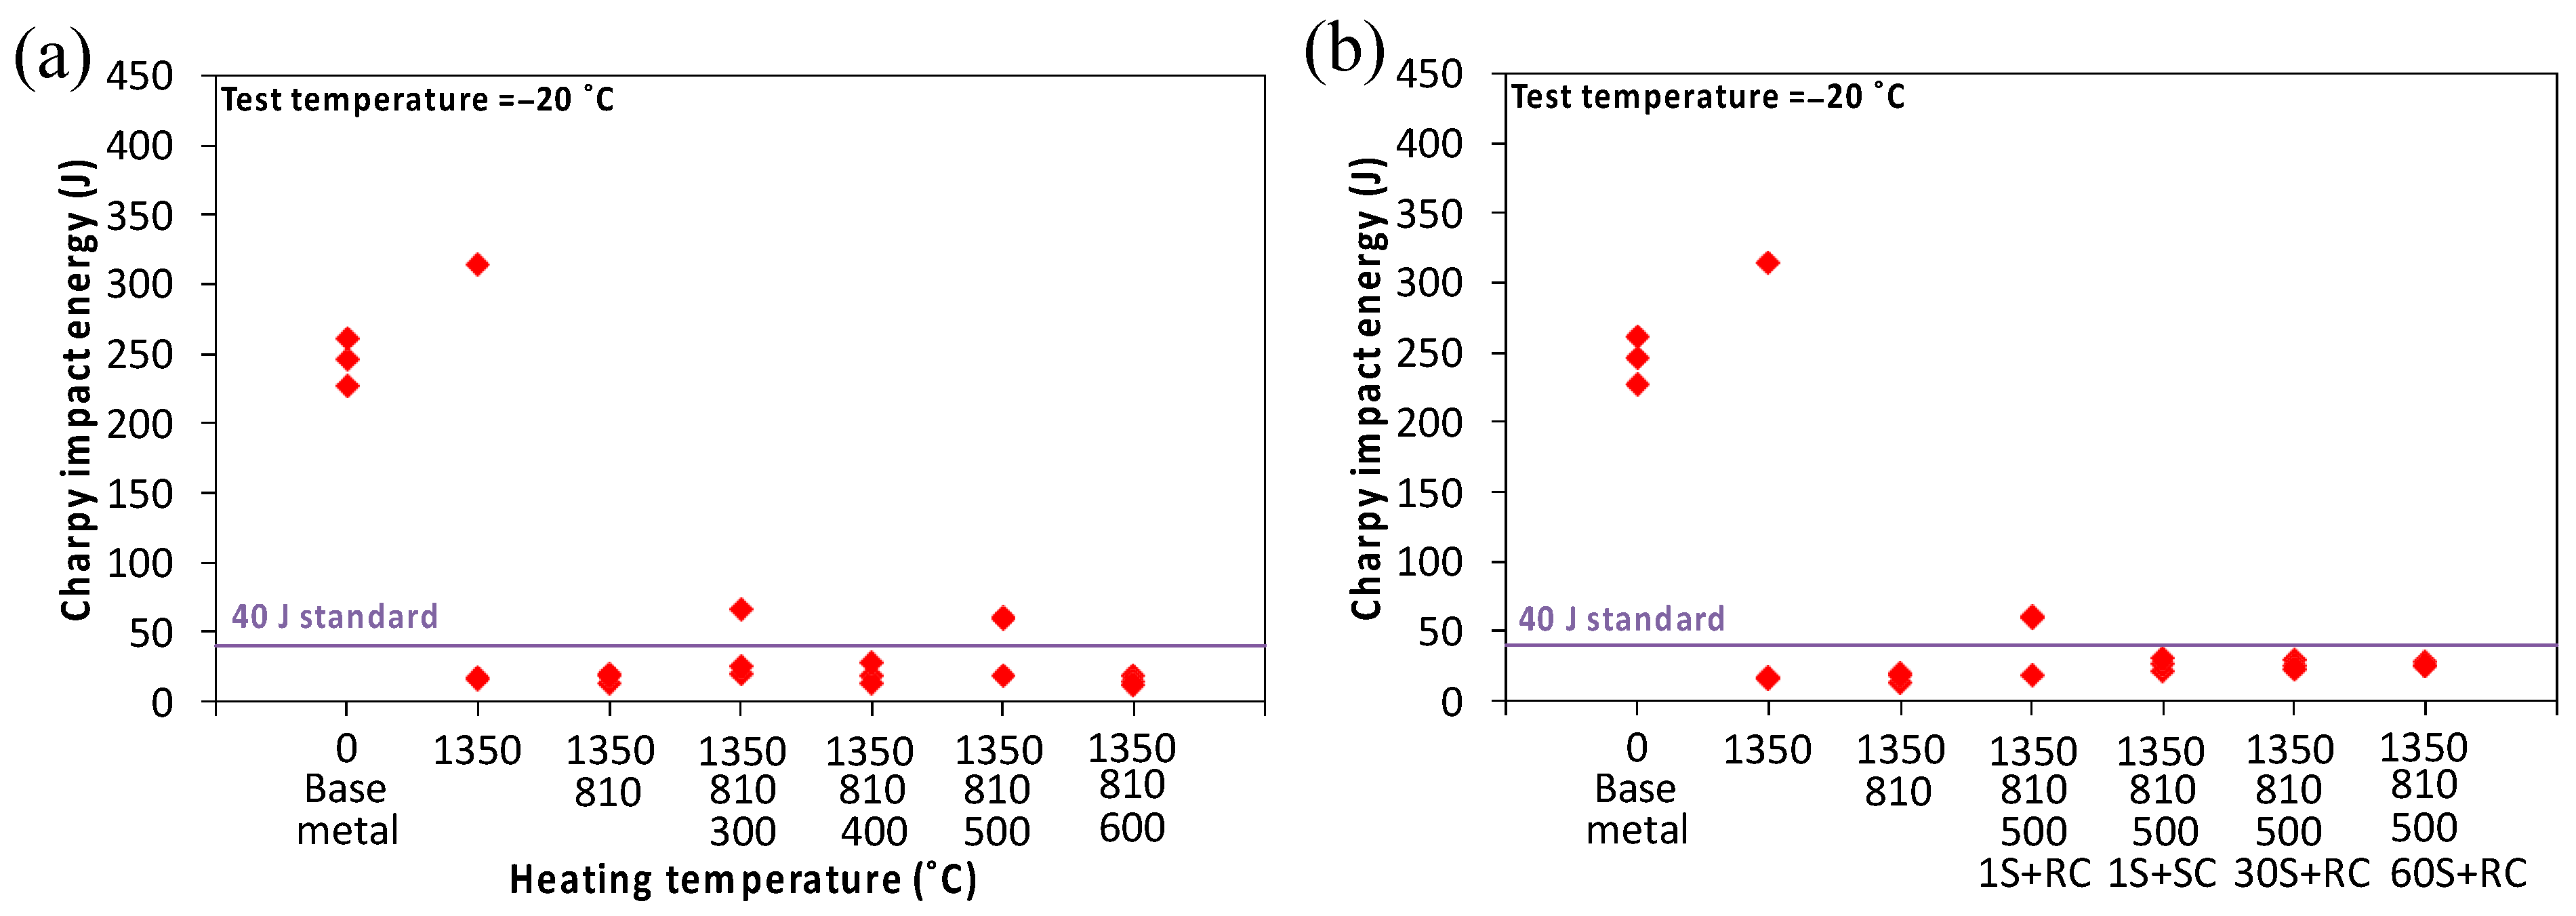
The corresponding results of the Charpy impact tests at −20 °C in Figure 25 present the variation in the absorbed energy for the simulated ICCGHAZ samples. The intercritically reheated specimens consistently showed a substantial deterioration in toughness, which can be attributed to the combined influences of the M–A size, fraction, and location. The detailed analysis of the microstructural evolution within the intercritical range and its impact on the fracture toughness can be referred to in our earlier work [17,18].
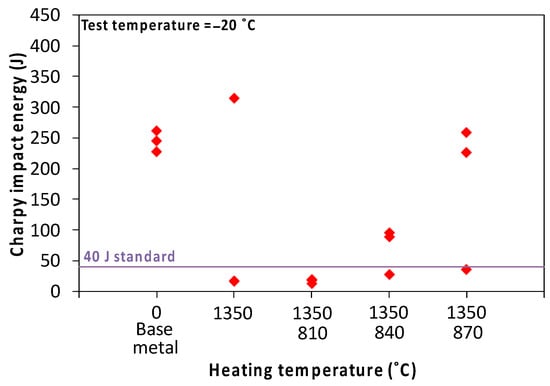
Figure 25.
Charpy impact energies of ICCGHAZ samples simulated at different intercritical reheating temperatures compared with those of the base metal and original CGHAZ. (Heating temperature “0” represents the base metal, while heating temperature “1350” represents the original CGHAZ.)
5.2. Influence of PAGS on Simulated ICCGHAZ
The above investigations have indicated that the frequently occurring necklace-type M–A constituent along the PAG boundary in the ICCGHAZ has made it scarcely possible to regulate the toughness because the M–A constituent is particularly difficult to control as it forms during the second thermal cycle at a peak temperature between Ac1 and Ac3. It is also essential to conduct further investigations on whether the precursor microstructure formed in the CGHAZ, especially the PAGS, has any positive effects on the subsequent microstructure, including the necklace-type M–A constituent, and the impact toughness in the ICCGHAZ.
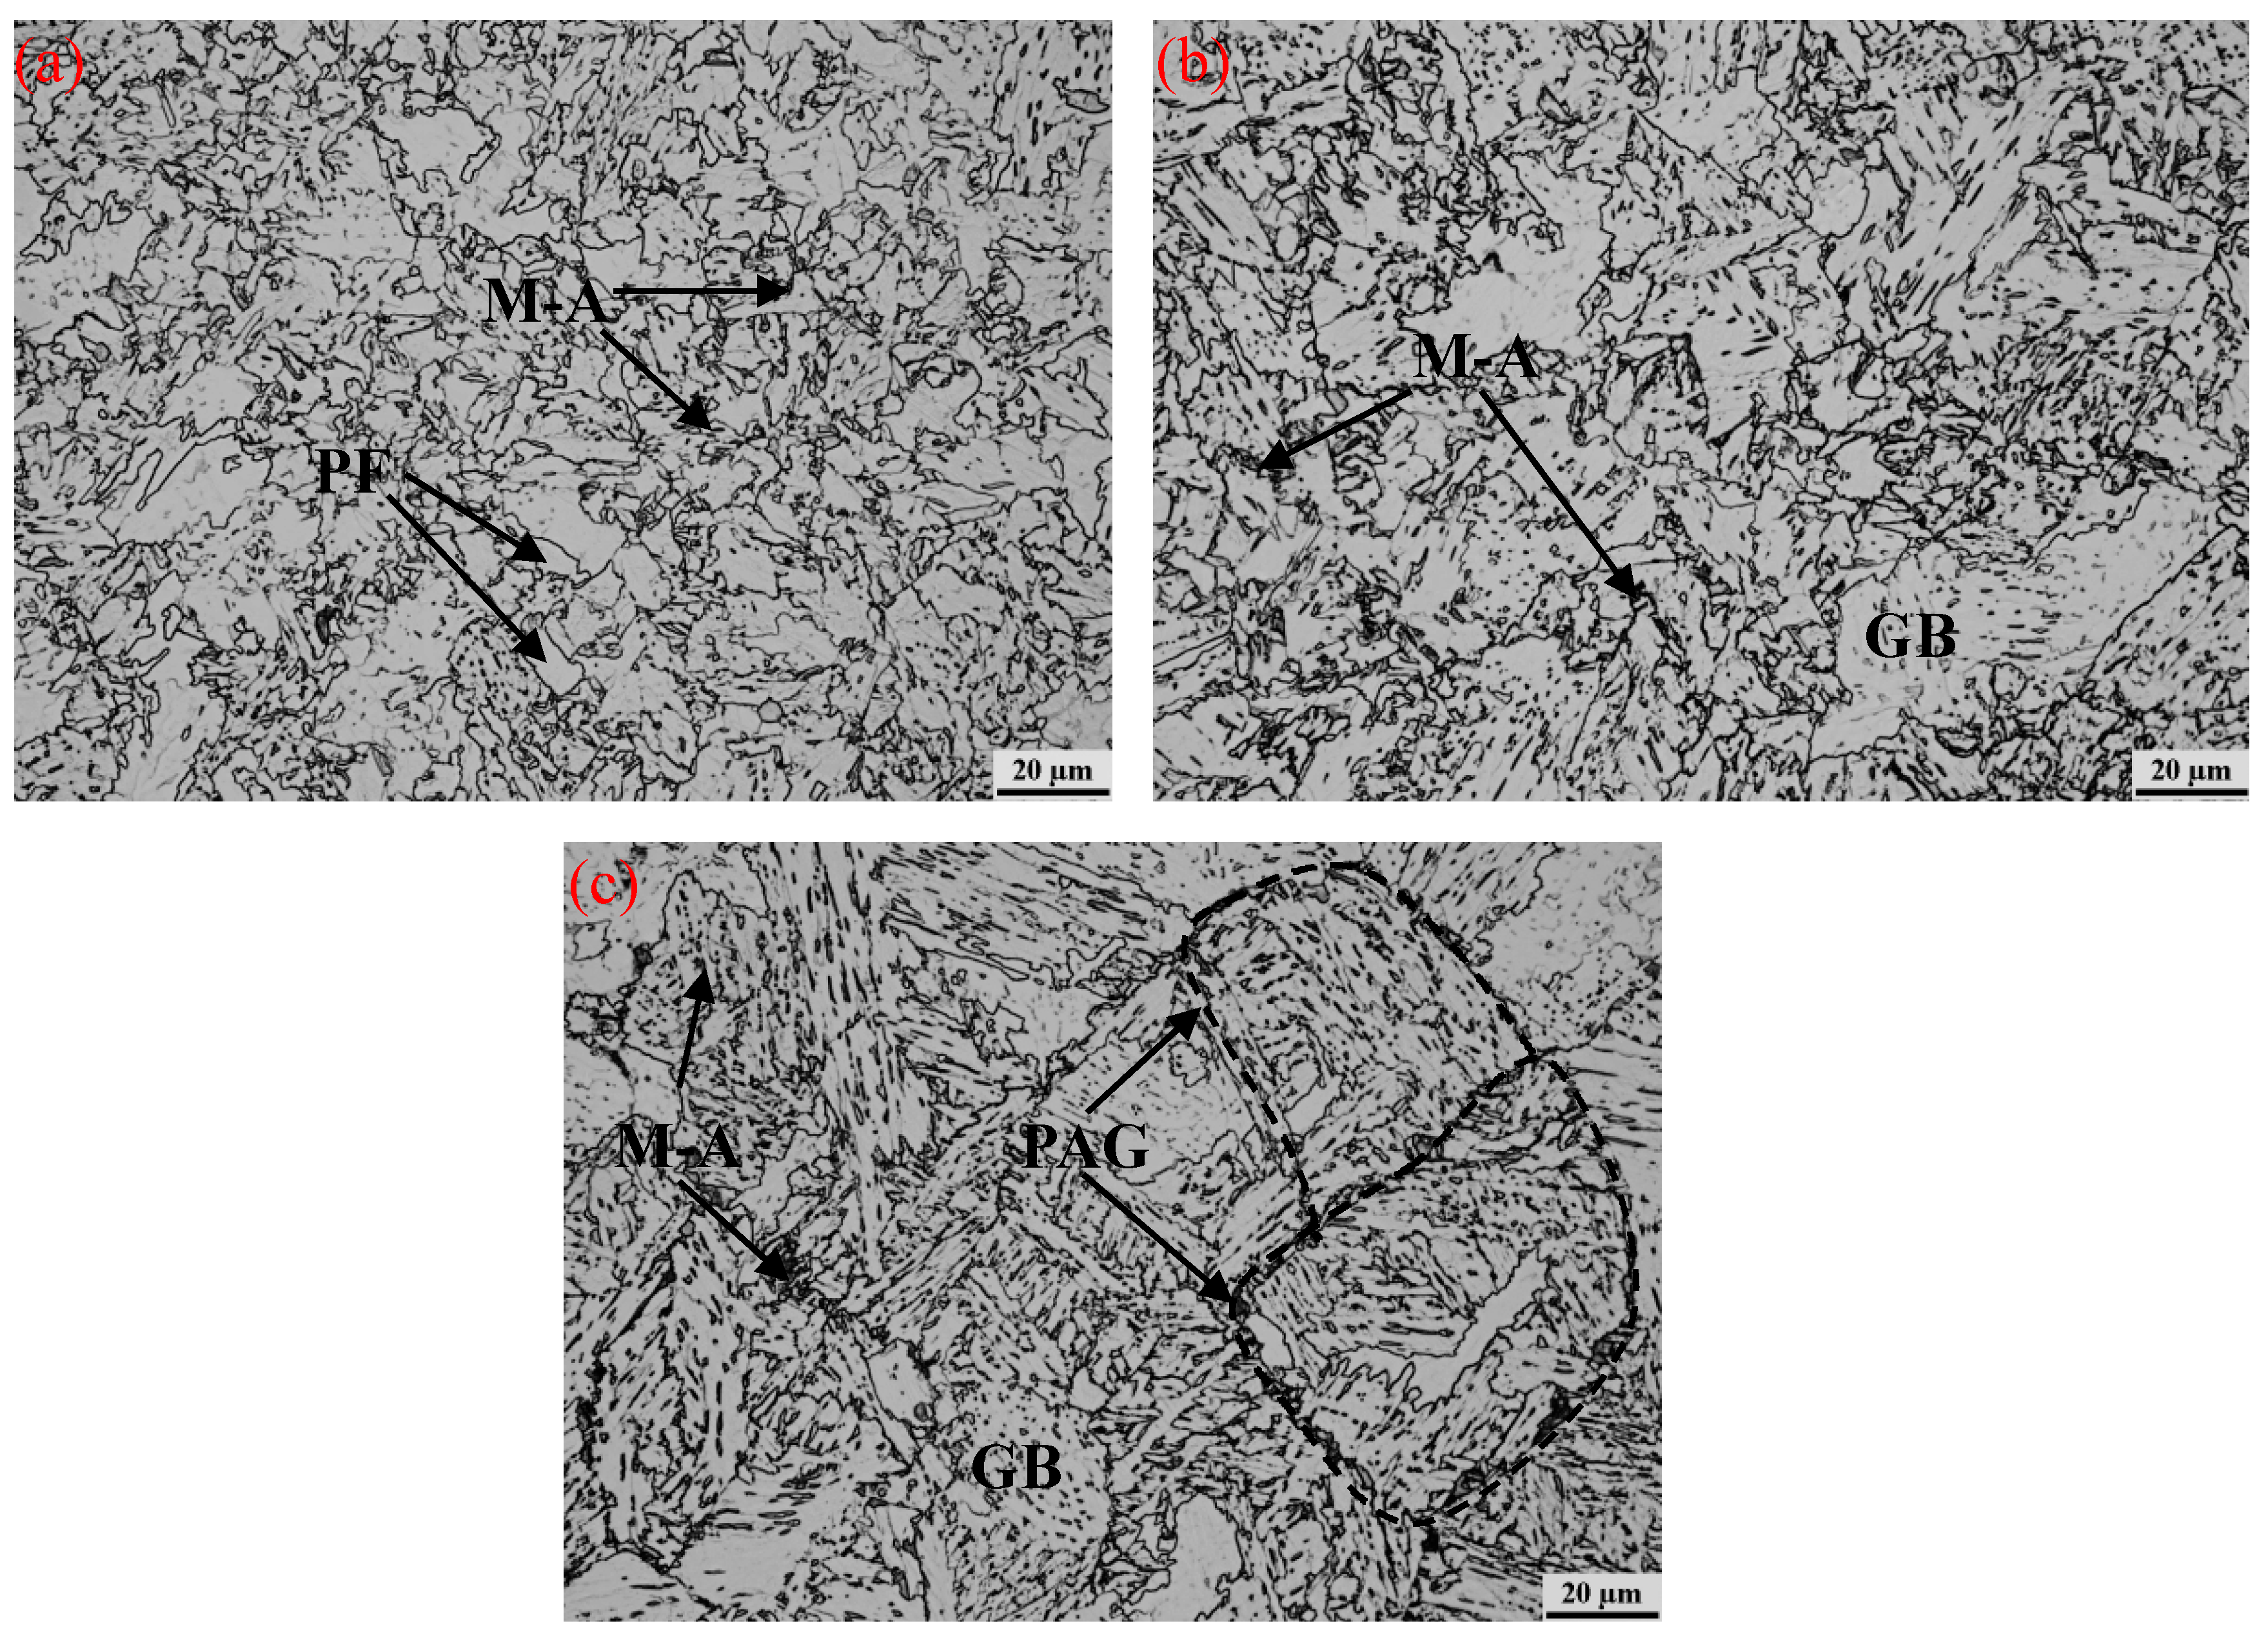
The optical micrographs of the ICCGHAZ samples simulated by changing the first-pass peak temperature are shown in Figure 26. The PAGS was coarsened by increasing the first-pass peak temperature. The microstructure of the ICCGHAZ simulated at Tp1 = 1100 °C primarily comprised polygonal ferrite, quasi-polygonal ferrite, and a small fraction of the M–A constituent. When the first-pass peak temperature was increased to 1250 °C, the M–A constituent predominantly formed along the PAG boundaries. With the significant coarsening of the PAGS at the first-pass peak temperature of 1350 °C, the fraction of the grain boundaries decorated by the necklace-type M–A increased. The necklace-type M–A was also found to be coarsened. This observation suggests that the M–A constituent was dispersed with a refinement in the grain size but was continuously distributed along large PAG boundaries.

Figure 26.
Microstructures of ICCGHAZ samples thermally simulated using Gleeble at different first-pass peak temperatures (Tp1) and Tp2 = 810 °C: (a) Tp1 = 1100 °C and Tp2 = 810 °C, (b) Tp1 = 1250 °C and Tp2 = 810 °C, and (c) Tp1 = 1350 °C and Tp2 = 810 °C. PF: polygonal ferrite, PAG: prior austenite grain, GB: granular bainite, and M–A: martensite–austenite constituent.
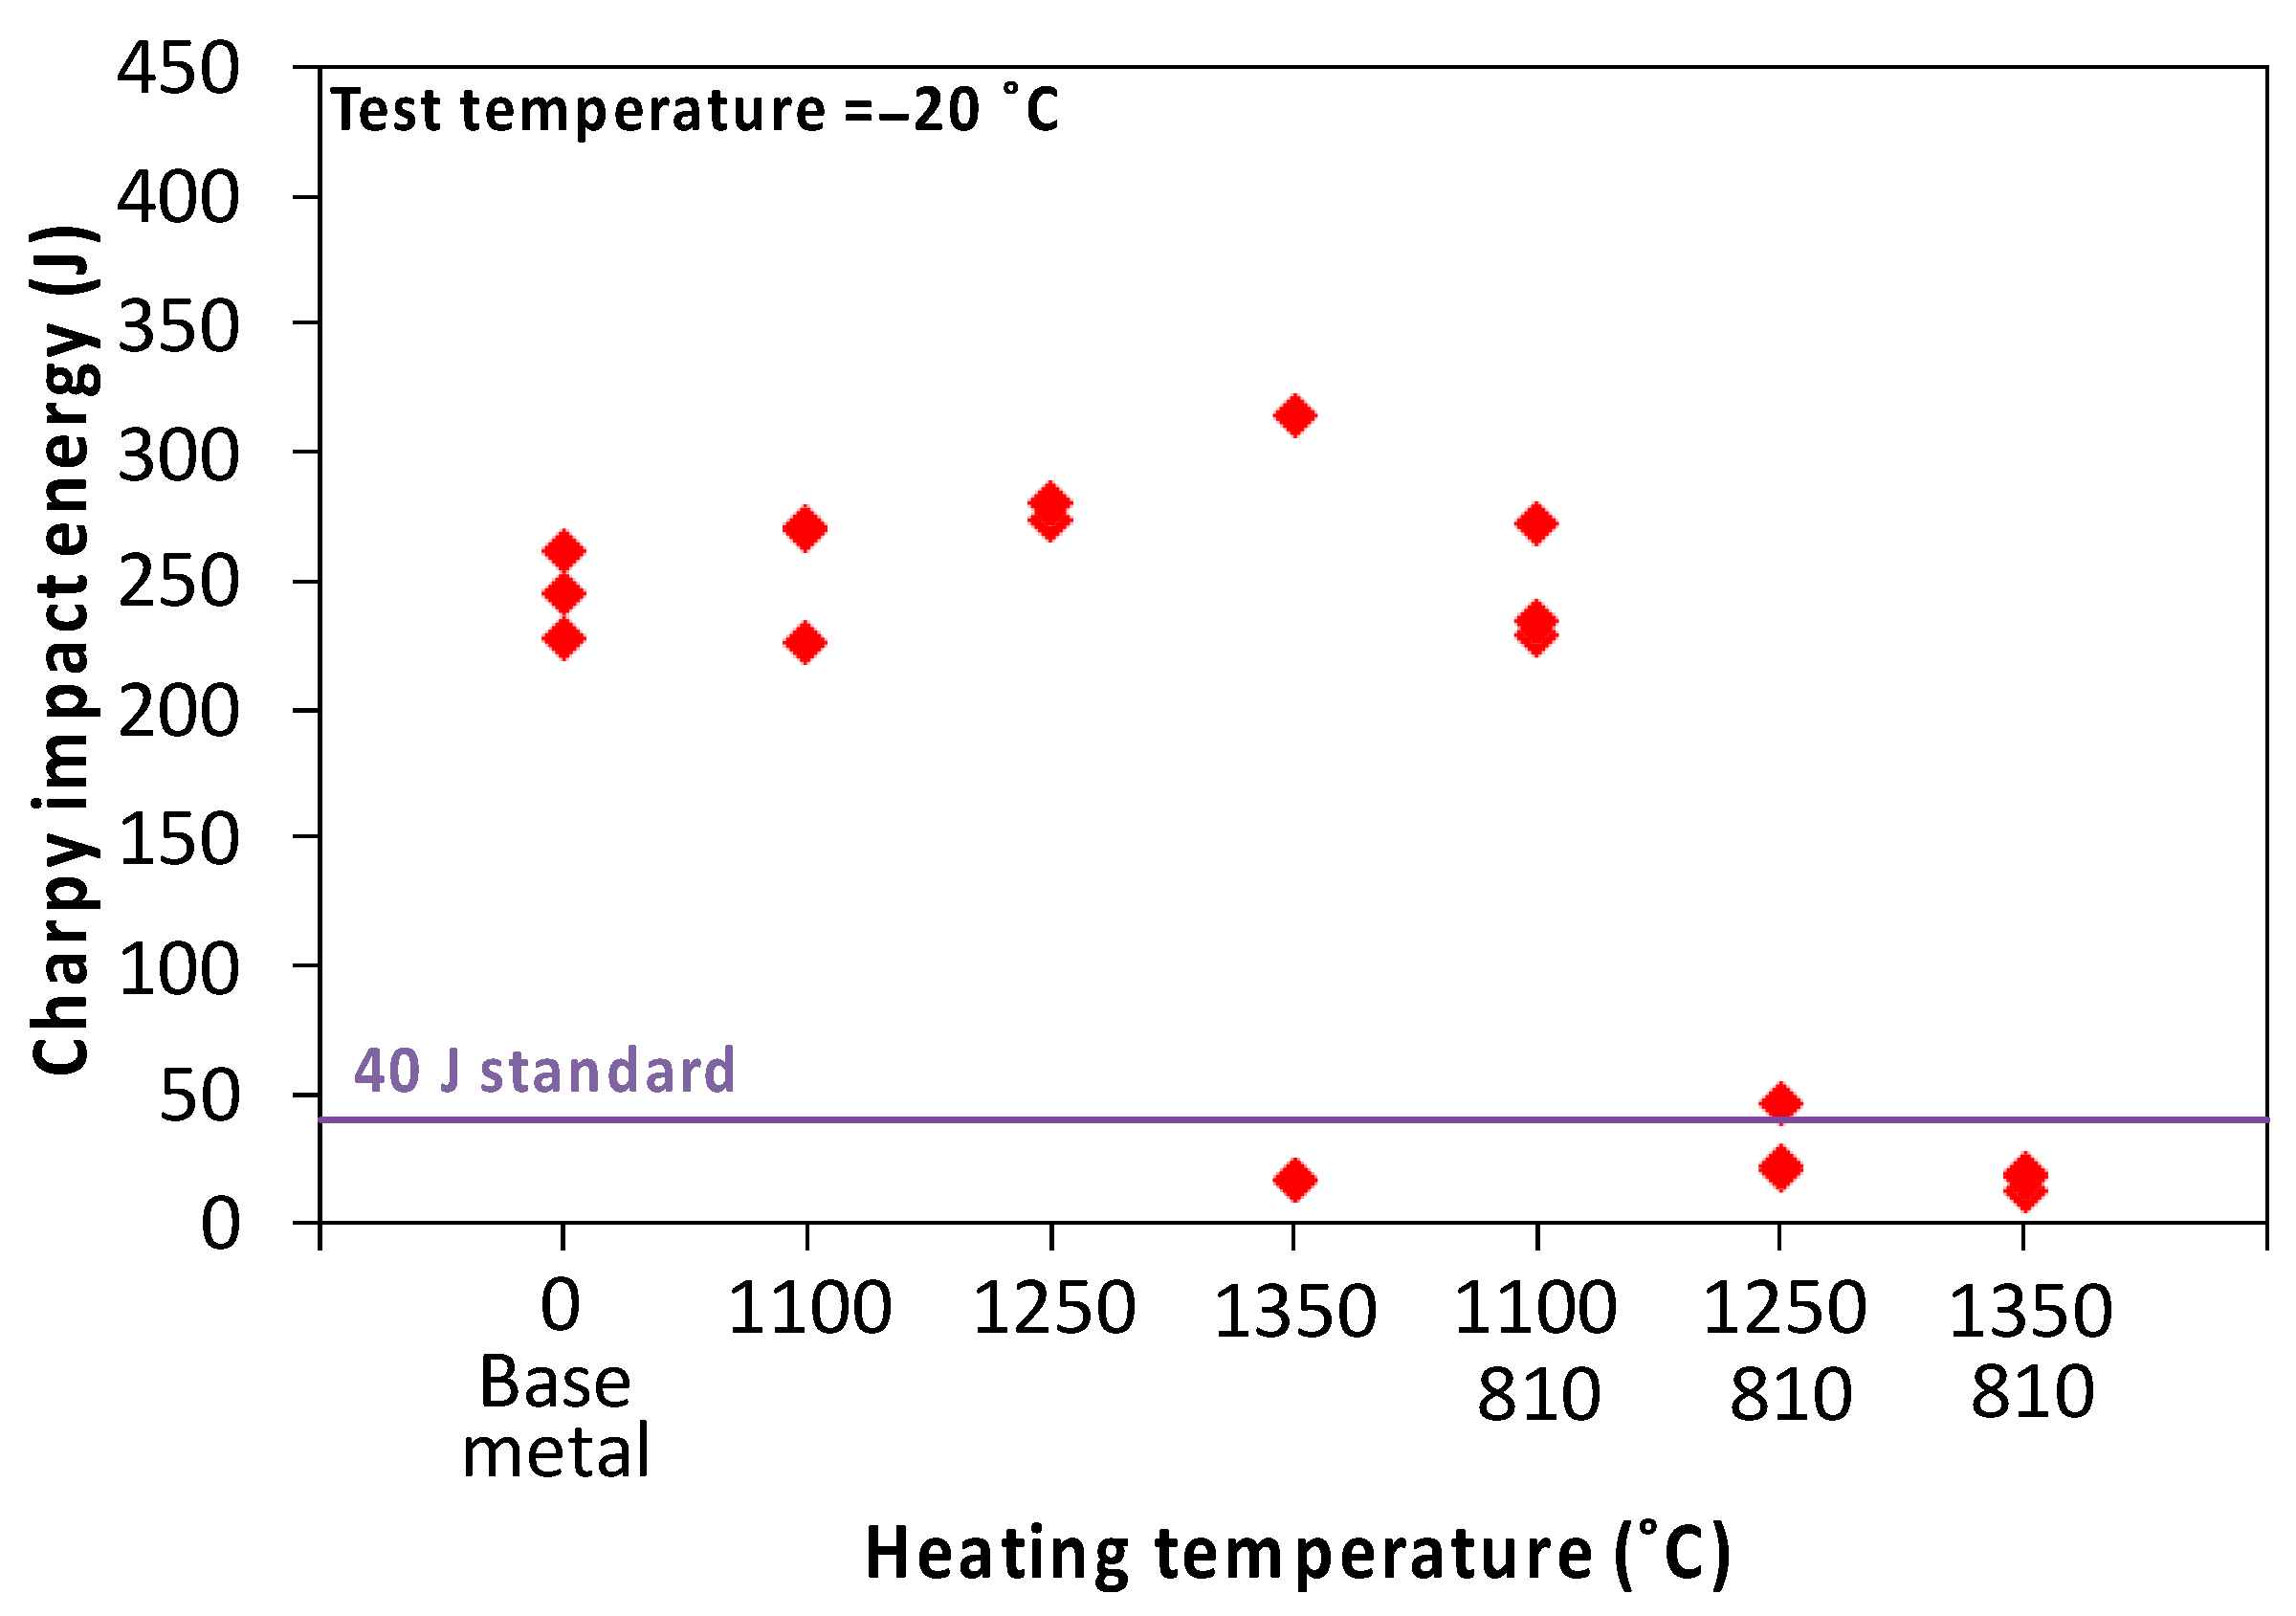
The corresponding Charpy impact toughness data are presented in Figure 27. It is clear that intercritical reheating at 810 °C had virtually no effect on the toughness when the first-pass peak temperature was 1100 °C with a fine PAGS. However, with increasing first-pass peak temperature and, consequently, increasing PAGS, the toughness considerably reduced. The lowest toughness was obtained for the sample simulated at Tp1 = 1350 °C with a necklace-type M–A constituent. Obviously, when the coarse grains were decorated by the M–A constituent after two-pass reheating, there was a significant drop in the toughness. The size of the M–A constituent was also influenced by the PAGS. Thus, the M–A constituent predominantly governed the toughness. Cleavage fracture-initiation mechanisms associated with the M–A constituent have been reported in previous studies [44,45,46]. It has been proposed that when there is a necklace-type M–A constituent, there is an “overlap in transformation-induced residual tensile stresses” and an enhancement in the stress concentration due to the strength mismatch between the M–A constituent and matrix during deformation. Thus, the M–A constituent, which presents as a continuous and interconnected structure, is detrimental to the toughness.

Figure 27.
Charpy impact energy variation as a function of first-pass peak temperature (Tp1) for simulated ICCGHAZ samples.
5.3. Influences of Thermal Treatments on Simulated ICCGHAZ
5.3.1. Rapid Tempering after Welding
Rapid tempering at high temperatures (from 500 to 700 °C) has recently been suggested to improve the impact toughness via carbide (cementite) refinement [47,48]. The time-scale of rapid-tempering heat treatments is said to limit the dislocation recovery, thereby providing increased nucleation sites for the formation of fine, dispersed cementite particles. The effects of rapid tempering were also investigated for martensitic steel within a lower tempering-temperature range, and a consistent improvement in toughness was observed [49,50,51]. Therefore, rapid tempering is considered as a solution to improve the toughness of the ICCGHAZ in this work via Gleeble thermal simulation.
Figure 28 presents the microstructural evolution with increasing rapid-tempering temperature. Similar microstructural constituents were identified in all the simulated samples, with obvious grain coarsening as the temperature increased. All the simulated samples showed the formation of a coarse necklace-type M–A constituent along the PAG. It was found that rapid tempering at 300 °C refined the PAG, while rapid tempering at 500 °C generated the lowest fraction of the M–A constituent. However, ether a lower cooling rate or a longer holding time apparently promoted the formation and coarsening of the M–A constituent throughout the entire microstructure (Figure 29).

Figure 28.
Microstructures of simulated ICCGHAZ samples after rapid tempering at different temperatures: (a) Tp1 = 1350 °C, Tp2 = 810 °C, and Tp3 = 300 °C; (b) Tp1 = 1350 °C, Tp2 = 810 °C, and Tp3 = 400 °C; (c) Tp1 = 1350 °C, Tp2 = 810 °C, and Tp3 = 500 °C; (d) Tp1 = 1350 °C, Tp2 = 810 °C, and Tp3 = 600 °C. PAG: prior austenite grain, GB: granular bainite, and M–A: martensite–austenite constituent.
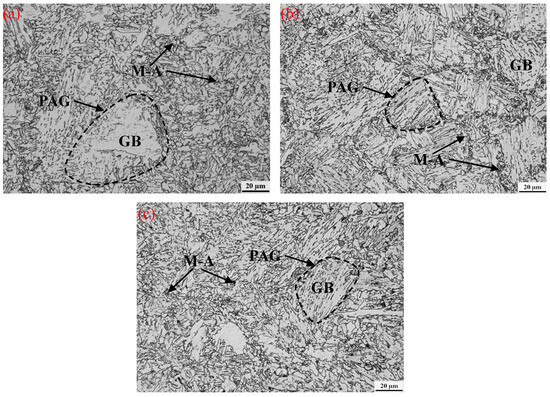
Figure 29.
Microstructures of simulated ICCGHAZ samples after rapid tempering at 500 °C, followed by different combinations of cooling rates and holding times: (a) holding for 1 s and slowing cooling at 5 °C/s, (b) holding for 30 s and He quenching, and (c) holding for 60 s and He quenching. PAG: prior austenite grain, GB: granular bainite, and M–A: martensite–austenite constituent.
The toughness variation is presented as functions of the rapid-tempering conditions in Figure 30. Only a slightly increase in toughness was observed after the rapid tempering. However, most of the toughness values were lower than the standard of 40 J. One or two values generated by rapid tempering at 300 and 500 °C, followed by quenching, barely met the requirements. The major reason could be that rapid tempering cannot prevent the formation of the M–A constituent, particularly of the necklace type, which severely decreases the Charpy toughness. The refined PAGS could contribute one good toughness value for the sample simulated by rapid tempering at 300 °C. In relation to rapid tempering at 500 °C, the two good toughness values for the simulated samples could be due to the obviously lower amount of the necklace-type M–A constituent compared with those in the other samples.
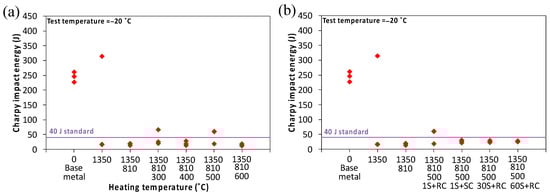
Figure 30.
Charpy impact energies of simulated ICCGHAZ samples after rapid tempering under different conditions: (a) rapid tempering at different temperatures and (b) rapid tempering at 500 °C, followed by different combinations of cooling rates and holding times.
5.3.2. Thermal Treatment before Welding
It has been proven by the above results in Section 4.3 that the toughness of the simulated CGHAZ samples was obviously improved by a special thermal treatment at a peak temperature of 800 °C. To further investigate the influence of this special thermal treatment on the ICCGHAZ, three passes of Gleeble thermal simulation were also carried out using a real weld HI of 4.2 kJ/mm. Only 800 °C was selected as the peak temperature of the first pass to apply the thermal treatment, and the remaining parameters for the first and second passes were kept the same. In terms of the third pass, the peak temperature was fixed at 810 °C with a cooling time of Δt8/5 = 28.93 s to produce the ICCGHAZ. A one-pass simulation was also conducted on the BM, using 800 °C as the peak temperature of the thermal treatment.
The BM microstructure after the single-pass thermal treatment, in Figure 31a, presented a mixture of ferrite, bainite, and a relatively large volume of the M–A constituent. It is interesting that the M–A constituent presented a more granular shape instead of the slender, blocky, or necklace type that was observed previously. A significant microstructural change was observed in the ICCGHAZ simulated by the thermal treatment (Figure 31b). The necklace-type M–A constituent was absent in the thermally treated samples compared with the original ICCGHAZ sample (Figure 23a), while the prominent microstructure was composed of lath bainite and granular bainite.

Figure 31.
Microstructures of samples simulated using thermal treatment at a peak temperature of 800 °C before welding: (a) BM and (b) ICCGHAZ. PF: polygonal ferrite, GB: granular bainite, LB: lath bainite, and M–A: martensite–austenite constituent.
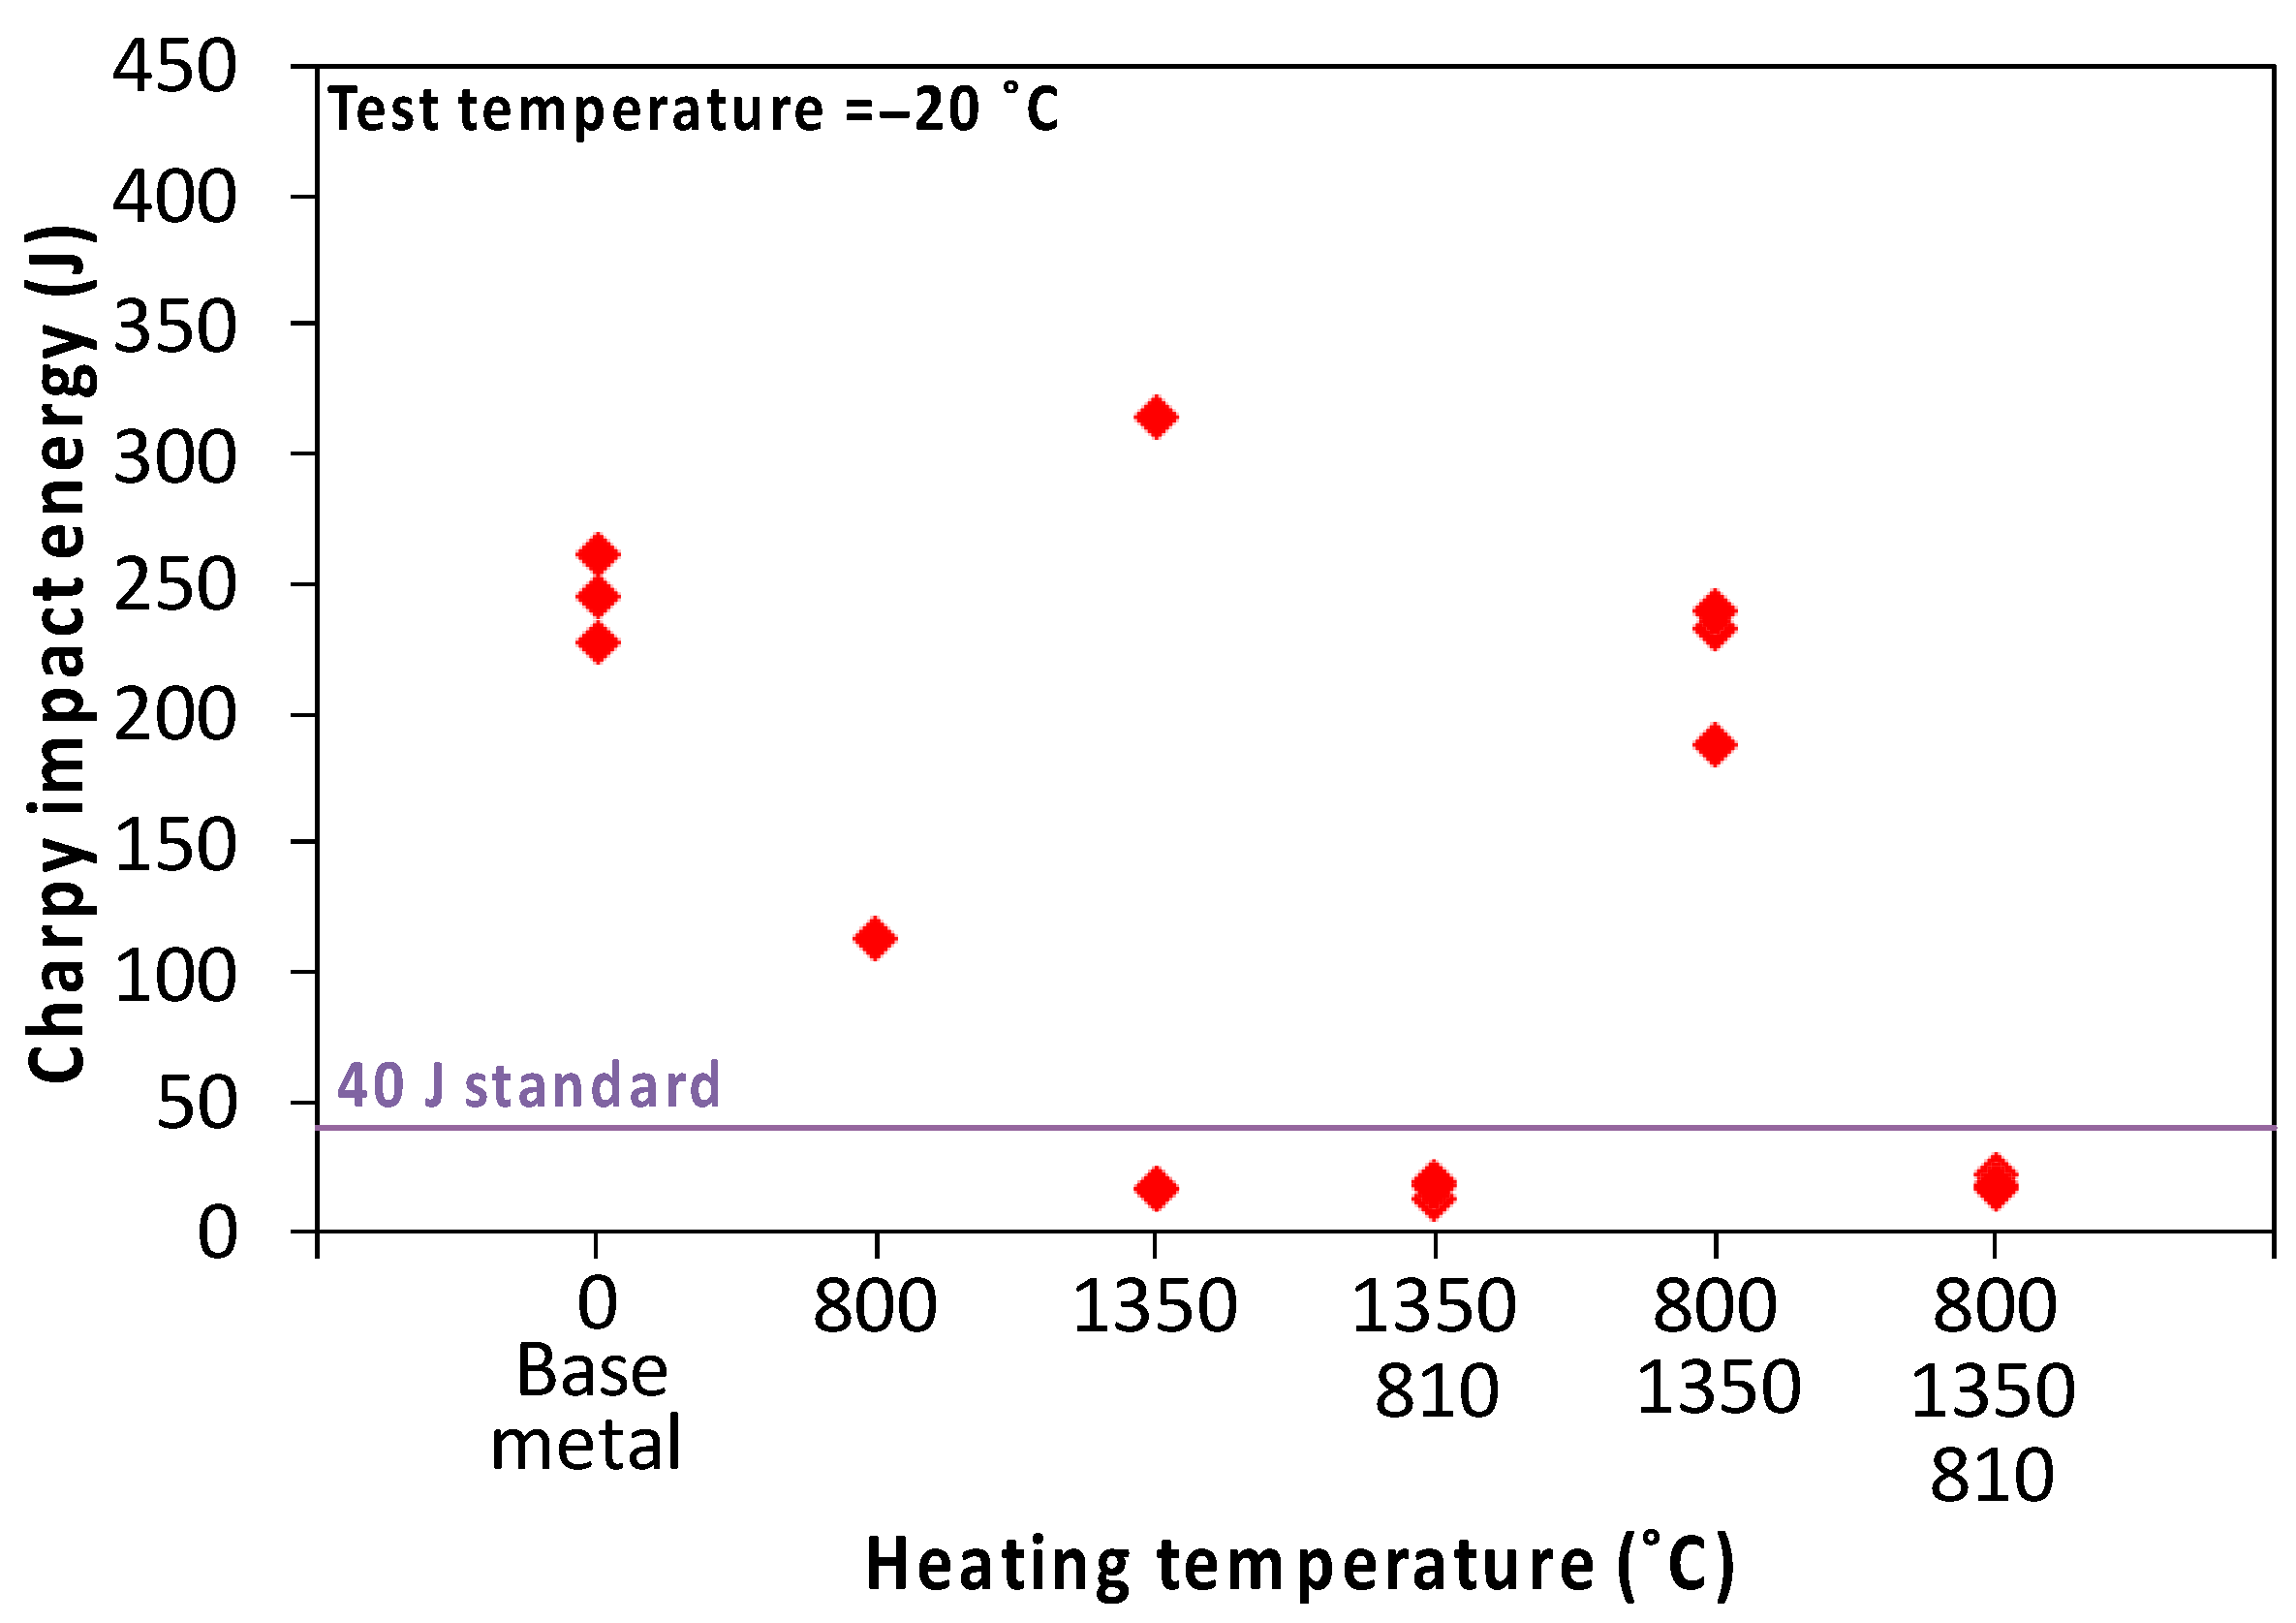
Figure 32 summarises the Charpy impact energies of the ICCGHAZ samples simulated with and without the thermal treatment. The impact energies of the base metal with and without the thermal treatment, CGHAZ with and without the thermal treatment, and the original ICCGHAZ were also included. Although the impact energy of the base metal was significantly reduced by the thermal treatment at a peak temperature of 800 °C before welding, the current steel exhibited acceptable toughness. It has been demonstrated in a previous study by other researchers [52] that the M–A phase possessing a granular shape does not initiate brittle fracture, and the bainite–MA steels exhibited no decrease in the ductile–brittle transition temperature. Therefore, the slight reduction in the impact energy can be attributed to the apparent grain coarsening. In addition, the special thermal treatment used in this study prevented the formation of the necklace-type M–A constituent along the PAG. However, the large PAG and generated microstructure constituents decreased the toughness. Therefore, the pre-welding thermal treatment failed to improve the toughness of the ICCGHAZ.
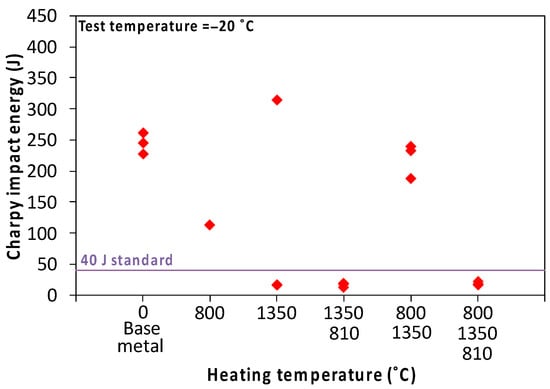
Figure 32.
Charpy impact energies of simulated samples with thermal treatment at a peak temperature of 800 °C before welding.
6. Conclusions
The present study focused on the low-temperature toughness (typically at −20 °C) of the double-V weld seams of thick-walled line pipes. A comprehensive study was performed to understand the effects of heat inputs in a wide range on the grain size and precipitate coarsening and the correlation between the microstructure and toughness of the HAZ. The following conclusions are reached:
- (1)
- An investigation was undertaken of the mid-thickness HAZ, using CVN tests at −20 °C, in an X70-grade pipe. The results showed that −20 °C was in the transition zone of the toughness, with a high degree of scattering from more than 200 J to less than 40 J;
- (2)
- It is considered that a high HI and a large PAGS are both detrimental to the CGHAZ toughness. It has been confirmed by thermal simulations of the CGHAZ at different heat inputs and PAGS measurement results that the CGHAZ toughness obviously decreased as a result of an increase in the heat input and the large PAGS induced by increased peak temperatures;
- (3)
- A number of thermal treatments were tested using Gleeble thermal simulations, and opportunities were identified to improve the CGHAZ toughness through the thermal treatment of the plate before welding. A specially designed thermal treatment for the plate was recommended to achieve improved CGHAZ toughness. The corresponding thermal cycle for this treatment involved peak temperatures of 700 and 800 °C with a cooling rate of 10 °C/s, holding for 1 s, followed by rapid cooling to 200 °C at a rate of 10 °C/s;
- (4)
- The thermal simulations of the ICCGHAZ microstructures at different intercritical reheating temperatures showed that an increase in the intercritical reheating temperature led to improved toughness. It has been confirmed that the necklace-type M–A constituent resulted in a decrease in the toughness. The microstructural characterisation revealed that the necklace-type M–A constituent only formed when the intercritical reheating temperature was just above Ac1. The results also indicated that large PAGSs promoted the formation of the necklace-type M–A constituent;
- (5)
- Owing to the combined effects of the large PAGs and detrimental microstructural constituents, the toughness of the simulated ICCGHAZ remained unchanged by either rapid tempering after welding or thermal treatment before welding;
- (6)
- In pipe construction, tack welding is typically used to secure the pieces in the correct alignment before the final, more comprehensive welding is performed. Regarding the two-pass SAW, optimising the use of tack welds has the potential to reduce the effective HI associated with the two main welds. Consequently, in future investigations, it would be valuable to explore the impact of modifying the current welding procedure, with a particular emphasis on the application of tack welds.
Author Contributions
Methodology, Y.M., L.F., H.L., L.S. (Leilei Sun), L.Z. and C.Z.; experimental design, Y.M., L.S. (Lihong Su), C.S., L.F., H.L., L.S. (Leilei Sun), L.Z. and C.Z.; formal analysis, Y.M. and H.L.; investigation, Y.M., L.S. (Lihong Su) and C.S.; data analysis, Y.M., L.S. (Lihong Su), C.S., L.F., H.L., L.S. (Leilei Sun) and L.Z.; resources, Y.M., L.F., H.L., L.S. (Leilei Sun), L.Z. and C.Z.; writing—original draft, Y.M.; writing—review and editing, Y.M., L.S. (Lihong Su), L.F. and H.L.; supervision, L.F. and H.L.; project administration, L.F. and H.L.; funding acquisition, H.L., L.S. (Leilei Sun), L.Z. and C.Z. All authors have read and agreed to the published version of the manuscript.
Funding
This work was financially supported by the Baosteel-Australia Joint Research and Development Centre under project BA16008.
Data Availability Statement
The data presented in this study are available on request from the corresponding author. The data are not publicly available due to privacy.
Acknowledgments
The authors would like to thank Liang Cheng at the University of Wollongong for her great support during the Gleeble thermal simulation.
Conflicts of Interest
Authors L.S. (Leilei Sun), L.Z. (Lei Zheng), and C.Z. (Chuanguo Zhang) were employed by the company Baoshan Iron & Steel Co., Ltd. The remaining authors declare that the research was conducted in the absence of any commercial or financial relationships that could be construed as a potential conflict of interest.
References
- Romualdi, N. Microstructure Evolution in the Coarse Grain Heat Affected Zone of Line Pipe Steels; University of British Columbia: Vancouver, BC, Canada, 2023. [Google Scholar]
- Dornelas, P.H.G.; Filho, J.D.C.P.; Moraes e Oliveira, V.H.P.; Moraes, D.D.O.; Zumpano Júnior, P. Effect of the interpass temperature on simulated heat-affected zone of gas metal arc welded API 5L X70 pipe joint. Int. J. Adv. Manuf. Technol. 2022, 119, 261–274. [Google Scholar] [CrossRef]
- Mohammadijoo, M.; Collins, L.; Rashid, M.; Arafin, M. Influence of Steel Chemistry and Field Girth Welding Procedure on Performance of API X70 Line Pipe Steels. In International Pipeline Conference; American Society of Mechanical Engineers: New York, NY, USA, 2020; p. V003T05A035. [Google Scholar]
- Saoudi, A.; Fellah, M.; Hezil, N.; Lerari, D.; Khamouli, F.; Atoui, L.; Bachari, K.; Morozova, J.; Obrosov, A.; Samad, M.A. Prediction of mechanical properties of welded steel X70 pipeline using neural network modelling. Int. J. Press. Vessel. Pip. 2020, 186, 104153. [Google Scholar] [CrossRef]
- Singh, M.P.; Shukla, D.K.; Kumar, R.; Arora, K.S. The structural integrity of high-strength welded pipeline steels: A review. Int. J. Struct. Integr. 2021, 12, 470–496. [Google Scholar] [CrossRef]
- Bhadeshia, H.K. Local Brittle Zones and the Role of Niobium. In Materials Science Forum; Trans Tech Publications Ltd.: Basel, Switzerland, 2014; Volume 783–786, pp. 2129–2135. [Google Scholar]
- Guillala, A.; Abdelbakib, N.; Gaceba, M.; Bettayeba, M. Effects of martensite-austenite constituents on mechanical properties of heat affected zone in high strength pipeline steels-review. Chem. Eng. 2018, 70, 583–588. [Google Scholar] [CrossRef]
- Chu, Q.; Xu, S.; Tong, X.; Li, J.; Zhang, M.; Yan, F.; Zhang, W.; Bi, Z.; Yan, C. Comparative Study of Microstructure and Mechanical Properties of X80 SAW Welds Prepared Using Different Wires and Heat Inputs. J. Mater. Eng. Perform. 2020, 29, 4322–4338. [Google Scholar] [CrossRef]
- Dagostini, V.D.S.; Moura, A.N.D.; Luz, T.D.S.; Castro, N.A.; Orlando, M.T.D.A.; Vieira, E.A. Microstructural analysis and mechanical behavior of the HAZ in an API 5L X70 steel welded by GMAW process. Weld. World 2021, 65, 1051–1060. [Google Scholar] [CrossRef]
- Hu, B.; Wang, Q.; Wang, Q. Effect of Heat Input on Microstructure and Tensile Properties in Simulated CGHAZ of a V-Ti-N Microalloyed Weathering Steel. Metals 2023, 13, 1607. [Google Scholar] [CrossRef]
- Zhu, Z.; Han, J.; Li, H. Influence of heat input on microstructure and toughness properties in simulated CGHAZ of X80 steel manufactured using high-temperature processing. Met. Mater. Trans. A 2015, 46, 5467–5475. [Google Scholar] [CrossRef]
- Zhou, P.; Wang, B.; Wang, L.; Hu, Y.; Zhou, L. Effect of welding heat input on grain boundary evolution and toughness properties in CGHAZ of X90 pipeline steel. Mater. Sci. Eng. A 2018, 722, 112–121. [Google Scholar] [CrossRef]
- Arakawa, T.; Nishimura, K.; Yano, K.; Suzuki, N. Development of high performance UOE pipe for linepipe. JFE Tech. Rep. 2013, 1, 23–35. [Google Scholar]
- Fu, C.; Li, X.; Li, H.; Han, T.; Han, B.; Wang, Y. Influence of ICCGHAZ on the Low-Temperature Toughness in HAZ of Heavy-Wall X80 Pipeline Steel. Metals 2022, 12, 907. [Google Scholar] [CrossRef]
- Gordienko, A.; Derevyagina, L.; Malikov, A.; Orishich, A.; Surikova, N.; Volochaev, M. The effect of the initial microstructure of the X70 low-carbon microalloyed steel on the heat affected zone formation and the mechanical properties of laser welded joints. Mater. Sci. Eng. A 2020, 797, 140075. [Google Scholar] [CrossRef]
- De-Castro, D.; Eres-Castellanos, A.; Vivas, J.; Caballero, F.G.; San-Martín, D.; Capdevila, C. Morphological and crystallographic features of granular and lath-like bainite in a low carbon microalloyed steel. Mater. Charact. 2022, 184, 111703. [Google Scholar] [CrossRef]
- Zhu, Z. Structure Property Correlation in the Weld HAZ of High Strength Line Pipe Steels. Ph.D. Thesis, School of Mechanical, Materials and Mechatronics Engineering, University of Wollongong, Wollongong, Australia, 2013. Available online: https://ro.uow.edu.au/theses/3989 (accessed on 23 August 2013).
- Zhu, Z.; Kuzmikova, L.; Li, H.; Barbaro, F. The effect of chemical composition on microstructure and properties of intercritically reheated coarse-grained heat-affected zone in X70 steels. Met. Mater. Trans. B 2013, 45, 229–235. [Google Scholar] [CrossRef]
- Zhu, Z.; Han, J.; Li, H. Effect of alloy design on improving toughness for X70 steel during welding. Mater. Des. 2015, 88, 1326–1333. [Google Scholar] [CrossRef]
- Jorge, J.; Souza, L.; Mendes, M.; Bott, I.; Araújo, L.; Santos, V.; Rebello, J.; Evans, G. Microstructure characterization and its relationship with impact toughness of C–Mn and high strength low alloy steel weld metals—A review. J. Mater. Res. Technol. 2021, 10, 471–501. [Google Scholar] [CrossRef]
- Cho, L.; Tselikova, A.; Holtgrewe, K.; De Moor, E.; Schmidt, R.; Findley, K.O. Critical assessment 42: Acicular ferrite formation and its influence on weld metal and heat-affected zone properties of steels. Mater. Sci. Technol. 2022, 38, 1425–1433. [Google Scholar] [CrossRef]
- Wang, J.; Shen, Y.; Xue, W.; Jia, N.; Misra, R. The significant impact of introducing nanosize precipitates and decreased effective grain size on retention of high toughness of simulated heat affected zone (HAZ). Mater. Sci. Eng. A 2021, 803, 140484. [Google Scholar] [CrossRef]
- Okatsu, M.; Oi, K.; Ihara, K.; Hoshino, T. High strength linepipe with excellent HAZ toughness. In Proceedings of the ASME 2004 23rd International Conference on Offshore Mechanics and Arctic Engineering, Vancouver, BC, Canada, 20–25 June 2004; Volume 2, pp. 751–756. [Google Scholar]
- Moon, J.; Lee, J.; Lee, C. Prediction for the austenite grain size in the presence of growing particles in the weld HAZ of Ti-microalloyed steel. Mater. Sci. Eng. A 2007, 459, 40–46. [Google Scholar] [CrossRef]
- Moon, J.; Lee, C. Behavior of (Ti, Nb)(C, N) complex particle during thermomechanical cycling in the weld CGHAZ of a microalloyed steel. Acta Mater. 2009, 57, 2311–2320. [Google Scholar] [CrossRef]
- Li, B.; Liu, Q.; Jia, S.; Ren, Y.; Yang, P. Effect of V content and heat input on HAZ softening of deep-sea pipeline steel. Materials 2022, 15, 794. [Google Scholar] [CrossRef] [PubMed]
- Hu, J.; Du, L.-X.; Wang, J.-J.; Xie, H.; Gao, C.-R.; Misra, R. High toughness in the intercritically reheated coarse-grained (ICRCG) heat-affected zone (HAZ) of low carbon microalloyed steel. Mater. Sci. Eng. A 2014, 590, 323–328. [Google Scholar] [CrossRef]
- Liu, D.; Cheng, B.; Chen, Y. Strengthening and Toughening of a Heavy Plate Steel for Shipbuilding with Yield Strength of Approximately 690 MPa. Met. Mater. Trans. A 2013, 44, 440–455. [Google Scholar] [CrossRef]
- Wang, X.; Ma, X.; Wang, Z.; Subramanian, S.; Xie, Z.; Shang, C.; Li, X. Carbon microalloying effect of base material on variant selection in coarse grained heat affected zone of X80 pipeline steel. Mater. Charact. 2019, 149, 26–33. [Google Scholar] [CrossRef]
- Zhang, T.; Roy, S.; Patra, S.; Poole, W.J.; Militzer, M. Intercritical Austenite Formation and Decomposition in the Coarse Grain Heat-Affected Zone of an X80 Line Pipe Steel. Met. Mater. Trans. A 2022, 53, 3239–3244. [Google Scholar] [CrossRef]
- Mandal, M.; Poole, W.; Militzer, M.; Collins, L. Mechanical Properties of Intercritically Annealed X80 Line Pipe Steels. Met. Mater. Trans. A 2021, 52, 1336–1352. [Google Scholar] [CrossRef]
- Efron, L.I.; Stepanov, P.P.; Zharkov, S.V.; Chastukhin, A.V. Investigation of Low-Carbon Pipeline Steel Weldability by Welding Thermal Cycle Simulation. Metallurgist 2022, 66, 909–921. [Google Scholar] [CrossRef]
- Mohamed, A.Y.; Mohamed, A.H.A.; Hamid, Z.A.; Farahat, A.I.Z.; El-Nikhaily, A.E. Effect of heat treatment atmospheres on microstructure evolution and corrosion resistance of 2205 duplex stainless steel weldments. Sci. Rep. 2023, 13, 4592. [Google Scholar] [CrossRef]
- Kah, P.; Jibril, A.; Martikainen, J.; Suoranta, R. Process possibility of welding thin aluminium alloys. Int. J. Mech. Mater. Eng. 2012, 7, 232–242. [Google Scholar]
- ASTM Standard, E384-22; A Standard Test Method for Microindentation Hardness of Materials. ASTM International: Philadelphia, PA, USA, 2022. Available online: https://www.astm.org/e0384-22.html (accessed on 1 December 2023).
- Offeshore Standard, DNV-OS-F101; Submarine Pipeline Systems. DNV, DET NORSKE VERITAS AS: Bærum, Norway, 2013. Available online: http://www.opimsoft.cn/download/reference/os-f101_2013-10.pdf (accessed on 1 December 2023).
- ASTM Standard, E23-23a; Standard Test Methods for Notched Bar Impact Testing of Metallic Materials. ASTM International: Philadelphia, PA, USA, 2023. Available online: https://www.astm.org/e0023-23a.html (accessed on 1 December 2023).
- Wang, X.L.; Wang, Z.Q.; Xie, Z.J.; Ma, X.P.; Subramanian, S.; Shang, C.; Li, X.C.; Wang, J.L. Combined effect of M/A constituent and grain boundary on the impact toughness of CGHAZ and ICCGHAZ of E550 grade offshore engineering steel. Math. Biosci. Eng. 2019, 16, 7494–7509. [Google Scholar] [CrossRef]
- ISO Standard, ISO 3183; Petroleum and natural gas industries Steel pipe for pipeline transportation systems. The International Organization for Standardization (ISO): Geneva, Switzerland, 2019. Available online: https://www.iso.org/obp/ui/#iso:std:iso:3183:ed-4:v1:en (accessed on 1 December 2023).
- Zhang, Y.; Zhang, H.; Liu, W.; Hou, H. Effects of Nb on microstructure and continuous cooling transformation of coarse grain heat-affected zone in 610 MPa class high-strength low-alloy structural steels. Mater. Sci. Eng. A 2009, 499, 182–186. [Google Scholar] [CrossRef]
- Takahashi, M. Recent progress: Kinetics of the bainite transformation in steels. Curr. Opin. Solid State Mater. Sci. 2004, 8, 213–217. [Google Scholar] [CrossRef]
- Li, C.; Wang, Y.; Han, T.; Han, B.; Li, L. Microstructure and toughness of coarse grain heat-affected zone of domestic X70 pipeline steel during in-service welding. J. Mater. Sci. 2011, 46, 727–733. [Google Scholar] [CrossRef]
- Luo, X.; Chen, X.; Wang, T.; Pan, S.; Wang, Z. Effect of morphologies of martensite–austenite constituents on impact toughness in intercritically reheated coarse-grained heat-affected zone of HSLA steel. Mater. Sci. Eng. A 2018, 710, 192–199. [Google Scholar] [CrossRef]
- Davis, C.L.; King, J.E. Cleavage initiation in the intercritically reheated coarse-grained heat-affected zone: Part I. Fractographic evidence. Met. Mater. Trans. A 1994, 25, 563–573. [Google Scholar] [CrossRef]
- Li, X.; Ma, X.; Subramanian, S.; Shang, C.; Misra, R. Influence of prior austenite grain size on martensite–austenite constituent and toughness in the heat affected zone of 700MPa high strength linepipe steel. Mater. Sci. Eng. A 2014, 616, 141–147. [Google Scholar] [CrossRef]
- Huda, N.; Midawi, A.; Gianetto, J.A.; Gerlich, A.P. Continuous cooling transformation behaviour and toughness of heat-affected zones in an X80 line pipe steel. J. Mater. Res. Technol. 2021, 12, 613–628. [Google Scholar] [CrossRef]
- Revilla, C.; López, B.; Rodriguez-Ibabe, J. Carbide size refinement by controlling the heating rate during induction tempering in a low alloy steel. Mater. Des. 2014, 62, 296–304. [Google Scholar] [CrossRef]
- Sackl, S.; Zuber, M.; Clemens, H.; Primig, S. Induction Tempering vs Conventional Tempering of a Heat-Treatable Steel. Met. Mater. Trans. A 2016, 47, 3694–3702. [Google Scholar] [CrossRef]
- Gáspár, M.; Sisodia, R. Improving the HAZ toughness of Q+T high strength steels by post weld heat treatment. In IOP Conference Series: Materials Science and Engineering; IOP Publishing: Bristol, UK, 2018; Volume 426, p. 012012. [Google Scholar]
- Judge, V.K.; Speer, J.G.; Clarke, K.D.; Findley, K.O.; Clarke, A.J. Rapid Thermal Processing to Enhance Steel Toughness. Sci. Rep. 2018, 8, 1–6. [Google Scholar] [CrossRef]
- Euser, V.K.; Clarke, A.J.; Speer, J.G. Rapid Tempering: Opportunities and Challenges. J. Mater. Eng. Perform. 2020, 29, 4155–4161. [Google Scholar] [CrossRef]
- Okatsu, M.; Shikanai, N.; Kondo, J. Development of a high-deformability linepipe with resistance to strain-aged hardening by HOP®(heat-treatment on-line process). JFE Tech. Rep. 2008, 12, 8–14. [Google Scholar]


Disclaimer/Publisher’s Note: The statements, opinions and data contained in all publications are solely those of the individual author(s) and contributor(s) and not of MDPI and/or the editor(s). MDPI and/or the editor(s) disclaim responsibility for any injury to people or property resulting from any ideas, methods, instructions or products referred to in the content. |
© 2023 by the authors. Licensee MDPI, Basel, Switzerland. This article is an open access article distributed under the terms and conditions of the Creative Commons Attribution (CC BY) license (https://creativecommons.org/licenses/by/4.0/).