Abstract
The influence of normal rolling and cross-rolling on the microstructure, mechanical properties, and anisotropy of Al-3Li-1Cu-0.4Mg-0.1Er-0.1Zr alloy was investigated. With an increase in the rolling reduction amount, both the strength and plasticity of the alloy are enhanced. Among them, the alloy in the normal rolling state with a deformation amount of 90% exhibits the best properties, with a tensile strength of 362 MPa and an elongation of 19.1% along the rolling direction. During the rolling process, the intergranular Cu-containing phase in the alloy is continuously broken and dissolved, leading to a decrease in both size and quantity, turning from continuous distribution along grain boundaries to a granular distribution. Moreover, a large quantity of the Al3Li phase and Al3(Er, Zr, Li) core–shell composite phase are precipitated in the alloy. Recrystallization occurs mainly through the particle stimulated nucleation (PSN) mechanism. Cross-rolling eliminates the brass-type texture <111> produced by normal rolling and enhances the brass R-type texture {111}<112>. The index of plane anisotropy (IPA) of the strength decreases from 10.1% for normal rolling to 5.5% for cross-rolling, and the IPA of elongation decreases from 12.8% to 3.3%. Cross-rolling provides an effective method to reduce the anisotropy of Al-Li alloys.
1. Introduction
Al-Li alloys are considered to be the ideal lightweight, high-strength structural materials in the aerospace field due to their high elastic modulus, high specific strength, low density, good weldability, and corrosion resistance [1,2,3]. After deformation processing, the microstructure of Al-Li alloys can be improved to enhance their mechanical properties and ultimately obtain the desired sheets or plates [4]. The main deformation processes for Al-Li alloys include rolling, extrusion, and stretching. Among them, rolling is one of the most commonly used deformation processes [5,6,7].
During the hot rolling process, the microstructure and mechanical properties undergo a series of changes, such as work hardening, dynamic softening, dissolution and precipitation of second phases, and grain preferential orientation [8,9,10]. An appropriate hot rolling process can not only reduce the anisotropy but also enhance mechanical properties of the alloy. Ye et al. [11] investigated the effects of different methods of thermomechanical processing on the precipitation behavior, crystallographic texture, and tensile properties of Al-Cu-Li alloy (AA2195). The results showed that although HC-T8-processed alloy had higher tensile strength and elongation compared to H-T8-processed alloy, the strength anisotropy of HC-T8 alloy was more pronounced. The higher dislocation density existed in the H-T8 samples, which promoted the nucleation of strengthening phase T1 in the matrix and suppressed the precipitation at grain boundary, resulting in better strength and ductility. Zhuo et al. [12] investigated the effects of the combined processing methods of heat treatment and rolling on the mechanical properties of Al-6Si-3Cu alloy. After solution treatment and rolling deformation, the as-cast Al alloy exhibited a tensile strength increased by 105%, reaching 429.8 MPa, and an improved elongation by 76%, reaching 5.8%. The increased ductility compared to as-cast alloy is due to the fragmentation and refinement of Si particles and dissolution of coarse precipitates.
Different rolling deformation processes have different effects on the texture of alloys, thus influencing the anisotropy of alloys [13,14,15]. Huh et al. [16] found that an AA5182 alloy sheet improved its strong texture through cross-rolling accompanied by recrystallization texture. Niraj et al. [17] found that AA2195 alloy exhibited typical copper texture after conventional rolling, while it showed a brass texture after cross-rolling. Li et al. [18] investigated the effects of cross-rolling and annealing on the microstructure and mechanical properties of AA7075 alloy and found that cross-rolling reduced the intensity of dominant textures, such as brass and S grain orientations, causing the decreased anisotropy of the alloy. However, texture is not the sole factor affecting the anisotropy of Al-Li alloys. Other factors, such as the presence of grain-boundary-precipitation-free zones and the type and size of second phases, also influence the anisotropy [19,20,21].
In this work, Al-3Li-1Cu-0.4Mg-0.1Er-0.1Zr alloy was processed with normal rolling and cross-rolling at 500 °C. The alloy with a low anisotropy was obtained through the cross-rolling process. The evolution of the microstructure, mechanical properties, and anisotropy under different rolling processes was investigated.
2. Materials and Methods
Al-3Li-1Cu-0.4Mg-0.1Er-0.1Zr alloy was melted and cast using commercial pure ingots of Al (99.9 wt.%), Li (99.9 wt.%), and Mg (99.9 wt.%) and master alloy ingots of Al-50 wt.%Cu, Al-10 wt.%Er, and Al-10 wt.%Zr. Subsequently, the as-cast alloy was subjected to homogenization annealing at 500 °C for 24 h followed by furnace cooling. The chemical composition of the alloy was determined using inductively coupled plasma atomic emission spectroscopy, as shown in Table 1.

Table 1.
The chemical composition of the as-received Al-3Li-1Cu-0.4Mg-0.1Er-0.1Zr alloy.
In the normal rolling, the rolling direction was kept unchanged. In this study, sheet materials with initial thicknesses of 2.5 mm, 4 mm, and 20 mm were rolled to a final thickness of 2 mm, resulting in corresponding deformation rates of 20%, 50%, and 90%, respectively. Each reduction in thickness for each pass was set at 0.4 mm. The different initial thicknesses of the sheet materials resulted in deformation rates of 16%, 10%, and 2% for the respective thicknesses. The rolling was conducted at 500 °C with a roll diameter of 500 mm and a roll speed of 600 r/min. Prior to rolling, the specimens were heated to 500 °C using a resistance furnace, and the temperature was held for 30 min. At the intervals between two passes, the specimens were kept in the resistance furnace for 5 min. The final rolled sheet thickness was 2 mm.
In the cross-rolling, the initial thickness was set as 20 mm. Other parameters were the same as in the normal rolling process except for the change in rolling direction between passes. Two rolling directions were selected: one was the initial rolling direction (RD), and the other was perpendicular to the previous rolling direction (TD). The rolling process was performed alternately between these two directions, and the alloy was ultimately rolled to a thickness of 2 mm.
The mechanical properties of the specimens were measured by a WDW3050 electronic universal testing machine. The tensile specimen dimensions are shown in Figure 1. The nominal strain rate was 1 × 10⁻³s−1. Five parallel samples were selected for testing in the same state, and the average value was taken. In order to investigate the effect of rolling processes on the anisotropy of Al-Li alloy, the conventional rolled alloy with 90% deformation and the cross-rolled alloy were taken for tensile testing. The specimens were cut at 0°, 45°, and 90° with respect to the rolling direction (RD direction), as shown in Figure 1.
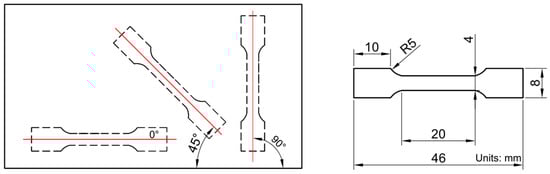
Figure 1.
The locations and dimensions of the tensile specimens.
Phase analysis was carried out by X-ray diffraction (XRD, Rigaku TTR-III) with a copper foil target, tube voltage 40 kv, tube current 110 mA, scanning speed of 2°/min, start angle of 10°, and end angle of 90°. The microstructure and tensile fracture morphology of the rolled alloy were observed using a Hitachi SU5000 scanning electron microscope (SEM) with an attached energy dispersive spectrometer (EDS) to measure the chemical compositions of the phases. The morphology, composition, and distribution of the second phase in the rolled alloy were observed and characterized using a JEM-2100EX transmission electron microscope (TEM). The texture measurements of the specimens were conducted using a Hitachi SU5000 SEM electron backscatter diffraction (EBSD) system. After the testing, HKL Channel 5 software was used to process and analyze the collected data, outputting inverse pole figures, pole figures, and orientation distribution function (ODF) maps.
3. Results and Discussion
3.1. Microstructure and Mechanical Properties of Different Rolling Reductions
3.1.1. Microstructural Evolution during Rolling with Different Reductions
As shown in Figure 2, the gray-white phase represents Cu-rich phases, while the bright-white phase is a mixed phase mainly composed of Cu-rich phases. Figure 2a,b show that after 20% deformation rolling, a small amount of Cu-rich phases near the grain boundaries are fragmented in blocklike shapes, while the majority of the Cu-rich phases still maintain continuous distribution along the grain boundaries. After 50% deformation rolling, more Cu-rich phases that were originally continuously distributed along the grain boundaries are fragmented in particle-like shapes, as shown in Figure 2c,d. It can also be observed that the Cu-rich phases that have not been completely fragmented still distribute along the grain boundaries, but they have transformed from large blocklike shape to fine elongated strips. Overall, there is a reduction in the quantity of Cu-rich phases. After 90% deformation rolling, the Cu-rich phases that are originally continuously distributed along the grain boundaries in the Al-Li alloy are completely fragmented into particles, as shown in Figure 2e,f. From general observation, the quantity of Cu-rich phases in the alloy after 90% deformation rolling is significantly reduced, and there are almost no larger Cu-rich phases.
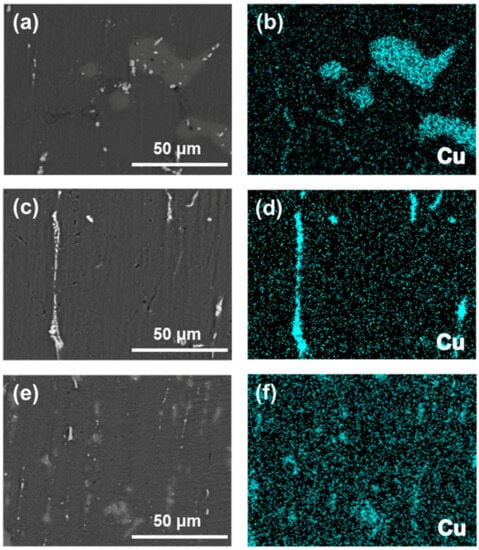
Figure 2.
SEM images and their corresponding EDS mapping of Cu element in the RD–ND plane of Al-3Li-1Cu-0.4Mg-0.1Er-0.1Zr alloys with different rolling deformations: (a,b) 20%, (c,d) 50%, and (e,f) 90%.
XRD patterns of Al-Li alloys with deformation amounts of 20%, 50%, and 90% are presented in Figure 3. In 20% and 50% deformed Al-Li alloys, only the diffraction peaks of α-Al and Al2Cu are observed. By comparing the XRD patterns of the 20%, 50%, and 90% deformed Al-Li alloys, it can be noticed that the intensity of the Al2Cu phase diffraction peak significantly decreases in the 90% deformed Al-Li alloy, indicating that a large amount of Al2Cu phase is dissolved into the matrix. Moreover, besides the diffraction peaks of α-Al and Al2Cu, some new diffraction peaks of Al3Li phase appear, indicating that a large amount of the Al3Li phase is dynamically precipitated. However, according to the literature, there are also Al3Zr phase, Al3Er phase, Al3(Er, Zr) phase, and Al3(Er, Zr, Li) composite phase with the same crystal structure as the Al3Li phase, which all have an L12 crystal structure [5]. Therefore, based on the XRD patterns of the 90% deformed Al-Li alloy in the rolled state, it is possible that besides the dynamic precipitation of the Al3Li phase, the dynamic precipitations of the Al3Zr phase, Al3Er phase, Al3(Er, Zr) phase, and Al3(Er, Zr, Li) composite phase also occur during the hot rolling process.
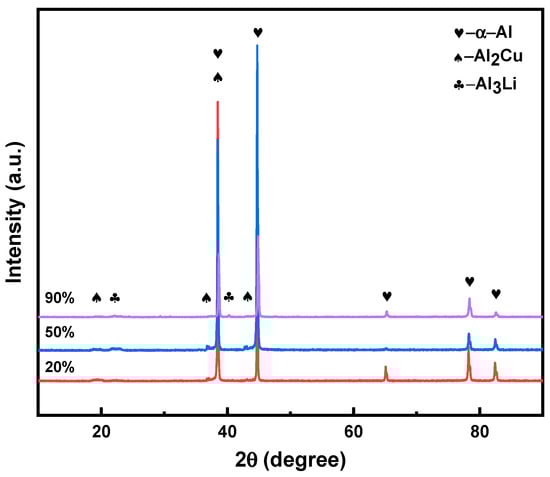
Figure 3.
The XRD patterns of Al-3Li-1Cu-0.4Mg-0.1Er-0.1Zr alloys with rolling deformation amounts of 20%, 50%, and 90%, respectively.
Figure 4 shows the TEM dark-field image of the Al-Li alloys in the as-rolled state at 90% deformation and the selected-area electron diffraction (SAED) pattern along the [011]Al axis. It can be observed that there is a large number of bright spherical nanoscale second phases, which exhibit the typical morphology of the Al3Li phase. From Figure 4b, the electron diffraction pattern can be identified as two sets of diffraction spots: one set originates from the face center cubic (FCC) lattice of the matrix, which is α-Al, and the other set represents the L12-type superlattice diffraction spots embedded in the FCC diffraction spots. It can be concluded that the dispersed bright spherical second phase in Figure 4a is an Al3Li phase with an L12 crystal structure. Additionally, there are also some dark nanoscale second phases, which are much larger in size compared to the Al3Li phase. These phases have a dark center and a white circular shell, showing a typical core–shell structure. These phases are possibly Al3(Er, Li) composite phases, Al3(Zr, Li) composite phases, or Al3(Er, Zr, Li) composite phases, where the inner layer consists of Al3Er, Al3Zr, or Al3(Er, Zr) composite phases and the outer white shell consists of an Al3Li phase [22,23].
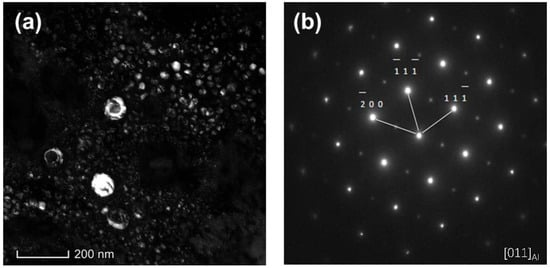
Figure 4.
The dark-field TEM images of a 90% rolled state Al-3Li-1Cu-0.4Mg-0.1Er-0.1Zr alloy and the electron diffraction spots of the [011]Al axis: (a) dark phase, and (b) electron diffraction pattern.
As shown in Figure 5, the high-resolution transmission electron microscope (HRTEM) image reveals the presence of a core–shell composite phase, and corresponding diffraction patterns were obtained by performing a Fourier transform at different positions within the core–shell structure. Further analysis was conducted to investigate the structural composition of the core–shell phase. In Figure 5a, a clear observation of the core–shell structured phase can be made, where the core region and shell region of the core–shell structured phase are marked with dashed lines. It can be clearly seen that the core region of the Al3(Er, Zr) composite phase has a darker contrast, followed by the brighter shell region, and then the darker α-Al matrix region. Subsequently, a Fourier transform was performed on these three regions, resulting in the respective diffraction patterns. It can be observed from Figure 5d that the Fourier transform diffraction at the α-Al matrix region surrounding the core–shell structured phase is a typical FCC diffraction. From Figure 5b,c, it can be observed that the Fourier transform diffraction patterns at the core position and shell position of the core–shell structured phase correspond to L12-type superlattice diffractions. Based on the above analysis, although both the core and shell of the core–shell structure exhibit L12-type superlattice diffraction, the diffraction pattern obtained through the Fourier transform indicates that the core structure corresponds to the Al3Li phase while the shell corresponds to the Al3(Er, Zr) phase. Therefore, the core–shell structure can be described as a composite phase of Al3(Er, Zr, Li) [24,25,26].
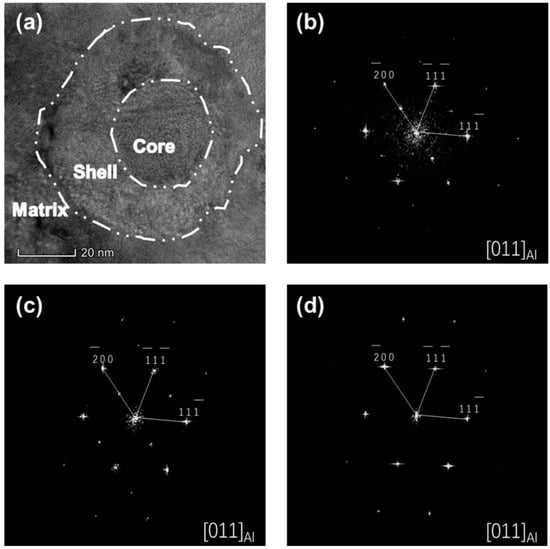
Figure 5.
HRTEM images of core–shell structured composite phases in 90% cold rolled Al-3Li-1Cu-0.4Mg-0.1Er-0.1Zr alloy and the corresponding Fourier transform diffraction patterns obtained at different positions of the core–shell structure: (a) HRTEM image, (b) Fourier transform diffraction pattern at the core position, (c) Fourier transform diffraction pattern at the shell position, and (d) Fourier transform diffraction pattern at the matrix position.
3.1.2. Mechanical Properties during Rolling with Different Reductions
The stress–strain curves of Al-3Li-1Cu-0.4Mg-0.1Er-0.1Zr alloys with different rolling deformations are shown in Figure 6. With the increase in rolling deformation, the mechanical properties of the alloys, including tensile strength, yield strength, and elongation, continuously improve, with the best mechanical properties achieved at the 90% deformation. The as-rolled Al-Li alloy with 20% deformation has a tensile strength of 102 MPa and an elongation of 1.1%, but it does not exhibit yielding. When the rolling deformation increases to 50%, the tensile strength, yield strength, and elongation are 194 MPa, 92 MPa, and 5.4%, respectively. When the rolling deformation increases to 90%, the mechanical properties of the alloy show significant improvement. The tensile strength, yield strength, and elongation are 362 MPa, 274 MPa, and 19.1%, respectively. With the increase in rolling deformation, the mechanical properties of the alloy, including tensile strength, yield strength, and elongation, are greatly enhanced.
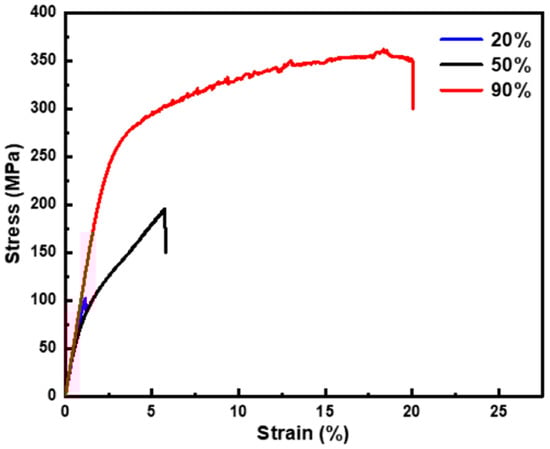
Figure 6.
Stress–strain curves of Al-3Li-1Cu-0.4Mg-0.1Er-0.1Zr alloys under different rolling deformation percentages.
Figure 7a,b display the tensile fracture surfaces of Al-Li alloy with a 20% rolling deformation. In the images, typical low-melting-point metal brittle intergranular fractures can be observed, which are caused by the segregation of low-melting-point eutectic phases at the grain boundaries. The fracture mode of the Al-Li alloy with a 20% rolling deformation is the intergranular brittle fracture. Additionally, large blocks of the second phase along the grain boundaries can also be observed in the tensile fracture surfaces, which greatly influence the mechanical properties of the alloy, particularly its plasticity. Figure 7c,d represent the tensile fracture surfaces of Al-Li alloy with a 50% rolling deformation, where many smooth intergranular fracture surfaces, coarse second-phase particles, and pores resulting from the detachment of the second phase can clearly be seen. It can be further observed that compared to the 20% rolling deformation, the fracture surface of the 50% rolling deformation shows more dimples, although their distribution is not uniform. Hence, it can be inferred that the fracture mode of the Al-Li alloy with a 50% rolling deformation is a mixture of intergranular and dimple fractures. Figure 7e,f illustrate the tensile fracture surfaces of Al-Li alloy with a 90% rolling deformation, where numerous dimples are observed with a more uniform distribution. Some intergranular fracture surfaces and traces of fractured and detached second-phase particles with sizes around 10 µm can also be observed. Compared to the 50% rolling deformation, the number and distribution of dimples increase in the tensile fracture surface of the Al-Li alloy with a 90% rolling deformation. The size and quantity of second-phase particles decrease. Based on these results, it can be preliminarily concluded that the fracture mode of the Al-Li alloy after a 90% rolling deformation is a mixture of intergranular and dimple fractures, with the dimple fractures being predominant.
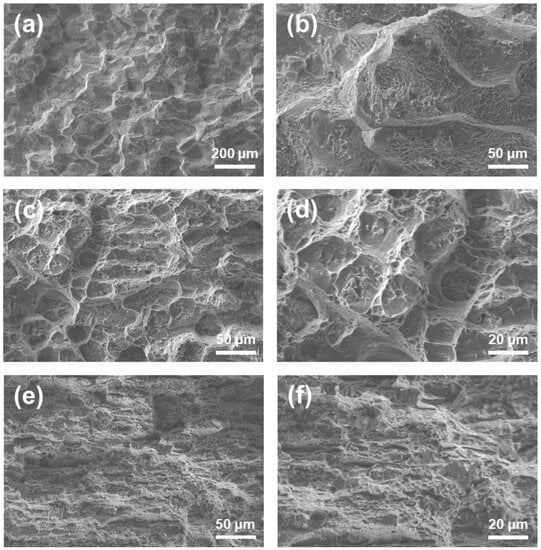
Figure 7.
Scanning electron microscopy of tensile fracture surfaces of aluminum–lithium alloys at different rolling deformation levels: (a,b) 20%, (c,d) 50%, and (e,f) 90%.
3.2. Microstructure and Mechanical Properties of Normal Rolled and Cross-Rolled Specimens
3.2.1. Microstructure of Normal Rolled and Cross-Rolled Specimens
Figure 8 shows the EBSD grain maps of normal rolled and cross-rolled Al-Li alloys. In Figure 8a, it can be observed that the grains in the normal rolled alloy are severely elongated along the RD direction, presenting a typical fibrous morphology. Additionally, numerous small equiaxed grains can be observed, indicating recrystallization occurrence. In Figure 8b, it can be seen that the elongation of the grains along the RD direction is relatively not obvious in the cross-rolled alloy, which is attributed to the increased deformation component in the TD direction. A few small recrystallized grains are also observed. A comparison reveals that the grain orientation in the normal rolled Al-Li alloy is mainly oriented along the <111>//RD direction, with a small fraction oriented along the <001>//RD direction. However, the grain orientation in the cross-rolled Al-Li alloy exhibits a more pronounced diversification, with a noticeable decrease in the <111>//RD orientation and a shift towards other directions. This indicates that normal rolling tends to align the grains in the Al-Li alloy towards a single orientation, while the cross-rolling process can alter this orientation pattern, leading to a more diversified grain orientation in the rolled alloy [27,28,29].
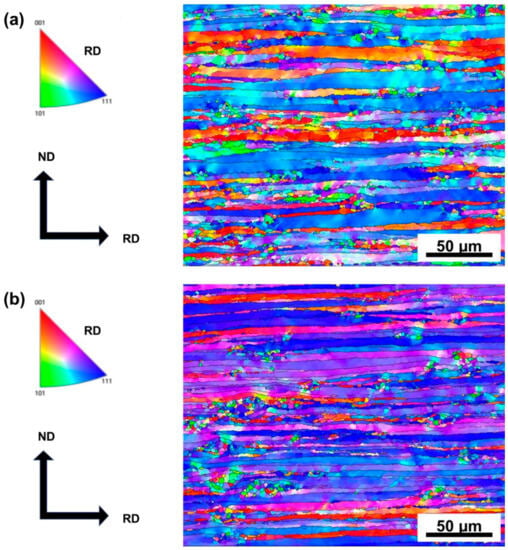
Figure 8.
EBSD grain map of 90% deformation Al-3Li-1Cu-0.4Mg-0.1Er-0.1Zr alloy in conventional rolled and cross-rolled state: (a) normal rolling, and (b) cross-rolling.
Figure 9 shows the recrystallization of Al-Li alloys with 90% deformation in both normal rolling and cross-rolling. Although recrystallization occurs after cross-rolling, the degree of recrystallization is significantly reduced compared to normal rolling, with a noticeable decrease in proportion of recrystallized grains, 23.5% vs. 4.5%. Figure 10 shows the EBSD microstructure at the same position. Some voids can be observed in Figure 10, which are caused by the detachment of coarse second-phase particles during electropolishing. By combining Figure 9 and Figure 10, it can be observed that the regions with detached second-phase particles in Figure 10 correspond well to the regions with obvious recrystallized grains in Figure 9. This indicates that recrystallization is more likely to occur near the coarse second-phase particles during rolling, known as particle stimulated nucleation (PSN) [30]. The recrystallized grains in the cross-rolled alloys are also distributed near micrometer-sized second-phase particles in the alloy, indicating that the recrystallization mechanism is also dependent on PSN. However, by comparing the observations, it can also be found that near some second-phase particles in the cross-rolled Al-Li alloy, there do not exist recrystallized grains, indicating that these particles do not induce recrystallization via PSN. Compared to conventional rolling, the degree of recrystallization in the cross-rolled Al-Li alloy is reduced, with a decrease in the proportion of recrystallized grains by approximately 6.5%. It can be concluded that, in the cross-rolling process, the alloy undergoes alternating deformation along the RD–ND directions, with different rolling directions between adjacent passes, which activates more slip systems compared to normal rolling, thereby promoting recovery and reducing the dislocation density in the alloy. Although the PSN mechanism can help accumulate deformation energy and promote recrystallization, the overall reduction in dislocation density in the alloy makes it difficult to reach the critical value for recrystallization. Therefore, only a portion of the second-phase particles in the cross-rolled alloy induce recrystallization, resulting in a reduced number of recrystallized grains compared to normal rolling [31,32,33].
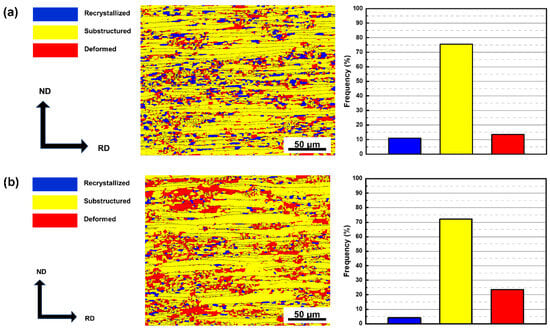
Figure 9.
The recrystallization characteristics of 90% deformation in both normal rolling and cross-rolling states of Al-3Li-1Cu-0.4Mg-0.1Er-0.1Zr alloys: (a) normal rolling, and (b) cross-rolling.
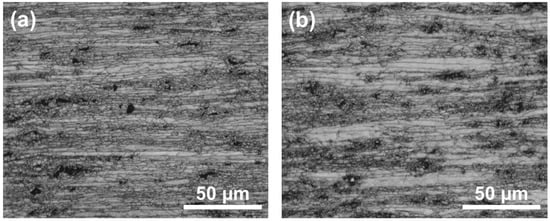
Figure 10.
Microstructure of Al-3Li-1Cu-0.4Mg-0.1Er-0.1Zr alloys with 90% deformation by normal rolling and cross-rolling: (a) normal rolling, and (b) cross-rolling.
3.2.2. Grain Orientation and Texture of Al-Li Alloys Processed by Normal Rolling and Cross-Rolling
As shown in Figure 11, it can be observed that the phase composition of the alloys does not change in normal rolled and cross-rolled specimens, mainly consisting of α-Al, Al3Li, and Cu-rich phases. However, we can observe that the intensity of diffraction peaks varies. After cross-rolling, the intensity of the (111) and (200) diffraction peaks is enhanced, while the intensity of the (200) diffraction peak is decreased, suggesting that the preferred grain orientation changes.
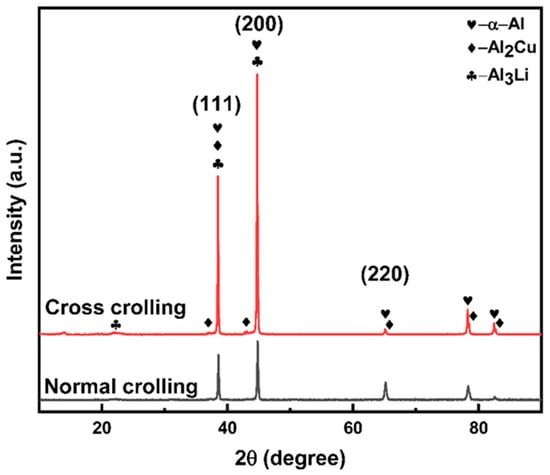
Figure 11.
XRD pattern of conventional rolling and cross-rolling with 90% deformation.
The pole figures of the as-rolled and cross-rolled Al-Li alloys are presented in Figure 12. X0 and Y0 represent the rolling direction and normal direction, respectively. Analysis reveals that the normal rolled Al-Li alloy predominantly exhibits a brasslike texture with the {011}<111> orientation, while the cross-rolled alloy primarily exhibits a brass R-type texture with the {111}<112> orientation [30].
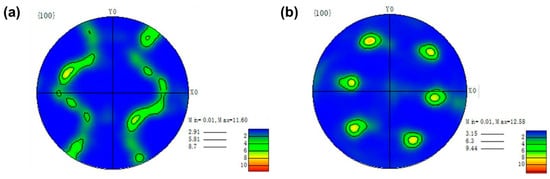
Figure 12.
Different rolling processes for Al-3Li-1Cu-0.4Mg-0.1Er-0.1Zr alloy {001} surface pole: (a) normal rolling, (b) cross-rolling.
The ODF (orientation distribution function) graphs of the normal rolled and cross-rolled Al-Li alloys are shown in Figure 13. The graphs utilize a constant φ2 in a range of 0° to 90°, with a 5-degree interval per image. It is observed that the alloy exhibits a strong brasslike texture {011}<111> after normal rolling, as depicted in Figure 13a. This is consistent with the results shown in the pole figure of Figure 13a, with the highest intensity of 9.11. Additionally, a weaker brass R-type texture {111}<112> is present in the alloy after normal rolling. Figure 13b demonstrates that the alloy displays a strong brass R-type texture {111}<112> after cross-rolling, which aligns with the pole figure result in Figure 12b. The highest intensity in this texture reaches 10.07. Moreover, a weak cube texture {001}<100> can be observed in the cross-rolled alloy [34,35].
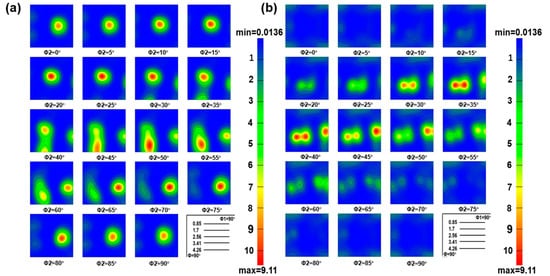
Figure 13.
ODF diagrams of Al-3Li-1Cu-0.4Mg-0.1Er-0.1Zr alloys in different rolling processes: (a) normal rolling, and (b) cross-rolling.
Cross-rolling changes the alloy texture composition of alloy. After cross-rolling, the intensity of the brass R-type texture {111}<112> become stronger, eliminating the brass-type texture {011}<111>, while also adding a weak cubic cube texture {001}<100> [36]. The main texture of the alloy changed from the brass-type texture {011}<111> to the brass R-type texture {111}<112>, with similar intensity. According to the literature, the brass-type texture {011}<111> is a recrystallization texture. It is formed by rotating the brass-type texture around the ND direction and usually appears after recrystallization through the PSN mechanism [30]. Based on the characterization of recrystallization mentioned earlier, it can be concluded that normal rolling of Al-Li alloy contains a large number of recrystallized grains formed by the PSN mechanism, which coincides with the recrystallization texture of normal rolling. Although recrystallization also occurs during cross-rolling, it does not exhibit a recrystallization texture, indicating that the recrystallized grains generated by the cross-rolling process are randomly oriented.
3.2.3. Mechanical Properties of Normal Rolled and Cross-Rolled Specimens
Figure 14 shows the stress–strain curves of the normal rolled and cross-rolled Al-Li alloys, with three different orientations of 0° (RD), 45°, and 90° (TD) with respect to the RD direction. It can be observed that the tensile strength varies significantly in different directions for the normal rolled alloy, while the cross-rolled Al-Li alloys exhibit smaller variations in tensile strength among the different orientations.
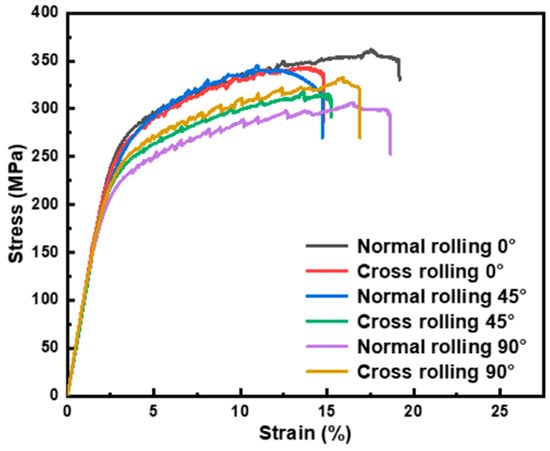
Figure 14.
A 90% deformation stress–strain curve of normal rolled and cross-rolled Al-3Li-1Cu-0.4Mg-0.1Er-0.1Zr alloys.
To provide a more comprehensive understanding, the tensile strength and elongation of Al-Li alloys were statistically compared, as shown in Figure 15. The specimens along RD in the normal rolled state have the highest tensile strength, reaching 362 MPa, while those along TD have the lowest tensile strength at only 306 MPa. Comparatively, the tensile strength values in different directions of the cross-rolled Al-Li alloys are relatively close, with the RD still having the highest tensile strength of 342 MPa, while the lowest tensile strength of 319 MPa is observed in the 45° direction. From Figure 15b, it can be observed that the normal rolled specimen along RD has the highest elongation, reaching 19.1%, while that along the 45° direction has the lowest elongation of 14.7%. The cross-rolled specimen along the 45° direction has the highest elongation, reaching 15.2%, and that along TD has the lowest elongation of 14.6%.
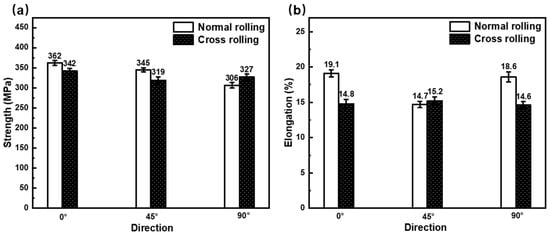
Figure 15.
Tensile strength and elongation of Al-3Li-1Cu-0.4Mg-0.1Er-0.1Zr alloys in different rolling processes: (a) strength, and (b) elongation.
The planar anisotropy of the mechanical properties of alloy sheets can be measured using the IPA. The greater the IPA value, the greater the anisotropy of the mechanical properties [4]. The calculation method is shown in Equation (1).
where Xmax, Xmid, and Xmin represent the maximum, intermediate, and minimum values, respectively. Combined with Figure 15, the IPA values of tensile strength and elongation of the alloy can be calculated separately. Figure 16 shows the statistical chart of IPA values for the strength and elongation of the normal rolled and cross-rolled specimens. Compared with the strength IPA of normal rolled specimens, that of cross-rolled specimens decreases from 10.1% to 5.5%, indicating a significant decrease in its anisotropy. The IPA of elongation also decreases from 12.8% to 3.3%, further demonstrating the decreased anisotropy of Al-Li alloy after cross-rolling [36].
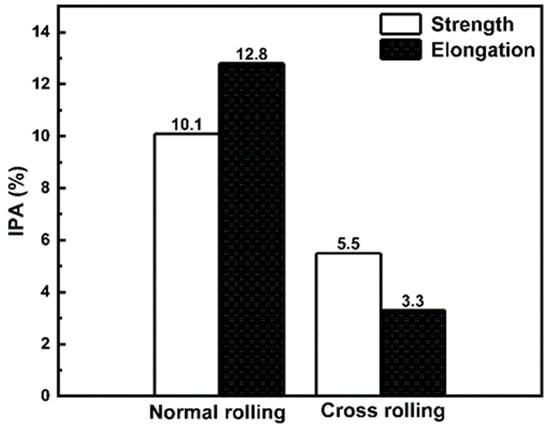
Figure 16.
Statistical diagram of IPA values of Al-3Li-1Cu-0.4Mg-0.1Er-0.1Zr alloys in different rolling process.
In this paper, the factors affecting the planar anisotropy of the alloy plane are discussed by two kinds of factors. First is the second-phase particles; the alloy is distributed with δ′ (Al2Cu) as the main reinforcing phase, which is a spherical substable phase with a cubic superlattice crystal structure (L12). Since the δ′ phase is a spherical phase, its enhancement effect on the strength of the alloy is basically the same in different loading directions. However, the low shear modulus of the δ′ phase enables the dislocations to repeatedly slide on the same slip surface and shear the δ′ phase, which can easily lead to the anisotropy of the alloy elongation. The δ′ phase acts with the dislocations by a cut-through mechanism during plastic deformation of the alloy, which promotes the coplanar slip, softens the slip surface gradually, and reduces the number of effective slip coefficients, which can easily lead to the localized stress concentration at the grain boundaries and cause brittle fracture in the alloy. Brittle fracture occurs [14,15]. This is the main reason that affects the plasticity change in the alloy in different directions. Second is with regard to the type of fabrication: the main changes in the type of fabrication of the alloy after cross-rolling are the elimination of brasslike fabrication {011}<111> and the enhancement of brass R-type fabrication {111}<112>. It is shown that the stronger the brasslike weave is, the higher the anisotropy of the alloy is and the higher the IPA index is, while the {111} surface weave can obviously inhibit the anisotropy of the alloy [13,32], which causes the alloy to be strongly anisotropic in the unidirectional rolling process, and a lower anisotropy can be obtained in the cross-rolling process.
4. Conclusions
- (1)
- As the rolling deformation increases, the Cu-rich phase in the Al-3Li-1Cu-0.4Mg-0.1Er-0.1Zr alloy continues to fragment and dissolve, resulting in a continuous decrease in size from 30 µm to about 8 µm with a more uniform distribution.
- (2)
- In the alloy with the rolling reduction of 90%, abundant Al3Li phases are precipitated, and an Al3(Er, Zr, Li) core–shell composite phase is formed. Additionally, recrystallization occurs by the PSN mechanism.
- (3)
- The strength and plasticity of Al-3Li-1Cu-0.4Mg-0.1Er-0.1Zr alloys increases with the increase in rolling reduction, in which the tensile strength of the alloy specimen with 90% of rolling deformation is 362MPa and the elongation is 19.1%.
- (4)
- Compared with the normal rolled specimen, the cross-rolled specimen has relatively lower strength and elongation. The cross-rolling eliminates the brasslike texture {011}<111> generated by normal rolling and enhances the brass R-type texture {111}<112>.
- (5)
- The IPA of the strength decreases from 10.1% in normal rolling to 5.5% in cross-rolling, and the particle stimulated nucleation of the elongation decreases from 12.8% to 3.3%. The cross-rolling obviously decreases the anisotropy.
Author Contributions
Z.M.: investigation, materials processing, and writing original draft. T.Z.: casting, heat treatment. D.S.: rolling processing. B.Q.: microstructure characterizations. N.T.: chemical composition designment. S.B.: texture characterization. R.W.: conceptualization, methodology, and revising original draft. All authors have read and agreed to the published version of the manuscript.
Funding
This research was funded by National Key Research and Development Program of China (grant number 2021YFE0103200), National Natural Science Foundation of China (grant numbers 52261135538, 51971071, U21A2049, 52271098), Fundamental Research Funds for the Central Universities (grant number 3072022QBZ1002), and the Russian Science Foundation (grant number 23-49-00098).
Data Availability Statement
The data that support the findings of this study are available from the corresponding author upon reasonable request.
Conflicts of Interest
The authors declare no conflict of interest.
References
- Jiang, L.; Rouxel, B.; Langan, T.; Dorin, T. Coupled segregation mechanisms of Sc, Zr and Mn at θ′ interfaces enhances the strength and thermal stability of Al-Cu alloys. Acta Mater. 2021, 206, 116634. [Google Scholar] [CrossRef]
- Han, J.; Wang, H.; Xu, A.; Niu, K. Enhanced matrix precipitation of T1 (Al2CuLi) phase in AA2055 Al–Li alloy during stress aging process. Mater. Sci. Eng. A 2021, 827, 142057. [Google Scholar] [CrossRef]
- Wu, L.; Li, X.; Wang, H. Significant roles of minor Mg addition in microstructural evolution and mechanical properties of cast Al–3Li–2Cu-0.15 Zr alloy. J. Alloys Compd. 2021, 857, 157600. [Google Scholar] [CrossRef]
- Abd El-Aty, A.; Xu, Y.; Guo, X.; Zhang, S.-H.; Ma, Y.; Chen, D. Strengthening mechanisms, deformation behavior, and anisotropic mechanical properties of Al-Li alloys: A review. J. Adv. Res. 2018, 10, 49–67. [Google Scholar] [CrossRef] [PubMed]
- Booth-Morrison, C.; Dunand, D.C.; Seidman, D.N. Coarsening resistance at 400 °C of precipitation-strengthened Al–Zr–Sc–Er alloys. Acta Mater. 2011, 59, 7029–7042. [Google Scholar] [CrossRef]
- Sun, Z.; Wang, H.; Tian, X.; He, B. Developing a novel lightweight Al–Mg–Li alloy for laser powder bed fusion additive manufacturing: Parameter optimization, microstructure evolution, and mechanical performance. Mater. Sci. Eng. A 2023, 872, 144992. [Google Scholar] [CrossRef]
- Yang, Z.; Liao, Y.; Wu, R.; Sun, D.; Liu, M.; Wang, Y. Effect of Single-Pass Large-Strain Rolling on Microstructure and Mechanical Properties of Al-3Li-1Cu-0.2 Er-0.1 Zr Alloy. J. Mater. Eng. Perform. 2022, 31, 3287–3298. [Google Scholar] [CrossRef]
- Zhang, P.; Chen, M. Progress in characterization methods for thermoplastic deforming constitutive models of Al–Li alloys: A review. J. Mater. Sci. 2020, 55, 9828–9847. [Google Scholar] [CrossRef]
- Chung, T.F.; Lin, S.Q.; Li, H.; Hsiao, C.N.; Yang, J.R.; Tsao, C.S.; Ohmura, T. Microstructure evolution and shearing behaviour of δ″/θ″/δ″ precipitates in an aged Al-Cu-Li-Mg aluminium alloy. J. Alloys Compd. 2023, 953, 170095. [Google Scholar] [CrossRef]
- Li, Y.; Xu, G.; Peng, X.; Guo, G.; Liu, S.; Liang, X. Research on microstructure and mechanical properties of 2050 Al-Li alloy during non-isothermal aging. J. Alloys Compd. 2022, 906, 163977. [Google Scholar] [CrossRef]
- Ye, F.; Mao, L.; Rong, J.; Zhang, B.; Wei, L.; Wen, S.; Jiao, H.; Wu, S. Influence of different rolling processes on microstructure and strength of the Al–Cu–Li alloy AA2195. Prog. Nat. Sci. Mater. Int. 2022, 32, 87–95. [Google Scholar] [CrossRef]
- Zhuo, X.; Zhang, Q.; Liu, H.; Hu, Z.; Zhang, P.; Jiang, J.; Ma, A.; Wu, Y. Enhanced tensile strength and ductility of an Al-6Si-3Cu alloy processed by room temperature rolling. J. Alloys Compd. 2022, 899, 163321. [Google Scholar] [CrossRef]
- Wang, Y.; Zhao, G.; Xu, X.; Chen, X. Effect of extrusion parameters on microstructure, texture and mechanical property anisotropy of spray deposited 2195 Al–Li alloy profile. Mater. Sci. Eng. A 2021, 818, 141406. [Google Scholar] [CrossRef]
- Xu, X.; Hao, M.; Chen, J.; He, W.; Li, G.; Jiao, C.; Burnett, T.L.; Zhou, X. Influence of microstructural and crystallographic inhomogeneity on tensile anisotropy in thick-section Al–Li–Cu–Mg plates. Mater. Sci. Eng. A 2022, 829, 142135. [Google Scholar] [CrossRef]
- Li, H.R.; Ma, Y.L.; Li, J.F.; Liu, D.Y.; Lu, D.D.; Guo, Y.J. Investigation of anisotropy and structure variation of spray-formed 2195 Al-Li alloy via final temperature-controlled rolling and cold rolling. J. Alloys Compd. 2023, 937, 168414. [Google Scholar] [CrossRef]
- Huh, M.; Cho, S.; Engler, O. Randomization of the annealing texture in aluminum 5182 sheet by cross-rolling. Mater. Sci. Eng. A 2001, 315, 35–46. [Google Scholar] [CrossRef]
- Nayan, N.; Mishra, S.; Prakash, A.; Murty, S.; Prasad, M.; Samajdar, I. Effect of cross-rolling on microstructure and texture evolution and tensile behavior of aluminium-copper-lithium (AA2195) alloy. Mater. Sci. Eng. A 2019, 740, 252–261. [Google Scholar] [CrossRef]
- Li, Z.; Chen, L.; Tang, J.; Sun, W.; Zhao, G.; Zhang, C. Improving mechanical anisotropy and corrosion resistance of extruded AA7075 alloy by warm cross rolling and annealing. J. Alloys Compd. 2021, 863, 158725. [Google Scholar] [CrossRef]
- Medjahed, A.; Moula, H.; Zegaoui, A.; Derradji, M.; Henniche, A.; Wu, R.; Hou, L.; Zhang, J.; Zhang, M. Influence of the rolling direction on the microstructure, mechanical, anisotropy and gamma rays shielding properties of an Al-Cu-Li-Mg-X alloy. Mater. Sci. Eng. A 2018, 732, 129–137. [Google Scholar] [CrossRef]
- Abd El-Aty, A.; Xu, Y.; Zhang, S.-H.; Ha, S.; Ma, Y.; Chen, D. Impact of high strain rate deformation on the mechanical behavior, fracture mechanisms and anisotropic response of 2060 Al-Cu-Li alloy. J. Adv. Res. 2019, 18, 19–37. [Google Scholar] [CrossRef]
- Zhong, F.; Wu, H.; Jiao, Y.; Wu, R.; Zhang, J.; Hou, L.; Zhang, M. Effect of Y and Ce on the microstructure, mechanical properties and anisotropy of as-rolled Mg-8Li-1Al alloy. J. Mater. Sci. Technol. 2020, 39, 124–134. [Google Scholar] [CrossRef]
- Yu, T.; Li, B.; Medjahed, A.; Hou, L.; Wu, R.; Zhang, J.; Sun, J.; Zhang, M. Impeding effect of the Al3 (Er, Zr, Li) particles on planar slip and intergranular fracture mechanism of Al-3Li-1Cu-0.1 Zr-X alloys. Mater. Charact. 2019, 147, 146–154. [Google Scholar] [CrossRef]
- Shi, C.; Zhang, L.; Wu, G.; Zhang, X.; Chen, A.; Tao, J. Effects of Sc addition on the microstructure and mechanical properties of cast Al-3Li-1.5 Cu-0.15 Zr alloy. Mater. Sci. Eng. A 2017, 680, 232–238. [Google Scholar] [CrossRef]
- Chen, A.; Wu, G.; Zhang, L.; Zhang, X.; Shi, C.; Li, Y. Microstructural characteristics and mechanical properties of cast Al-3Li-xCu-0.2 Zr alloy. Mater. Sci. Eng. A 2016, 677, 29–40. [Google Scholar] [CrossRef]
- Mikhaylovskaya, A.; Mochugovskiy, A.; Levchenko, V.; Tabachkova, N.Y.; Mufalo, W.; Portnoy, V. Precipitation behavior of L12 Al3Zr phase in Al-Mg-Zr alloy. Mater. Charact. 2018, 139, 30–37. [Google Scholar] [CrossRef]
- Xue, C.; Wang, S.; Zhang, Y.; Tian, G.; Yang, X.; Chang, X.; Ke, Y.; Xie, Z.; Wang, J. Uncovering the kinetics of Li-rich clusters and monodisperse core–shell Al3 (Zr, Sc) structures in Al–Li–Cu alloys. Mater. Sci. Eng. A 2023, 881, 145393. [Google Scholar] [CrossRef]
- Wang, Y.; Zhang, S.; Wu, R.; Turakhodjaev, N.; Hou, L.; Zhang, J.; Betsofen, S. Coarsening kinetics and strengthening mechanisms of core-shell nanoscale precipitates in Al-Li-Yb-Er-Sc-Zr alloy. J. Mater. Sci. Technol. 2021, 61, 197–203. [Google Scholar] [CrossRef]
- Shen, K.; Timko, M.; Li, Y.-J.; Toal, R.; Santos, N.; Es-Said, S.; Ba Thaung, S.; Guevara, L.; Riebe, R.; Es-Said, O.S. The Effect of Temper, Grain Orientation, and Composition on the Fatigue Properties of Forged Aluminum-Lithium 2195 Alloy. J. Mater. Eng. Perform. 2019, 28, 5625–5638. [Google Scholar] [CrossRef]
- Chen, X.; Zhao, G.; Liu, G.; Sun, L.; Chen, L.; Zhang, C. Microstructure evolution and mechanical properties of 2196 Al-Li alloy in hot extrusion process. J. Mater. Process. Technol. 2020, 275, 116348. [Google Scholar] [CrossRef]
- Wang, X.-Y.; Jiang, J.-T.; Li, G.-A.; Wang, X.-M.; Shao, W.-Z.; Zhen, L. Particle-stimulated nucleation and recrystallization texture initiated by coarsened Al2CuLi phase in Al–Cu–Li alloy. J. Mater. Res. Technol. 2021, 10, 643–650. [Google Scholar] [CrossRef]
- Fu, R.; Huang, Y.; Liu, Y.; Li, H. Microstructural Evolution and Dynamic Recrystallization Behavior of the Homogenized 2195 Al–Li Alloy During Hot Deformation. Met. Mater. Int. 2023, 29, 2605–2622. [Google Scholar] [CrossRef]
- Wang, D.; Gao, C.; Luo, H.-Y.; Yang, Y.-H.; Ma, Y. Texture evolution behavior and anisotropy of 2A97 Al–Li alloy during recrystallization at elevated temperature. Rare Met. 2018, 42, 3139–3149. [Google Scholar] [CrossRef]
- Guo, Y.-J.; Li, J.-F.; Lu, D.-D.; Deng, S.-X.; Zeng, G.-J.; Ma, Y.-L.; You, W.; Chen, Y.-L.; Zhang, X.-H.; Zhang, R.-F. Characterization of Al3Zr precipitation via double-step homogenization and recrystallization behavior after subsequent deformation in 2195 Al-Li alloy. Mater. Charact. 2021, 182, 111549. [Google Scholar] [CrossRef]
- Tangen, S.; Sjølstad, K.; Furu, T.; Nes, E. Effect of concurrent precipitation on recrystallization and evolution of the P-texture component in a commercial Al-Mn alloy. Metall. Mater. Trans. A 2010, 41, 2970–2983. [Google Scholar] [CrossRef]
- Bennett, T.; Petrov, R.; Kestens, L.; Zhuang, L.-Z.; De Smet, P. The effect of particle-stimulated nucleation on texture banding in an aluminium alloy. Scr. Mater. 2010, 63, 461–464. [Google Scholar] [CrossRef]
- Tian-Zhang, Z.; Long, J.; Yong, X.; Shi-Hong, Z. Anisotropic yielding stress of 2198 Al–Li alloy sheet and mechanisms. Mater. Sci. Eng. A 2020, 771, 138572. [Google Scholar] [CrossRef]
Disclaimer/Publisher’s Note: The statements, opinions and data contained in all publications are solely those of the individual author(s) and contributor(s) and not of MDPI and/or the editor(s). MDPI and/or the editor(s) disclaim responsibility for any injury to people or property resulting from any ideas, methods, instructions or products referred to in the content. |
© 2023 by the authors. Licensee MDPI, Basel, Switzerland. This article is an open access article distributed under the terms and conditions of the Creative Commons Attribution (CC BY) license (https://creativecommons.org/licenses/by/4.0/).