
The Mechanism of Phase Transfer Synthesis of Silver Nanoparticles Using a Fatty Amine as Extractant/Phase Transfer Agent
 ,
,  , ,
, ,  ,
,  ,
,  ,
,  ,
,  and
and 
Abstract
1. Introduction
2. Experimental
3. Results and Discussion
3.1. UV-Vis Analysis
3.2. DLS-Analysis
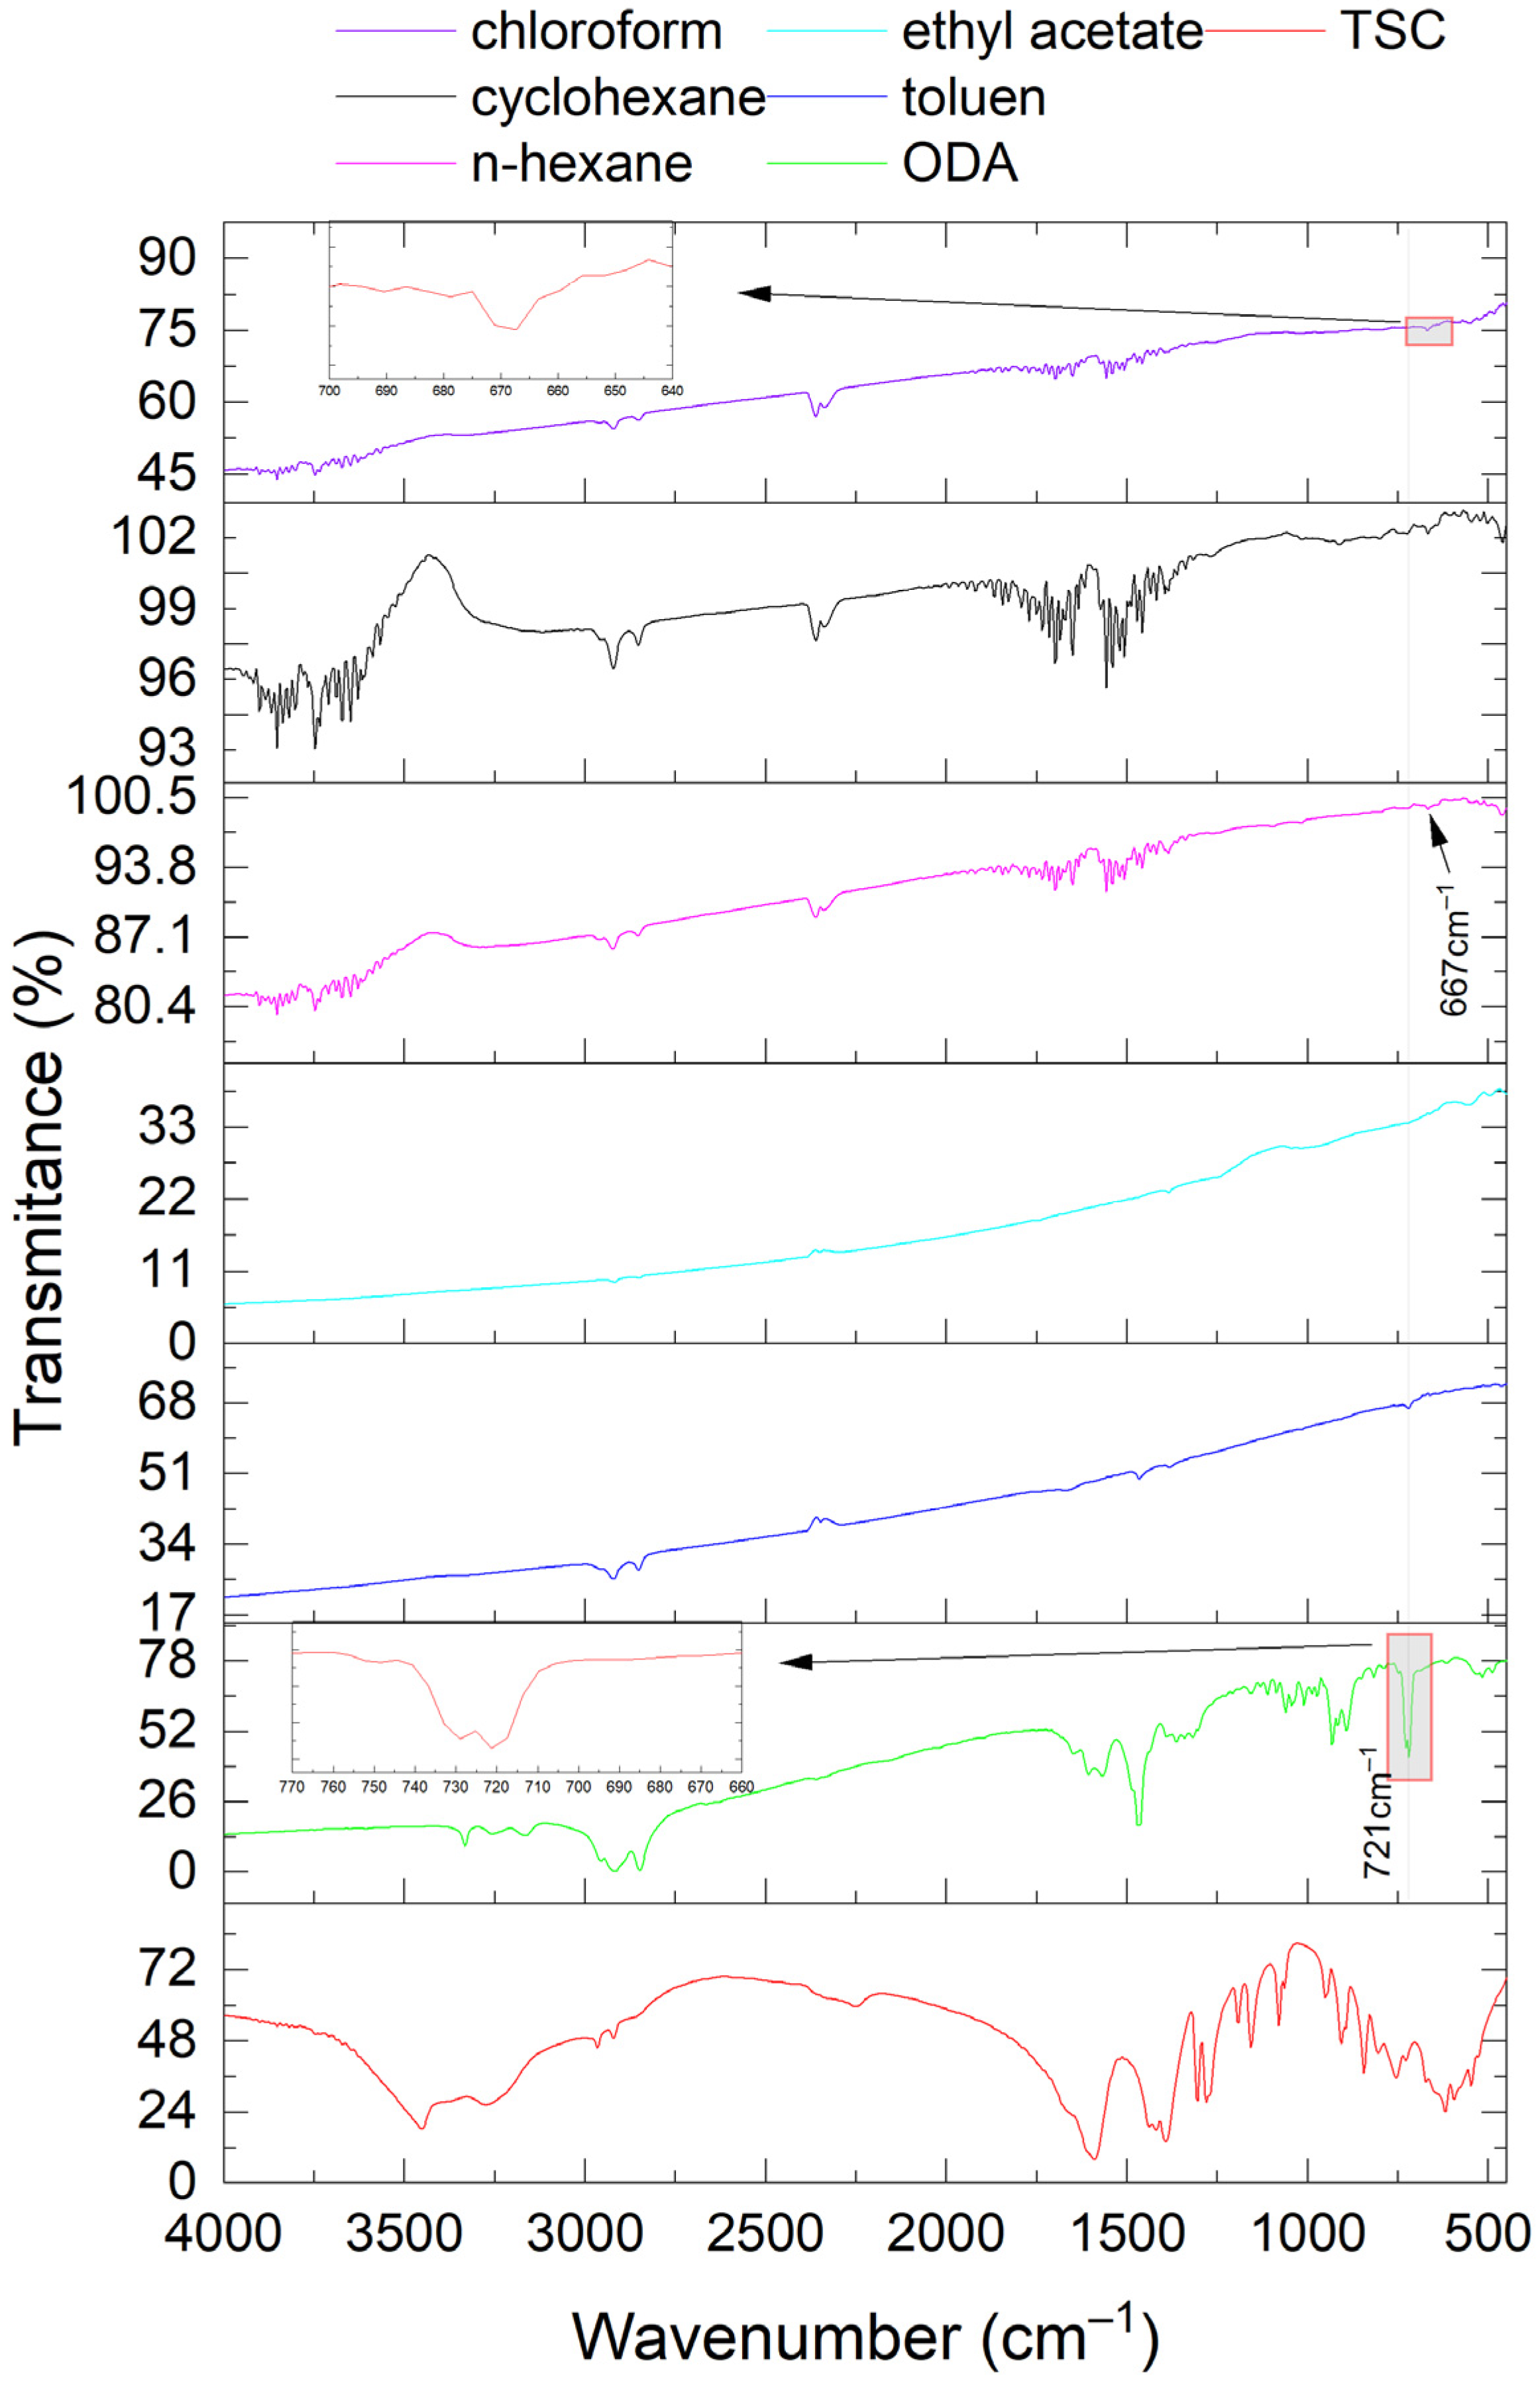
3.3. FT-IR Analysis
3.4. Influence of ODA Initial Concentration in N-Hexane
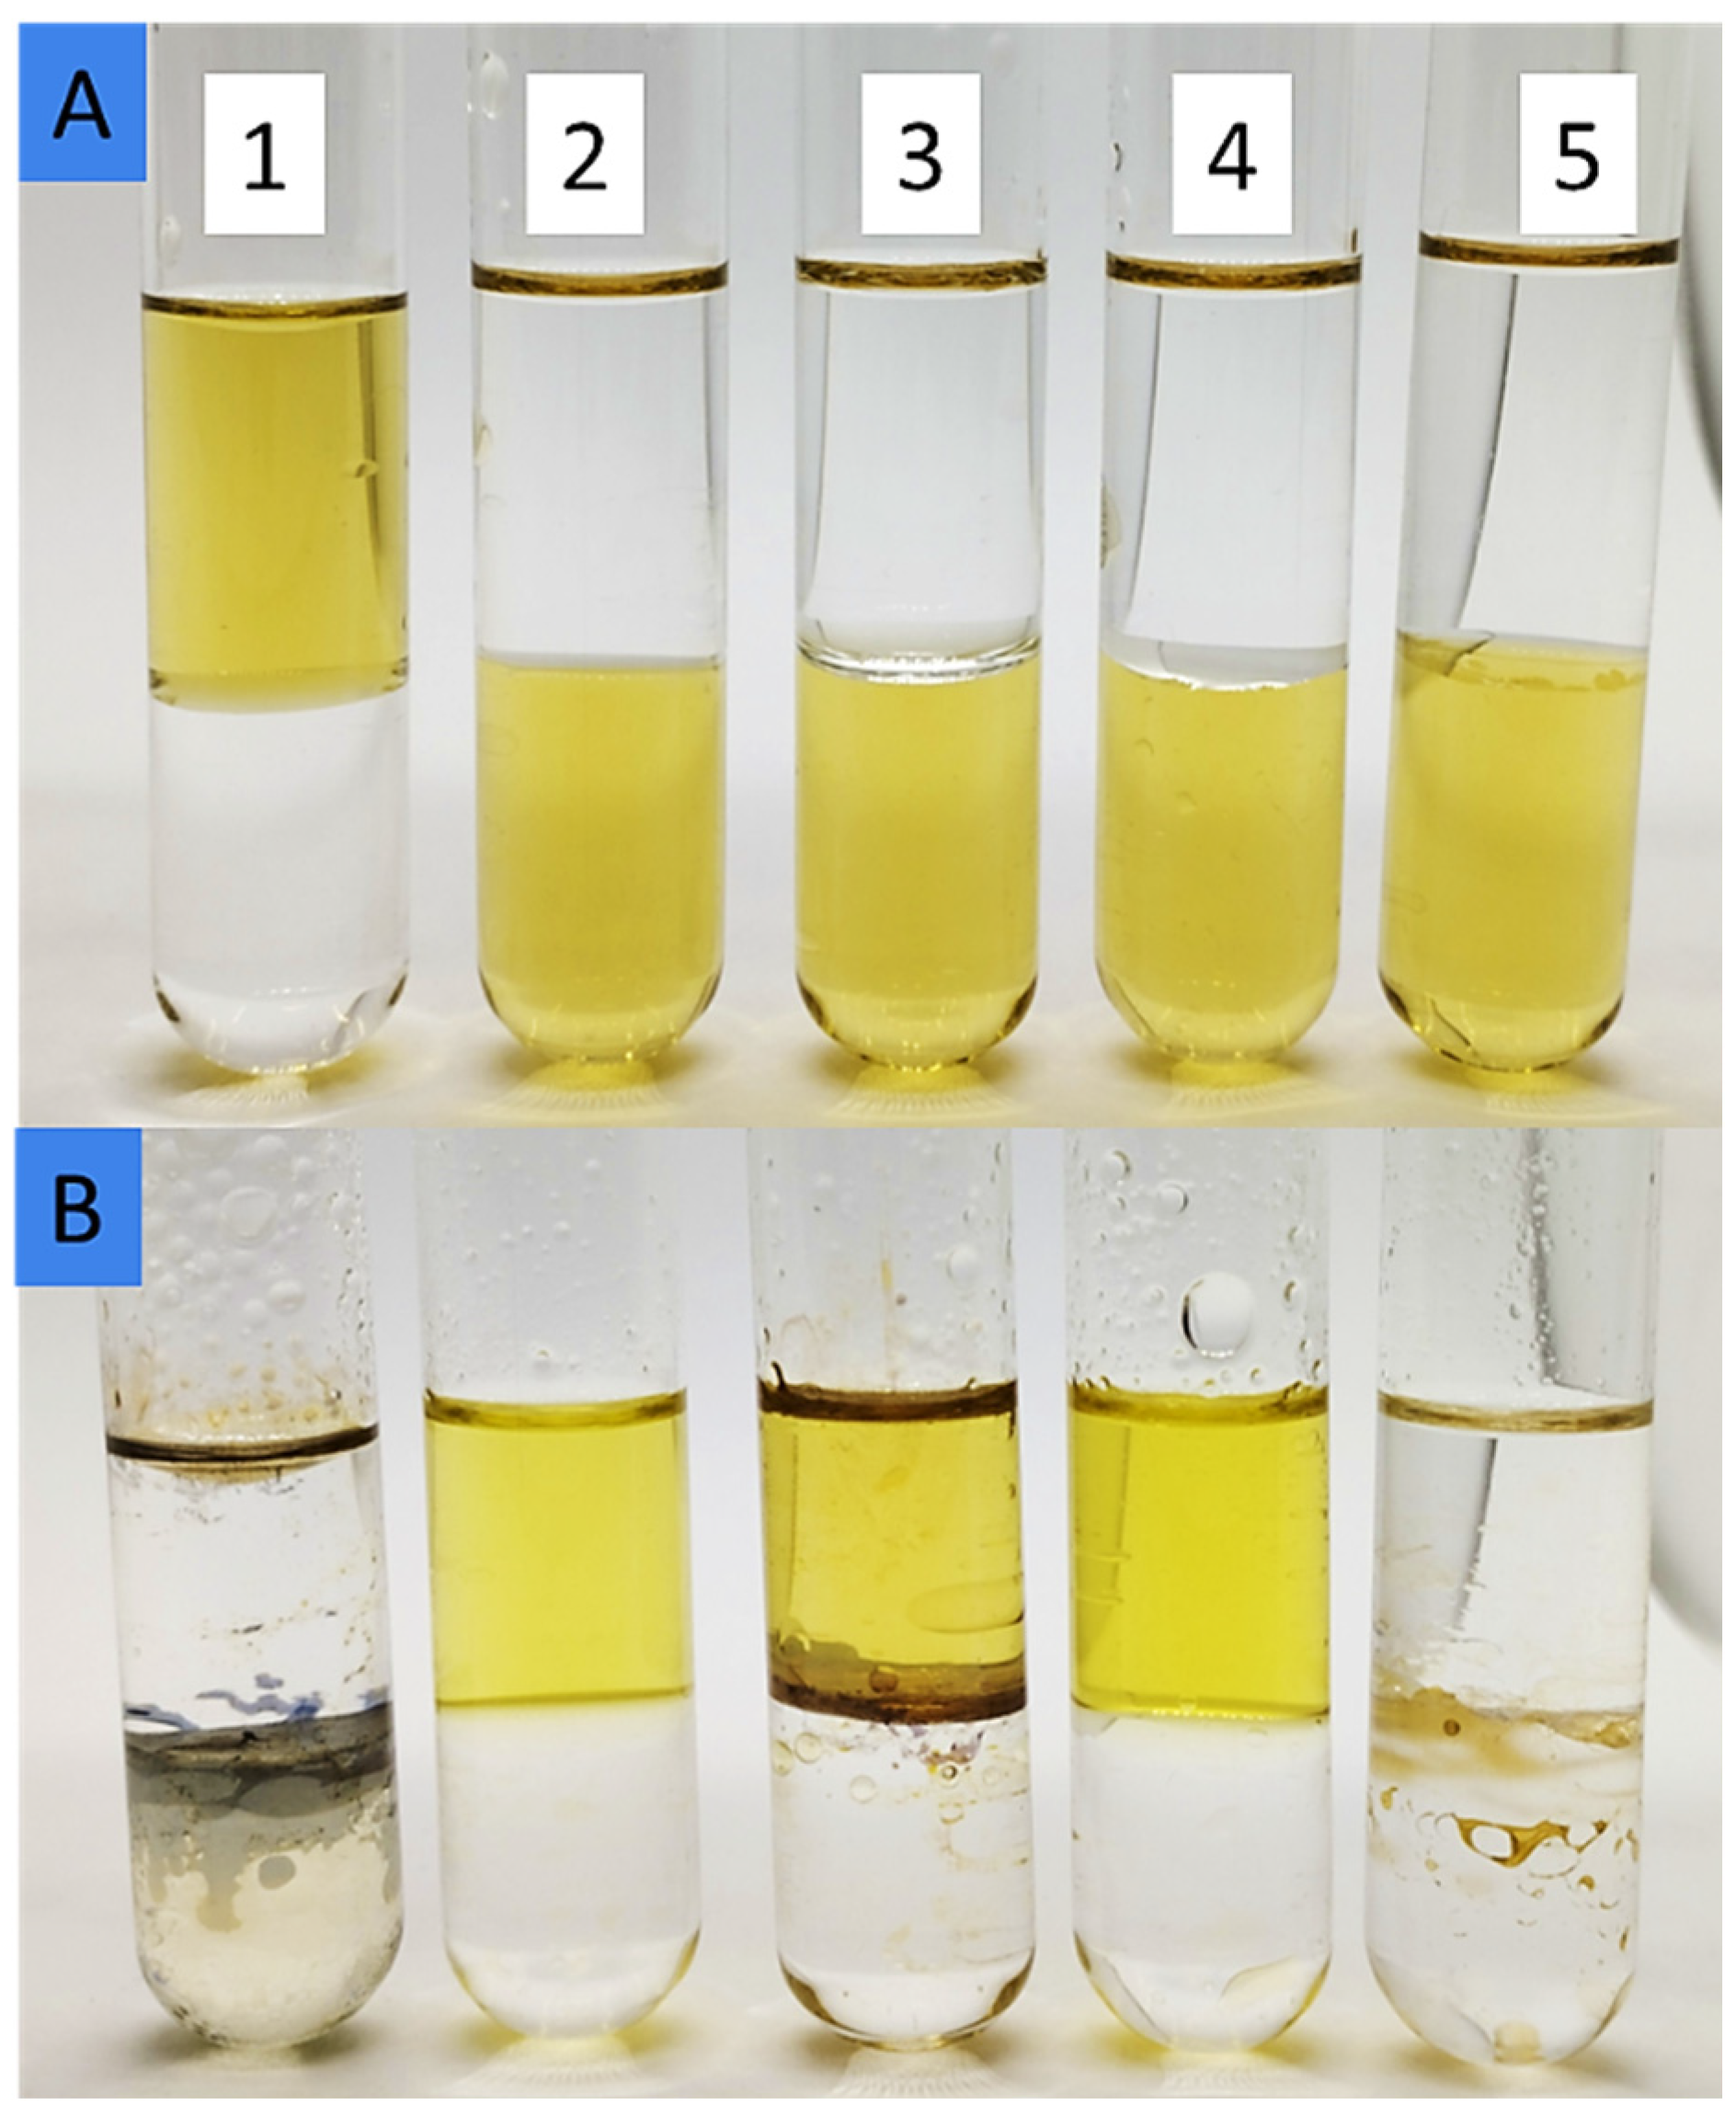
3.5. Influence of Organic-Water Phase Ratio
3.6. XRD Analysis
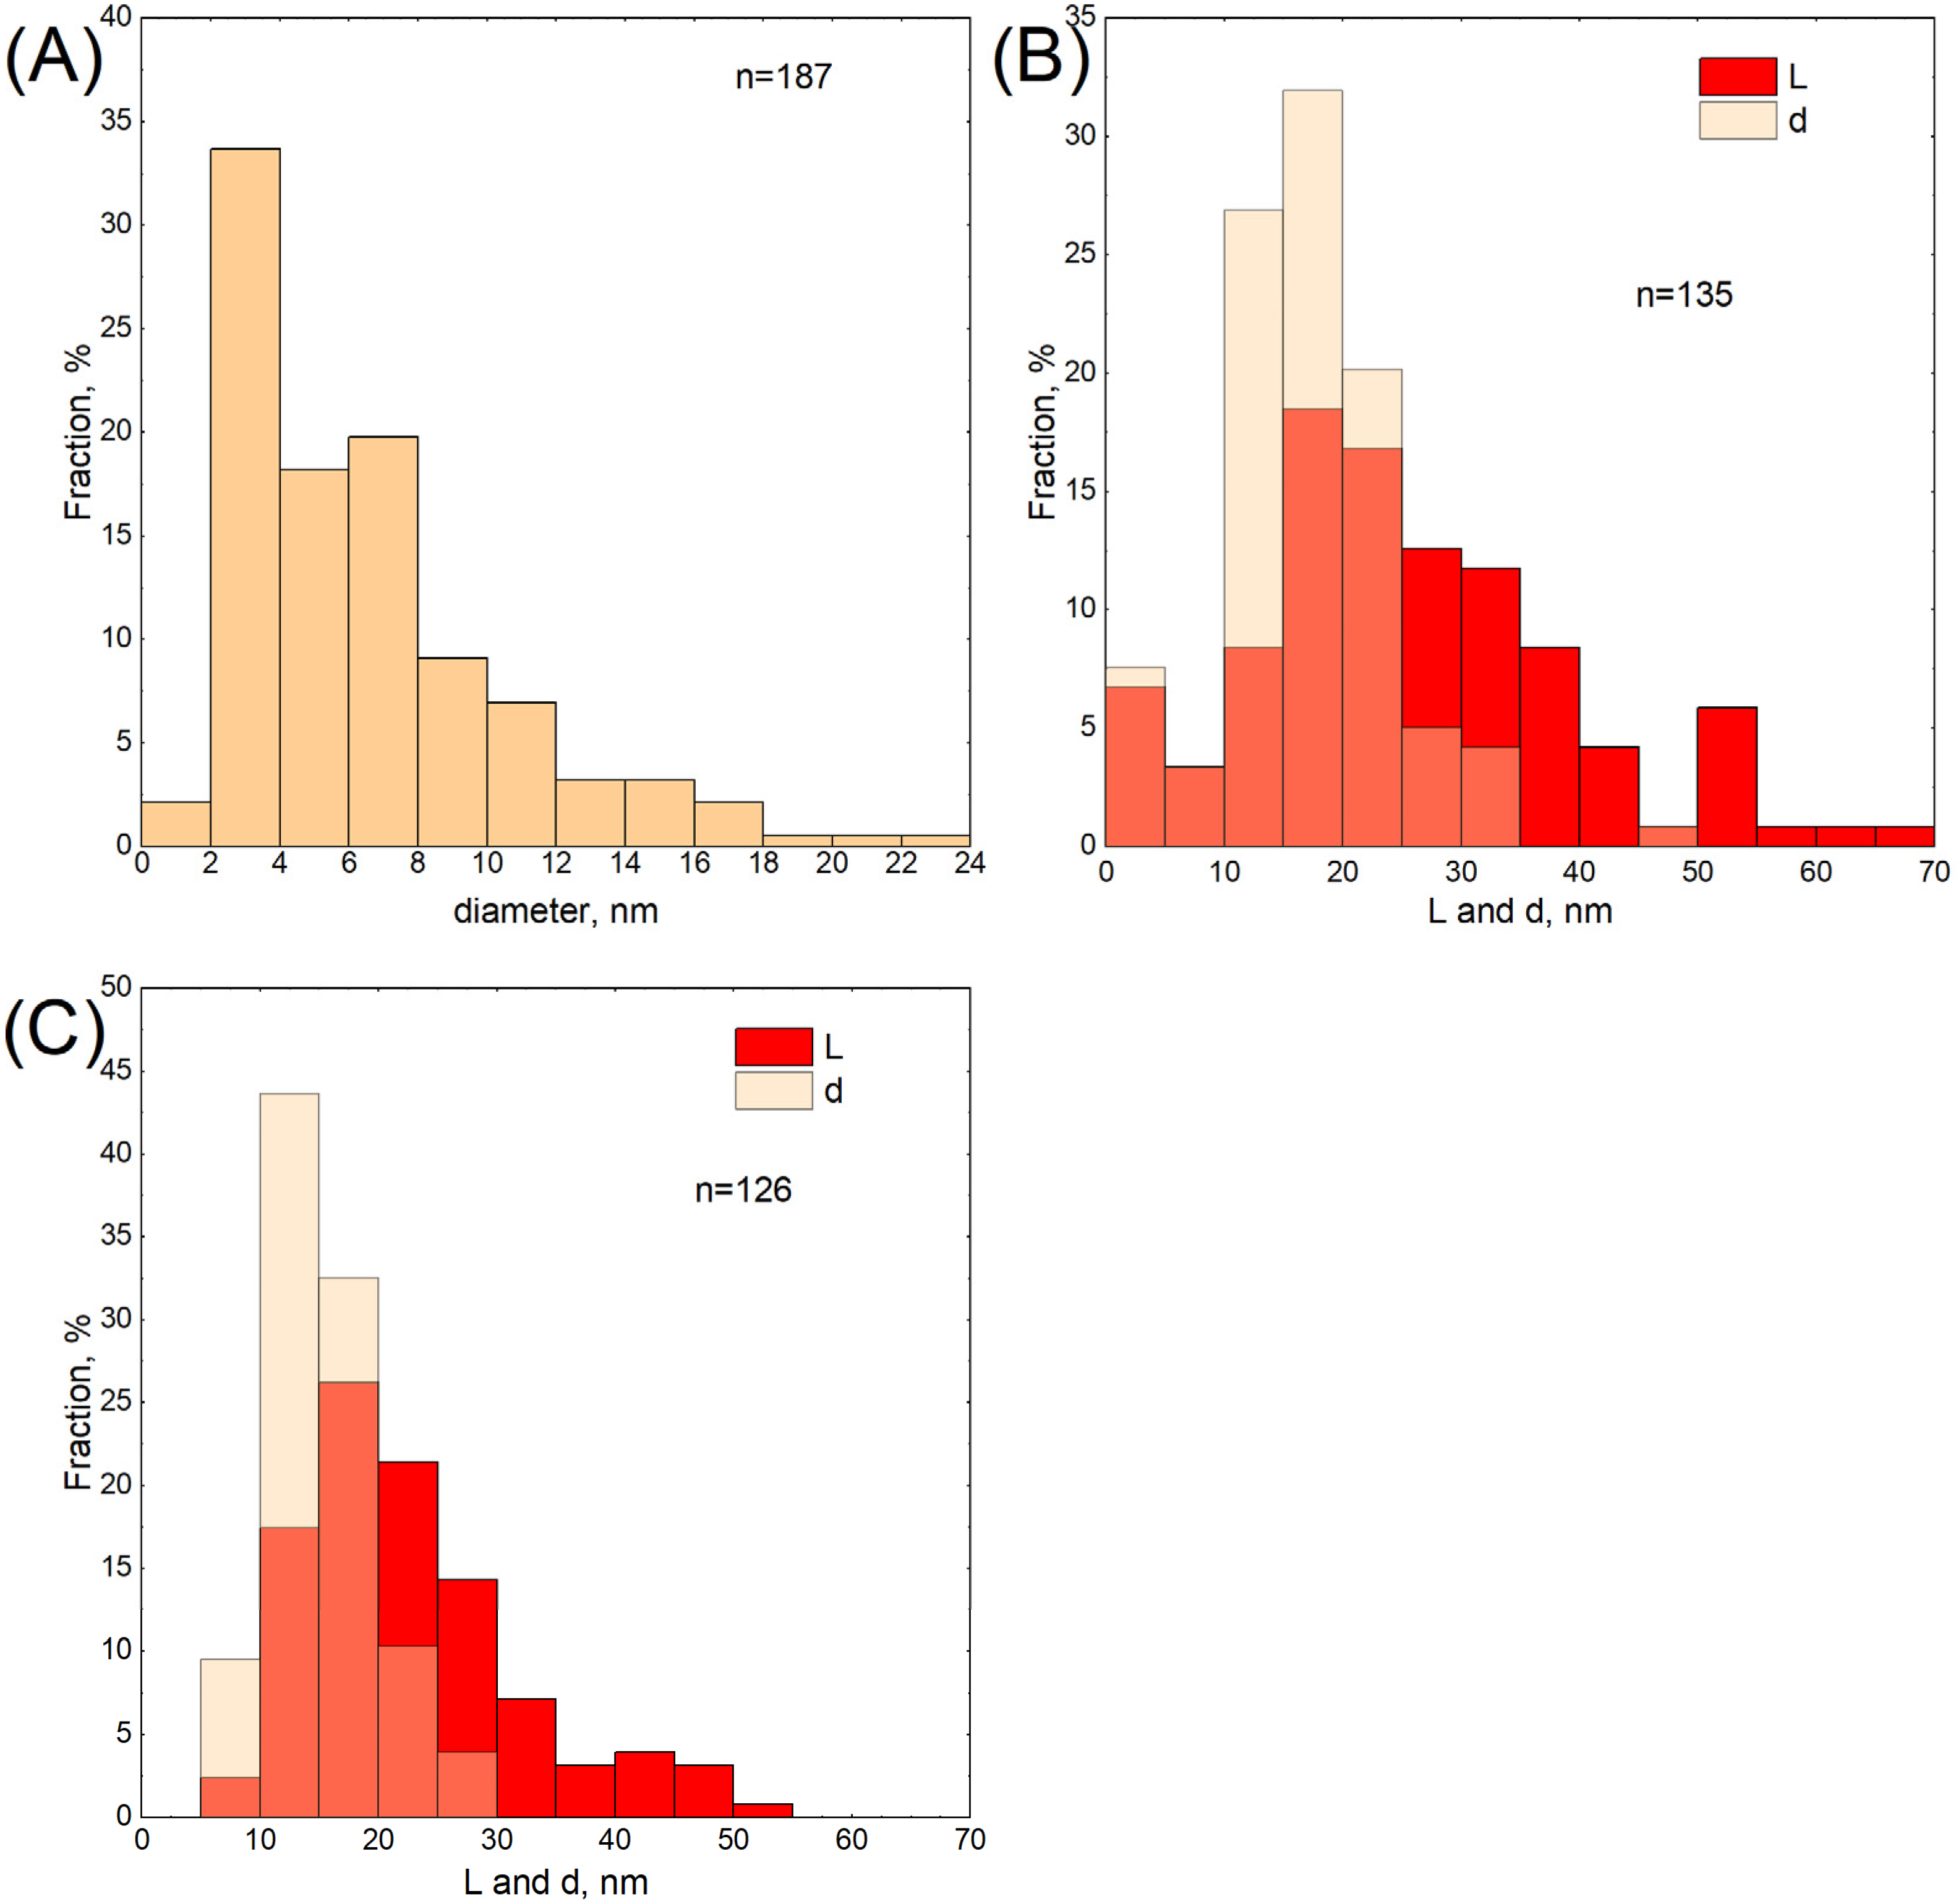
3.7. HR-TEM Analysis
4. Conclusions
- At the phase boundary, the process of ODA adsorption on the surface of silver nanoparticles takes place.
- Low concentration of ODA in the organic phase results in the formation of the third phase or a complete lack of extraction of silver nanoparticles.
Author Contributions
Funding
Institutional Review Board Statement
Informed Consent Statement
Data Availability Statement
Acknowledgments
Conflicts of Interest
References
- Yusuf, M. Silver Nanoparticles: Synthesis and Applications. In Handbook of Ecomaterials; Martínez, L.M.T., Kharissova, O.V., Kharisov, B.I., Eds.; Springer International Publishing: Cham, Switzerland, 2019; pp. 2343–2356. [Google Scholar]
- Iravani, S.; Korbekandi, H.; Mirmohammadi, S.V.; Zolfaghari, B. Synthesis of silver nanoparticles: Chemical, physical and biological methods. Res. Pharm. Sci. 2014, 9, 385–406. [Google Scholar]
- Gudikandula, K.; Maringanti, S.C. Synthesis of silver nanoparticles by chemical and biological methods and their antimicrobial properties. J. Exp. Nanosci. 2016, 11, 714–721. [Google Scholar] [CrossRef]
- Xiao, Q.; Yao, Z.; Liu, J.; Hai, R.; Oderji, H.Y.; Ding, H. Synthesis and characterization of Ag–Ni bimetallic nanoparticles by laser-induced plasma. Thin Solid Films 2011, 519, 7116–7119. [Google Scholar] [CrossRef]
- Asanithi, P.; Chaiyakun, S.; Limsuwan, P. Growth of Silver Nanoparticles by DC Magnetron Sputtering. J. Nanomater. 2012, 2012, 963609. [Google Scholar] [CrossRef]
- Jabłońska, J.; Jankowski, K.; Tomasik, M.; Cykalewicz, D.; Uznański, P.; Całuch, S.; Szybowicz, M.; Zakrzewska, J.; Mazurek, P. Preparation of silver nanoparticles in a high voltage AC arc in water. SN Appl. Sci. 2021, 3, 244. [Google Scholar] [CrossRef]
- Wojnicki, M.; Mania, I.; Marzec, M.; Gajewska, M.; Mech, K. Influence of experimental conditions on deposition of silver nanoparticles onto surface of graphene oxide. Arch. Metall. Mater. 2015, 60, 2631–2635. [Google Scholar] [CrossRef]
- Özkar, S.; Finke, R.G. Silver Nanoparticles Synthesized by Microwave Heating: A Kinetic and Mechanistic Re-Analysis and Re-Interpretation. J. Phys. Chem. C 2017, 121, 27643–27654. [Google Scholar] [CrossRef]
- Pal, A.; Shah, S.; Devi, S. Microwave-assisted synthesis of silver nanoparticles using ethanol as a reducing agent. Mater. Chem. Phys. 2009, 114, 530–532. [Google Scholar] [CrossRef]
- Zhao, X.; Xia, Y.; Li, Q.; Ma, X.; Quan, F.; Geng, C.; Han, Z. Microwave-assisted synthesis of silver nanoparticles using sodium alginate and their antibacterial activity. Colloids Surf. A Physicochem. Eng. Asp. 2014, 444, 180–188. [Google Scholar] [CrossRef]
- Tuleshova, E.Z.; Baeshov, A.B. Electrochemical method for obtaining a finely dispersed silver powder. Russ. J. Appl. Chem. 2015, 88, 1142–1145. [Google Scholar] [CrossRef]
- Jara, N.; Milán, N.S.; Rahman, A.; Mouheb, L.; Boffito, D.C.; Jeffryes, C.; Dahoumane, S.A. Photochemical Synthesis of Gold and Silver Nanoparticles—A Review. Molecules 2021, 26, 4585. [Google Scholar] [CrossRef] [PubMed]
- Pascu, B.; Negrea, A.; Ciopec, M.; Duteanu, N.; Negrea, P.; Bumm, L.A.; Grad, O.; Nemeş, N.S.; Mihalcea, C.; Duda-Seiman, D.M. Silver Nanoparticle Synthesis via Photochemical Reduction with Sodium Citrate. Int. J. Mol. Sci. 2023, 24, 255. [Google Scholar] [CrossRef]
- Zhang, Y.; Chen, F.; Zhuang, J.; Tang, Y.; Wang, D.; Wang, Y.; Dong, A.; Ren, N. Synthesis of silver nanoparticles via electrochemical reduction on compact zeolite film modified electrodes. Chem. Commun. 2002, 23, 2814–2815. [Google Scholar] [CrossRef] [PubMed]
- Kuntyi, O.; Mazur, A.; Kytsya, A.; Karpenko, O.; Bazylyak, L.; Mertsalo, I.; Pokynbroda, T.; Prokopalo, A. Electrochemical synthesis of silver nanoparticles in solutions of rhamnolipid. Micro Nano Lett. 2020, 15, 802–807. [Google Scholar] [CrossRef]
- Singaravelan, R.; Bangaru Sudarsan Alwar, S. Electrochemical synthesis, characterisation and phytogenic properties of silver nanoparticles. Appl. Nanosci. 2015, 5, 983–991. [Google Scholar] [CrossRef]
- Mavaei, M.; Chahardoli, A.; Shokoohinia, Y.; Khoshroo, A.; Fattahi, A. One-step Synthesized Silver Nanoparticles Using Isoimperatorin: Evaluation of Photocatalytic, and Electrochemical Activities. Sci. Rep. 2020, 10, 1762. [Google Scholar] [CrossRef]
- Mavani, K.; Shah, M. Synthesis of Silver Nanoparticles by Using Sodium Borohydride as a Reducing Agent. Int. J. Eng. Res. Technol. 2013, 2, 1–5. [Google Scholar] [CrossRef]
- Quintero-Quiroz, C.; Acevedo, N.; Zapata-Giraldo, J.; Botero, L.E.; Quintero, J.; Zárate-Triviño, D.; Saldarriaga, J.; Pérez, V.Z. Optimization of silver nanoparticle synthesis by chemical reduction and evaluation of its antimicrobial and toxic activity. Biomater. Res. 2019, 23, 27. [Google Scholar] [CrossRef]
- Mushran, S.P.; Agrawal, M.C.; Mehrotra, R.M.; Sanehi, R. Kinetics and Mechanism of Reduction of Silver(I) by Ascorbic Acid. J. Chem. Soc. Dalton Trans. 1973, 3, 1460–1462. [Google Scholar] [CrossRef]
- Malassis, L.; Dreyfus, R.; Murphy, R.J.; Hough, L.A.; Donnio, B.; Murray, C.B. One-step green synthesis of gold and silver nanoparticles with ascorbic acid and their versatile surface post-functionalization. RSC Adv. 2016, 6, 33092–33100. [Google Scholar] [CrossRef]
- Katherine, G.; Brajesh, K.; Marcelo, G.; Alexis, D.; Luis, C. Ascorbic Acid-assisted Green Synthesis of Silver Nanoparticles: pH and Stability Study. In Green Chemistry; Brajesh, K., Alexis, D., Eds.; IntechOpen: Rijeka, Croatia, 2022; Chapter 13. [Google Scholar] [CrossRef]
- Zain, N.M.; Stapley, A.G.F.; Shama, G. Green synthesis of silver and copper nanoparticles using ascorbic acid and chitosan for antimicrobial applications. Carbohydr. Polym. 2014, 112, 195–202. [Google Scholar] [CrossRef] [PubMed]
- Eka Putri, G.; Rahayu Gusti, F.; Novita Sary, A.; Zainul, R. Synthesis of silver nanoparticles used chemical reduction method by glucose as reducing agent. J. Phys. Conf. Ser. 2019, 1317, 012027. [Google Scholar] [CrossRef]
- Wojnicki, M.; Luty-Błocho, M.; Kotańska, M.; Wytrwal, M.; Tokarski, T.; Krupa, A.; Kołaczkowski, M.; Bucki, A.; Kobielusz, M. Novel and effective synthesis protocol of AgNPs functionalized using L-cysteine as a potential drug carrier. Naunyn-Schmiedeberg’s Arch. Pharmacol. 2018, 391, 123–130. [Google Scholar] [CrossRef] [PubMed]
- Babu Kalidindi, S.; Sanyal, U.; Jagirdar, B.R. Chemical Synthesis of Metal Nanoparticles Using Amine–Boranes. ChemSusChem 2011, 4, 317–324. [Google Scholar] [CrossRef] [PubMed]
- Agnihotri, S.; Mukherji, S.; Mukherji, S. Size-controlled silver nanoparticles synthesized over the range 5–100 nm using the same protocol and their antibacterial efficacy. RSC Adv. 2014, 4, 3974–3983. [Google Scholar] [CrossRef]
- Wang, X.; Zhao, Z.; Ou, D.; Tu, B.; Cui, D.; Wei, X.; Cheng, M. Size-controlled synthesis of silver nanoparticles from silver mirror reaction in toluene. Micro Nano Lett. 2016, 11, 454–456. [Google Scholar] [CrossRef]
- Zhang, W.; Zhang, L.; Sun, Y. Size-controlled green synthesis of silver nanoparticles assisted by L-cysteine. Front. Chem. Sci. Eng. 2015, 9, 494–500. [Google Scholar] [CrossRef]
- Gul, N.; Ata, S.; Bibi, I.; Ijaz ul, M.; Azam, M.; Shahid, A.; Alwadai, N.; Masood, N.; Iqbal, M. Size controlled synthesis of silver nanoparticles: A comparison of modified Turkevich and BRUST methods. J. Phys. Chem. 2022, 236, 1173–1189. [Google Scholar] [CrossRef]
- Dong, X.; Ji, X.; Wu, H.; Zhao, L.; Li, J.; Yang, W. Shape Control of Silver Nanoparticles by Stepwise Citrate Reduction. J. Phys. Chem. C 2009, 113, 6573–6576. [Google Scholar] [CrossRef]
- Khodashenas, B.; Ghorbani, H.R. Synthesis of silver nanoparticles with different shapes. Arab. J. Chem. 2019, 12, 1823–1838. [Google Scholar] [CrossRef]
- Mukherji, S.; Bharti, S.; Shukla, G.; Mukherji, S. Synthesis and characterization of size- and shape-controlled silver nanoparticles. Phys. Sci. Rev. 2019, 4, 20170082. [Google Scholar] [CrossRef]
- Hong, T.; Lu, A.; Liu, W.; Chen, C. Microdroplet Synthesis of Silver Nanoparticles with Controlled Sizes. Micromachines 2019, 10, 274. [Google Scholar] [CrossRef] [PubMed]
- Zhu, J.; Liu, S.; Palchik, O.; Koltypin, Y.; Gedanken, A. Shape-Controlled Synthesis of Silver Nanoparticles by Pulse Sonoelectrochemical Methods. Langmuir 2000, 16, 6396–6399. [Google Scholar] [CrossRef]
- Martins, C.S.M.; Sousa, H.B.A.; Prior, J.A.V. From Impure to Purified Silver Nanoparticles: Advances and Timeline in Separation Methods. Nanomaterials 2021, 11, 3407. [Google Scholar] [CrossRef] [PubMed]
- Alele, N.; Streubel, R.; Gamrad, L.; Barcikowski, S.; Ulbricht, M. Ultrafiltration membrane-based purification of bioconjugated gold nanoparticle dispersions. Sep. Purif. Technol. 2016, 157, 120–130. [Google Scholar] [CrossRef]
- Wang, X.; Xu, S.; Zhou, J.; Xu, W. A rapid phase transfer method for nanoparticles using alkylamine stabilizers. J. Colloid Interface Sci. 2010, 348, 24–28. [Google Scholar] [CrossRef]
- Kumar, A.; Joshi, H.; Pasricha, R.; Mandale, A.B.; Sastry, M. Phase transfer of silver nanoparticles from aqueous to organic solutions using fatty amine molecules. J. Colloid Interface Sci. 2003, 264, 396–401. [Google Scholar] [CrossRef]
- Sastry, M. Phase transfer protocols in nanoparticle synthesis. Curr. Sci. 2003, 85, 1735–1745. [Google Scholar]
- Smits, J.; Giri, R.P.; Shen, C.; Mendonça, D.; Murphy, B.; Huber, P.; Rezwan, K.; Maas, M. Synergistic and Competitive Adsorption of Hydrophilic Nanoparticles and Oil-Soluble Surfactants at the Oil–Water Interface. Langmuir 2021, 37, 5659–5672. [Google Scholar] [CrossRef]
- Benitez, J.J.; Fuente, O.R.d.l.; Díez-Pérez, I.; Sanz, F.; Salmeron, M. Dielectric properties of self-assembled layers of octadecylamine on mica in dry and humid environments. J. Chem. Phys. 2005, 123, 104706. [Google Scholar] [CrossRef]
- Bossa, G.V.; Roth, J.; Bohinc, K.; May, S. The apparent charge of nanoparticles trapped at a water interface. Soft Matter 2016, 12, 4229–4240. [Google Scholar] [CrossRef] [PubMed]
- Wyman, J. The dielectric constant of mixtures of ethyl alcohol and water from −5 to 40°. J. Am. Chem. Soc. 1931, 53, 3292–3301. [Google Scholar] [CrossRef]
- Elliott, N.B.; Prenni, A.J.; Ndou, T.T.; Warner, I.M. Size-Selective Extraction of Polycyclic Aromatic Hydrocarbons from a Microemulsion System Using Cyclodextrins. J. Colloid Interface Sci. 1993, 156, 359–364. [Google Scholar] [CrossRef]
- National Center for Biotechnology Information. 2023. Available online: https://pubchem.ncbi.nlm.nih.gov/compound/Octadecylamine (accessed on 12 February 2023).
- Wojnicki, M.; Luty-Błocho, M.; Kwolek, P.; Gajewska, M.; Socha, R.P.; Pędzich, Z.; Csapó, E.; Hessel, V. The influence of dielectric permittivity of water on the shape of PtNPs synthesized in high-pressure high-temperature microwave reactor. Sci. Rep. 2021, 11, 4851. [Google Scholar] [CrossRef] [PubMed]
- Machunsky, S.; Peuker, U.A. Liquid-Liquid Interfacial Transport of Nanoparticles. Phys. Sep. Sci. Eng. 2007, 2007, 034832. [Google Scholar] [CrossRef]
- Sredojević, D.; Stavrić, S.; Lazić, V.; Ahrenkiel, S.P.; Nedeljković, J.M. Interfacial charge transfer complex formation between silver nanoparticles and aromatic amino acids. Phys. Chem. Chem. Phys. 2022, 24, 16493–16500. [Google Scholar] [CrossRef]
- Yang, J.; Yin, H.; Jia, J.; Wei, Y. Facile Synthesis of High-Concentration, Stable Aqueous Dispersions of Uniform Silver Nanoparticles Using Aniline as a Reductant. Langmuir 2011, 27, 5047–5053. [Google Scholar] [CrossRef]
- Wang, D.; Li, Y. Effective Octadecylamine System for Nanocrystal Synthesis. Inorg. Chem. 2011, 50, 5196–5202. [Google Scholar] [CrossRef]
- Patil, V.; Sastry, M. Formation of Close-Packed Silver Nanoparticle Multilayers from Electrostatically Grown Octadecylamine/Colloid Nanocomposite Precursors. Langmuir 2000, 16, 2207–2212. [Google Scholar] [CrossRef]
- Yin, A.-X.; Min, X.-Q.; Zhang, Y.-W.; Yan, C.-H. Shape-Selective Synthesis and Facet-Dependent Enhanced Electrocatalytic Activity and Durability of Monodisperse Sub-10 nm Pt−Pd Tetrahedrons and Cubes. J. Am. Chem. Soc. 2011, 133, 3816–3819. [Google Scholar] [CrossRef]
- Kundu, S.; Liang, H. Photoinduced Formation of Shape-Selective Pt Nanoparticles. Langmuir 2010, 26, 6720–6727. [Google Scholar] [CrossRef] [PubMed]
- Gupta, S.S.R.; Kantam, M.L.; Bhanage, B.M. Shape-selective synthesis of gold nanoparticles and their catalytic activity towards reduction of p-nitroaniline. Nano-Struct. Nano-Objects 2018, 14, 125–130. [Google Scholar] [CrossRef]
- Yamashita, Y.; Tashiro, S.; Ishii, Y.; Uchihashi, T.; Matsushita, N.; Kubota, R.; Shionoya, M. Shape-selective one-step synthesis of branched gold nanoparticles on the crystal surface of redox-active PdII-macrocycles. Dalton Trans. 2022, 51, 1318–1324. [Google Scholar] [CrossRef] [PubMed]


| AgNPs in Different Solvents | λmax, nm | Absorbance Organic Phase, A.U. | Extraction Efficiency, % | Dielectric Constant ε, - | Solubility of Dispersant Phase in Water, mg/L |
|---|---|---|---|---|---|
| water | 389 | 1.757 | 100.0 | 80.1 | No limit |
| n-hexane | 399 | 1.962 | 100.0 | 2.1 | 9.5 |
| cyclohexene | 400 | 2.077 | 98.5 | 2.2 | 55 |
| toluene | 420 | 0.315 | 100.0 | 2.4 | 526 |
| chloroform | 406 | 1.209 | 100.0 | 4.8 | 7.95 × 10³ |
| ethyl acetate | 408 | 0.03 | 98.9 | 6.0 | 64 × 103 |
| AgNPs in Different Solvents | d, nm | SD, nm |
|---|---|---|
| water | 22.0 | 2.8 |
| n-hexane | 20.3 | 0.8 |
| cyclohexene | 15.0 | 1.1 |
| toluene | 199.4 | 9.9 |
| chloroform | 11.6 | 1.6 |
Disclaimer/Publisher’s Note: The statements, opinions and data contained in all publications are solely those of the individual author(s) and contributor(s) and not of MDPI and/or the editor(s). MDPI and/or the editor(s) disclaim responsibility for any injury to people or property resulting from any ideas, methods, instructions or products referred to in the content. |
© 2023 by the authors. Licensee MDPI, Basel, Switzerland. This article is an open access article distributed under the terms and conditions of the Creative Commons Attribution (CC BY) license (https://creativecommons.org/licenses/by/4.0/).
Share and Cite
Wojtaszek, K.; Tokarski, T.; Kutyła, D.; Kołczyk-Siedlecka, K.; Żabiński, P.; Csapó, E.; Socha, R.P.; Escribà-Gelonch, M.; Hessel, V.; Wojnicki, M. The Mechanism of Phase Transfer Synthesis of Silver Nanoparticles Using a Fatty Amine as Extractant/Phase Transfer Agent. Metals 2023, 13, 882. https://doi.org/10.3390/met13050882
Wojtaszek K, Tokarski T, Kutyła D, Kołczyk-Siedlecka K, Żabiński P, Csapó E, Socha RP, Escribà-Gelonch M, Hessel V, Wojnicki M. The Mechanism of Phase Transfer Synthesis of Silver Nanoparticles Using a Fatty Amine as Extractant/Phase Transfer Agent. Metals. 2023; 13(5):882. https://doi.org/10.3390/met13050882
Chicago/Turabian StyleWojtaszek, Konrad, Tomasz Tokarski, Dawid Kutyła, Karolina Kołczyk-Siedlecka, Piotr Żabiński, Edit Csapó, Robert P. Socha, Marc Escribà-Gelonch, Volker Hessel, and Marek Wojnicki. 2023. "The Mechanism of Phase Transfer Synthesis of Silver Nanoparticles Using a Fatty Amine as Extractant/Phase Transfer Agent" Metals 13, no. 5: 882. https://doi.org/10.3390/met13050882
APA StyleWojtaszek, K., Tokarski, T., Kutyła, D., Kołczyk-Siedlecka, K., Żabiński, P., Csapó, E., Socha, R. P., Escribà-Gelonch, M., Hessel, V., & Wojnicki, M. (2023). The Mechanism of Phase Transfer Synthesis of Silver Nanoparticles Using a Fatty Amine as Extractant/Phase Transfer Agent. Metals, 13(5), 882. https://doi.org/10.3390/met13050882