Article

Convolution Neural Network Fusion Lock-In Thermography: A Debonding Defect Intelligent Determination Approach for Aviation Honeycomb Sandwich Composites (HSCs)

1
Sichuan Institute of Aerospace Systems Engineering, Chengdu 610100, China
2
School of Mechatronics Engineering, Harbin Institute of Technology, Harbin 150001, China
3
State Key Laboratory of Robotics and System (HIT), Harbin Institute of Technology, Harbin 150001, China
*
Authors to whom correspondence should be addressed.
Metals 2023, 13(5), 881; https://doi.org/10.3390/met13050881
Submission received: 29 March 2023 / Revised: 12 April 2023 / Accepted: 26 April 2023 / Published: 2 May 2023
(This article belongs to the Special Issue Thermography Techniques for Examination of Metals)

Abstract

:
This report is on convolution neural network (CNN) fusion lock-in thermography, which can implement the intelligent identification of defects for aviation honeycomb sandwich composites (HSCs). First, HSCs specimens with subsurface delamination defects were fabricated and stimulated by halogen lamps according to sinusoidal modulation, and the defects were reliably inspected using lock-in thermography. The amplitude and phase images (commonly referred to as feature images) were obtained by using a digital lock-in correlation algorithm. Furthermore, these feature images were changed into gray or color-level image formalism datasets, which is pre-processed in ways including contrast enhancement, threshold segmentation as well as mosaic data augmentation. Finally, the four-layer feature pyramid structure and ransformer are combined and introduced to the popular YOLOv5 CNN model, and a YOLOLT CNN model is formed to realize the defect identification. The average precision (AP) in the defect identification of HSCs in complex environments (contains noise and other objects) reached 93.2% and achieved an average recognition speed of 0.6 s/image.

1. Introduction

Launch vehicles and aerospace vehicles have put forward higher requirements for the specific strength and specific modulus of their materials. Honeycomb sandwich composites (HSCs) are made of two high-strength facings and a lightweight honeycomb core (i.e., aluminum, titanium as well as paper), and they have been widely used in the primary and secondary load-bearing structures of aerospace vehicles due to their high specific stiffness, high specific strength, low density, good thermal insulation, as well as vibration reduction [1,2,3]. During the preparation process or long-term work in a harsh environment, HSCs may generate defects or damages (i.e., debonding, collapse, skin delamination, ponding, impact damage, etc.), and among the defects, the most common is the debonding between the skin and an adhesive layer, as well as the adhesive layer and a honeycomb core [4]. These defects are usually small, discontinuous, and relatively hidden, which causes HSCs to have no symptoms before failure; however they are suddenly destroyed under the action of external impact or internal stress, causing a fatal threat to the structure and seriously affecting the normal use of relevant components [5]. Therefore, it is of great significance to quickly, efficiently and accurately identify the debonding defects of internal HSCs using an effective nondestructive testing and evaluation (NDT&E) approach.
Currently, several NDT&E techniques have been used to detect the debonding defects that occurred on HSCs including holographic interferometry (HI), ultrasonic testing (UT) and infrared thermography (IRT) [6]. Holographic interferometry (HI) is a fully optical method for defect detection, allowing the measuring of the surface displacement changes induced by subsurface defects with external stimulation. Thomas. et al. applied the HI method to inspect the defect with a square wave excitation, and a defect detection strategy was proposed to improve the speed and accuracy of the debonding detection of internal sandwich structures [7]. The leaky lamb wave method has been utilized to detect the defect of sandwich structures. Chong et al. reported a full-field ultrasonic guided wave approach for the inspection of sandwich composite. Gere, the continuous wavelet transform was used to characterize the full-field ultrasonic signal at a given dominant frequency [8]. As the ultrasonic guide wave method has the disadvantage of lower detection efficiency, the immersion C scan method has been used to inspect the debonding of HSCs, and the C scan image provides a powerful tool for the debonding detection of HSCs [9]. Simultaneously, immersion C needs water as the coupling medium. This is a contact inspection method, and these factors would affect the applicability of this method and the detection ability.
Lock-in thermography (LIT) as an active thermography method has been employed for the detection of many defects, especially typical defects of composite such as debonding, delamination and fiber fracture [10,11,12]. LIT possibly requires less energy, obtains high signal-noise-ratio (SNR) and detect deep defects, and has showed to be very attractive for applications in the aerospace and automotive industry. Meola et al. applied LIT to inspect the common damages of aerospace composites, and the results show that LIT was effectively used for the detection of impact damage extension range and the size of composites [13]. Wang et al. [5] presented LIT to detect the debonding of carbon/epoxy facings-aluminum honeycomb sandwich composites (C/E HSCs) and established a 3D finite element model of HSCs with an external optical sinusoidal excitation to analyze the effects of the modulation frequency, optical power intensity, and excitation period on defect detectability, and the results implied that LIT provides an effective method for inspecting the debonding of C/E HSCs. Recently, many deep learning methods have been remarkable in computer vision tasks. Among them, convolution neural network (CNN) has been attractive and widely used in imaging processing, classification, and target recognition.
The aim of this paper is to detect the debonding of HSCs by combining LIT and CNN, which is helpful in accurately identifying the debonding of HSCs and reducing the interference of background noise. To accomplish this aim, the paper is organized as follows: In Section 2, the HSCs specimens with subsurface debonding are fabricated, and a CNN model YOLOLT that combines a four-layer feature pyramid structure and transformer is proposed for HSCs debonding defect recognition. Section 3 highlights the LIT image processing and CNN training, and introduces the experimental study on the debonding defect identifications of HSCs using the YOLOLT method. Finally, the conclusions are presented in Section 4.

2. Specimens and Methods

2.1. Specimens

In this study, the carbon/epoxy HSCs specimens are prepared and illustrated in Figure 1, where the carbon/epoxy facing thickness is 1.0 mm, labeled as S1, S2 and S3. The debonding defects are modeled by adhering 0.1 mm Polytetrafluoroethylene (PTFE) film on the adhesive layer, and they have different sizes, shapes and spacings. The dimensions and shapes of sample were obtained by tape measures and a bore gauge. The size of the sample is 600 mm × 400 mm.

2.2. Experimental Setup and Procedure

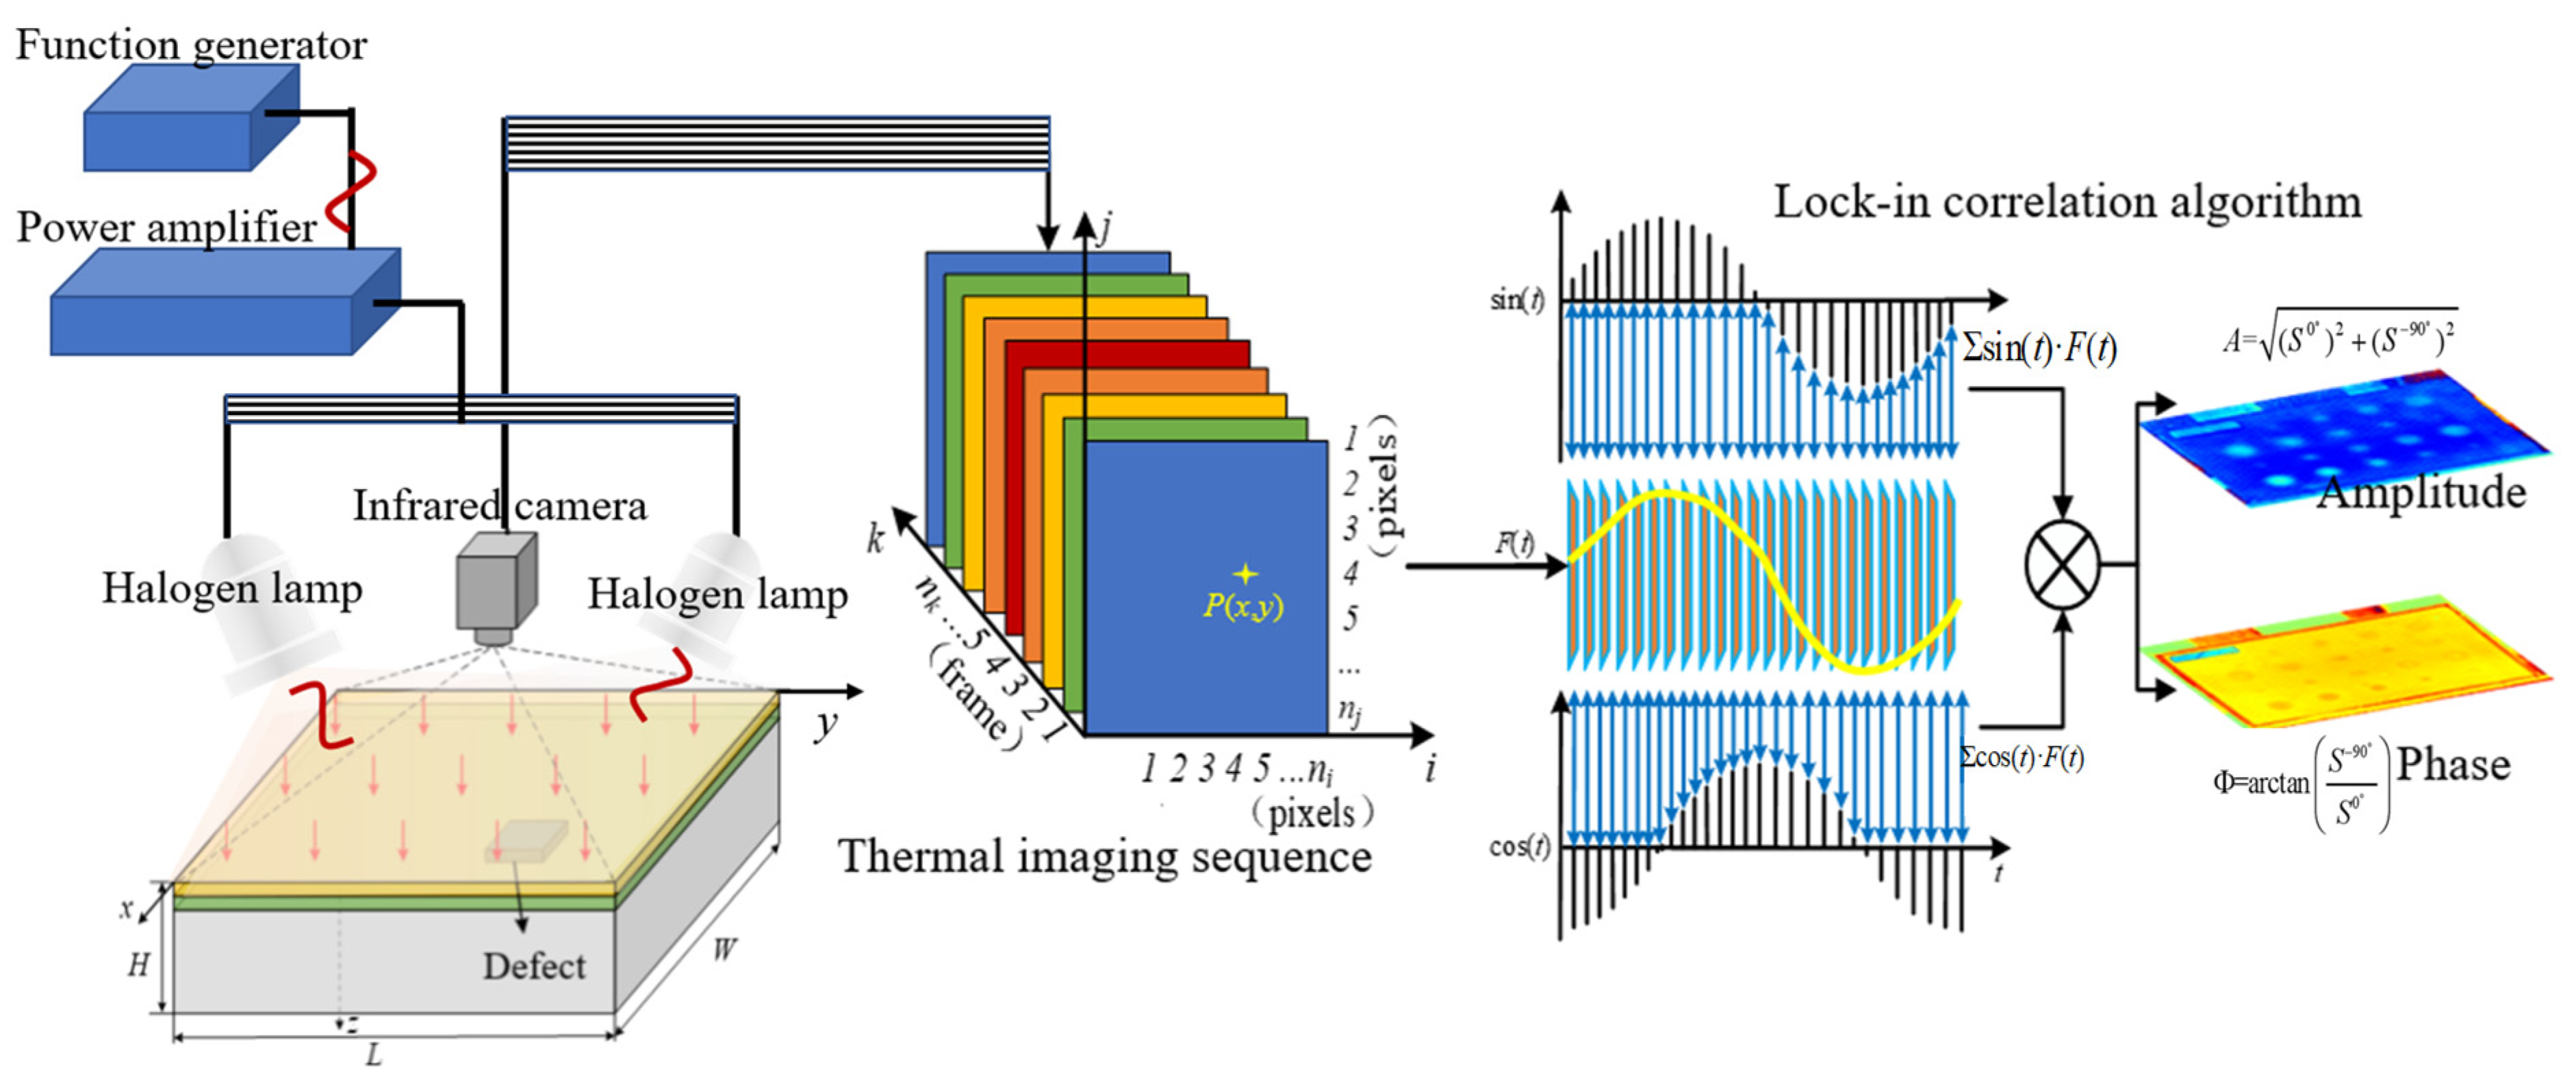
A schematic diagram of the experimental setup was presented in Figure 2. Here, a mid-infrared camera (FLIR SC7000) with 320 × 256 pixels elements, spectral bandwidth 3.6~5.1 μm and frame rate 170 fps for the full window was employed for LIT inspection. The modulation heat apparatus utilized two 1 kW halogen lamps to provide the external excitation, and a Protek 9031 function generator was used to control the power amplifier to sinusoidally modulate the intensity of the halogen lamps. To prevent direct reflection back into the infrared camera, the thermal sources were oriented on either side of the specimen.
The HSCs specimen was vertically positioned with the sound side exposed to the excitation source. In this study, the specimen was localized at a distance of 2 m to the infrared camera, a range of modulation frequencies was used to interrogate HSCs specimens ranging from 0.4 Hz down to 0.05 Hz and the frame rate of the infrared camera was set to 37 fps.
Figure 3 shows the LIT amplitude and phase images of S1 HSCs specimen at different frequencies.
From Figure 3, it can be found that the modulation frequency has a critical and significant effect on the subsurface defect detection by both LIT amplitude and phase images. However, the LIT phase image is helpful to identify the defect compared to LIT amplitude, which is easily influenced by non-uniform heat and surface emissivity.

2.3. YOLOLT Model

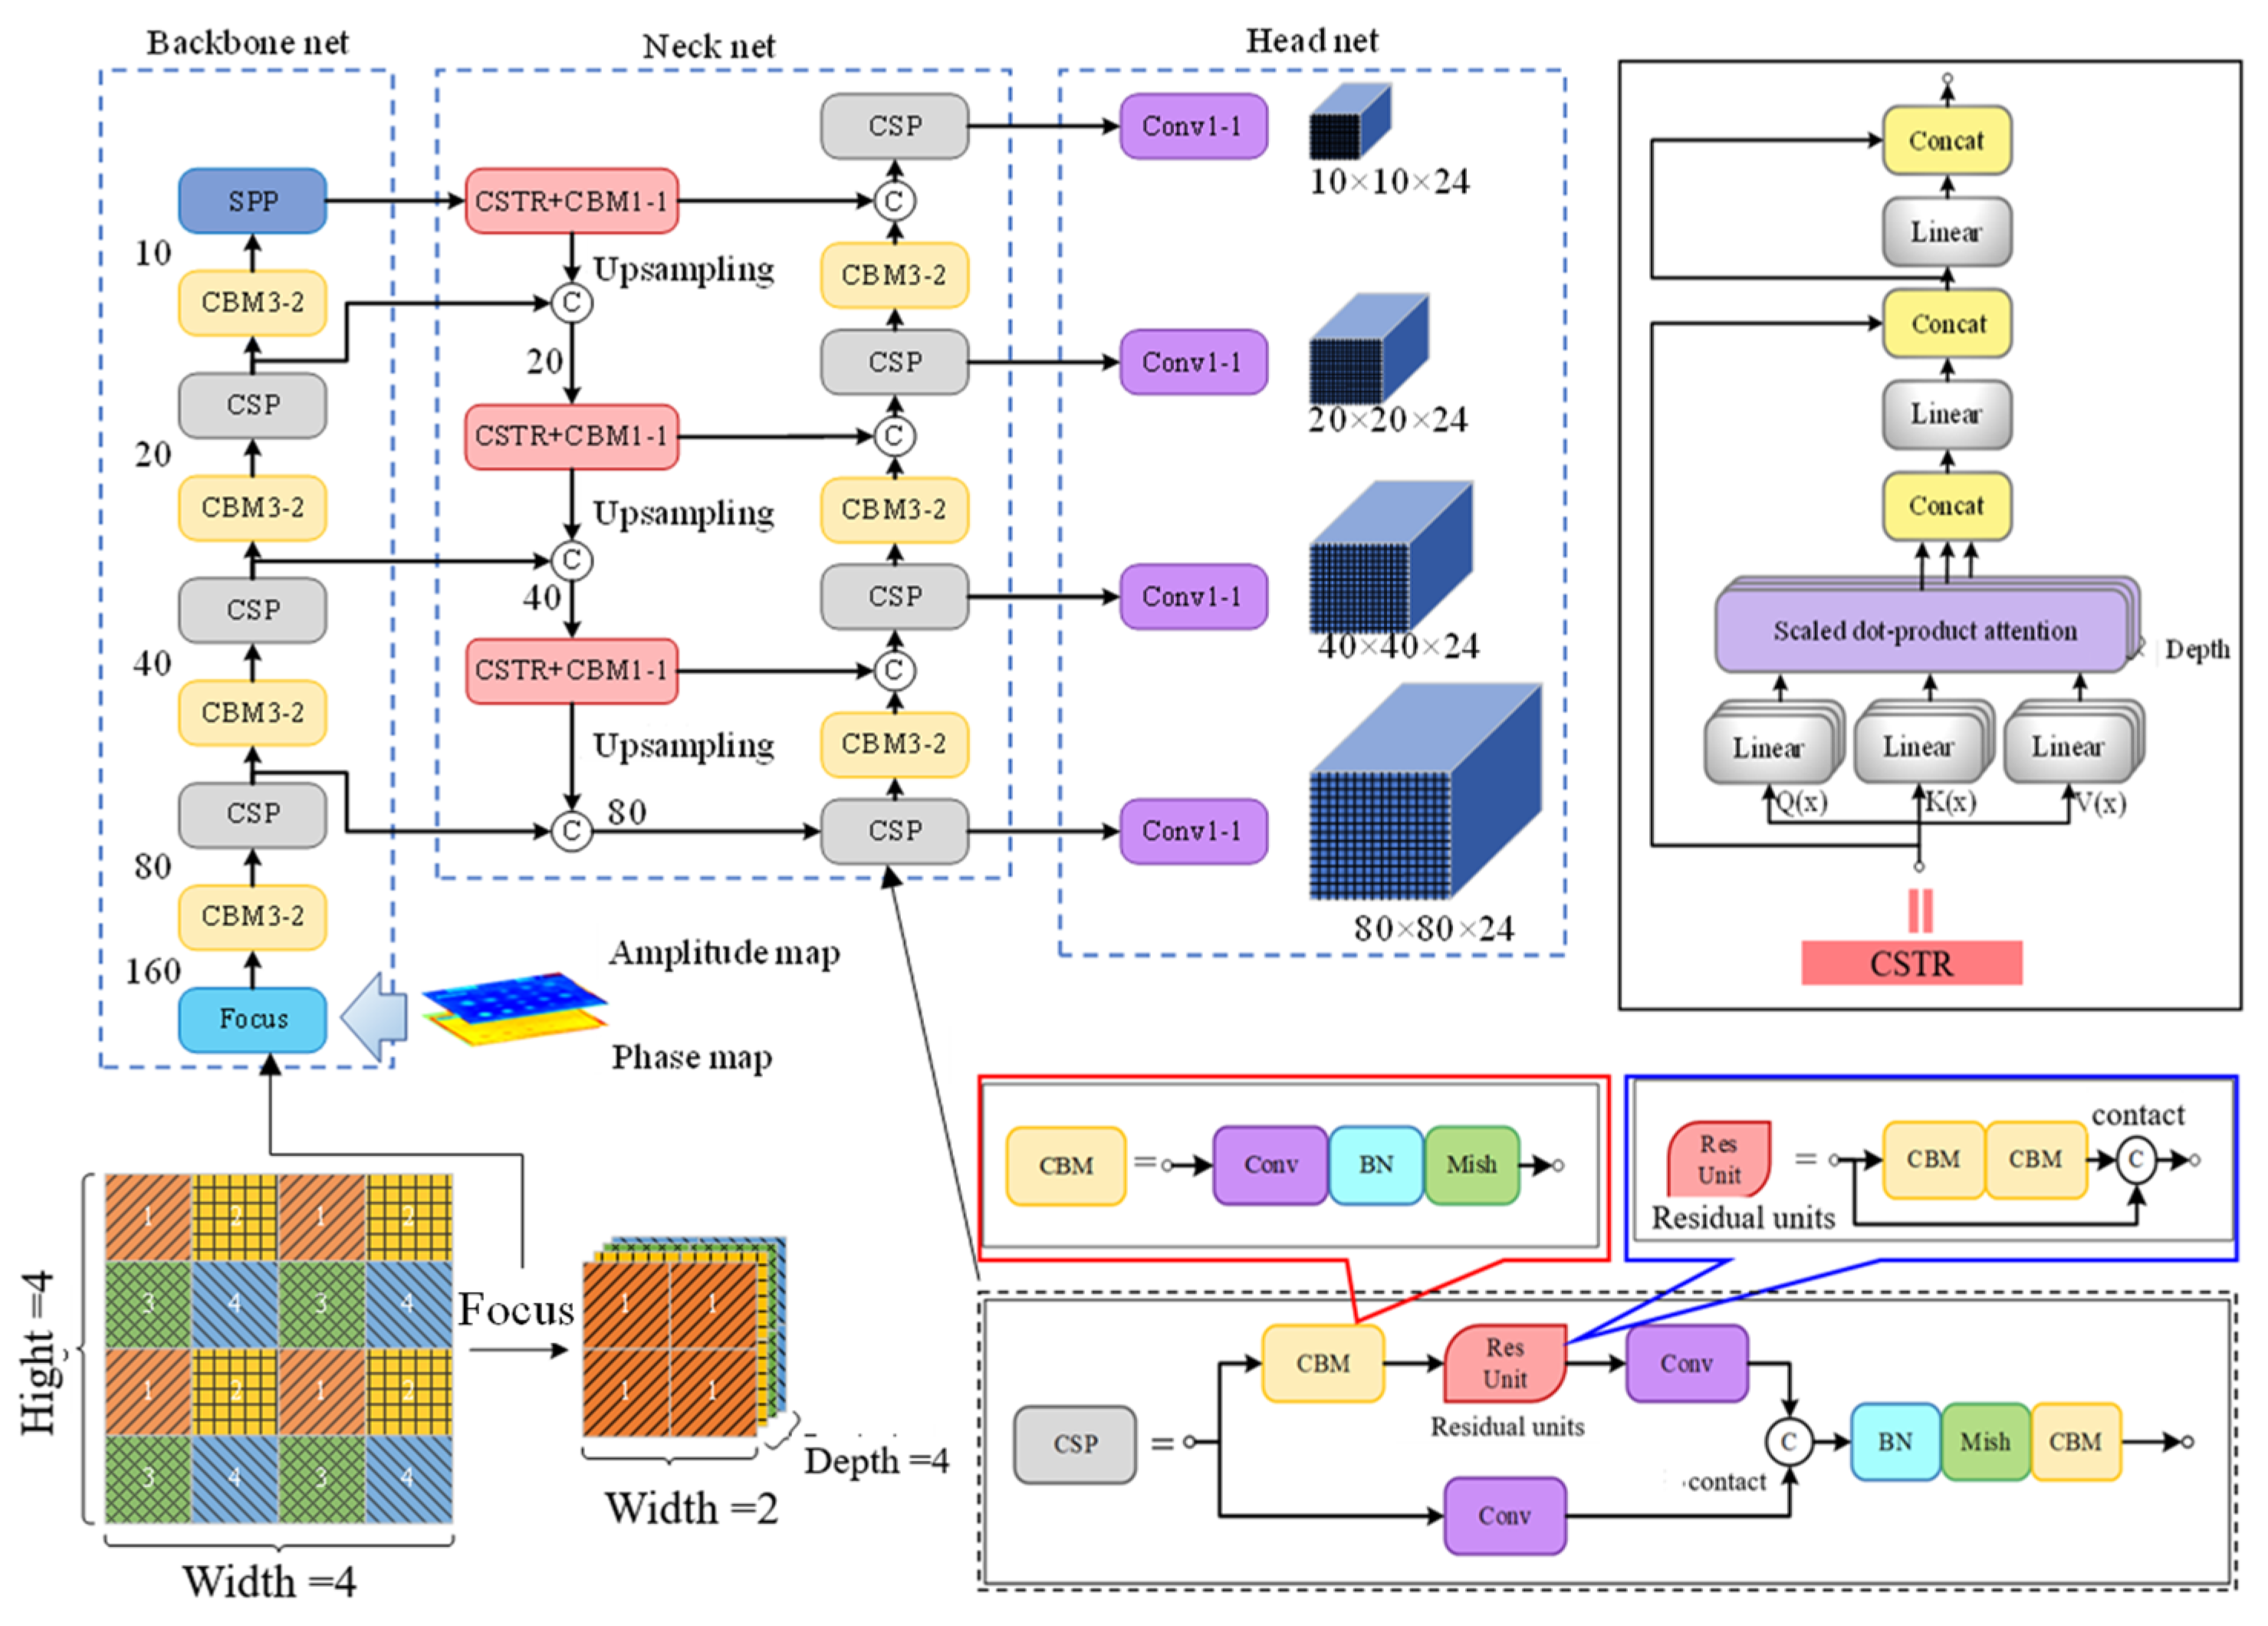
To reliably and accurately identify the debonding of HSCs, a defined YOLOLT convolution neural network (CNN) model is proposed, utilizing a matured YOLOv5-based CNN structure to integrate into lock-in thermography (LIT), and its structure mainly includes backbone net, neck net, and head net. Figure 4 represents the schematic diagram of the structure of the YOLOLT model.
In Figure 4, the backbone net was a fully convolutional network that used a large number of residual skip layer connections, and to avoid the adverse effect of the pooling layer on the gradient update, a convolution operation with a stride of 2 was utilized to implement the down-sampling operation. In the neck net, the feature pyramid network (FPN) [14] and the pyramid attention network (PAN) [15] were used to fuse deep and shallow features to achieve multi-scale target recognition. FPN and PAN aggregate parameters for the various recognition layers from different backbone layers by connecting breadthwise, which make the multi-scale feature images have better robustness for facing objects with a large-scale variation range. In the head net, the EIOU Loss function [16] was employed for the loss function of the prediction box position, and the BCE Loss [17] was considered as both the category loss function and target confidence loss function of the prediction box.
As LIT amplitude and phase images are formed with each calculation pixel value by using of the lock-in correlation algorithm seen in Figure 2, they are unavailable as the input image-based gray or RGB levels for the YOLOVLT model. Therefore, the LIT amplitude and phase images should be changed to gray or RGB-level images, and they can be transferred into gray or RGB images by the following:
I g r a y [ A m ( x , y ) ] = g r a y ( I A m )
I g r a y [ P h ( x , y ) ] = g r a y ( I P h )
I r g b [ A m ( x , y ) ] = R G B ( I A m )
I r g b [ P h ( x , y ) ] = R G B ( I P h )
I A m = A m ( x , y ) min [ A m ( x , y ) ] max [ A m ( x , y ) ] min [ A m ( x , y ) ]
I P h = P h ( x , y ) min [ P h ( x , y ) ] max [ P h ( x , y ) ] min [ P h ( x , y ) ]
here, Igray, Irgb present the gray level image and RGB pseudo-color image, IAm, IPh stand for the normalization images of LIT amplitude and phase images, and Am(x, y), Ph(x, y) are the LIT amplitude and phase images obtained by lock-in correlation algorithms shown in Figure 2.

2.4. YOLOLT Model Training and Evaluation

For the purpose of YOLOLT model training, a Dell desktop workstation was employed for the training and experimental test. It was configured with an Intel Core i9–10980X CPU, NVIDIA GeForce RTX 3090 GPU with 24 G RAM, 256 GB RAM, and Windows 10 64-bit OS. A homemade software was programmed using Python 3.7.10, and the deep learning framework was established based on Pytorch 1.8.0.
Average precision (AP) is defined as the area under the precision (P)-recall (R) curve, and it was considered as the criterion and employed for evaluating the YOLOLT performance on the defect identification. Here, for the target detection, Intersection over Union (IoU) was used to calculate the coincidence degree of the two target boundaries, which is the ratio of the intersection area to the union one for two areas [16]. Additionally, for the defect determination, precision (P) is calculated to represent the ratio of successful recognition for a given defect, recall (R) is calculated to represent the ratio of correct inspection for all defects, and they are given by the following:
P = T P T P + F P
R = T P T P + F N
here, TP presents the correctly determined number of true defects, FP stands for the falsely identified defect number of non-defects and FN represents the falsely recognized non-defect number of true defects.
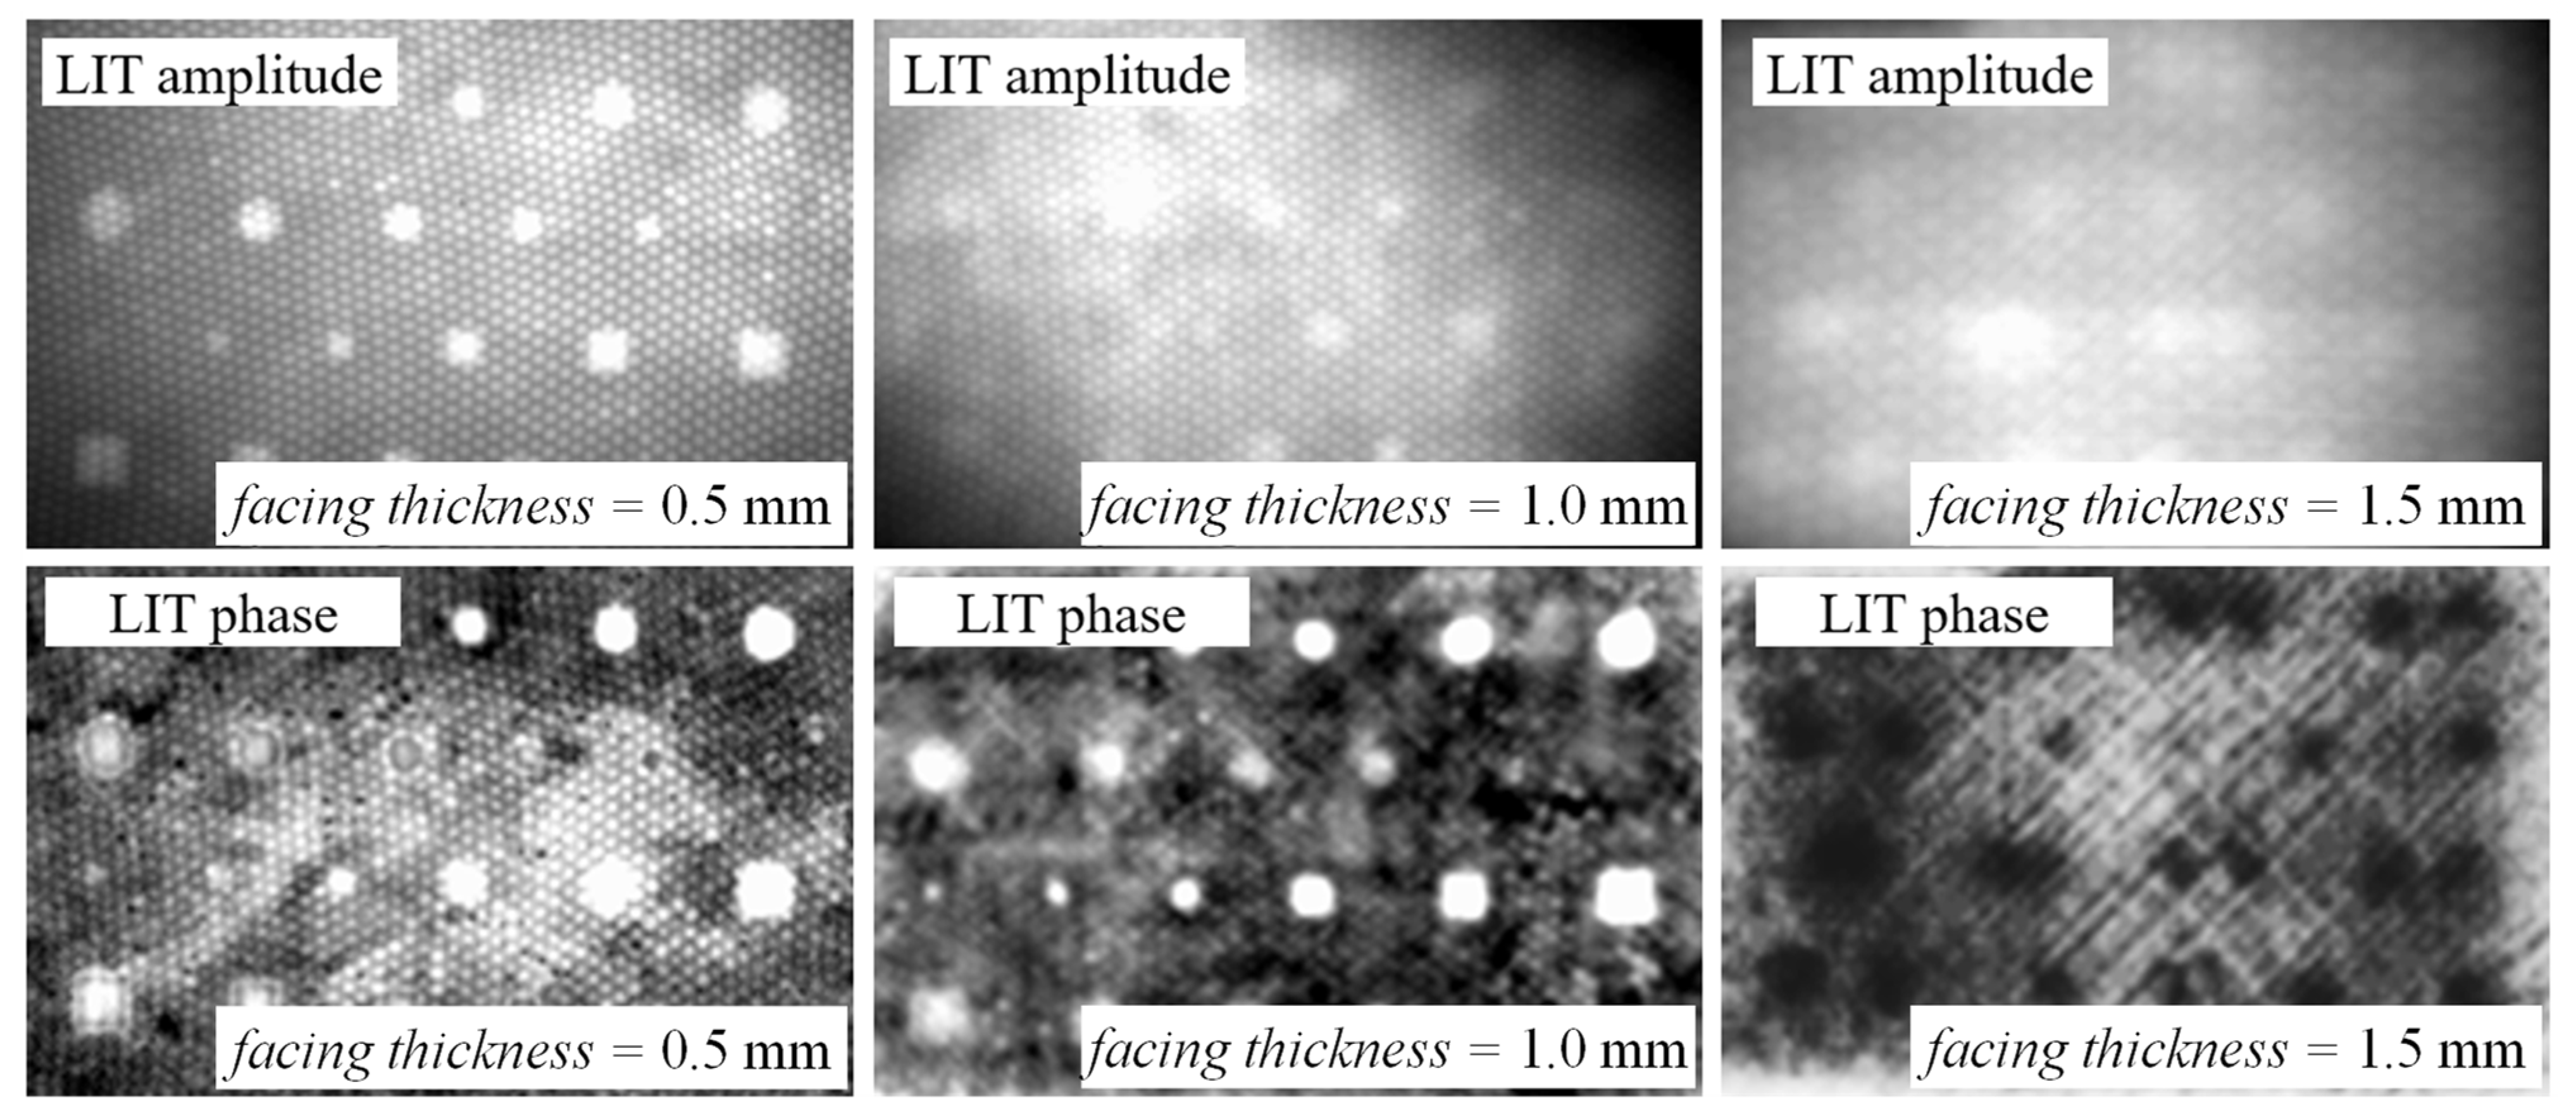
For the purpose of the accurately detection of HSCs debonding, a series of HSCs specimens were prepared for the debonding detection by use of LI, including 60 specimens, 20 debonding of each HSCs specimen. These specimens had a range of facing thickness from 0.5 mm up to 2.0 mm, and the debonding size varyied from 5 mm to 20 mm. Furthermore, the LIT amplitude and phase images of these HSCs specimens were formed for the dataset for YOLOLT training, and HSCs specimens of S1, S2 as well as S3 were used to examine the YOLOLT performance. Figure 5 illustrated the LIT amplitude and phase images for the different facing thicknesses of HSCs specimens.
From Figure 5, the debonding defect of HSCs was difficult to directly and accurately determine regarding the facing thickness reaching up to 1.5 mm by using the LIT amplitude and phase images; however, it is very critical and imperative to implement intelligence identification of these debonding defects in virtue of CNN model. Based above all LIT amplitude and phase images dataset, the YOLOLT model was trained and used to examine the debonding recognition capability of HSCs. In this work, the training parameters of YOLOLT, mainly including batch size and epoch, had the batch size varied from 2 to 16, the epoch set as 300 and 500, and the LIT amplitude and phase images pre-processed for the contrast enhancement and segmentation.

2.5. LIT Images Enhancement, Segmentation and Data Augmentation

Image contrast enhancement is very significant to improve the defect identification, and it would highlight the details of defects from the background. In this work, the common global histogram and adaptive threshold equalization methods were used to enhance the contrast of LIT images. Figure 6 shows the enhanced LIT phase image and its histogram of HSCs S1 specimen.
As can be seen from Figure 6, the debonding defects of HSCs S1 specimen become obvious, easily distinguished from the background through global histogram and threshold equalization, respectively. Simultaneously, the debonding defect contour caused a relatively obvious expansion phenomenon after threshold equalization processing, which is not conducive to quantify the defect size. Additionally, the histogram in Figure 6c is relatively average and uniform, which implied that the background noise had also enhanced. However, from Figure 6b, the contrasts of debonding defects with different sizes were obviously enhanced by global histogram method, and the gray level distribution had a degree of discrimination, which was helpful for being better differentiated regarding background and noise. Furthermore, the enhanced LIT images were filtered by using the most commonly Gaussian and Median filters [18].
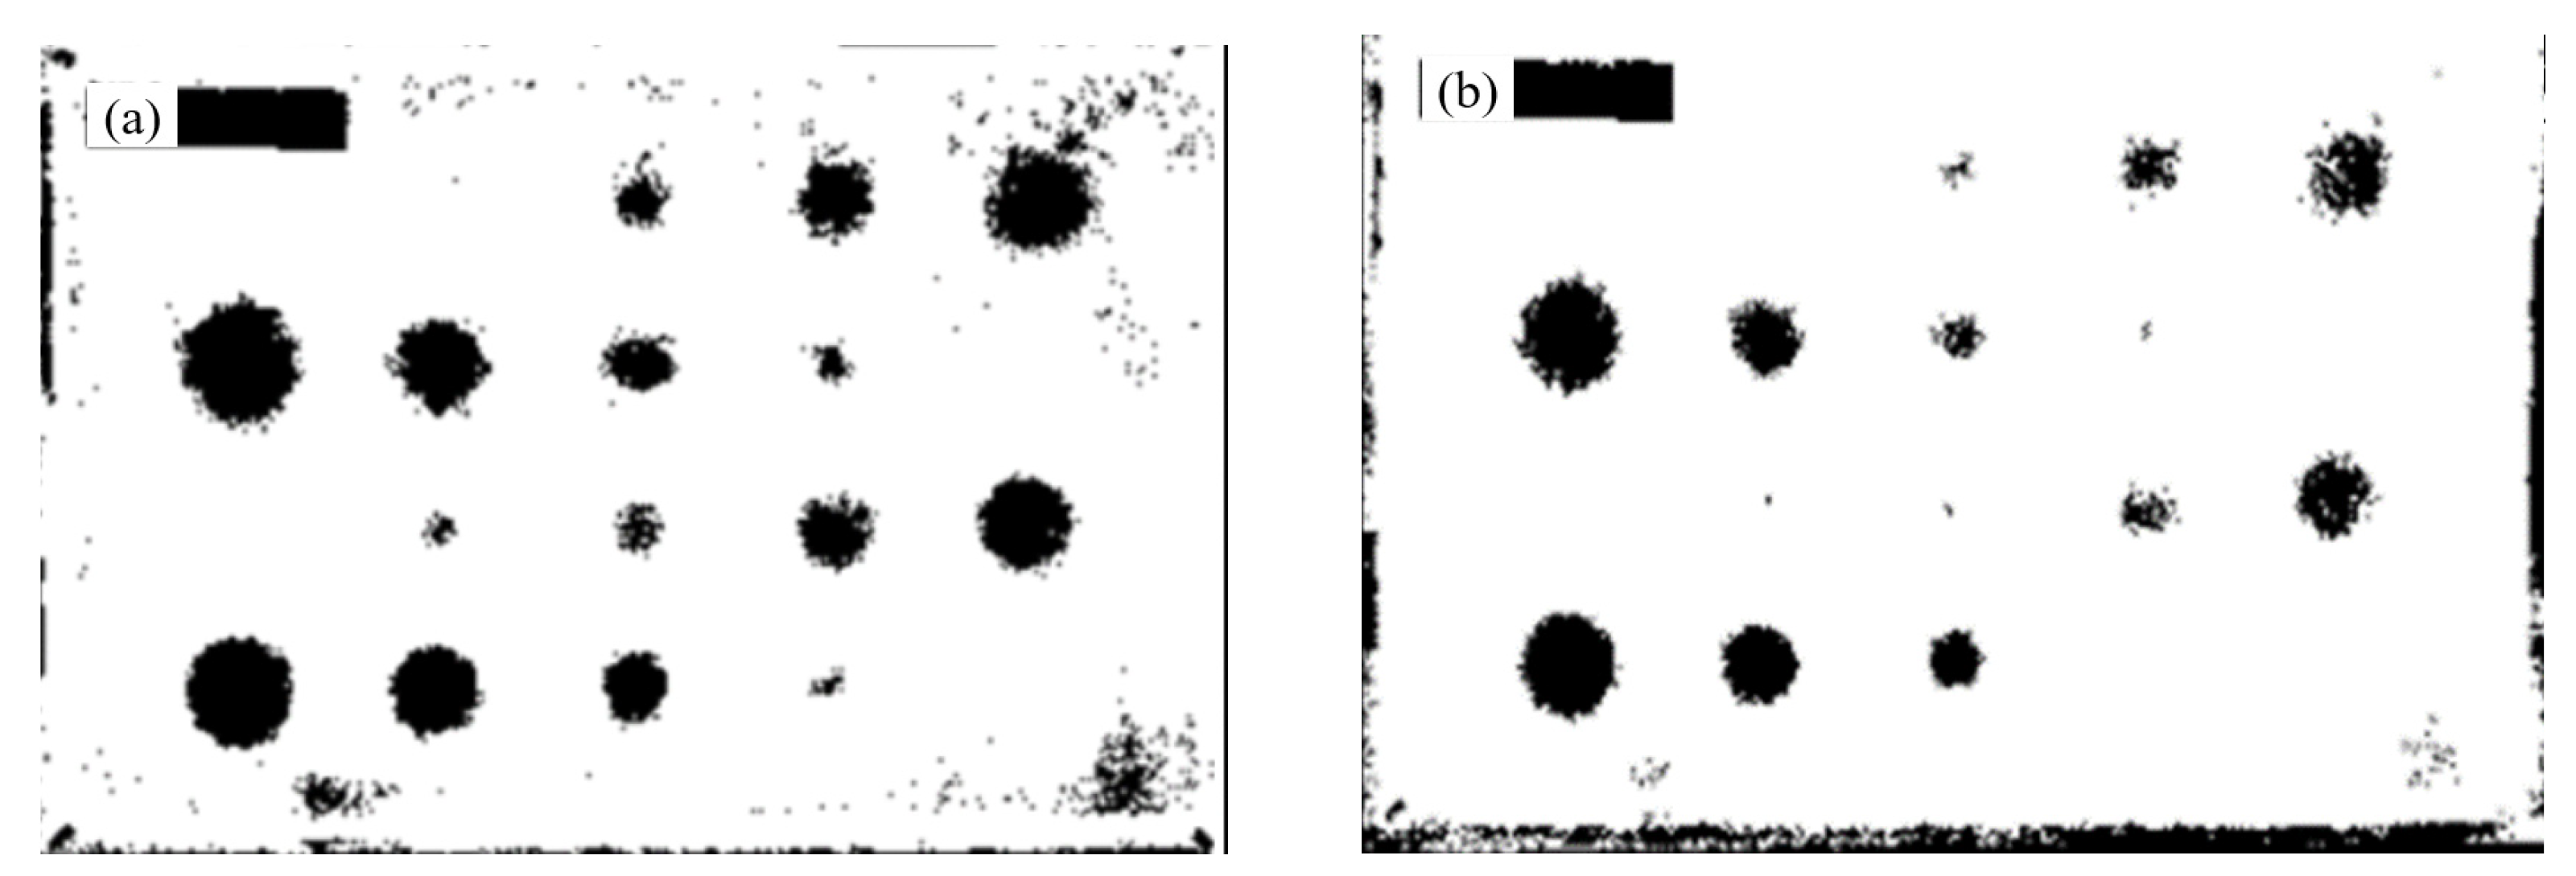
To quantitatively detect the debonding defect area from LIT images, it is necessary to perform binarization of the LIT image’s use of image segmentation. In this work, both threshold algorithm and K-means clustering segmentation were used to segment the LIT images, and here, the threshold segmentation adopted an adaptive threshold, and the K-means clustering utilized a 2-clustering for segmentation. Figure 7 presents the binarized segmentation of an LIT amplitude image of HSCs S1 specimen.
From Figure 7, both threshold and K-means clustering segmentations were available for realization of binary distinction between the debonding defects and background, and they had failed to segment all debonding defects. It can be seen in Figure 7b that the image edge burr is relatively lesser and the background noise is also evidently suppressed by using of K-means clustering segmentation; however, the debonding defect is relatively difficult to accurately identify compared to threshold segmentation. From Figure 7a, more debonding defects were segmented, their shapes were significantly distinguished, and finally, the threshold segmentation was employed for the defect detection of LIT images.
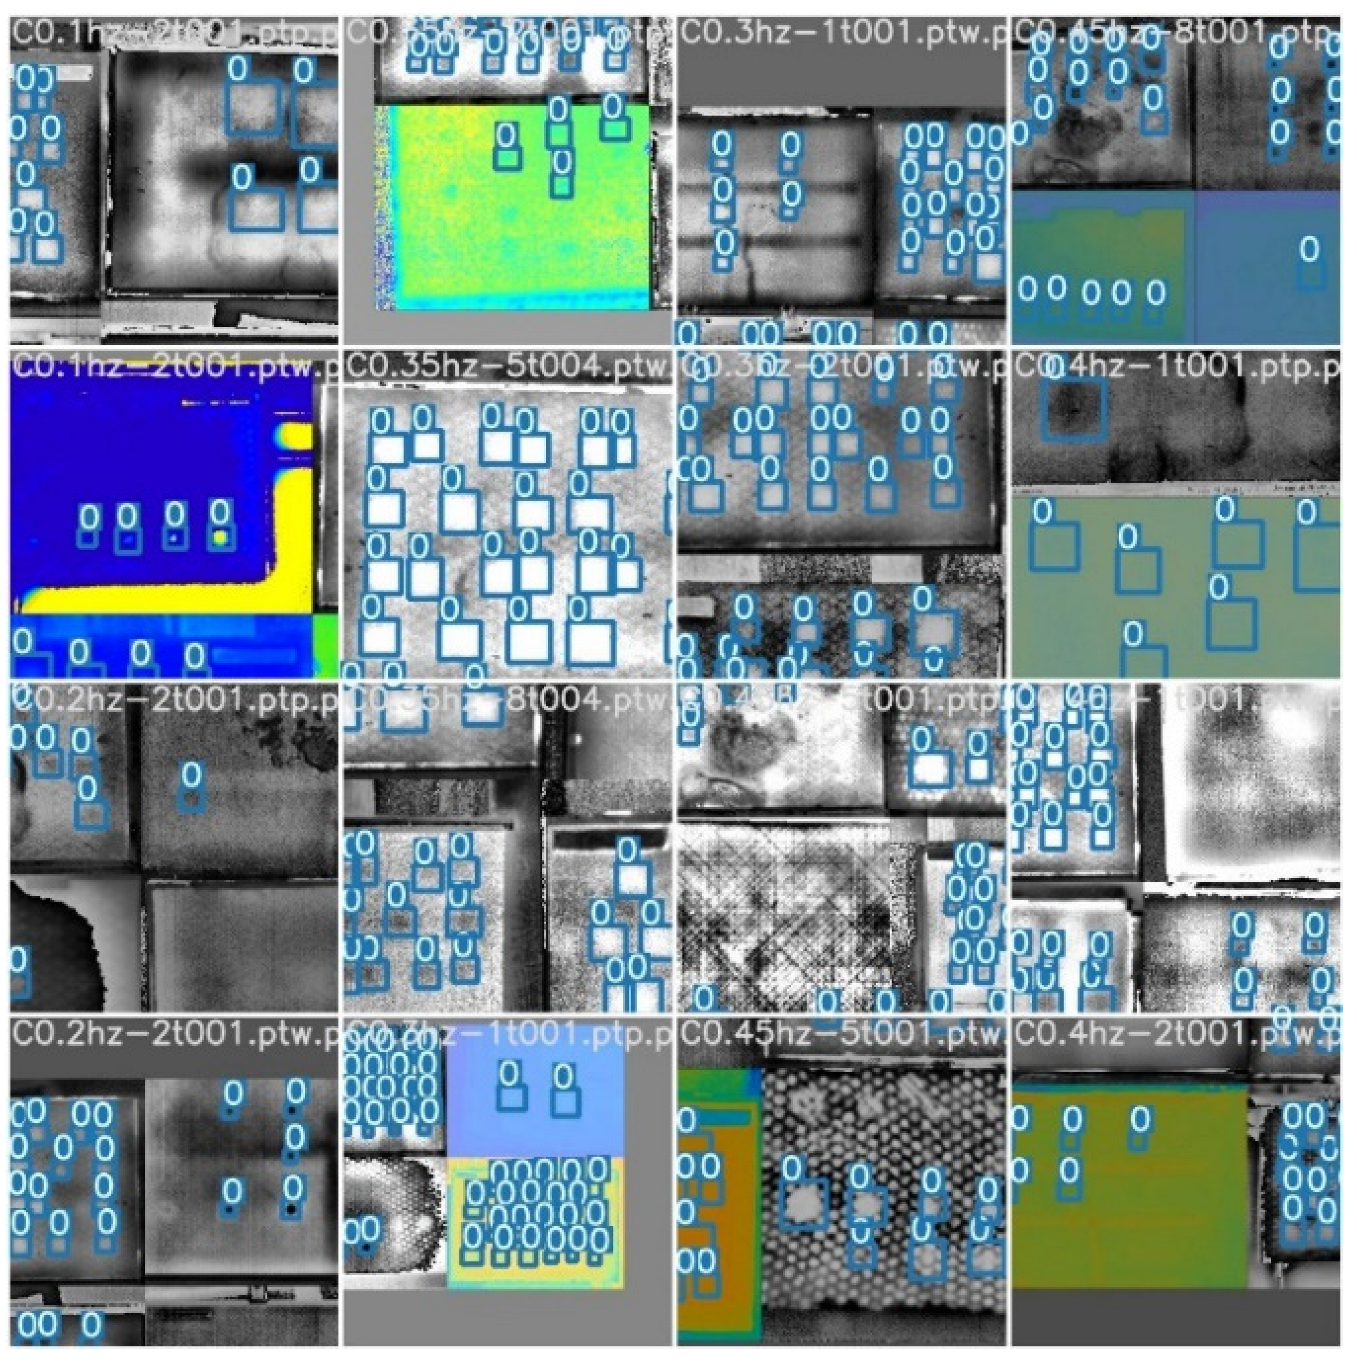
Generally, for the construction of a neural network, the deeper neural network allows the handling of more complex problems, and the more layers of the neural network, the more parameters it contains. To obtain the correct parameters to meet complex work requirements, it is necessary that a large amount of data is used for CNN training. The dataset in this experiment contains 1270 infrared images, which are divided into a training set and verification set according to the ratio of 7:3 due to there not being enough data for practical engineering applications. In order to improve the generalization of the neural network and avoid overfitting, it has to perform data augmentation on the original data to increase the amount of training data, as well as to enhance the robustness of the CNN model. Commonly, data augmentation mainly carries out simple processing on the original data such as flipping, translation, rotation, scaling and cropping [19]. In this work, mosaic data augmentation was applied to the LIT images dataset, the input batch size was set to 16 for YOLOLT, and the results was shown in Figure 8. From Figure 8, each sub image is concatenated from four original HSCs images, which means that the Mosaic algorithm has been implemented, achieving the goal of expanding the dataset.
The mosaic data augmentation method has more merits regarding the expansion of the LIT image dataset, enriching the background of the recognized object; primarily, the random scaling adds a lot of small objects, making the CNN more generalizable.

3. Results and Discussion

Figure 9 shows the corresponding AP and loss function curves of different batch sizes during 300 training epochs. Here, image size was set to 320.
From Figure 9, it was found that the AP curve started to greatly fluctuate before 150 epochs, and then it gradually converged and reached a stable stage. The comparison of YOLOLT training results with varied batch sizes is listed in Table 1.
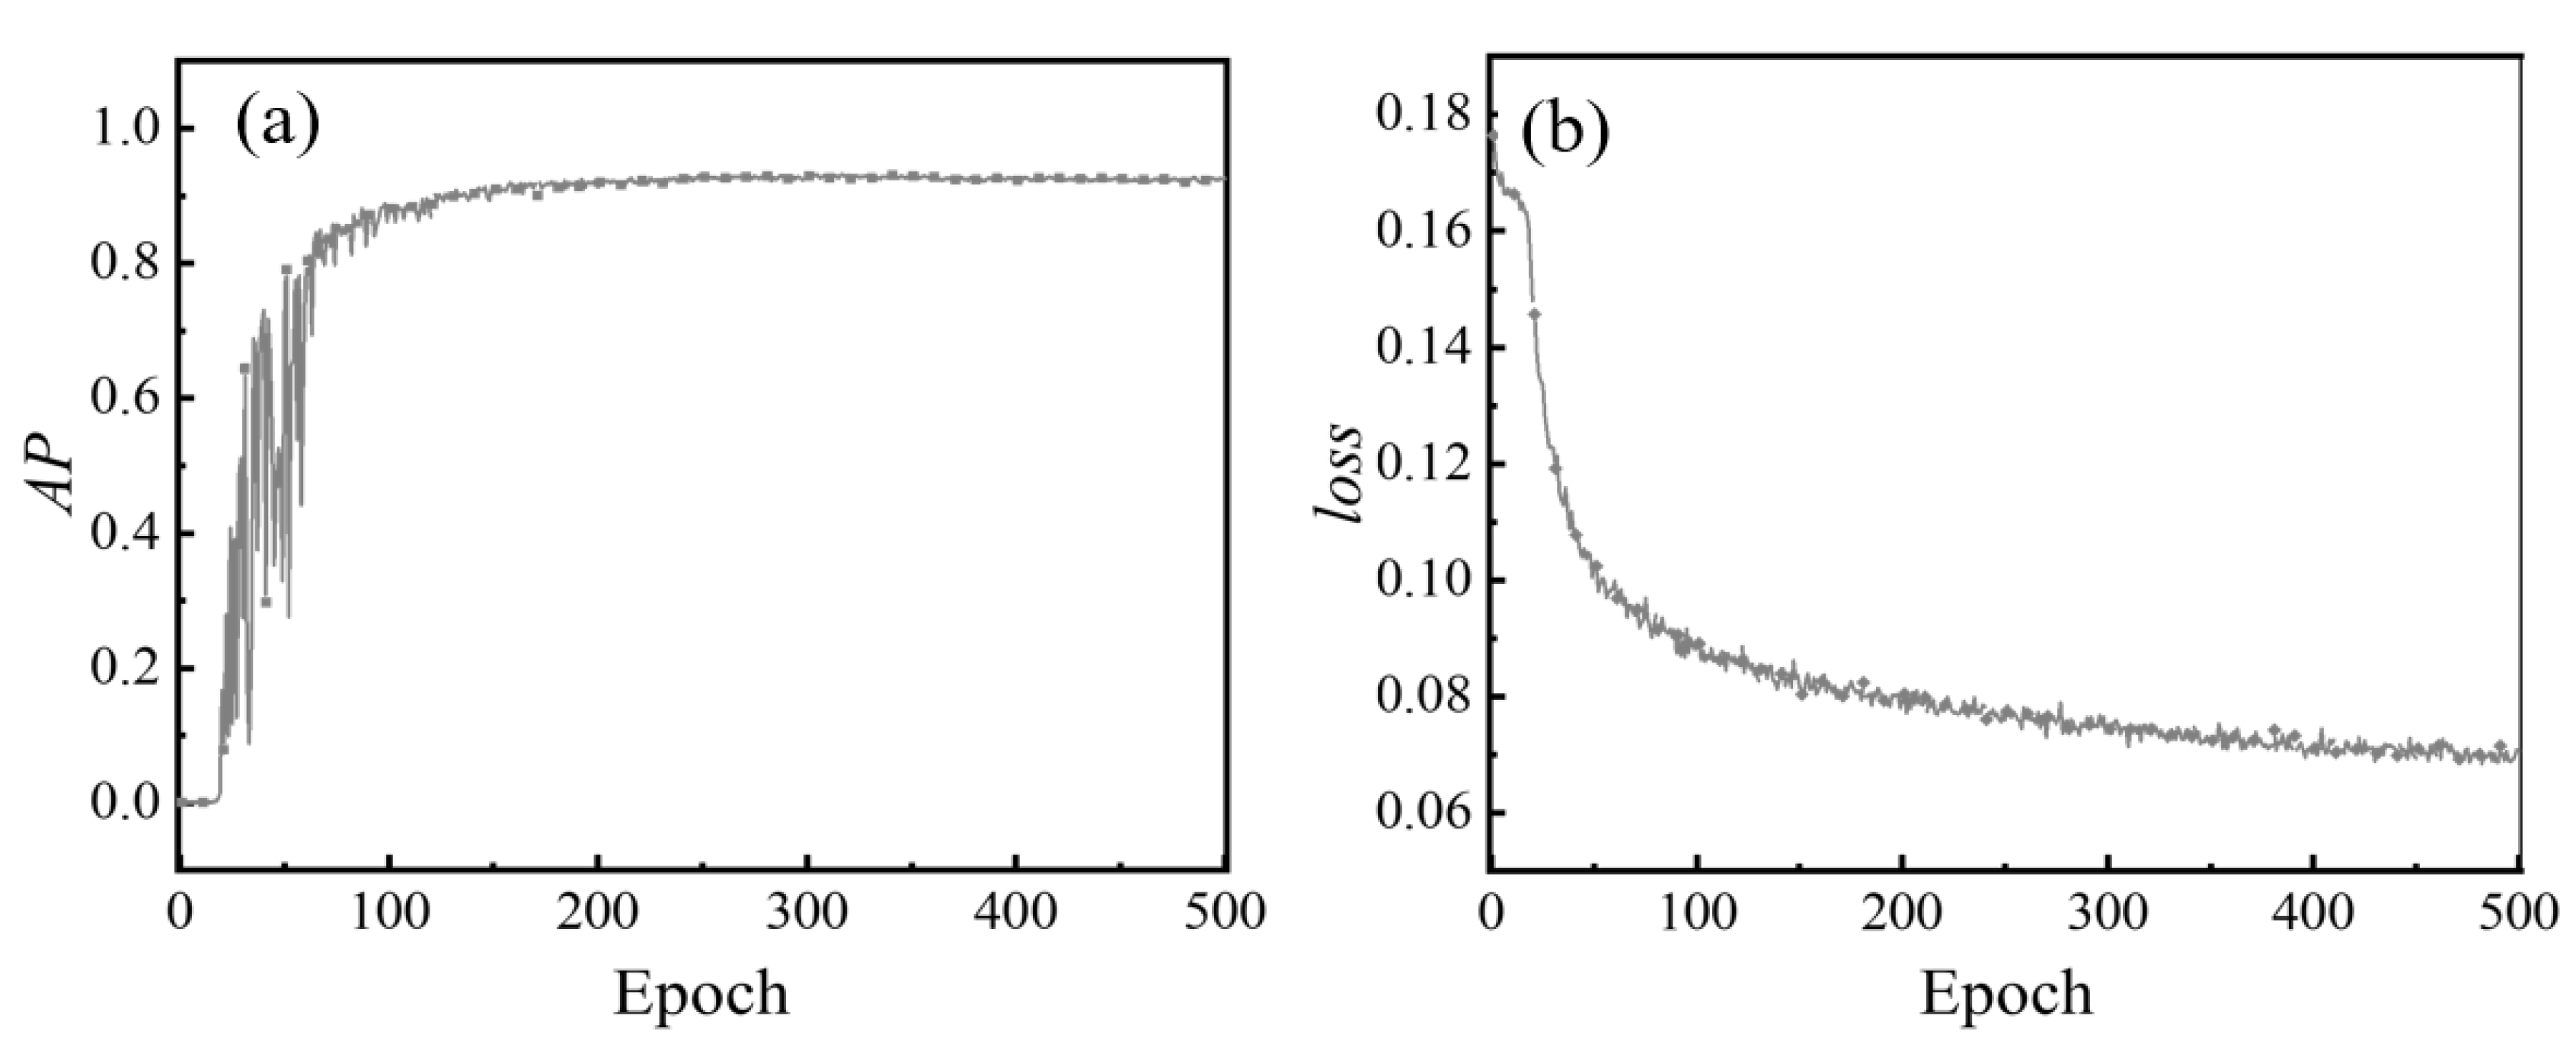
It can be seen from Figure 9 and Table 1 that the YOLOLT rapidly converged with the increase in the batch size during training, but it easily failed regarding the local optimum point; furthermore, this resulted in the drastic fluctuations in the AP cures. In opposite, for a small batch size, YOLOLT would escape the current local optimal position due to the rapid rise in the learning rate, and it could find a new optimal point as soon as possible. The AP has the largest value at the batch size of 16 compared to others, and the training time is reduced to 75.35% in comparison with batch size of 4. Therefore, in this work, the batch size was set to 16 for YOLOLT training. Figure 10 shows AP and loss function curves during the training process at batch size of 16 and epochs of 500.
From Figure 10, the AP and loss function curves were basically stable after 300 epochs, and the AP reached up to the maximum value at the 297th epoch, and then gradually decreased due to over-fitting. Therefore, the YOLOLT model was trained with 300 epochs in experiment.
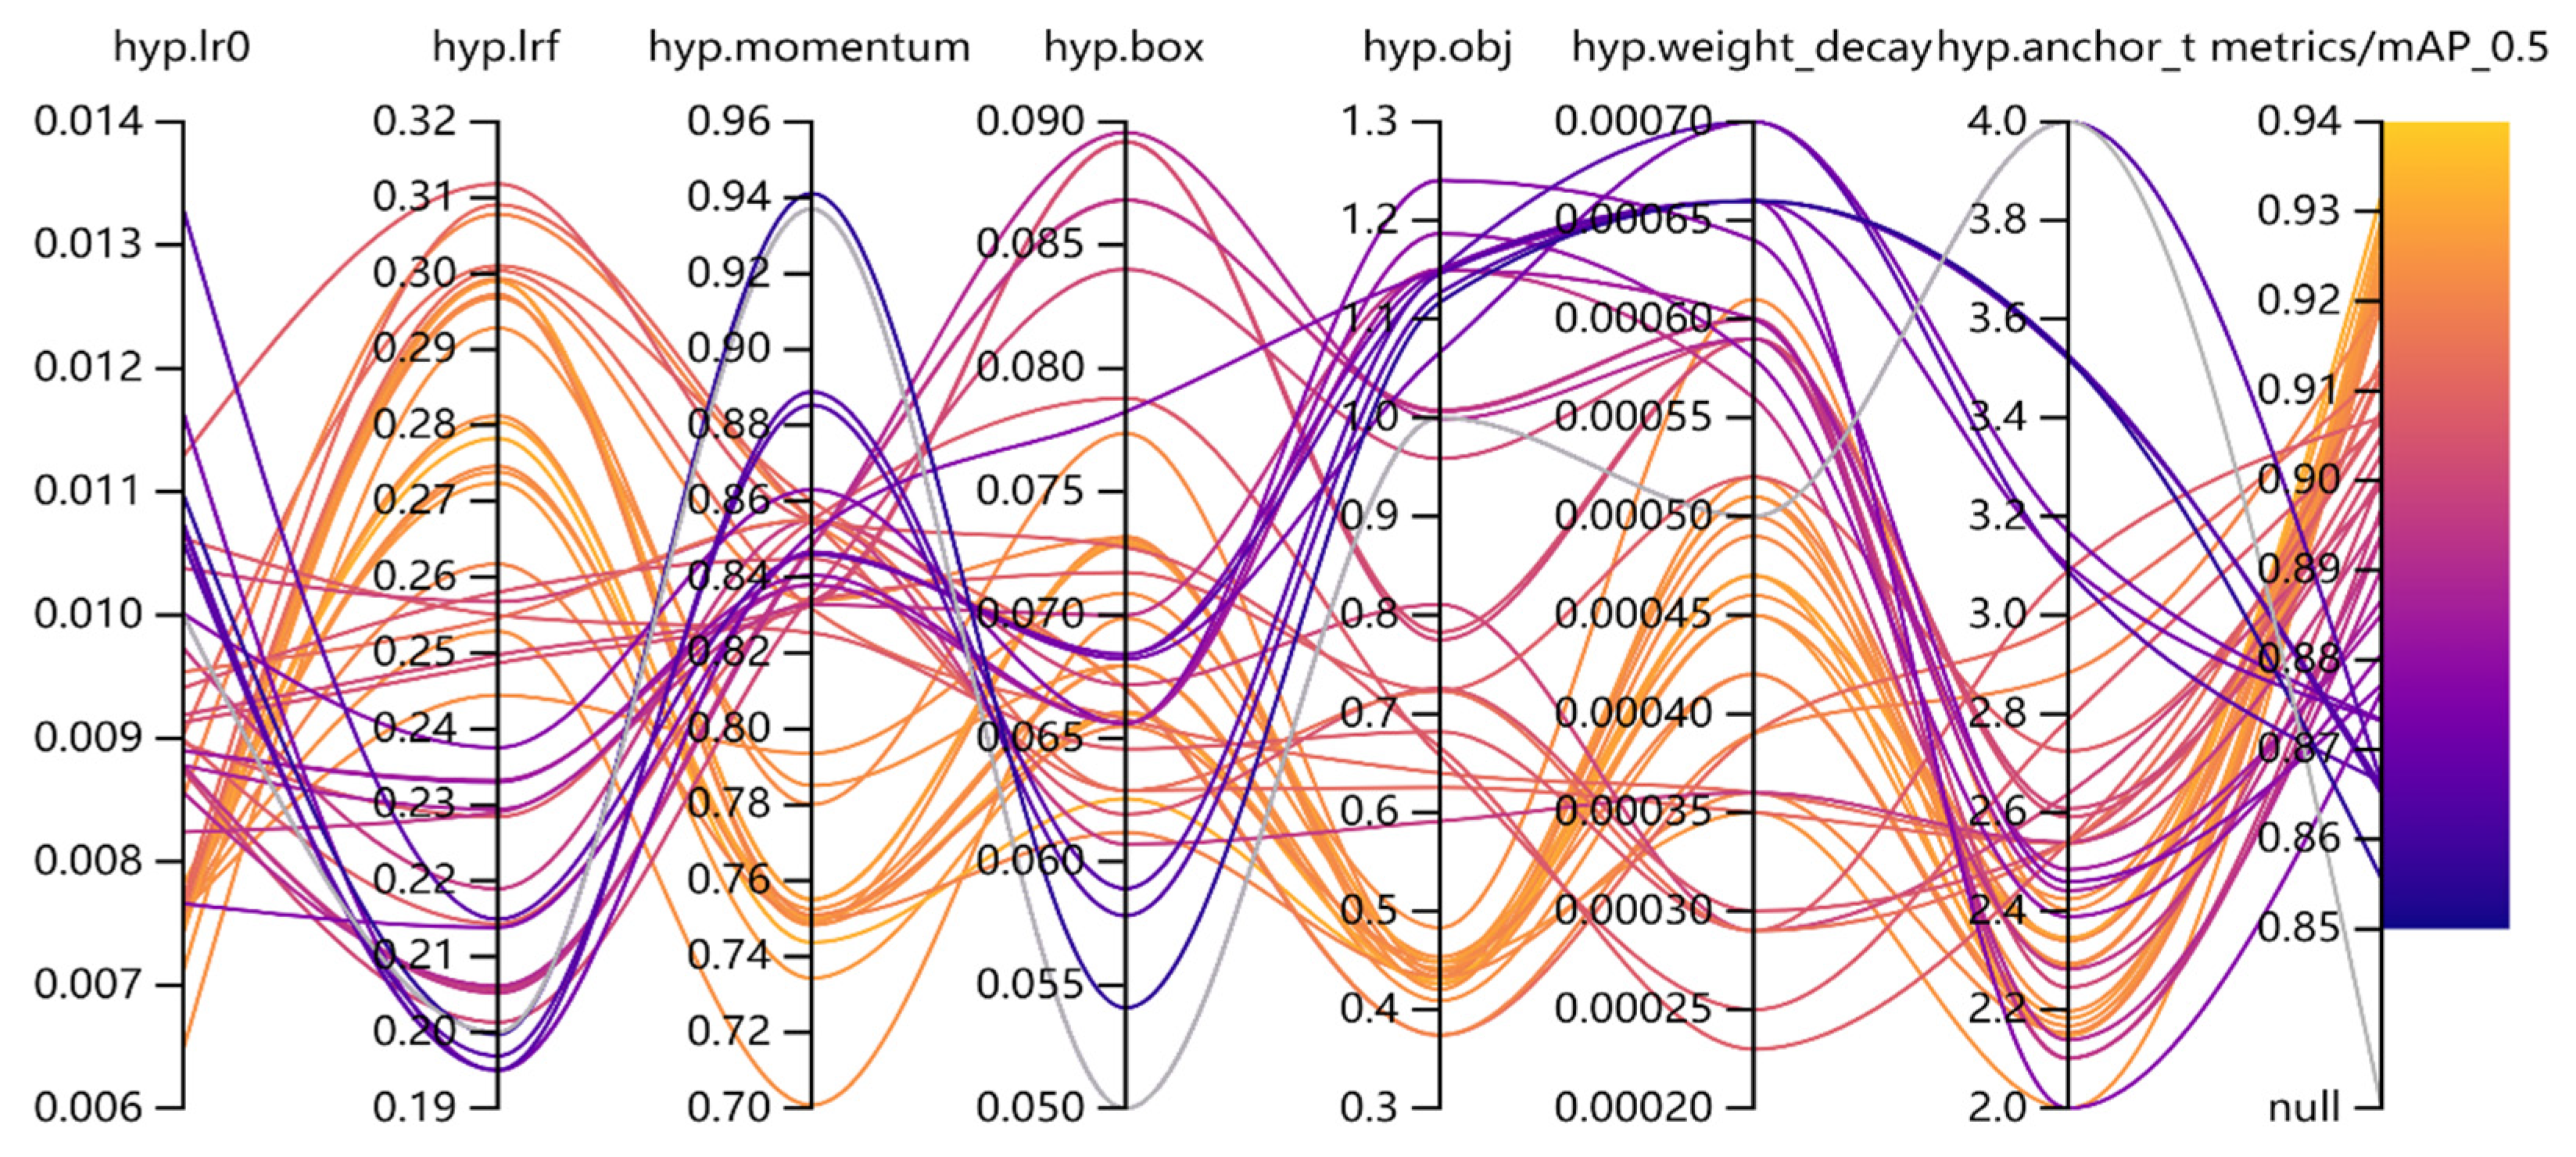
In the current case, the genetic algorithm [20] has been used to find the optimal main hyperparameters of YOLOLT (including initial learning rate lr0, cosine annealing learning rate lrf, stochastic gradient descent momentum SGD momentum, EIOU loss coefficient box, target detection loss coefficient obj, optimizer weight attenuation coefficient weight decay, threshold for the ratio of the length and width of the label to the length and width of the anchor anchor-t, etc.). Table 2 shows the range of hyperparameters variation.
The crossover and mutation are the main operators in the genetic algorithm. In this current case, the variation with 90% probability and 0.04 variance was set to generate the new offspring based on the combination of the best parents of all previous generations. Simultaneously, the optimal three combinations of the hyperparameters of the previous generation were directly inherited to the next generation through skipping mutation and crossover, and eliminating the remaining combinations after each epoch. Figure 11 illustrates a parallel coordinate diagram of the hyperparameter optimization results after 50 epochs.
It was found from Figure 11 that the optimization of hyperparameters played a significant role in improving AP, and AP fluctuated in variation range from 0.85 to 0.94, finally reaching a maximum value of 0.932. The yellow curve in Figure 10 represents an optimal hyperparameters of YOLOLT, and they were listed in Table 3 and applied for the identification of the debonding defect by LIT inspection.
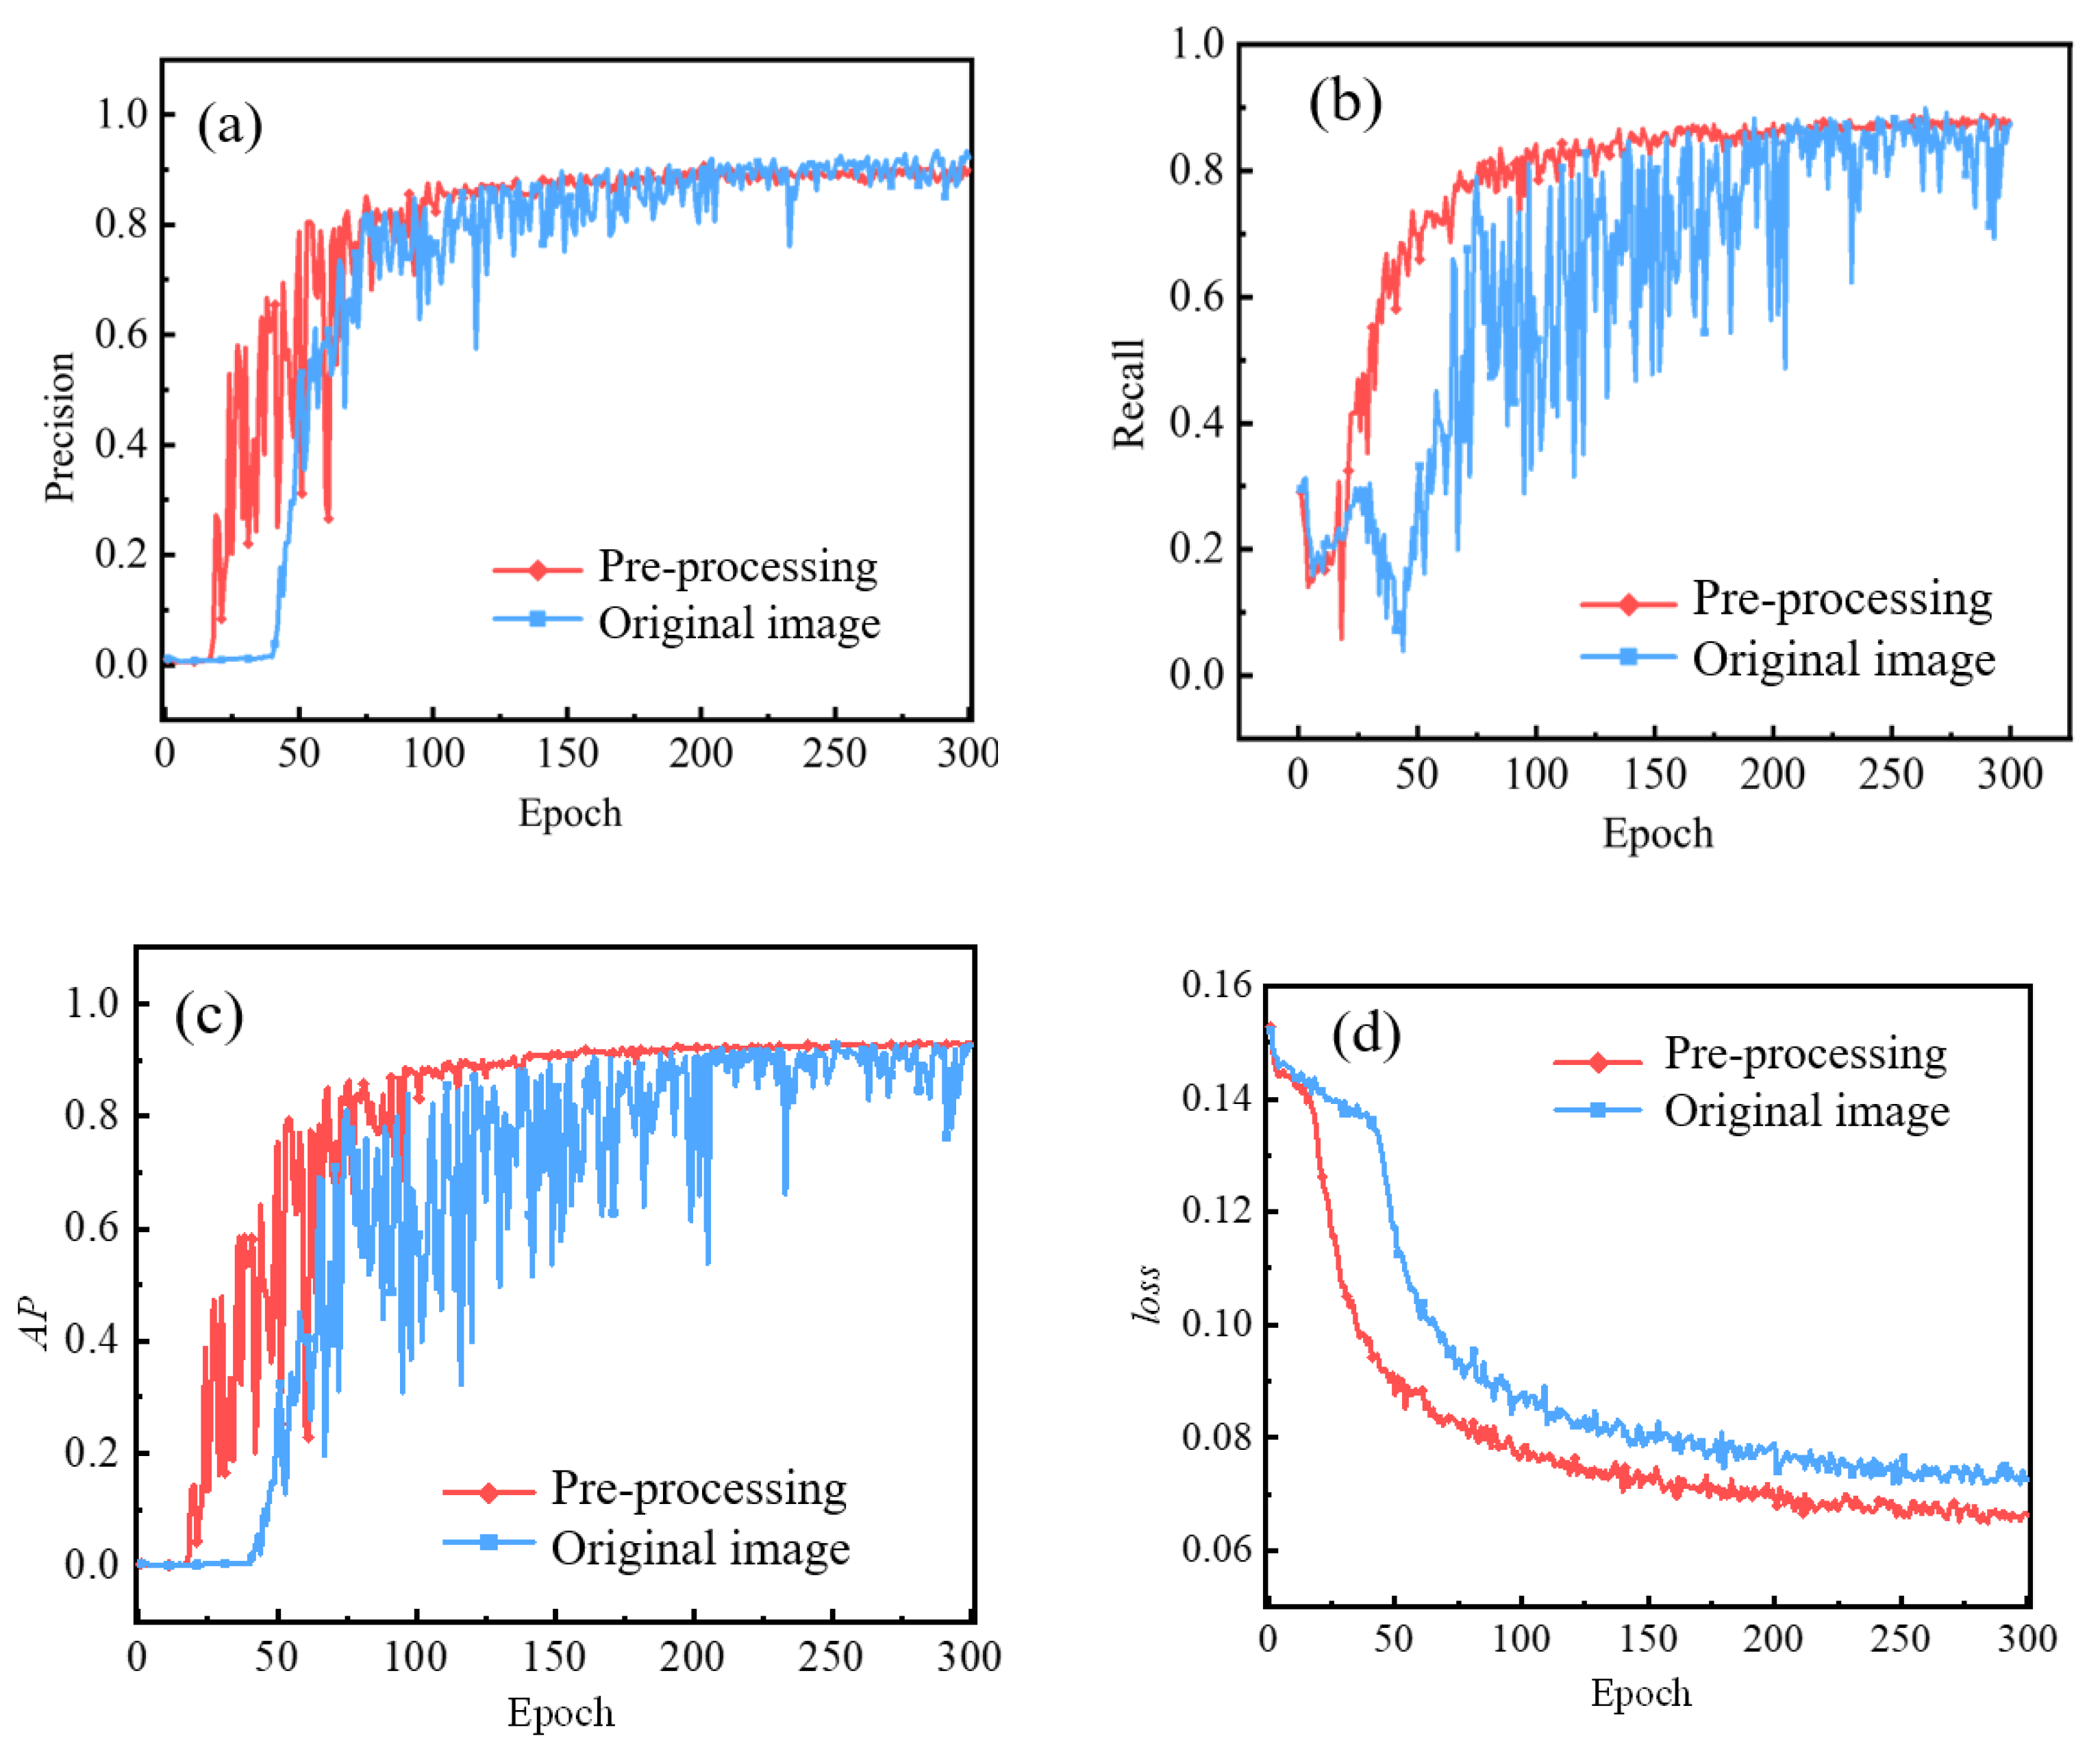
LIT image pre-processing would be directly influenced by YOLOLT training properties. Figure 12 presents the precision, recall, AP and loss function curves during YOLOLT training with the pre-processed LIT images and original ones as datasets, respectively.
From the precision and recall curves in Figure 12a,b, it can be seen that YOLOLT would be converged about 20 epochs in advance with pre-processing LIT images used in training, and the precision and recall curves were more stable and less volatile than the training from original LIT images. Simultaneously, from Figure 12c,d, the oscillation amplitude of overall AP curve become very weak and tended to relatively stabilize after 100 epochs, with the loss curve decreasing more smoothly with pre-processed dataset training in comparison with original images training. This contributed to the fact that it would improve the debonding defect detectability and identification probability by LIT image pre-processing, so that the false positive rate of YOLOLT model was reduced. The YOLOLT training evaluation results were listed in Table 4.
It was obtained from Table 4 that the performance parameters of YOLOLT including AP, P as well as R were increased with pre-processed LIT images dataset training compared to original LIT images dataset training, and the training time was obviously reduced by about 20%.
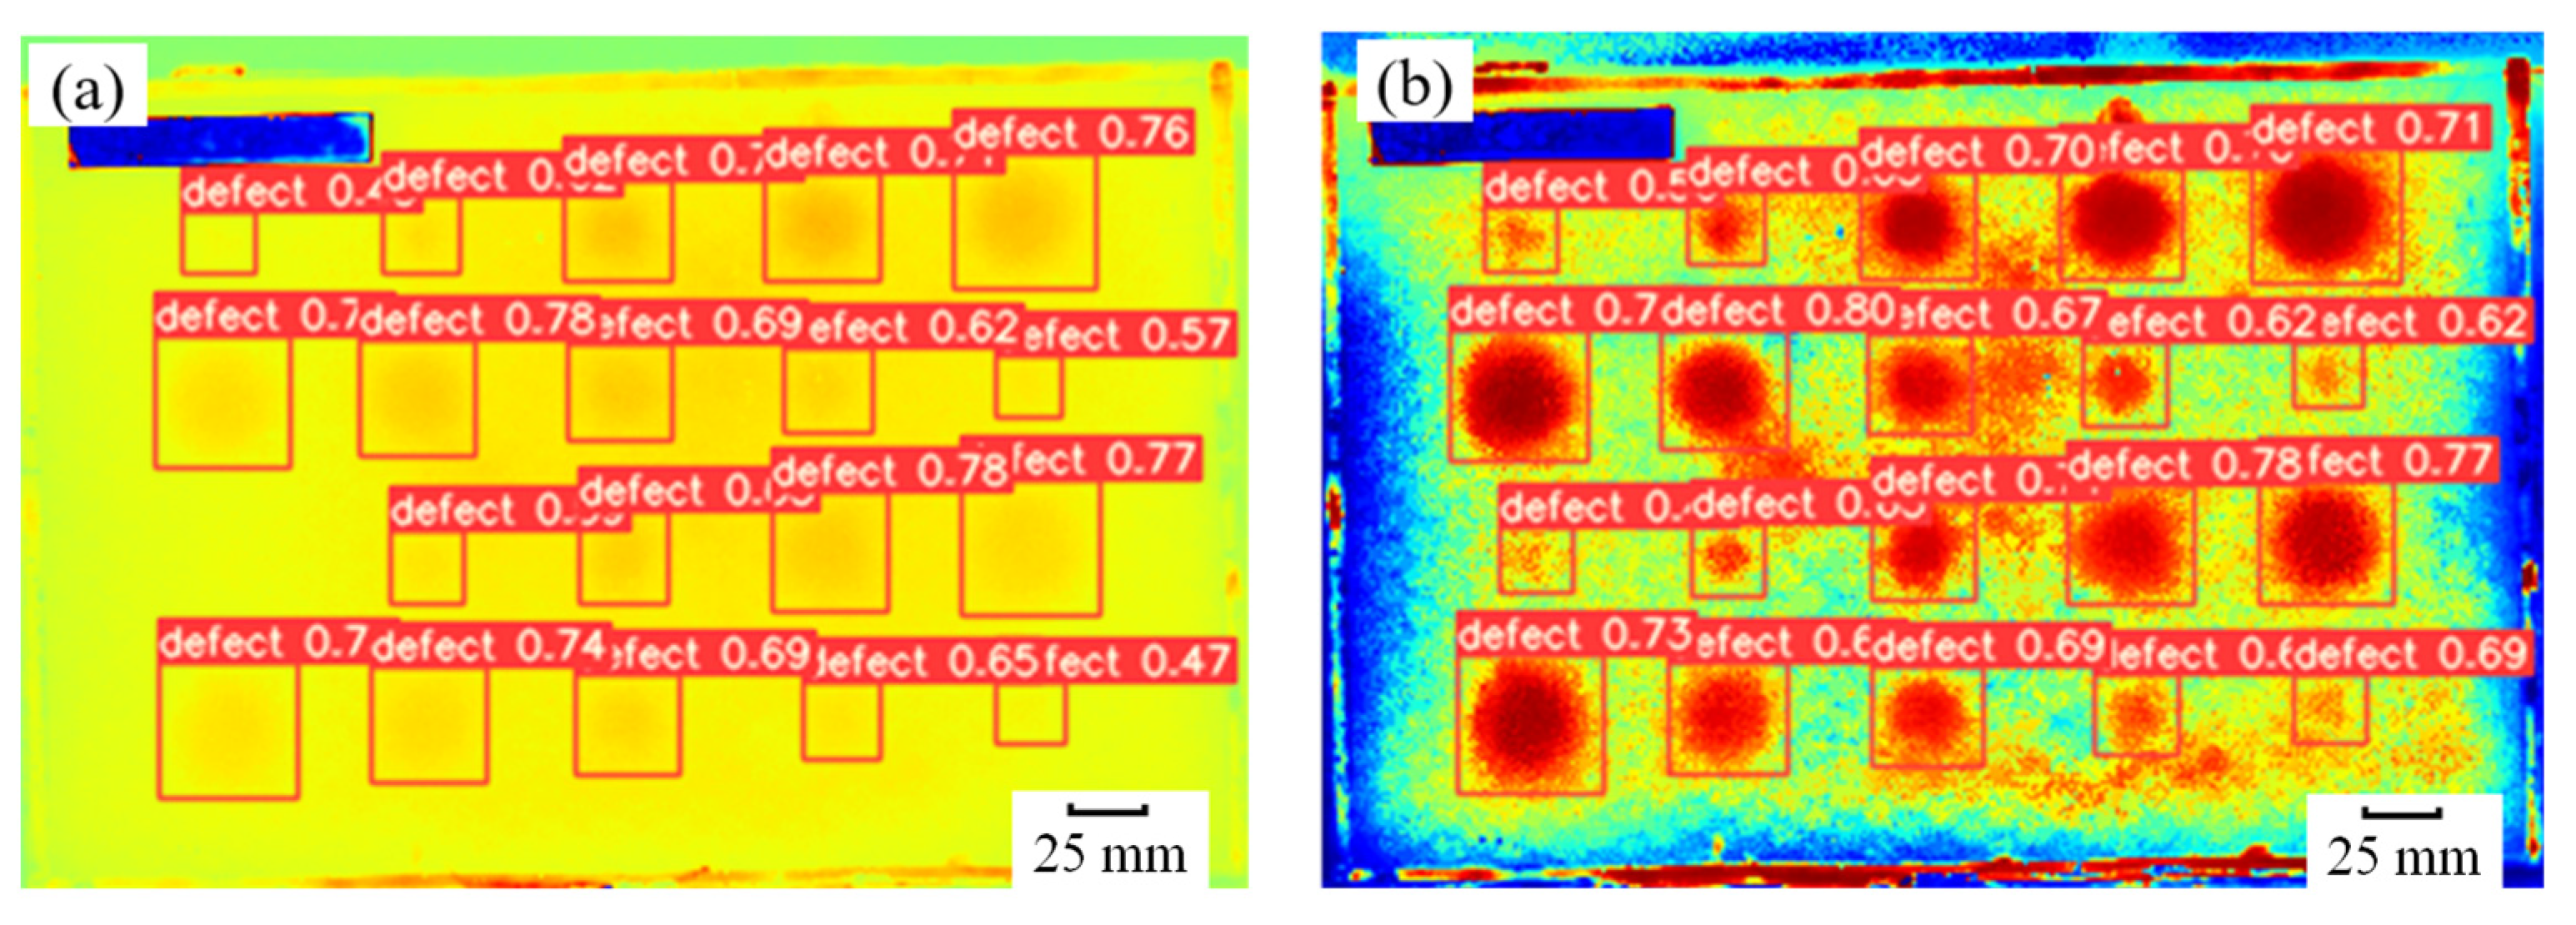
Figure 13 illustrates the comparisons of the debonding defect recognition results of HSCs S1 specimen by YOLOLT.
It can be seen from Figure 13 that all the debonding defects of HSCs S1 specimen were reliable and accurately identified from the pre-processed LIT phase image by the use of YOLOLT, and this indicates that the signal-noise-ratio (SNR) of LIT phase image was improved visibly to the naked eye, with the contrast between debonding defect background enlarged to enhance the defect recognition probability of YOLOLT. For the defect with a diameter of Φ5 mm, its edge became blurred and easily submerged in the background noise, and in this case, it was still difficult to reliably determine the pre-processed LIT phase image by using YOLOLT. However, it provides evidence that the accuracy of debonding defect identification was improved and the training time of YOLOLT was obviously reduced by utilizing the pre-processed LIT images.
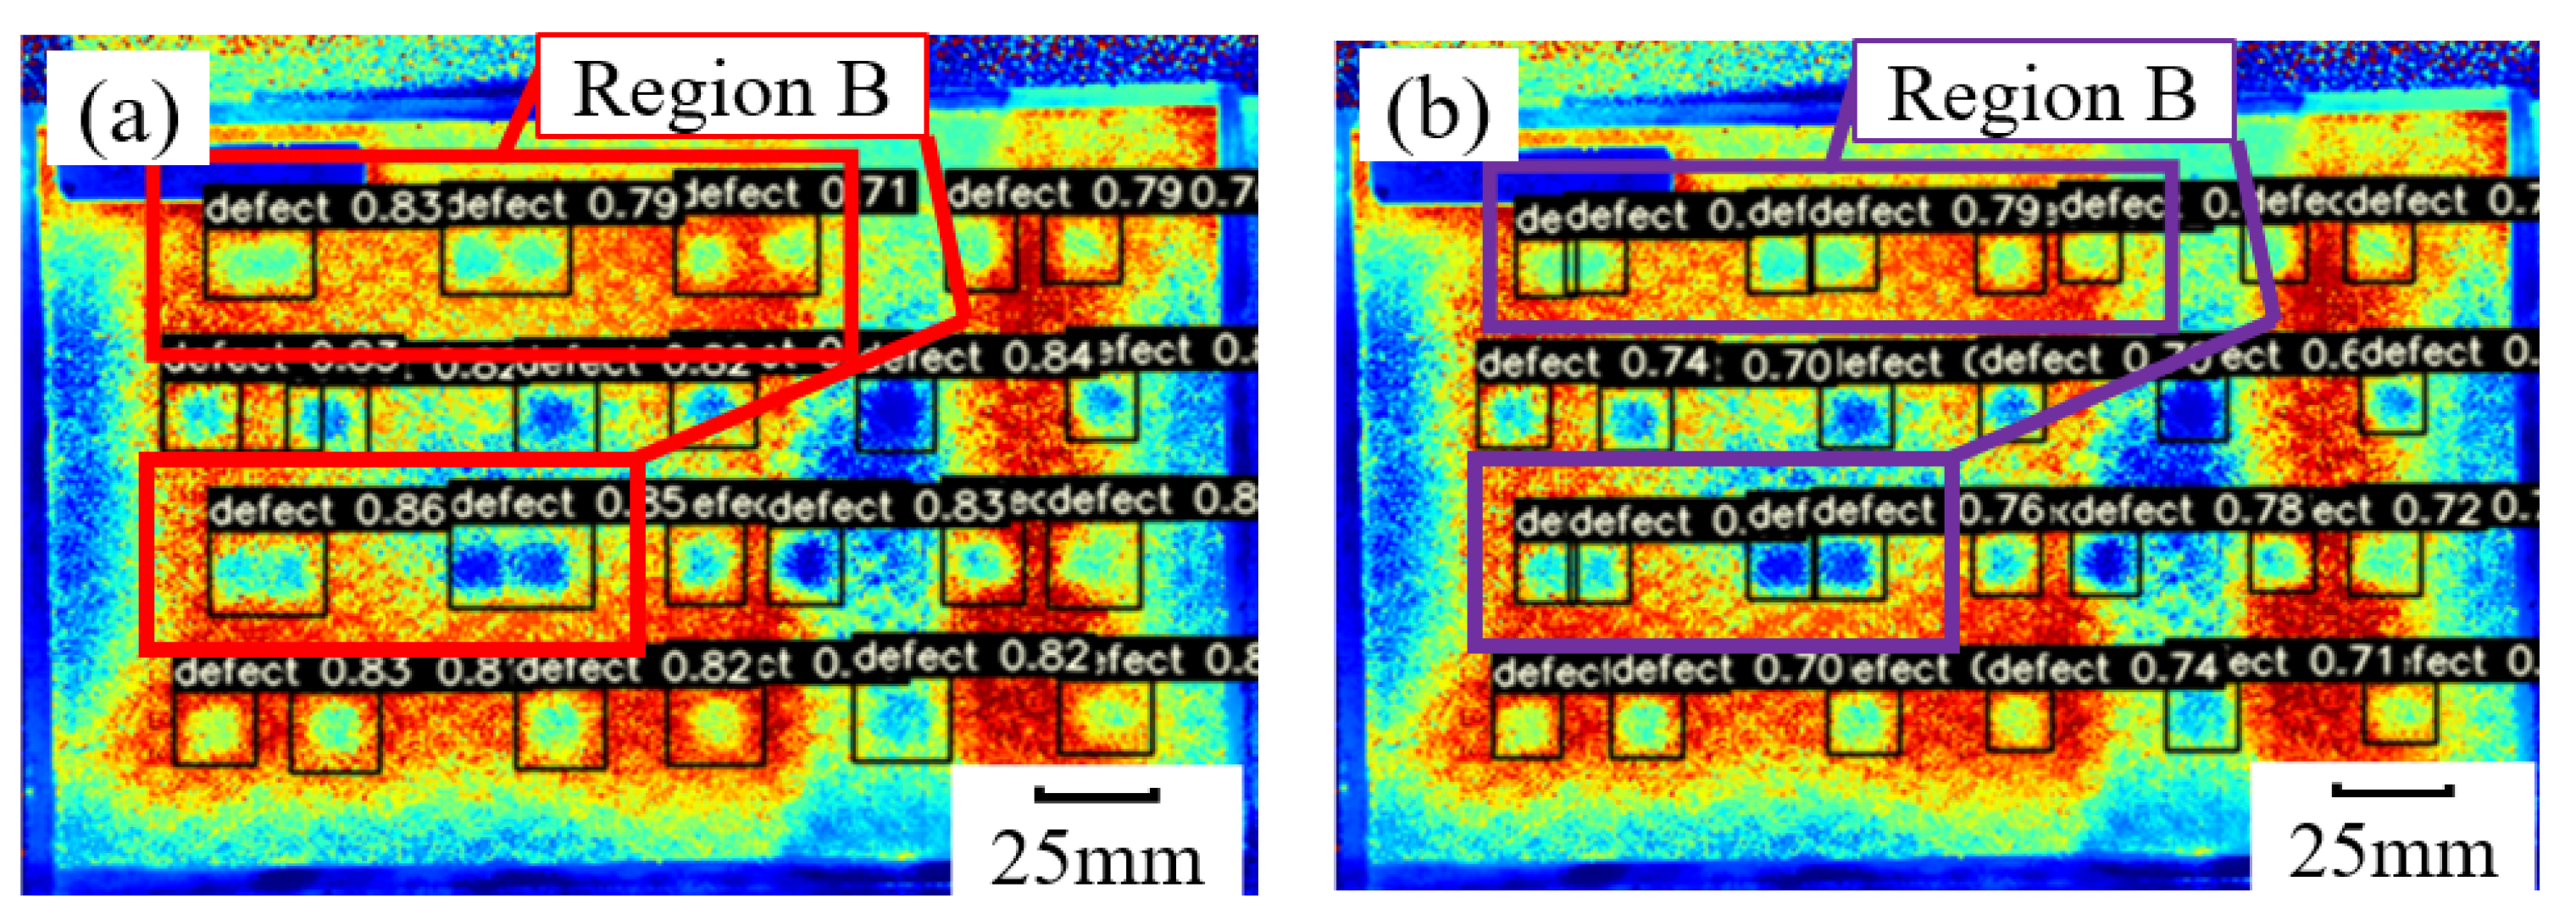
In this work, the proposed YOLOLT model was inherited from the popular YOLOv5 structure of the CNN model. It increases the number of branches in the head network with an increase in the layers of the feature pyramid network; in addition, the transformer structure was added, and the self-attention mechanism is also introduced to prevent overfitting and improve the resolution of defects. Figure 14 shows the debonding defect recognition results of HSCs S2 specimen by using the ordinary YOLOv5 and the proposed YOLOLT, respectively.
From Figure 14a, the debonding defects with the size of 5 mm (seen in Region A) were missed and not accurately identified by using the ordinary YOLOv5 model. However, from Figure 14b, the small-sized debonding defects (seen in a same Region A) were reliable and accurately recognized by using the proposed YOLOLT CNN model. Here, this implied that the small-sized defects identification capability of YOLOLT was improved due to the increase in the layers of feature pyramid network based on YOLOv5. So, in this work, it is a significant improvement of YOLOv5 that a branch of four times down-sampling from the backbone network was added, the eight times down-sampling feature map from the upper-level feature pyramid network was up-sampled and then spliced along the channel direction tensor, and finally, the feature fusion was performed through the pyramid attention network, as well as output to the head network.
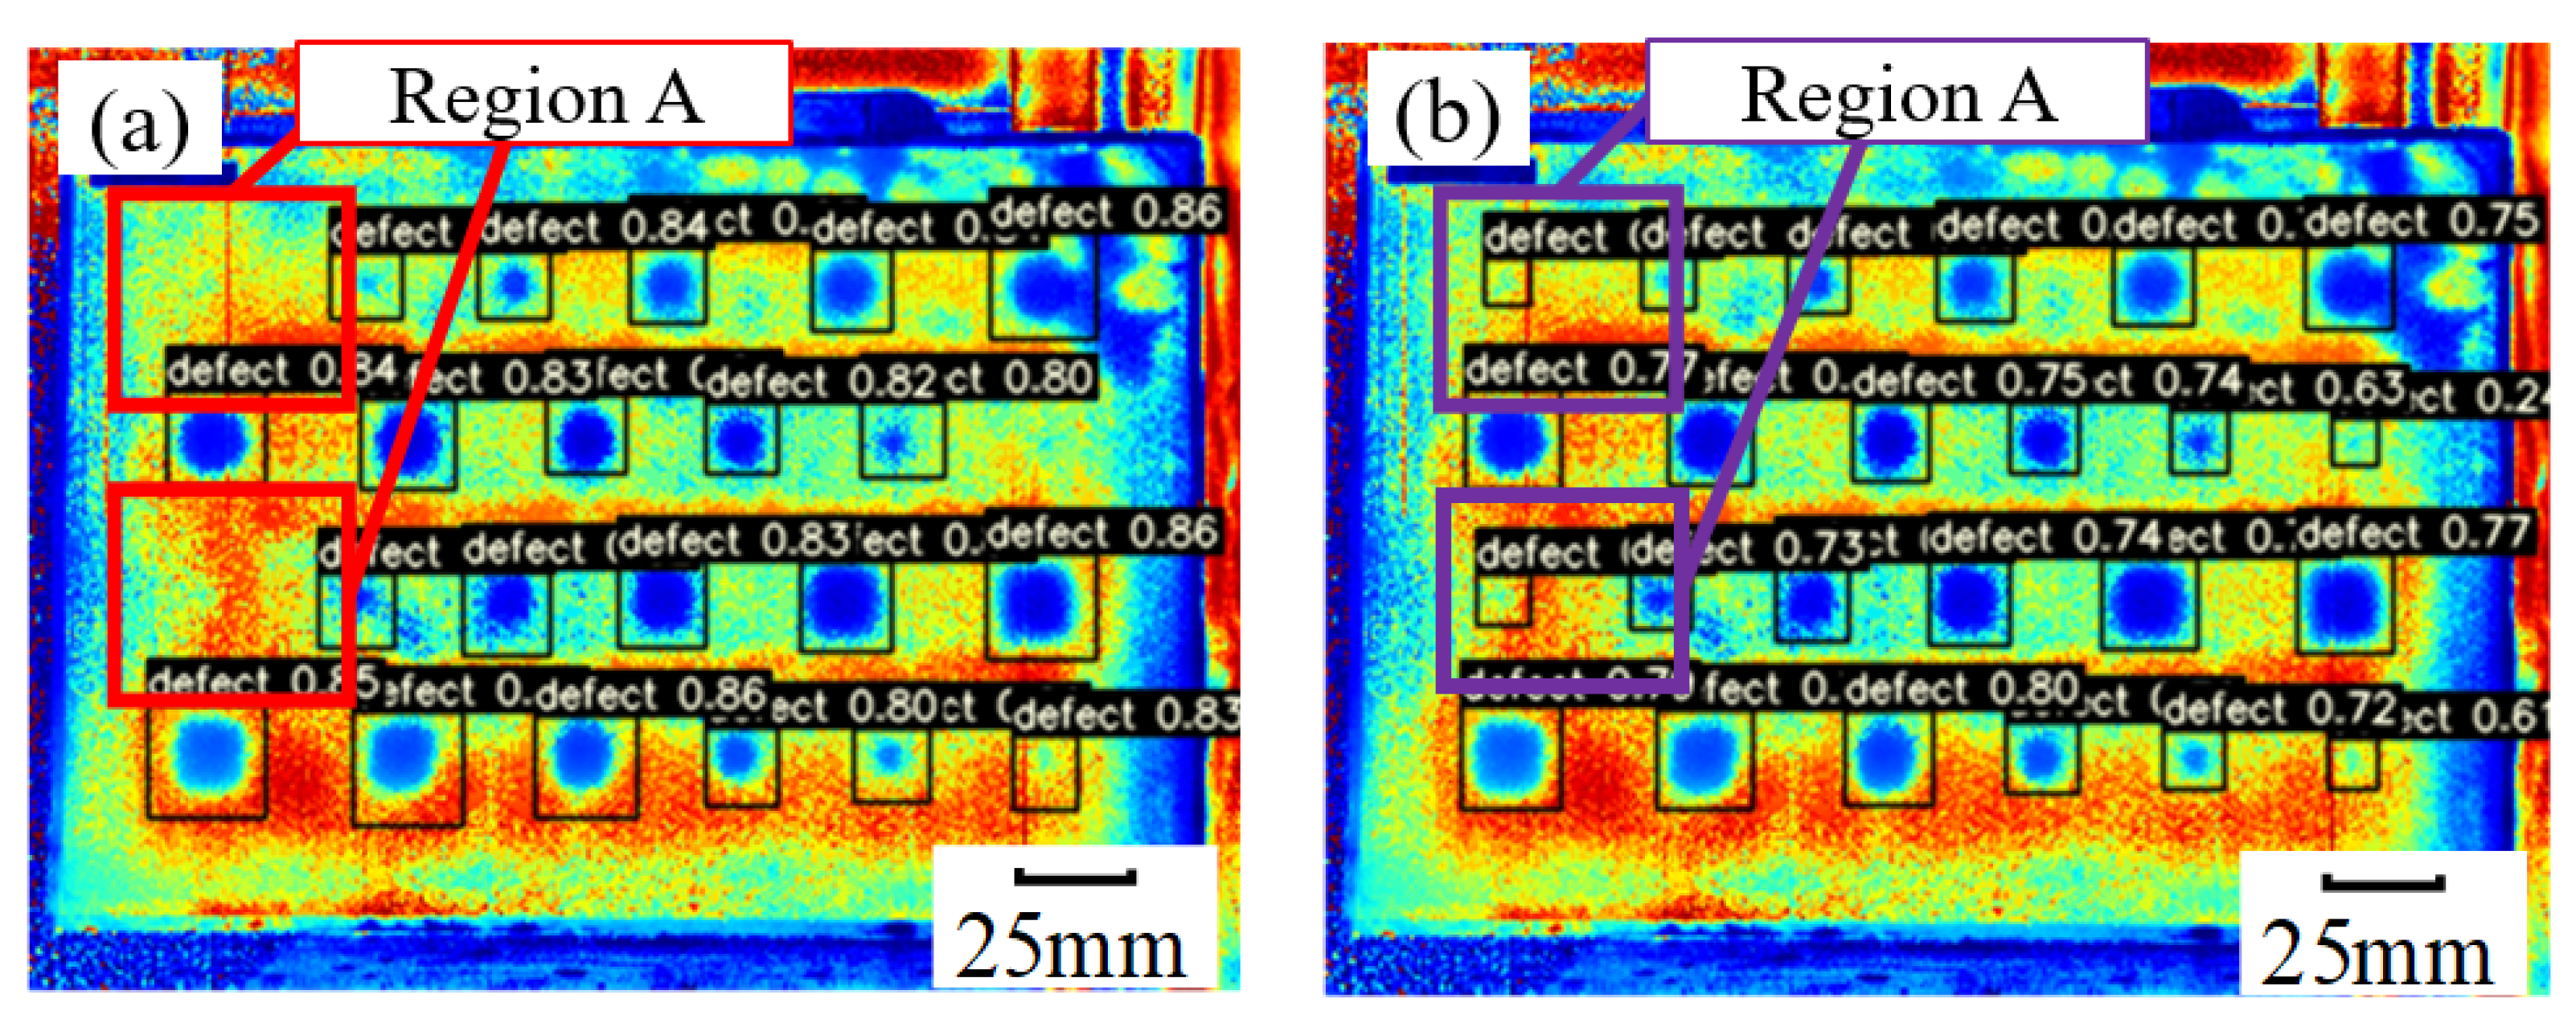
Figure 15 depicts the debonding defect recognition results of the HSCs S3 specimen by using the ordinary YOLOv5 and the proposed YOLOLT, respectively.
From Figure 15a, it was seen that the two adjacent debonding defects (the distances between the two defects center were 10 mm, 15 mm and even 20 mm shown in Region A) were identified as one debonding defect by using the ordinary YOLOv5 CNN model. However, from Figure 15b, the two adjacent debonding defects (shown in the same Region A) were accurately distinguished by using the YOLOLT CNN model, and this contributed to the fact that the YOLOLT took into account introducing a self-attention principle through a transformer structure; furthermore, it would add adaptive weights to the defect features of input LIT images of HSCs through scaled dot-product attention (SDPA) to enhance the feature expression ability. From the above improvements in YOLOv5, YOLOLT can be nade more sensitive to the adjacent defects and accurately distinguish them.
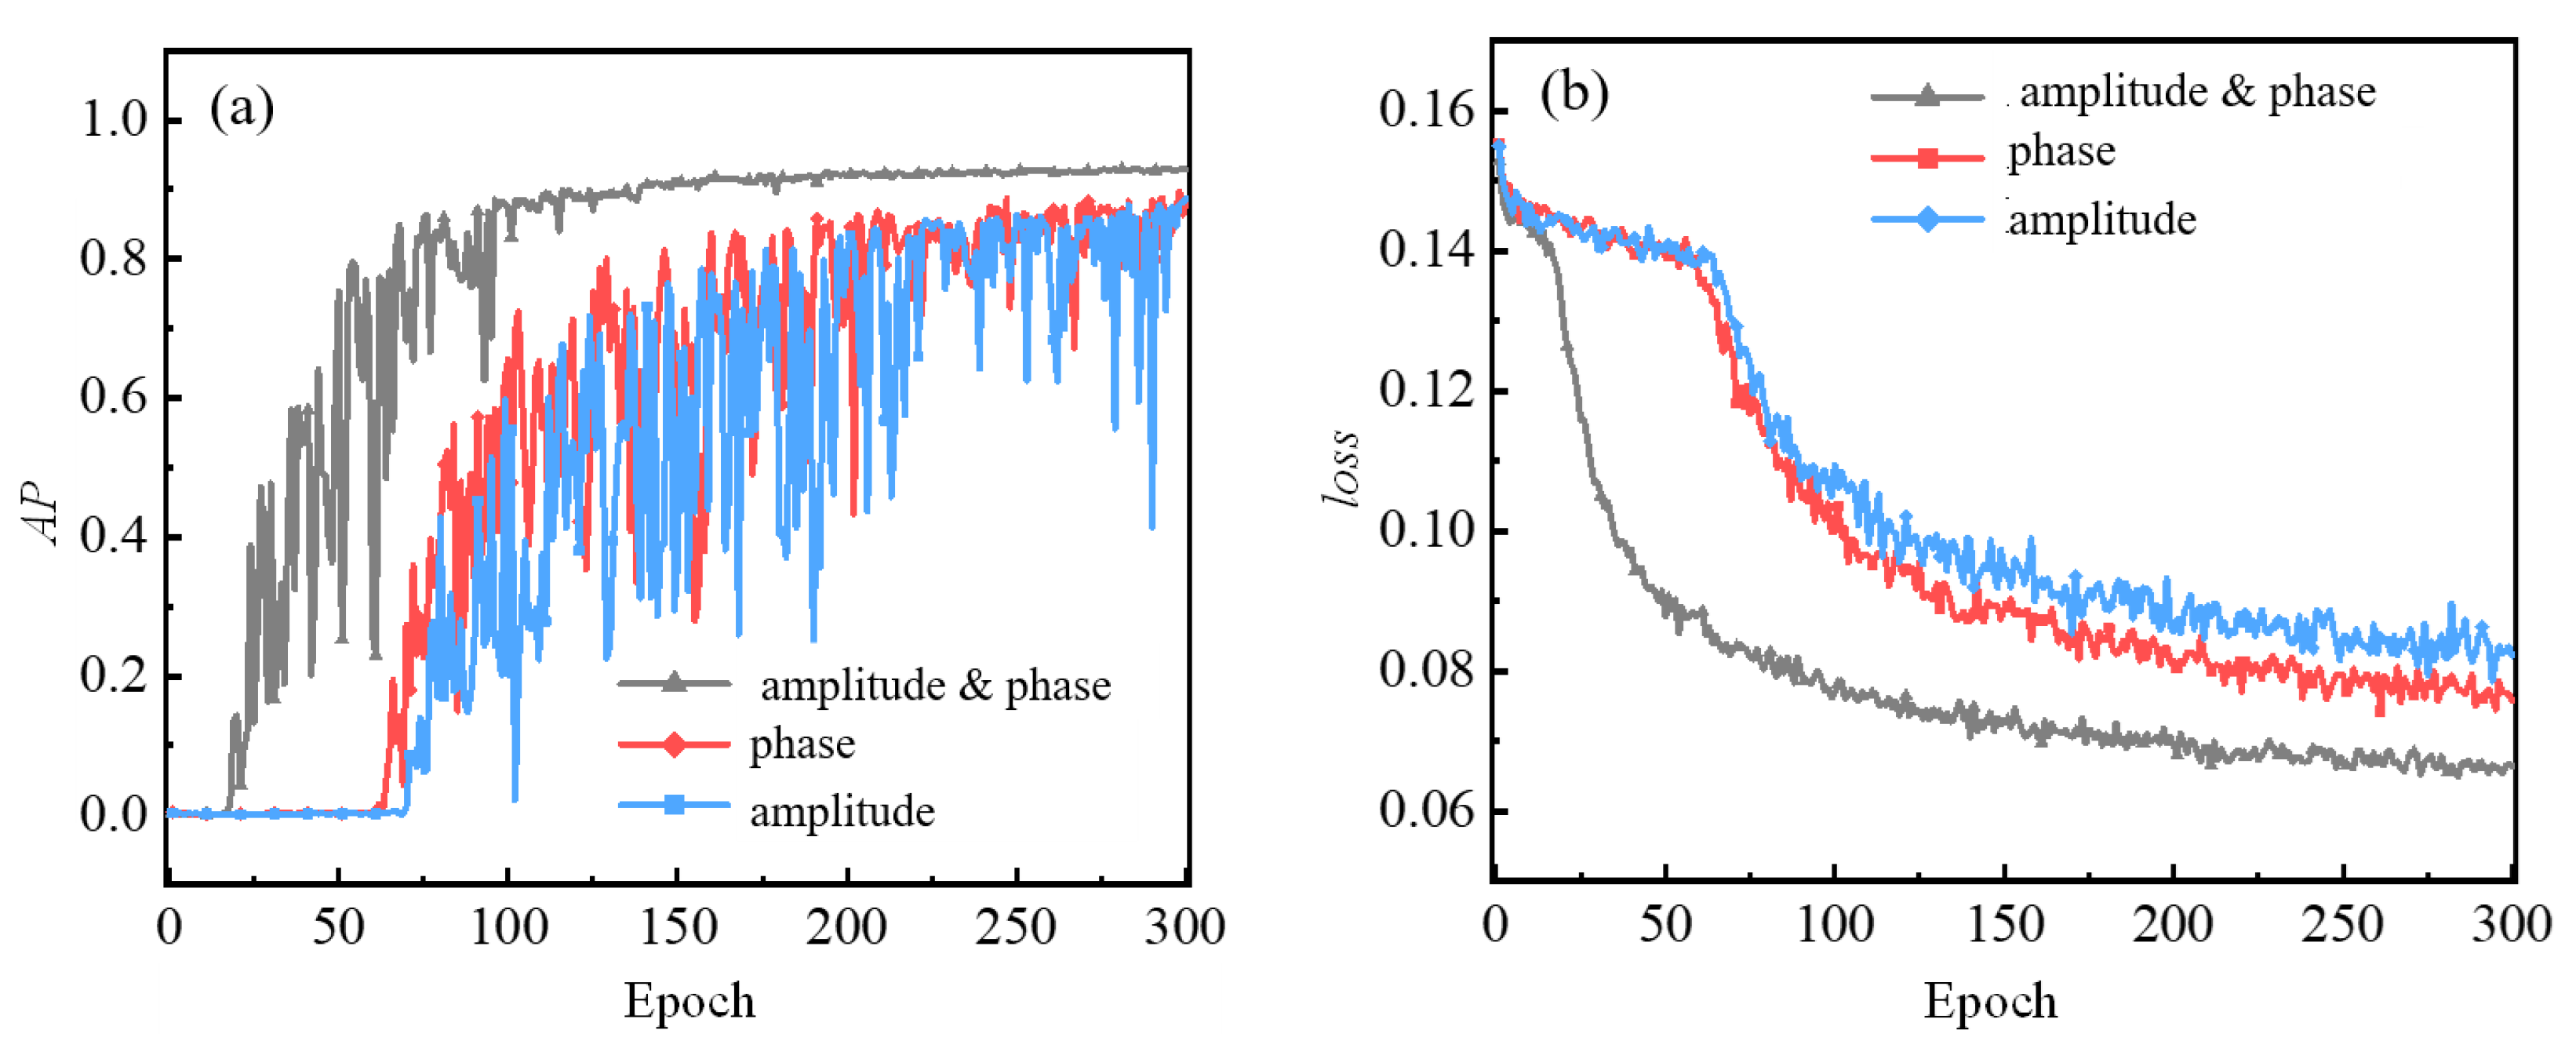
The amplitude and phase images can be synchronously obtained by using LIT inspection; therefore, the YOLOLT CNN model could be trained by using LIT amplitude image, LIT phase image and their fusion (LIT amplitude and phase) datasets, respectively. In this case, the effect of different datasets on the recognition accuracy of YOLOLT was studied, and the AP and loss function curves were obtained by training the use of LIT amplitude, phase and their combination (amplitude and phase), shown in Figure 16, as well as the evaluation parameters were listed in Table 5.
From Figure 16a, it was seen that the AP curves shows a relative high fluctuation by of the use of individual LIT amplitude or phase dataset training compared to the synchronous use of amplitude and phase (amplitude and phase) training. From Figure 16b, it was found that the loss curve of training would be slowly decreased before 60 epochs whenever using individual LIT amplitude or phase dataset, and then it would be rapidly decreased to a stable stage; simultaneously, the loss value of LIT phase training would be always lower than LIT amplitude training. However, the loss curve of training would be quickly reduced by synchronously using amplitude and phase, and it has a relatively low loss value in comparison with individual LIT amplitude or phase training. This also indicated that the feature information of debonding defect of HSCs could be comprehensively extracted through synchronously using amplitude and phase training.
It can be seen from Table 5 that the performance parameters of YOLOLT including AP, R were increased synchronously using amplitude and phase dataset training compared to individual LIT images dataset training, and in contrast, the defect identification time was increased by about 10% and 5% compared to LIT amplitude and phase dataset training, respectively.
Figure 17 shows the comparisons of the debonding defect recognition results of HSCs S2 by the use of YOLOLT with different datasets training.
From Figure 17a, for HSCs S2 specimen, six debonding defects were missed and not reliably identified by YOLOLT obtained from LIT amplitude dataset training. From Figure 17b, there were four debonding defects of HSCs S2 missed, and they were not accurately labeled by the YOLOLT obtained from the LIT phase dataset training. Finally, from Figure 17c, all debonding defects of HSCs S2 were reliably and accurately recognized by YOLOLT from the synchronous use of amplitude and phase dataset training, and this also verified that LIT amplitude and phase characterize the defect feature of HSCs from two direction channels in the feature space, thus providing more feature details of defects of HSCs for YOLOLT training and applications.

4. Conclusions

A convolution neural network (CNN) fusion lock-in thermography (LIT) has been successfully employed for the debonding defect identification of honeycomb structure composites (HSCs). The calculated LIT amplitude and phase matrices are changed into the gray and color-level images, and they have been processed by global histogram equalization and threshold segmentation for improvement of contrast and defect determination. A named YOLOLT CNN model was proposed, which combines a four-layer feature pyramid structure and transformer into a popular YOLOv5 CNN model framework. The YOLOLT CNN model was trained with the use of individual LIT amplitude, LIT phase and their synchronous datasets (amplitude and phase), and the optimal training parameters of YOLOLT were obtained such as a batch size of 16, epochs of 300 for HSCs debonding defect inspection. Through comparison experiments, the YOLOLT CNN model has a high debonding defect identification ability compared to the ordinary YOLOv5 CNN model, and the debonding defects of HSCs are allowed to reliably and accurately be recognized by YOLOLT from the synchronous use of amplitude and phase dataset training. In this work, with the application of YOLOLT, the average accuracy of identifying the debonding defects of HSCs specimens could reach up to 93.2%, and the average recognition speed was about 0.6 s. The CNN fusion LIT method provides a powerful tool for the debonding defect of HSCs. In the future work, this method can be studied in depth, the instance segmentation research of HSCs defects can be carried out and the prediction of the defect area mask can be realized through CNN. In-depth research on the depth of HSCs defects will be carried out, and the detection of the depth of HSCs defects will be realized by analyzing the temperature time response of the pixel points in the defect area in the infrared image sequence. Combined with lock-in thermography, it is further applied to the classification, quantitative identification and intelligent detection of debonding defects. The limitation of this paper is the limited datasets and the limited labels caused by the inefficiency of manual labeling, which is also one of the problems to be solved in the future.

Author Contributions

Conceptualization, X.W.; methodology, X.W.; software, F.Y.; validation, M.G.; formal analysis, X.W.; investigation, M.G. and H.Y.; data curation, M.G.; writing—original draft preparation, X.W.; writing—review and editing, X.W. and H.Y.; visualization, M.G. and F.Y.; supervision, F.W. and J.L.; project administration, F.W. and J.L.; funding acquisition, F.W. and J.L. All authors have read and agreed to the published version of the manuscript.

Funding

This research was funded by National Natural Science Foundation of China (NSFC) (No. 61571153, No. 51173034), Self-planned Task of State Key Laboratory of Robotics and System (HIT), the Programme of Introducing Talents of Discipline of Universities (Grant No. B07108), and 2022-JCJQ-JJ-0646, Fei Wang acknowledges National Natural Science Foundation of China (NSFC) (No. 62201173), China Post-doctoral Innovation Talent Support Program of China (No. BX2021092), China Postdoctoral Science Foundation (No. 2021M690841), Heilongjiang Natural Science Foundation (Grant No. LH2022F026).

Data Availability Statement

Not applicable.

Conflicts of Interest

The authors declare no conflict of interest.

References

  1. Vargas-Rojas, E.; Nocetti-Cotelo, C.-A. Alternative proposal, based on systems-engineering methods, aimed at substituting with carbon-epoxy laminates the load-bearing aluminum sandwiches employed in the structure of a small satellite. Adv. Space Res. 2020, 66, 193–218. [Google Scholar] [CrossRef]
  2. Wang, C.; Ma, S.; Li, D.; Zhao, J.; Zhou, H.; Wang, D.; Zhou, D.; Gan, T.; Wang, D.; Liu, C.; et al. 3D printing of lightweight polyimide honeycombs with the high specific strength and temperature resistance. ACS Appl. Mater. Interfaces 2021, 13, 15690–15700. [Google Scholar] [CrossRef] [PubMed]
  3. Fiborek, P.; Kudela, P. Model-Assisted Guided-Wave-Based Approach for Disbond Detection and Size Estimation in Honeycomb Sandwich Composites. Sensors 2021, 21, 8183. [Google Scholar] [CrossRef] [PubMed]
  4. Meruane, V.; Del Fierro, V. An inverse parallel genetic algorithm for the identification of skin/core debonding in honeycomb aluminum panels. Struct. Control Health Monit. 2015, 22, 1426–1439. [Google Scholar] [CrossRef]
  5. Wang, F.; Wang, Y.H.; Liu, J.Y.; Wang, Y. Theoretical and experimental study on carbon/epoxy facings-aluminum honeycomb sandwich structure using lock-in thermography. Measurement 2018, 126, 110–119. [Google Scholar] [CrossRef]
  6. Sfarra, S.; Ibarra-Castanedo, C.; Avdelidis, N.P.; Genest, M.; Bouchagier, L.; Kourousis, D.; Tsimogiannis, A.; Anastassopoulous, A.; Bendada, A.; Maldague, X.; et al. A comparative investigation for the nondestructive testing of honeycomb structures by holographic interferometry and infrared thermography. In Proceedings of the 15th International Conference on Photoacoustic and Photothermal Phenomena, Leuven, Belgium, 19–23 July 2009; Volume 214, p. 012071. [Google Scholar]
  7. Thomas, B.P.; Pillai, S.A.; Narayanamurthy, C.S. Investigation on vibration excitation of debonded sandwich structures using time-average digital holography. Appl. Opt. 2017, 56, F7–F13. [Google Scholar] [CrossRef] [PubMed]
  8. Chong, S.Y.; Victor, J.J.; Todd, M.D. Full-field ultrasonic inspection for a composite sandwich plate skin-core debonding detection using laser-based ultrasonics. In Proceedings of the SPIE Smart Structures and Materials + Nondestructive Evaluation and Health Monitoring, Portland, OR, USA, 25–29 March 2017; Volume 1017007, pp. 1–10. [Google Scholar]
  9. Lu, P.; Wei, Q.; Ao, B.; Min, J.L.; Wu, J.J.; Yan, Y.H. Digital imaging detection of aluminum honeycomb sandwich structure. Nondetruct. Test. 2015, 9, 340–346. [Google Scholar]
  10. Wang, F.; Liu, J.; Song, P.; Gong, J.; Peng, W.; Liu, G.; Chen, M.; Wang, Y. Multimodal optical excitation pulsed thermography: Enhanced recognize debonding defects of the solid propellant rocket motor cladding layer. Mech. Syst. Signal Process. 2022, 163, 108164. [Google Scholar] [CrossRef]
  11. Wang, F.; Wang, Y.; Liu, J.; Wang, Y. The Feature Recognition of CFRP Subsurface Defects Using Low-Energy Chirp-Pulsed Radar Thermography. IEEE Trans. Ind. Inform. 2020, 16, 5160–5168. [Google Scholar] [CrossRef]
  12. Wang, F.; Liu, J.; Dong, B.; Liu, G.; Chen, M.; Wang, Y. Optimization of Thermal-Wave Radar Thermography by Transverse Heat Flow Suppression Technique for Accurate Defect Detection of CFRP Laminates. IEEE Trans. Instrum. Meas. 2021, 70, 1–10. [Google Scholar] [CrossRef]
  13. Meola, C.; Carlomagno, G.M. Recent Advances in the Use of Infrared Thermography. Meas. Sci. Technol. 2004, 15, 27–58. [Google Scholar] [CrossRef]
  14. Lin, T.Y.; Dollár, P.; Girshick, R.; He, K.; Hariharan, B.; Belongie, S. Feature Pyramid Networks for Object Detection. In Proceedings of the IEEE Conference on Computer Vision and Pattern Recognition, Honolulu, HI, USA, 21–26 July 2017; pp. 936–944. [Google Scholar]
  15. Li, H.; Xiong, P.; An, J.; Wang, L. Pyramid Attention Network for Semantic Segmentation. In Proceedings of the IEEE Conference on Computer Vision and Pattern Recognition, Salt Lake City, UT, USA, 18–22 June 2018; pp. 1–14. [Google Scholar]
  16. Zhang, Y.; Ren, W.; Zhang, Z.; Jia, Z.; Wang, L.; Tan, T. Focal and Efficient IOU Loss for Accurate Bounding Box Regression. In Proceedings of the IEEE Conference on Computer Vision and Pattern Recognition, Nashville, TN, USA, 20–25 June 2021; pp. 4321–4330. [Google Scholar]
  17. Li, M.; Yang, S.; Liu, X. Pareto or Non-Pareto: Bi-Criterion Evolution in Multi-Objective Optimization. IEEE Trans. Evol. Comput. 2016, 20, 645–665. [Google Scholar] [CrossRef]
  18. Abdelhakim, A.; Saleh, H.; Abdelhakim, M. Fragile watermarking for image tamper detection and localization with effective recovery capability using K-means clustering. Multimed. Tools Appl. 2019, 78, 32523–32563. [Google Scholar] [CrossRef]
  19. Yun, S.; Han, D.; Oh, S.J.; Chun, S.; Choe, J.; Yoo, Y. CutMix: Regularization Strategy to Train Strong Classifiers with Localizable Features. In Proceedings of the International Conference on Computer Vision, Seoul, Republic of Korea, 27–28 October 2019; pp. 1–14. [Google Scholar]
  20. Tao, W.; Tian, J.; Liu, J. Image segmentation by three-level thresholding based on maximum fuzzy entropy and genetic algorithm. Pattern Recognit. Lett. 2003, 24, 3069–3078. [Google Scholar] [CrossRef]
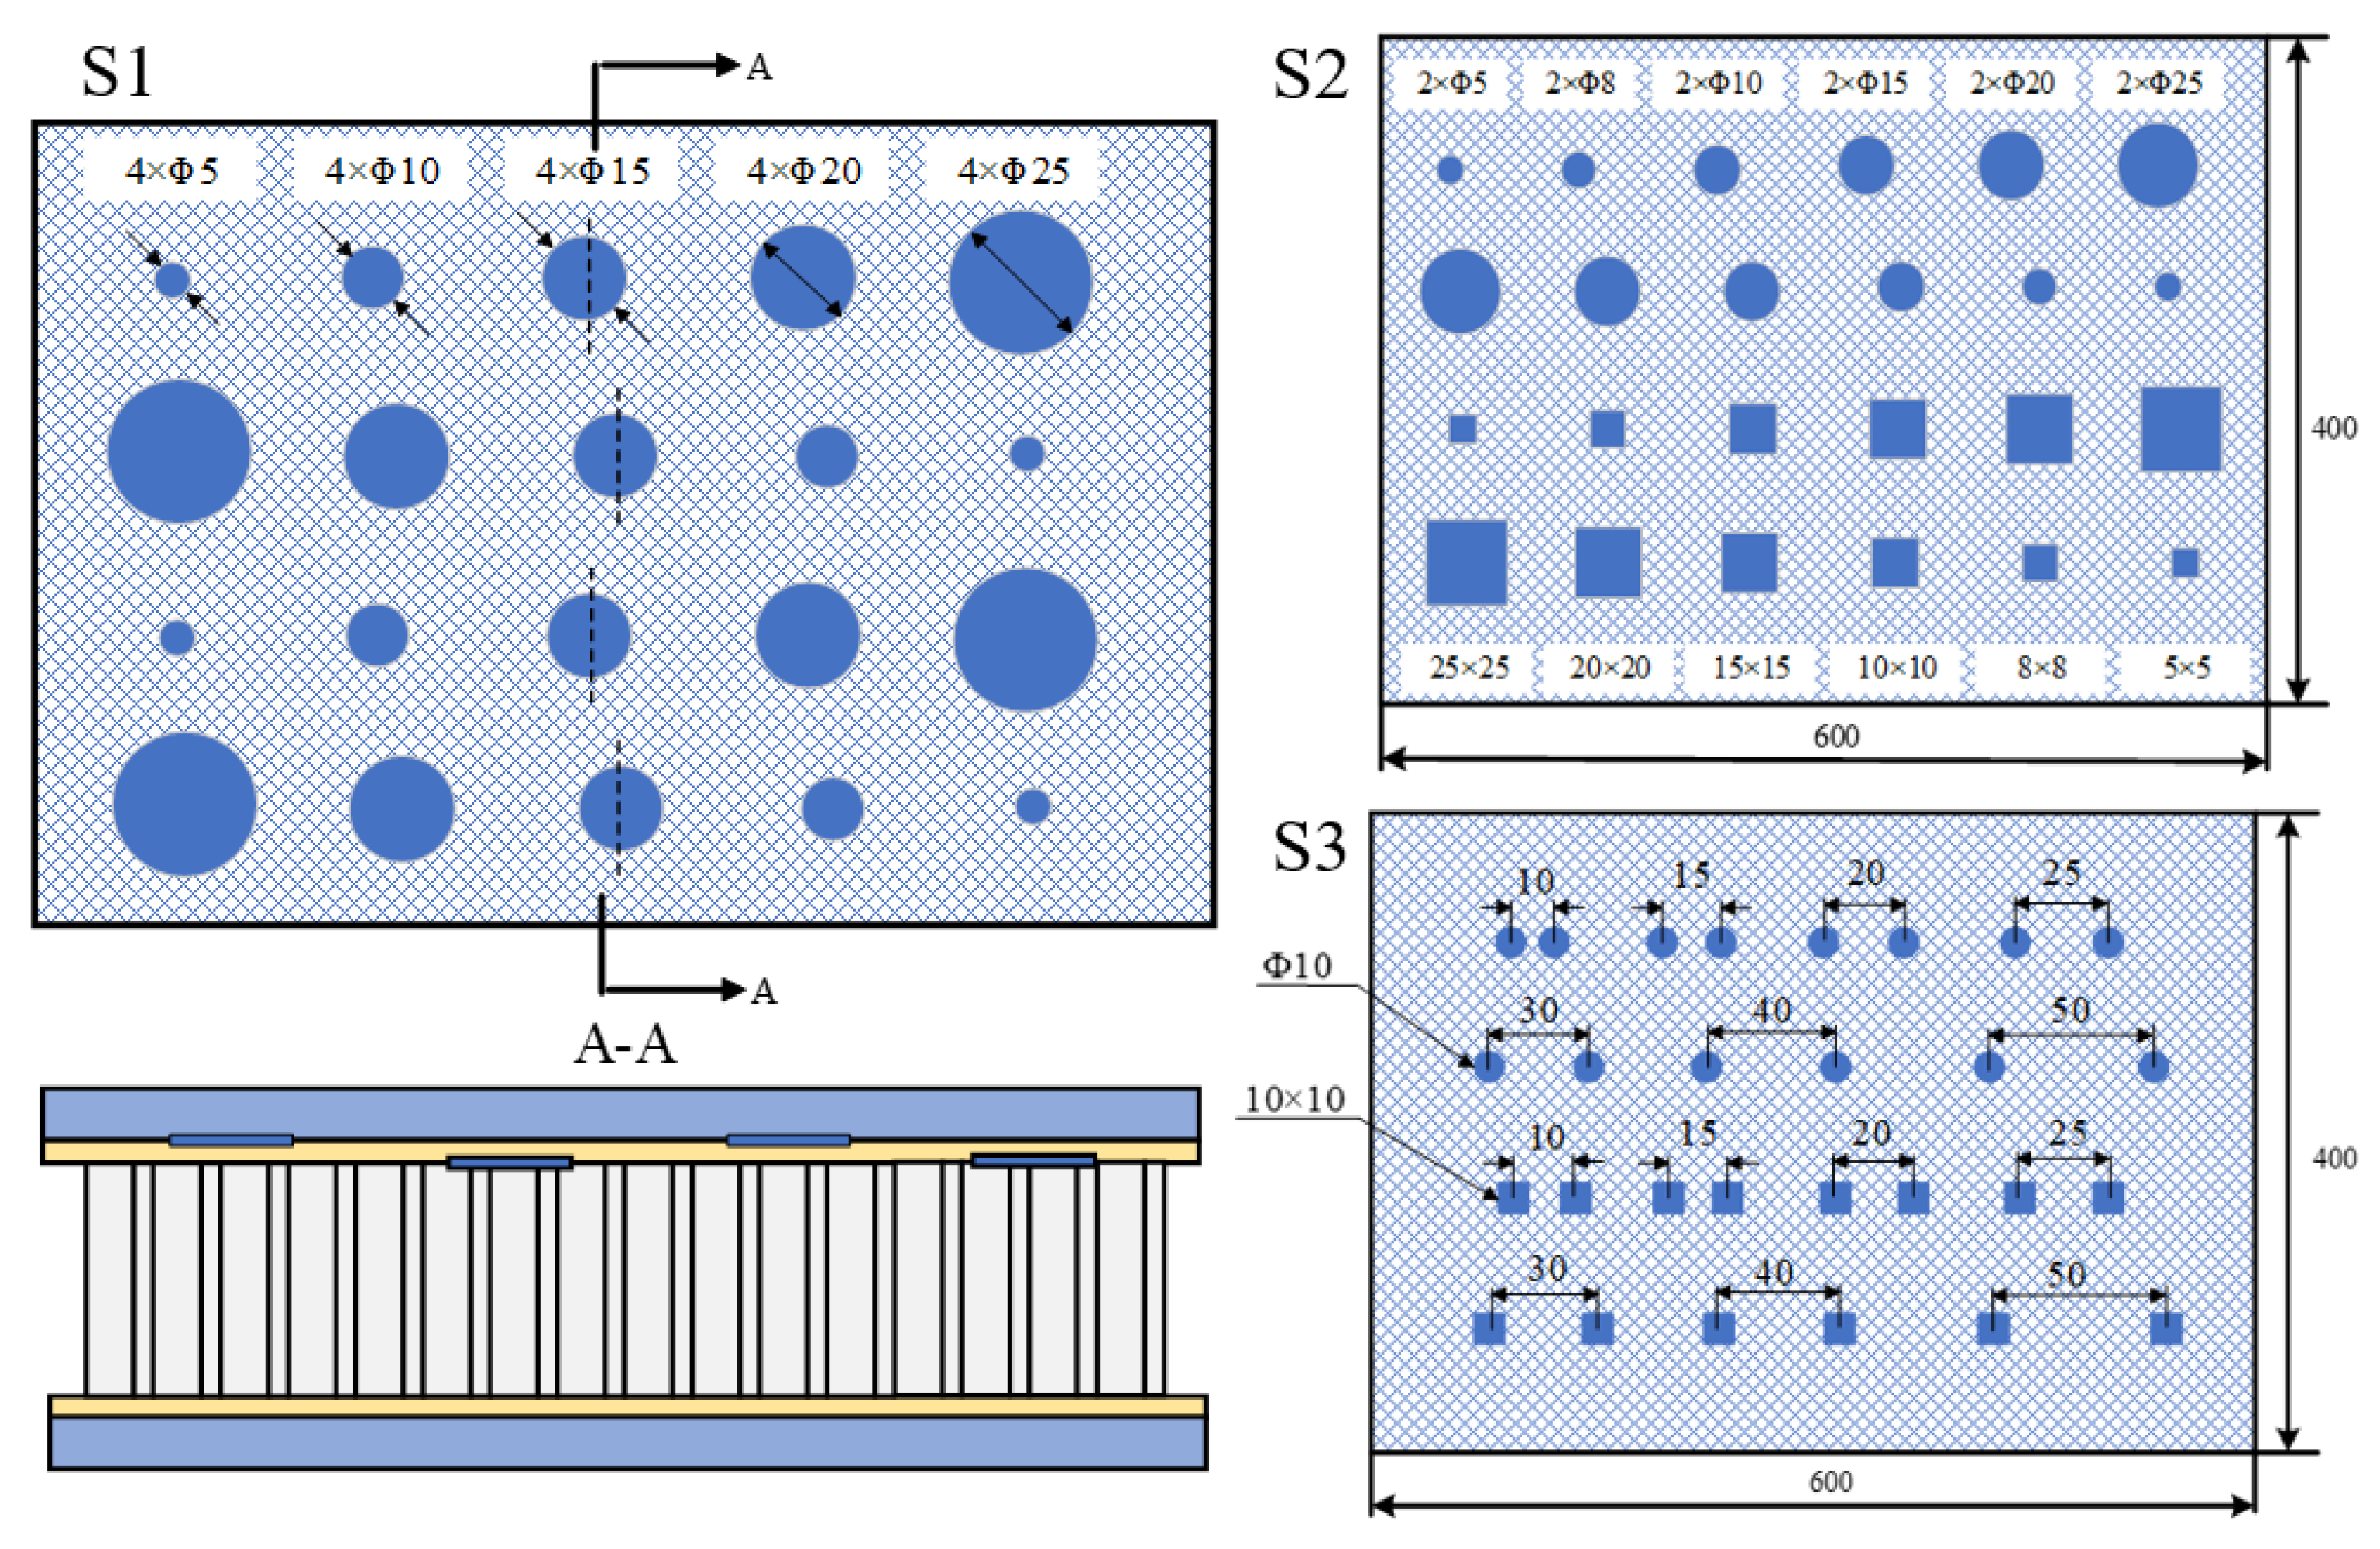
Figure 1. The HSCs specimens with subsurface artificial defects (unit: mm).
Metals 13 00881 g001
Figure 2. The schematic diagram of lock-in thermography.
Metals 13 00881 g002
Figure 3. The LIT inspection results of S1, (a) amplitude images and (b) phase images.
Metals 13 00881 g003
Figure 4. A schematic diagram of defined YOLOLT.
Metals 13 00881 g004
Figure 5. LIT images of HSCs specimens with various facing thickness.
Metals 13 00881 g005
Figure 6. The enhanced gray LIT phase image of S1, (a) original gray image, (b) histogram equalization enhancement and (c) threshold equalization enhancement.
Metals 13 00881 g006
Figure 7. The image segmentation results, (a) threshold and (b) K-means cluster.
Metals 13 00881 g007
Figure 8. Mosaic data augmentation results.
Metals 13 00881 g008
Figure 9. Comparison diagram of different batch-size training processes, (a) AP cures as a function of training epochs and (b) loss cures as a function of epochs.
Metals 13 00881 g009
Figure 10. The training process curves, (a) AP curves and (b) loss function curves.
Metals 13 00881 g010
Figure 11. The parallel coordinates plot of hyperparameter optimization results.
Metals 13 00881 g011
Figure 12. YOLOT training results with pre-processing and original LIT images as dataset, (a) precision curves, (b) recall curves, (c) AP curves and (d) loss function curves.
Metals 13 00881 g012
Figure 13. The debonding defect determination of HSCs S1 specimen by YOLOLT, (a) original LIT phase image and (b) pre-processed LIT phase image.
Metals 13 00881 g013
Figure 14. The comparisons debonding defects recognition of HSCs S2, (a) the ordinary YOLOv5, and (b) the proposed YOLOLT.
Metals 13 00881 g014
Figure 15. The comparisons debonding defects recognition of HSCs S3, (a) the ordinary YOLOv5, and (b) the proposed YOLOLT.
Metals 13 00881 g015
Figure 16. The training results with different datasets, (a) AP curves and (b) loss function curves.
Metals 13 00881 g016
Figure 17. Comparisons of defect identification of HSCs S2 with different datasets training, (a) LIT amplitude image, (b) LIT phase image and (c) LIT amplitude and phase images.
Metals 13 00881 g017
Table 1. Comparison of YOLOLT training results with different batch sizes.
Evaluation Batch Size = 2Batch Size = 4Batch Size = 8Batch Size = 12Batch Size = 16
P0.7210.7300.7250.7410.743
R0.9800.9900.9900.9900.990
AP0.9060.9230.9260.9260.932
Training time (s)17,4679056542647334308
Table 2. Range of hyperparameters variation.
HyperparametersMutation ScaleMinimum ValueMaximum Value
lr010.000010.1
lrf10.011.0
momentum0.30.60.98
box10.020.2
obj10.24.0
weight decay10.00.001
anchor-t12.08.0
Table 3. Optimal hyperparameters of YOLOLT.
ParametersValueParametersValue
batch size16epochs300
images size320lr00.00771
lrf0.2783momentum0.7437
box1obj0.4312
weight decay0.00047anchor-t2.34
Table 4. The training evaluation results.
CNN ModelAPPRTraining Time/s
Pre-processing 0.9320.7120.993470
Original image0.9250.6810.984308
Table 5. The evaluation results based on different training datasets.
Training DatasetAPRIdentification Time (s)
LIT amplitude0.8790.9700.549
LIT phase0.8870.9800.575
LIT amplitude and phase0.9320.9900.603
Disclaimer/Publisher’s Note: The statements, opinions and data contained in all publications are solely those of the individual author(s) and contributor(s) and not of MDPI and/or the editor(s). MDPI and/or the editor(s) disclaim responsibility for any injury to people or property resulting from any ideas, methods, instructions or products referred to in the content.