1. Introduction
In recent decades, metal nanoparticles have attracted significant attention due to their unique physical, chemical, and optical properties. Alongside crystalline metal nanoparticles, currently, particles with an amorphous structure are of great interest [
1,
2,
3,
4]. Atoms in amorphous particles are in a nonequilibrium state and have a higher Gibbs energy compared to atoms in a crystal, have a unique electronic structure, which makes them promising in the fields of catalysis, biomedicine, optics, and electronics [
5,
6]. Amorphous metals, or metallic glasses, have a combination of unusual magnetic and mechanical properties and contain a large quantity of stored energy [
7,
8,
9,
10].
When exploring the synthesis and processing of metal nanoparticles, a significant focus is placed on managing the size, shape, and phase state of the particles due to their substantial impact on useful properties [
11,
12]. Consequently, it is crucial to investigate the stability of the phase state, the mechanisms of phase transitions, and the factors that influence the kinetics of these transitions and the temperature at which they occur.
One of the most effective tools for studying the above issues is currently the molecular dynamics method. Molecular dynamics is intensively and successfully used to simulate the structure and properties of nanoparticles, as well as the processes occurring in them and with their participation. To date, simulations have been carried out for both single-component metal clusters, for example [
13,
14,
15,
16,
17], and clusters of binary alloys [
17,
18,
19,
20]. It is now known that the melting temperature of nanoparticles decreases with their decreasing size due to an increase in the fraction of the surface area relative to the volume, which has been shown both experimentally [
21,
22] and by computer simulations [
13,
17,
23]. Simulations have also revealed that the temperature at which crystallization occurs during cooling from the molten state also depends on the size and shape of the particles, that is, on the surface fraction, and decreases with an increase in this fraction [
13,
14,
16].
Two methods are usually used when studying the processes of crystallization and melting using molecular dynamics: modeling the phase transition at a constant temperature [
15,
24,
25] or at a constant rate of temperature change [
14,
16,
26]. In [
15], for example, the crystallization of iron nanoparticles under constant temperature conditions was studied using the molecular dynamics simulation. In [
14,
16], the crystallization of nickel nanoparticles was simulated during cooling from the melt at constant rates ranging from 2 × 10
12 to 4 × 10
13 K/s in [
14] and from 5 × 10
10 to 5 × 10
12 K/s in [
16]. In [
14,
16], in particular, it was found that the crystallization of a pure nickel particle already occurs at a cooling rate below 10
13 K/s.
At the same time, the mechanism and kinetics of the devitrification of nanoparticles, that is, the loss of an amorphous state as a result of their crystallization upon heating, remain poorly understood. This work is devoted to the study of the process of the devitrification of amorphous copper nanoparticles in vacuum and in a silver shell at the atomic level using a molecular dynamics simulation. The choice of particles of the Cu-Ag system as the object of study was due to their high prospects for use in various fields. For example, bimetallic Cu-Ag nanoparticles are well known for their antibacterial and electrical properties [
27,
28]. They are used as electrochemical sensors [
29] and are actively applied in the field of catalysis [
29,
30,
31]. The potential application of Cu-Ag nanoparticles in the field of corrosion resistance [
32] and solar cells [
33] has been successfully demonstrated.
When creating the nanoparticles of the Cu-Ag system, for example, by condensation from the gas phase, the formation of the particle structure often occurs with the formation of a Cu core located in the shell of Ag atoms [
34,
35]. The lattice parameters of Cu and Ag differ by about 13% (3.615 and 4.086 Å, respectively), and therefore, apparently, the Ag shell should affect the process of the devitrification (crystallization) of the Cu core.
2. Description of the Model
To describe the interatomic interactions in the Cu–Ag system, we used EAM potentials from [
36], where they were obtained based on comparison with experimental data and ab initio calculations for the various properties and structures of Cu and Ag metals, as well as their compounds. They effectively reproduce a broad spectrum of structural-energetic and mechanical properties of the Cu-Ag system. According to tests carried out in [
36], these potentials demonstrate good transferability to high-temperature properties, including their fairly good reproduction of phase transition temperatures, thermal expansion, changes in elastic moduli with temperature, and diffusion characteristics. The entire Cu-Ag phase diagram calculated in [
36] with these potentials in conjunction with Monte Carlo simulations is in satisfactory agreement with the experiment. These potentials are most often used for the molecular dynamics simulation of the Cu-Ag system [
37,
38]. In particular, in [
39], this potential was successfully used to study the copper crystallization process by the molecular dynamics method.
At the first stage, a copper particle was created by cutting a ball of the appropriate size from an ideal crystal. The study focused on particles ranging in diameter from 1.5 to 11 nm. For particles with a diameter of less than 1.5 nm, determining the onset of crystallization was challenging, and for particles with a diameter greater than 11 nm, the impact of the free surface was relatively minor. The particle was in vacuum in a cubic computational cell with periodic boundary conditions. The distance between the cell boundaries was large enough to exclude any possible interaction of the particle with its virtual twin. In this model, it is also possible to use free boundary conditions (that is, just a vacuum around the particle), but, firstly, this does not affect the results at all, and, secondly, the use of periodic conditions is more convenient for controlling the constancy of the number of atoms in the system. Temperature control was carried out using a Nose-Hoover thermostat. The temperature in the model was set through a change in the velocities of the atoms. The time integration step in the molecular dynamics method was equal to 1 fs. The particle was able to freely change its volume within the computational cell. With a sharp change in temperature (at the initial setting) and during phase transitions, the particle changed its volume quite quickly, within just a few picoseconds, that is, there was no pressure in the model. Thus, the NPT canonical ensemble was used in the model under consideration.
To simulate a silver layer around a copper particle, a shell was created containing approximately the same number of atoms as the particle contained. Initially, the silver shell was also cut from the crystal. The distance between the surface of the copper particle and the inner surface of the silver shell was initially set to 0.28 nm. However, as a result of the subsequent procedures for preparing the model, such as structural relaxation, the melting of both metals, and subsequent sharp cooling, the choice of the initial distance between the particle and the shell had virtually no effect on the final results. After creating a particle with a shell, the structure was relaxed at a temperature of 500 K for 20 ps to eliminate the appearance of stresses at the interface between copper and silver. This was followed by the procedure for creating particles with an amorphous structure of the core and shell.
Particles with an amorphous structure were created by the ultrafast (in the order of 10
16 K/s) cooling of particles melted upon heating to a temperature that is significantly higher than the melting point (typically 2000–2500 K). When the metal is cooled at such a rapid rate, homogeneous crystallization does not have sufficient time to occur, resulting in the formation of an amorphous structure that is characteristic of a supercooled liquid [
7]. It is known that the atomic structure of real metallic glasses is not just a set of randomly located atoms, but is a metastable system consisting of a set of small ordered clusters [
8,
9,
10]. However, pure metals have a very high tendency to crystallize and such a high cooling rate when obtaining an amorphous structure at the initial stage was used in our work to reduce the likelihood of the formation of crystallization nuclei in the particle, which could affect the results. In addition, after this, structural relaxation was carried out at a temperature of 200 K for 100 ps, as a result of which the structure was rearranged and a metastable structure was formed, resistant to structural transformation up to the devitrification temperature, as evidenced by not a gradual change in the average energy of atoms during heating, but a relatively sharp change. The quality of the amorphous structure was checked using the diagrams of the radial distribution of atoms and the average energy of atoms in a nanoparticle (this will be discussed in more detail in the next section). In addition, the destruction of the crystal structure of particles, as well as their crystallization, as a rule, were clearly visually visible, as well as when using a crystal phase visualizer that relied on the common neighbor analysis (CNA) method [
40].
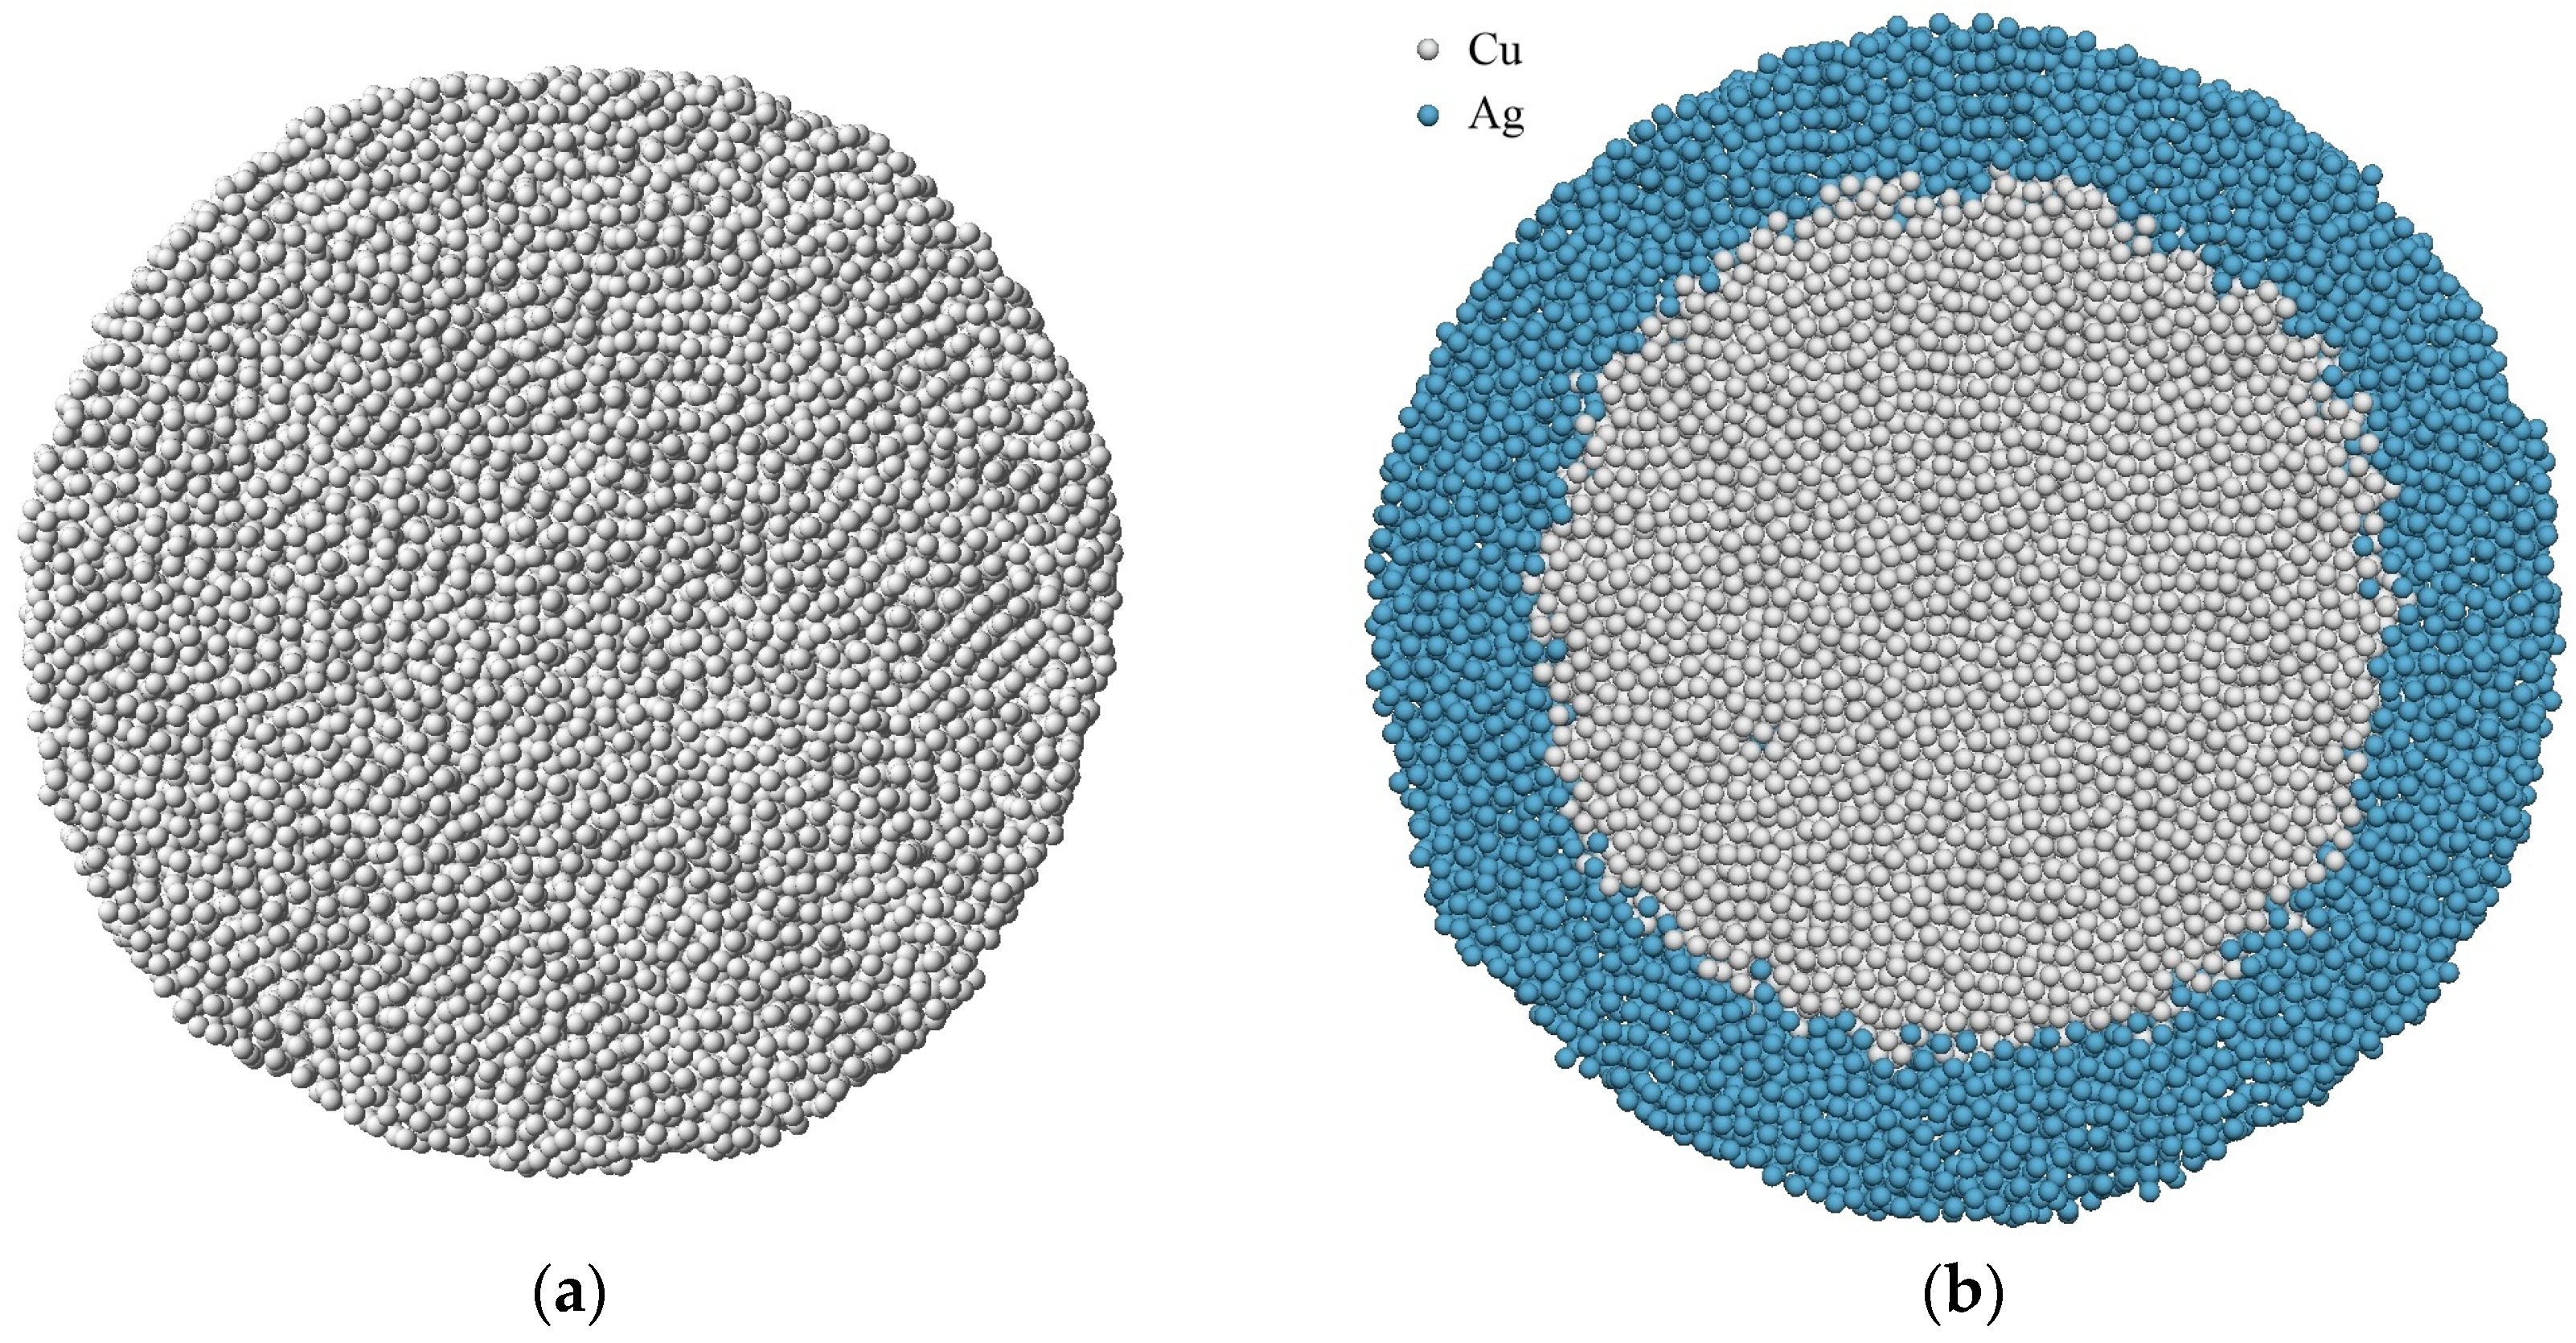
Figure 1 shows the examples of cuts of amorphous copper particles with a diameter of 9 nm in vacuum and in a silver shell.
Two constant heating rates, 5 × 10
11 and 10
12 K/s, were used to simulate the heating of particles of different sizes. The temperature was changed by correspondingly changing the velocity moduli of the atoms in the system after an equal time period of 10 fs. It was shown in [
14,
16] that a temperature change rate of 10
13 K/s is adequate to induce the homogeneous crystallization in a metal. However, the lower the rate, the more accurate the determination of the phase transition onset temperature. On the other hand, the longer the computer experiment, the higher the mutual diffusion at the Cu-Ag interface, which also affects the error in determining the devitrification temperature. The rate in the range 5 × 10
11–10
12 K/s turned out to be optimal in this case.
The coefficients of thermal expansion for copper and silver are close in value (approximately 17 × 10
−6 and 19 × 10
−6 K
−1 for normal temperatures [
36]), which excluded the appearance of additional internal stresses at the Cu-Ag interface due to unequal expansion. In addition, the computer experiments had a relatively long duration, which was sufficient to rid the system of possible stresses at the boundary as a result of structure relaxation.
3. Results and Discussion
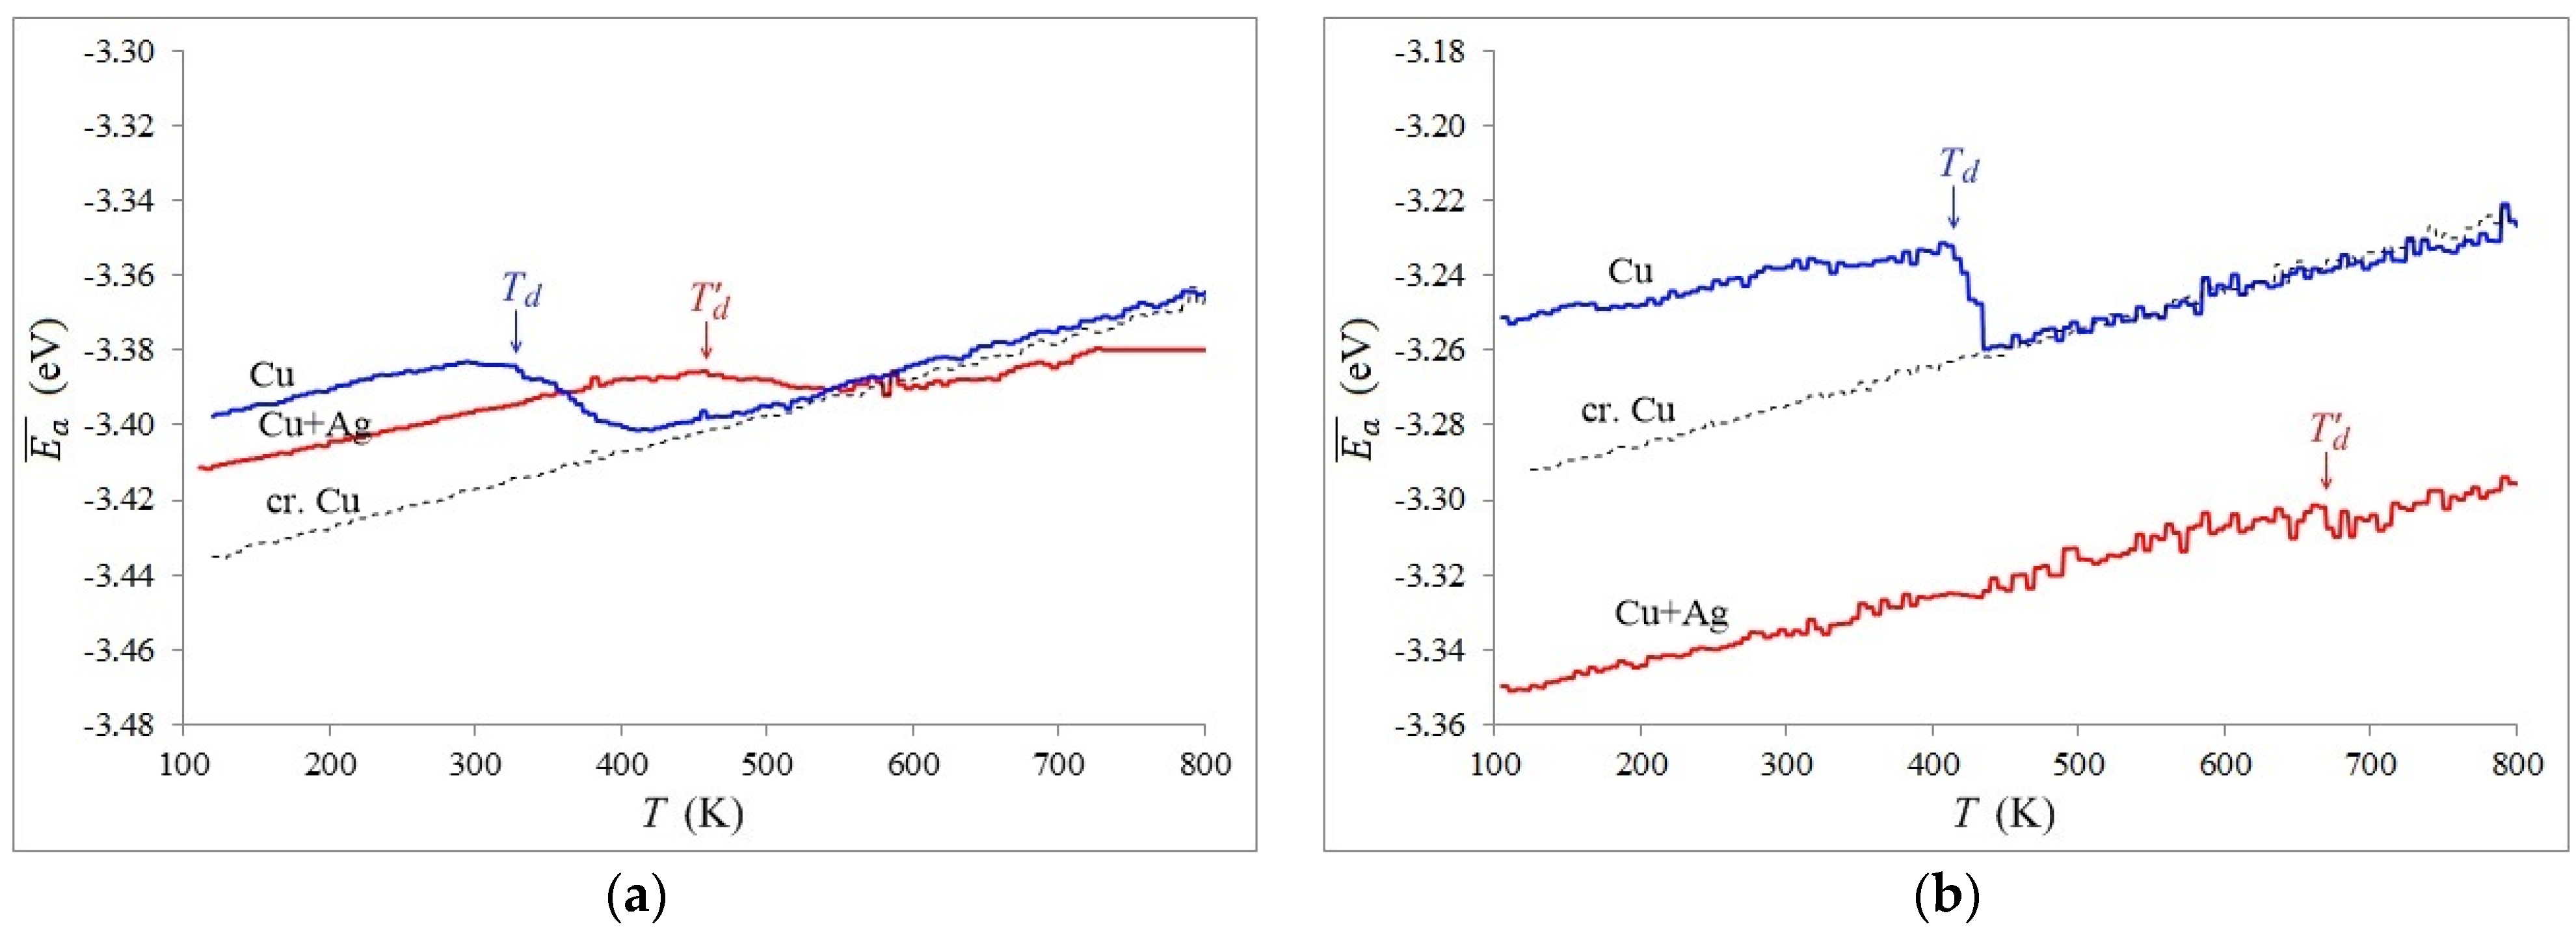
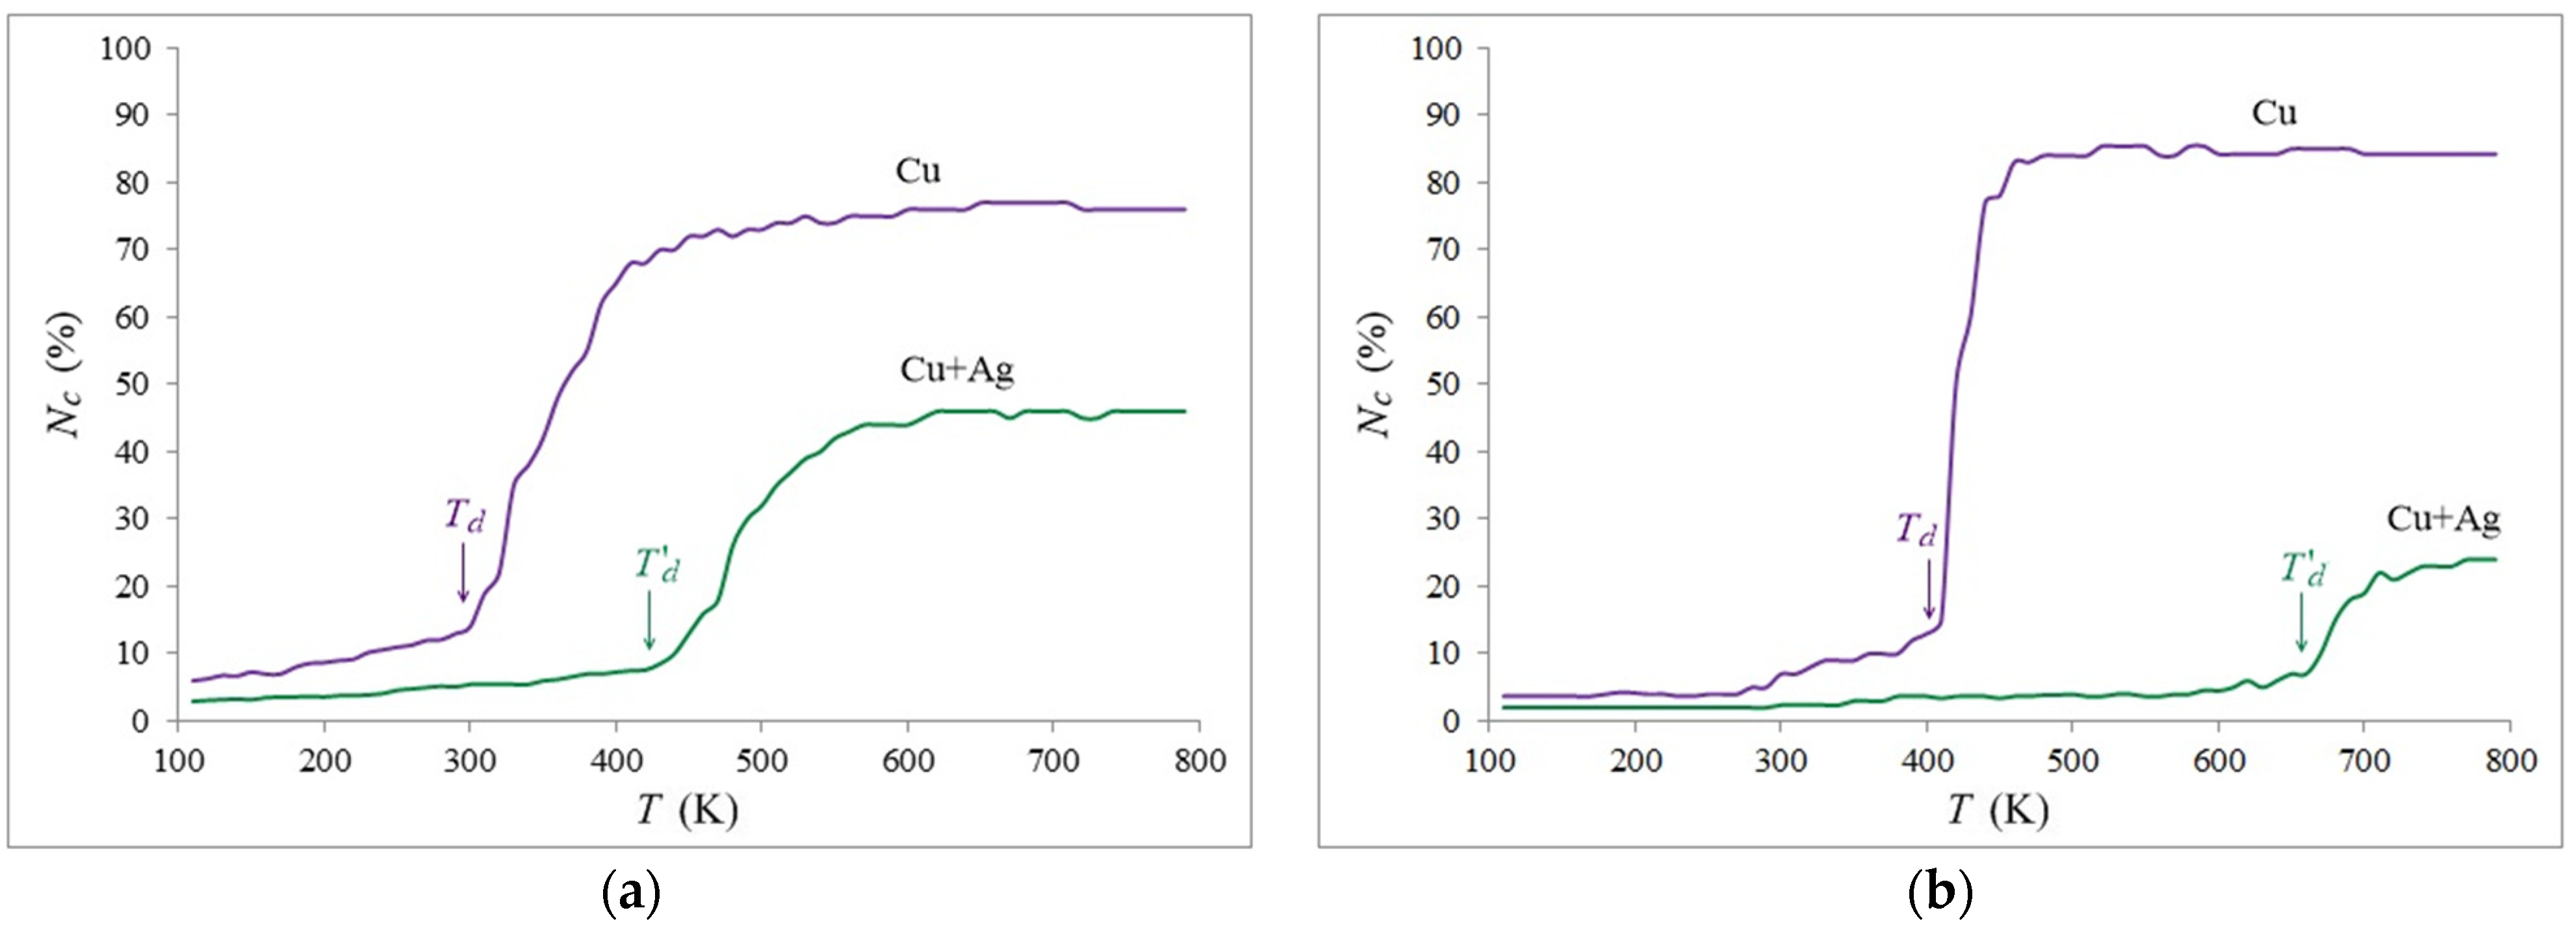
The average potential energy of copper atoms
was employed as a means of characterizing the structure of the nanoparticles.
Figure 2 depicts the changes in the average energy of copper atoms with increasing temperature for particles with diameters of 8 and 3 nm in vacuum and in a silver shell. The dotted lines also show the dependencies for single-crystal particles that do not contain any defects, except for the free surface.
The sharp decrease in the average energy on the graphs is an obvious sign of a phase transition—devitrification, that is, the crystallization of amorphous particles upon heating. Melting-crystallization phase transitions do not happen instantaneously, and the crystal-liquid front moves at a finite speed that is typically several tens of meters per second and is temperature-dependent [
41,
42]. Therefore, we determined the devitrification temperature from the onset of the phase transition, which is shown by arrows in the figure.
For relatively small particles, the change in energy during the crystallization was sharper (
Figure 2b), which is explained by the relatively shorter duration of this process in particles with a smaller diameter.
For particles in vacuum (blue graphs in
Figure 2), the devitrification started at about 320 K for a particle with a diameter of 8 nm and 410 K for a particle with a diameter of 3 nm. The devitrification temperature increased as the particle diameter decreased, likely due to the effect of the surface.
After the devitrification and crystallization of the entire particle in vacuum, the average energy of the atoms almost coincided with the energy of a single-crystal particle. The upward energy deviation in the case of the 8 nm particle (
Figure 2a) is due to the formation of defects during crystallization, particularly grain boundaries. Small particles crystallized with the formation of a lower defect density compared to larger diameter particles.
The graph of the change in the energy of the copper atoms for the 3 nm particle in a silver shell (red in
Figure 2b) is located lower than the graph for a particle without a shell, and for 8 nm particle, the energy values are similar in both cases. This is explained by an increase in the contribution of mutual diffusion with a decrease in the particle diameter–as the diameter decreases, the fraction of atoms interacting with silver atoms increases, which leads to a decrease in the average energy of the copper atom.
The drop in the average energy of the copper atoms during the devitrification is much smaller for particles in a shell compared to those in vacuum, which is again explained by the contribution in the calculation of the average energy of copper atoms in contact with silver atoms.
The presence of a silver shell, as can be seen from the graphs in
Figure 2, does have a significant effect on the devitrification temperature. It begins at a much higher temperature than for particles in a vacuum: approximately 440 and 670 K for particles 8 and 3 nm in diameter, respectively.
For a particle with a diameter of 3 nm surrounded by a silver shell, as seen in
Figure 2b, the change in energy during crystallization was insignificant, which complicated the determination of the temperature at which devitrification began. In such cases, a second characteristic was additionally used, which helps to more accurately determine the devitrification temperature, but requires more time to perform calculations. It consisted of plotting the dependence of the fraction of the crystalline phase found using the CNA method [
40].
Figure 3 shows examples of these dependencies for the same particles used in
Figure 2. To construct them, the content of crystalline phases in a copper particle was periodically analyzed during a computer experiment. As can be seen, the resulting graphs correlate with the graphs of changes in the average energy of atoms in
Figure 2. Two features should be noted. Firstly, the proportion of the crystalline phase in all cases does not reach 100%. Secondly, in the case of the presence of a silver shell, this proportion is significantly lower. The first is obviously explained by the presence after crystallization of the particle of a high concentration of defects, mainly grain boundaries. Moreover, this concentration, as a rule, decreased as the particle size decreased. The second, that is, the influence of the shell, is apparently due to the absence in this case of a free surface, which, as will be shown below, plays an important role in the devitrification of particles, as well as the contribution of mutual diffusion at the interface. Crystallization in the presence of a shell was, as a rule, noticeably less intense and with the generation of a comparatively larger amount of defects.
To mathematically explain how the free surface of nanoparticles affects their melting point, a formula is commonly used which assumes that the change in the phase transition temperature is proportional to the ratio of the particle’s surface area to its volume [
13,
23]. For a particle with a spherical shape, this change should be proportional to
N−1/3 or
d−1, where
N represents the number of atoms in the nanoparticle, and
d is its diameter. We applied the same assumption to the devitrification temperature, but with the addition of a correction, δ, which accounts for the finite thickness of the near-surface layer of the particle or the diffusion zone in the case of a silver shell:
Here, and represent the devitrification temperatures of the particle and hypothetical bulk material, respectively, and A is the parameter that determines the extent to which the particle surface affects its devitrification.
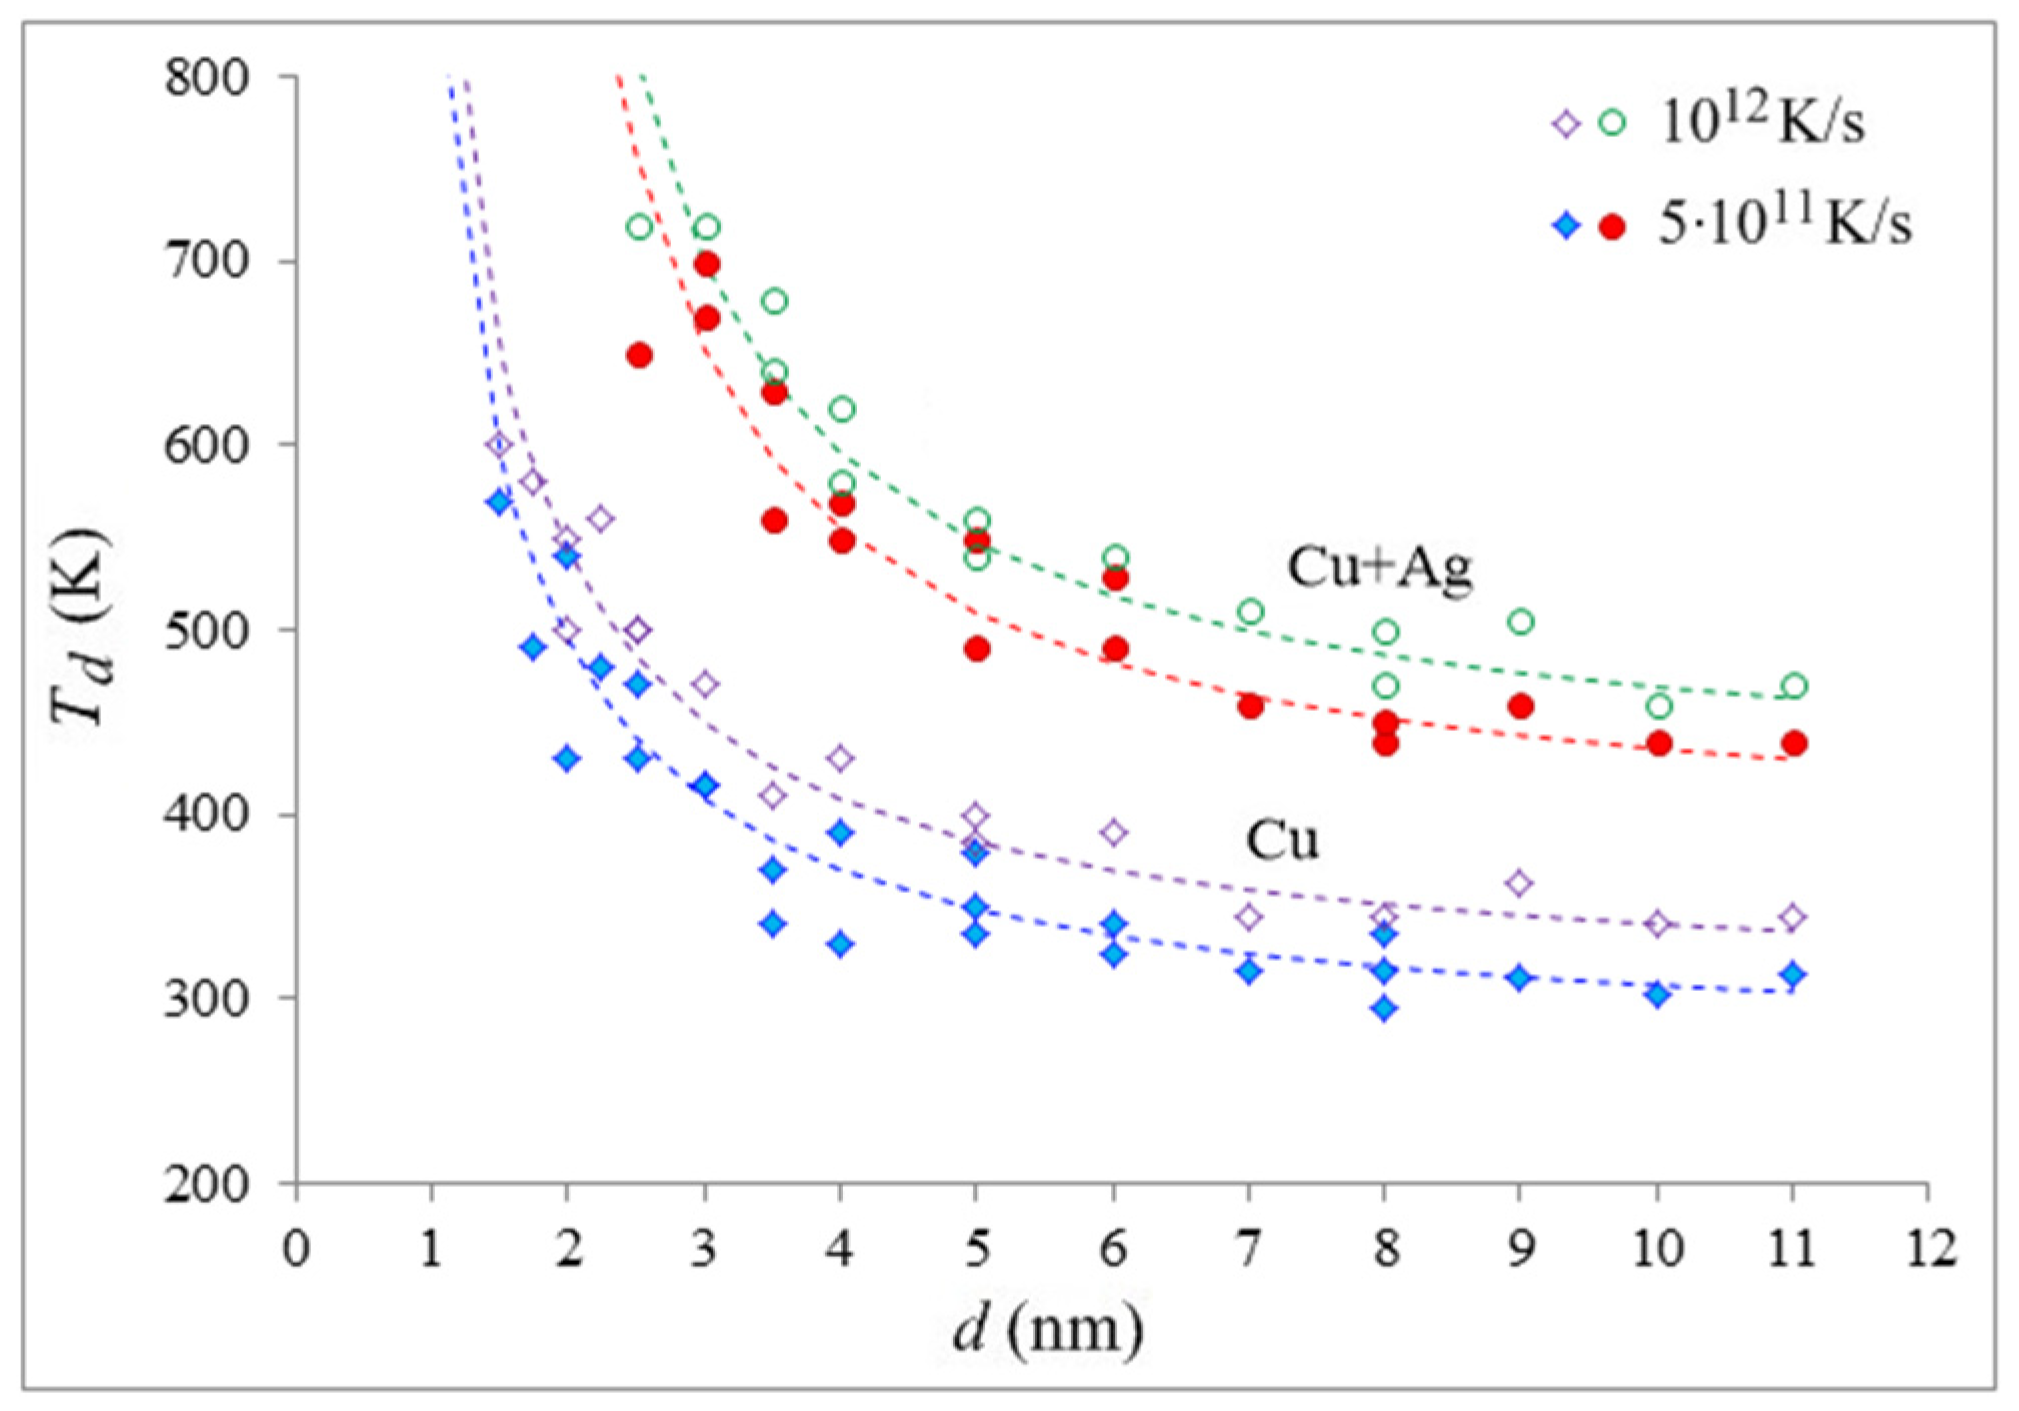
The approximation curves for the relationship between the devitrification temperature of copper nanoparticles in a vacuum and in a silver shell and their diameter were created using Formula (1) (dashed lines in
Figure 4). The markers in
Figure 4 show the values obtained in the model: filled—for a rate of 5 × 10
11 K/s, unfilled—for a rate of 10
12 K/s. As can be seen, the approximation curves and the data are in good agreement, providing evidence of the dominant role played by the interface (free surface or interphase boundary) in the devitrification process of the nanoparticles. The values for Formula (1) for the copper particles in a vacuum are as follows:
= 270 K,
= −360 K∙nm,
δ = 0.4 nm for a rate of 5 × 10
11 K/s, and
= 300 K,
= −390 K∙nm,
δ = 0.4 nm for a rate of 10
12 K/s. In a silver shell:
= 380 K,
= −490 K∙nm,
δ = 1.2 nm for a rate of 5 × 10
11 K/s, and
= 400 K,
= −590 K∙nm,
δ = 1.0 nm for a rate of 10
12 K/s.
As can be seen, the effect of the silver shell on the devitrification temperature of the copper particles is quite strong. For the considered particle sizes, the difference in the devitrification temperatures without a shell and with a shell ranged from about 130 K to 250 K, depending on the copper particle diameter—the temperature difference increased with the decreasing copper particle diameter. When considering the diffusion zone and blurring the particle boundary, the value of δ increased by 0.8 nm at a heating rate of 5 × 10¹¹ K/s and by 0.6 nm at a rate of 1012 K/s, which approximately corresponds to the picture that was observed during the simulation.
The considered temperatures for diffusion in polycrystalline materials are relatively low, but it should be taken into account that the metals in the model were in an amorphous state, which is characterized by higher diffusion. In addition, part of the diffusion process occurred at the stage of creating a particle with a shell. To estimate the inter-diffusion that occurred at the Cu-Ag interface during the simulation, we used the fraction of dissolved copper atoms in silver. Using it to estimate the diffusion coefficient in this case was inconvenient, since, in particular, when calculating it, it was difficult to separate inter- and self-diffusion. A Cu atom was considered dissolved if the number of Ag atoms in its immediate environment (within a radius of 3.7 Å) exceeded 50%. For heating from 100 to 800 K at a temperature change rate of 5 × 10¹¹ K/s, the fraction of dissolved atoms was, for example, 5.9% for a particle with a diameter of 8 nm and 13.5% for a 3 nm particle.
Figure 4 illustrates that the onset temperature of devitrification is also dependent on the heating rate: as the rate increases, the devitrification temperature increases. Homogeneous crystallization is typically divided into two key phases: the generation of stable crystalline nuclei and the propagation of the crystallization front. The first stage is a random process that necessitates a certain amount of time for the nuclei to develop, which will then begin to grow and initiate the second stage. This has also been discussed in works [
25,
43], which studied the process of devitrification in massive samples. An increase in the rate of temperature growth reduces the time that the system spends at a certain temperature and decreases the probability of stable nuclei formation.
The probabilistic nature of the crystallization process can cause its onset at noticeably different temperatures in experiments with similar conditions. This was the main reason for the error and deviation of the markers in
Figure 3 from the approximation curves.
The value in Formula (1), which is typically interpreted as the melting temperature of a massive sample when considering the melting of nanoparticles, was found to be different in our case for different heating rates and for particles in a vacuum and in a shell. The first is obviously explained by the previously described influence of the rate of the temperature change on the temperature of the onset of devitrification. However, the second is an interesting fact, indicating, apparently, that this value also depends on the phase transition mechanism. Below it will be shown that the mechanism of initiation and the occurrence of crystallization during devitrification for particles in a vacuum and in a shell is indeed fundamentally different.
The value , which determines the extent to which the particle interface affects the change in the devitrification temperature relative to the bulk material under identical conditions, also turned out to be different and depends on both the heating rate and the absence or presence of the shell. The value increases in the modulus with an increase in the heating rate and in the presence of a shell.
The value
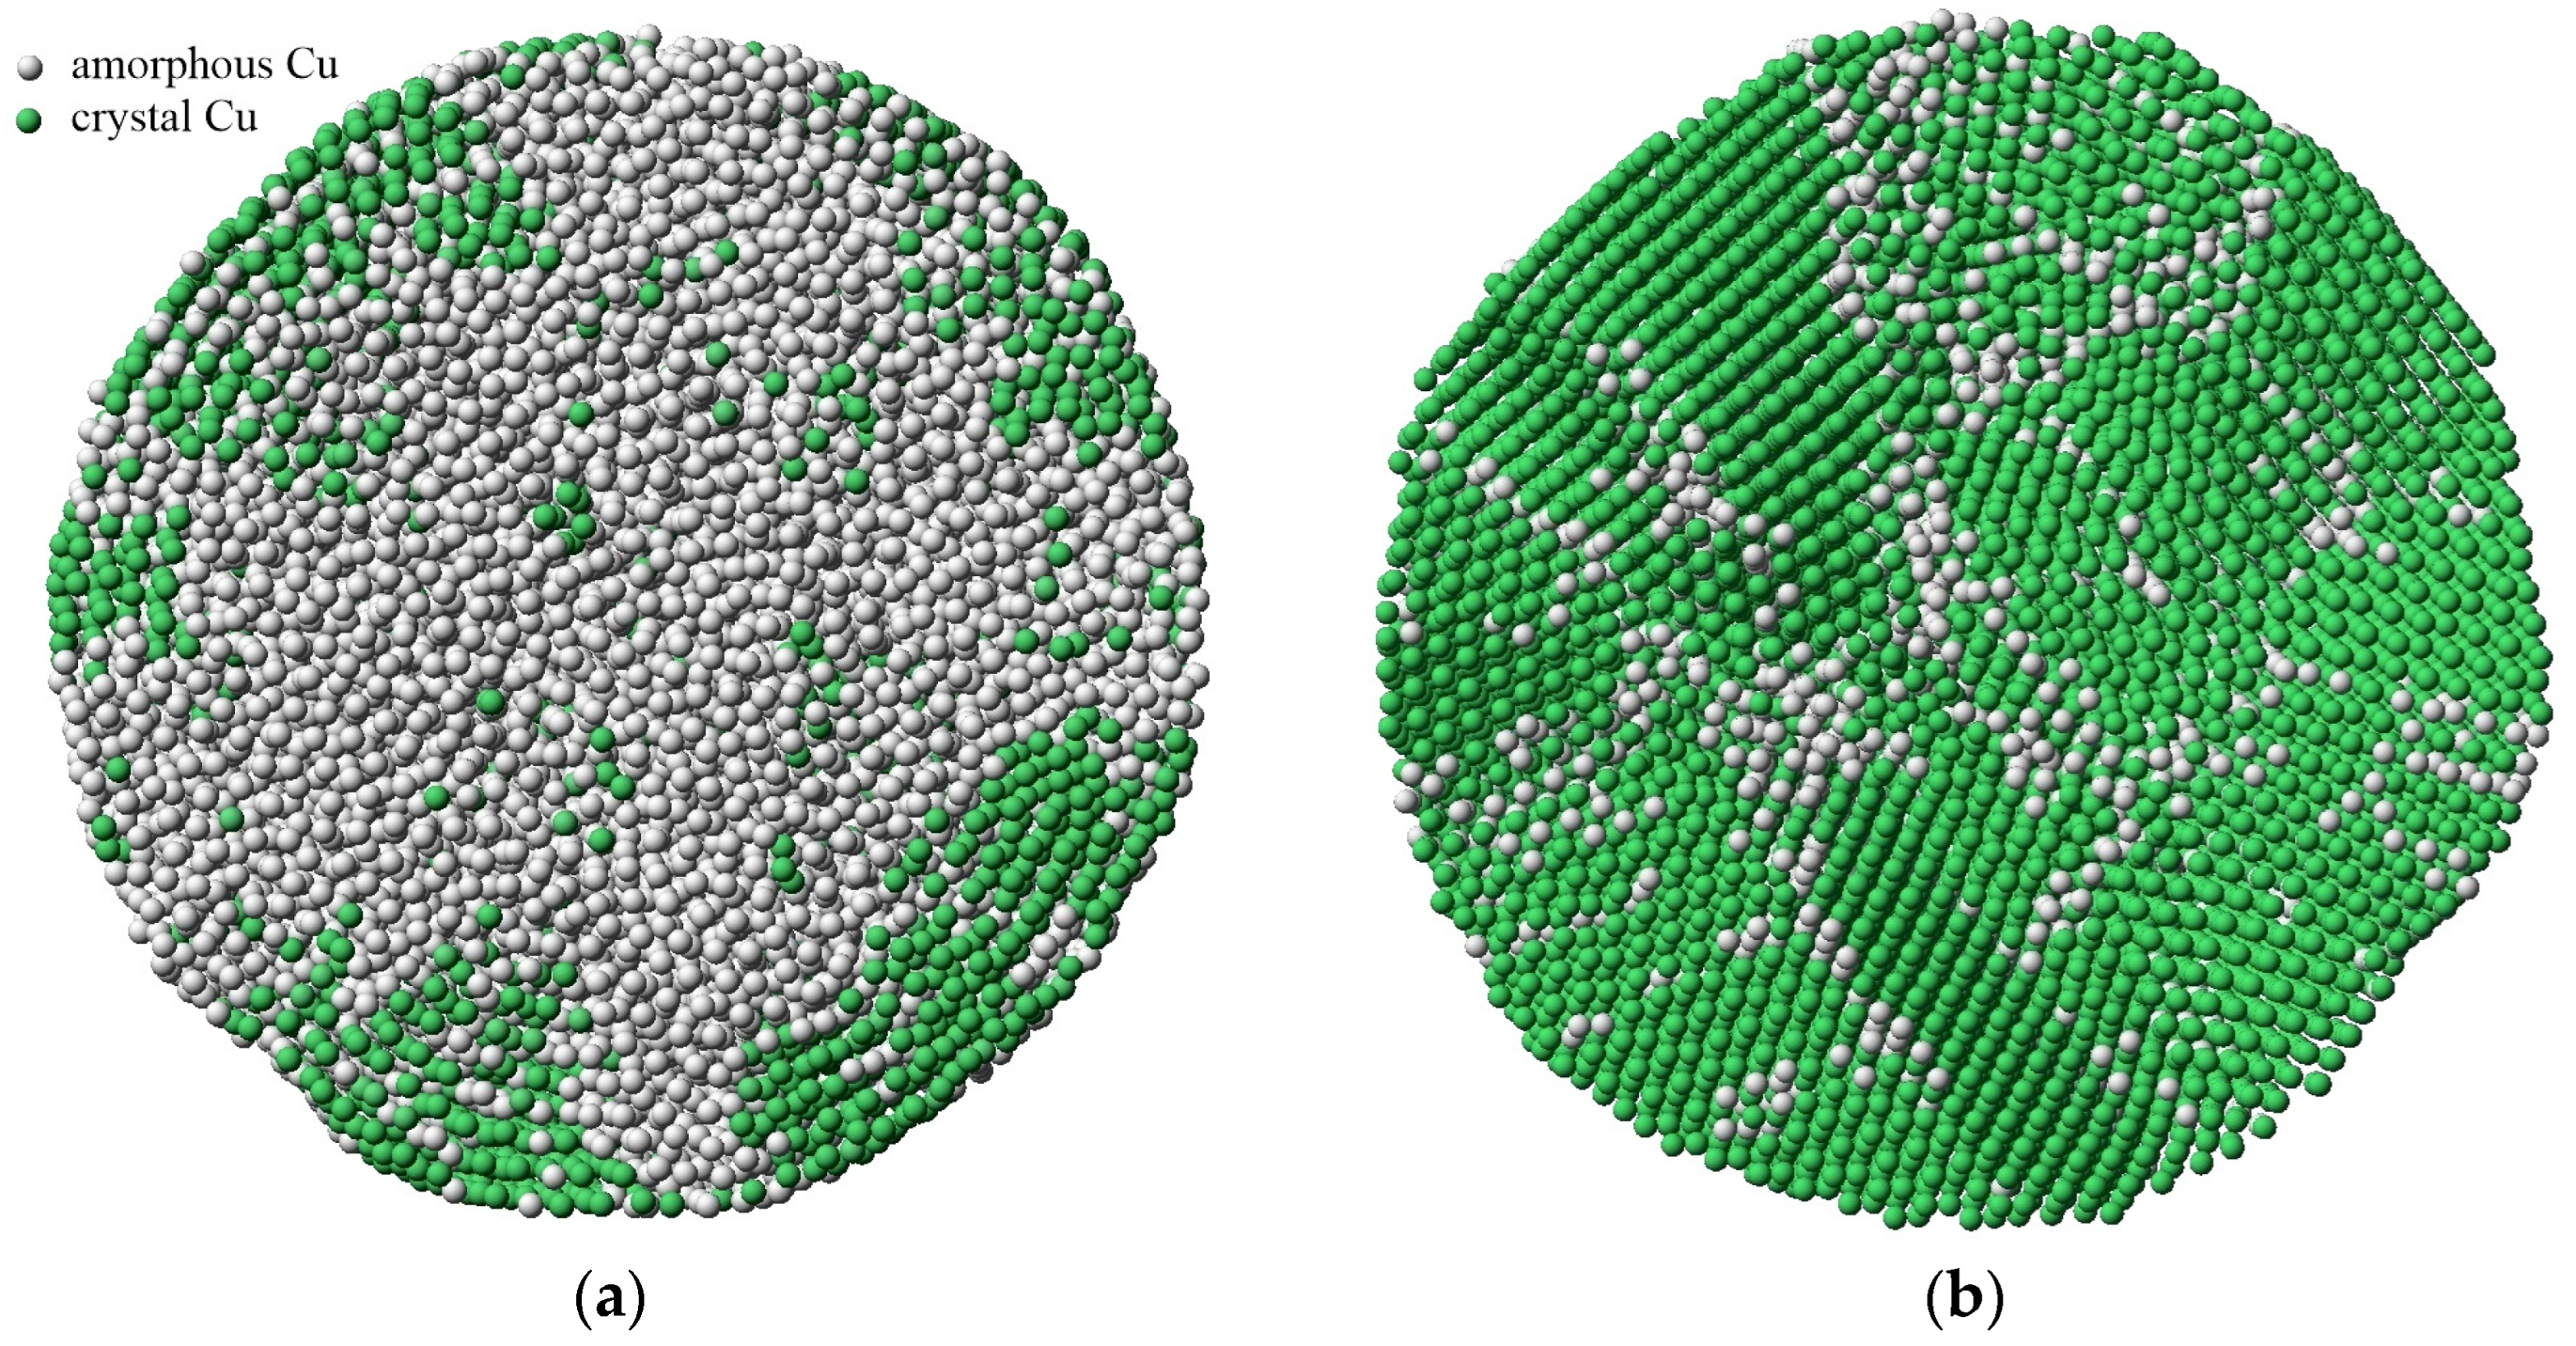
in the case of describing the dependence of the devitrification temperature on the particle diameter turned out to be negative. Thus, if the melting temperature of nanoparticles decreases as the particle size decreases, the devitrification temperature, on the contrary, increases. This can be explained as follows. Potential wells in which atoms are located on the surface or near defects are less deep and wider, blurred due to the less regular arrangement of neighboring atoms, thermal vibrations, and diffusion. Therefore, the presence of defects and interfaces reduces the probability of the nucleation of the centers (nuclei) of crystallization. However, on the other hand, their formation requires the presence of a certain mobility of atoms, that is, self-diffusion, which is just more intense near the surface. This is clearly seen in
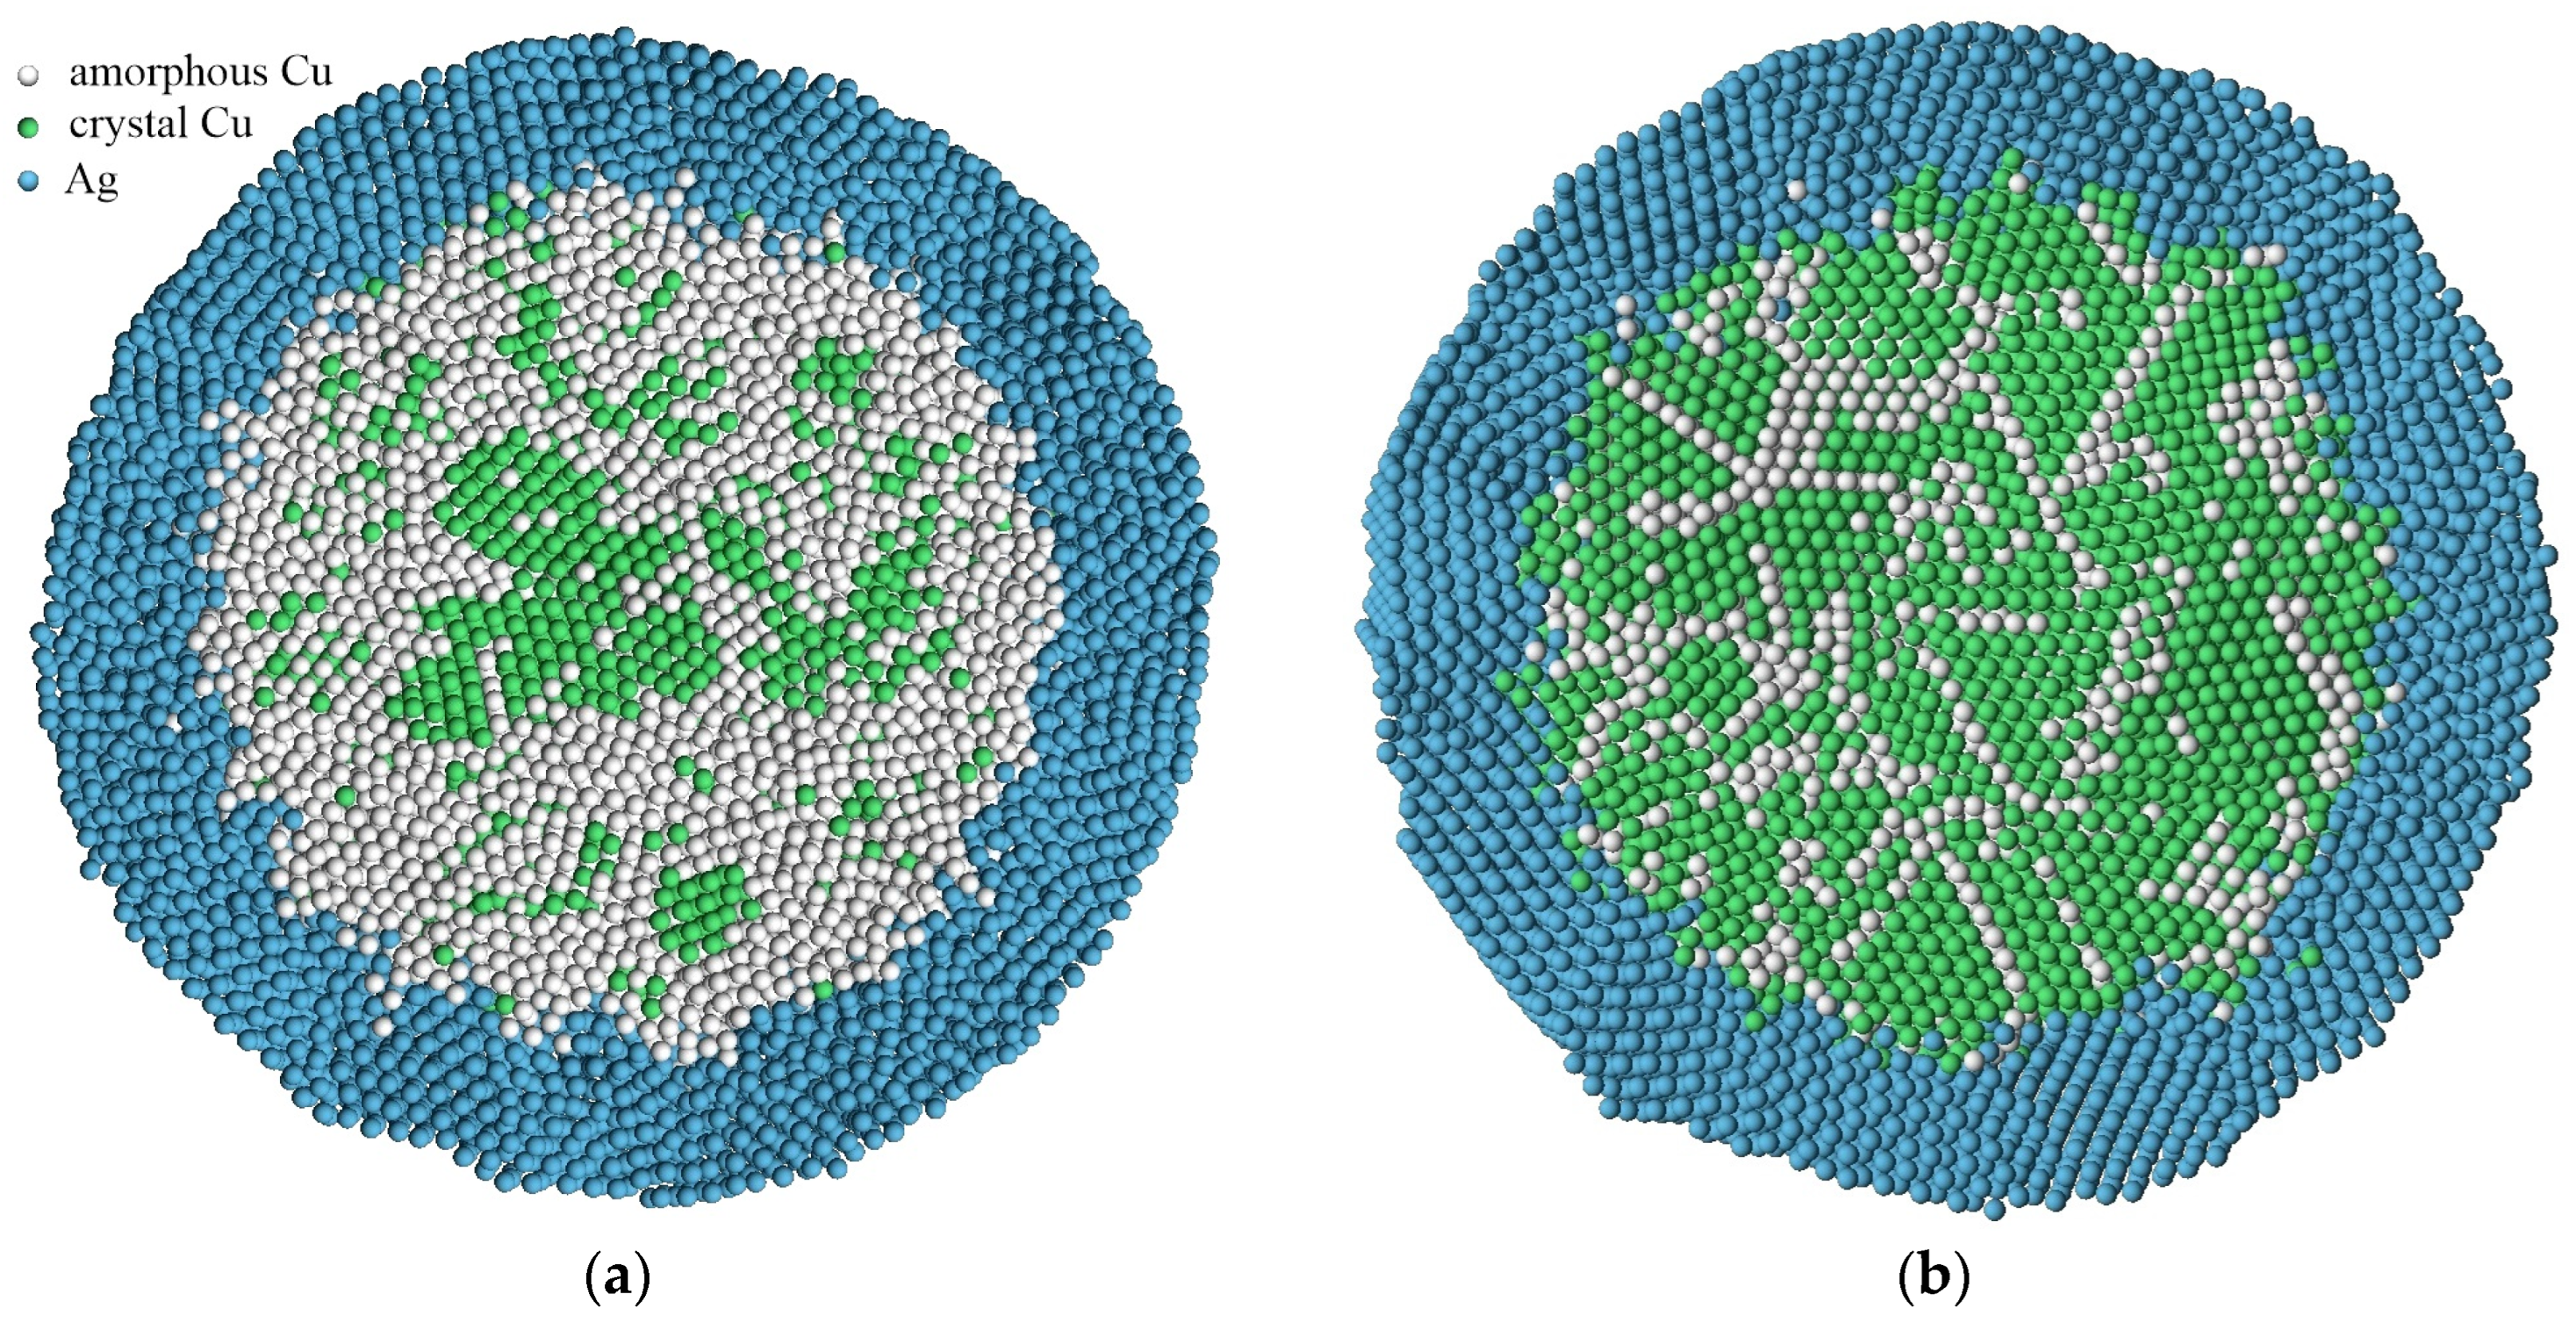
Figure 5, where the mechanism of crystallization during devitrification was studied using common neighbor analysis (CNA). This visualizer analyzes the location of neighboring atoms to determine the crystal structure to which each atom belongs.
Figure 5 clearly shows that during the devitrification, the nucleation of the crystal structure occurs from the surface, which is explained by the relatively large contribution of self-diffusion near the surface in this case. As seen in the given example, a polycrystalline structure with a high density of grain boundaries forms after crystallization in the volume of the particle. Upon subsequent relaxation at a sufficiently high temperature, the density of defects is expected to decrease due to recrystallization, grain growth, and the displacement of defects to the free surface.
The formation of a polycrystalline structure with grain boundaries inside nanoparticles has also been experimentally observed during the rapid crystallization of gold nanoparticles [
4], as well as during the molecular dynamics modeling of the crystallization of nickel [
14,
16] and iron [
15] nanoparticles.
In the case of the presence of a silver shell, the devitrification mechanism changed dramatically (
Figure 6). Crystallization nuclei are formed in the volume of the “core” of the copper particle, rather than near the interface as in the absence of a shell. Here, the factor of the high mobility of atoms near the boundary disappears, and the formation of relatively deeper and narrower potential wells in the volume of the “core” of the particle comes to the fore. In addition, the strong difference between the lattice parameters of copper and silver, as well as the presence of a diffusion zone, lead to the smearing of potential wells for copper atoms and a reduction in the likelihood of crystallization nuclei forming near the interface.
The result obtained, that is, an increase in the temperature range for the existence of an amorphous phase of metal nanoparticles in the shell of another metal, can apparently be qualitatively extended to other binary systems. Moreover, a greater influence of the shell on the increase in the devitrification temperature should be expected with a greater difference in the radii of the atoms of the two metals, as well as with greater mutual diffusion.


 ,
, 