Abstract
In recent years, with the development of science and technology, the strategic position of germanium is becoming more and more important, and the global demand for germanium is also increasing. At present, there is no unified description of the existence form of germanium in solutions. Based on the current mainstream acid leaching process of germanium, this paper studies the existing form and properties of germanium in sulfuric acid solutions. Through the characterization and analysis of Raman, FTIR, and XPS of three concentrations of pure germanium solution, it is clear that germanium mainly exists in the form of H2GeO3 and some Ge4+ in sulfuric acid solution. Through the Tyndall effect and zeta potential, it is determined that H2GeO3 exists in the form of colloid in sulfuric acid solution. With the increase of germanium concentration, H2GeO3 will polymerize in a sulfuric acid solution to form polygermanic acid, and the H2GeO3 colloidal dispersion system becomes more stable. This study clarifies the existing form and properties of germanium in sulfuric acid solution, which is of great significance to the leaching extraction of germanium-containing materials and the development of the germanium industry.
1. Introduction
As a kind of strategic dispersed metal, germanium is widely used in national defense, communications, electronics, aerospace, solar cells, medicine, metallurgy, semiconductors, and other fields [1,2,3,4,5]. Germanium is one of the key materials supporting the development of modern high technology; the European Union and the United States, among other developed countries, have attached great importance to the development and utilization of germanium resources by classifying germanium as a key mineral catalog in 2017 and 2018, respectively. China listed germanium as a national strategic reserve resource as early as 2011 [6,7,8,9]. In particular, with the progress and development of science and technology, the application fields and scopes of germanium have become wider and wider. Some scholars also predict that the shortage of germanium resources will become increasingly prominent in 2025 [9]. Although germanium is so important, there is almost no independent germanium deposit in nature. Due to the iron affinity of germanium, Ge4+ will replace and coexist with iron-philic elements such as Fe3+, Ti4+, Cr3+, and Sn4+. The sulfur affinity of germanium enables germanium to be enriched in certain sulfides. Therefore, germanium often exists in the form of associated minerals in lead–zinc sulfide and lead–zinc oxide, coal, and copper mines [3,10,11]. In China, germanium mainly comes from lead–zinc ore. As a by-product of lead–zinc smelting, zinc oxide dust is an important secondary resource for extracting germanium. At present, the main process of extracting germanium from zinc oxide dust in the industry is the atmospheric sulfuric acid leaching method. The leaching efficiency of germanium is generally between 60% and 75% [12]. There are many reasons for the low leaching rate of germanium in dust, such as the uneven distribution of germanium in dust and the formation of lead sulfate during the leaching process, which makes it difficult for sulfuric acid to continue to react with internal substances. The main leaching process of zinc oxide dust in the industry is sulfuric acid leaching. However, there is no clear explanation for the existence and properties of germanium in sulfuric acid solutions, which not only restricts the further research on the sulfuric acid leaching process of dust but also hinders the improvement of the germanium leaching rate.
At present, the research on the occurrence state of germanium mainly focuses on germanium in minerals. For example, it is currently believed that germanium is enriched in sulfides and sulfates because germanium can form sulfur germanates in the form of GeS32−and GeS44−, similar to those entering sulfur-bearing minerals [3,13,14]. Because of the affinity between germanium and iron, germanium is also enriched in iron compounds. Some studies suggest that Ge replaces Fe in the hexahedral metal sites of magnetite, Ge replaces Fe in the octahedral metal sites of hematite and goethite, and the Ge in magnetite may be coupled with Fe by Ge(IV) + Fe(II) = 2Fe(III) exchange; the germanium in hematite may occur by coupling with iron to replace 2Fe(III) = Ge(IV) + Fe(II), similar to the coupling replacement of titanium and iron in ilmenite. The germanium in goethite may be replaced by the coupling of Fe(III) + H(I) = Ge(IV), losing a H atom from the OH group [3,10,15]. At present, there is no unified conclusion on the specific existing form of germanium in coal. It is generally believed that germanium in coal is contained in macromolecular components [3,16]; some researchers believe that germanium in coal exists in the form of humic acid complexes. It is also believed that germanium exists in coal in the form of a single organic compound, or on the surface of organic matter in coal due to surface redox reaction and surface adsorption [3,15,16,17,18].
At present, there is no unified description of the existence form of germanium in solutions [19]. B. Marchon [20] and V.A. Nazarenko [21] proposed the existence of Ge(IV) cations in acidic solutions with pH = 0.2–1.5, such as (Ge4+, Ge(OH)3+, Ge(OH)22+, Ge(OH)3+). However, Bernstein [15] and Pokrovski et al. [22] questioned this. They believed that the results did not provide an accurate stability estimate of Ge(IV) cation species. Even if these species exist, they only exist in very acidic solutions. Pokrovski [22] believes that germanium exists in the form of germanium hydroxide (Ge(OH)4) due to the high redox potential of most hydrothermal and surface environments, and the ionization products of Ge(OH)4 in most natural fluids basically exist in the form of xGeO2·yH2O.
At present, the research on the existing form of germanium mainly focuses on germanium in minerals, while the research on the existing form of germanium in solutions is still relatively lacking. In order to eliminate the interference of other impurity ions as much as possible, this paper uses the self–configured pure germanium solution to study the existence form and properties of germanium in a sulfuric acid solution. The main forms of germanium in a sulfuric acid solution were determined by Raman, FTIR, XPS, and other microscopic characterization methods, combined with the E–pH diagram of the Ge–S–H2O system. Some properties of the main forms of germanium in sulfuric acid solution were determined by combining two macroscopic and microscopic analyses of the Tyndall effect, nanoparticle size, and Zeta potential. It provides a theoretical basis for the future research on the efficient extraction of germanium and provides assistance for promoting the sustainable development of the germanium industry, the development of high tech in China, and national defense security.
2. Materials and Methods
2.1. Experimental Design
In order to accurately explore the existing form and properties of germanium in a sulfuric acid solution and eliminate the interference of other impurity elements as much as possible, this experiment used a self-configured pure germanium solution for research. The reagents used in this experiment are high purity substances, including germanium dioxide, sodium hydroxide, concentrated sulfuric acid, and deionized water. Because the solubility of GeO2 in sulfuric acid is small, and with the increase of sulfuric acid concentration, the solubility of GeO2 will gradually decrease. Therefore, in this experiment, sodium hydroxide solution was used to dissolve GeO2, and concentrated sulfuric acid was added to adjust the pH of the solution. The reaction involved is presented as follows [10,23]:
2NaOH + GeO2 = Na2GeO3 + H2O
Na2GeO3 + H2SO4 = H2GeO3 + Na2SO4
GeO2 + 2H2SO4 = Ge(SO4)2 + 2H2O
Ge4+ +2H2SO4 = Ge(SO4)2 + 4H+
The specific operation process of configuring a pure germanium solution is as follows: Firstly, the required sodium hydroxide solution is prepared with deionized water and a certain amount of sodium hydroxide. Then, GeO2 of the required quality is added into the configured sodium hydroxide solution, which can be stirred appropriately to accelerate the dissolution of GeO2. Next, the concentrated sulfuric acid is gradually dropped into the germanium liquid according to the required acidity, and the pH of the germanium liquid is adjusted to 1 (the concentration of sulfuric acid is 30 g/L), and the constant volume is used for reserves. Three kinds of germanium in different concentrations were prepared by the above method: 50 mg/L, 500 mg/L and 1 g/L.
2.2. Testing Equipment
The phase form of germanium in germanium solution was detected by Raman spectrometer (HORIBA Scientific LabRAM HR Evolution, HORIBA, Villeneuve d’Ascq, France). The functional group types of germanium in germanium solution were detected by Fourier transform infrared spectrometer (FT-IR, Thermo Scientific IN10, Thermo Scientific, Waltham, MA, USA). The valence state of germanium in germanium solution was measured by X-ray photoelectron spectroscopy (XPS, Thermo Scientific K-Alpha, Thermo Scientific, Waltham, MA, USA). The analysis process is as follows: Firstly, part of the germanium solution is dropped onto the silicon wafer, dried under infrared light, and placed in the sample chamber. When the pressure in the sample chamber is less than 2.0 × 10⁻⁷, the sample is sent to the analysis chamber. The spot size is 400 μm, the operating voltage is 12 kV, and the filament current is 6 mA. The full scan energy is 150 eV and the step size is 1 eV. The detection is performed at a narrow spectrum scan of 50 eV with an energy and step size of 0.1 eV. The particle size and Zeta potential of germanium solution were measured by nano particle size and Zeta potential analyzer (Malvern Zetasizer Nano ZS90, Malvern, UK).
3. Results and Discussion
3.1. The States of Germanium
3.1.1. E–pH Diagram Simulation
According to the relevant literature [10,24] and the Factsage 7.0 software database (GTT–Technologies, Herzogenrath, Germany), the Pourbaix diagram of the Ge–S–H2O system is drawn, and the results are shown in Figure 1. From the Pourbaix diagram of the Ge–S–H2O system, the preferred physical state of germanium at different pH and redox potentials can be seen. The reaction equations involved in the Pourbaix diagram are shown in Table 1.
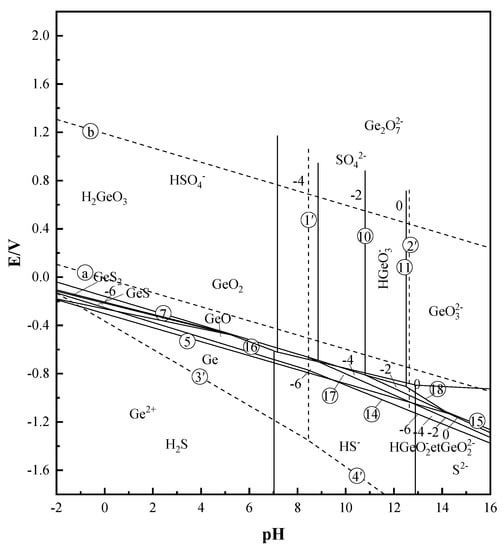
Figure 1.
E–pH diagram of Ge–S–H2O system (T = 25 °C).

Table 1.
Reaction equation of Figure 1.
From the E–pH diagram of the Ge–S–H2O system in Figure 1, it can be seen that various forms of germanium in the solution system have their own stable regions, and the phase morphology of germanium is closely related to the solution potential and the pH value of the reaction system. Therefore, the pH value and potential of the solution can be used to determine the stable range of different germanium phases in the solution, and then determine the main phase form of germanium in the solution. The potential pH meter was used to measure the potential of the three different concentrations of pure germanium solutions of 50 mg/L, 500 mg/L, and 1 g/L. After the measurement was completed, it was determined that the potential range of the three different concentrations of germanium solution was between 0.371–0.413 V. According to the measured potential range of the three different concentrations of germanium solution, the E–pH diagram of the Ge–S–H2O system in Figure 1 was compared and analyzed. It can be determined that in the potential range of 0.371–0.413 V, the stable phase form of germanium in the sulfuric acid system (pH = 1) is H2GeO3. The stable phase of sulfur is HSO4−. Therefore, combining the measured potential with the Pourbaix diagram of the Ge–S–H2O system, it can be preliminarily judged that germanium mainly exists in the form of H2GeO3 in the sulfuric acid solution system (pH = 1).
In order to verify that germanium exists in the form of H2GeO3 in the sulfuric acid solution, Raman, FT–IR, and XPS analysis were performed on three different concentrations of germanium solution to explore the molecular bonds and molecular structure of the germanium phase in the sulfuric acid solution (pH = 1) and further clarify the existing form of germanium in the sulfuric acid solution.
3.1.2. Raman Spectra Analysis
The Raman spectra of 50 mg/L, 500 mg/L, and 1 g/L germanium solutions at pH = 1 were analyzed. The Raman spectra of 50 mg/L, 500 mg/L, and 1 g/L germanium solutions were shown in Figure 2a–c. Table 2 demonstrates the characteristic peaks corresponding to several common germanium-containing molecular bonds. Combined with Figure 2 and Table 2, it can be seen that the characteristic peaks near 430 cm−1 are attributed to the vibration scattering of the Ge–S bond [25,26,27], the characteristic peaks near 980 cm−1 are attributed to the symmetric stretching vibration of five–coordinate germanium non-bridge oxygen [28], and the bending vibration of H–O–H bond near 1600 cm−1 [29] and the characteristic peaks near 3410 cm−1 are attributed to crystal water [30]. It can be seen from Figure 2 that among the Raman spectra of three germanium liquids with different concentrations, only the Ge–S bond with vibration scattering near 430 cm−1 and the pentagonal germanium with non-bridgy-oxygen symmetric stretching vibration near 980 cm−1 are the molecular bonds containing germanium. Combined with the above potential pH diagram of the Ge–S–H2O system and Equations (1)–(4), the peaks near 430 cm−1 and 980 cm−1 may correspond to Ge(SO4)2 and H2GeO3, respectively. Further analysis of Figure 2 shows that as the concentration of germanium solution increases from 50 mg/L to 1 g/L, the intensity of the characteristic peak near 980 cm−1 will also increase. This is because with the increase of germanium content in the germanium solution, more five-coordinate germanium will be generated in the sulfuric acid system. The content of five-coordinate germanium in the unit solution volume is significantly improved, which is manifested in the Raman spectrum that the intensity of the characteristic peak at the molecular bond position will increase.
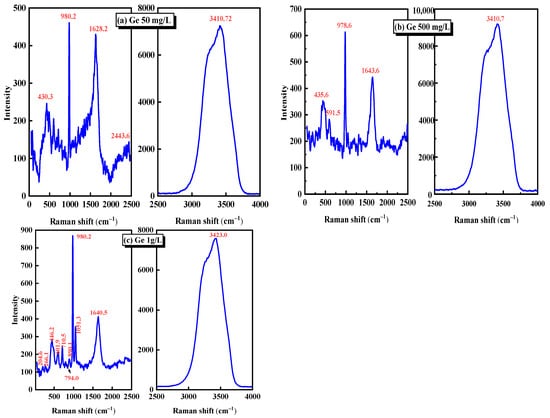
Figure 2.
Raman spectra of different germanium concentrations in sulfuric acid system (a) 50 mg/L, (b) 500 mg/L, (c) 1 g/L.
Table 2.
Characteristic frequency information of germanium Raman spectra (cm−1).
Through the Raman spectrum analysis of three different concentrations of germanium solution in Figure 2, it can be determined that in the sulfuric acid solution with pH = 1, the main forms of germanium may be H2GeO3 and Ge(SO4)2. However, since SO42− often exists in the form of ions in the acidic system, germanium may mainly exist in the form of H2GeO3 and some Ge4+ ions in the sulfuric acid solution with pH = 1. Through further analysis of three different concentrations of germanium solution, it is found that when the concentration of germanium solution increases from 50 mg/L to 1 g/L, the Raman peak intensity representing the H2GeO3 molecule in the Raman spectrum will increase.
In Raman spectroscopy, the characteristic peaks at different positions can represent specific molecular bonds. Table 2 [25,26,27,28,29,30,31,32,33,34] lists some Raman spectral characteristic peak data corresponding to germanium–containing molecular bonds.
3.1.3. FTIR Spectra Analysis
Fourier transform infrared spectroscopy and Raman spectroscopy complement each other and can identify structural features or characteristic groups. Fourier transform infrared spectroscopy was used to analyze the pure germanium solution with three different concentrations of 50 mg/L, 500 mg/L, and 1 g/L in the sulfuric acid system with pH = 1. The analysis diagram is shown in Figure 3. Table 3 shows the characteristic peaks of infrared spectra corresponding to several common germanium-containing functional groups. Combined with Table 3 and Figure 3, it can be seen that the characteristic peak at 3300–3450 cm−1 is attributed to the vibration absorption peak of Ge–OH [35]. The vibration peak in the range of 1630–1660 cm−1 should be the bending vibration peak of OH−1 or the O–H group and covalent bond functional group of adsorbed water [36]. The absorption peak between 650–780 cm−1 should be the bending vibration peak of Ge–O in the germanate. The vibration peak at 629 cm−1 should be attributed to the asymmetric stretching vibration peak of Ge–O–Ge, which is caused by the aggregation of GeO32−, which proves the formation of [GeO32−]n [37]. The absorption peak of sulfate is in the range of 1000–1200 cm−1, and the band at 1100 cm−1 in the infrared spectrum, can be attributed to S–O and sulfate in sulfonic acid group [38]. The absorption peak near 1980 cm−1 is related to the oscillation of Ge–H [39]. From the infrared spectrum of Figure 3, it can be seen that in the sulfuric acid system, germanium in a germanium solution mainly exists in the form of H2GeO3 molecules, and with the germanium solution concentration increased from 50 mg/L to 1 g/L, the relative strength of Ge–O–Ge valence bond increases. That is, it is easier to form polygermanic acid.
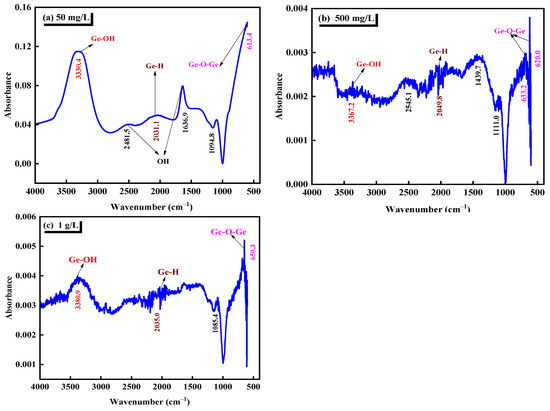
Figure 3.
Infrared spectra of different germanium concentrations in sulfuric acid system (a) 50 mg/L, (b) 500 mg/L, (c) 1 g/L.
Table 3.
Characteristic frequency information of germanium infrared spectrum (cm−1).
Through the Fourier infrared spectrum analysis of three different concentrations of germanium solution in Figure 3, it can be seen that in the sulfuric acid solution with pH = 1, germanium mainly exists in the form of H2GeO3 molecule. Through the further analysis of the Fourier infrared spectrum in Figure 3, it is determined that with the increase of the concentration of the germanium solution from 50 mg/L to 1 g/L, the asymmetric stretching vibration peak attributed to Ge–O–Ge in the Fourier infrared spectrum is more and more shifted, which may be due to the increase of the concentration of germanium solution. The increase of GeO32− content gradually aggregates to form [GeO32−]n. This is also corresponding to the above Raman spectrum analysis.
In the Fourier Transform infrared spectra, the characteristic peaks corresponding to different germanium-containing functional groups are shown in Table 3 [35,37,38,39].
3.1.4. XPS Spectroscopy Analysis
In order to verify the above analyses, Ge3d detail spectra is detected. This further clarifies the existing form of germanium in a sulfuric acid solution, which is shown in Figure 4. As can be seen from Figure 4, the XPS spectrum of Ge 3d is mainly composed of Ge 3dA, Ge 3dB, and Ge 3dC. Table 4 is the common XPS binding energy data of several germanium-containing phase peaks. By combining the XPS binding energy data in Table 4, it can be seen that germanium mainly exists in the form of Ge4+ ions in the solution, and Ge4+ mainly exists in the form of GeO32− and GeO44−. It can be seen from Figure 4 that the binding energies of the strongest main peak Ge 3dA at 50 mg/L and 500 mg/L are between 32–35 eV, and the strongest main peak Ge 3dB at 1 g/L is between 30–32 eV. This shows that in the sulfuric acid solution system, germanium mainly exists in the form of H2GeO3.
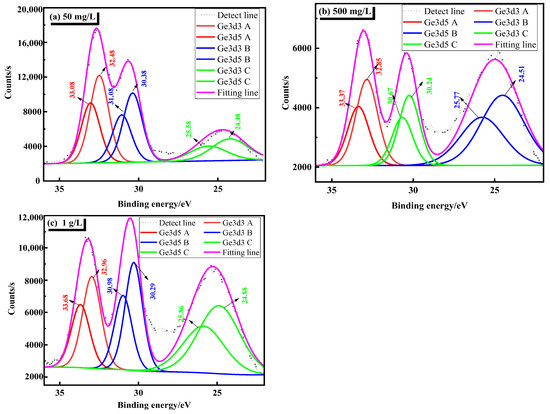
Figure 4.
Ge3d detail spectra of different germanium concentrations in sulfuric acid system (a) 50 mg/L, (b) 500 mg/L, (c) 1 g/L.
Table 4.
XPS binding energy of germanium phase.
In X-ray photoelectron spectroscopy, the valence states of germanium corresponding to different binding energies are shown in Table 4 [40,41,42,43,44,45,46,47,48,49,50,51,52,53].
Raman spectroscopy, Fourier transform infrared spectroscopy, and X-ray photoelectron spectroscopy were used to characterize and analyze the three different concentrations of pure germanium solutions of 50 mg/L, 500 mg/L, and 1 g/L. According to the analysis results, in the sulfuric acid solution system with pH = 1, germanium mainly exists in the form of H2GeO3 molecules and some Ge4+ ions. According to Raman spectroscopy and Fourier transform infrared spectroscopy, it can be seen that when the concentration of the germanium solution increases from 50 mg/L to 1 g/L, the content of H2GeO3 molecules in germanium solution will also increase and will gradually aggregate to form polygermanic acid.
3.2. The States of Germanium
3.2.1. Tyndall Phenomenon of Germanium Solution
The Tyndall effect is a commonly used method to distinguish solutions and colloids. When a beam of visible light passes through the colloid, a bright “pathway” phenomenon can be observed in the colloid from the direction perpendicular to the incident light. In order to explore whether H2GeO3 molecules in germanium solution are colloid-like substances, and to observe this phenomenon more intuitively, the Tyndall effect of different concentrations of germanium solution was observed.
Figure 5 is the Tyndall phenomenon of different germanium concentrations in the sulfuric acid system, which can be seen from Figure 5. In the sulfuric acid system, the three concentrations of pure germanium solutions have obvious “optical paths”. As the concentration of germanium increases, it can be found that the “optical paths” in the germanium solution will become thicker and more obvious. This shows that the content of H2GeO3 in a germanium solution increases with the increase of germanium concentration, which also corresponds to the conclusion of infrared spectroscopy. The increase in the content of H2GeO3 per unit volume will lead to the aggregation of GeO32− to form [GeO32−]n; the Tyndall effect is that the “optical paths” will become more obvious.
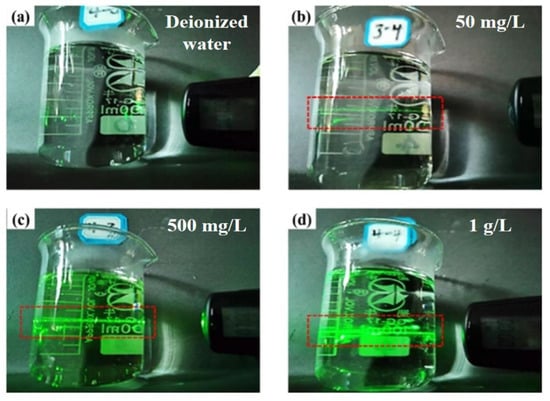
Figure 5.
Tyndall effect diagram of different concentrations of germanium in sulfuric acid system (a) deionized water, (b) 50 mg/L germanium solution, (c) 500 mg/L germanium solution, (d) 1 g/L germanium solution.
3.2.2. Nanoparticle Size and Zeta Potential
The colloids are fine particles with a particle size of 1 nanometer (nm) to 1 micrometer (μm), which are difficult to settle naturally like clay and usually negatively charged in water. The particle size of the germanium solution with three concentrations was analyzed by the nano particle size analyzer, and the results are shown in Figure 6. It can be found from Figure 6 that when the concentration of germanium solution is 50 mg/L, 500 mg/L, and 1 g/L, the particle sizes of H2GeO3 molecules in solution are 3.59 nm, 134 nm, and 200 nm, respectively. This shows that as the concentration of the germanium solution increases from 50 mg/L to 1 g/L, the H2GeO3 molecules in the germanium solution will gradually aggregate to form polygermanic acid, which is consistent with the results of the above Raman spectrum analysis and Fourier spectrum analysis. The increase of particle size also verifies the results of the Tyndall phenomenon, which again shows that germanium exists in colloidal form in sulfuric acid solution.
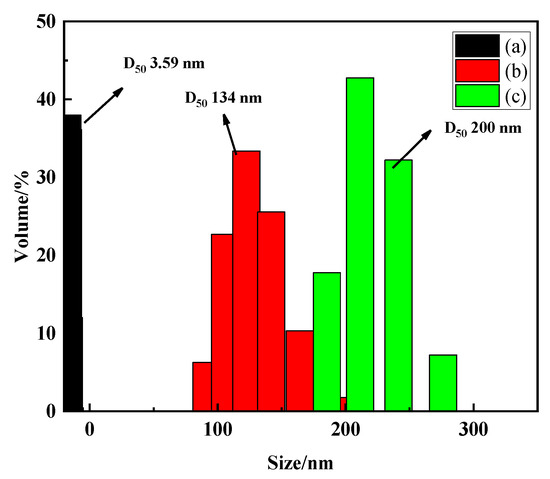
Figure 6.
Particle size in different concentrations of germanium-containing sulfuric acid solutions (a) 50 mg/L; (b) 500 mg/L; (c) 1 g/L.
Zeta potential is an important indicator to characterize the stability of colloidal dispersions. The absolute value of zeta potential indicates the stability of the colloidal dispersion system. The higher the absolute value is, the better the stability of colloidal dispersion system is, as shown in Figure 7a. In order to explore the stability of the colloidal dispersion system in germanium solution with pH = 1, the Zeta potential analysis of a germanium solution with 50 mg/L, 500 mg/L, and 1 g/L was carried out. The results are shown in Figure 7b. It can be seen from Figure 7 that the Zeta potential is negative, which indicates that the colloidal particles are negatively charged as a whole, and the surface of the germanium-containing colloid is negatively charged, again verifying that germanium exists in the form of H2GeO3. At the same time, with the increase of germanium concentration, the absolute value of Zeta potential also increases, from 1.57 to 8.98. That is, a greater repulsive force between particles indicates that with the increase of germanium solubility, the H2GeO3 colloid will be more dispersed and not easy to agglomerate, while the colloidal dispersion system in germanium solution will be more stable.
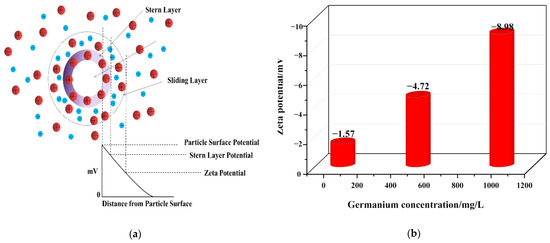
Figure 7.
Zeta potential of germanium solution with different concentrations in sulfuric acid system (a) is the Zeta potential diagram, (b) is the Zeta potential diagram of three germanium concentrations.
Based on the Tyndall phenomenon and nanoparticle size–zeta potential analysis, germanium exists in the form of negatively charged colloidal particles in the sulfuric acid solution. With the increase of germanium concentration from 50 mg/L to 1 g/L, the size of colloidal particles increased from 3.59 nm to 200 nm, and the Zeta potential decreased from −1.57 mV to −8.98 mV. In addition, according to the results of the nano-particle size and Zeta potential, with the increase of germanium concentration, the collision of local particles is intensified, and the H2GeO3 molecules will gradually agglomerate to form polygermanic acid. At the same time, the repulsion between polygermanic acid molecules will gradually increase, making it difficult for the formed polygermanic acid to continue to agglomerate and precipitate and then exist in the form of colloid.
4. Conclusions
At present, there is no unified description of the existing form of germanium in an aqueous solution. Based on the acid-leaching extraction process of germanium-containing materials, this paper studies the existing state and properties of germanium in a sulfuric acid solution system. The existing form of germanium was determined by the characterization of three concentrations of pure germanium solution, and the properties of the main forms of germanium in sulfuric acid solution were verified by the Tyndall effect and nano-zeta potential. The results of the characterization analysis show that the main form of germanium in sulfuric acid solutions is H2GeO3 and part of Ge4+. With the increase of the germanium concentration from 50 mg/L to 1 g/L in a sulfuric acid solution, the size of H2GeO3 colloidal particles increased from 3.59 nm to 200 nm, and the zeta potential decreased from −1.57 mV to −8.98 mV, indicating that the dispersion of H2GeO3 colloidal particles was more stable with the increase of germanium concentration. This study is of great value for improving germanium leaching and further recovering germanium from germanium-containing solutions.
Author Contributions
Conceptualization, Methodology, Validation, Formal analysis, Investigation, Writing—original draft, Visualization; L.S.; Methodology, Formal analysis, Writing—original draft, Visualization; H.D.; Conceptualization, Methodology, Validation, Resources, Writing—original draft, Visualization, Supervision; M.L.; Methodology, Validation, Resources, Visualization, Supervision; Y.H.; Methodology, Validation, Resources, Visualization, Supervision; Y.Z.; Conceptualization, Methodology, Re sources, Supervision, Project administration, Funding acquisition; K.Y.; Conceptualization, Methodology, Resources, Supervision, Project administration, Funding acquisition; L.Z. All authors have read and agreed to the published version of the manuscript.
Funding
This work was financially supported by National Natural Science Foundation of China [grant number 51974141], Major Science and Technology Project of Yunnan Province [grant number 202202AB080005], Yunnan Fundamental Research Projects [202301AT070480], and Yunnan Applied Basic Research Projects [202101AT070280].
Institutional Review Board Statement
Not applicable.
Informed Consent Statement
Not applicable.
Data Availability Statement
Not applicable.
Conflicts of Interest
The authors declare no conflict of interest.
References
- Kaji, M. DI Mendeleev’s concept of chemical elements and the principles of chemistry. Bull. Hist. Chem. 2002, 27, 4–16. [Google Scholar]
- Depuydt, B.; Theuwis, A.; Romandic, I. Germanium: From the first application of Czochralski crystal growth to large diameter dislocation-free wafers. Mater. Sci. Semicond. Process. 2006, 9, 437–443. [Google Scholar] [CrossRef]
- Hu, R.Z.; Su, W.C.; Qi, H.W.; Bi, X.W. Geochemistry, occurrence and mineralization of germanium. Bull. Mineral. Petrol. Geochem. 2000, 19, 215–217. [Google Scholar]
- Zhang, M.; Gu, X.; Fu, S.; Si, R.; Li, F. A Review of Disperse Element Germanium. Bull. Mineral. Petrol. Geochem. 2003, 1, 82–87. [Google Scholar]
- Dass, D. Effects of surface passivation by hydrogen on the structural and electronic properties of a germanium nanowire: A sp3 tight binding study. Appl. Surf. Sci. 2019, 488, 404–417. [Google Scholar] [CrossRef]
- Zhang, X.; Bu, Z.; Lin, S.; Chen, Z.; Li, W.; Pei, Y. GeTe thermoelectrics. Joule 2020, 4, 986–1003. [Google Scholar] [CrossRef]
- Huang, T.; Cao, Q.; Jing, B.; Wang, X.; Wang, D.; Liang, L. Towards high-performance lithium-sulfur battery: Investigation on the capability of metalloid to regulate polysulfides. Chem. Eng. J. 2022, 430, 132677. [Google Scholar] [CrossRef]
- Wang, P.; Chen, L.Y.; Ge, J.P.; Cai, W.; Chen, W.Q. Incorporating critical material cycles into metal-energy nexus of China’s 2050 renewable transition. Appl. Energy 2019, 253, 113612. [Google Scholar] [CrossRef]
- Chen, X.; Qu, J.; Zhang, Y.; Wu, L.; Wang, L. Analysis of the global germanium resource supply and demand situation from 2021 to 2035. China Min. Mag. 2021, 30, 37–42. [Google Scholar]
- Wang, J.; He, A. Xiandai Zhe Yejin; Metallurgical Industry Press: Beijing, China, 2005. [Google Scholar]
- Shen, Z.; Cai, S.; Zhao, J. Current Situation and Sustainable Development Suggestions of Germanium Resources in China. Min. Res. Dev. 2015, 35, 108–112. [Google Scholar]
- Gu, L. Experimental study on increasing germanium leaching rate from zinc oxide dust. China Min. Mag. 2020, 29 (Suppl. S1), 419–421+424. [Google Scholar]
- Höll, R.; Kling, M.; Schroll, E. Metallogenesis of germanium—A review. Ore Geol. Rev. 2007, 30, 145–180. [Google Scholar] [CrossRef]
- Li, W. The Recovery of Germanium from the Pb and Zn Sulfide Concentrate. Master’s Thesis, Central South University, Changsha, China, 2004. [Google Scholar]
- Bernstein, L.R.; Waychunas, G.A. Germanium crystal chemistry in hematite and goethite from the Apex Mine, Utah, and some new data on germanium in aqueous solution and in stottite. Geochim. Cosmochim. Acta 1987, 51, 623–630. [Google Scholar] [CrossRef]
- Hu, R.Z.; Bi, X.W.; Su, W.C.; Ye, Z.J. Some considerations on germanium mineralization in coal-as exemplified by Lincang germanium deposit. Acta Miner. Sin. 1997, 4, 364–368. [Google Scholar]
- Li, J.; Zhuang, X.; Querol, X. Trace element affinities in two high-Ge coals from China. Fuel 2011, 90, 240–247. [Google Scholar] [CrossRef]
- Hu, R.Z.; Qi, H.W.; Zhou, M.F.; Su, W.C.; Bi, X.W.; Peng, J.T.; Zhong, H. Geological and geochemical constraints on the origin of the giant Lincang coal seam-hosted germanium deposit, Yunnan, SW China: A review. Ore Geol. Rev. 2009, 36, 221–234. [Google Scholar] [CrossRef]
- Geng, X.; Liu, Y.; Zhang, W.; Wang, L.; Wen, J.; Sun, J. Recent advances in the recovery of germanium during the zinc refining process. Chem. Eng. J. 2022, 446, 137445. [Google Scholar] [CrossRef]
- Marchon, B.; Cote, G.; Bauer, D. Some typical behaviours of the β-dodecenyl 8-hydroxyquinoline through its reactions with germanium (IV). J. Inorg. Nucl. Chem. 1979, 41, 1353–1363. [Google Scholar] [CrossRef]
- Nazarenko, V.A.; Andrianov, A.M. Complex compounds of germanium and its state in solution. Russ. Chem. Rev. 1965, 34, 547. [Google Scholar] [CrossRef]
- Pokrovski, G.S.; Schott, J. Thermodynamic properties of aqueous Ge (IV) hydroxide complexes from 25 to 350 C: Implications for the behavior of germanium and the Ge/Si ratio in hydrothermal fluids. Geochimica Cosmochimica Acta 1998, 62, 1631–1642. [Google Scholar] [CrossRef]
- Wang, Z. Dictionary of Chemical Technology; Chemical Industry Press: Beijing, China, 1992. [Google Scholar]
- Liu, C.X.; Wang, J.K.; Shen, Q.F. Electrochemical behavior of germanium in zinc deposition from acidic electrolytes. Chin. J. Nonferrous Met. 2009, 19, 1690–1694. [Google Scholar]
- Arai, K. Observation of chemical reaction and liquid structure of S Ge by Raman spectroscopy. J. Non Cryst. Solids 1983, 59, 1059–1062. [Google Scholar] [CrossRef]
- Volodin, V.A.; Krivyakin, G.K.; Ivlev, G.D.; Prokopyev, S.L.; Gusakova, S.V.; Popov, A.A.E. Crystallization of amorphous germanium films and multilayer a-Ge/a-Si structures upon exposure to nanosecond laser radiation. Semiconductors 2019, 53, 400–405. [Google Scholar] [CrossRef]
- Bermejo, D.; Cardona, M. Raman scattering in pure and hydrogenated amorphous germanium and silicon. J. Non Cryst. Solids 1979, 32, 405–419. [Google Scholar] [CrossRef]
- Henderson, G.S. The Germanate Anomaly: What do we know? J. Non Cryst. Solids 2007, 353, 1695–1704. [Google Scholar] [CrossRef]
- Tominaga, Y. Raman Scattering of Liquid Water and Hydrogen-Bonded Cluster. Nihon Kessho Gakkaishi 1998, 40, 95–100. [Google Scholar] [CrossRef]
- Eom, H.J.; Gupta, D.; Cho, H.R.; Hwang, H.J.; Hur, S.D.; Gim, Y.; Ro, C.U. Single–particle investigation of summertime and wintertime Antarctic sea spray aerosols using low-Z particle EPMA, Raman microspectrometry, and ATR-FTIR imaging techniques. Atmos. Chem. Phys. 2016, 16, 13823–13836. [Google Scholar] [CrossRef]
- Choi, S.; Han, S.; Hwang, S. Defect-related photoluminescence and Raman studies on the growth of Ge nanocrystals during annealing of Ge+-implanted SiO2 films. Thin Solid Film. 2002, 413, 177–180. [Google Scholar] [CrossRef]
- Fujii, M.; Hayashi, S.; Yamamoto, K. Raman scattering from quantum dots of Ge embedded in SiO2 thin films. Appl. Phys. Lett. 1990, 57, 2692–2694. [Google Scholar] [CrossRef]
- Men, D.; Xiao, W.; Ye, X.; Hua, W. Structure and Raman scattering of nanocrystalline germanium thin films. J. Guangdong Non Ferr. Met. 2005, 15, 22–25. [Google Scholar]
- Verweij, H.; Buster, J. The structure of lithium, sodium and potassium Germanate glasses, studied by Raman scattering. J. Non Cryst. Solids 1979, 34, 81–99. [Google Scholar] [CrossRef]
- Hosono, H.; Abe, Y. Temperature dependence of infrared absorption spectra of hydroxyl groups in soda Germanate glasses. J. Am. Ceram. Soc. 1989, 72, 44–48. [Google Scholar] [CrossRef]
- Saikia, B.J.; Parthasarathy, G. Fourier transform infrared spectroscopic characterization of kaolinite from Assam and Meghalaya. Northeast. India J. Mod. Phys. 2010, 1, 206–210. [Google Scholar]
- Ma, G.; Liu, Y.; Peng, T.; Wu, W.; Ji, G. Preparation and characterizion of the Ni[Ge2O5](OH)4 Nanodisk. J. Sichuan Univ. Nat. Sci. Ed. 2013, 50, 590–594. [Google Scholar]
- Liu, S.; Jia, L.; Xu, Y.; Tsona, N.T.; Ge, S.; Du, L. Photooxidation of cyclohexene in the presence of SO2: SOA yield and chemical composition. Atmos. Chem. Phys. 2017, 17, 13329–13343. [Google Scholar] [CrossRef]
- Nelis, A.; Haye, E.; Terwagne, G. Influence of oxygen co-implantation on germanium out-diffusion and nanoclustering in SiO2/Si films. Thin Solid Film 2022, 746, 139135. [Google Scholar] [CrossRef]
- Gautam, C.R.; Das, S.; Gautam, S.S.; Madheshiya, A.; Singh, A.K. Processing and optical characterization of lead calcium titanate borosilicate glass doped with germanium. J. Phys. Chem. Solids 2018, 115, 180–186. [Google Scholar] [CrossRef]
- Najafov, B.A.; Figarov, V.R. Solar energy converters based on a-Si0. 80 Ge0. 20: H films. Int. J. Sustain. Energy 2007, 26, 149–155. [Google Scholar] [CrossRef]
- Nekić, N.; Šarić, I.; Salamon, K.; Basioli, L.; Sancho-Parramon, J.; Grenzer, J.; Hübner, R.; Bernstorff, S.; Petravić, M.; Mičetić, M. Preparation of non-oxidized Ge quantum dot lattices in amorphous Al2O3, Si3N4 and SiC matrices. Nanotechnology 2019, 30, 335601. [Google Scholar] [CrossRef]
- Lam, D.; Chen, K.S.; Kang, J.; Liu, X.; Hersam, M.C. Anhydrous liquid-phase exfoliation of pristine electrochemically active GeS nanosheets. Chem. Mater. 2018, 30, 2245–2250. [Google Scholar] [CrossRef]
- Mirabella, F.; Johnson, R.L.; Ghijsen, J. Photoemission investigations of manganese thin films deposited on GeS (001) surfaces. Surf. Sci. 2002, 506, 172–182. [Google Scholar] [CrossRef]
- Yang, G.; Yang, C.; Hu, D.; Peng, C.; Tang, K.; Lu, Y.; Tang, F.; He, X.; Xu, Y. Effect of halogen on imprinting gradient refractive index microstructure in GeS2–Ga2S3–NaX (X = F, Cl, Br, I) glasses for broadband infrared diffraction gratings. Ceram. Int. 2021, 47, 28511–28520. [Google Scholar] [CrossRef]
- Hollinger, G.; Kumurdjian, P.; Mackowski, J.M.; Pertosa, P.; Porte, L.; Duc, T.M. ESCA study of molecular GeS3−x Tex As2 glasses. J. Electron Spectrosc. Relat. Phenom. 1974, 5, 237–245. [Google Scholar] [CrossRef]
- Gopalakrishnan, R.; Chowdari, B.V.R.; Tan, K.L. Properties and structure of Pb Ge O F glasses. Solid State Ion. 1992, 51, 203–208. [Google Scholar] [CrossRef]
- Sabharwal, S.C.; Jha, S.N. Optical and X-ray photoelectron spectroscopy of PbGeO3 and Pb5Ge3O11 single crystals. Bull. Mater. Sci. 2010, 33, 395–400. [Google Scholar] [CrossRef]
- Dolado, J.; Hidalgo, P.; Méndez, B. Correlative study of vibrational and luminescence properties of Zn2GeO4 microrods. Phys. Status Solidi A 2018, 215, 1800270. [Google Scholar] [CrossRef]
- Zhang, Z.; Ge, X.; Zhang, X.; Duan, L.; Li, X.; Yang, Y.; Lü, W. A sea cucumber-like BiOBr nanosheet/Zn2GeO4 nanorod heterostructure for enhanced visible light driven photocatalytic activity. Mater. Res. Express 2018, 5, 015009. [Google Scholar] [CrossRef]
- Zhou, J.; Zhang, W.; Zhao, H.; Tian, J.; Zhu, Z.; Lin, N.; Qian, Y. Growth of bouquet-like Zn2GeO4 crystal clusters in molten salt and understanding the fast Na-storage properties. ACS Appl. Mater. Interfaces 2019, 11, 22371–22379. [Google Scholar] [CrossRef]
- Gabrelian, B.V.; Lavrentyev, A.A.; Vu, T.V.; Tkach, V.A.; Marchuk, O.V.; Kalmykova, K.F.; Ananchenko, L.N.; Parasyuk, O.V.; Khyzhun, O.Y. Quaternary Cu2HgGeSe4 selenide: Its electronic and optical properties as elucidated from TB-mBJ band-structure calculations and XPS and XES measurements. Chem. Phys. 2020, 536, 110821. [Google Scholar] [CrossRef]
- Kwon, M.; Han, S.; Ryu, J.H.; Lee, C.; Lee, Y.Y.; Kim, B.H. Characteristics of SiGe Oxidation and Ge Loss according to Ge Content. In Proceedings of the 2020 31st Annual SEMI Advanced Semiconductor Manufacturing Conference (ASMC), Saratoga Springs, NY, USA, 24–26 August 2020; IEEE: Piscataway, NJ, USA, 2020; pp. 1–4. [Google Scholar]


Disclaimer/Publisher’s Note: The statements, opinions and data contained in all publications are solely those of the individual author(s) and contributor(s) and not of MDPI and/or the editor(s). MDPI and/or the editor(s) disclaim responsibility for any injury to people or property resulting from any ideas, methods, instructions or products referred to in the content. |
© 2023 by the authors. Licensee MDPI, Basel, Switzerland. This article is an open access article distributed under the terms and conditions of the Creative Commons Attribution (CC BY) license (https://creativecommons.org/licenses/by/4.0/).