Article

Microstructure and Mechanical Properties of Selective Laser Melted Reduced Activation Ferritic/Martensitic Steel

1
Southwestern Institute of Physics, Huangjing Road Number 5, Chengdu 610041, China
2
Additive Manufacturing Institute, College of Mechatronics and Control Engineering, Shenzhen University, Shenzhen 518060, China
*
Authors to whom correspondence should be addressed.
Metals 2022, 12(12), 2044; https://doi.org/10.3390/met12122044
Submission received: 30 October 2022 / Revised: 21 November 2022 / Accepted: 23 November 2022 / Published: 28 November 2022
(This article belongs to the Special Issue 3D Printing of Metal)

Abstract

:
Cube and tensile samples of reduced activation ferritic/martensitic steel were formed at different laser powers and scanning velocities using a selective laser melting process; the microstructural characteristics and tensile properties of the cube and tensile samples were investigated in this study. The experimental results showed that the SLMed CLF-1 samples that formed with selected laser melting were near-fully dense, and the relative density of the SLMed CLF-1 samples exceeded 99%. Meanwhile, there were numerous nano-sized spherical and needle-like precipitate dispersions distributed in the grains and boundary of the grains, and the precipitates were mainly composed of M23C6 carbide and MX carbide. The microstructure was composed of columnar grains and equiaxed grains arranged in a sequence, and the smallest average size of the grains was 15 ± 2.1 µm when measured at 320 W of power and 800 mm/s scanning velocity. In addition, the sample at 320 W of power and 800 mm/s scanning velocity exhibited higher yield strength (875 ± 6.0 MPa) and higher elongation (25.6 ± 0.8%) than that of the sample at 200 W of power, 800 mm/s scanning velocity, yield strength of 715 ± 1.5 MPa, and elongation of 22.6 ± 1.2%.

1. Introduction

In the past decades, reduced activation ferritic/martensitic (RAFM) steel has been widely selected as primary structural materials in the nuclear industry, including test blanket modules (TBMs), nuclear power cladding, and cores, owing to its good advantages of low activation, good radiation resistance, and outstanding mechanical and thermophysical properties [1,2,3,4]. The service environment of RAFM steel structure that are used in the nuclear industry usually needs to withstand high thermal load, and it needs to match the plasma configuration [5,6,7,8]. Therefore, RAFM steel structures have complex curved surfaces and require high precision. These conditions bring great challenges to traditional processing techniques, and new forming strategies to solve this conflict are desired in the manufacturing of reduced activation ferritic/martensitic steel. Additive manufacturing (AM) can form complex components with high design flexibility because of the layer-by-layer processing methods. The AM approach is mainly divided into laser-directed energy deposition (LDED) and selective laser melting (SLM) according to the powder feeding forms. The LDED technique is widely used in the manufacture and repair of large parts because of the high deposition rate and high degree of freedom of the powder feeding nozzle. The SLM method is suitable for manufacturing precision parts owing to its small molten pool [9,10,11,12]; therefore, SLM has been used to confirm the feasibility of producing the RAFM steel component [13,14,15].
Huang et al. [13] utilized the SLM method to fabricate an RAFM steel component in 2018; while the SLMed RAFM steels have poor formability with many porosities and cracks, Thomas et al. [15] produced RAFM steel walls and solid buildings using SLM. The SLM-built RAFM steel achieved poor anisotropy and lower ductility (7%) compared with the forgings in elongation (~20%) [16]. Huang et al. [14] reported that the defects can be dramatically eliminated by hot isostatic pressing, and as a result the tensile strength of the as-deposited material is improved. However, the use of hot isostatic pressing process causes the tensile strength to deteriorate, and it cannot guarantee the elimination of all the porosities and micro-cracks. Meanwhile, this treatment increases the cost and processing time and contradicts the concept of AM one-time molding. Therefore, it is necessary to systematically study the relationship between the SLMed RAFM steel processing, structure, and performance. In this study, RAFM steels were fabricated using the SLM method under various laser powers and scanning velocities, and the microstructure and tensile properties were investigated using scanning electron microscope (SEM), optical microscopy (OM), and X-ray diffraction (XRD) analyses to further understand the relationship between the processing, microstructure, and properties. The evolution behavior of grain morphology was also revealed in detail based on the experimental results.

2. Materials and Experimental Procedures
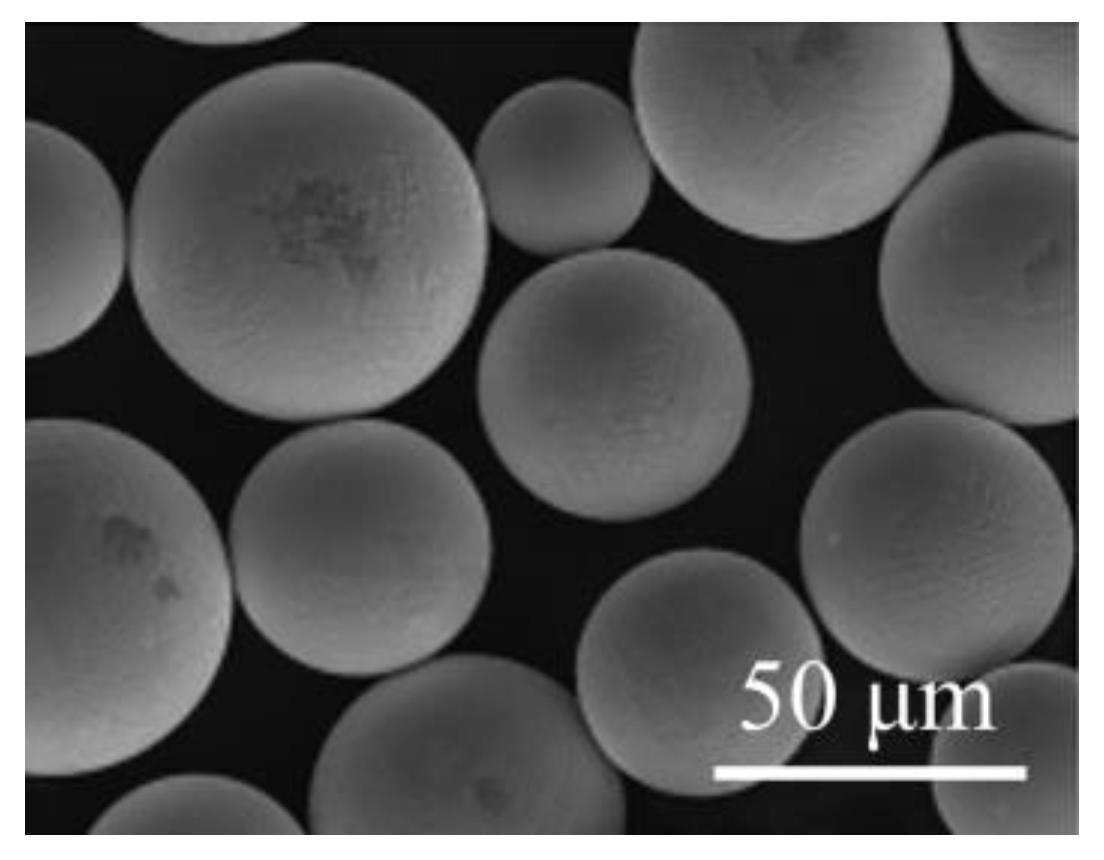
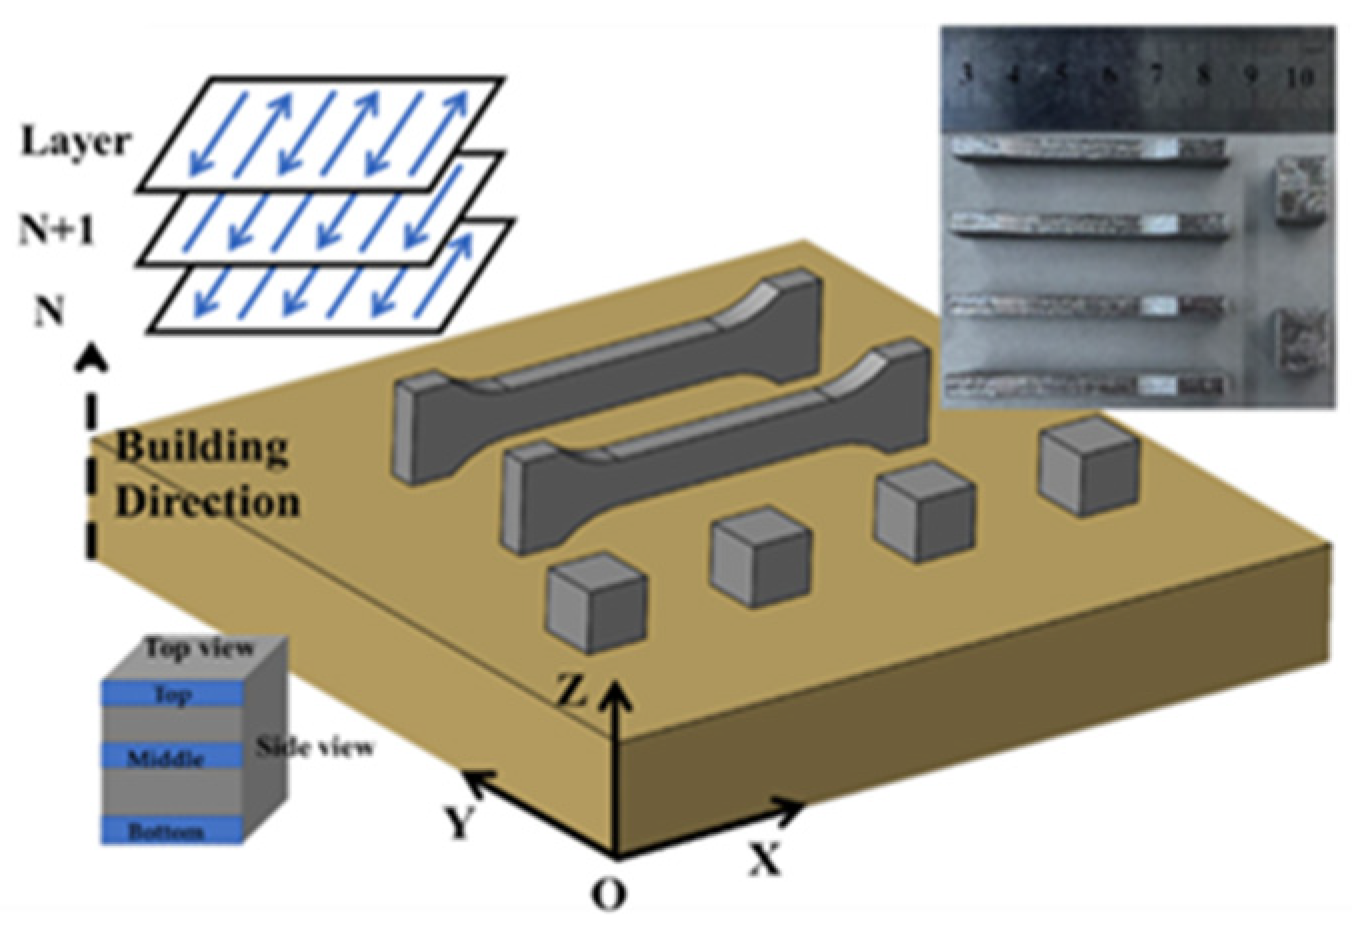
2.1. Materials

The RAFM steel raw material CLF-1 was developed by the Southwest Institute of Physics in this experiment. CLF-1 is intended to be used as the first-wall material for fusion reactors in the future. The manufacturing methods for CLF-1′s powder particle are usually one of two methods: gas atomization (GA) and plasma-rotating electrode process (PREP) [17]. The GA approach is the most common method of powder production. Compared with the GA method, the PREP technique has many advantages, such as higher sphericity and lower porosity [17,18]. Considering the characteristics of sphericity and porosity, the powder was produced using the PREP method and was provided by the Institute of Metal Research, Chinese Academy of Sciences. The purpose of this research was to apply RAFM steel in a reactor. The interaction between the neutrons and Mo, Nb, and N elements of the RAFM steel in the reactor will lead to radioactivity in RAFM steel; therefore, the Mo, Nb, and N elements of the RAFM steel would be replaced with W, Ta, and V for the purpose of reducing the activation of RAFM steel. Table 1 lists the chemical compositions of the CLF-1 powder. It can be clearly seen from Table 1 that the CLF-1 steel in this investigate was a low-carbon martensitic steel, and the components of CLF-1 steel were C, Cr, W, Ta, V, Mn, and Fe, and the mass fraction of Fe was 88.16%.
Figure 1 shows the scanning electron microscope picture of the CLF-1 powder produced using the PREP method. It can be clearly seen from Figure 1 that the average particle size range of the powder particles is 31.3 µm, and the powder particles have good sphericity. There is no obvious hollow in the powder particles.

2.2. Experimental Procedures

RAFM steel powder particles were dried for 2 h at a temperature of 120 °C to remove moisture at the beginning of the experiment. The selective laser melting experiment was carried out in a BLT S310 SLM system. This system contains a 500 W fiber laser and stable powder spreading system. The layer thickness of the powder was set as 30 µm, and the hatch spacing was 85 µm. The laser size was 80 µm. Cuboid samples with dimensions of 10 × 10 × 10 mm3 were fabricated for microstructural analysis, and plate-shaped tensile specimens were horizontally fabricated (see Figure 2). In order to reduce the stress concentration, the scanning strategy adopted zigzag scanning. The laser powders and the scanning speeds were selected considering the optimized process parameters. Table 2 lists the process parameters used in this experiment, and one cuboid sample was formed for each of the parameter settings. The densities of the SLMed CLF-1 cuboid samples were measured using Archimedes’ method with distilled water. The phase analysis of the as-deposited samples was carried out using X-ray diffraction (XRD) with Cu Kα radiation, and the type of XRD used was a Rigaku MiniFlex 600 (Rigaku Inc., Tokyo, Japan); the scanning speed of the XRD analysis was run at about 10 ◦/min. The samples were mechanically ground with #400–2000 before observing the microstructure and polished with 2.5 µm of polishing paste; they were then etched by the solution Vilella’s reagent (1 g of picric acid, 10 mL of hydrochloric acid, and 100 mL of ethanol). The microstructure of the sample was examined by optical microscopy using a Keyence VHX-5000 microscope (Keyence Inc., Osaka, Japan) and scanning electron microscope (SEM, FE-SEM, ZEISS MERLIN Compact, Oberkochen, Germany). Hardness tests were carried out using a Struers Duramin-A300 Vickers microhardness tester (Struers Inc., Copenhagen, Denmark) at load of 500 g with 15 s. Tensile tests of the samples were conducted using an INSTRON11-96 electronic testing machine (Instron Inc., High Wycome, England). Three tensile specimens were tested for each condition. The balanced phase diagram and continuous cooling transformation curve (CCT) were calculated using JMatPro software (V5.1, Sente Software Inc., Surrey, England). JMatPro is a software based on material type which has been used in different studies and has good agreement with the predicted material’s characteristics (alloy composition, phases, phase composition, physical and mechanical properties, etc.) [12]. The element composition setting in JMatPro, which is used to calculate CCT and the balanced phase diagram, was same as in Table 2. The material type of calculation was selected to be stainless steel. The temperature calculation ranged from 10 °C to 1600 °C, and the calculation step was conducted at 10 °C.

3. Results and Discussion
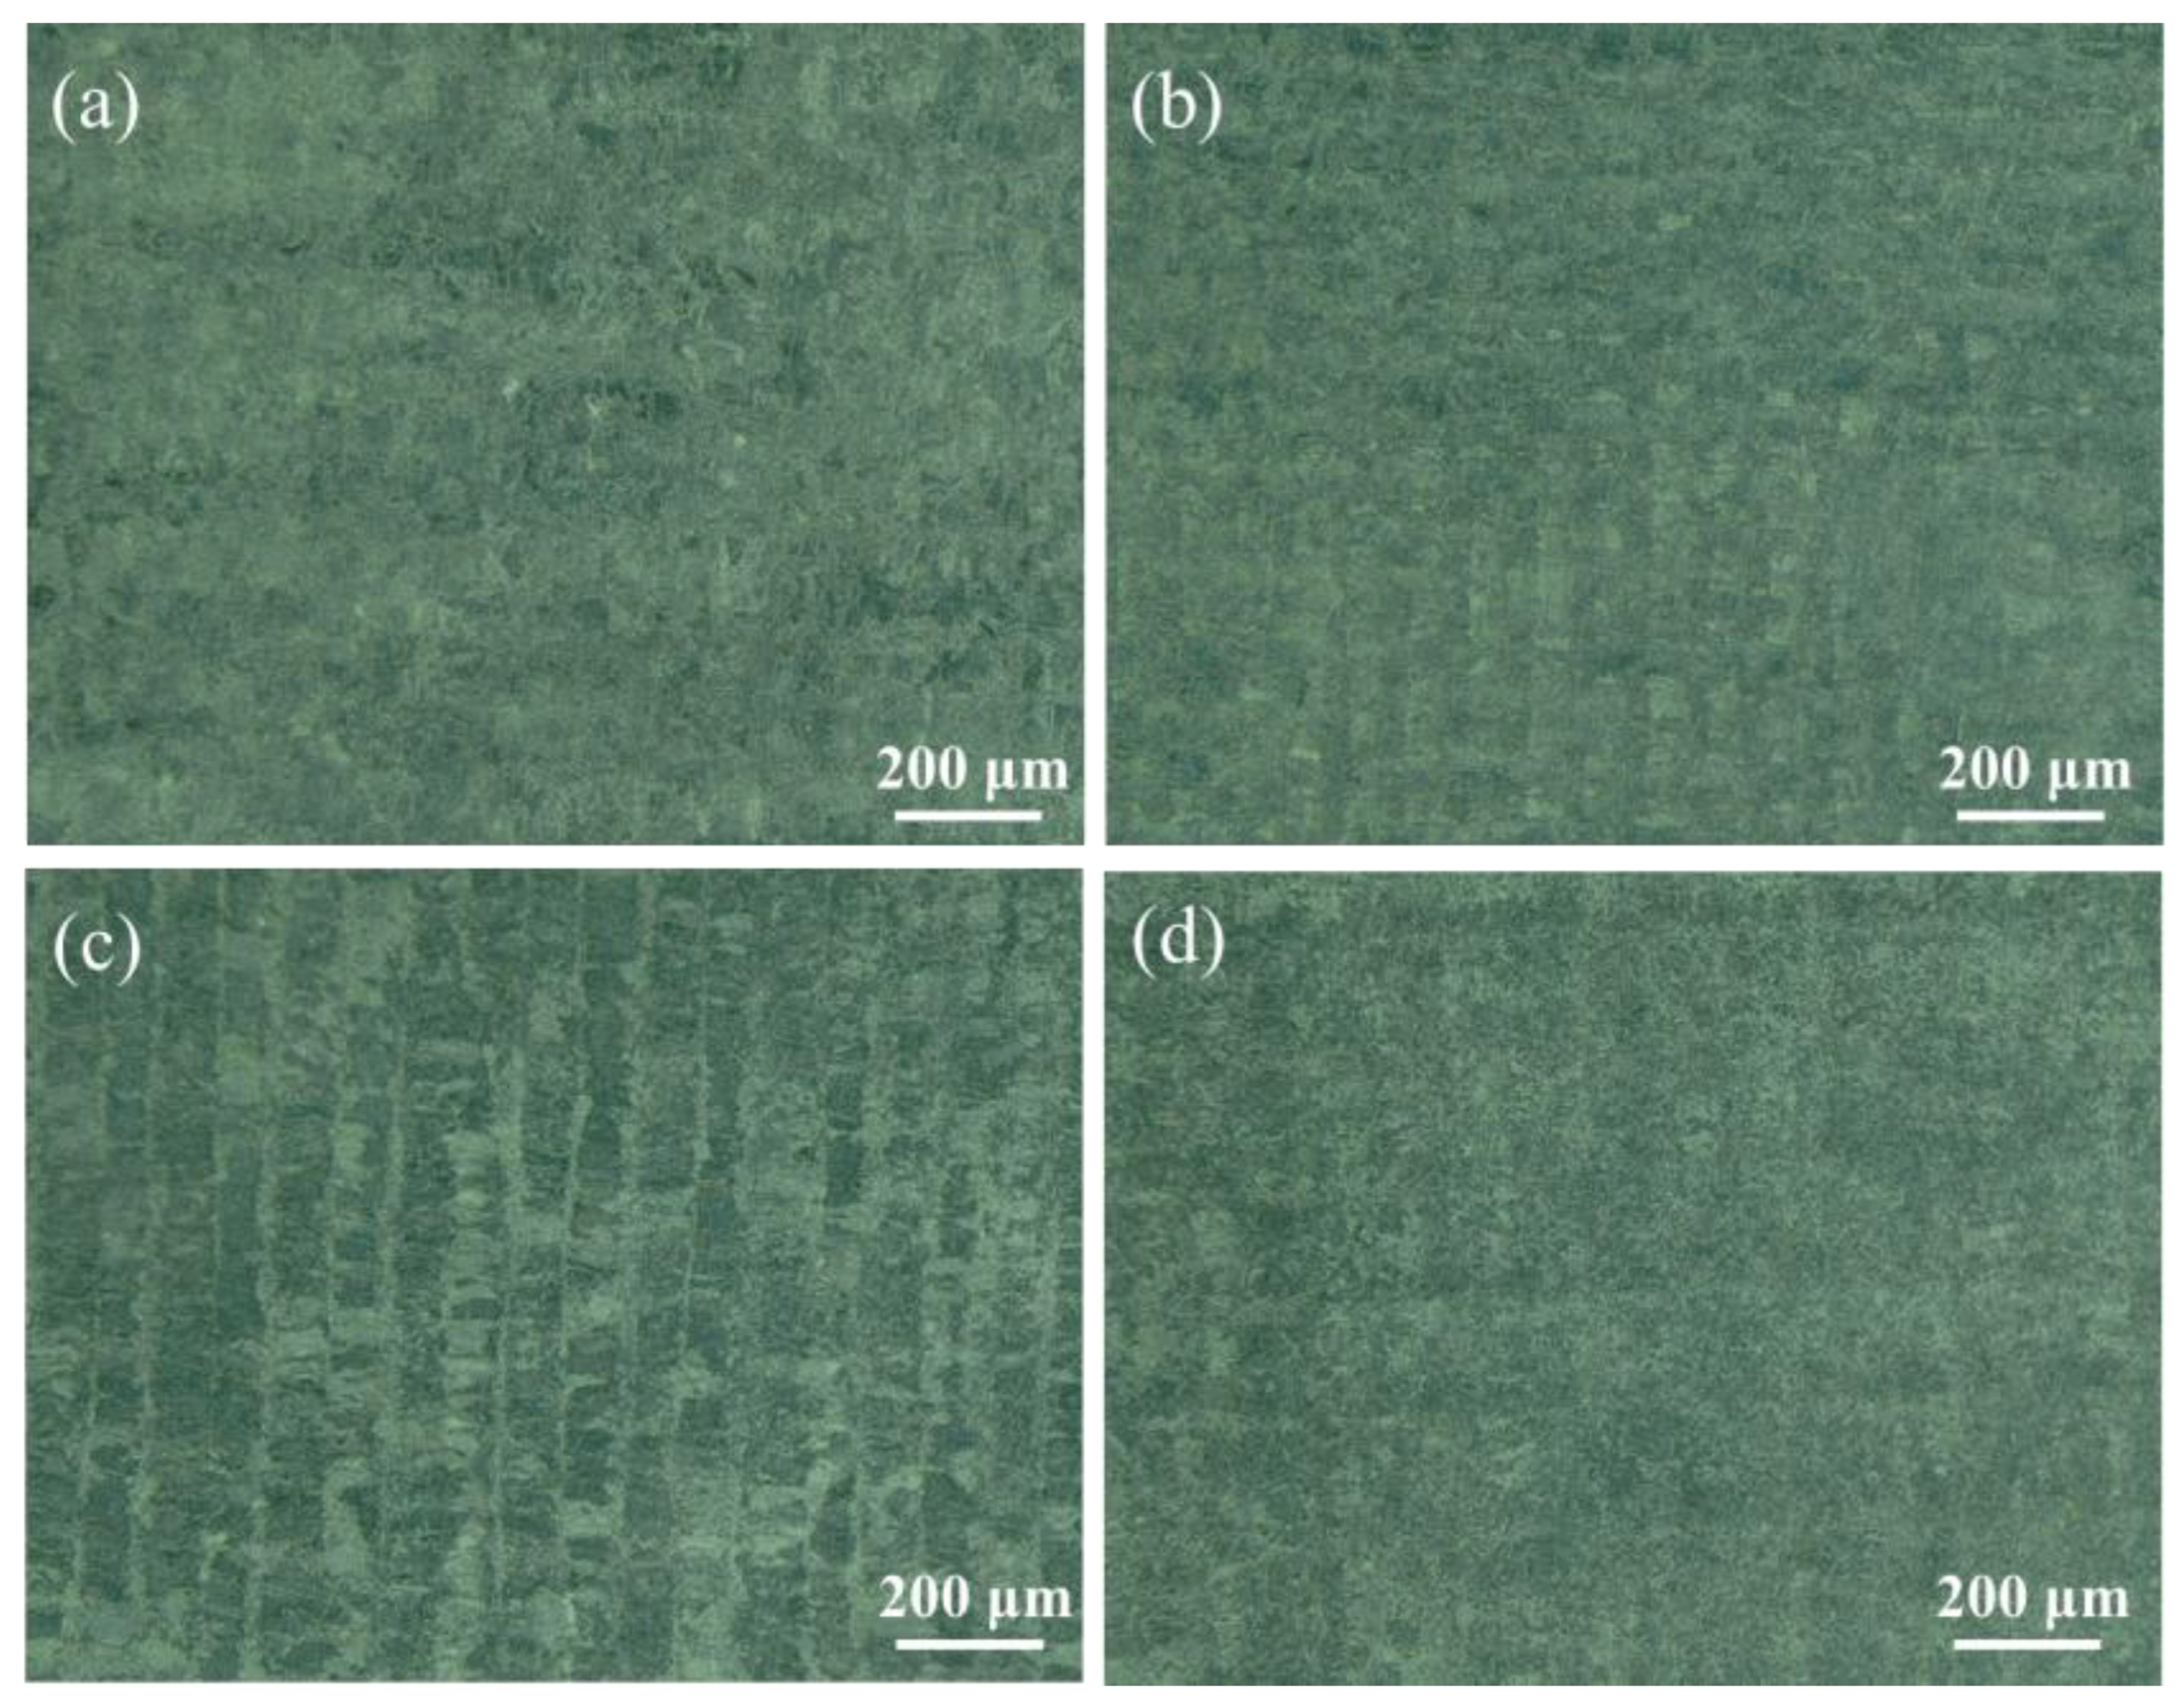
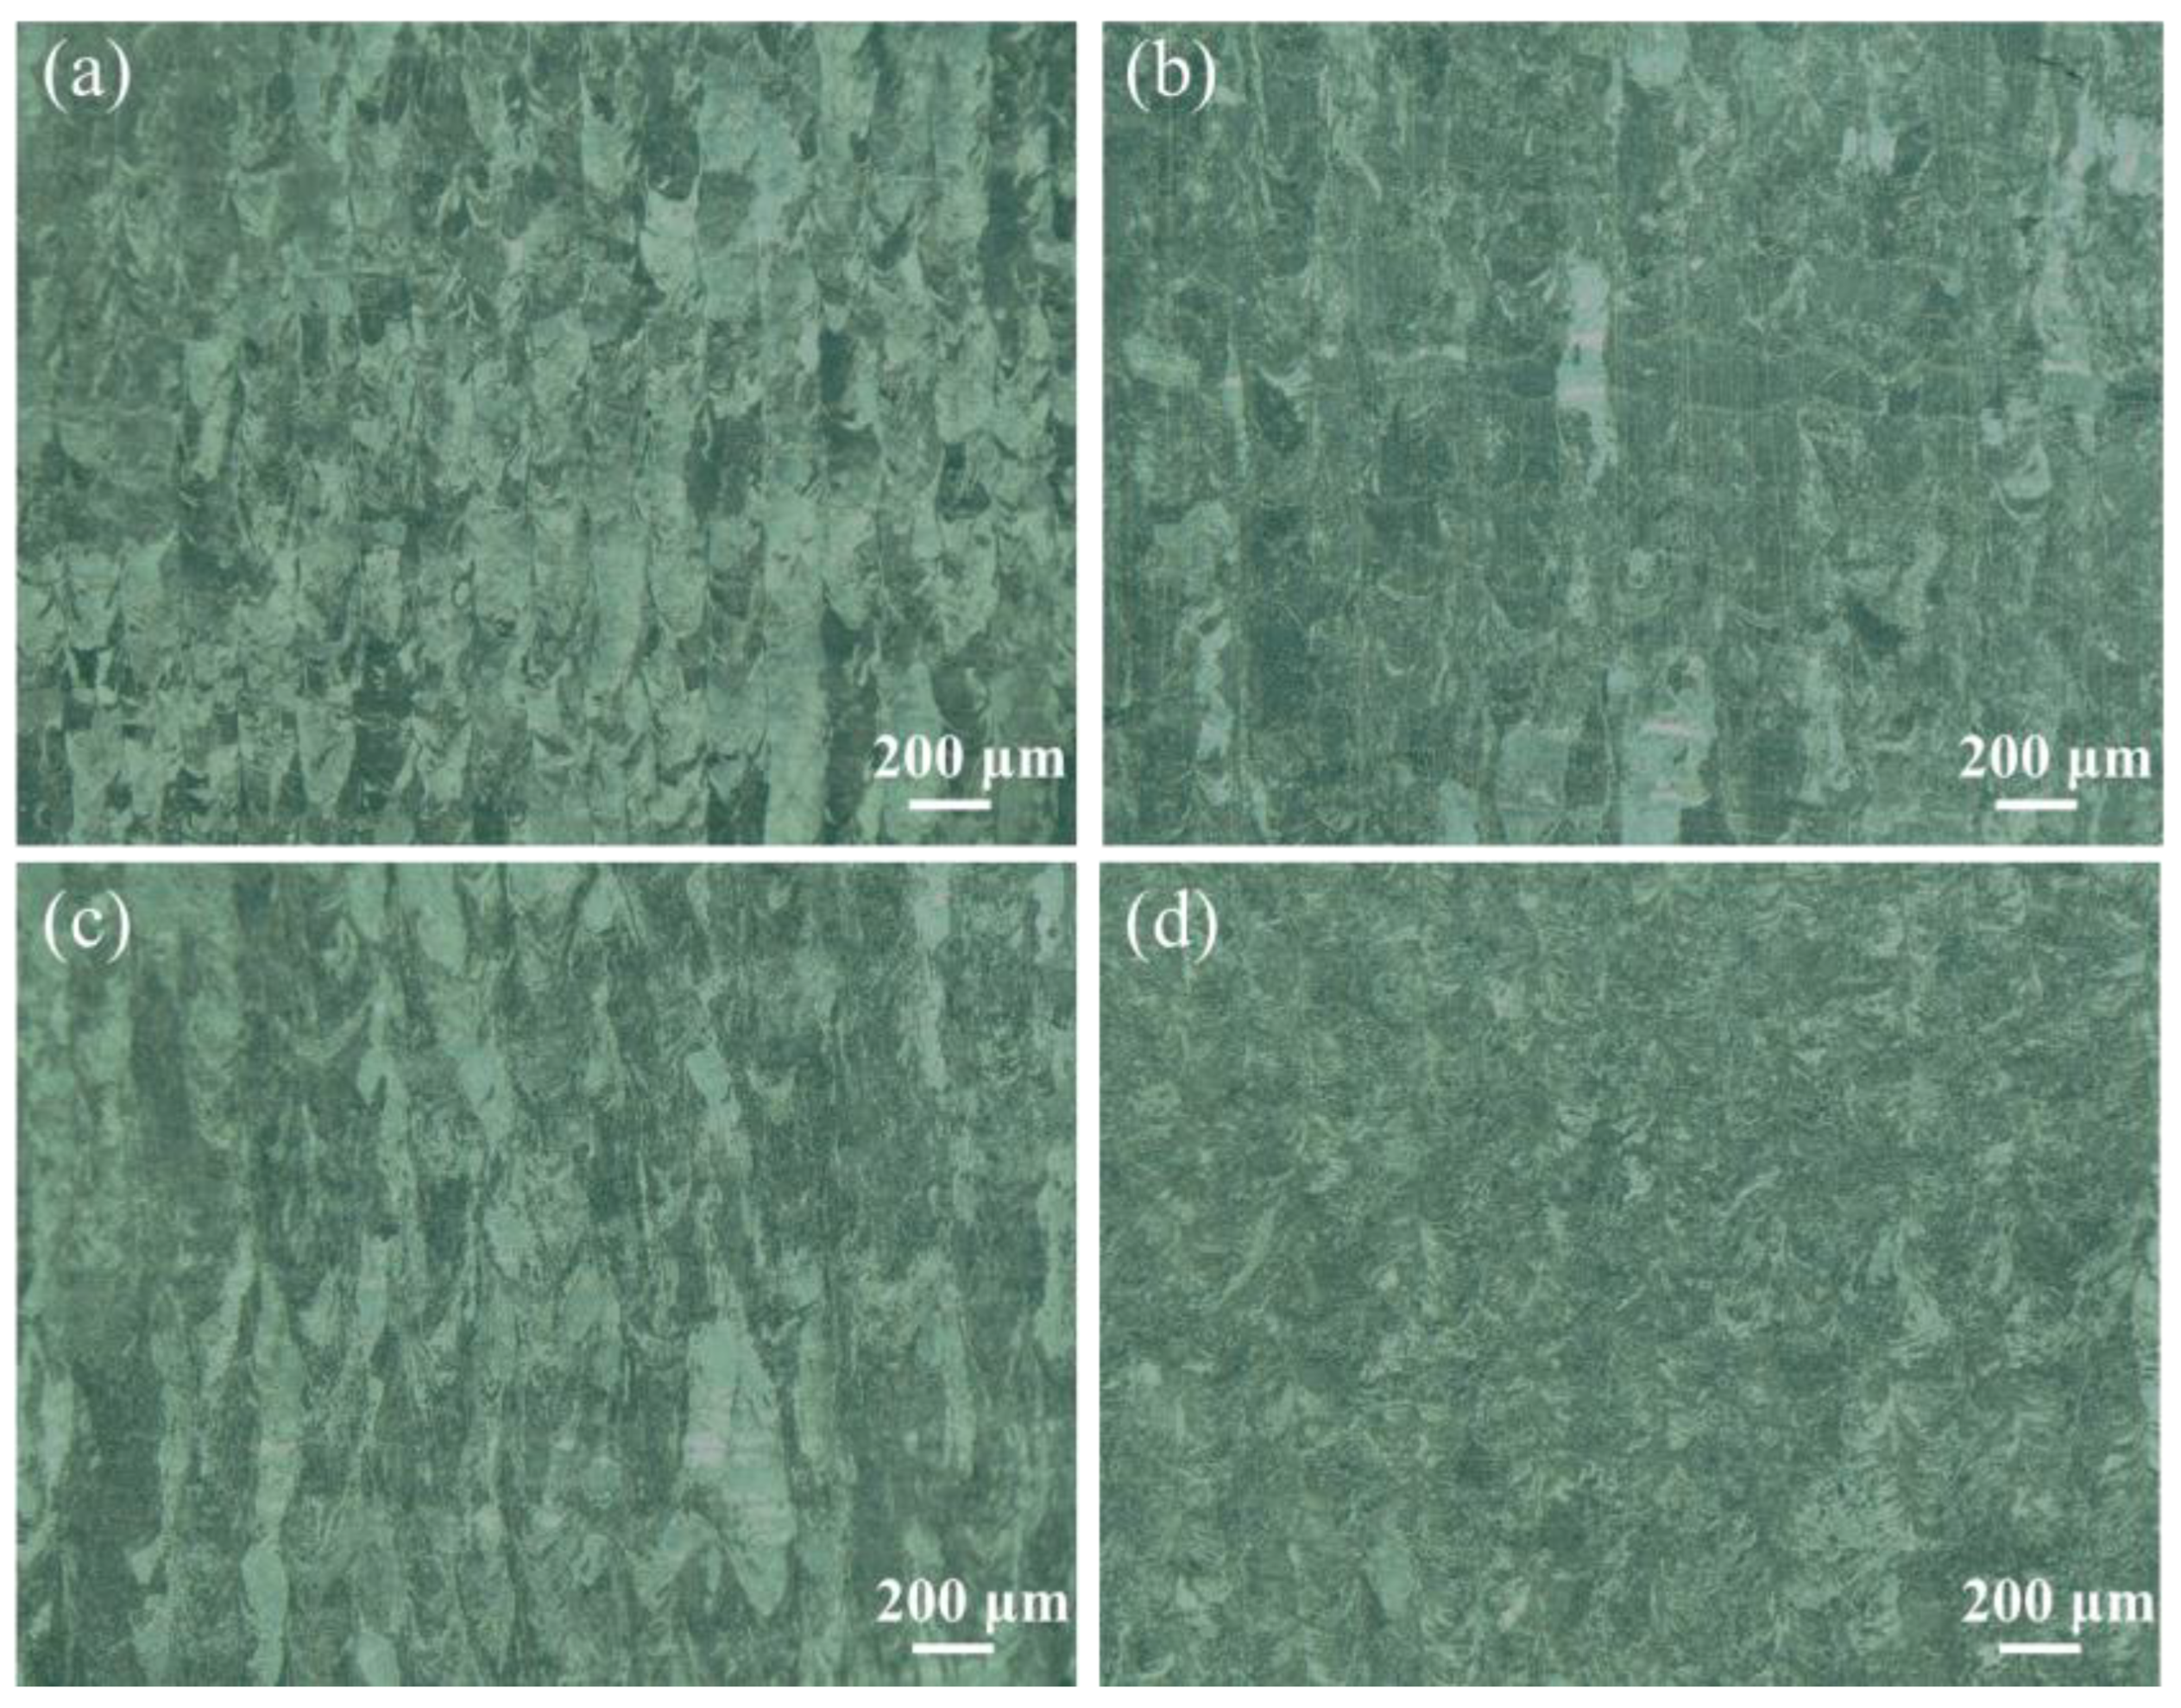
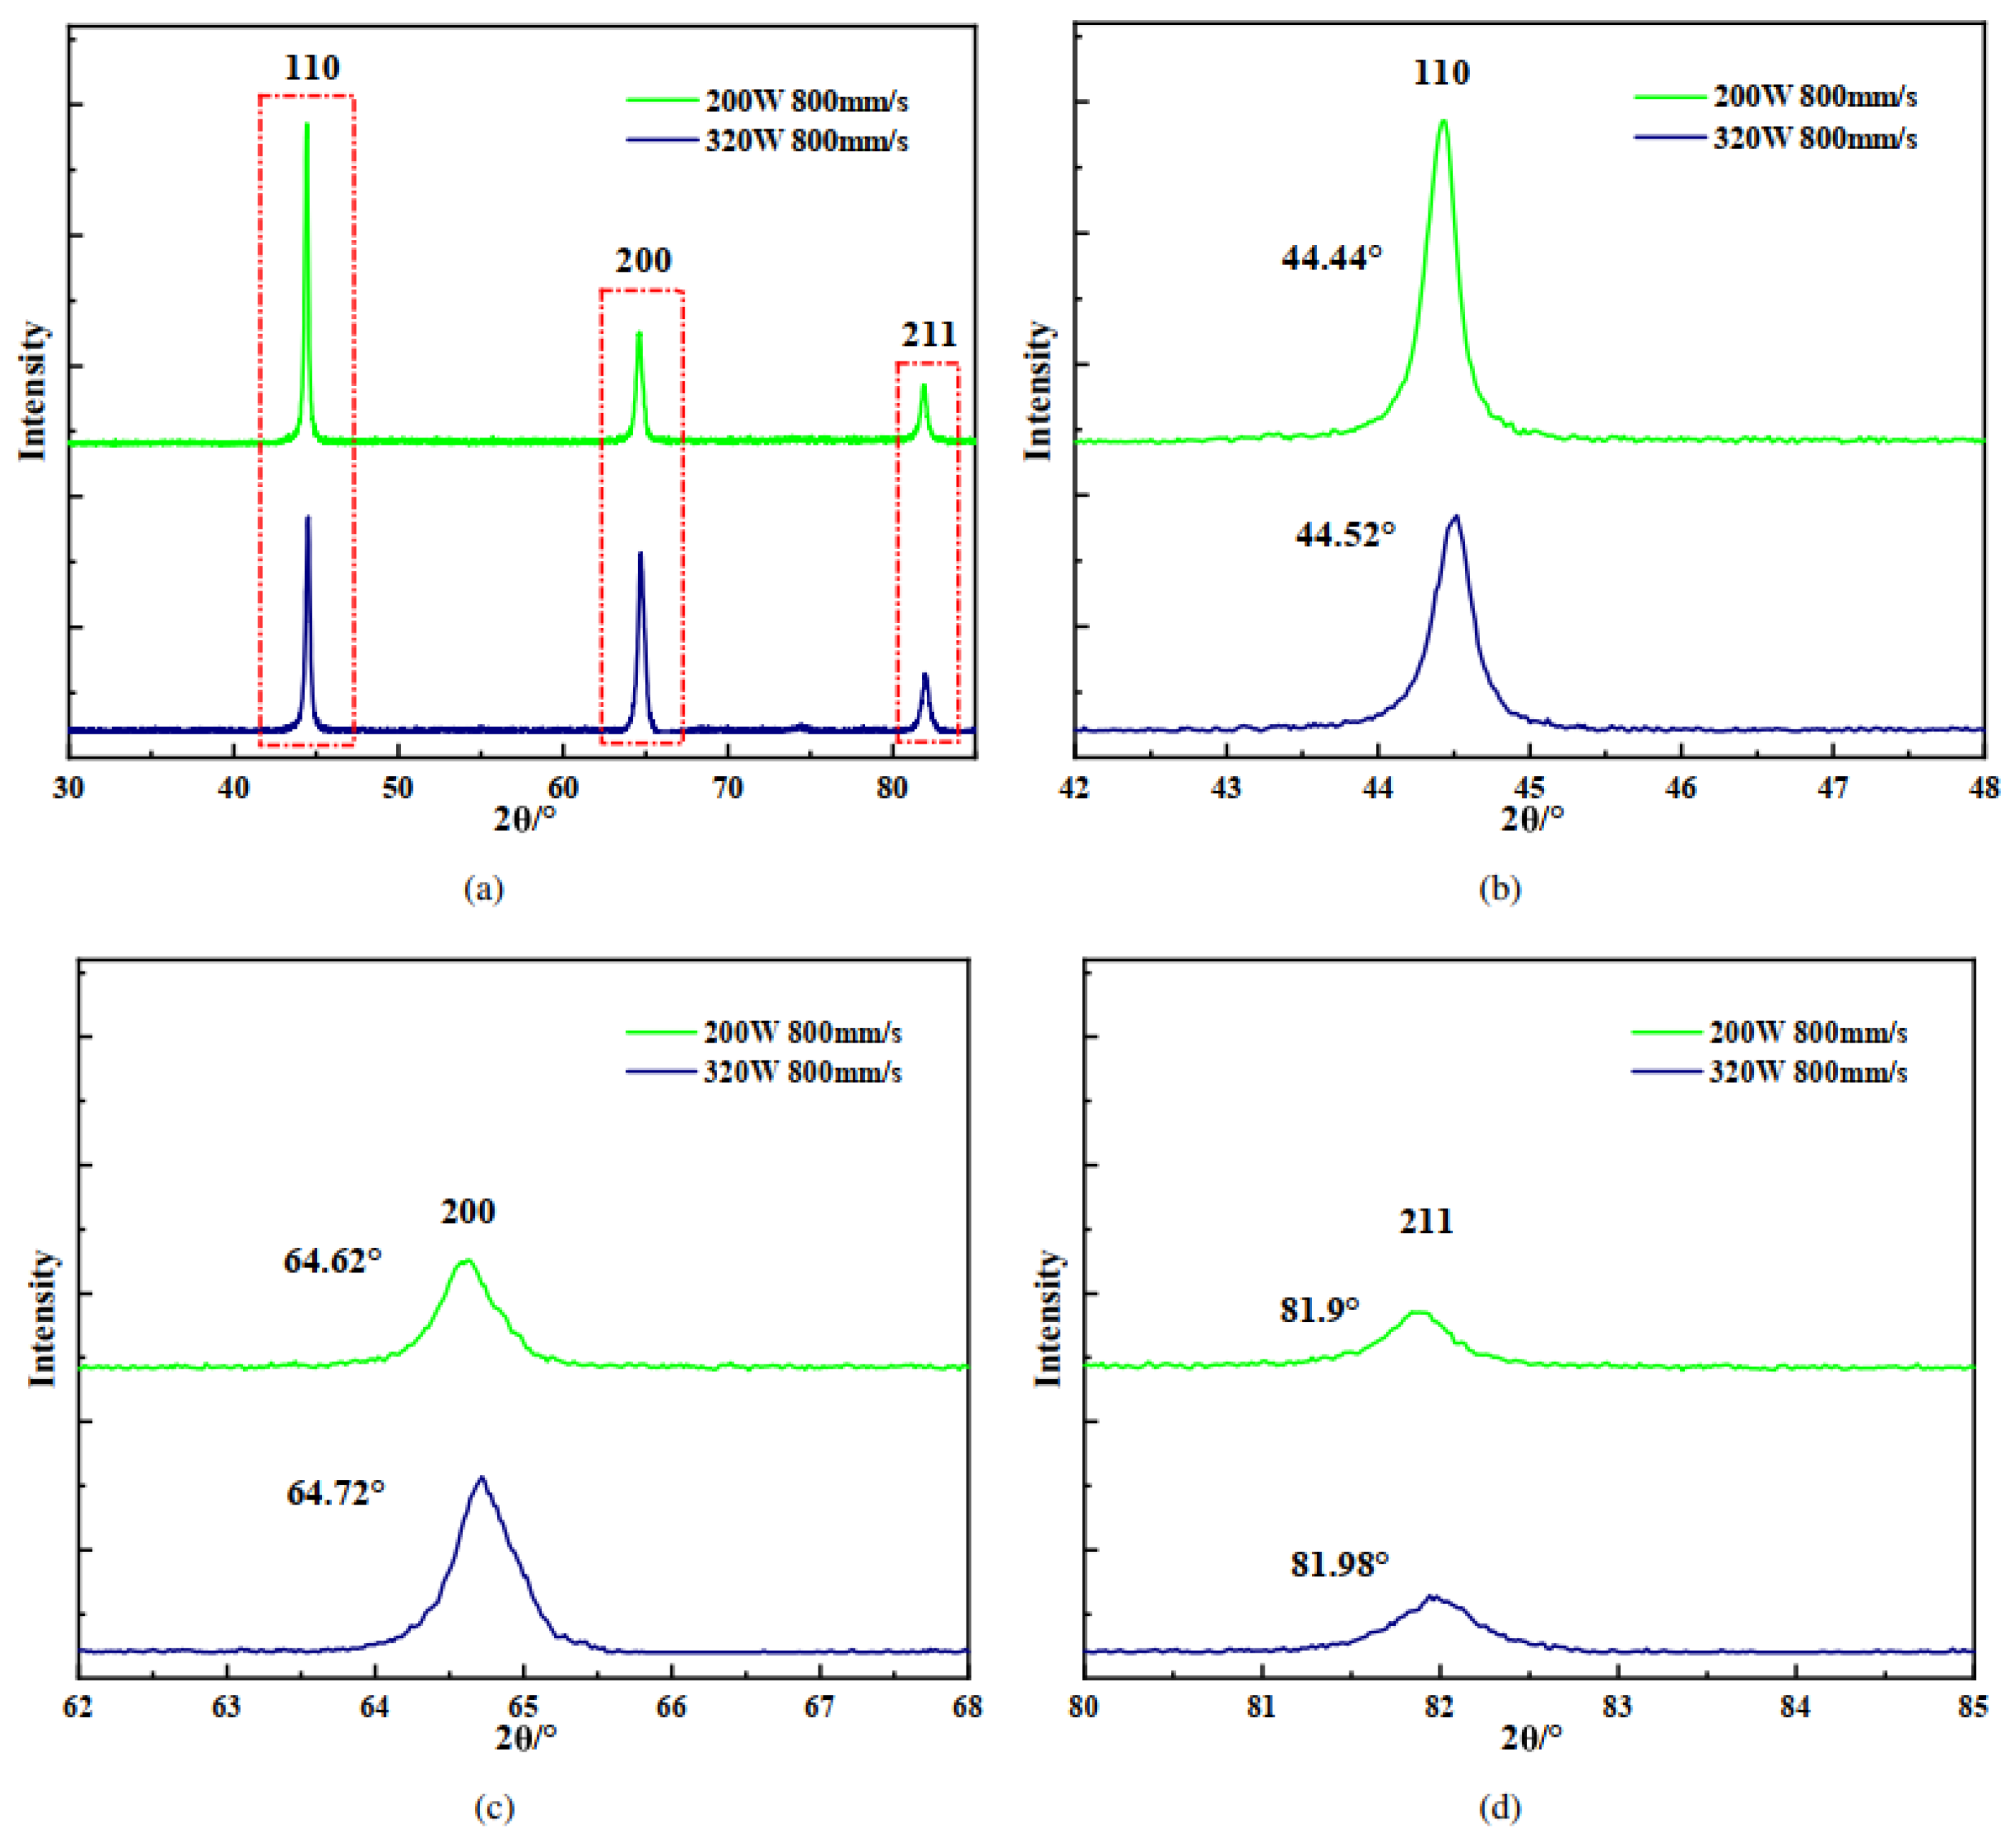
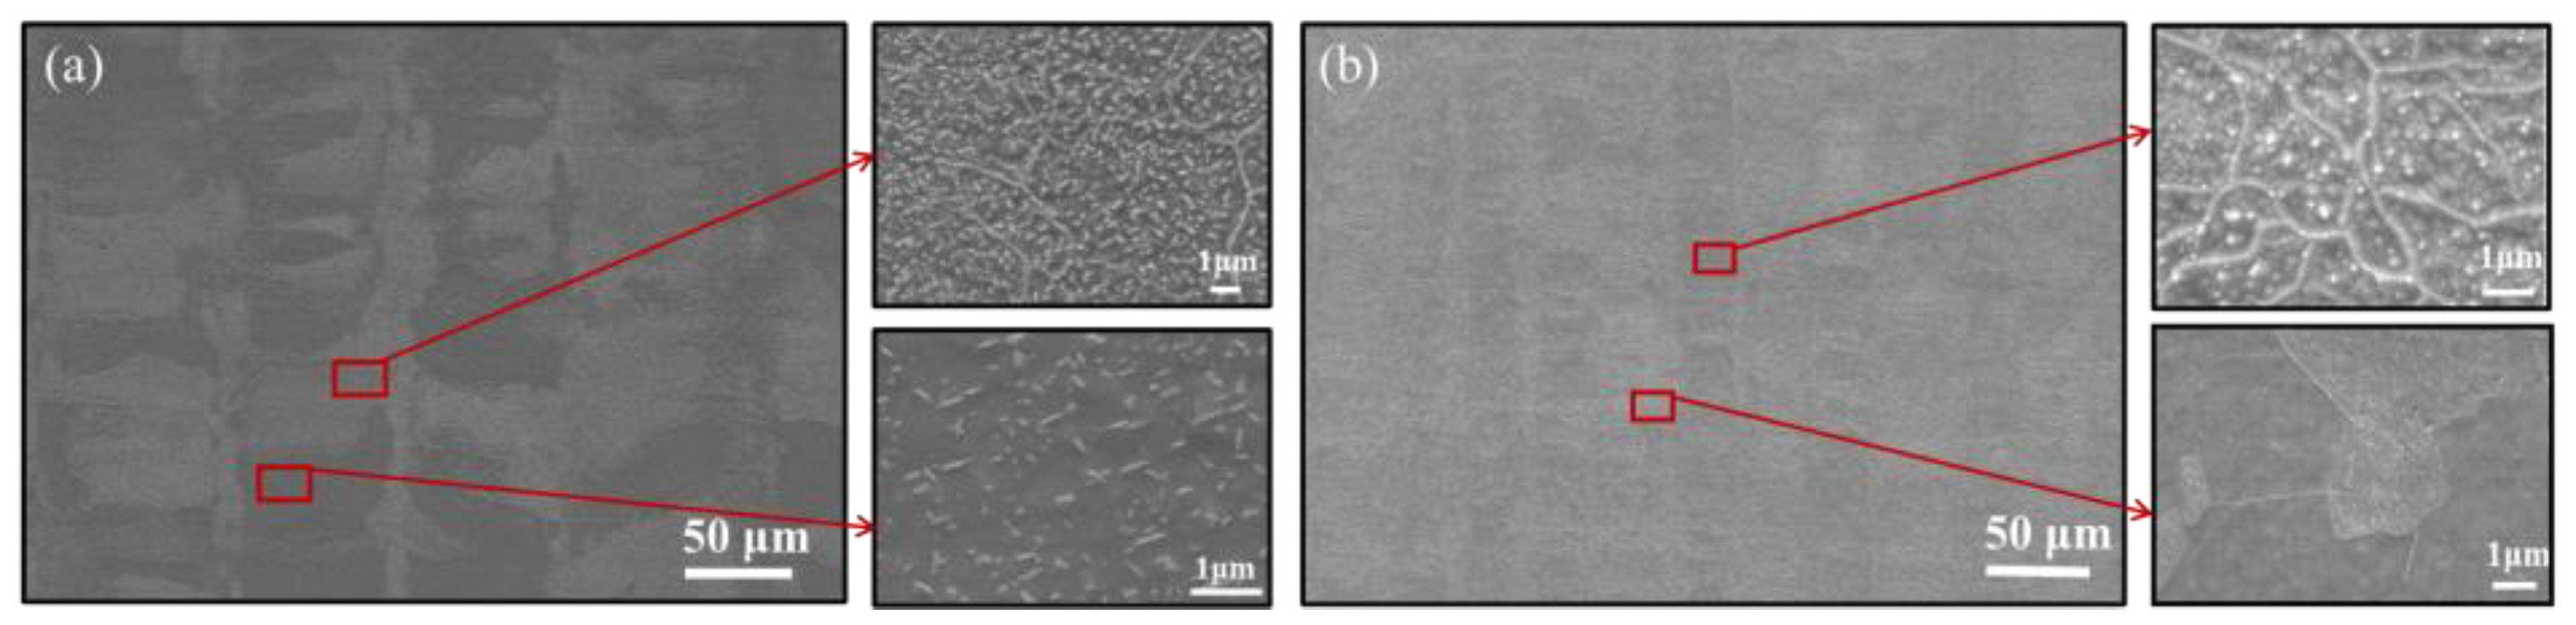
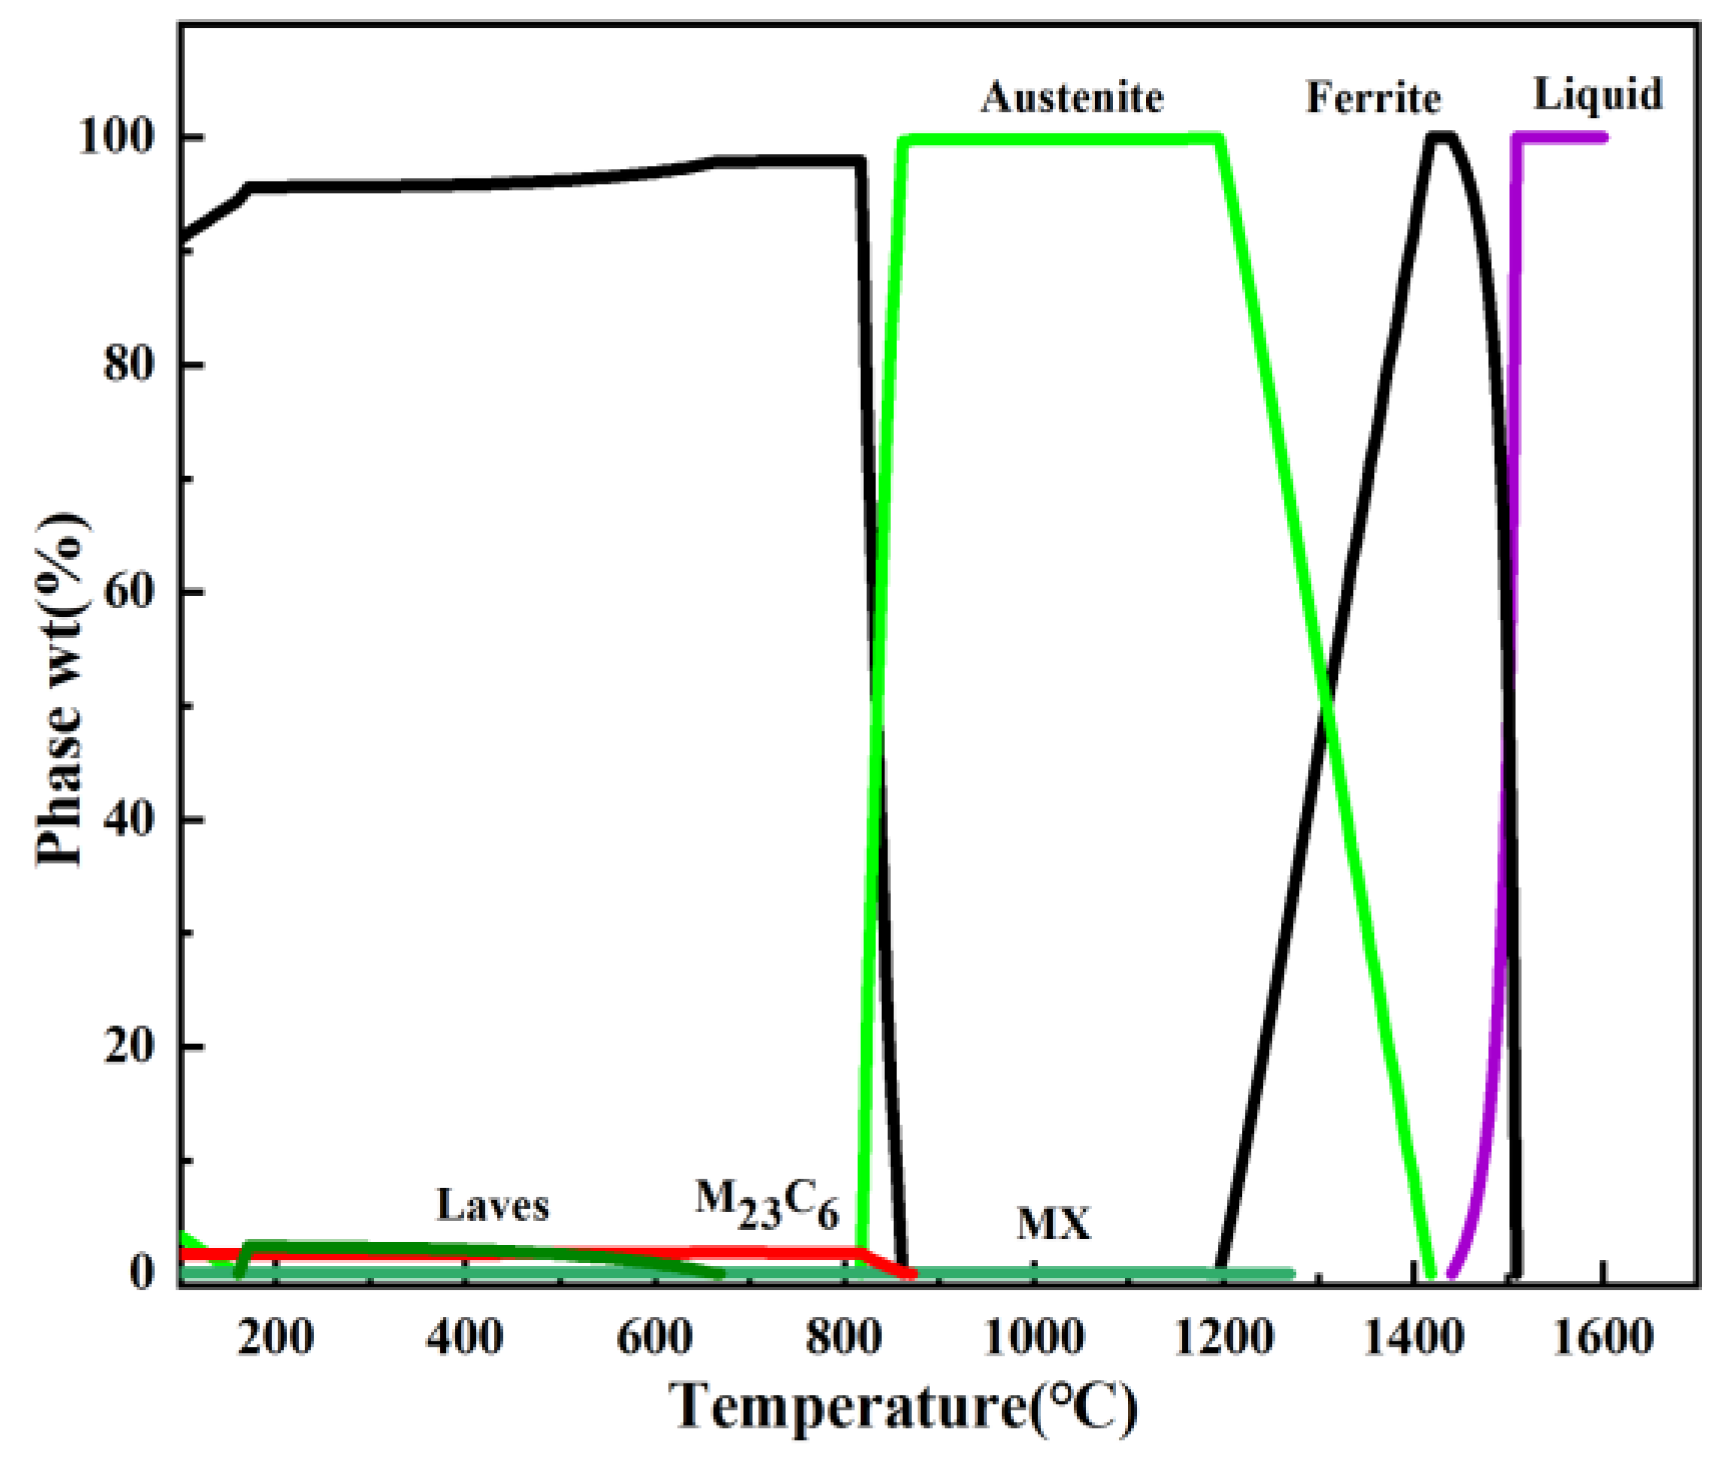
3.1. Microstructure

Figure 3 and Figure 4 show the morphologies of the CLF-1 grains from the top view and side view under different process parameters, respectively. As can be seen from Figure 3 and Figure 4, there were no obvious cracks and pores in the samples, and the relative density of all the samples exceeded 99%. The sample reached the highest relative density in the conditions of 320 W power and 800 mm/s scanning velocity, where the relative density was 99.73%. Meanwhile, the microstructure of the grains had a similar morphology; the average grain size was smallest in the conditions of 320 W power and 800 mm/s scanning velocity, and the average grain size was 15 ± 2.1 µm.
The growth mode and structure morphology during the solidification process are dependent on the temperature gradient (G) and the growth rate (R). The growth rate (R) can be expressed as [19]:
R = Vs × cosθ
where Vs is the scanning velocity and θ is the angle between Vs and R. The temperature gradient G can be calculated as follows [20]:
G = 2 K ( T T 0 ) 2 ε P
where T is the liquid temperature of the alloy, T0 is the initial temperature of the substrate, ε is the laser absorption coefficient, and P is the laser power. The liquid temperature T of the alloy can be estimated by [21,22]:
T ( x , y , z ) = 1 2 π λ . 4 P β π D 2 D 2 D 2 D 2 4 x 0 2 D 2 4 x 0 2 exp [ ( V S ( x x 0 ) 2 α + V S ( x x 0 ) 2 + ( y y 0 ) 2 + z 2 2 α ) ] ( x x 0 ) 2 + ( y y 0 ) 2 + z 2 d x d y
where P is the laser power, D is the diameter of the laser beam, and β is the laser absorptivity, which can be calculated by: α × c × ρ, where α is heat dissipation coefficient, c is the specific heat capacity, and ρ is the density of material.
According to Equation (3), T is proportional to the laser power P; therefore, T increases with an increase in P. According to Equation (2), the temperature gradient G is proportional to liquid temperature T2 of the alloy; as a result, the temperature gradient G increases with an increase in laser power P. Hence, one conclusion can be deduced that G and R are greatest at 320 W power and 800 mm/s scanning velocity conditions. According to rapid solidification, the grains become smaller as the G × R increases [23].
It can also be seen from Figure 3 and Figure 4 that columnar grains and equiaxed grains were arranged in sequence along the Y-direction, the equiaxed grains were formed along the center line of the laser track, and epitaxially grown columnar coarse grains penetrated through multiple deposition layers; meanwhile, the width of these columnar grains was about 85 µm, which matched the hatch spacing well. It is worth noting that the direction of epitaxial growth of the columnar grains was not perpendicular to the deposition direction, which is related to the direction of heat diffusion during the solidification of the molten pool. The authors believe that there is a temperature gradient in the molten pool from the center of the molten pool to the outside during the solidification process which, combined with the subsequent laser remelting, resulted in the columnar grains and equiaxed grains being arranged in sequence along the Y-direction.
Figure 5 shows the XRD patterns of the as-deposited CLF-1 steel at 200 W power and 800 mm/s scanning velocity and 320 W power and 800 mm/s scanning velocity, respectively. As can be seen from Figure 5, the diffraction peaks were 44.6°, 65°, 82.3°, which are consistent with the diffraction peaks of ferrite/martensite. Meanwhile, there was no residual austenite detected due to the high cooling rate during the SLM process. It can be seen from Figure 5b–d that the diffraction peak shifted toward the large angle with increasing laser power. The authors believe that as the laser energy density increases, the redistribution of large-sized atoms (Cr, V, and Ta) and interstitial atoms caused the interplanar spacing to decrease, which resulted in this phenomenon.
Figure 6 shows the SEM images of the SLMed CLF-1 steels observed from the top view. It can be seen that numerous nano-sized spherical and needle-like precipitates were dispersion distributed in the grains and boundary of the grains. These precipitates mainly play a role in dispersion strengthening by pinning dislocations and subgrain boundaries to increase the strength [24]. The precipitates of the SLMed CLF-1 steels were mainly as follows: M23C6 carbide, MX carbide, and the laves phase shown in the balanced phase diagram (Figure 7). Because laves phases are often generated during the creep process and have an irregular shape [25], the precipitates were M23C6 carbide and MX carbide.

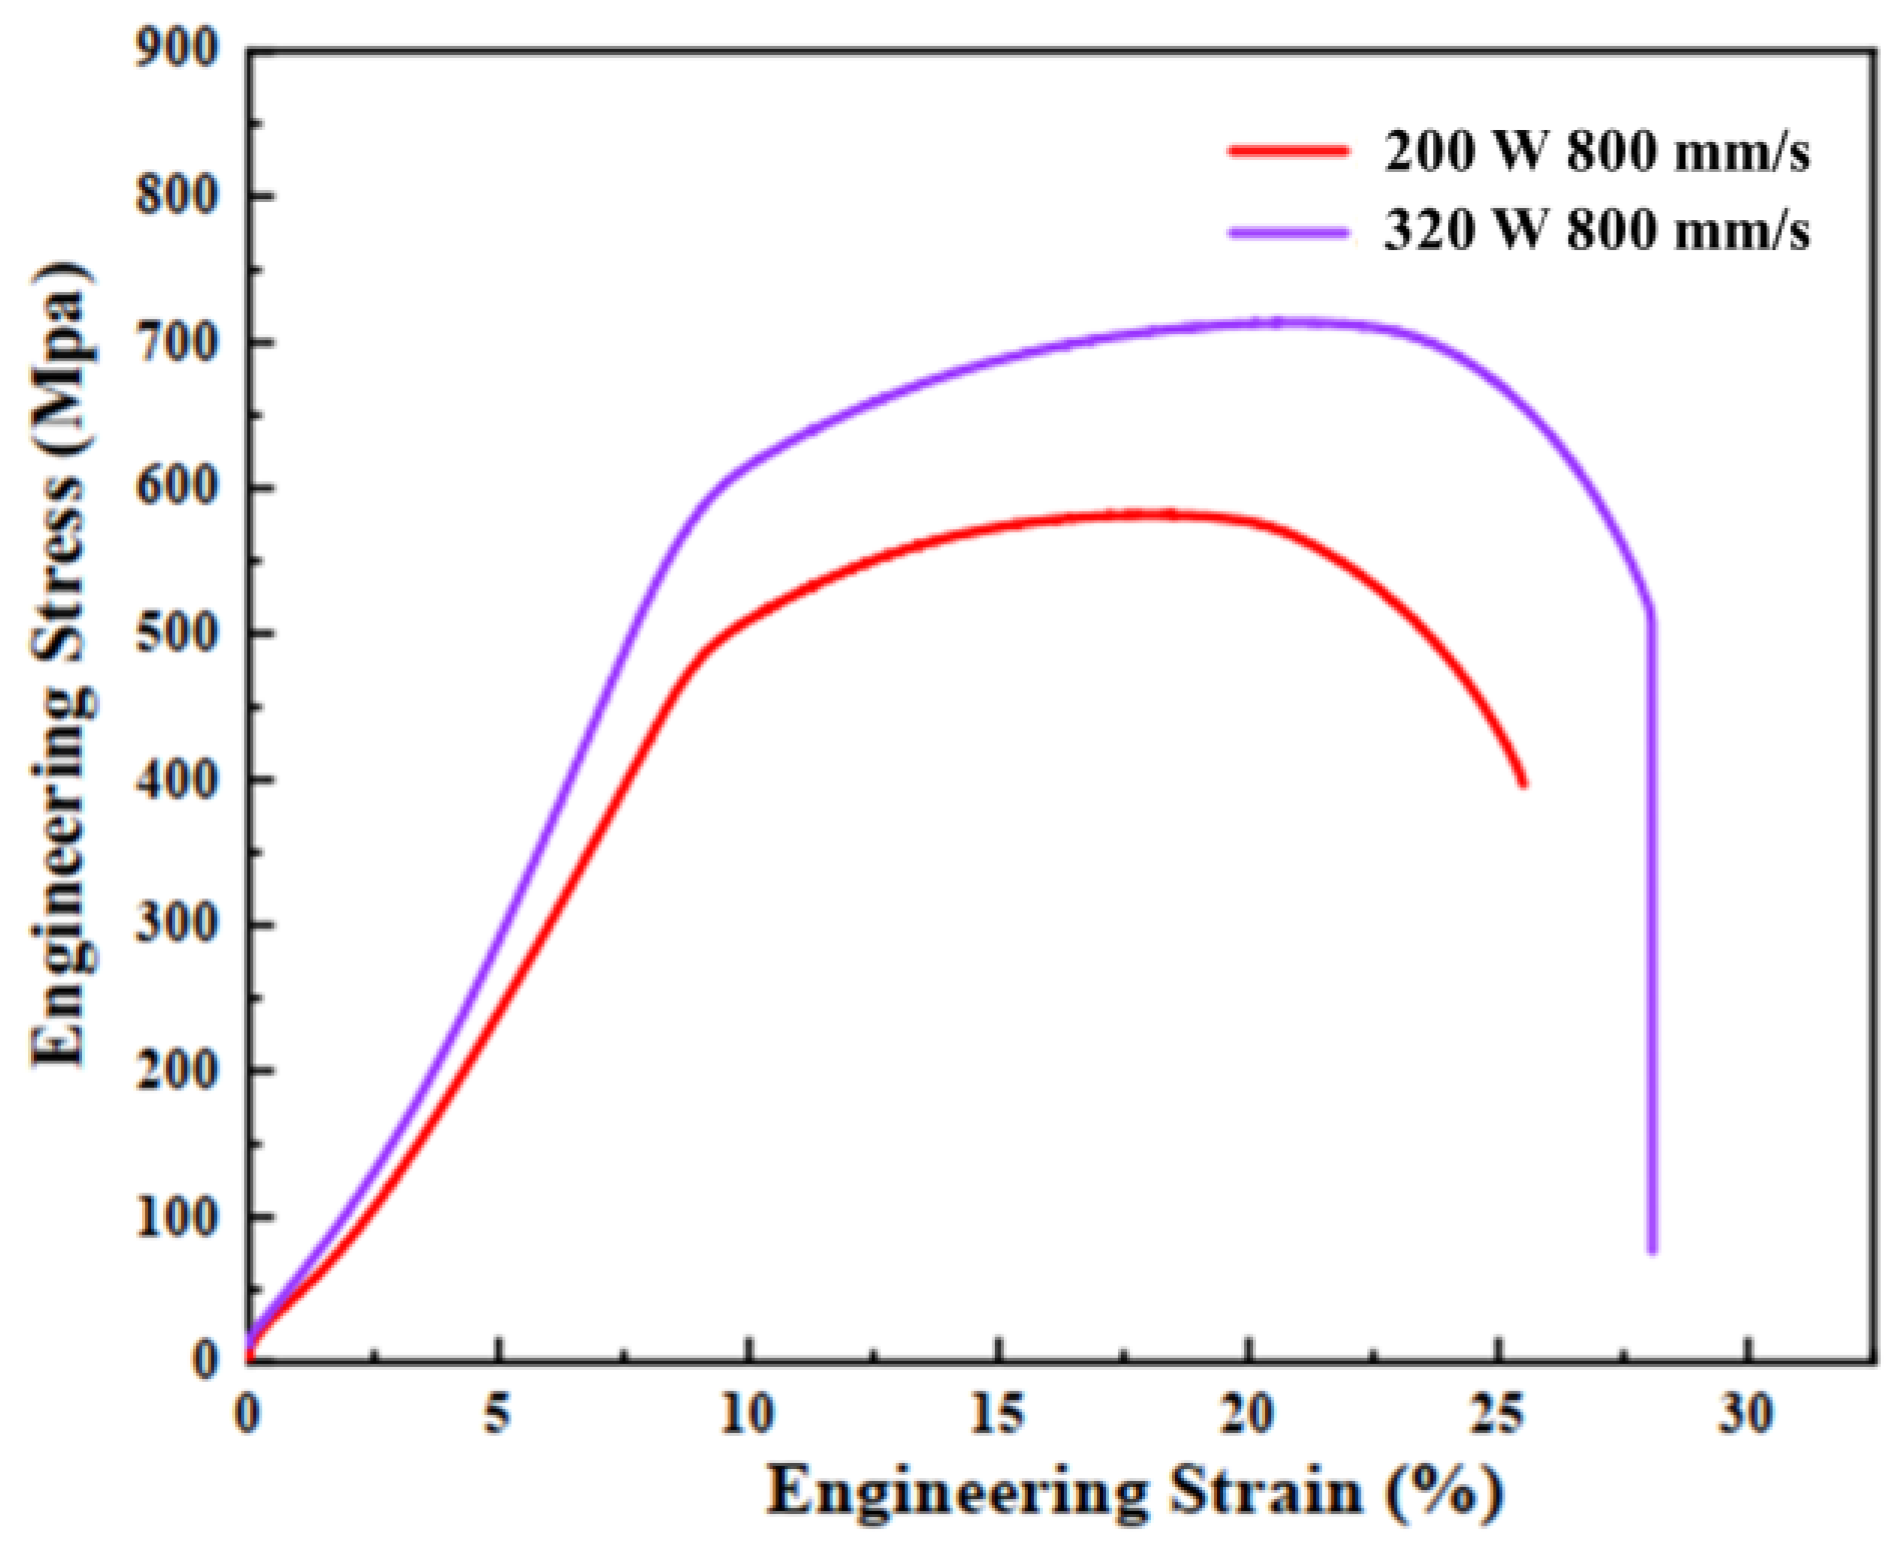
3.2. Mechanical Properties

Table 3 lists the micro-hardness of the SLMed CLF-1 steel from the bottom to the top along the deposition direction. As can be seen from Table 3, with the formation of martensites during the SLM process, the micro-hardness became high. It can be seen from Table 3 that the increase in laser power had no significant effect on the micro-hardness. The average micro-hardness of the bottom, middle, and top was 312 ± 7 HV, 289 ± 8 HV, and 293 ± 3 HV at 200 W power with 800 mm/s scanning velocity process, and 323 ± 6 HV, 310 ± 3 HV, and 296 ± 5 HV at 320 W power with 800 mm/s scanning velocity process, respectively. It can also be seen that the micro-hardness from the bottom, middle, and top of the sample was similar, which indicates that the microstructure uniformity was relatively consistent during the SLM Process.
Figure 8 shows the stress–strain curves of the SLMed CLF-1 steels. As can be seen from Figure 8, the sample at 320 W power with 800 mm/s scanning velocity exhibited a higher yield strength of 875 ± 6.0 MPa and higher elongation of 25.6 ± 0.8% than that of the sample with 200 W power, 800 mm/s scanning velocity, yield strength of 715 ± 1.5 MPa, and elongation of 22.6 ± 1.2%. The ultimate tensile strength samples at 200 W and 320 W power with 800 mm/s scanning velocity were 710 ± 5.1 MPa and 553 ± 7.2 MPa, respectively. The ductility and strength of the SLMed samples was about the same as the forgings [16]. In polycrystals, the yield strength(σs) and the average grain diameter(d) satisfy the Hall–Petch relationship: σs = σ0 + Kd−1/2, where K is the influence coefficient of the grain boundary on deformation, which is related to the grain boundary structure. The higher yield strength at 320 W power and 800 mm/s scanning velocity can be explained by the average grain diameter(d) being smaller than that of the sample with 200 W power and 800 mm/s scanning velocity.
Owing to the unique microstructure formed by the SLM process as shown in Figure 3, Figure 4, and Figure 6, stress concentration occurred at the interface between the columnar grains and the equiaxed grains. The ductility increased due to the stress being dispersed in numerous equiaxed grains. Many fine carbides precipitating from substrate play an important role in precipitation hardening to increase the strength. As a result, the SLMed CLF-1 steel displayed excellent mechanical properties.

4. Conclusions

In this study, the cube and tensile samples of the SLMed CLF-1 steel were formed with the selected laser melting technique at different laser powers and scanning velocities. Furthermore, the microstructure and mechanical properties of these samples have been systematically researched. The conclusions are shown as follows:
(1)
The relative density of the SLMed CLF-1 samples exceeded 99%, and there were no obvious tracks and pores in the samples due to using the PREP powder.
(2)
Numerous nano-sized spherical and needle-like precipitates were dispersion distributed in the grains and boundary of the grains, and the precipitates were mainly composed of M23C6 carbide and MX carbide. The microstructure was composed of columnar grains and equiaxed grains, and the smallest average size of the grains was 15 ± 2.1 µm under the procedure parameters of 320 W power and 800 mm/s scanning velocity.
(3)
The sample at 320 W power and 800 mm/s scanning velocity exhibited higher yield strength (875 ± 6.0 MPa) and higher elongation (25.6 ± 0.8%) than that of the sample at 200 W power, 800 mm/s scanning velocity, yield strength (715 ± 1.5 MPa), and elongation (22.6 ± 1.2%).
The investigation showed that the room temperature comprehensive mechanical properties of SLMed CLF-1 steel are same as the forgings. The investigation also provides a new processing strategy for fabricating SLMed CLF-1 steel components. However, the microstructure of SLMed CLF-1 steel has coarse columnar grains, and the obvious anisotropy of these columnar grains will cause significant differences in the tensile properties of different deposition directions. It is necessary to focus on the deposition samples of different directions in the future. Furthermore, SLMed CLF-1 steels have been used in high-temperature environments for a long time, and our follow-up work will study the high-temperature mechanical properties of SLMed CLF-1 steels samples. This work lays the foundation for the application of SLMed CLF-1 steel in the nuclear industry and serves as a significant guide suggestion for the research of first-wall cladding material.

Author Contributions

Z.Y.: Conceptualization, methodology, writing—original, draft; C.X.: investigation, methodology, data curation; H.L. (Hao Liu): methodology, writing—original; X.S.: investigation, draft, writing—review and editing; G.Z.: writing—review and editing; H.L. (Hongbin Liao): formal analysis; W.Q.: conceptualization; J.Y.: methodology; C.L.: supervision; H.W.: investigation, resources, writing—review and editing. All authors have read and agreed to the published version of the manuscript.

Funding

This work was supported by the National Magnetic Confinement Fusion Science Program of China (Project No. 2019YFE03090100).

Data Availability Statement

The data that support the findings of this study are available from the corresponding author, upon reasonable request.

Conflicts of Interest

The authors declare that they have no conflict of interest in this work.

References

  1. Zinkle, S.J.; Busby, J.T. Structural materials for fission & fusion energy. Mater. Today 2009, 12, 12–19. [Google Scholar]
  2. Rietema, C.J.; Walker, M.A.; Jacobs, T.R.; Clarke, A.J.; Clarke, K.D. High-throughput nitride and interstitial nitrogen analysis in ferritic/martensitic steels via time-of-flight secondary ion mass spectrometry. Mater. Charact. 2021, 179, 111357. [Google Scholar] [CrossRef]
  3. Odette, G.; Alinger, M.; Wirth, B. Recent developments in irradiation-resistant steels. Annu. Rev. Mater. Res. 2008, 38, 471–503. [Google Scholar] [CrossRef]
  4. Xia, Z.; Zhang, C.; Liu, W.; Yang, Z. Effect of surface mechanical attrition treatment on precipitation behaviors and ferrite grains in heat resisting steels. ISIJ Int. 2014, 54, 1935–1942. [Google Scholar] [CrossRef] [Green Version]
  5. Shin, S.H. A Study on Corrosion Behaviors of Ferritic/Martensitic Steels in Liquid Sodium Condition for Sodium-cooled Fast Reactor Application. Ph.D. Thesis, Graduate School of Unist, Ulsan, Republic of Korea, 2015. [Google Scholar]
  6. Hirai, T.; Barabash, V.; Escourbiac, F.; Durocher, A.; Ferrand, L.; Komarov, V.; Merola, M. Iter divertor materials and manufacturing challenges. Fusion Eng. Des. 2017, 125, 250–255. [Google Scholar] [CrossRef]
  7. Tanigawa, H.; Shiba, K.; Sakasegawa, H.; Hirose, T.; Jitsukawa, S. Technical issues related to the development of reduced-activation ferritic/martensitic steels as structural materials for a fusion blanket system. Fusion Eng. Des. 2011, 86, 2549–2552. [Google Scholar] [CrossRef]
  8. Feng, K.; Wang, X.; Feng, Y.; Chen, Y.; Zhao, Z.; Li, Z.; Wang, P.; Wang, Q.; Ye, X.; Zhao, F.; et al. Current progress of chinese hccb tbm program. Fusion Eng. Des. 2016, 109, 729–735. [Google Scholar] [CrossRef]
  9. Huang, W.; Lin, X. Research progress in laser solid forming of high-performance metallic components at the state key laboratory of solidification processing of china. 3d Print. Addit. Manuf. 2014, 1, 156–165. [Google Scholar] [CrossRef]
  10. Gu, D.; Shi, X.; Poprawe, R.; Bourell, D.L.; Setchi, R.; Zhu, J. Material-structure-performance integrated laser-metal additive manufacturing. Science 2021, 372, eabg1487. [Google Scholar] [CrossRef] [PubMed]
  11. Herzog, D.; Seyda, V.; Wycisk, E.; Emmelmann, C. Additive manufacturing of metals. Acta Mater. 2016, 117, 371–392. [Google Scholar] [CrossRef]
  12. Li, Z.; Chen, J.; Sui, S.; Zhong, C.; Lu, X.; Lin, X. The microstructure evolution and tensile properties of inconel 718 fabricated by highdeposition-rate laser directed energy deposition. Addit. Manuf. 2020, 31, 100941. [Google Scholar]
  13. Huang, B.; Zhai, Y.; Liu, S.; Mao, X. Microstructure anisotropy and its effect on mechanical properties of reduced activation ferritic/martensitic steel fabricated by selective laser melting. J. Nucl. Mater. 2018, 500, 33–41. [Google Scholar] [CrossRef]
  14. Zhai, Y.; Huang, B.; Mao, X.; Zheng, M. Effect of hot isostatic pressing on microstructure and mechanical properties of CLAM steel produced by selective laser melting. J. Nucl. Mater. 2018, 515, 111–121. [Google Scholar] [CrossRef]
  15. Boegelein, T.; Dryepondt, S.N.; Pandey, A.; Dawson, K.; Tatlock, G.J. Mechanical response and deformation mechanisms of ferritic oxide dispersion strengthened steel structures produced by selective laser melting. Acta Mater. 2015, 87, 201–215. [Google Scholar] [CrossRef] [Green Version]
  16. Liao, H.; Wang, X.; Yang, G.; Feng, Y.; Wang, P.; Feng, K. Recent progress of R&D activities on reduced activation ferritic/martensitic steel (CLF-1). Fusion Eng. Des. 2019, 147, 111235. [Google Scholar] [CrossRef]
  17. Zhong, C.; Chen, J.; Linnenbrink, S.; Gasser, A.; Sui, S.; Poprawe, R. A comparative study of Inconel 718 formed by High Deposition Rate Laser Metal Deposition with GA powder and PREP powder. Mater. Des. 2016, 107, 386–392. [Google Scholar] [CrossRef]
  18. Lu, J.; Lin, X.; Kang, N.; Huang, W. Characterizations of micro-nano structure and tensile properties of a sc modified almn alloy fabricated by selective laser melting. Mater. Charact. 2021, 178, 111305. [Google Scholar] [CrossRef]
  19. Song, J.; Deng, Q.; Chen, C.; Hu, D.; Li, Y. Rebuilding of metal components with laser cladding forming. Appl. Surf. Sci. 2006, 252, 7934–7940. [Google Scholar] [CrossRef]
  20. Huang, Y.; Zeng, X.; Hu, Q.; Zhou, S. Microstructure and interface interaction in laser induction hybrid cladding of Ni-based coating. Appl. Surf. Sci. 2009, 255, 3940–3945. [Google Scholar] [CrossRef]
  21. Fan, W.; Tan, H.; Lin, X.; Huang, W. Microstructure formation of Ti-6Al-4 V in synchronous induction assisted laser deposition. Mater. Des. 2018, 160, 1096–1105. [Google Scholar] [CrossRef]
  22. Rosenthal, D. Mathematical Theory of Heat Distribution During Welding and Cutting. Weld. J. 1941, 20, 220–234. [Google Scholar]
  23. Li, X.P.; Ji, G.; Chen, Z.; Addad, A.; Wu, Y.; Wang, H.W.; Vleugels, J.; Van Humbeeck, J.; Kruth, J.P. Selective laser melting of nano-TiB2 decorated AlSi10Mg alloy with high fracture strength and ductility. Acta Mater. 2017, 129, 183–193. [Google Scholar] [CrossRef]
  24. Taneike, M.; Sawada, K.; Abe, F. Effect of carbon concentration on precipitation behavior of M23C6 carbides and MX carbonitrides in martensitic 9Cr steel during heat treatment. Met. Mater. Trans. A 2004, 35, 1255–1262. [Google Scholar] [CrossRef]
  25. Cui, H.; Sun, F.; Chen, K.; Zhang, L.; Wan, R.; Shan, A.; Wu, J. Precipitation behavior of Laves phase in 10%Cr steel X12CrMoWVNbN10-1-1 during short-term creep exposure. Mater. Sci. Eng. A 2010, 527, 7505–7509. [Google Scholar] [CrossRef]
Figure 1. Scanning electron microscope picture of the CLF-1 powder produced using the PREP method.
Metals 12 02044 g001
Figure 2. Schematic illustration of the scanning strategies and fabrication of bulks and tensile specimens.
Metals 12 02044 g002
Figure 3. Morphologies of grains under optical microscopy from top view (in XOY section): (a) 200 W power and 600 mm/s scanning velocity; (b) 200 W power and 800 mm/s scanning velocity; (c) 320 W power and 600 mm/s scanning velocity; (d) 320 W power and 800 mm/s scanning velocity.
Metals 12 02044 g003
Figure 4. Morphologies of grains under optical microscopy from side view (in XOZ section): (a) 200 W power and 600 mm/s scanning velocity; (b) 200 W power and 800 mm/s scanning velocity; (c) 320 W power and 600 mm/s scanning velocity; (d) 320 W power and 800 mm/s scanning velocity.
Metals 12 02044 g004
Figure 5. (a) XRD patterns of the as-deposited RAFM steels, (b) enlargement of the (110) peak, (c) enlargement of the (200) peak, and (d) enlargement of the (211) peak.
Metals 12 02044 g005
Figure 6. SEM images observed from the top view. (a) 200 W power and 800 mm/s scanning velocity; (b) 320 W power and 800 mm/s scanning velocity.
Metals 12 02044 g006
Figure 7. Balanced phase diagram.
Metals 12 02044 g007
Figure 8. Stress–strain curves of the SLMed CLF-1 steels.
Metals 12 02044 g008
Table 1. Chemical composition of the CLF-1 steel powder.
ElementCCrWTaVMnFe
Wt%0.119.41.50.150.210.4788.16
Table 2. The process parameters used in this investigation.
Laser Power (W)Scanning Velocity (mm/s)Layer Thickness (μm)Hatch Spacing (μm)
2006003085
800
320600
800
Table 3. Micro-hardness of the SLMed CLF-1 steel.
Location200 W 800 mm/s320 W 800 mm/s
Micro-hardness (HV)Top293 ± 3296 ± 5
Middle289 ± 8310 ± 3
Bottom312 ± 7323 ± 6
Publisher’s Note: MDPI stays neutral with regard to jurisdictional claims in published maps and institutional affiliations.

