Article

The Processing Map of Laser Powder Bed Fusion In-Situ Alloying for Controlling the Composition Inhomogeneity of AlCu Alloy

1
School of Mechatronics Engineering, Harbin Institute of Technology, Harbin 150001, China
2
Department of Mechanical and Energy Engineering, Southern University of Science and Technology, Shenzhen 518055, China
3
Shenzhen Key Laboratory for Additive Manufacturing of High-Performance Materials, Southern University of Science and Technology, Shenzhen 518055, China
*
Author to whom correspondence should be addressed.
Metals 2023, 13(1), 97; https://doi.org/10.3390/met13010097
Submission received: 23 November 2022 / Revised: 20 December 2022 / Accepted: 29 December 2022 / Published: 2 January 2023
(This article belongs to the Special Issue 3D Printing of Metal)

Abstract

:
In-situ alloying is a facile method for exploring high-performance metallic materials for additive manufacturing. However, composition inhomogeneity is inevitable, and it is a double-edged sword for the properties of in-situ alloyed parts. Appropriately controlling the composition inhomogeneity benefits the applications of in-situ alloying in specific microstructural and properties design. In this work, the Al20Cu alloy was selected as the benchmark alloy to investigate the tailoring of composition inhomogeneity. The morphology and area percentage of composition inhomogeneity in the as-built samples were firstly analyzed. These results provided evidence for the formation of composition inhomogeneity and indicate that its content is tightly dependent on processing parameters. The characteristics of the molten pool under various processing parameters were investigated by modeling the laser remelting process. Based on these, a processing map was established to guide the tailoring of composition inhomogeneity. This study expands the understanding of the formation mechanism of composition inhomogeneity in in-situ alloyed parts and sheds light on employing laser powder bed fusion in-situ alloying for new materials development.

1. Introduction

Laser powder bed fusion (LPBF) in-situ alloying is a cutting-edge technology, which realizes in-situ alloying of a certain proportion of different alloys or elemental powders by laser during the printing process, providing a simple method for optimizing the microstructure and composition characteristics of components [1]. Modification of alloy composition by in-situ alloying has been widely applied in LPBF [2,3,4,5,6,7]. However, chemical composition inhomogeneity due to inadequate in-situ alloying has been commonly observed. Generally, the composition inhomogeneity shows a negative impact on the quality of printed parts [5,7,8,9]. For instance, Lin et al. [6] reported that Si inhomogeneities decreased the ductility of Si-containing FeCoCrNi fabricated by in-situ alloying. However, with proper control, composition inhomogeneity can be utilized to ameliorate the performance of the components [10,11,12,13]. T. Zhang et al. [10] found that the strength and toughness of the alloy can be improved synchronously by reasonably utilizing the composition inhomogeneity. Therefore, reasonable control of composition inhomogeneity is a key challenge in manufacturing reliable parts by in-situ alloying.
Composition inhomogeneity is produced through inadequate homogenization of different melt in the molten pool during LPBF in-situ alloying [10,14] in which the melt has undergone an intense mixing process due to Marangoni fluid flow [15]. Although Marangoni fluid flow tends to homogenize the melt in the molten pool, the chaotic mixing traces are preserved due to the small size and rapid cooling of the molten pool of LPBF [14,16]. Thus, the morphology that arises after the laser melting can be observed in various in-situ alloyed alloys [6,10,17]. Considering the shape and melt flow of the molten pool are tightly connected with the processing parameters of LPBF [18], it is, therefore, a direct way to control the intermixing process by adjusting processing parameters. In the past a few years, considerable research has proved that composition inhomogeneity is alleviated by increasing laser energy input [17,19,20]. However, to our knowledge, no attempt has been made to define a function for processing parameters to characterize the mixing capacity of the corresponding molten pool, which is important for controlling the composition inhomogeneity. Thus, more basic investigations would be advisable.
Recently, increased attention has focused on Al–Cu alloys due to their high strength, corrosion resistance, and low density [21,22,23]. Meanwhile, the composition inhomogeneity of Al-Cu binary alloys with high copper content can be distinguished by both the distinct change in microstructure and the difference in contrast via backscattered electron (BSE) imaging [19,24]. Therefore, the Al20Cu alloy was selected as the benchmark alloy of the current research, and the mechanism of controlling the composition inhomogeneity via adjusting processing parameters during in-situ alloying was intensely studied experimentally and numerically. The LPBF processing parameters were well designed to avoid the chaotic keyhole, because the chaotic keyhole mode molten pool results in the generation of excessive porosity [18], which damages the performance of the component. The relationship between melt flow behavior and processing parameters was investigated by modeling the laser molten pool under various processing parameters. Based on this, a processing map was established to guide the drafting of processing parameters in in-situ alloying.

2. Materials and Methods

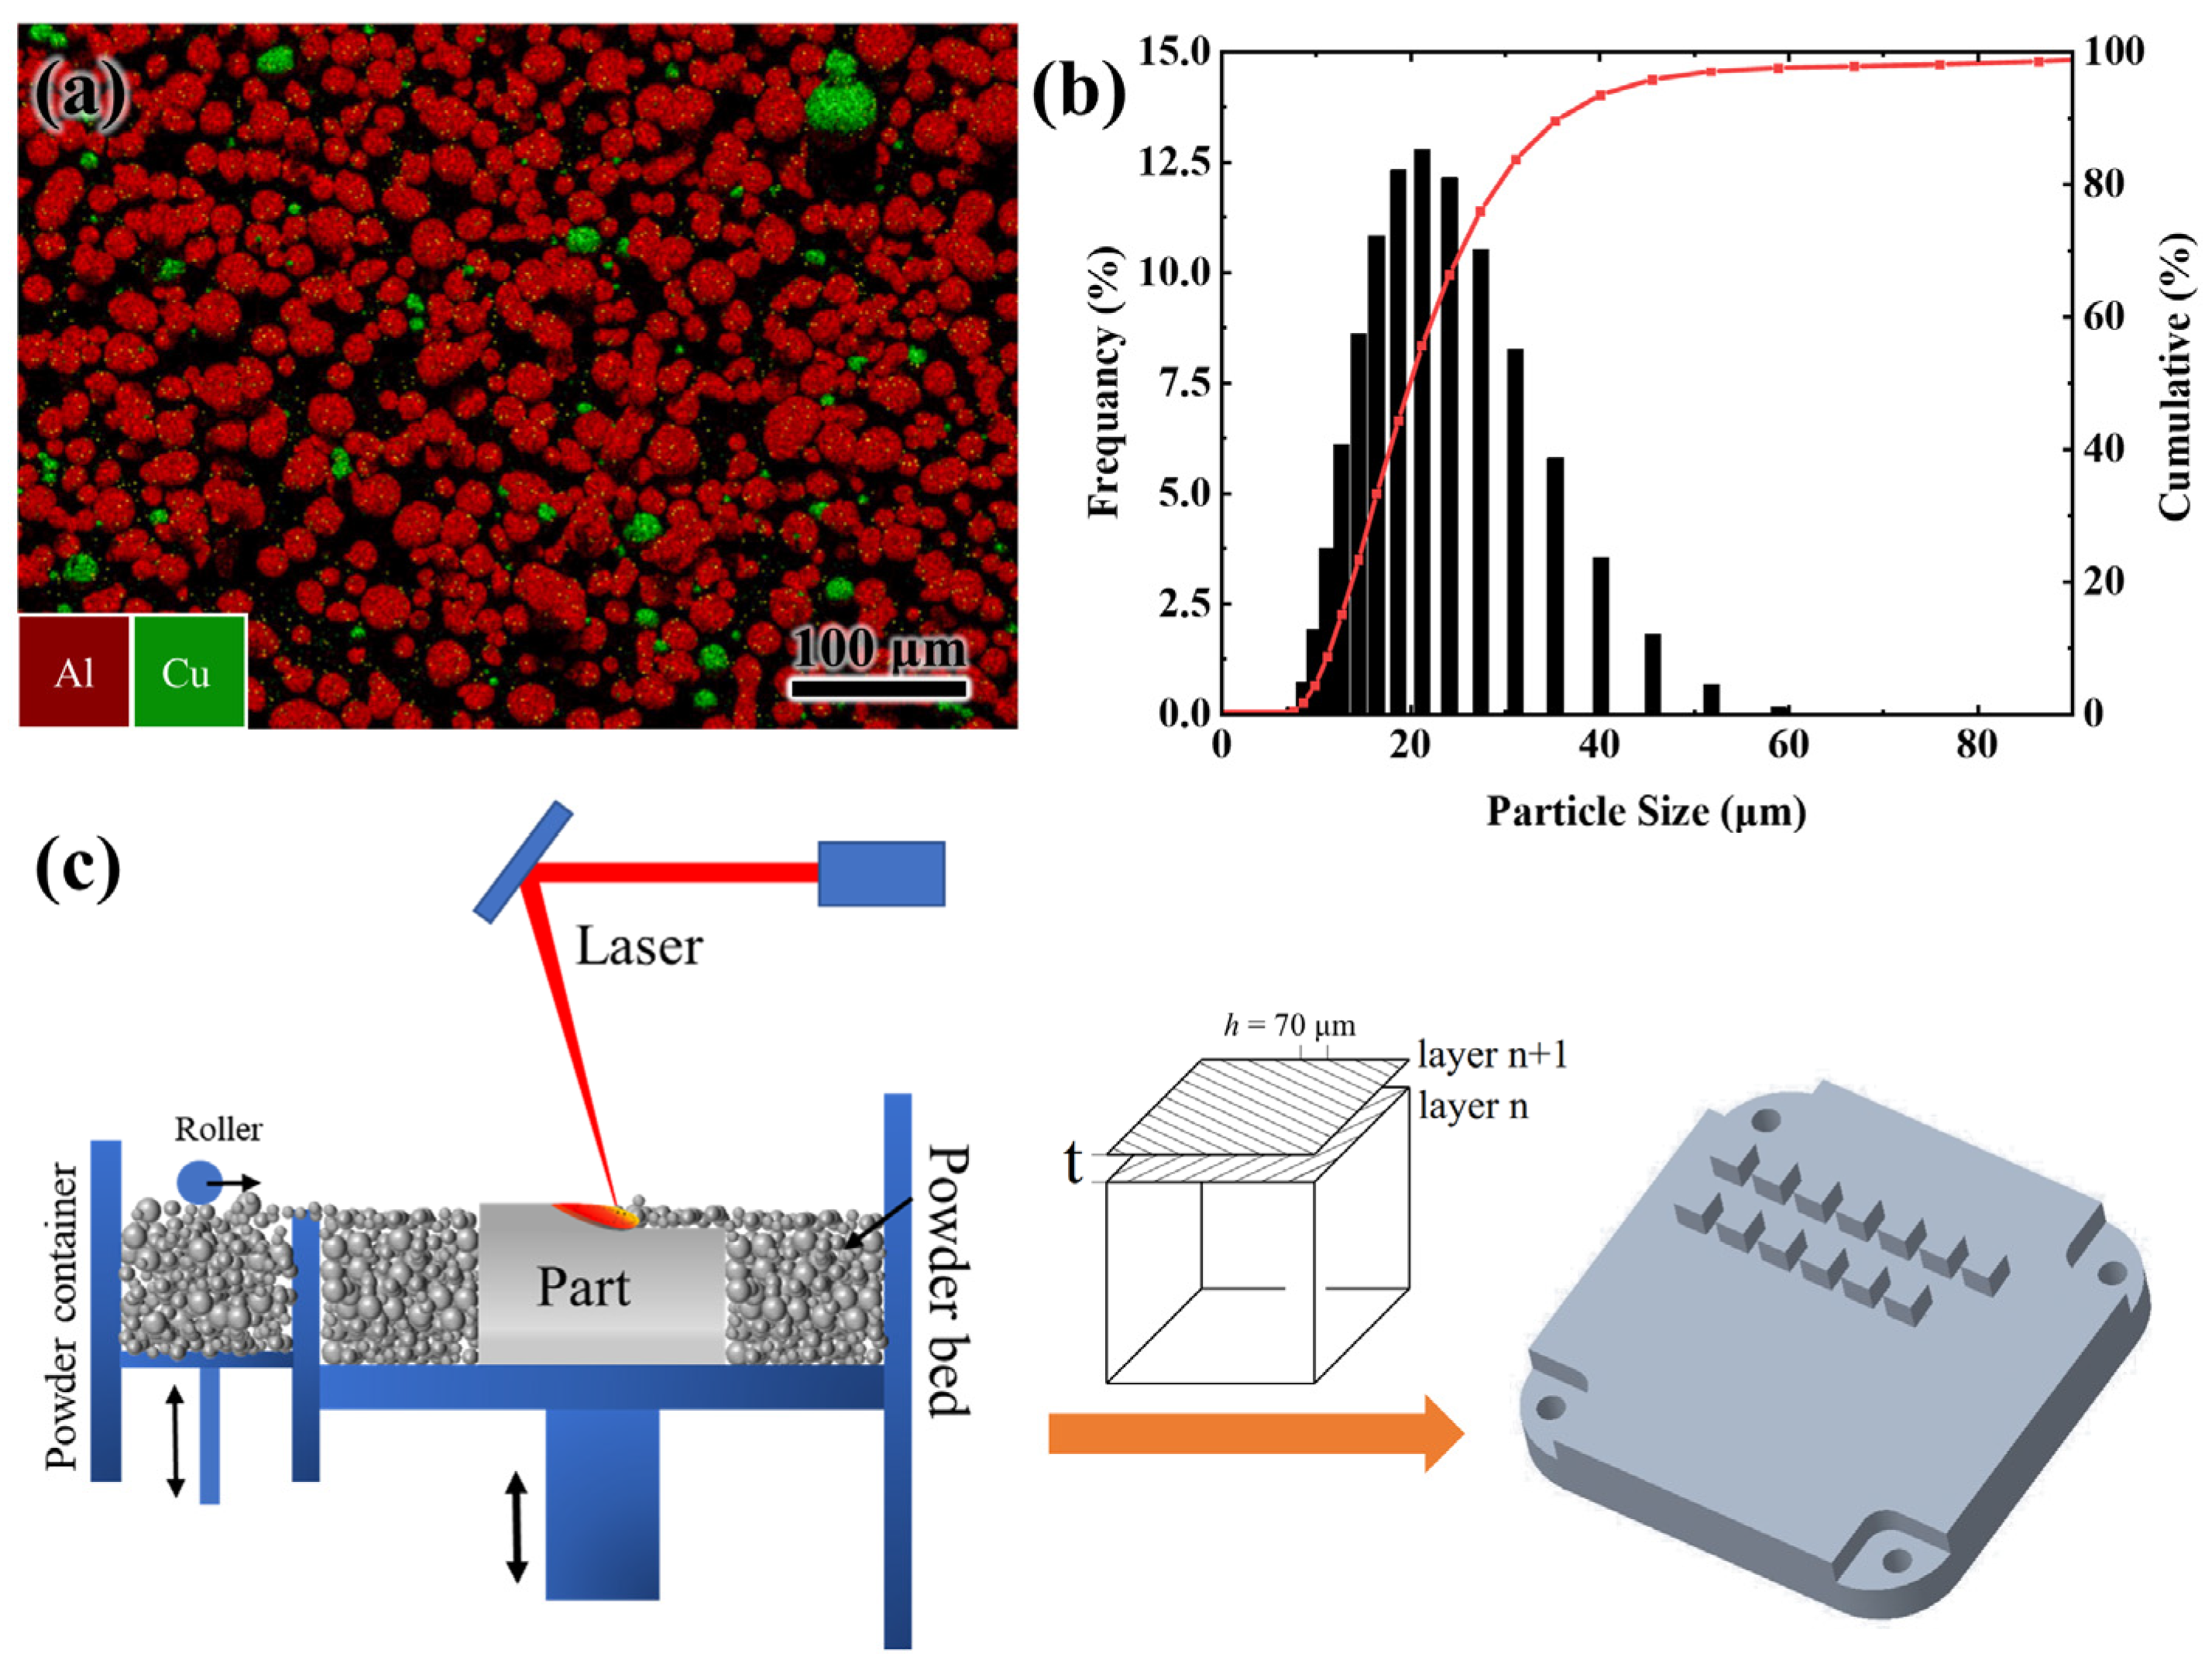
2.1. Sample Preparation and Microstructural Characterization

The gas-atomized commercial pure Al (99.9%) powder and pure Cu (99.9%) were overall spherical with a powder size distribution range of 15–53 μm. The 80 wt.% of pure Al powder and 20 wt.% of pure Cu powder were weighed and mixed with 180 g agate ball by WAB Turbula mixer (WAB, Moutonz, Switzerland) for 8 h for homogenization. The blended powder was measured by energy dispersive spectroscopy (EDS, Zeiss, Oberkochen, Germany) mapping and showed a uniform distribution, as shown in Figure 1a. The size of blended powder was also measured by Matersizer 300+ EV (Malvern Panalytical, Shanghai, China), as shown in Figure 1b.
The experimental samples were printed by EOS 290 equipment (EOS GmbH, Munich, Germany), which is equipped with a spot diameter of 70 μm laser. The power and scanning rate of the laser is the most important processing parameters for the molten pool formation, therefore, in the current work, only these two parameters were studied. The processing parameters used in the current study are listed in Table 1. The processing parameters design refers to the research [23,25] on processing parameters of LPBF aluminum alloy; higher scanning speed was used at high laser power and lower scanning speed at low laser power to avoid the chaotic keyhole and lack-of-fusion pores. The layer thickness and the hatch space should be as small as possible to facilitate the powder melting. The layer thickness was set as 30 μm, slightly larger than the powder average size of 22 μm, and the hatch space was set as 70 μm, equal to the size of the laser spot. A standard alternating x/y-raster scan strategy was used to build the samples, as shown in Figure 1c. The entire printing process was conducted in an inert argon atmosphere.
The specimens were ground and polished to a mirror finish by the conventional metallographic preparation method. Microstructure characterization was conducted on Zeiss Merlin field emission scanning electron microscope (SEM, Zeiss, Oberkochen, Germany) equipped with an energy dispersive spectroscopy (EDS). All characterizations of printed samples were performed on the XY plane (perpendicular to the building direction), which better shows the melting of the powder layer.

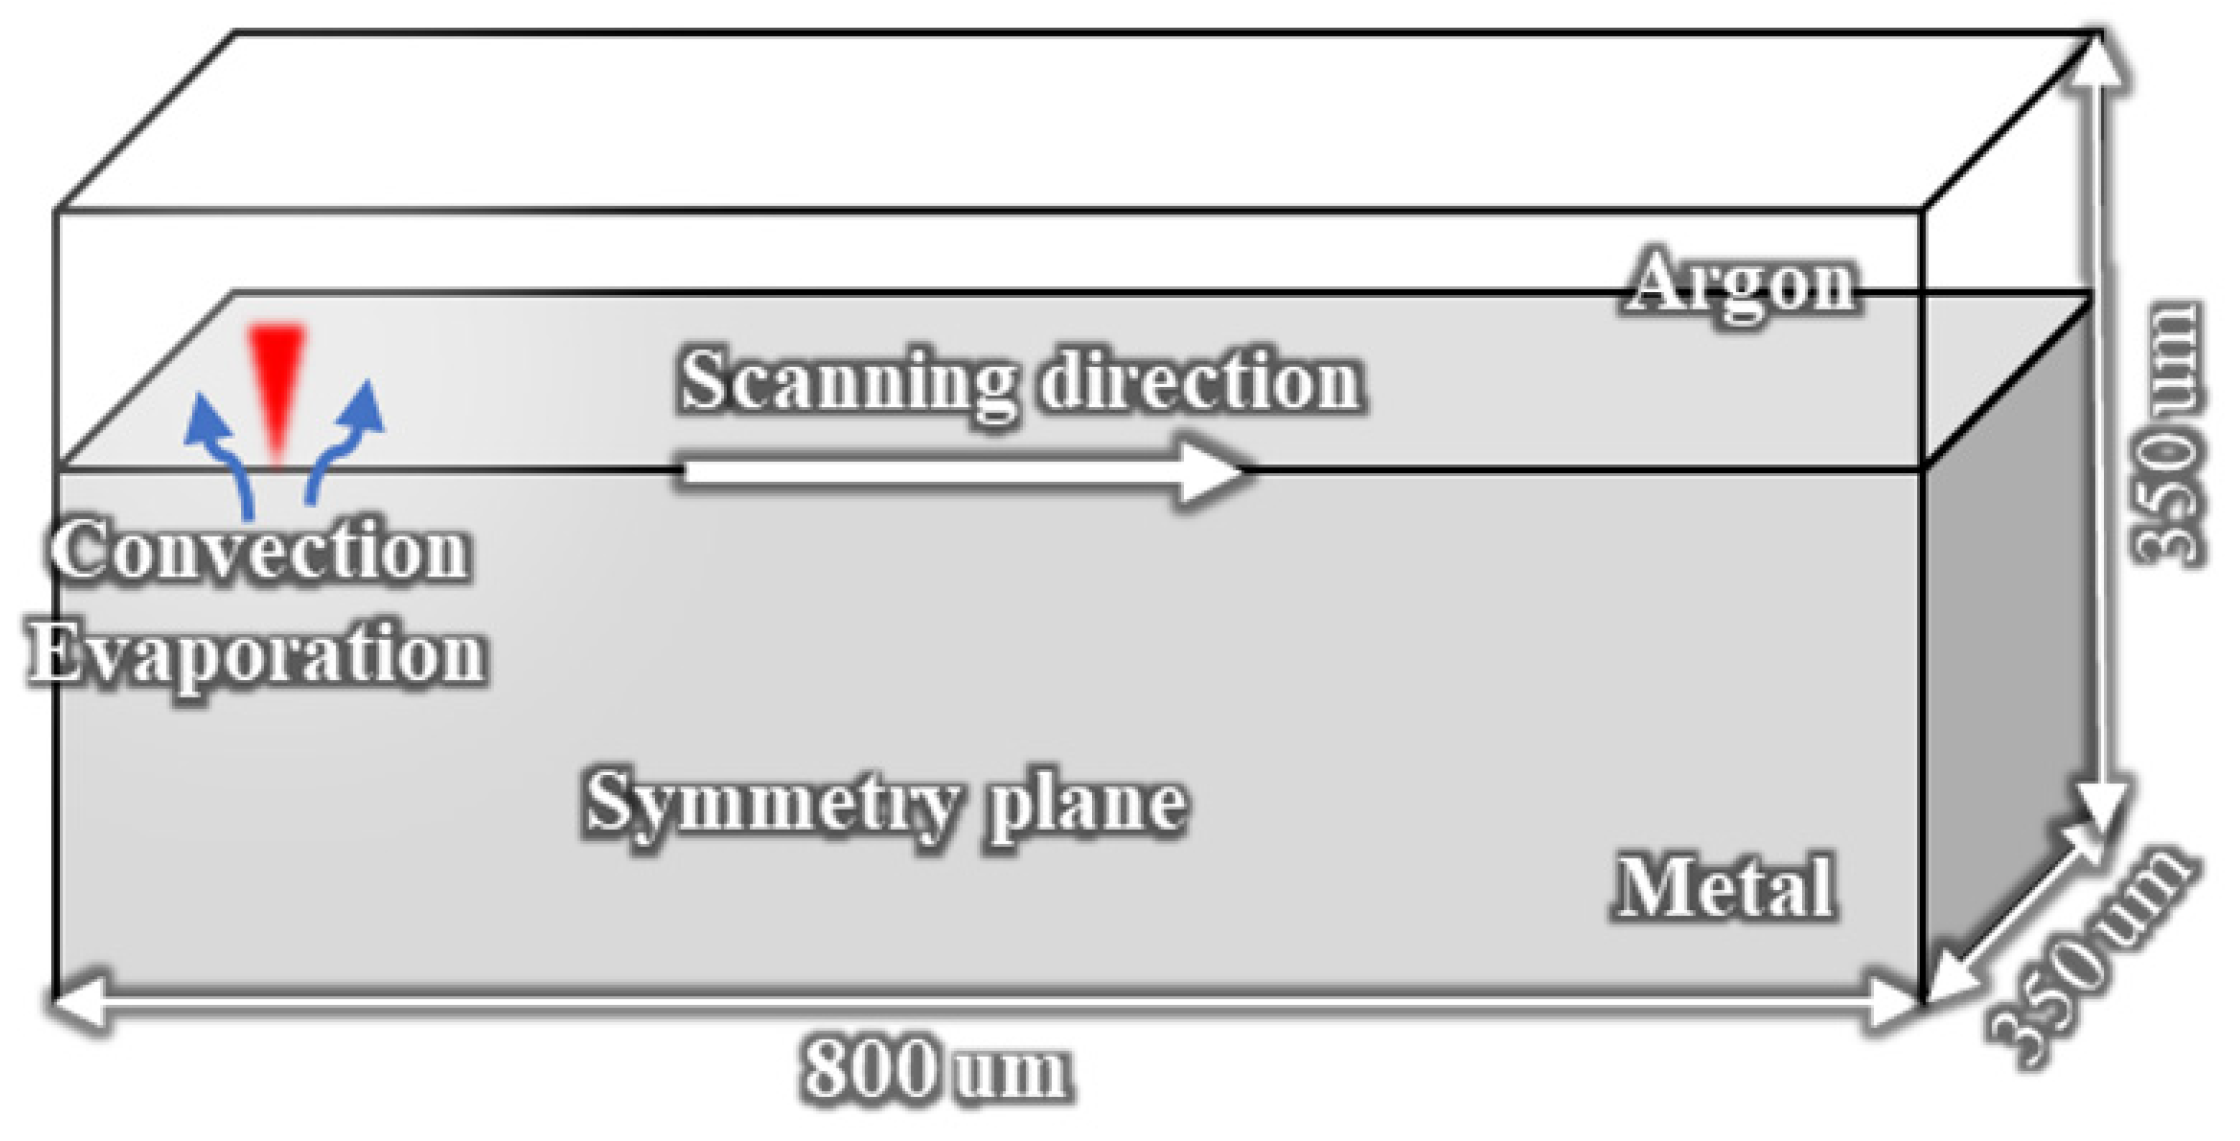
2.2. Laser Molten Pool Modeling

Previous studies on LPBF molten pool have revealed that the melt flow and shape of the molten pool is dominated by the Marangoni effect and metal vaporization [26,27]. This study focuses on comparing the effect of processing parameters on the characteristics of the molten pool, such as melt flow and shape of the molten pool. Therefore, the Marangoni effect and metal vaporization are weighed and the powder kinetics are ignored in this model. The LPBF process is simplified as laser remelting of Al20Cu alloy. Figure 2 shows the schematic of computational domain. Only half of the workpiece was taken into account to save computing resources. A movable laser is scanning in the +x direction to melt the metal, and this process is conducted in an argon atmosphere. The interactions of laser and metal, such as melting, solidification, metal evaporation, and Marangoni effect, were included in this model. The melt in the molten pool is treated as incompressible Newtonian laminar flow. This simulation was implemented in the commercial software FLUENT (18.0, ANSYS, Beijing, China). Based on these simplifications, the molten pool characteristics over the shifts in processing parameters were obtained quickly.
The governing conservation equations of mass, momentum, and energy concentration is formulated as follows [27,28,29]:
ρ t + · ρ u = 0 ,
ρ ( u t + ( u · ) u ) = · [ p I + μ u + μ ( u ) T ] + ρ g + p s + P evp + F SL ,
ρ c p ( T t + u T ) = · ( k T ) + Q l + Q con + Q evp + Q SL ,
where u , ρ , c p , μ , and k are the fluid velocity, density, specific heat, viscosity, and thermal conductivity, respectively. ρ g is the gravitational volume force. The source terms (in bold) were added by coupling with the user-defined functions (UDF), which will be described in detail below.
The gas–liquid interface is captured by the volume-of-fluid (VOF) method and the reactions on the free surface were written as volumetric with a continuum surface force (CSF) method [30].
F t + · ( F u ) = 0 ,
where F is the volume fraction of gas or metal.
The important reactions in the metal/gas surface are the laser heat flux and metal evaporation in this process. The laser heat flux Q l input at the metal/gas interface is assumed as a Gaussian laser beam, which can be described as [31]:
Q l = 2 P · η l π r b 2 exp ( 2 ( ( x V · t ) 2 + y 2 ) r b 2 ) · | F | 2 ρ s u f · c P s u f ρ m c P m + ρ g c P g ,
where P is laser power, V is laser scanning rate, r b is the effective laser beam radius, x and y are the distance to the laser beam’s center in x and y directions, η l is laser absorptivity. | F | is the absolute value of the gradient of metal phase volume fraction. The specific heat capacity and density of metal, gas, and surface are indicated by c P and ρ with subscript m, g, and suf, respectively.
The reaction of metal evaporation is included in this model. The vapor recoil pressure P vap and vapor heat loss Q vap can be formulated as [27,28,29]:
P vap = 0.54 P a exp ( M · L e v p K B ( T T e v p T · T e v p ) ) · | F | 2 ρ s u f ρ m + ρ g ,
Q vap = L e v p · 0.82 2 π R M · T · P a exp ( M · L v K B ( T T e v p T · T e v p ) ) · | F | 2 ρ s u f · c P s u f ρ m c P m + ρ g c P g ,
where L e v p , T e v p , P a , R , M , and K B are evaporation latent heat, evaporation temperature, ambient pressure, gas constant, molecular weight, and Boltzmann constant, respectively.
For the non-isothermal free surface, the moment source term p s caused by surface tension pressure and the Marangoni shear stress was formulated by [28]:
p s = ( γ κ · n s T d γ d T ) · | F | 2 ρ s u f ρ m + ρ g ,
where κ is the curvature of a free surface, γ is the surface tension, and n is the normal unit vector. d γ d T represent the temperature coefficient of surface tension.
The corresponding boundary condition for heat loss Q con of convection and radiation at the free surface was written as [31]:
Q con = ( h c ( T T 0 ) + σ ε ( T 4 T 0 4 ) ) · | F | 2 ρ s u f · c P s u f ρ m c P m + ρ g c P g ,
where h c is the coefficient of convection heat transfer, σ is Stefan-Boltzmann constant, and ε is the radiant emissivity.
The solid–liquid phase change of metal is considered by set a pseudo solidification interface, which is identified by temperature. The liquid fraction fL is defined as follows [32]:
f L = { 0 , T < T S T T S T L T S , T S   T     T L 1 , T L < T ,
where TS is the solidus temperature and TL is the liquidus temperature. Enthalpy-porosity method is used to model the melting and solidification process [32]. The melt velocity is damped when going through the mush zone, and it vanished in the solid. The damping force F SL when fluid goes through the mush zone and the latent heat release or absorb during metal melting or solidification can be expressed as follows:
F SL = A mush ( f L ) 2 ( f L 3 + 0.001 ) · u ,
Q SL = [ ρ Δ L f t + · ( ρ u Δ L f ) ] ,
where Δ L f is the latent heat of solid-liquid phase change. The parameter A m u s h is the mushy zone constant, which is set to 1 × 10¹⁰ in this model.
The mesh cell size is 4 μm and time step is 10−6 s. The second-order upwind method was used for the spatial discretization of energy and momentum. The pressure implicit with splitting of operators (PISO) algorithm was applied for the velocity-pressure coupling. The thermophysical properties of Al20Cu alloy were calculated by Thermo-calc software and listed in Table 2.

3. Results and Discussion

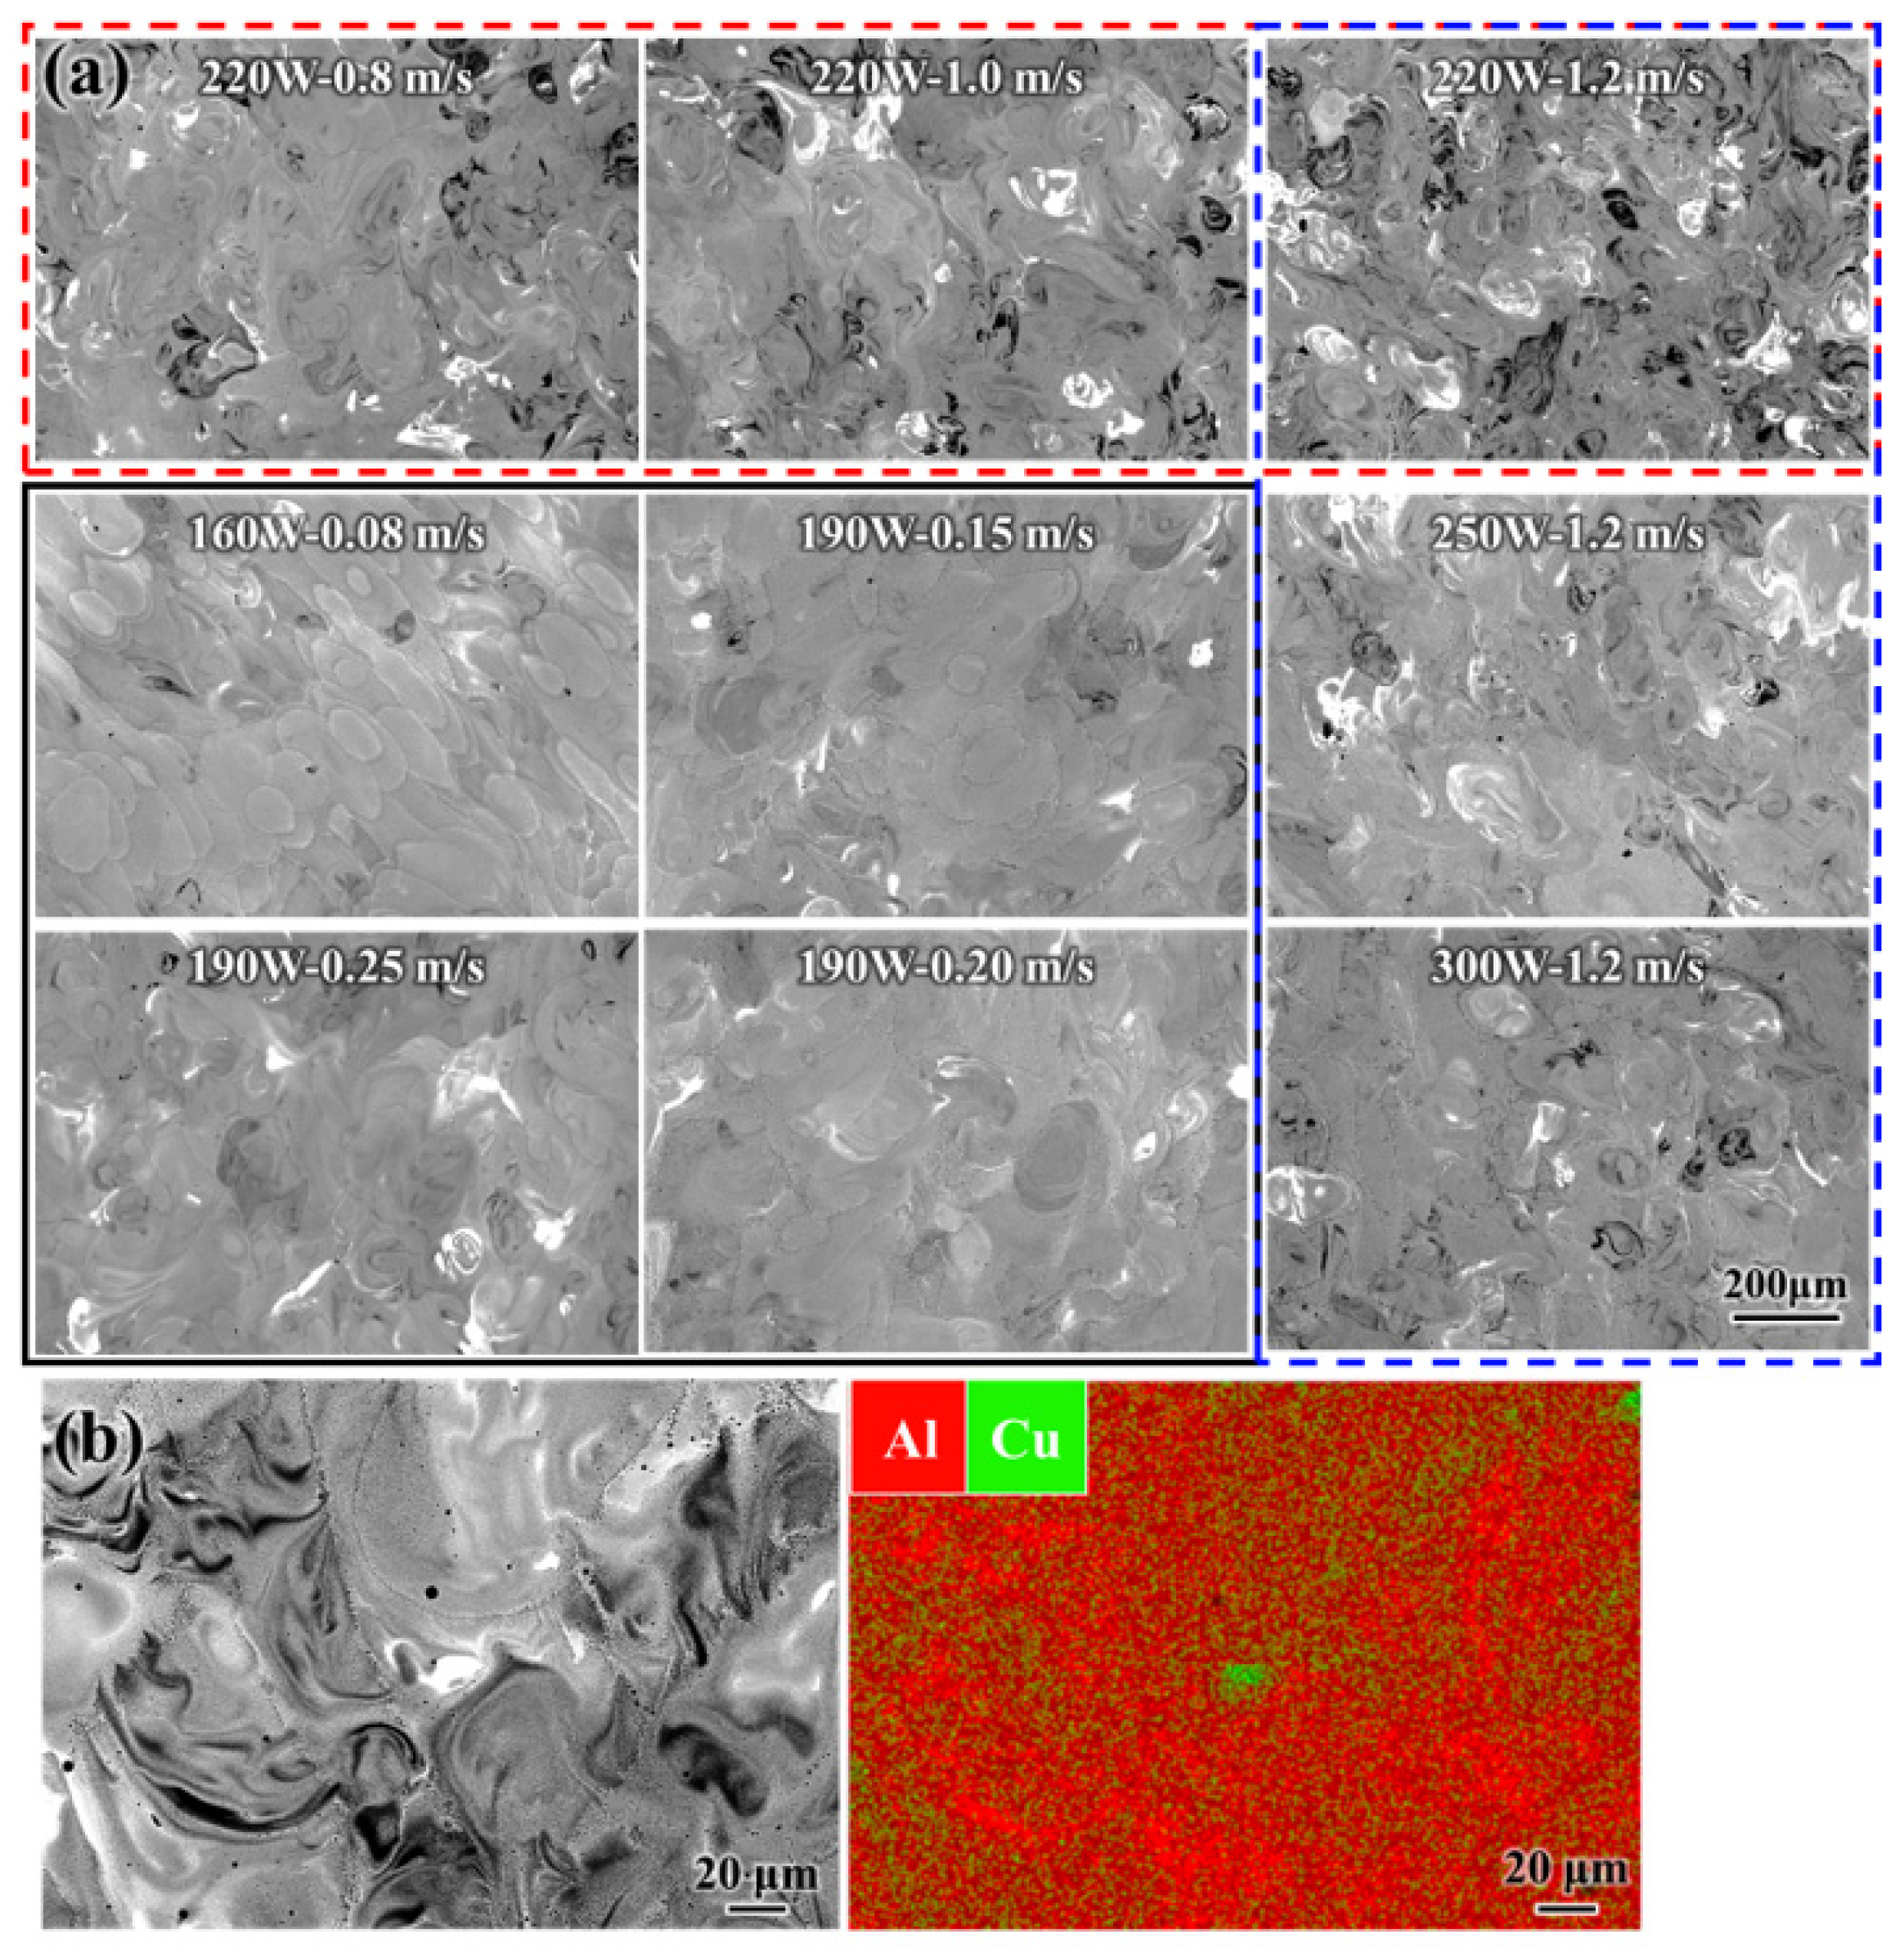
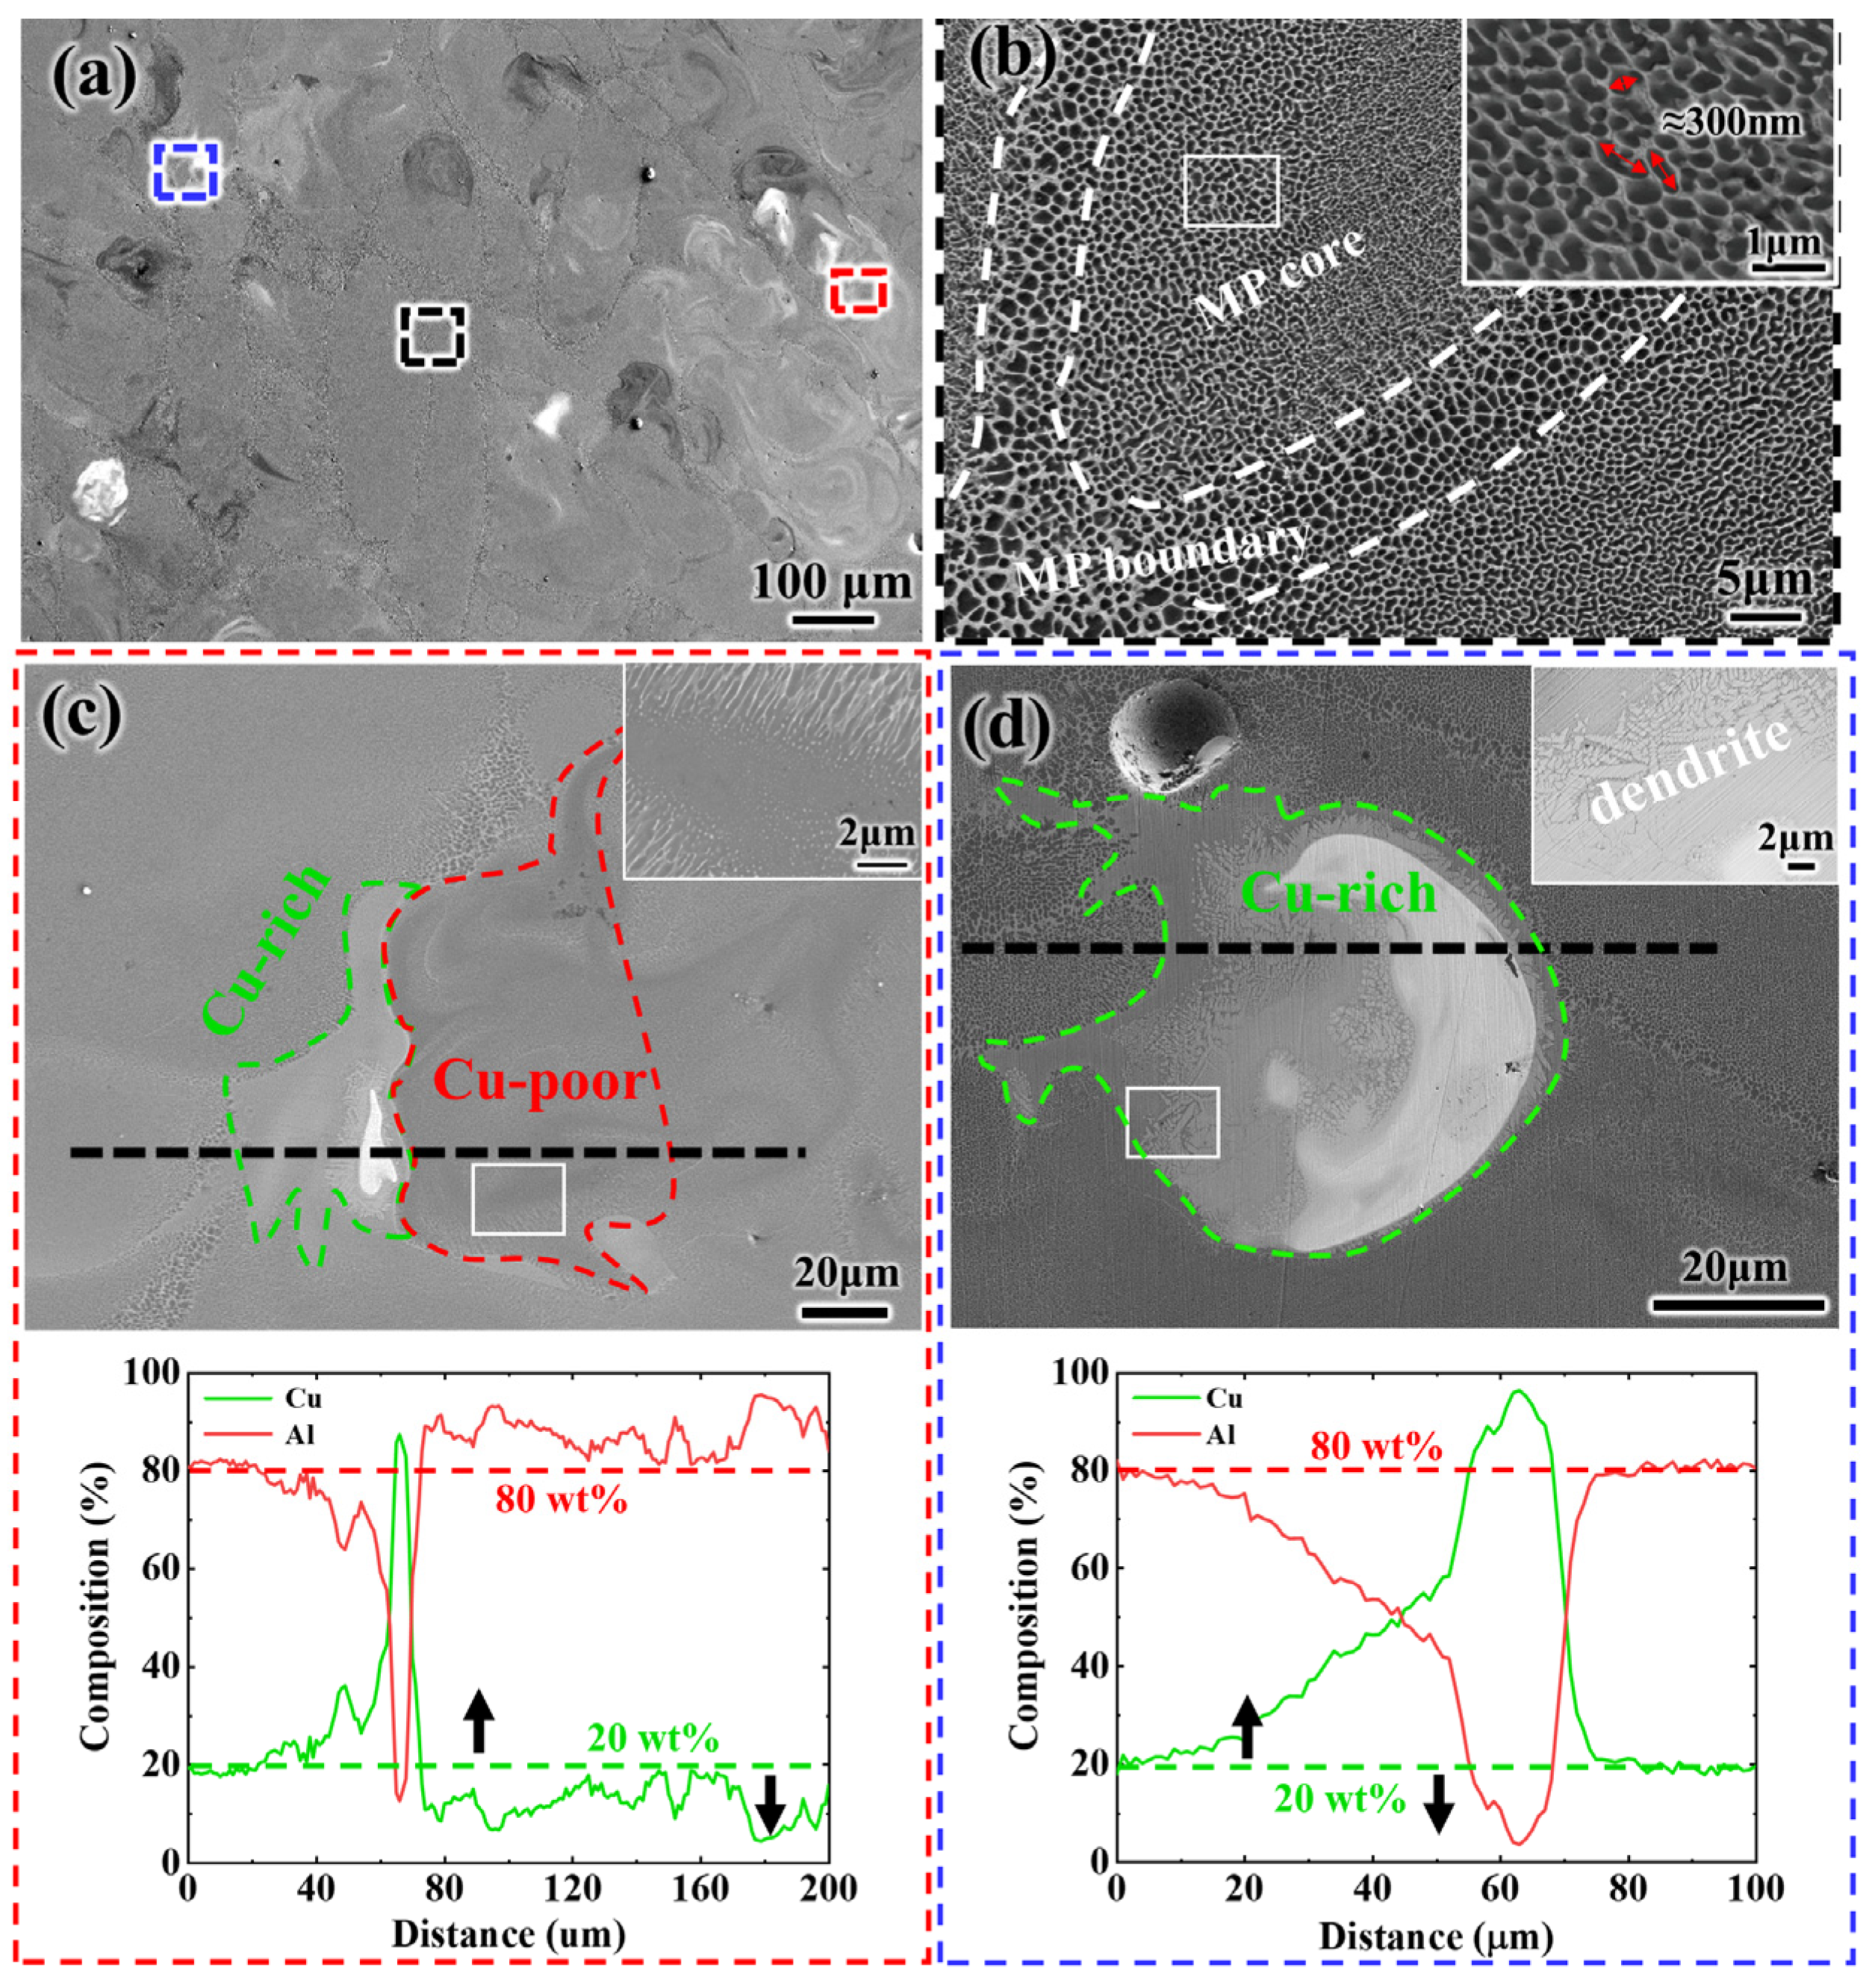
3.1. Composition Inhomogeneity of Al20Cu Alloy

Figure 3a shows the composition inhomogeneity morphology of the Al20Cu samples in-situ alloyed at different processing parameters. Figure 3b shows the elements distributed on the dark and bright regions of the BSE micrograph that commonly existed in most of the samples. By comparing the results of the BSE micrograph with the EDS mapping result, the bright area, dark area, and grey area in the BSE micrograph can be distinguished as Cu-rich zone, Cu-poor zone, and sufficient alloyed zone, respectively. It can be clearly observed that the morphology of the composition inhomogeneity within all samples resembled the melt flow morphology, which is an obvious morphology that arose after the laser melting [14]. This morphology is consistent with previous studies on in-situ alloying of Al-based, Ti-based, and high-entropy alloys [2,5,6,10,17]. The composition inhomogeneity regions are reduced with the increase of laser power (marked with the blue dash box in Figure 3a) or the decrease of scanning rate (marked with the red dash box in Figure 3a). A significant reduction in composition inhomogeneity was observed at the hyper-low scanning speed (marked with the black box in Figure 3a).
To quantify the extent of alloying, the area percentages of the composition inhomogeneity region in each sample were measured. An example of the measurement process of the composition inhomogeneity region is shown in Figure 4a. Three low magnitudes BSE micrographs in random positions were captured for each sample in the cross-section. The Cu-poor zone and Cu-rich zone in the BSE micrograph are selected by thresholding and quantified by ImageJ software after noise reduction and binarization. The area percentage of the composition inhomogeneity region is defined as the sum of the Cu-poor zone and Cu-rich zone. The normalized enthalpy Δ H / h s , a most commonly used form, was used to evaluate the laser energy absorbed by a material in each process parameter [34,35,36]. This number is formulated as follows [35]:
Δ H h s = η l P ρ h s π α · r b 3 · V ,
where h s , η l , P , V , α , and r b are the enthalpy of fusion, laser absorptivity, laser power, laser scanning rate, thermal diffusion coefficient, and laser beam radius, respectively.
The statistical results show that the area ratio of the composition inhomogeneity region within the sample is closely related to the absorbed laser energy, as shown in Figure 4b. As Δ H / h s increased, the area percentage of the composition inhomogeneity region decreases rapidly from 31.3% to 10% and then slowly declined to 5.2%. These results indicated that the composition inhomogeneity can be tailored by adjusting the laser power and scanning rate.
Figure 5 shows the representative microstructure of in-situ alloyed Al20Cu alloy. The fully alloyed Al20Cu alloy exhibits nano-sized cellular α-Al, which is decorated with a bright Al2Cu phase in the core of the molten pool, while the micro-sized cellular is dispersed along the molten pool boundary (Figure 5b). This featured microstructure is attributed to the rapid cooling of the molten pool [37]. The obvious solidification microstructures were detected in both the Cu-poor zone (Figure 5c) and the Cu-rich zone (Figure 5d) in which granular Al2Cu and obvious copper dendrites can be, respectively, observed. The composition fluctuations in both regions were analyzed by EDS line analysis (Figure 5c,d). In the Cu-rich zone, the content of copper element steadily rises in the diffusion layer, showing a large fluctuation amplitude but a small fluctuation frequency of composition as a whole. On the contrary, the fluctuation amplitude of composition in the Cu-poor zone is small, while the fluctuation frequency remains high. Beyond the insufficient alloyed zone, the mass percentage of Cu and Al concentration is close to the designed concentration. The violent fluctuation of element content indicates that aluminum and copper elements undergo a violent mixing process in the molten pool. Yet, the extremely high cooling rate of the molten pool preserved this morphology features [10], which also indicates that the life period of the molten pool is important for the formation of composition inhomogeneity.
The above results verify that morphology of composition inhomogeneity is tightly related to the processing parameters. In addition, the present results also indicate the characteristics of the molten pool, such as the melt flow and life period of the molten pool, which is critical in controlling the composition inhomogeneity of the LPBF in-situ alloyed components.

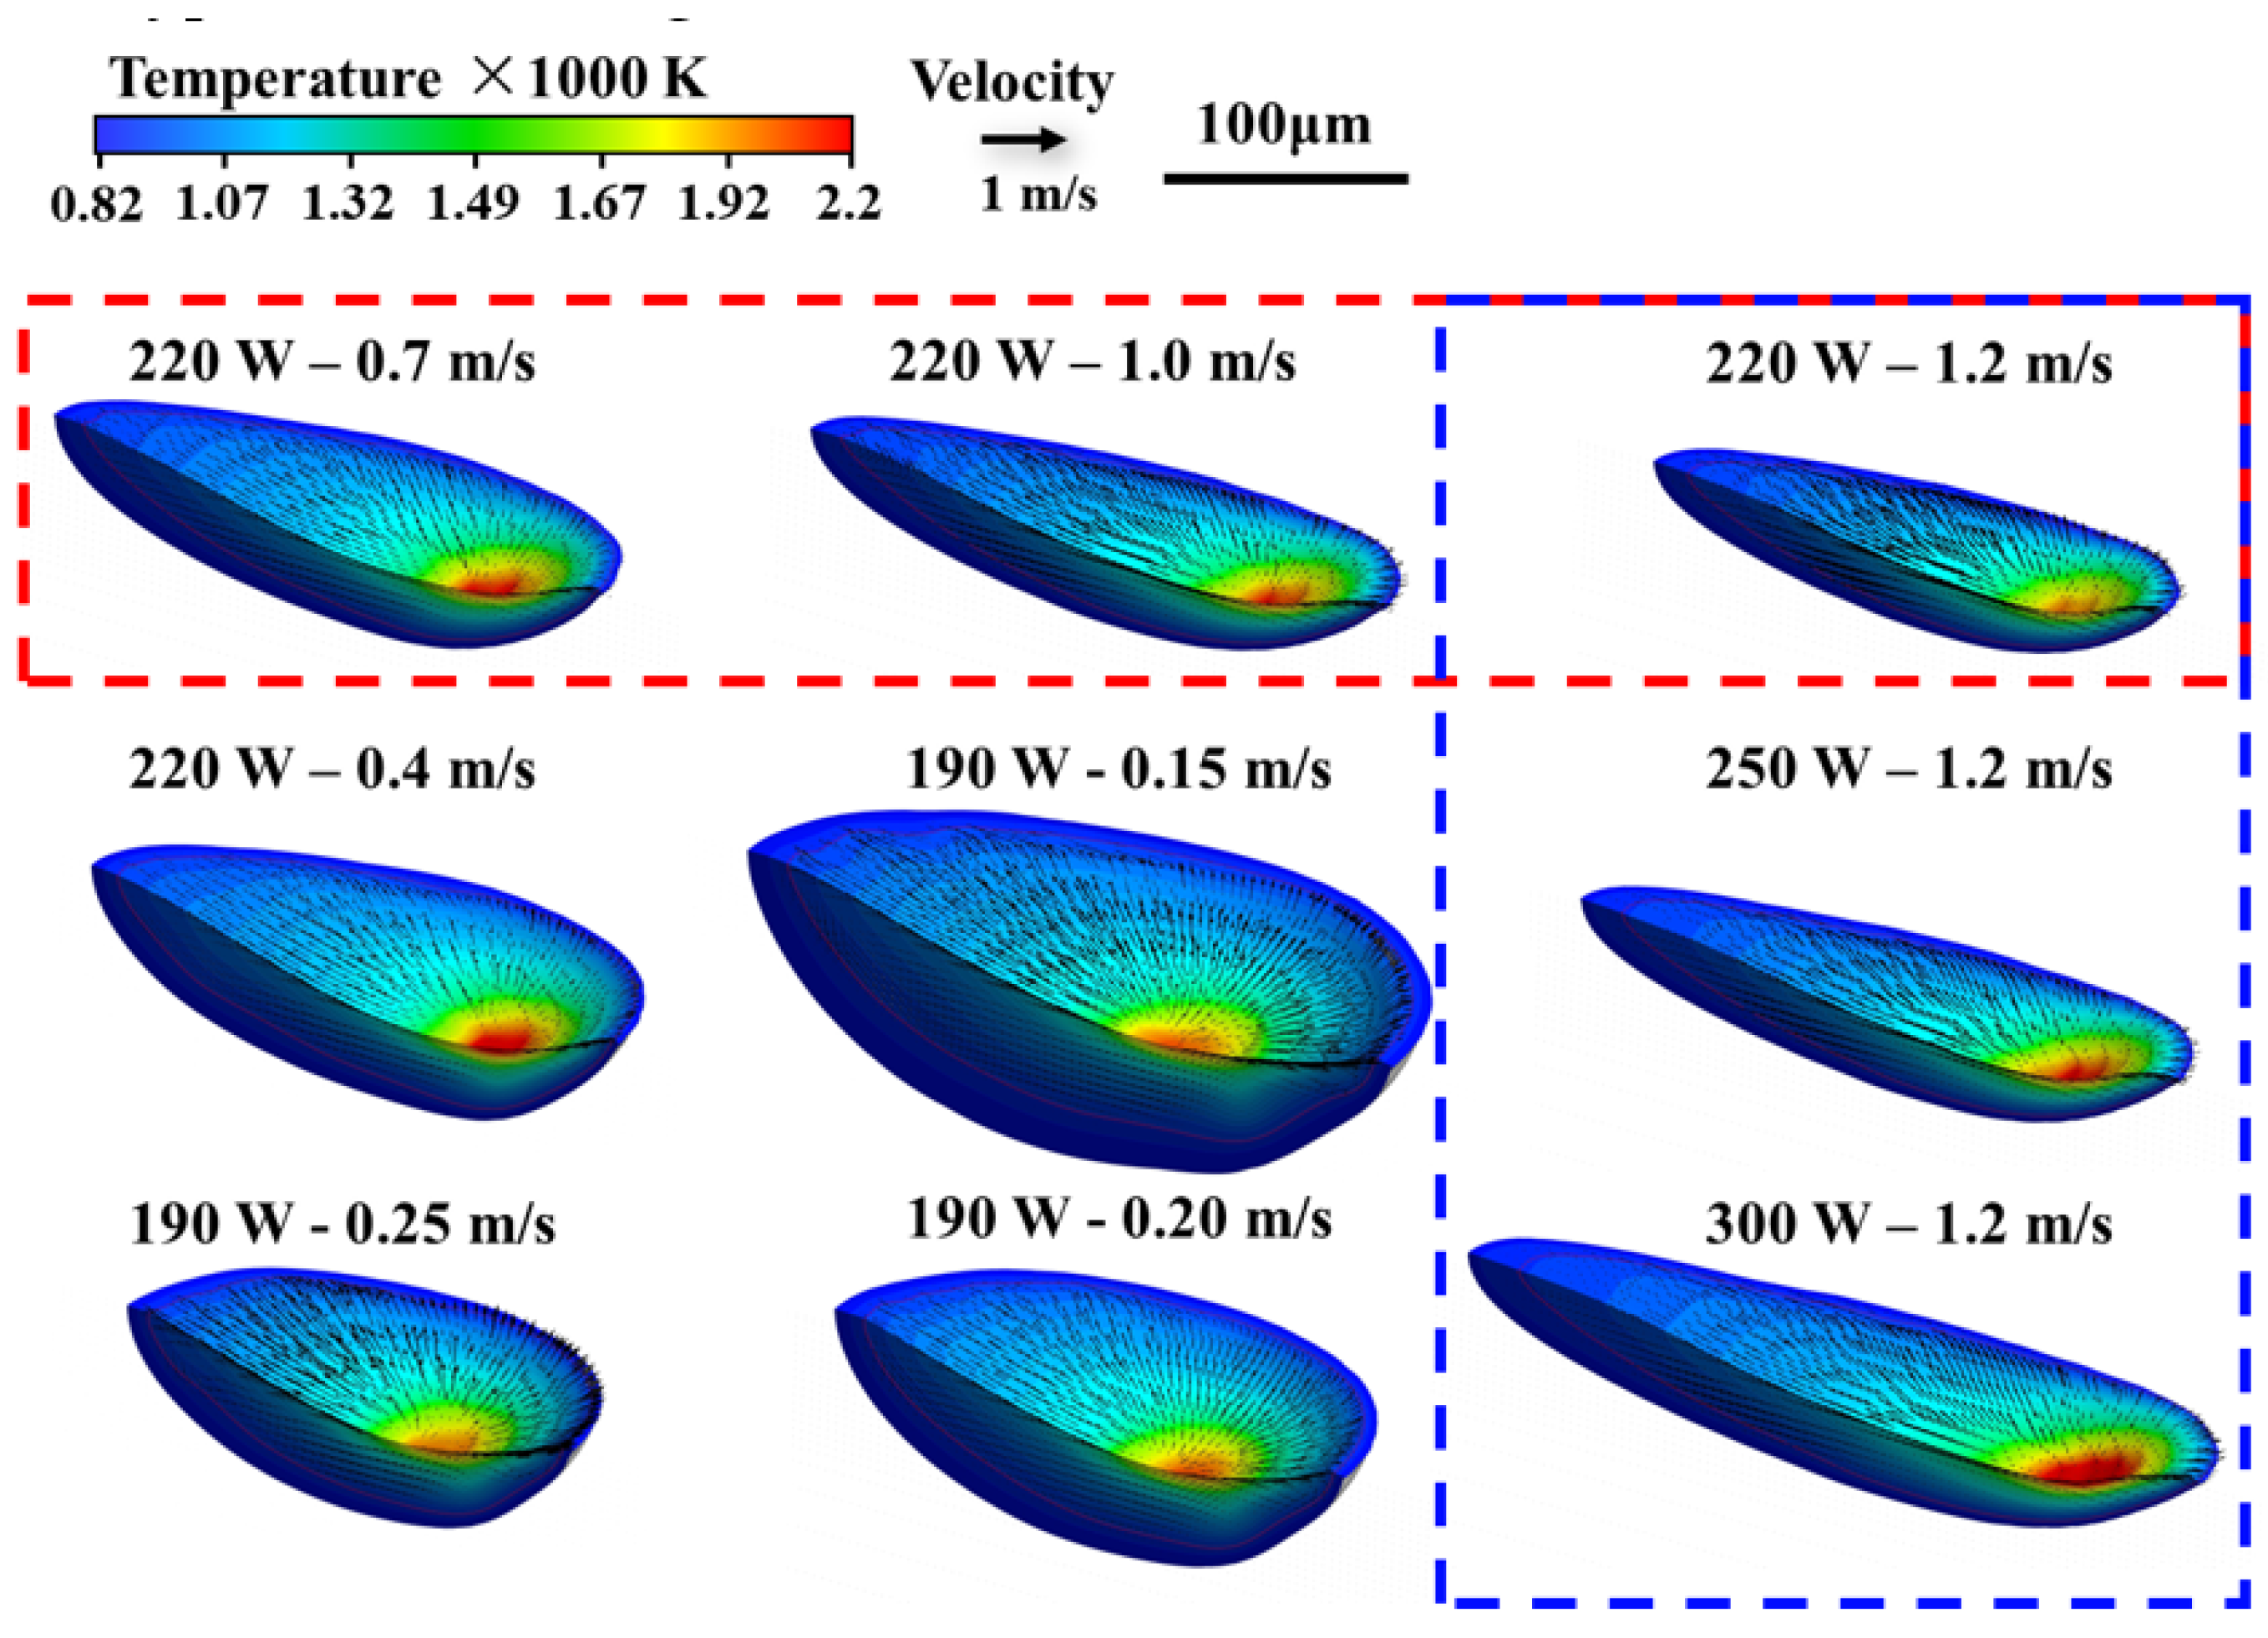
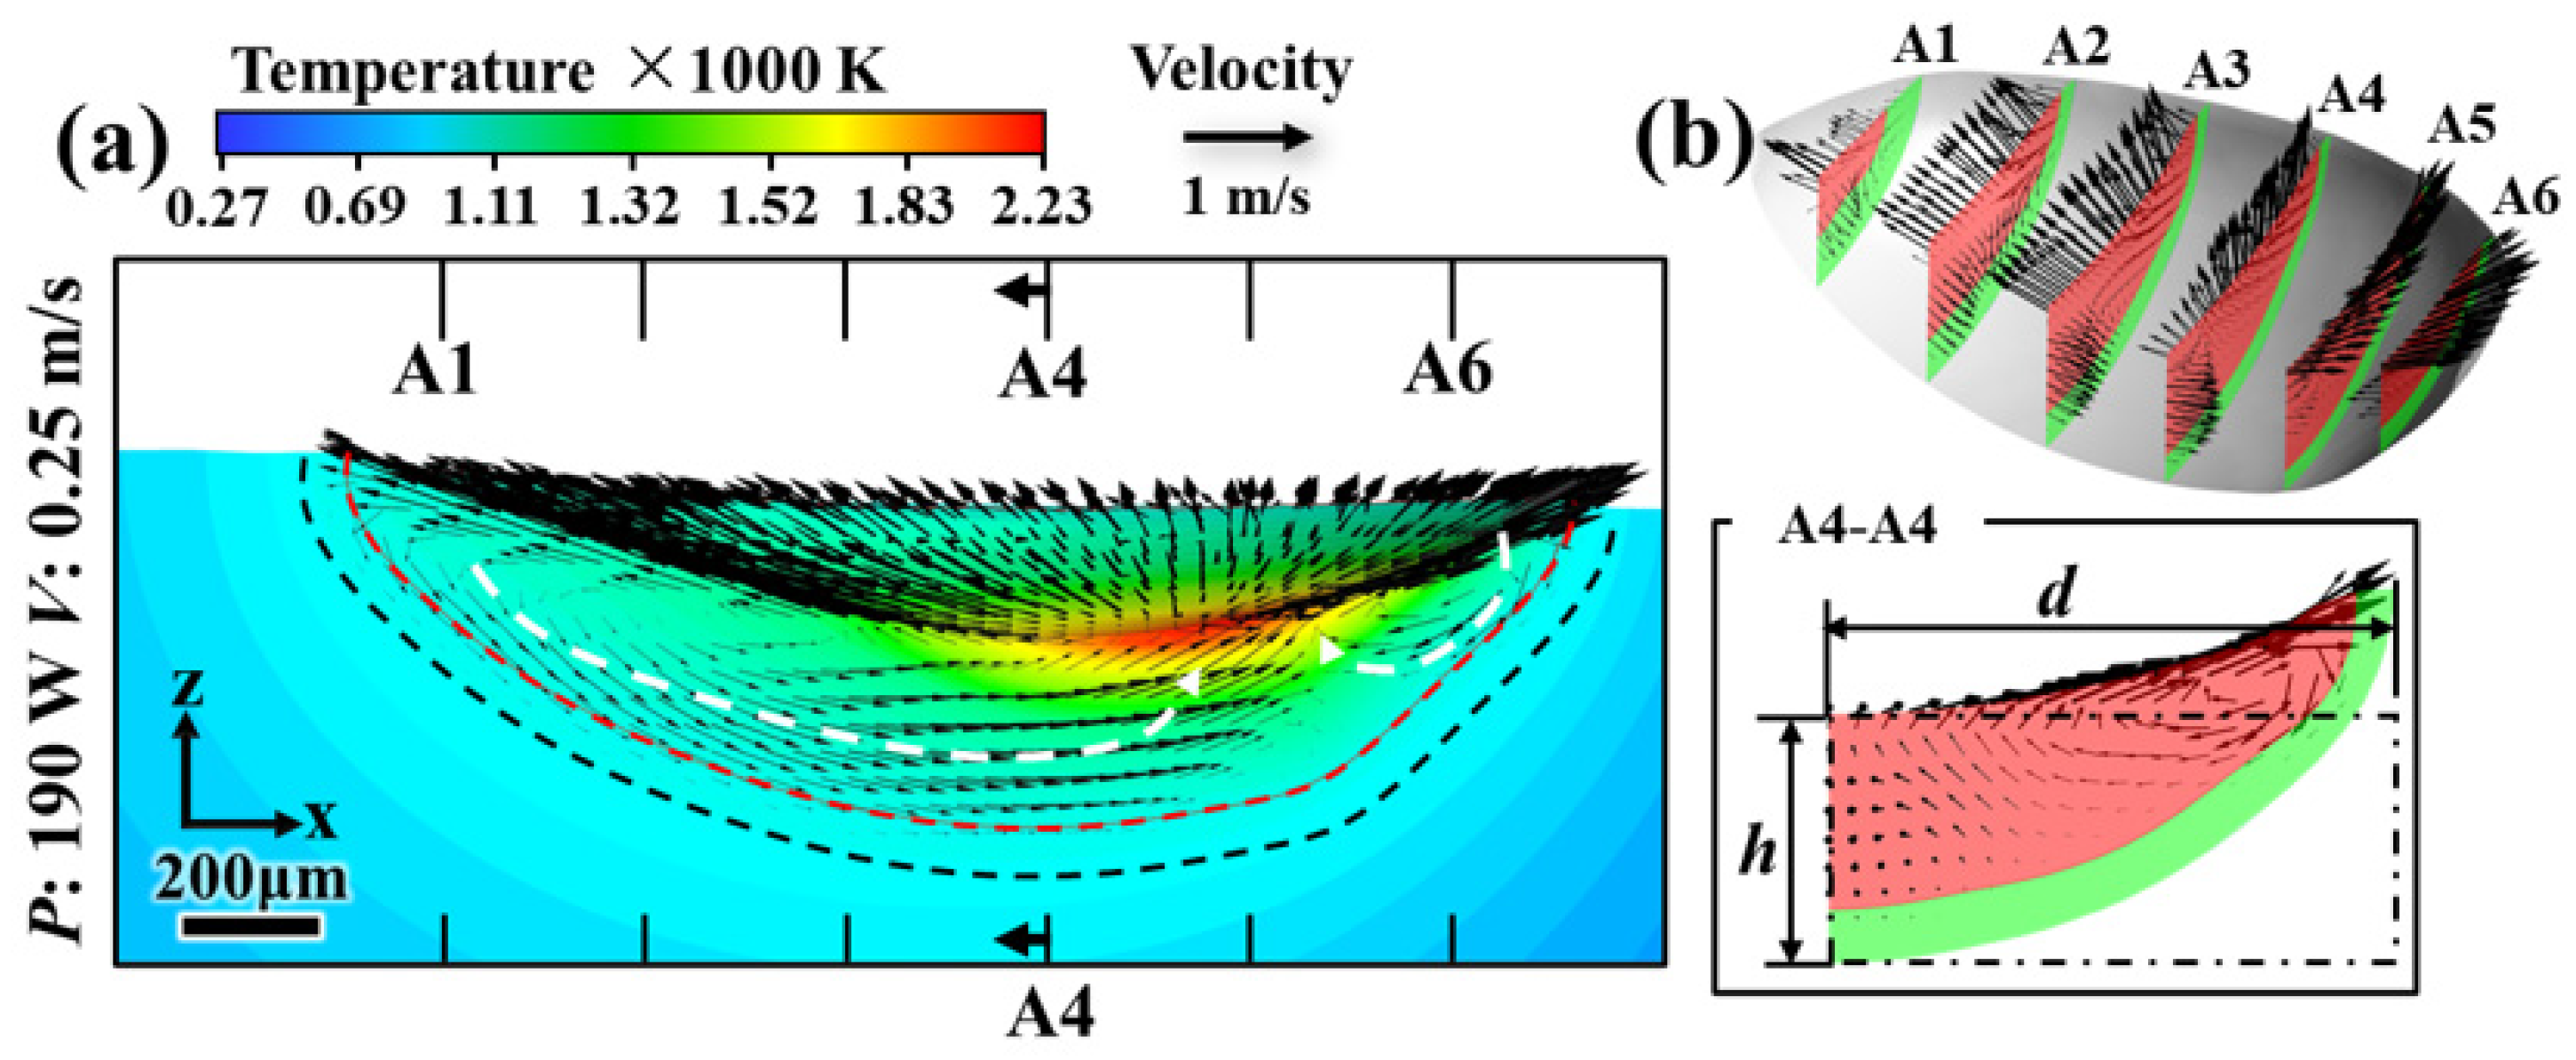
3.2. Characteristics of the Molten Pool under Various Processing Parameters

In the present work, the complicated LPBF process was reduced to a laser re-melting process. Based on this, the trend of molten pool characteristics over the shifts in processing parameters can be obtained quickly. The temperature and velocity field of molten pools in various processing parameters are shown in Figure 6. In all of these molten pools, the high-temperature melt at the gas-metal interface was derived to the low-temperature region, which is a typical Marangoni flow pattern. However, the shape and size of the molten pool changed significantly with the variation of processing parameters. A significant reduction in the size of the molten pool was observed with the increase of scanning rate (marked with the red dash box in Figure 6) or the decrease of laser power (marked with the blue dash box in Figure 6). The shape of molten pool changes from long and elliptical to roundness, when a hyper-low scanning rate is used.
The Peclet number Pe, which is the ratio of diffusion rate driven by concentration gradient to convection rate, is used to describe the relative importance of convection and diffusion.
P e = u L D ,
where u is the characteristic velocity, L is the characteristic length, and D is the diffusion rate of Cu in the Al matrix (3 × 10⁻⁹ m2/s). The most commonly used form to measure the characteristic length of molten pool in literature is the apparent radius or depth of the molten pool [15,38,39]. However, the molten pool shows a complex geometry shape (Figure 6), in consequence, the geometric characteristics of the molten pool cannot be described basically by the apparent radius or depth of the molten pool. In this work, the molten pool was regarded as a rectangular flow channel with varying cross-sections, and the characteristic length of each cross-section is calculated by hydraulic diameter, as illustrated in Figure 7. The characteristic length L can be calculated as follows:
L = 4 A C w = 2 h d h + d ,
where A is the cross-section area of the channel, C w is the wetting perimeter of the flow channel; h and d are the height and width of the channel, respectively. For each molten pool, six sections are intercepted at equal distances (Figure 7) and the Pe in each plane was calculated. In the present work, the diffusion rate of elements is set to a constant in the Pe numbers calculation. Therefore, the Pe numbers also reflect the convection strength within the molten pool.
Figure 8 shows the characteristic of the molten pool under various processing parameters. As shown in Figure 8a, the Pe number increased rapidly from 8560 to 13,700 and then fluctuated at approximately 13,700 with the increase of normalized enthalpy. It should be noted that the Pe number is increased with the increase of the laser power (red ball) or the decrease of the scanning rate (green star) when the normalized enthalpy is lower than 22.5 but does not further improve with the decrease of scanning rate (blue star) when the normalized enthalpy is higher than 22.5. This result indicates that the convection strength cannot be increased unlimitedly by increasing the laser power and decreasing the scanning rate. In addition, the Pe is in the order of 103, so the mass transfer process within the molten pool was dominated by convection. This result coincides with the experiment that the morphology of the composition inhomogeneity region resembled the convective motion of the melt flow (Figure 3a). Figure 8b,c plot the characteristic length of the molten pool vs. the normalized enthalpy. The average characteristic length is calculated from the average of six channels under each process parameter, and the life period of the molten pool ( t l i f e ) is the time for the metal to maintain the molten state. Unlike the trends from data in Figure 8a, the life period and dimension of the molten pool is monotonically increasing with the increase of normalized enthalpy, even under the processing parameters of a highly low scanning rate (blue star).
The above results reveal that the convection strength, time, and dimension of the molten pool are closely related to the normalized enthalpy. Once the normalized enthalpy exceeded a threshold value of 22.5, the convection within the molten pool reaches the peak of intensity in present Al20Cu alloy. As the normalized enthalpy further increases, although the convection strength does not increase, the size of the melt pool and its life period continue to increase, which means that the heterogeneous melts have more time and more space to mix under these conditions. Therefore, further increase of normalized enthalpy can still help to mix the heterogeneous melts. The experiment results present in Figure 3a also show the lower composition inhomogeneity of in-situ alloyed Al20Cu fabricated by the processing parameters with normalized enthalpy exceeding 22.5. Although the complex physical phenomena of in-situ alloying have not been fully revealed, the basic trends of the effect of the adjustment of processing parameters on the pool characteristics can be obtained from the simulation results. As the current work focuses on the influences of processing parameters, a more elaborate simulation will be done in the future.

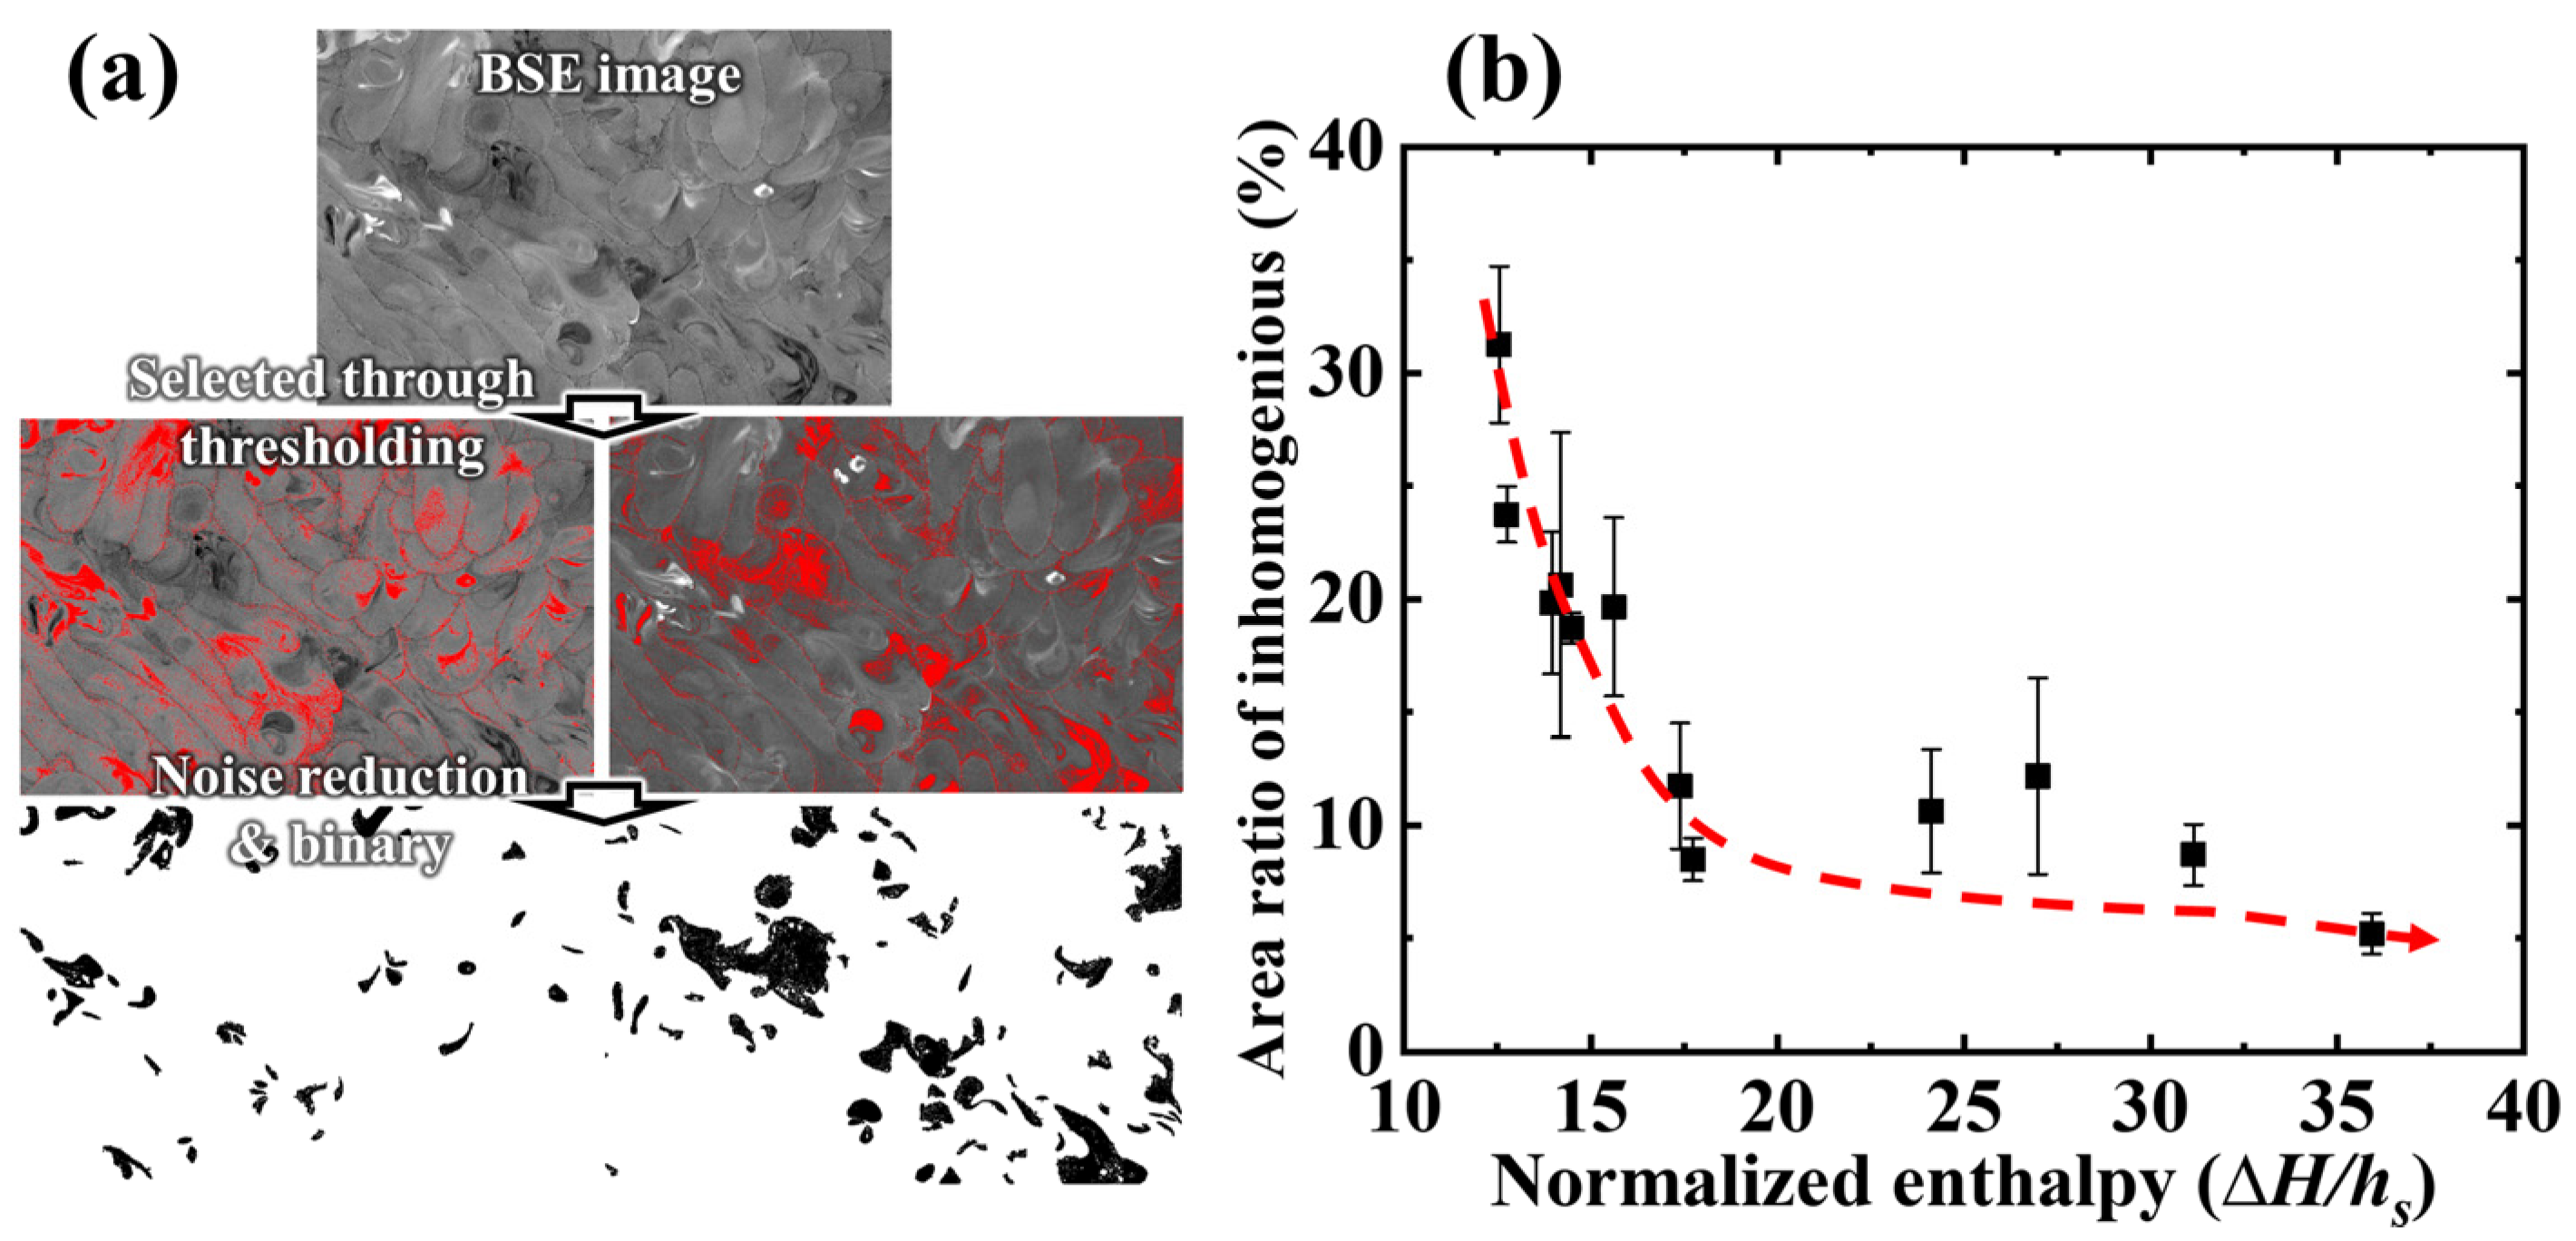
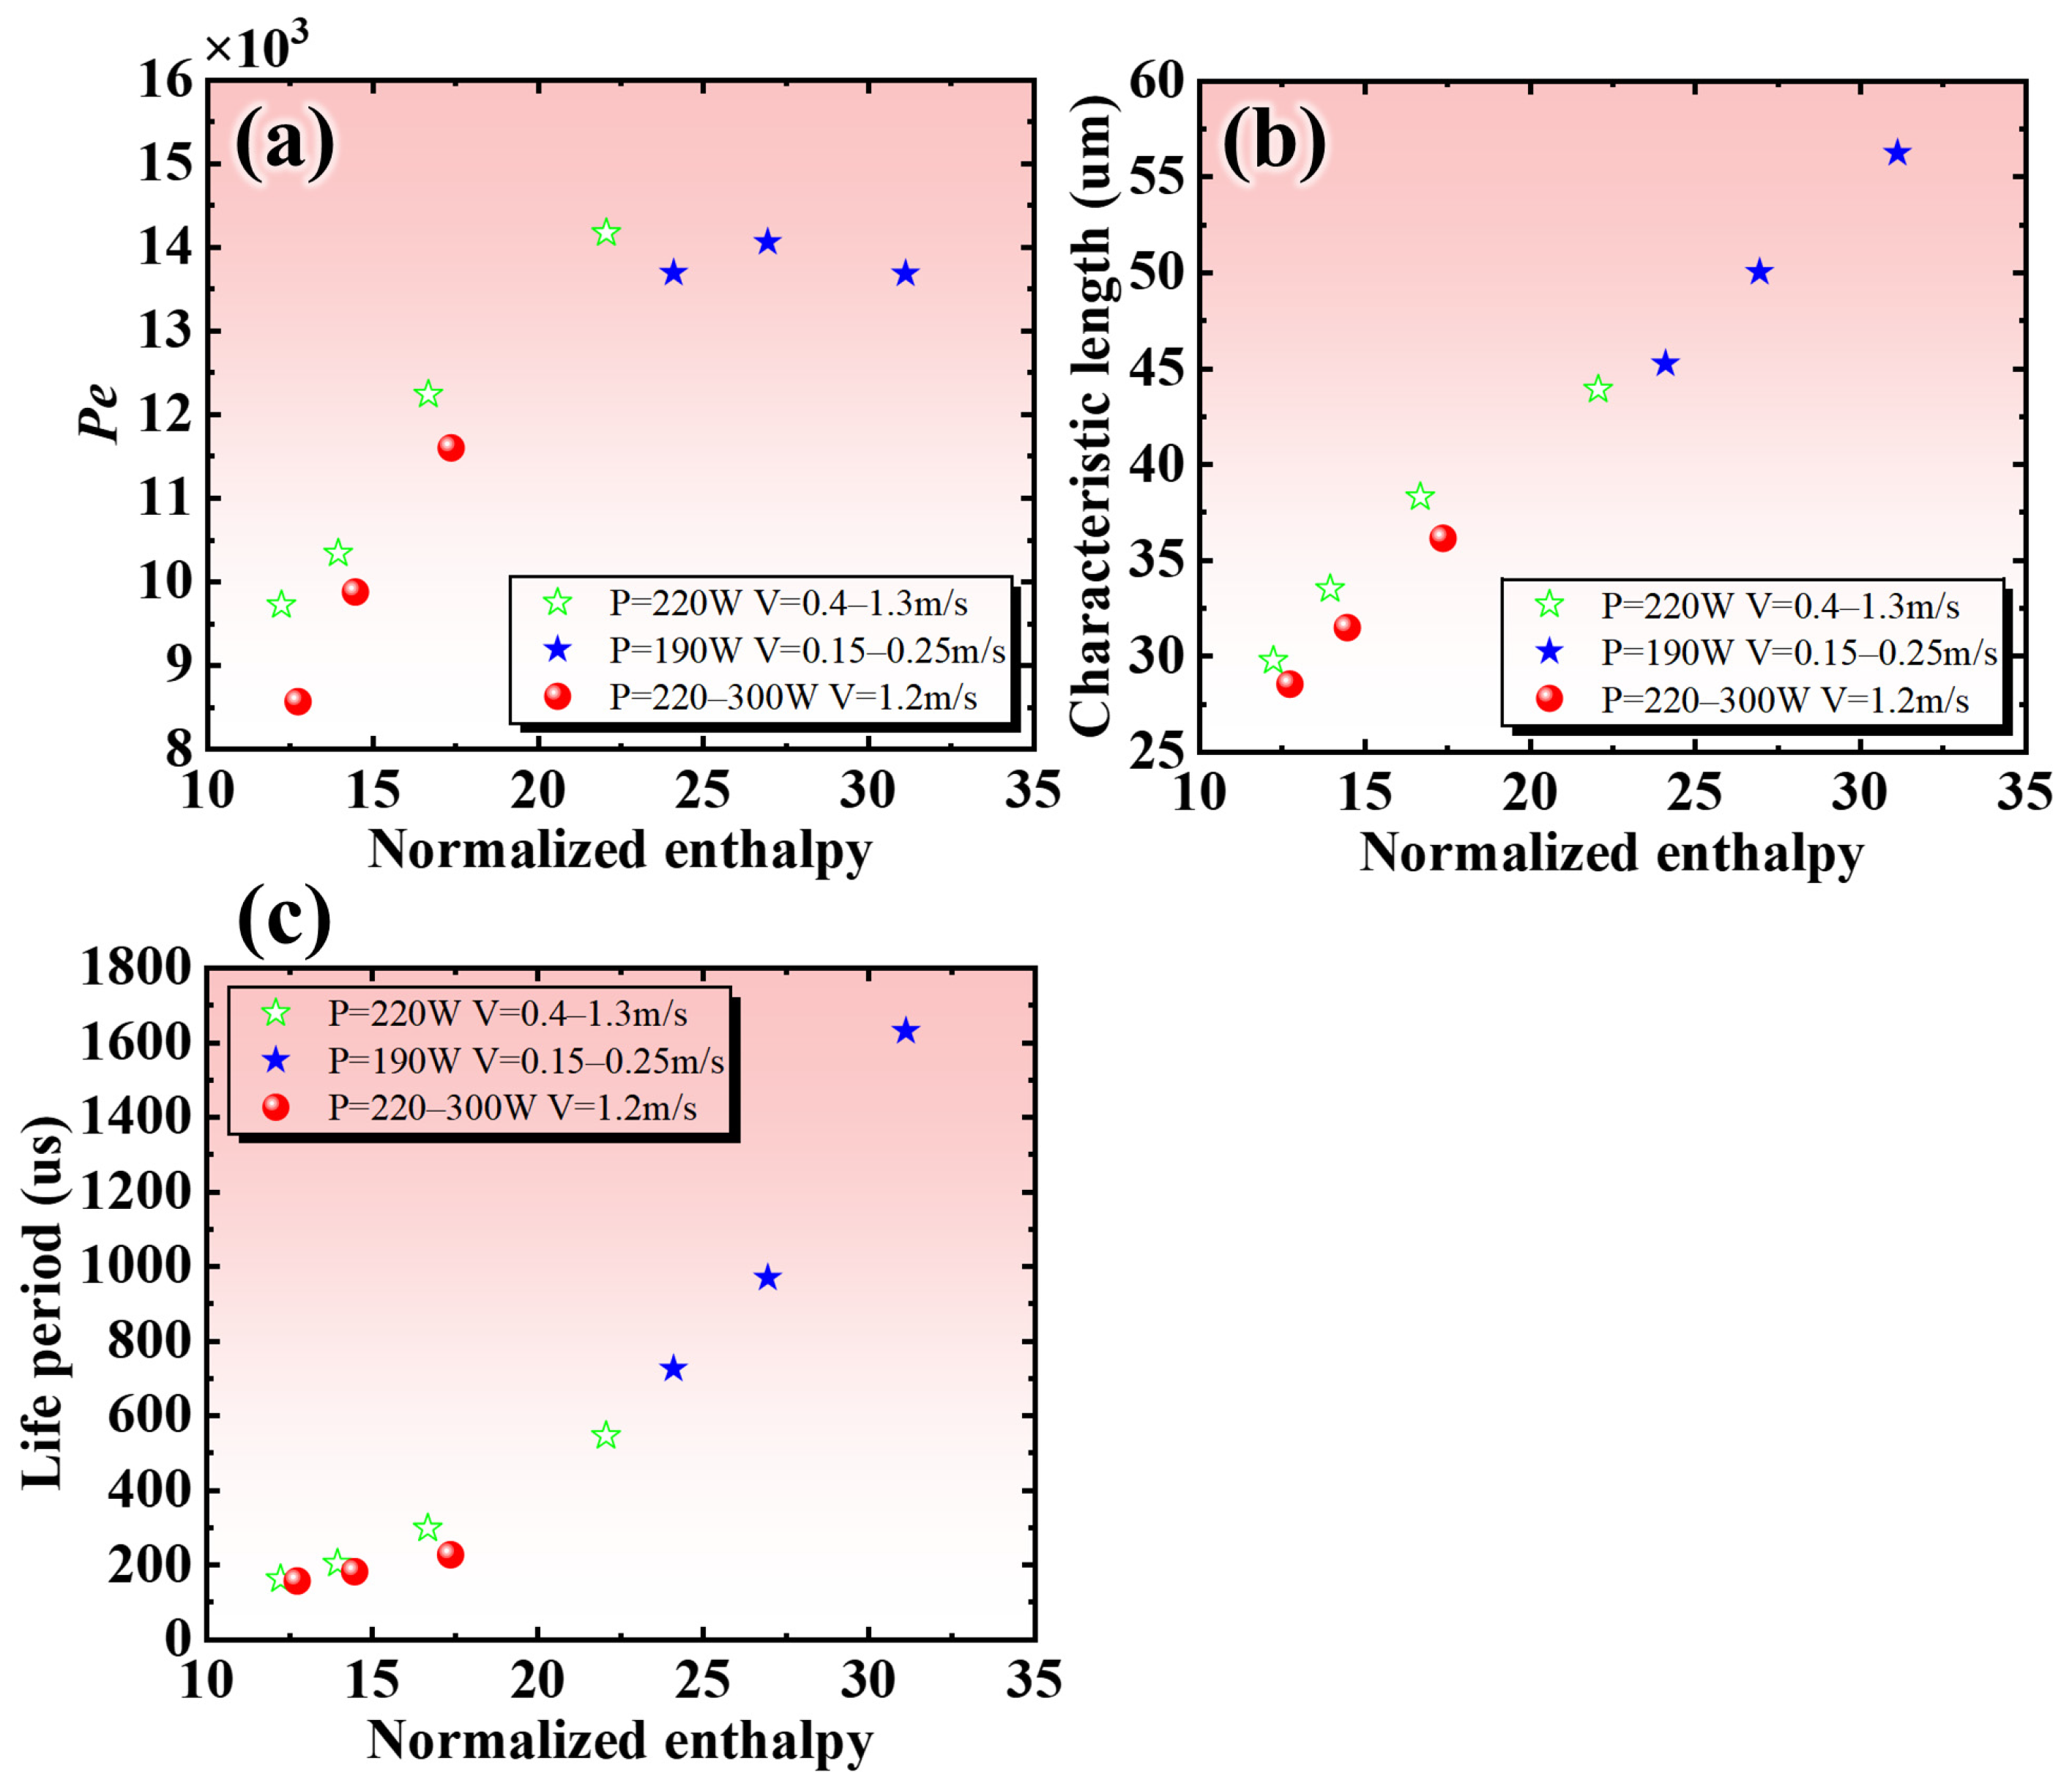
3.3. The Processing Map for Controlling the Composition Inhomogeneity

The above experimental results have proved the feasibility of tailoring the composition inhomogeneity by adjusting processing parameters (Figure 3). The influence of process parameter adjustment on the factors, which dominate the intermix of heterogeneous melt has been revealed by molten pool simulation (Section 3.2). Here, we shall attempt to summarize a parameter from the simulation results to characterize the mixing ability of the processing parameters to the heterogeneous melts.
The simulation results in Figure 6 show that the melt within the molten pool is a circulating flow. This suggests that the time required for the melt to move around the molten pool ( t c y ) can be defined as the quotient of molten pool size and melt flow velocity. The molten pool size and melt flow velocity are characterized by the characteristic length L and the characteristic velocity u , respectively, then the parameter t c y is formulated as t c y = L / u . It should be noted that this parameter reflects the flow characteristics of the melt in space but does not include the time characteristic. To account for this, a non-dimensional number we called convective stirring number (CSN) is defined as the quotient of the life period of the molten pool ( t l i f e ) and the time required for the melt to move around the molten pool ( t c y ), which is expressed as follows:
C S N = t l i f e · u / L ,
Figure 9 plots the variations of convective stirring number with the normalized enthalpy. The convective stirring number is increased with the increase of the laser power (red ball) or the decrease of the scanning rate (green star and blue star), which coincides with the experimental results in Figure 3a. This trend is also consistent with previous studies on the in-situ alloyed Al alloy and high entropy alloy [17,19].
In addition, the data in Figure 9 shows that the number of convective stirrings has a good linear fit with the energy input with a R2 = 0.96. Therefore, the following function can be used to determine the relationship between the convective stirring number and laser parameters:
C S N = k · η P ρ h s π α r 3 · r b + m ,
where k = 0.87 and m = 7.1 are the slope and intercept of the function obtained by linearly fitting the data in Figure 9, respectively. The processing map of CSN is shown in Figure 10. The micrograph of the samples was used to verify the accuracy of the model, which is placed around the processing map. Obviously, the composition inhomogeneity within the sample decreases significantly with increasing convective stirring numbers, which verifies the reliability of the processing map. The processing map in Figure 10a provides that a relatively high CSN can be obtained at the combination of a high laser power and a low scanning rate. However, the excessive input of laser energy will cause a keyhole, which results in the generation of excessive porosity [18], so the low scanning rate should be matched with lower laser power to avoid the chaotic keyhole [23,25].
In addition to adjusting the processing parameters, remelting is a more direct method to increase the convective stirring number. The convective stirring numbers are doubled for each remelting with the same laser parameters. Figure 11 shows the BSE micrograph of samples fabricated by adjusting processing parameters and remelting. The parameters 190 W-0.15 m/s and 220 W-1.3 m/s, with CSN equal to 19.9 and 3.5, respectively, were chosen as a benchmark for sample printing (Figure 11a,c). After once remelting, the CSN of these two parameters is increased to 39.8 and 7.0, respectively (Figure 11b,d). For comparing, the samples fabricated at a processing parameters 400 W-0.22 m/s (CSN = 39.9) and 220 W-0.73 m/s (CSN = 7.1) are shown in Figure 11e,f. For the parameters 190 W-0.15 m/s (Figure 11c), the Al and Cu melt experienced sufficient convective stirring after once remelting, so that the composition inhomogeneity disappeared. However, such a high CSN exists in the area with extremely low scanning speed in the process space, and the sample cannot even be formed due to overheat (Figure 11e). For the parameters 220 W-1.3 m/s with remelting (Figure 11d), the composition inhomogeneity region still exists due to the insufficient convective stirring numbers, and this is consistent with the morphology within the un-remelted sample with the number of convective stirrings equal to 7.1 (Figure 11f). These results showed that the availability of remelting on tailoring the composition inhomogeneity, and the homogeneous Al20Cu samples can be printed when CSN is equal to 39.8.

4. Conclusions

The Al20Cu alloy was selected as the benchmark alloy to investigate guidance for the tailoring of composition inhomogeneity by adjusting processing parameters. The main conclusions can be drawn as follows:
(1) The composition inhomogeneity of the in-situ alloyed Al20Cu alloy was characterized. The morphology of the composition inhomogeneity resembled the convective motion of the melt, and it is closely related to the processing parameters;
(2) In the present Al20Cu alloy, the convection within the molten pool reaches the peak of intensity once the normalized enthalpy of processing parameters exceeds 22.5, while the size of the melt pool and its life period continue to increase;
(3) A non-dimensional number CSN was provided to reflect the time-space characteristics of molten pool under various processing parameters. A processing map of convective stirring number was proposed for tailoring the composition inhomogeneity. An Al20Cu sample without composition inhomogeneity was successfully fabricated with the guidance of this processing map.
In summary, the results of this work provide process guidance for tailoring the composition inhomogeneity via LPBF in-situ alloying and contribute to the development of new materials for additive manufacturing by in-situ alloying.

Author Contributions

Y.Z.: conceptualization, methodology, data curation, writing—original draft, writing—reviewing and editing. X.C.: data curation, writing—original draft. F.Z.: investigation. X.L.: writing—original draft preparation. Y.H.: writing—original draft preparation. Q.Z.: writing—reviewing and editing, project administration, supervision. All authors have read and agreed to the published version of the manuscript.

Funding

This research was funded by Shenzhen Science and Technology Innovation Committee, Shenzhen, China (Project Nos. KQTD20170328154443162, JCYJ20210324104610029, JCYJ20210324104608023 and JSGG20210802154210032), the National Natural Science Foundation of China (No. 52074157) and GuangDong Basic and Applied Basic Research Foundation (No. 2021A1515110348).

Data Availability Statement

The data presented in this study are available upon request from the corresponding author.

Acknowledgments

We acknowledge software support from the Center for Computational Science and Engineering at Southern University of Science and Technology, Shenzhen, China.

Conflicts of Interest

The authors declare no conflict of interest.

References

  1. Sing, S.L.; Huang, S.; Goh, G.D.; Goh, G.L.; Tey, C.F.; Tan, J.H.K.; Yeong, W.Y. Emerging Metallic Systems for Additive Manufacturing: In-Situ Alloying and Multi-Metal Processing in Laser Powder Bed Fusion. Prog. Mater. Sci. 2021, 119, 100795. [Google Scholar] [CrossRef]
  2. Yadroitsev, I.; Krakhmalev, P.; Yadroitsava, I. Titanium Alloys Manufactured by In Situ Alloying During Laser Powder Bed Fusion. Jom 2017, 69, 2725–2730. [Google Scholar] [CrossRef]
  3. Bosio, F.; Manfredi, D.; Lombardi, M. Homogenization of an Al Alloy Processed by Laser Powder Bed Fusion In-Situ Alloying. J. Alloys Compd. 2022, 904, 164079. [Google Scholar] [CrossRef]
  4. Aboulkhair, N.T.; Simonelli, M.; Parry, L.; Ashcroft, I.; Tuck, C.; Hague, R. 3D Printing of Aluminium Alloys: Additive Manufacturing of Aluminium Alloys Using Selective Laser Melting. Prog. Mater. Sci. 2019, 106, 100578. [Google Scholar] [CrossRef]
  5. Bosio, F.; Fino, P.; Manfredi, D.; Lombardi, M. Strengthening Strategies for an Al Alloy Processed by In-Situ Alloying during Laser Powder Bed Fusion. Mater. Des. 2021, 212, 110247. [Google Scholar] [CrossRef]
  6. Lin, D.; Xu, L.; Li, X.; Jing, H.; Qin, G.; Pang, H.; Minami, F. A Si-Containing FeCoCrNi High-Entropy Alloy with High Strength and Ductility Synthesized in Situ via Selective Laser Melting. Addit. Manuf. 2020, 35, 101340. [Google Scholar] [CrossRef]
  7. Großwendt, F.; Röttger, A.; Strauch, A.; Chehreh, A.; Uhlenwinkel, V.; Fechte-Heinen, R.; Walther, F.; Weber, S.; Theisen, W. Additive Manufacturing of a Carbon-Martensitic Hot-Work Tool Steel Using a Powder Mixture–Microstructure, Post-Processing, Mechanical Properties. Mater. Sci. Eng. A 2021, 827, 142038. [Google Scholar] [CrossRef]
  8. Huang, S.; Narayan, R.L.; Tan, J.H.K.; Sing, S.L.; Yeong, W.Y. Resolving the Porosity-Unmelted Inclusion Dilemma during in-Situ Alloying of Ti34Nb via Laser Powder Bed Fusion. Acta Mater. 2021, 204, 116522. [Google Scholar] [CrossRef]
  9. Martinez, R.; Todd, I.; Mumtaz, K. In Situ Alloying of Elemental Al-Cu12 Feedstock Using Selective Laser Melting. Virtual Phys. Prototyp. 2019, 14, 242–252. [Google Scholar] [CrossRef]
  10. Zhang, T.; Huang, Z.; Yang, T.; Kong, H.; Luan, J.; Wang, A.; Wang, D.; Kuo, W.; Wang, Y.; Liu, C.-T. In Situ Design of Advanced Titanium Alloy with Concentration Modulations by Additive Manufacturing. Science 2021, 374, 478–482. [Google Scholar] [CrossRef]
  11. Zafari, A.; Lui, E.W.; Jin, S.; Li, M.; Molla, T.T.; Sha, G.; Xia, K. Hybridisation of Microstructures from Three Classes of Titanium Alloys. Mater. Sci. Eng. A 2020, 788, 139572. [Google Scholar] [CrossRef]
  12. Zafari, A.; Xia, K. Superior Titanium from Hybridised Microstructures–A New Strategy for Future Alloys. Scr. Mater. 2019, 173, 61–65. [Google Scholar] [CrossRef]
  13. Zafari, A.; Chandran, P.; Xia, K. Superior Tensile Properties in Additively Manufactured Ti Alloys. Aust. J. Mech. Eng. 2021, 19, 602–608. [Google Scholar] [CrossRef]
  14. Huang, W.; Wang, H.; Rinker, T.; Tan, W. Investigation of Metal Mixing in Laser Keyhole Welding of Dissimilar Metals. Mater. Des. 2020, 195, 109056. [Google Scholar] [CrossRef]
  15. Guo, Q.; Zhao, C.; Qu, M.; Xiong, L.; Hojjatzadeh, S.M.H.; Escano, L.I.; Parab, N.D.; Fezzaa, K.; Sun, T.; Chen, L. In-Situ Full-Field Mapping of Melt Flow Dynamics in Laser Metal Additive Manufacturing. Addit. Manuf. 2020, 31, 100939. [Google Scholar] [CrossRef]
  16. Cunningham, R.; Zhao, C.; Parab, N.; Kantzos, C.; Pauza, J.; Fezzaa, K.; Sun, T.; Rollett, A.D. Keyhole Threshold and Morphology in Laser Melting Revealed by Ultrahigh-Speed x-Ray Imaging. Science 2019, 363, 849–852. [Google Scholar] [CrossRef]
  17. Chen, P.; Yao, X.; Attallah, M.M.; Yan, M. In-Situ Alloyed CoCrFeMnNi High Entropy Alloy: Microstructural Development in Laser Powder Bed Fusion. J. Mater. Sci. Technol. 2022, 123, 123–135. [Google Scholar] [CrossRef]
  18. Gan, Z.; Kafka, O.L.; Parab, N.; Zhao, C.; Fang, L.; Heinonen, O.; Sun, T.; Liu, W.K. Universal Scaling Laws of Keyhole Stability and Porosity in 3D Printing of Metals. Nat. Commun. 2021, 12, 1–8. [Google Scholar] [CrossRef]
  19. Skelton, J.M.; Sullivan, E.J.; Fitz-Gerald, J.M.; Floro, J.A. Efficacy of Elemental Mixing of in Situ Alloyed Al-33wt%Cu during Laser Powder Bed Fusion. J. Mater. Process. Technol. 2022, 299, 117379. [Google Scholar] [CrossRef]
  20. Simonelli, M.; Aboulkhair, N.T.; Cohen, P.; Murray, J.W.; Clare, A.T.; Tuck, C.; Hague, R.J.M. A Comparison of Ti-6Al-4V in-Situ Alloying in Selective Laser Melting Using Simply-Mixed and Satellited Powder Blend Feedstocks. Mater. Charact. 2018, 143, 118–126. [Google Scholar] [CrossRef]
  21. Wang, P.; Deng, L.; Prashanth, K.G.; Pauly, S.; Eckert, J.; Scudino, S. Microstructure and Mechanical Properties of Al-Cu Alloys Fabricated by Selective Laser Melting of Powder Mixtures. J. Alloys Compd. 2018, 735, 2263–2266. [Google Scholar] [CrossRef]
  22. Martin, A.; San Sebastian, M.; Gil, E.; Wang, C.Y.; Milenkovic, S.; Pérez-Prado, M.T.; Cepeda-Jiménez, C.M. Effect of the Heat Treatment on the Microstructure and Hardness Evolution of a AlSi10MgCu Alloy Designed for Laser Powder Bed Fusion. Mater. Sci. Eng. A 2021, 819, 141487. [Google Scholar] [CrossRef]
  23. Tan, Q.; Liu, Y.; Fan, Z.; Zhang, J.; Yin, Y.; Zhang, M.X. Effect of Processing Parameters on the Densification of an Additively Manufactured 2024 Al Alloy. J. Mater. Sci. Technol. 2020, 58, 34–45. [Google Scholar] [CrossRef]
  24. Gill, S.C.; Kurz, W. Rapidly Solidified AlCu Alloys-I. Experimental Determination of the Microstructure Selection Map. Acta Metall. Mater. 1993, 41, 3563–3573. [Google Scholar] [CrossRef]
  25. Li, G.; Li, X.; Guo, C.; Zhou, Y.; Tan, Q.; Qu, W.; Li, X.; Hu, X.; Zhang, M.X.; Zhu, Q. Investigation into the Effect of Energy Density on Densification, Surface Roughness and Loss of Alloying Elements of 7075 Aluminium Alloy Processed by Laser Powder Bed Fusion. Opt. Laser Technol. 2022, 147, 107621. [Google Scholar] [CrossRef]
  26. Aucott, L.; Dong, H.; Mirihanage, W.; Atwood, R.; Kidess, A.; Gao, S.; Wen, S.; Marsden, J.; Feng, S.; Tong, M.; et al. Revealing Internal Flow Behaviour in Arc Welding and Additive Manufacturing of Metals. Nat. Commun. 2018, 9, 1–7. [Google Scholar] [CrossRef] [Green Version]
  27. Khairallah, S.A.; Anderson, A.T.; Rubenchik, A.; King, W.E. Laser Powder-Bed Fusion Additive Manufacturing: Physics of Complex Melt Flow and Formation Mechanisms of Pores, Spatter, and Denudation Zones. Acta Mater. 2016, 108, 36–45. [Google Scholar] [CrossRef] [Green Version]
  28. Tseng, C.C.; Li, C.J. Numerical Investigation of Interfacial Dynamics for the Melt Pool of Ti-6Al-4V Powders under a Selective Laser. Int. J. Heat Mass Transf. 2019, 134, 906–919. [Google Scholar] [CrossRef]
  29. Wang, L.; Zhang, Y.; Yan, W. Evaporation Model for Keyhole Dynamics during Additive Manufacturing of Metal. Phys. Rev. Appl. 2020, 14, 1. [Google Scholar] [CrossRef]
  30. Brackbill, J.U.; Kothe, D.B.; Zemach, C. A Continuum Method for Modeling Surface Tension. J. Comput. Phys. 1992, 100, 335–354. [Google Scholar] [CrossRef]
  31. Sun, Z.; Chueh, Y.H.; Li, L. Multiphase Mesoscopic Simulation of Multiple and Functionally Gradient Materials Laser Powder Bed Fusion Additive Manufacturing Processes. Addit. Manuf. 2020, 35, 101448. [Google Scholar] [CrossRef]
  32. Brent, A.D.; Voller, V.R.; Reid, K.J. Enthalpy-Porosity Technique for Modeling Convection-Diffusion Phase Change: Application to the Melting of a Pure Metal. Numer. Heat Transf. 1988, 13, 297–318. [Google Scholar] [CrossRef]
  33. Chen, S.; Zhao, Y.; Tian, S.; Gu, Y.; Zhan, X. Study on Keyhole Coupling and Melt Flow Dynamic Behaviors Simulation of 2219 Aluminum Alloy T-Joint during the Dual Laser Beam Bilateral Synchronous Welding. J. Manuf. Process. 2020, 60, 200–212. [Google Scholar] [CrossRef]
  34. Rubenchik, A.M.; King, W.E.; Wu, S.S. Scaling Laws for the Additive Manufacturing. J. Mater. Process. Technol. 2018, 257, 234–243. [Google Scholar] [CrossRef]
  35. Hann, D.B.; Iammi, J.; Folkes, J. A Simple Methodology for Predicting Laser-Weld Properties from Material and Laser Parameters. J. Phys. D. Appl. Phys. 2011, 44, 445401. [Google Scholar] [CrossRef]
  36. Metelkova, J.; Kinds, Y.; Kempen, K.; de Formanoir, C.; Witvrouw, A.; Van Hooreweder, B. On the Influence of Laser Defocusing in Selective Laser Melting of 316L. Addit. Manuf. 2018, 23, 161–169. [Google Scholar] [CrossRef]
  37. Delahaye, J.; Habraken, A.M.; Mertens, A. Influence of Si precipitates on fracture mechanisms of AlSi10Mg parts processed by Selective Laser Melting. Acta Mater. 2019, 175, 160–170. [Google Scholar] [CrossRef]
  38. Gan, Z.; Yu, G.; He, X.; Li, S. Numerical Simulation of Thermal Behavior and Multicomponent Mass Transfer in Direct Laser Deposition of Co-Base Alloy on Steel. Int. J. Heat Mass Transf. 2017, 104, 28–38. [Google Scholar] [CrossRef] [Green Version]
  39. Li, Z.; Yu, G.; He, X.; Tian, C.; Li, S.; Li, H. Probing Thermocapillary Convection and Multisolute Dilution in Laser Welding of Dissimilar Miscible Metals. Int. J. Therm. Sci. 2022, 172, 107242. [Google Scholar] [CrossRef]
Figure 1. (a) Al powder and Cu powder distribution and (b) particle size distribution of blended Al20Cu powder. (c) Schematic of LPBF process and scanning strategy.
Metals 13 00097 g001
Figure 2. Schematic of boundary condition and computational domain for laser scanning simulation.
Metals 13 00097 g002
Figure 3. Composition inhomogeneity within the Al-20Cu samples printed at various scanning rates and laser powers: (a) BSE micrographs of all samples, and (b) EDS mapping analysis of composition inhomogeneity region within the sample processed by laser power of 220 W and scanning rate of 1.2 m/s.
Metals 13 00097 g003
Figure 4. Quantitative characterization of composition inhomogeneity defects within the samples printed by different energy input: (a) schematic of measurement process, (b) statistical results.
Metals 13 00097 g004
Figure 5. The microstructure of the cross-plane of an as-printed Al20Cu sample: (a) a representative SEM micrograph and an enlarged detail of (b) fully alloyed zone, (c) Cu-poor zone, and (d) Cu-rich zone. The EDS line analysis performed across the Cu-poor zone and Cu-rich zone is placed at the bottom of (c,d).
Metals 13 00097 g005
Figure 6. Temperature and velocity field of molten pool under different processing parameters.
Metals 13 00097 g006
Figure 7. Analysis of convection diffusion by Peclet number Pe: (a) Temperature and velocity field of molten pool with laser power of 190 W and scanning rate of 0.25 m/s, and (b) the measuring sketch of characteristic length L.
Metals 13 00097 g007
Figure 8. The characteristics of molten pool at various scanning rates and laser powers: (a) Pe; (b) characteristic length; (c) life period.
Metals 13 00097 g008
Figure 9. The convective stirring numbers of the molten pool at various scanning rates and laser powers.
Metals 13 00097 g009
Figure 10. Processing map and experiment results of in-situ alloyed Al20Cu: (a) processing map shows the convection stirring number as a function of laser power and scanning rate. (b) BSE micrograph of the samples printed at various scanning rates and laser powers.
Metals 13 00097 g010
Figure 11. The composition inhomogeneity within the samples to increase CSN by (ad) remelting and (ef) adjusting processing parameters.
Metals 13 00097 g011
Table 1. Processing parameters used in the sample printing experiment.
Power (W)Scanning Rate (m/s)Hatch Distance (μm)Layer Thickness (μm)
1600.087030
1900.15, 0.2, 0.257030
2200.8, 1.0, 1.27030
2500.8, 1.2, 1.67030
3001.2, 1.87030
Table 2. Thermophysical properties of the material used in this simulation [33].
PropertyAl20Cu
Solid density ρs (kg m−3)3140
Liquid density ρl (kg m−3)2510
Solidus temperature TS (K)821.16
Liquidus temperature TL (K)875.7
Solid specific heat cp (J kg−1 K−1)850
Liquid specific heat cp (J kg−1 K−1)1010
Solid thermal conductivity k (W m−1 K−1)135.4
Liquid thermal conductivity k (W m−1 K−1)100
Heat transfer coefficient hc (W m−2 K−1)100
Radiant emissivity ε0.2
Temperature coefficient of surface tension d γ / d T (N m−1 K−1)−0.00035
Latent heat of fusion Lf (J kg−1)3.87 × 10⁵
Latent heat of evaporation Levp (J kg−1)9.46 × 10⁶
Vaporization temperature Tevp (K)2792.15
Disclaimer/Publisher’s Note: The statements, opinions and data contained in all publications are solely those of the individual author(s) and contributor(s) and not of MDPI and/or the editor(s). MDPI and/or the editor(s) disclaim responsibility for any injury to people or property resulting from any ideas, methods, instructions or products referred to in the content.

