Article

Influence of Relative Humidity and Oxygen Concentration on Corrosion Behaviour of Copper in H2S-Containing Liquid Petroleum Gas

1
School of New Energy and Materials, Southwest Petroleum University, Chengdu 610500, China
2
CenerTech Oilfield Chemical Co., Ltd., CNOOC, Tianjin 300450, China
*
Authors to whom correspondence should be addressed.
Metals 2022, 12(12), 2015; https://doi.org/10.3390/met12122015
Submission received: 12 October 2022 / Revised: 11 November 2022 / Accepted: 17 November 2022 / Published: 24 November 2022
(This article belongs to the Special Issue 3D Printing of Metal)

Abstract

:
In this paper, the influences of relative humidity (RH) and concentration of O2 on copper corrosion in H2S-containing LPG (liquid petroleum gas) were studied. The corrosion products obtained in different environments were also analysed by scanning electron microscopy (SEM), energy dispersive spectrometry (EDS), grazing incidence X-ray diffraction (GIXRD), X-ray photoelectron spectroscopy (XPS) and Fourier transform infrared spectroscopy (FTIR). In H2S-containing LPG, RH has pronounced influence on the corrosion grade of copper. The variation in the critical point (CP) with the RH of LPG is a linear relationship. The presence of O2 in dry H2S has limited influence on the corrosion of copper. In the presence of different RHs, the CP always follows a negative exponential function with O2 concentration. The analysis of different corrosion products implies different corrosion behaviours and mechanisms, which are dependent on the presence or absence of water vapour. The corrosion mechanisms obtained in four different environments were also proposed.

Graphical Abstract

1. Introduction

Natural gas is widely used in industry and our daily life. As an important existence of natural gas, liquefied petroleum gas (LPG) is more commonly utilized for its accessibility in transportation. In the exploitation and processing of LPG, sulphur removal is inevitable for the sake of alleviating corrosion attack by sulphide existing in produced LPG [1,2,3]. Various forms of sulphide, such as hydrogen sulphide, mercaptan and carbonyl sulphide, may lead to corrosion of copper components in production and storage facilities. Although the sulphur removal process can eradicate most of the sulphide to some extent, the residual sulphide, in trace amounts, can also be harmful to the corrosion of copper components. Of those common active sulphides, H2S is the most harmful to copper, even it is presented in low concentration. Although previous studies have revealed the behaviour of H2S on copper corrosion in LPG, the influence of other environmental factors, such as the presence of O2 and relative humidity (RH), also contribute to corrosion attack.
Recently, the corrosion behaviour of copper in the presence of various sulphides has been extensively studied [4,5,6,7]. Echeverria investigated the copper corrosion in SO2 through atomic force microscopy (AFM). The results showed that the microscopic topography and roughness of the copper surface changed after several weeks in a polluted atmosphere containing SO2 [8]. Majtás discovered that low concentrations of H2S can corrode copper parts, resulting in electrical failure of electronic equipment. Additionally, the adsorbed water can promote corrosion attack [9]. Zhu proved that the corrosion rate of copper in an SO2 environment first increases and then gradually decreases with exposure time. Conversely, the corrosion rate of copper in H2S increases slowly at first and then sharply declines [10]. Araban studied the corrosion behaviour of copper in different rural atmospheres. The results showed that corrosion product of Cu2O formed preferentially, in which relative humidity and ammonium sulphate had remarkable influence on the corrosion behaviour [11]. Monzó found that sulphide has an obvious influence on corrosion between the boundary and the centre of a copper sheet. Additionally, elemental sulphur is more corrosive than ethanethiol. The corrosion products of elemental sulphur are in the form of nodule particles, and the ethanethiol is in the form of a uniform film [12]. García found that, at low concentrations of elemental sulphur (5 ppm), mercaptans can significantly promote corrosion. At high concentrations of elemental sulphur (25 ppm), mercaptans inhibit the corrosion of elemental sulphur. Disulphide has an obvious inhibition effect on the corrosion of elemental sulphur [13]. Studies on the corrosion behaviour of copper in the outdoor natural atmosphere have also been reported [14,15,16,17,18,19,20]. Kong proved that the uneven corrosion of copper in the atmosphere of Turpan is caused by the dry–wet cycle and the cold–heat cycle [21]. Lopesino believed that the corrosion of copper is more serious when closer to the coast, and the degree of patina coverage depends on the concentration of chloride in the atmosphere [22]. Yan confirmed that the corrosion rate of copper in the atmosphere with sodium chloride is almost 30000 times higher than that in the blank atmosphere [23]. Some other studies focused on the influence of RH on the corrosion behaviour of copper [24,25,26]. Odnevall believed that in the rural atmosphere containing ammonium sulphate, the RH of the gas had a great influence on the corrosion behaviour of copper [12]. Sharma proposed that regarding copper in H2S with low relative humidity, the Cu2O layer resulted by air has a good protective effect on H2S. It almost has no protection under high RH [27]. Wu proved that the RH of the chloride-containing atmosphere is a key factor affecting the corrosion behaviour of copper wires [28]. The corrosion behaviour of chloride on copper has also been extensively studied [29]. Chen proposed that the non-uniform growth of corrosion products on the copper surface in chloride-containing sulphide aqueous solutions resulted in a potential difference between the “thick film” and the “thin film”, and this small potential difference accelerated the occurrence of corrosion [30]. Lu believed that chloride ions in the marine atmosphere of Nansha are the key factors to accelerate the corrosion of copper, and the corrosion products are Cu2O and Cu2Cl(OH)3 [31]. Schindelholz believed that sodium chloride is favourable for the formation of NaOH-rich diffusion regions, and copper preferentially forms Cu2O and Cu(OH)2 [32]. There are also few reports on the electrochemical study of corrosion products on copper surfaces [33]. Tran found that the growth of corrosion product films of copper exposed to H2S-containing subsurface gas has three successive stages: the first stage is a linear growth rate in thin layers (less than 15 nm). In the second stage, the oxidation rate is limited by the diffusion of copper(I) ions through the thicker corrosion layer. The third stage is linear growth [34]. Fiaud believes that both hydrogen sulphide concentration and relative humidity can promote the growth of oxide and sulphide corrosive substances. The growth mechanism of Cu2O is an electrochemical mechanism, and the growth mechanism of Cu2S is a mixed chemical and electrochemical mechanism [35]. Some other reports aimed at the corrosion behaviour of copper regarding other aspects, for example, application of theoretical calculations to copper corrosion [5,6,7,24], the influence of various organic acids on copper corrosion [36,37], the influence of changes in magnetic field on copper corrosion [38] and corrosion behaviour of copper by oxygen plasma [39].
Although some behaviours of copper corrosion in H2S have been studied, there is still some insufficiency. It is necessary to investigate the corrosion behaviour and mechanism of copper in LPG containing H2S at different conditions, including the presence of different RHs and O2 concentrations. In this paper, the influence of RH and O2 on the corrosion behaviour of copper in H2S-containing LPG was studied, the corrosion products on the surface of copper sheets were characterized and analysed and the corresponding corrosion mechanism of H2S on copper was proposed.

2. Experimental Methods

2.1. Materials

Copper sheets used in corrosion experiments were purchased from Fushun Keruisi Instrument Co., Ltd. Fushun Liaoning Province, China, which strictly follows the requirement of the ASTM standard [40]. The size of cuboid copper sheet is 75 mm × 12.5 mm × 3 mm, with the purity higher than 99.9%. Copper powder (analytical grade, Chengdu Kelon Chemical Co., Ltd. Chengdu, China) was used in X-ray photoelectron spectroscopy (XPS) and FTIR (Fourier transform infrared spectrometry). The purity of powder is 99.5% and the average particle size is 23 μm. The components of LPG are listed in Table 1. H2S and O2 gas used in the experiments were purchased from Zhengrong Gas company (Chengdu, China). The purity of H2S and O2 is 99.9%.

2.2. Copper Corrosion Tests

Copper corrosion tests were carried out according to the ASTM standard [40]. The copper sheet was first abrased with 65 μm silicon carbide sandpaper. Then, it was washed with isooctane. The copper surface was polished by 105 μm silicon carbide particles, which were operated with the assistance of isooctane-soaked degreasing cotton. The prepared copper sheets were suspended into the cylinder (the special closed container for corrosion test) in three parallel experiments. Then, high-purity N2 was used to remove the air inside the cylinder, by ventilating N2 into the cylinder to substitute the air. Then, to control the mass flow of LPG and H2S through a flowmeter (FMA5400A, Omega, San Antonio, TX, USA), they were injected into the cylinder and the gas was mixed evenly. Subsequently, the valve was fastened. Finally, the cylinder with mixture of LPG and H2S was vertically immersed in a water bath at a constant temperature (40 ± 0.5 °C) for 60 ± 5 min. After the experiment time was over, the liquid and gas in the cylinder were discharged. The copper sheets were taken out and compared with the standard colour plate [40]. Next, the corrosion grades of the copper sheets were evaluated. The details of the grade evaluation are shown in Table 2. The standard stipulates that if the corrosion level of a copper sheet reaches 2a and above, it is regarded as unqualified in corrosion.

2.3. Analysis of Corrosion Products

To facilitate the characterization of corrosion products, the concentrations of H2S and O2 were increased to 50 ppm and 10 ppm in copper corrosion tests. The copper sheets were used in corrosion tests for characterizations such as scanning electron microscopy (SEM), energy dispersive spectrometry (EDS) and grazing incidence X-ray diffraction (GIXRD). Samples of corrosion products for XPS and FTIR were prepared with powder, which could provide better results than copper sheets. The copper powder samples were applied by placing 0.1 g of copper powder in a glass sample bottle. Then, the glass sample bottle was suspended in a cylinder to conduct a copper corrosion experiment.
SEM (Model EVO MA15, ZEISS, Jena, Germany) was used to observe the morphology of the corrosion products on the copper surface. EDS (Model X-MaxN, OXFORD INSTRUMENTS Company, Abingdon, UK) was used to analyse the elemental composition of the corrosion products on the copper sheet surface. XPS (Nexsa type, Thermo Scientific, Waltham, MA, USA) was used to analyse the elemental composition and valence distribution of the corrosion products on the copper powder surface. The original XPS image was fitted with Casa XPS software. GIXRD (SmartLab 9 kw, Rigaku, Tokyo, Japan) was used to analyse the phase composition of corrosion products on the copper sheet surface. FTIR (INVENIO R, Bruker Optik GmbH, Bremen, Germany) was carried out to test the infrared spectrum of the corrosion products on the copper powder surface.

3. Results and Discussion

3.1. Influence of Humidity on Copper Corrosion in H2S-Containing LPG

The corrosion behaviour of copper in H2S-containing LPG is very sensitive to the gas humidity. The higher the gas humidity, the more easily copper is corroded by H2S. Figure 1a shows the variation in the corrosion grade of copper in H2S-containing LPG at different gas humidities. In LPG containing 3 ppm H2S, the corrosion grade of copper gradually intensifies with the increase in gas humidity. At 0–30% RH, there is no significant corrosion on the copper surface (corrosion grade is 1a). At 50–100% RH, the surface of the copper sheet begins to corrode (at 50% RH, the copper corrosion grade is 2a). The degree of corrosion varies with humidity. The copper corrosion grade reaches 2e at 100% RH. Meanwhile, the variation in the copper corrosion grade in LPG without H2S in the presence of different gas humidities is used as comparison, in which the copper surface does not corrode at all humidities (corrosion grade is 1a).
The critical point (CP) of copper corrosion in H2S-containing LPG decreases with the increase in the relative humidity of LPG. The CP is defined as the lowest H2S concentration to reach the corrosion grade of 2a at specific environmental conditions. Figure 1b shows the influence of H2S concentration and RH on the corrosion grade of copper in LPG. It can be seen that the CP gradually decreases with the increase in gas humidity. From 0% RH to 100% RH, the CP decreases from 3.8 ppm H2S to 1.7 ppm H2S. It indicates that higher humidity is more beneficial to the corrosion process. In higher humidity, the thin film of water at the copper surface forms more easily, which provides an electrolyte environment for H2S dissolution and electrochemical corrosion. With the increase in RH, the thickness of the water film at the interface increases, which will provide a better condition for electrochemical corrosion. Therefore, the corrosion attack is more severe at higher RH and the CP would be lowered with the increase in RH.
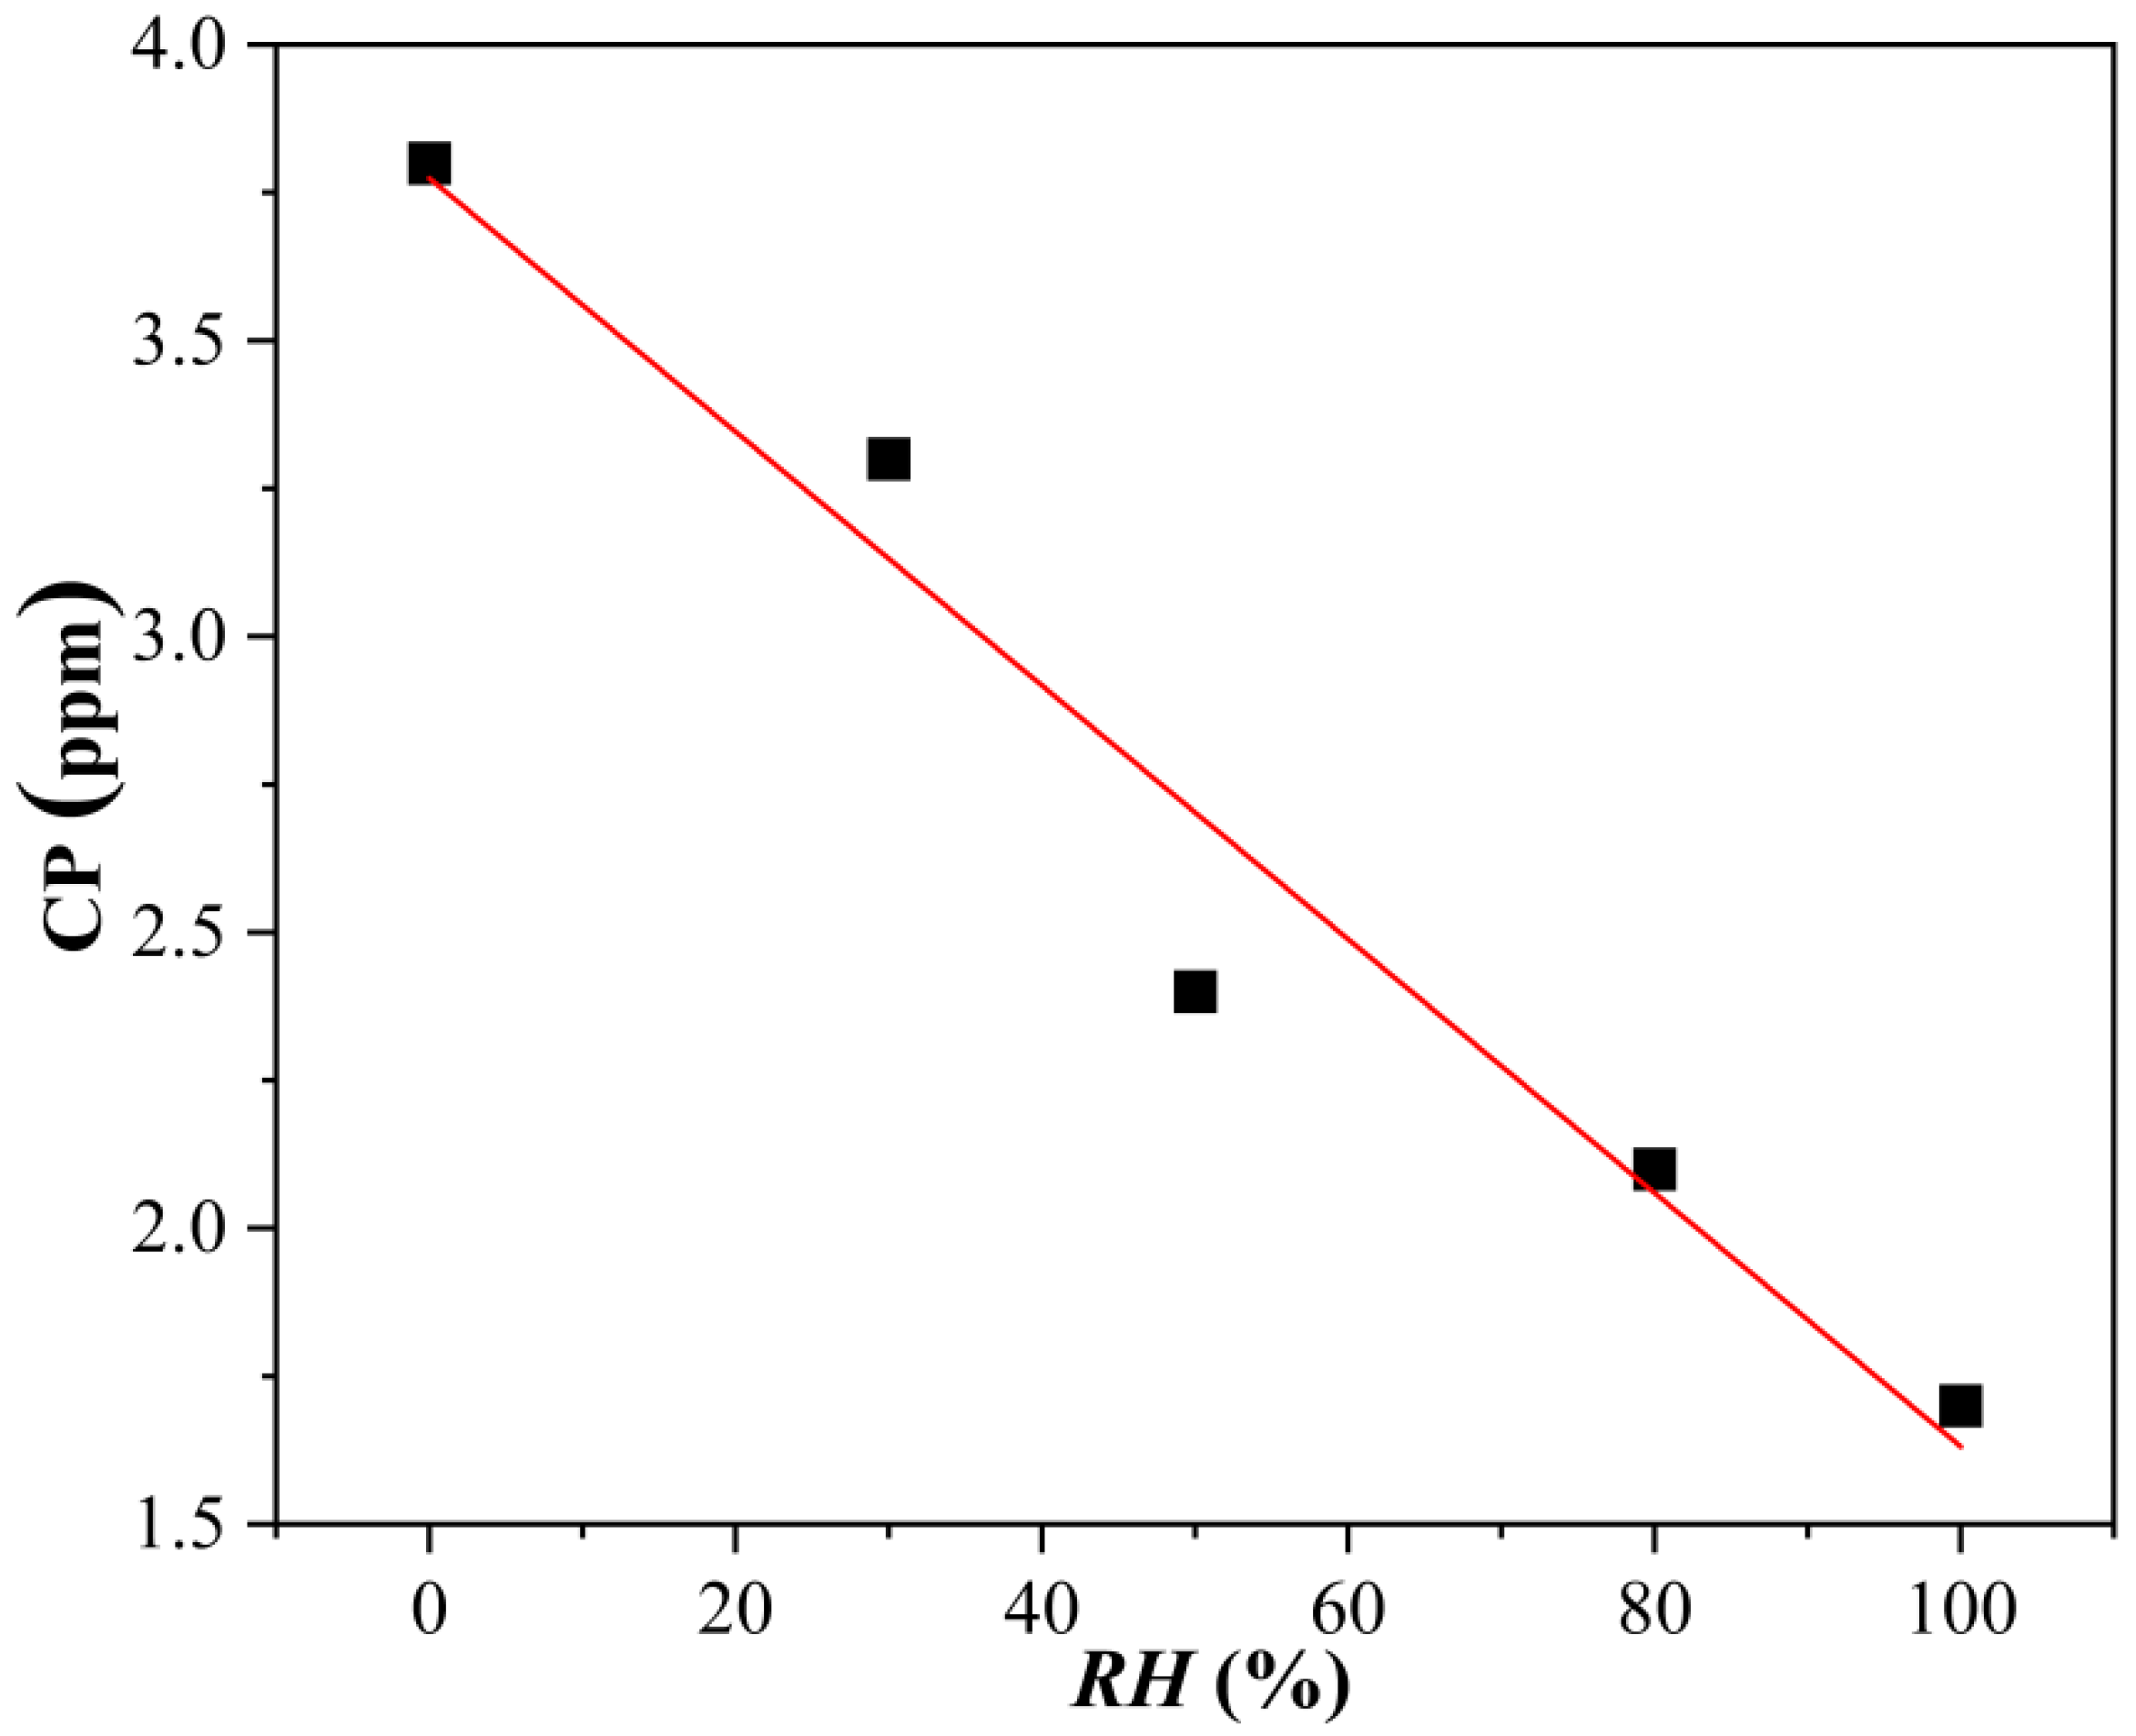
The influence of RH on the CP is shown in Figure 2. The results of the CP at different RHs show a linear relationship. The fitted data obey Equation (1) as follows:
C P = 0.021   R H + 3.77   ,   R 0 = 0.96
where CP is the critical point of copper corrosion, corresponding to the lowest H2S concentration for reaching the corrosion grade of 2a. RH is the relative humidity for the corrosion test. R is the coefficient of determination. The results imply that with the increase in RH, the thickness of the water film formed at the copper surface increases accordingly. The thicker water film is more favourable for H2S dissolution. Consequently, the electrochemical corrosion process is enhanced.

3.2. Synergistic Effect of Oxygen and Humidity on Copper Corrosion in H2S-Containing LPG

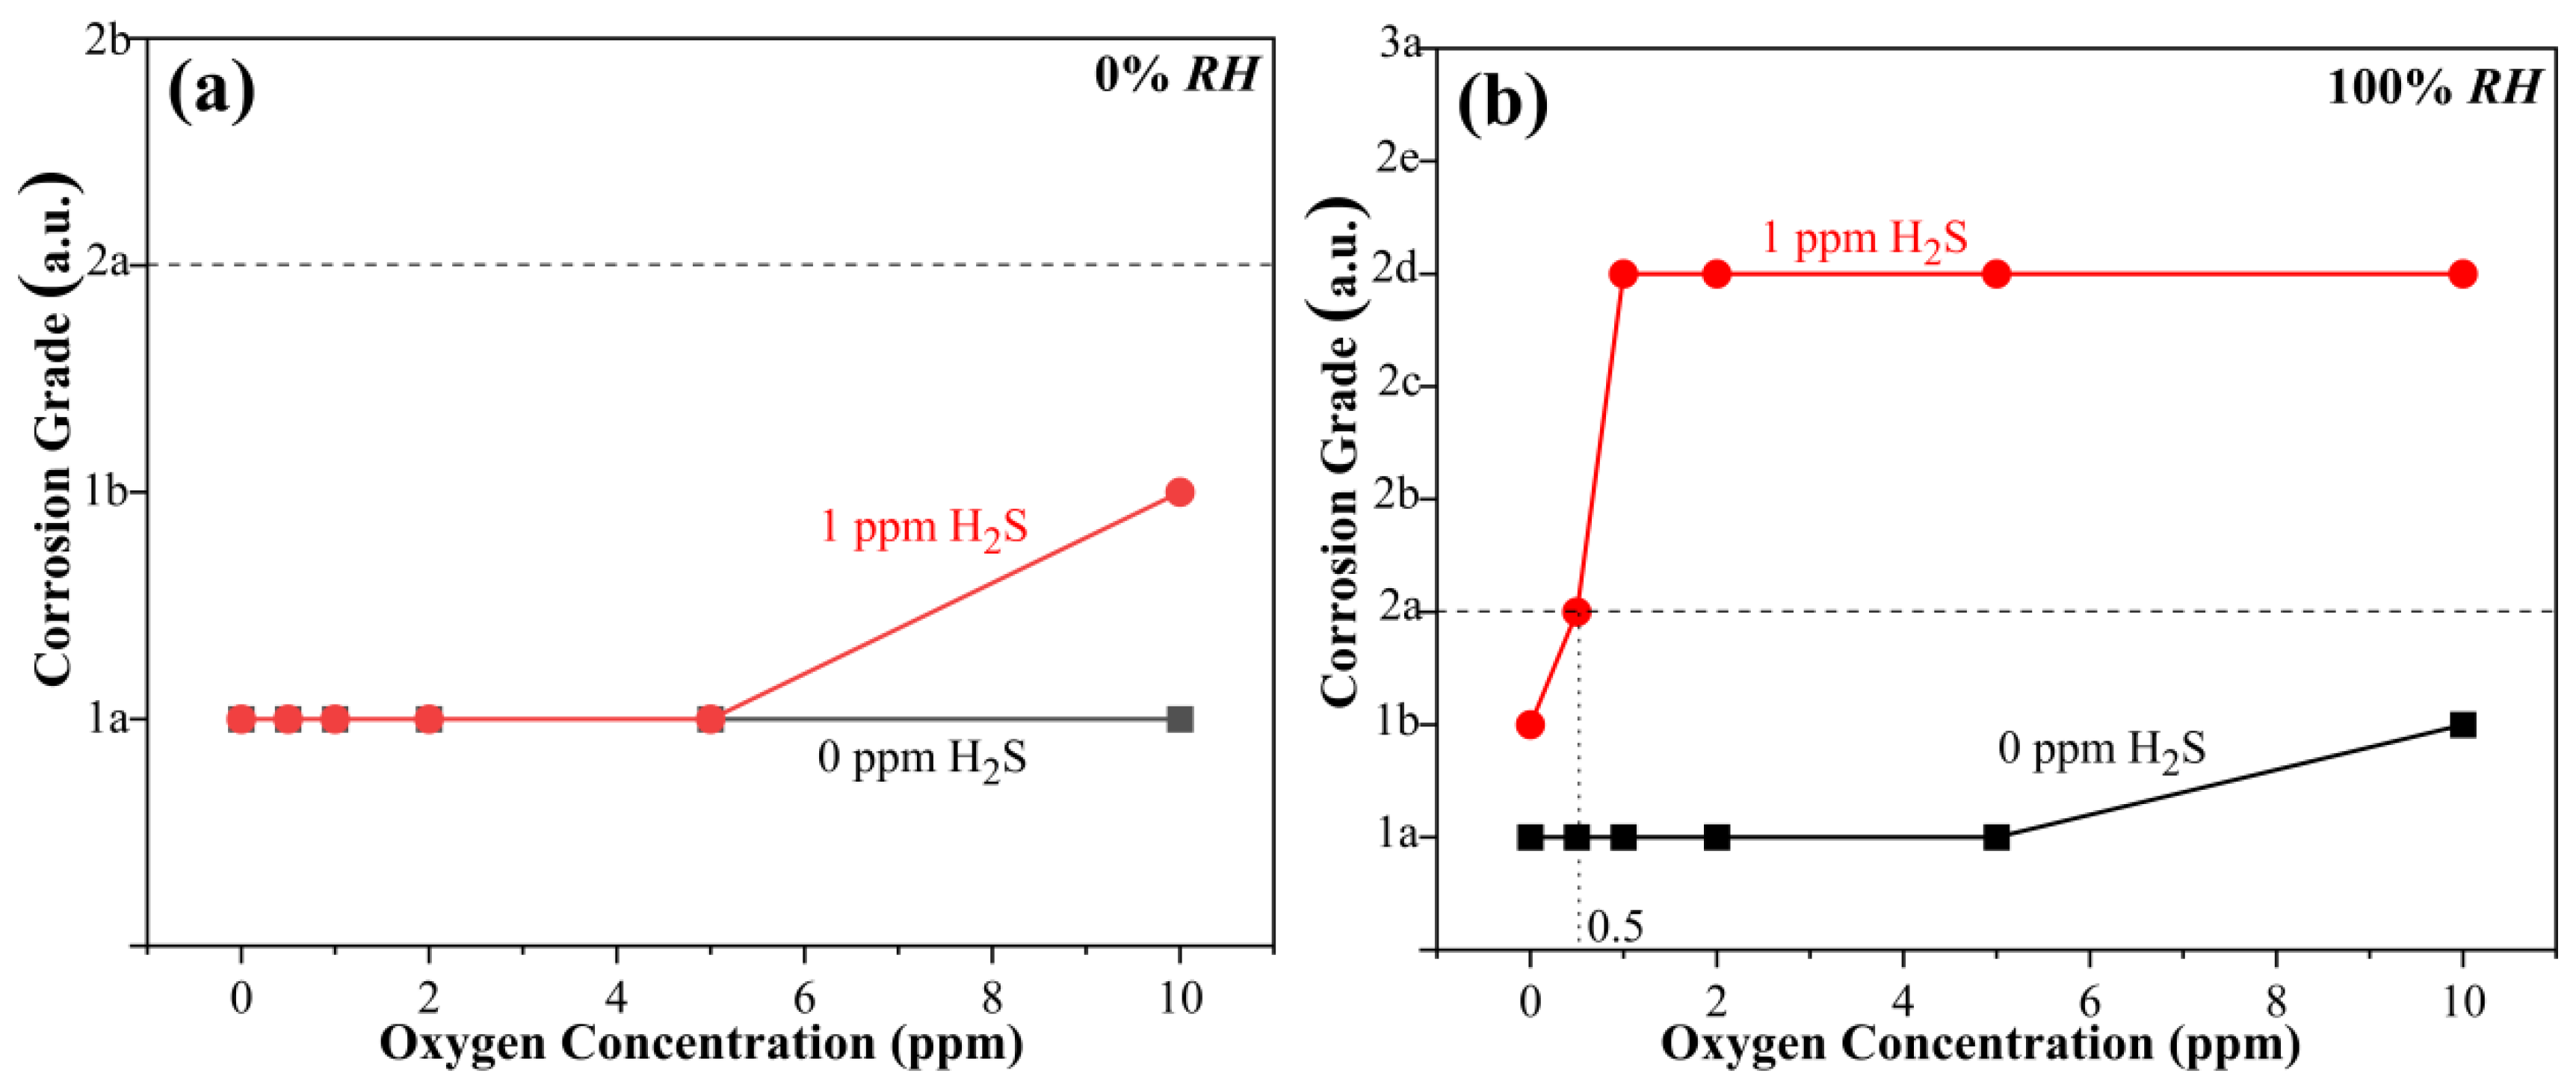
A small amount of O2 has limited influence on the corrosion of copper in dry LPG (0% RH). Figure 3a shows the variation in copper corrosion grade with O2 content in LPG (0% RH) containing H2S. As can be seen from Figure 3a, in pure LPG (without H2S), the corrosion grade of copper does not change with the increase in O2 content (corrosion grade is 1a). No apparent corrosion happened at the copper surface at such condition. In LPG containing trace H2S (1 ppm), slight corrosion on the copper surface appears with the increase in O2 content. Among them, there is no apparent corrosion on the copper surface from 0 to 5 ppm O2, and the corrosion grade of copper sheets in 10 ppm O2 begins to rise to 1b, which is also below 2a.
A small amount of O2 has a pronounced effect on the corrosion of copper in wet LPG (100% RH). Figure 3b is the variation in copper corrosion grade in H2S-containing LPG (100% RH) with O2 concentration. It demonstrates that in the absence of H2S, the copper corrosion grade can hardly be changed with the increase in O2 content. The copper surface does not corrode in 0–5 ppm O2, displaying a corrosion grade of 1a. In the presence of 10 ppm O2, the copper corrosion grade is slightly promoted to 1b. In the presence of a trace amount of H2S (1 ppm) at 100% RH, the degree of corrosion is sharply intensified with the increase in O2 content. An amount of 0.5 ppm of O2 can lead to unqualified copper corrosion (grade 2a). When the O2 content increases to 1 ppm, the corrosion grade rapidly climbs to grade 2d. When the content of O2 continues to increase, the corrosion grade is stabilized at grade 2d.
Figure 3 reveals that the coexistence of gas humidity and O2 has a notable synergistic effect on the corrosion of copper in LPG in the presence of H2S. Compared with pure LPG (0% RH, 0 ppm O2), the copper in LPG containing wet H2S and O2 is more easily corroded.
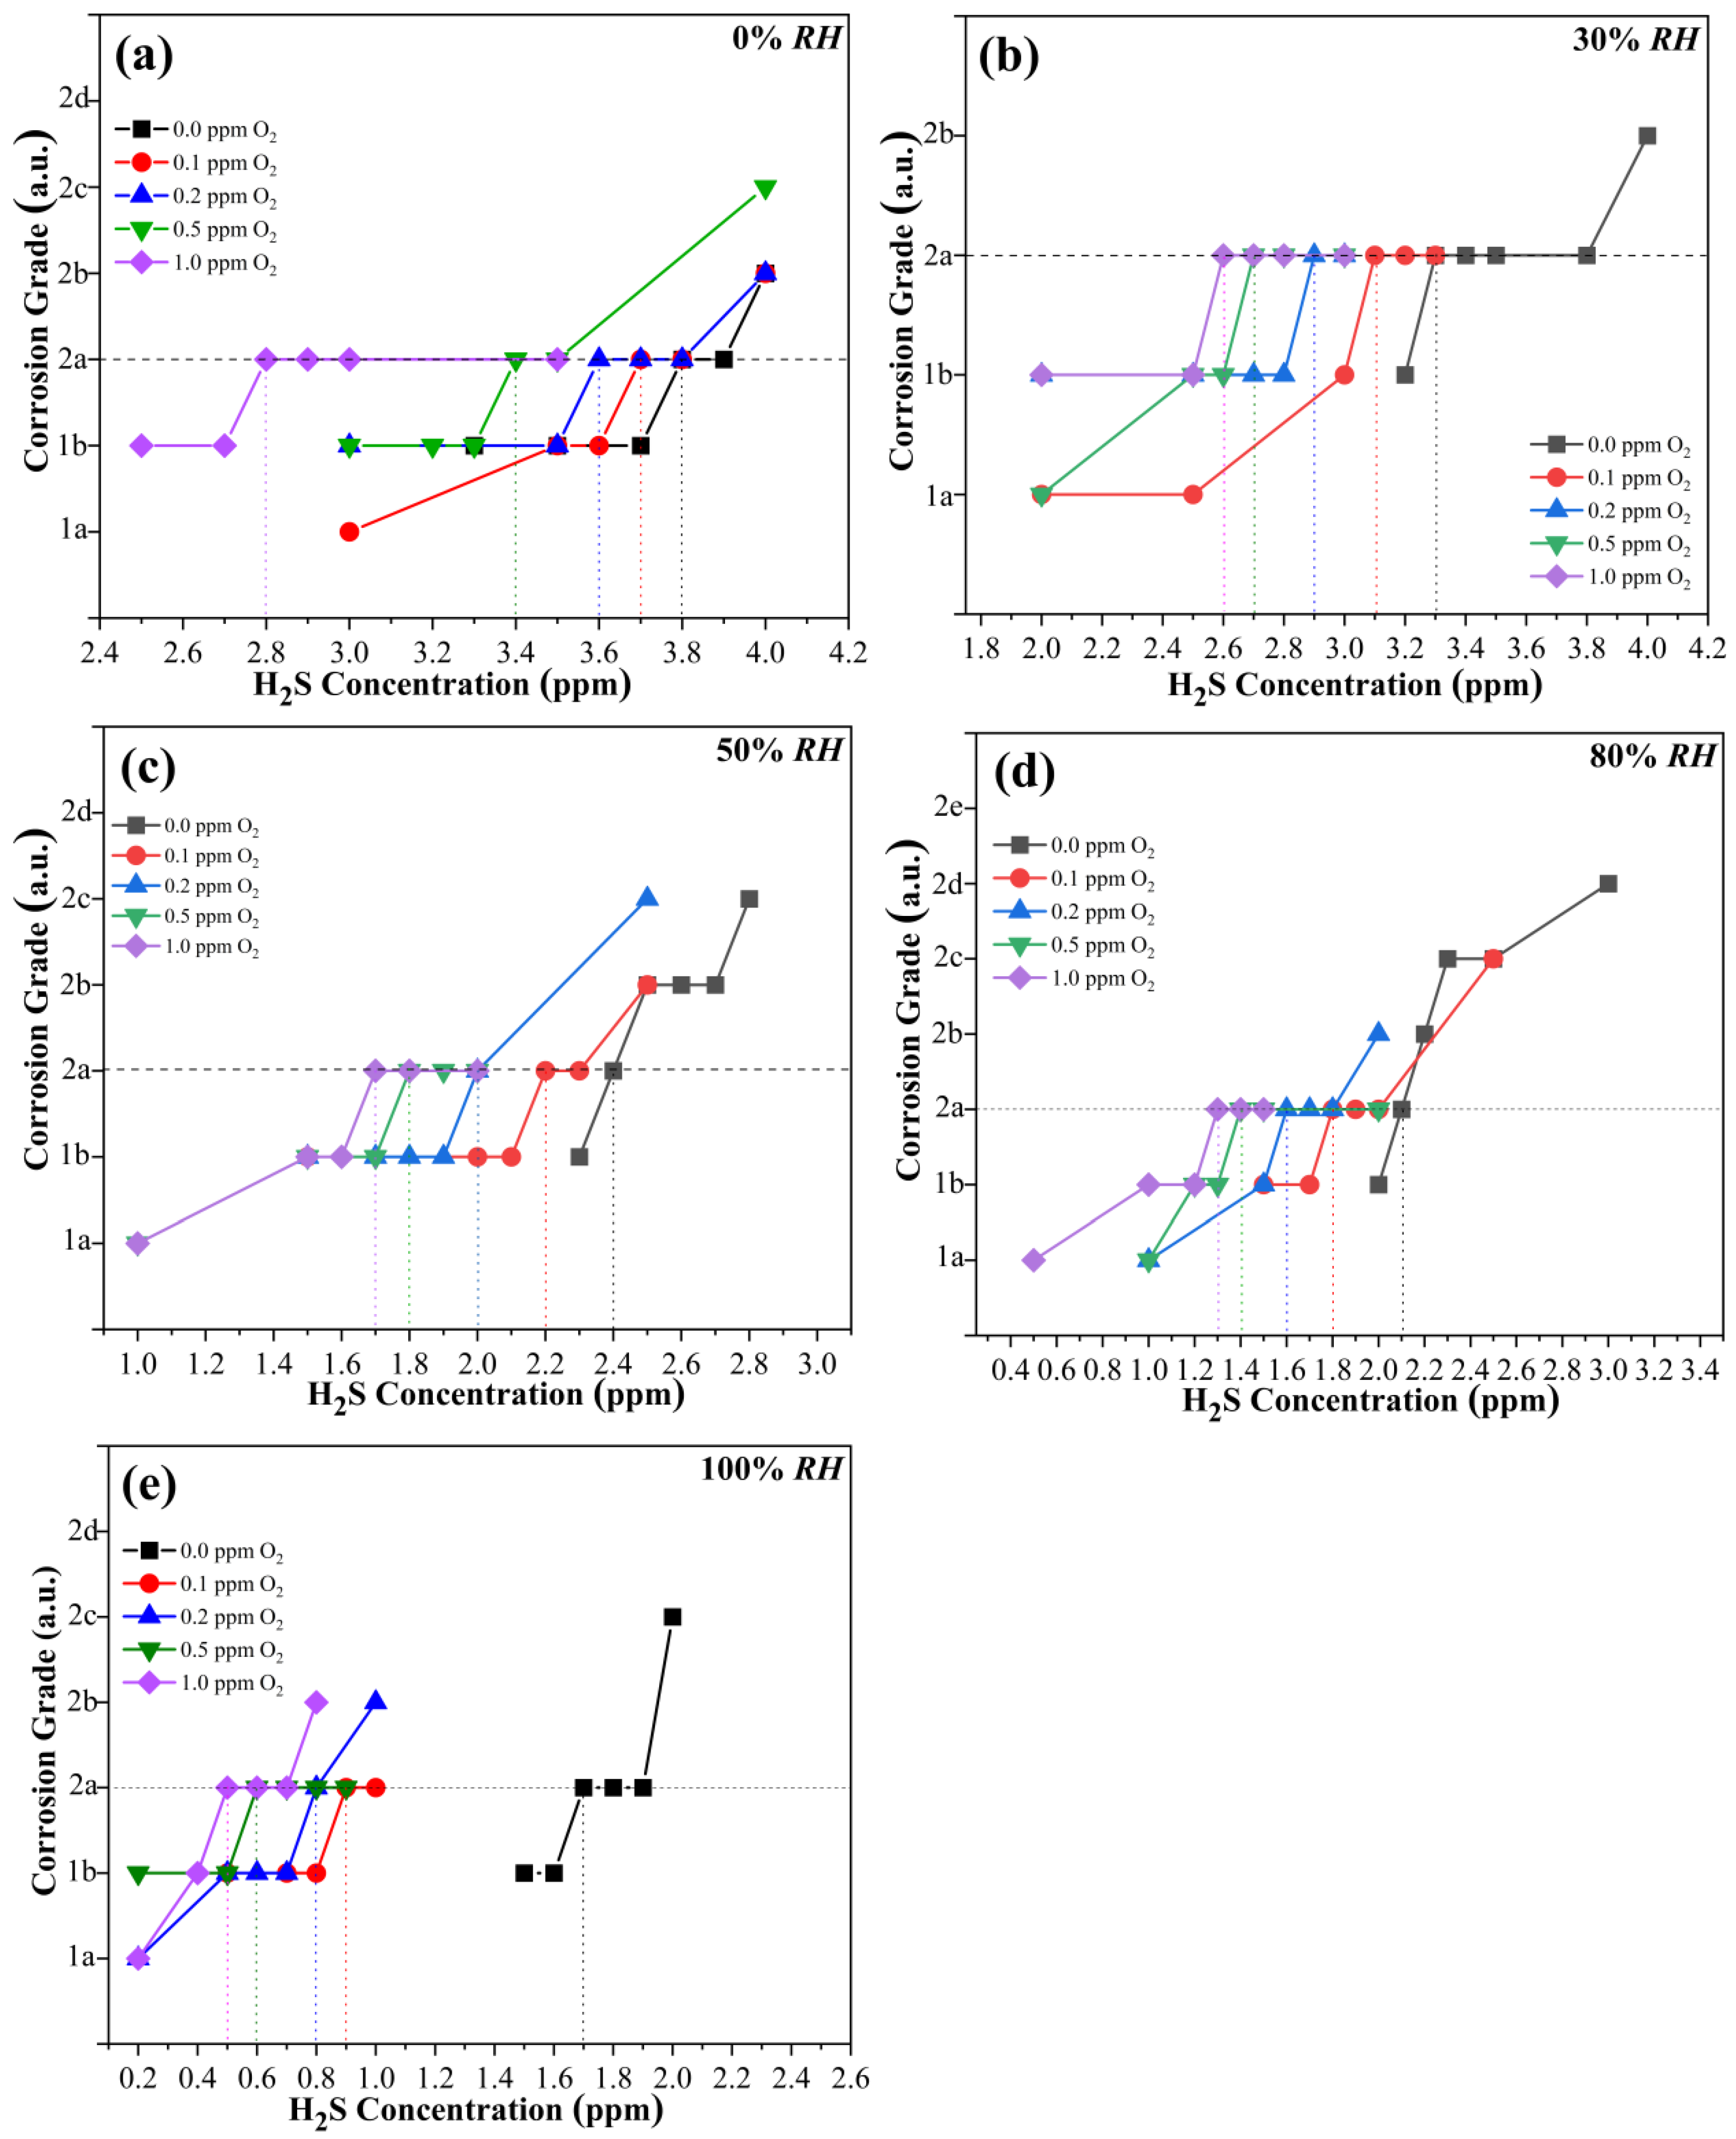
In order to further study the synergistic effect of oxygen and humidity on the CP of copper corrosion in H2S-containing LPG, the corrosion behaviour of copper in H2S-containing LPG in the presence of different oxygen concentrations was studied at 0% RH, 30% RH, 50% RH, 80% RH and 100% RH, respectively. The results are shown in Figure 4. It can be seen that at every RH condition, the CP gradually decreases with the increase in O2 concentration. At the same oxygen concentration, CP gradually declines with the increase in the gas humidity.
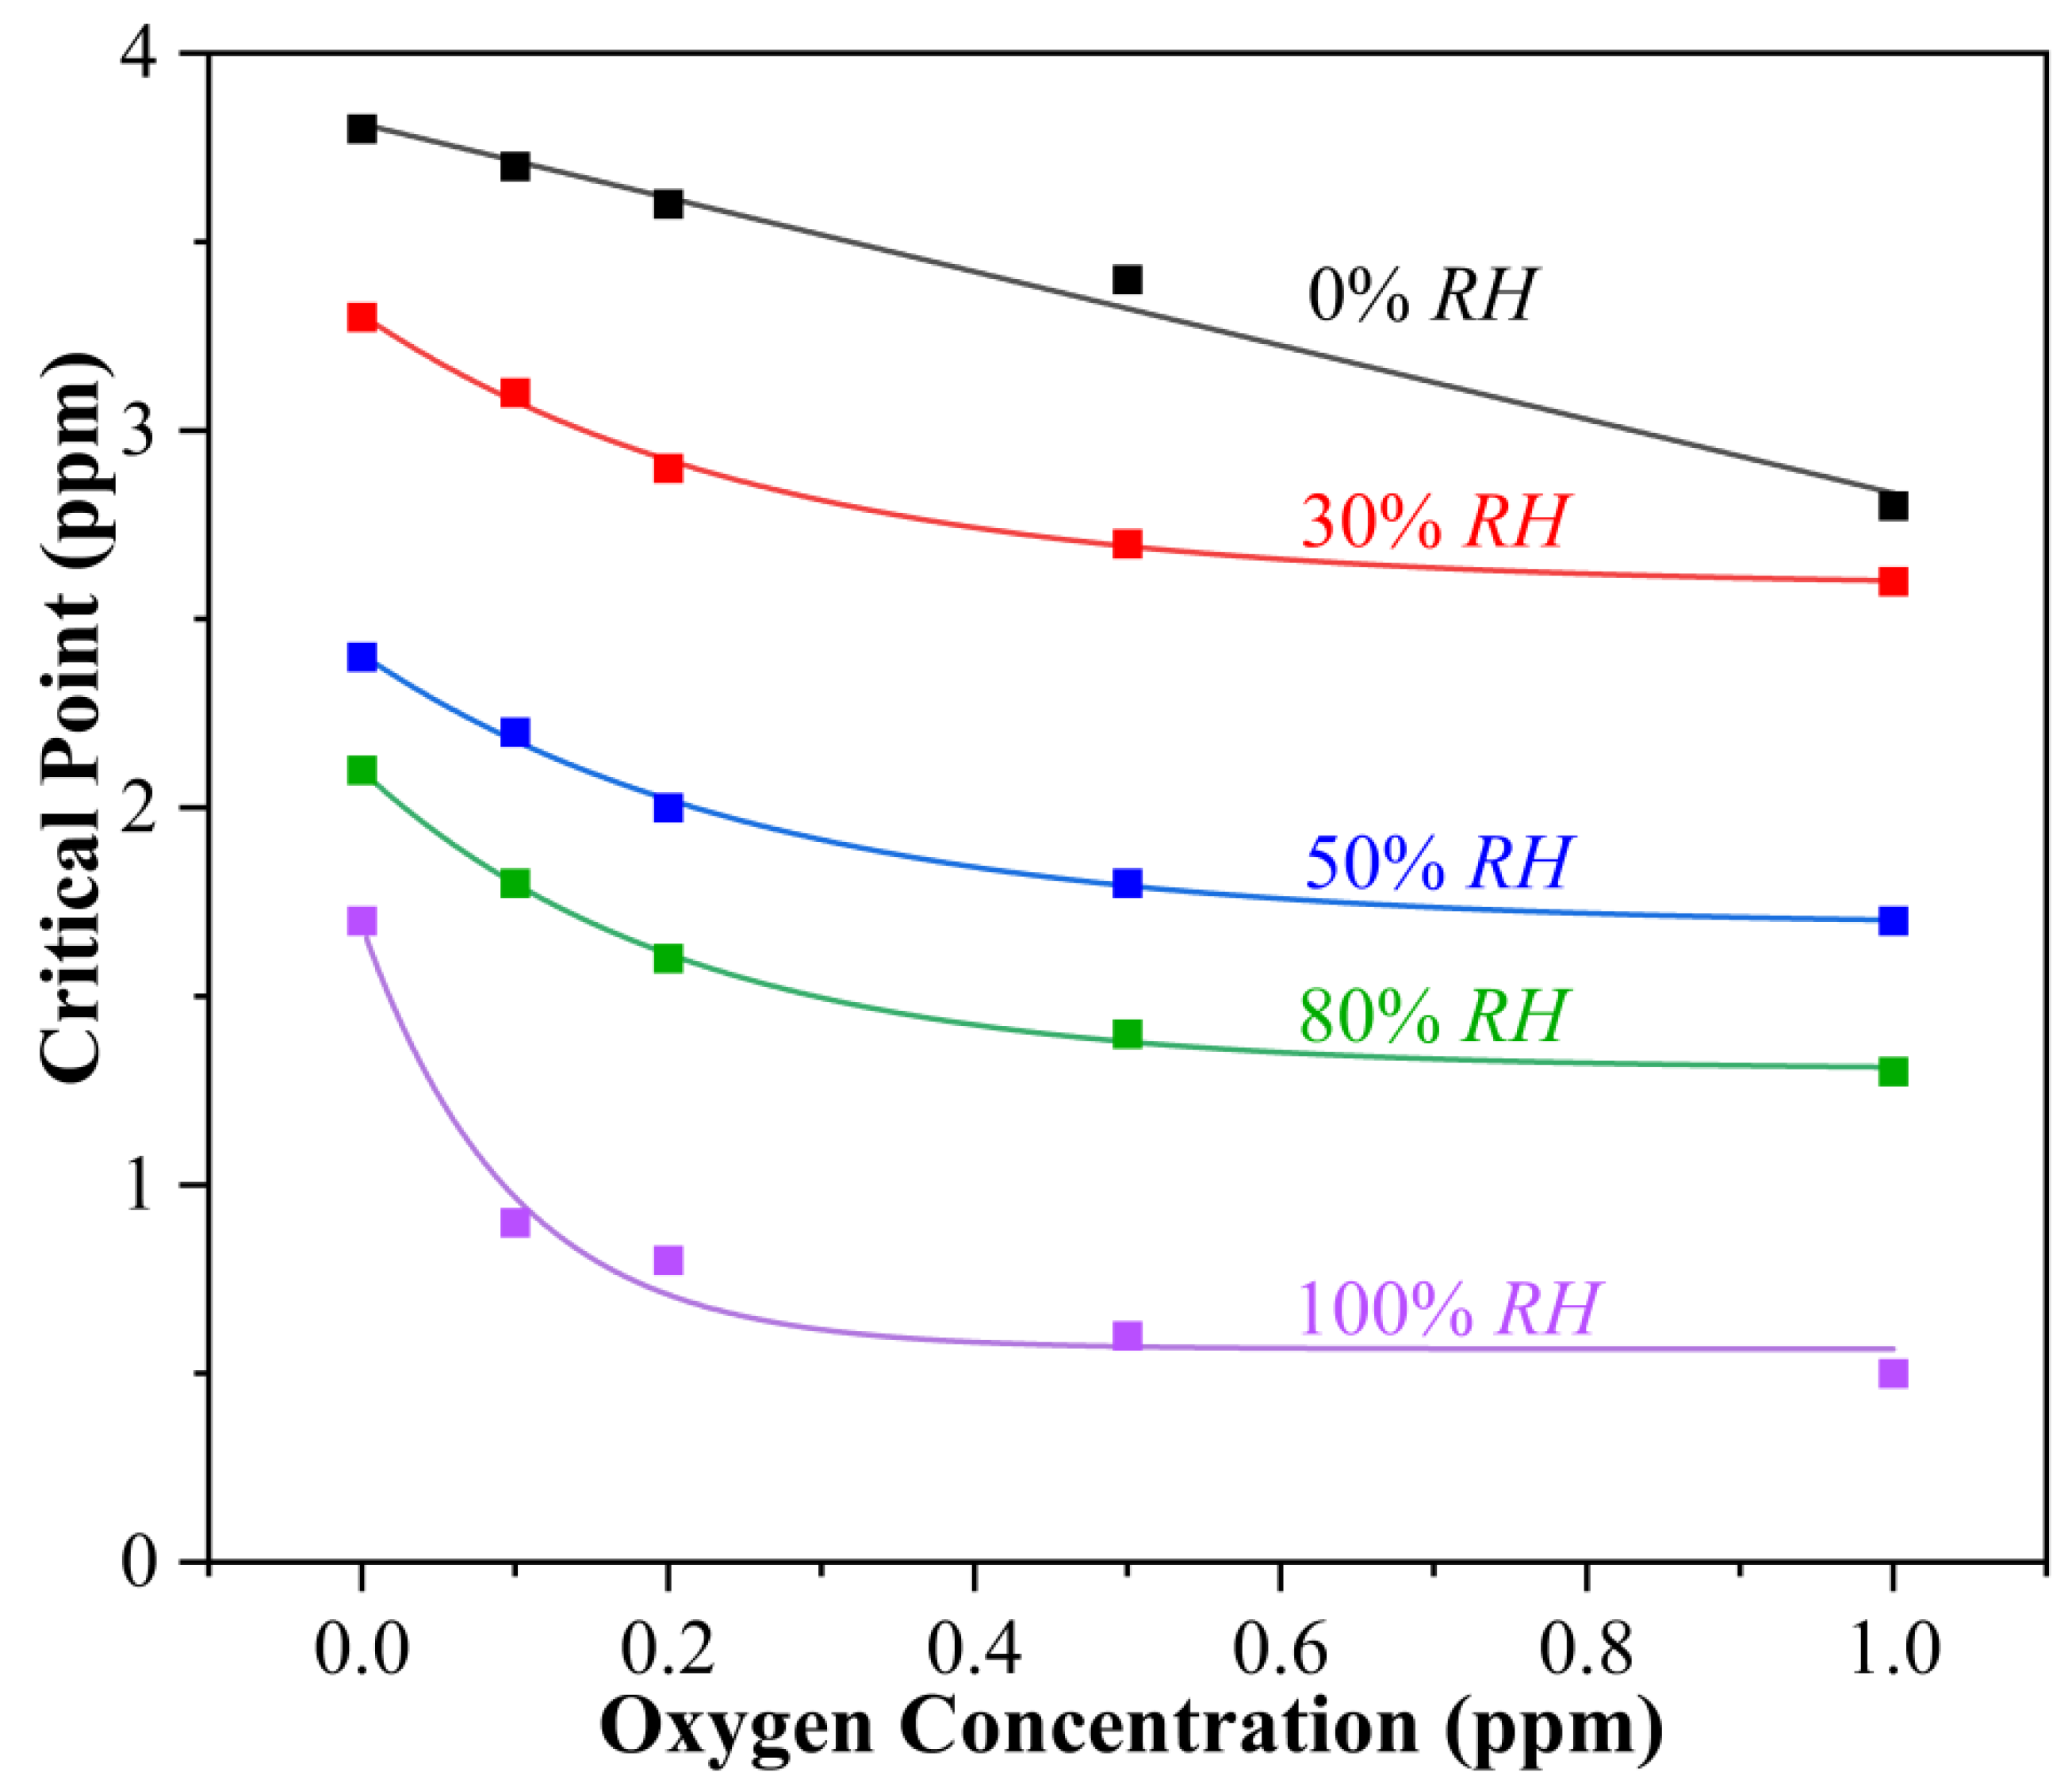
More precise behaviour can be illustrated by interpreting the relationship between the CP and O2 concentration at different RHs, as is shown in Figure 5. The discussion is carried out at different RHs.
(a)
In the absence of water (0% RH), CP follows a linear relationship with O2 concentration. The fitted data obey Equation (2) as follows:
C P 0 % = 3.81 0.978   C 0   ,     R 1 = 0.98
where CPx% is the critical point of copper corrosion in H2S-containing LPG (x% RH), corresponding to the minimum H2S concentration for corrosion grade 2a. C0 is the oxygen concentration of LPG in the copper corrosion test. R is the coefficient of determination.
(b)
In the presence of water (30% RH), CP follows a negative exponential function with the O2 concentration. The fitted data obey Equation (3) as follows:
C P 30 % = 0.720   e 3.82   C 0 + 2.585     ,       R 2 = 0.99
(c)
In the presence of water (50% RH), CP follows a negative exponential function with the O2 concentration. The fitted data obey Equation (4) as follows:
C P 50 % = 0.720   e 3.82   C 0 + 1.685     ,       R 3 = 0.99
(d)
In the presence of water (80% RH), CP follows a negative exponential function with the O2 concentration. The fitted data obey Equation (5) as follows:
C P 80 % = 0.793   e 4.74   C 0 + 1.305     ,       R 4 = 0.99
(e)
In the presence of water (100% RH), CP follows a negative exponential function with the O2 concentration. The fitted data obey Equation (6) as follows:
C P 100 % = 1.123   e 10.20   C 0 + 0.564         ,       R 5 = 0.98
In the absence of H2O, the contribution of O2 to copper corrosion is relatively even, which is consistent with a previous report [27]. However, the presence of H2O makes copper corrosion more sensitive to O2 even at low O2 concentration. The formation of a water film on the copper surface makes the corrosion process different. According to the Arrhenius Equation, Equations (7) and (8), in kinetics, when the temperature of the reaction system is constant, the rate constant of a specific chemical reaction is related to the activation energy of the reaction. The lower the activation energy of the reaction, the faster the reaction rate is. In the presence of H2O, the activation energy in the reaction system decreases (Equation (9)). Compared with the reaction system without H2O, the reaction rate constant (k) is larger, so the reaction rate is faster. This explains why the CP at 0% RH is higher than the CP in the presence of H2O.
k ( 0 ) = A   e ( E a ( 0 ) / R T )
k ( c ) = A   e ( E a ( c ) / R T )
from Equations (7) and (8):
E a ( c ) = E a ( 0 ) R T ln ( k ( c ) / k ( 0 ) )
where k(0) is the rate constant of the reaction, k(c) is the rate constant of the reaction after adding the catalyst, Ea(0) is the activation energy of the reaction (kJ∙mol−1), Ea(c) is the activation energy of the reaction after adding the catalyst (kJ∙mol−1), A is the pre-exponential factor, e is the natural base (2.718), R is the gas constant (8.314 J∙mol−1∙K−1) and T is the thermodynamic temperature (K). The presence of the water film, which acts as a catalyst in the system at the interface, changes the kinetics of the corrosion process.
The variation in the CP with O2 at different RHs can also be explained by Equations (7)–(9). It is well known that the presence of a water film at the interface can reduce the activation of the reaction, which can increase the number of activated molecules in the reaction system by increasing the number of effective collisions. Thus, it significantly accelerates the reaction rate. A higher RH in the reaction system means a thicker water vapour film on the copper surface, which implies greater effectiveness in promoting the corrosion process. When the reaction concentration is constant, the thicker water film can generate more activated molecules in the reaction system, the reaction rate constant (k) is larger and more effective collisions are generated per unit time to form more Cu2S and Cu2O.

3.3. Corrosion Mechanism of Copper in Different H2S-Containing LPG Environments

3.3.1. Surface Morphologies after Corrosion

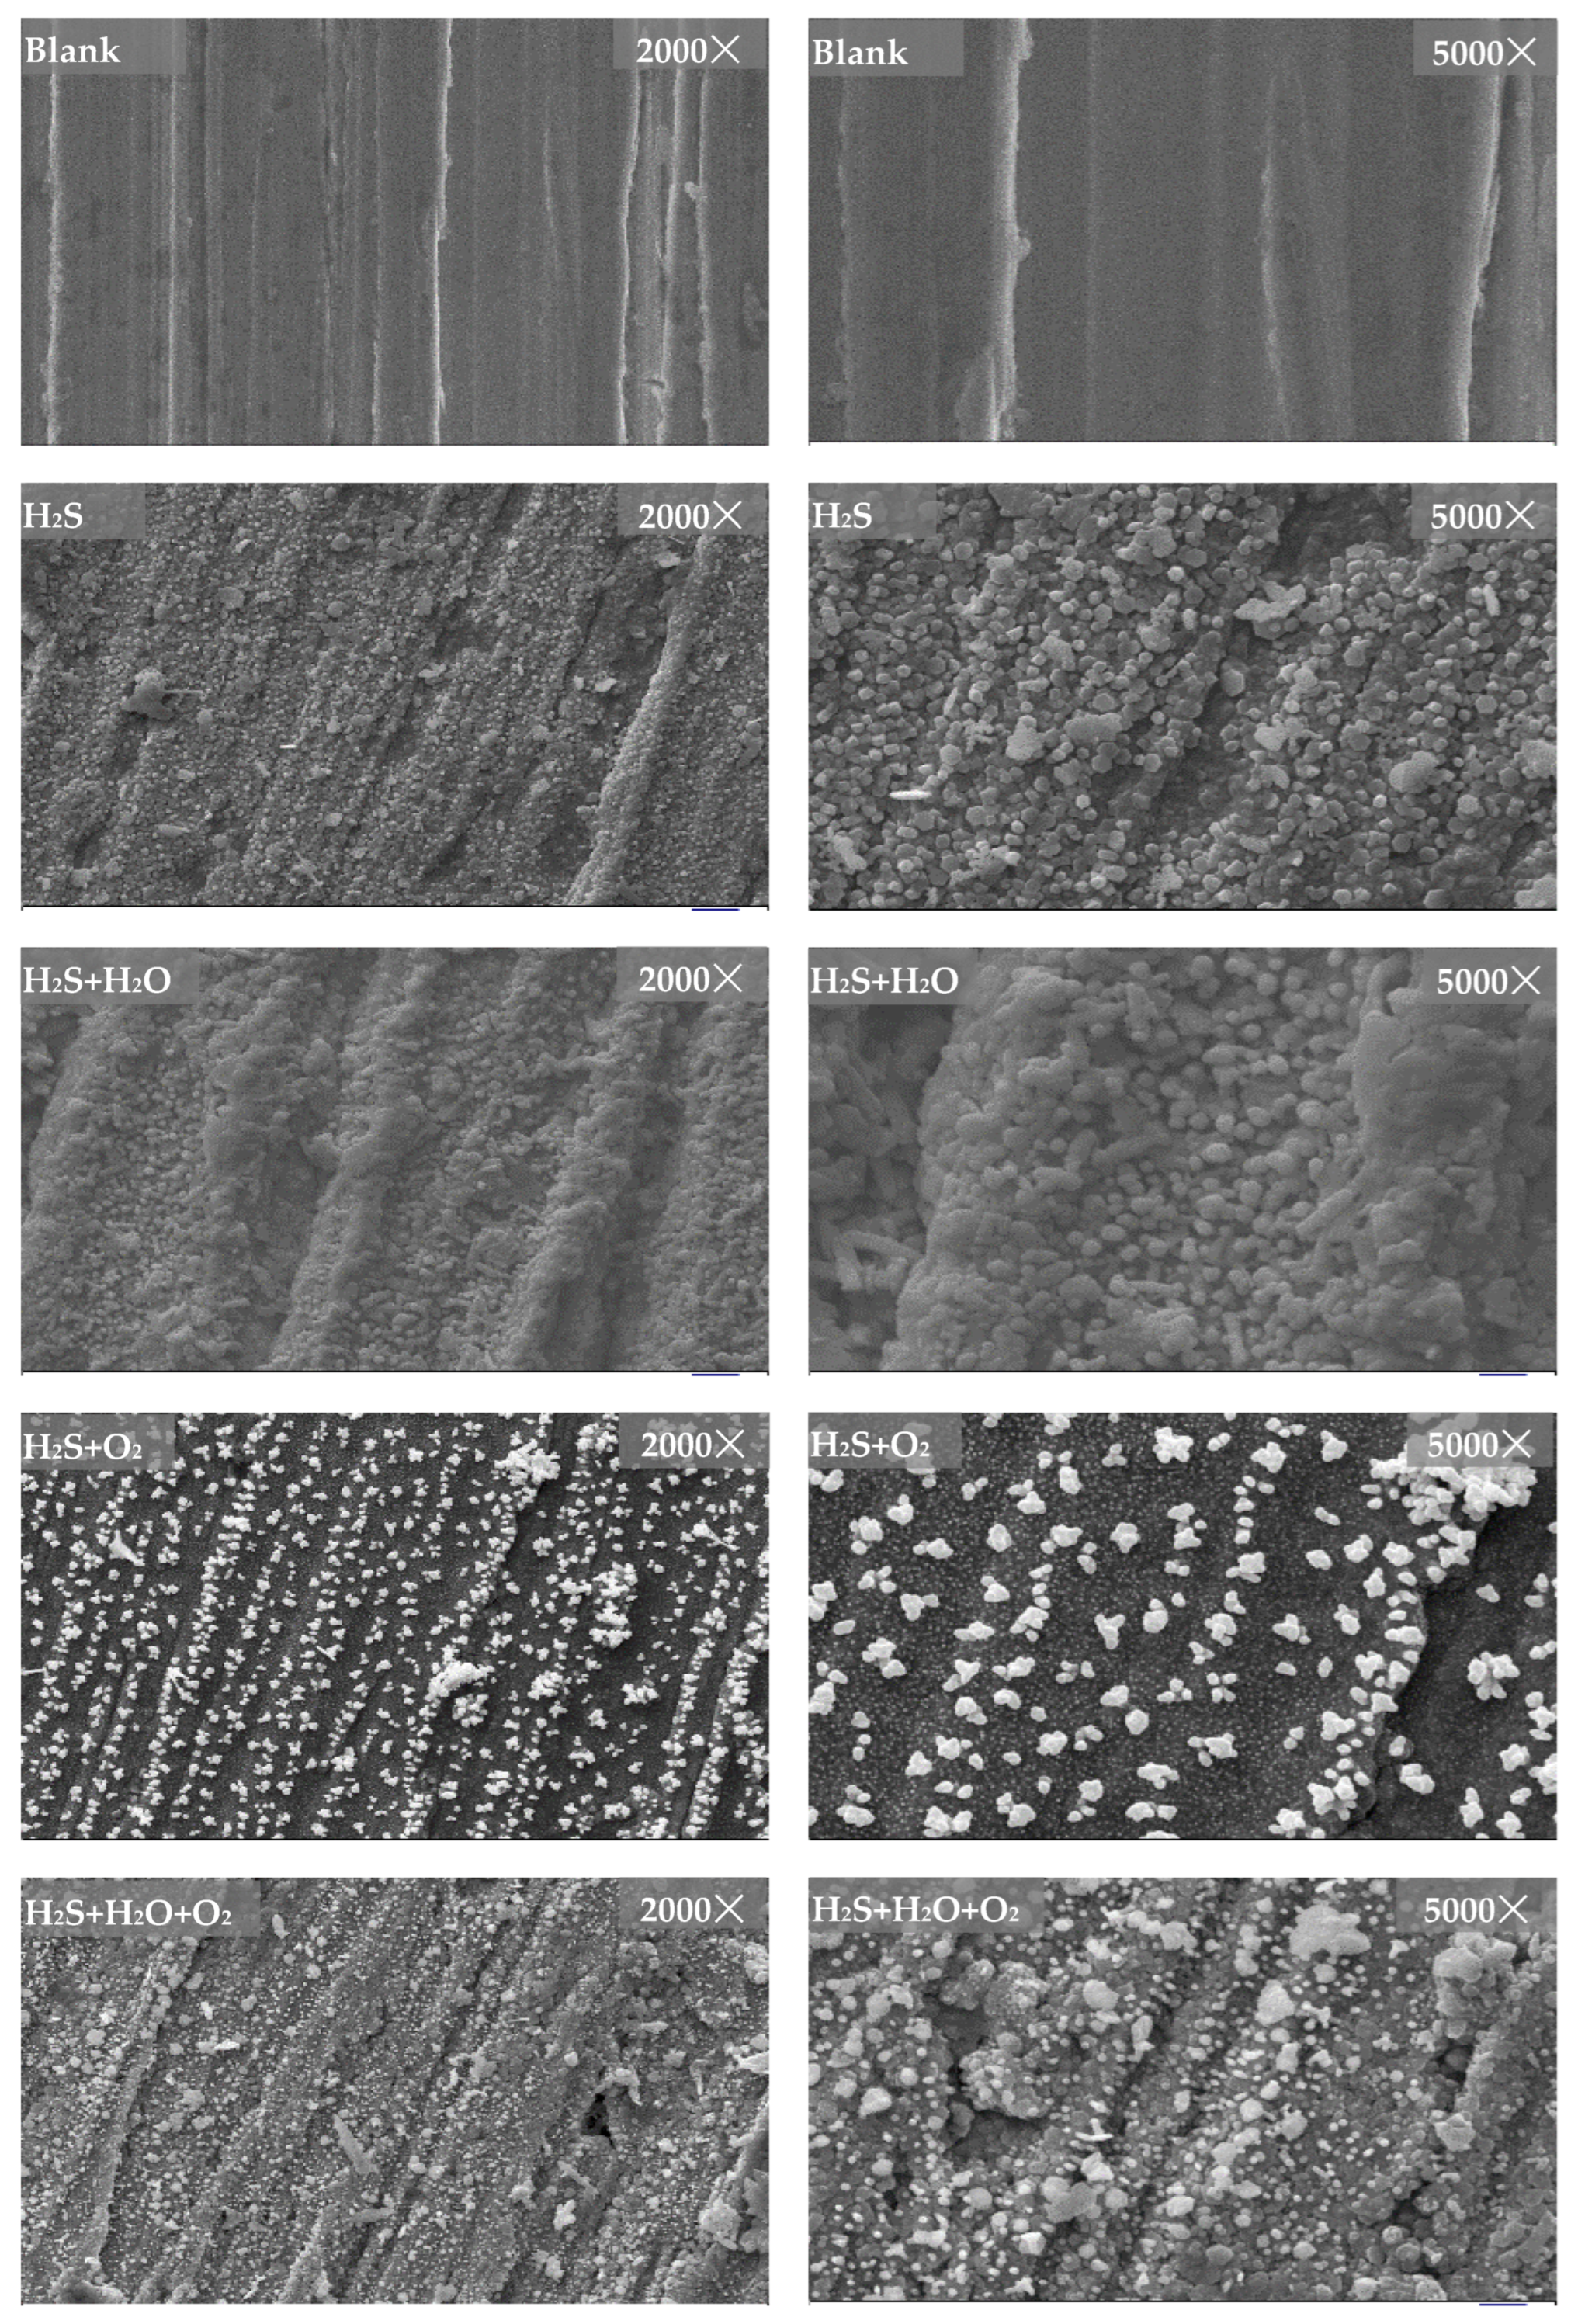
In different environments, LPG with H2S, H2S + H2O, H2S + O2 and H2S + O2 + H2O, the microscopic morphologies of the corrosion products on the copper surface sheet are shown in Figure 6. In the absence of H2S, the copper surface displays an uncorroded appearance with grooves of abrasion. When corroded in H2S-containing LPG, the copper surface is evenly covered with a thick corrosion product film. The corrosion products are in the shape of a regular hexagon with sharp edges and corners. In LPG (100% RH) containing H2S + H2O, the copper surface is evenly covered with a thick layer of corrosion product film. The corrosion products are spherical and accumulate at the grooves of scratches, indicating that the nucleation and growth of corrosion tend to preferentially happen at grooves of scratches [41]. A similar phenomenon also appears in other environments. In H2S + O2, the amount of corrosion products is significantly reduced. The corrosion products are sporadically distributed on the copper surface. The white particles of corrosion products are irregular in shape and size. It can be seen from the morphology that the general corrosion at this condition is significantly reduced, which is consistent with the previous experimental results. The corrosion attack happens at localized active sites, not on the whole surface. In H2S + H2O (100% RH) + O2, it exhibits a thick corrosion product film on the copper surface. Some irregular white corrosion products attach on the film surface.

3.3.2. EDS Analysis of Corrosion Products

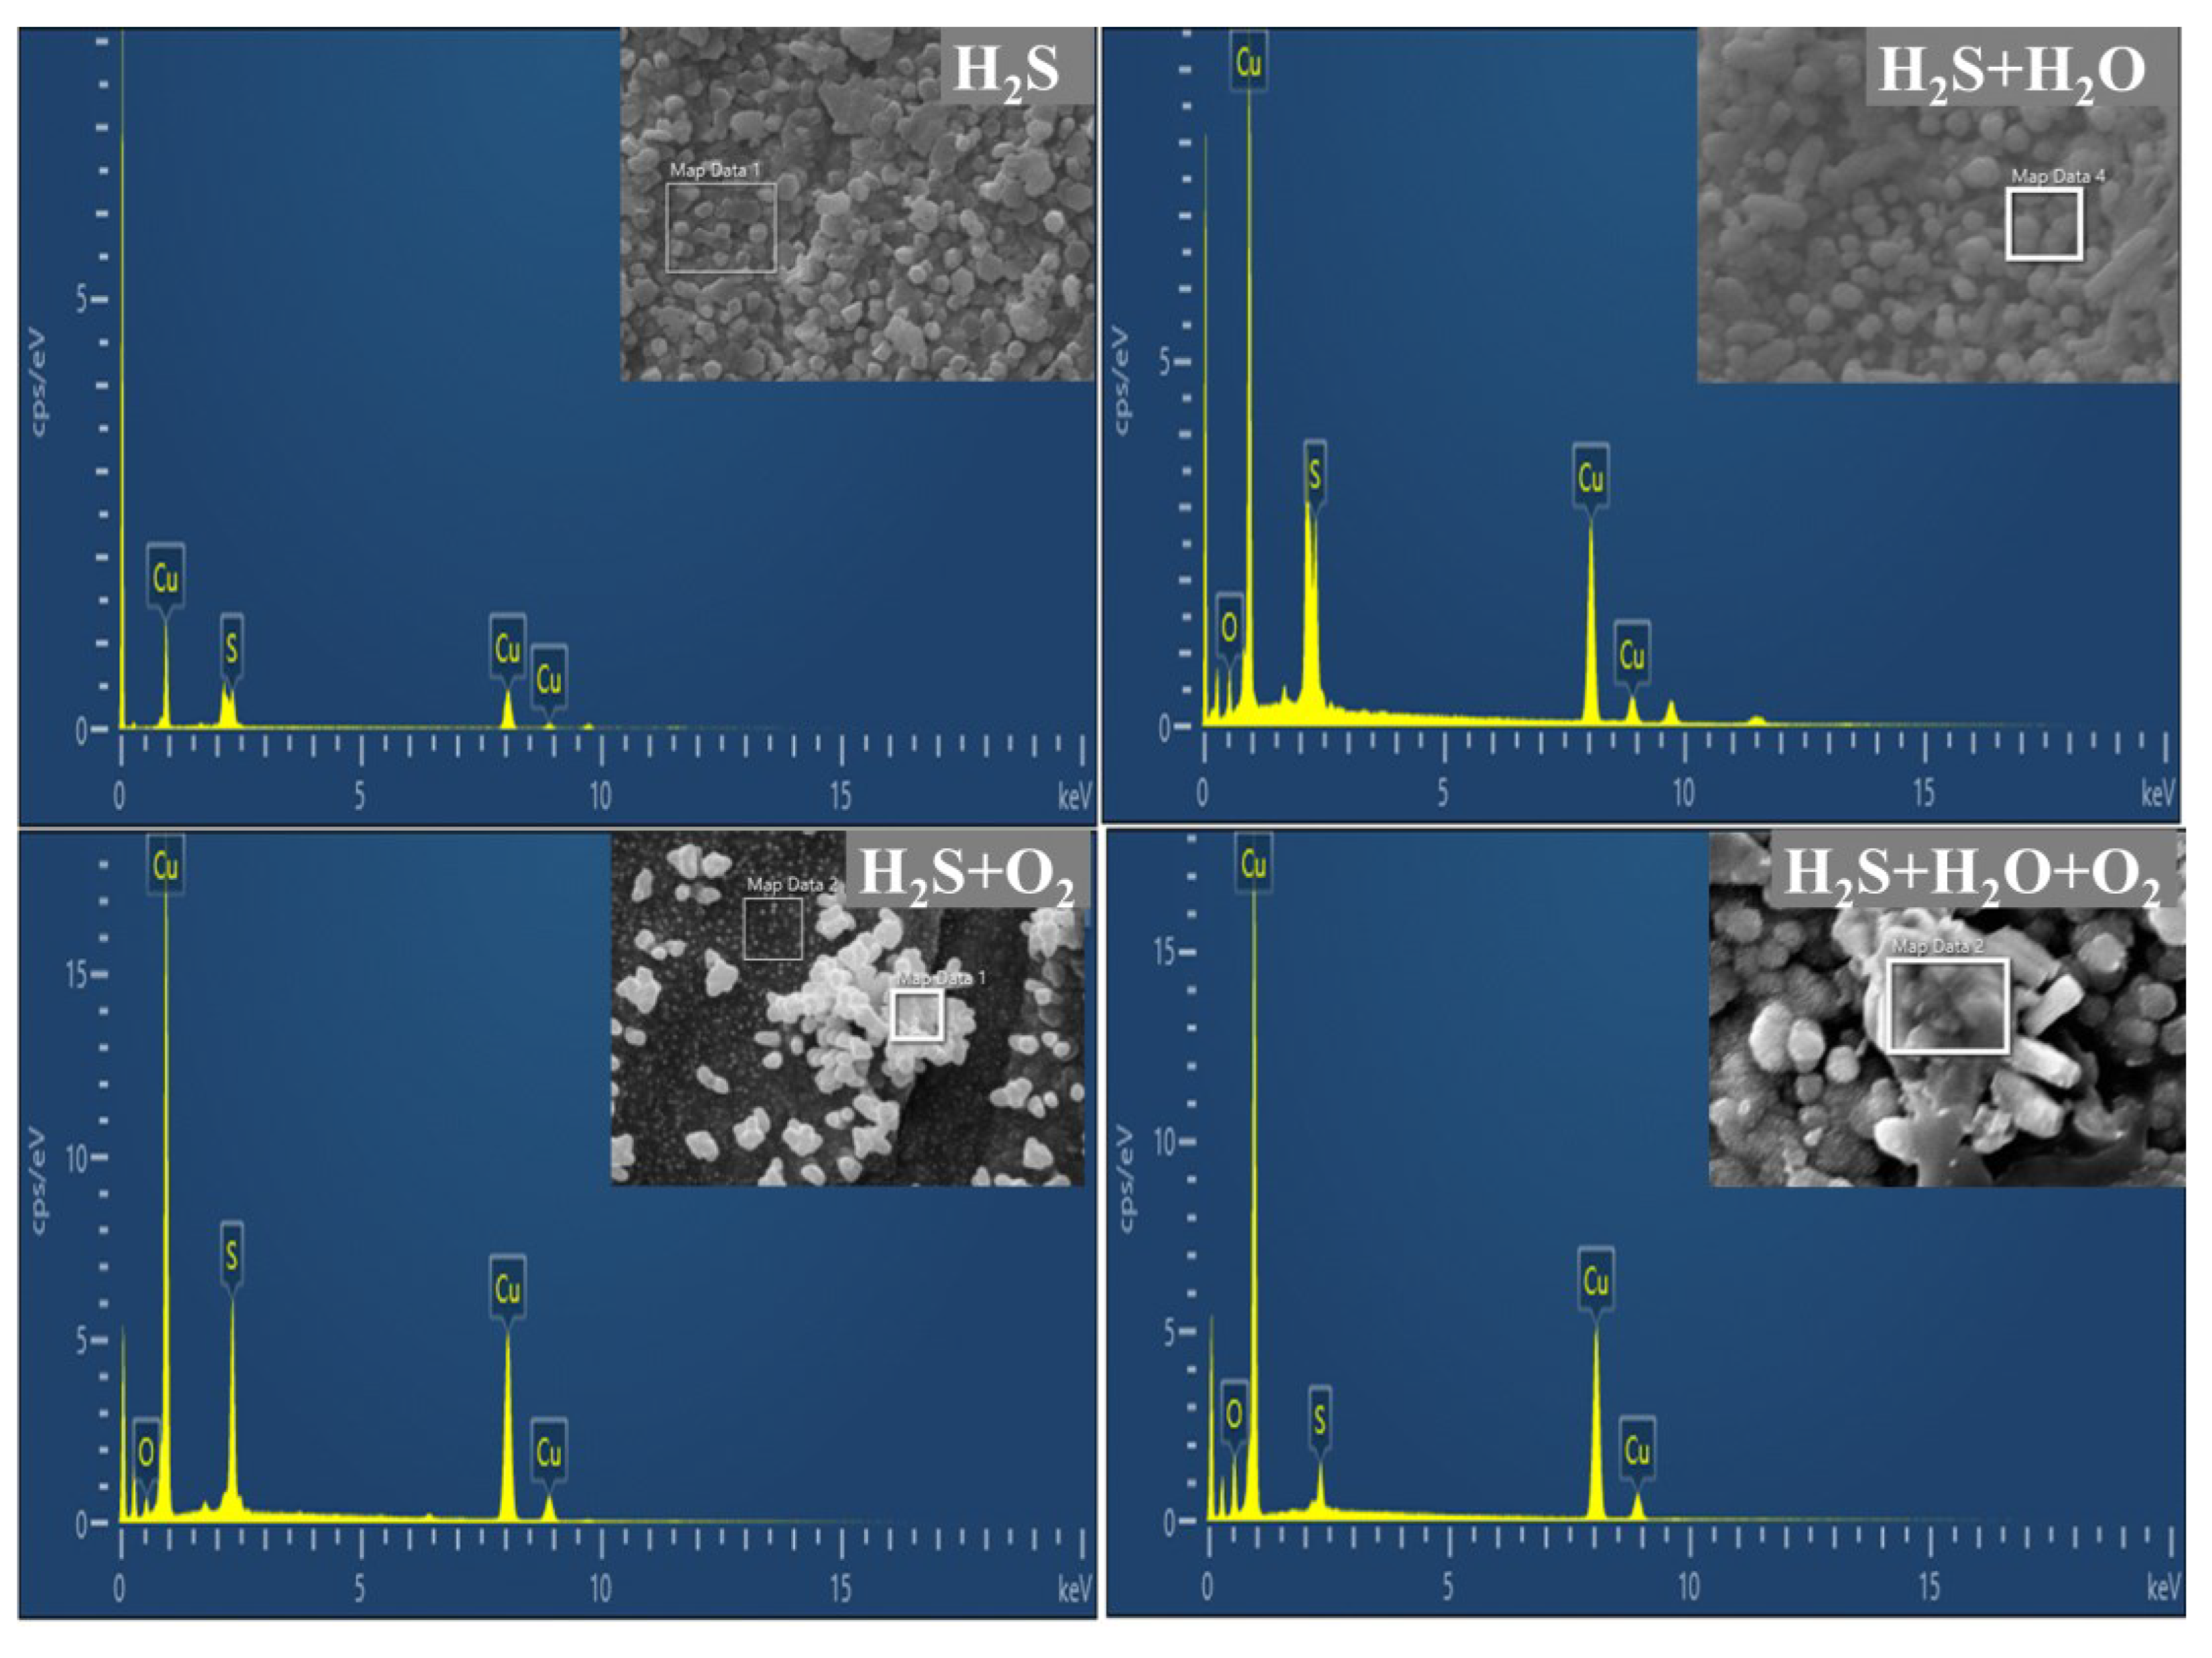
EDS was used to analyse the elemental information of corrosion products. Figure 7 and Table 3 manifest the elemental content of copper corrosion products at four medium conditions (H2S, H2S + H2O, H2S + O2 and H2S + H2O + O2). It can be seen from the results that the corrosion products of LPG in H2S mainly contain S and Cu, indicating that the corrosion products are only composed of copper sulphides. The corrosion products of LPG containing H2S + H2O mainly contain S, Cu and O, implying that they are mainly composed of copper sulphides and oxides. It is also possible that oxides were generated by exposure of the sample to air. The corrosion products in H2S+O2 mainly contain S, Cu and O. It shows that the content of S is much higher than that of O, indicating that the corrosion products are mainly composed of a large amount of copper sulphides and a small amount of copper oxides. The corrosion products in H2S + H2O + O2 mainly contain S, Cu and O elements, meaning that the corrosion products are mainly composed of copper oxides and sulphides. The content of O is much higher than that of S, implying that the existence of H2O and O2 is more favourable for the growth of copper oxide. In the presence of H2O (100% RH), it is more favourable to form a water film on the copper surface, which in turn leads to the dissolution and diffusion of oxygen. The electrochemical corrosion happens with the cathode process of oxygen depolarization reaction. Additionally, the dissolution of H2S in water film leads to the emergence of H+. The hydrogen depolarization reaction as a cathodic process also happens. The two cathodic processes occur at the same time in H2S + O2 + H2O, which induces the synergistic corrosion effects.

3.3.3. GIXRD Analysis of Corrosion Products

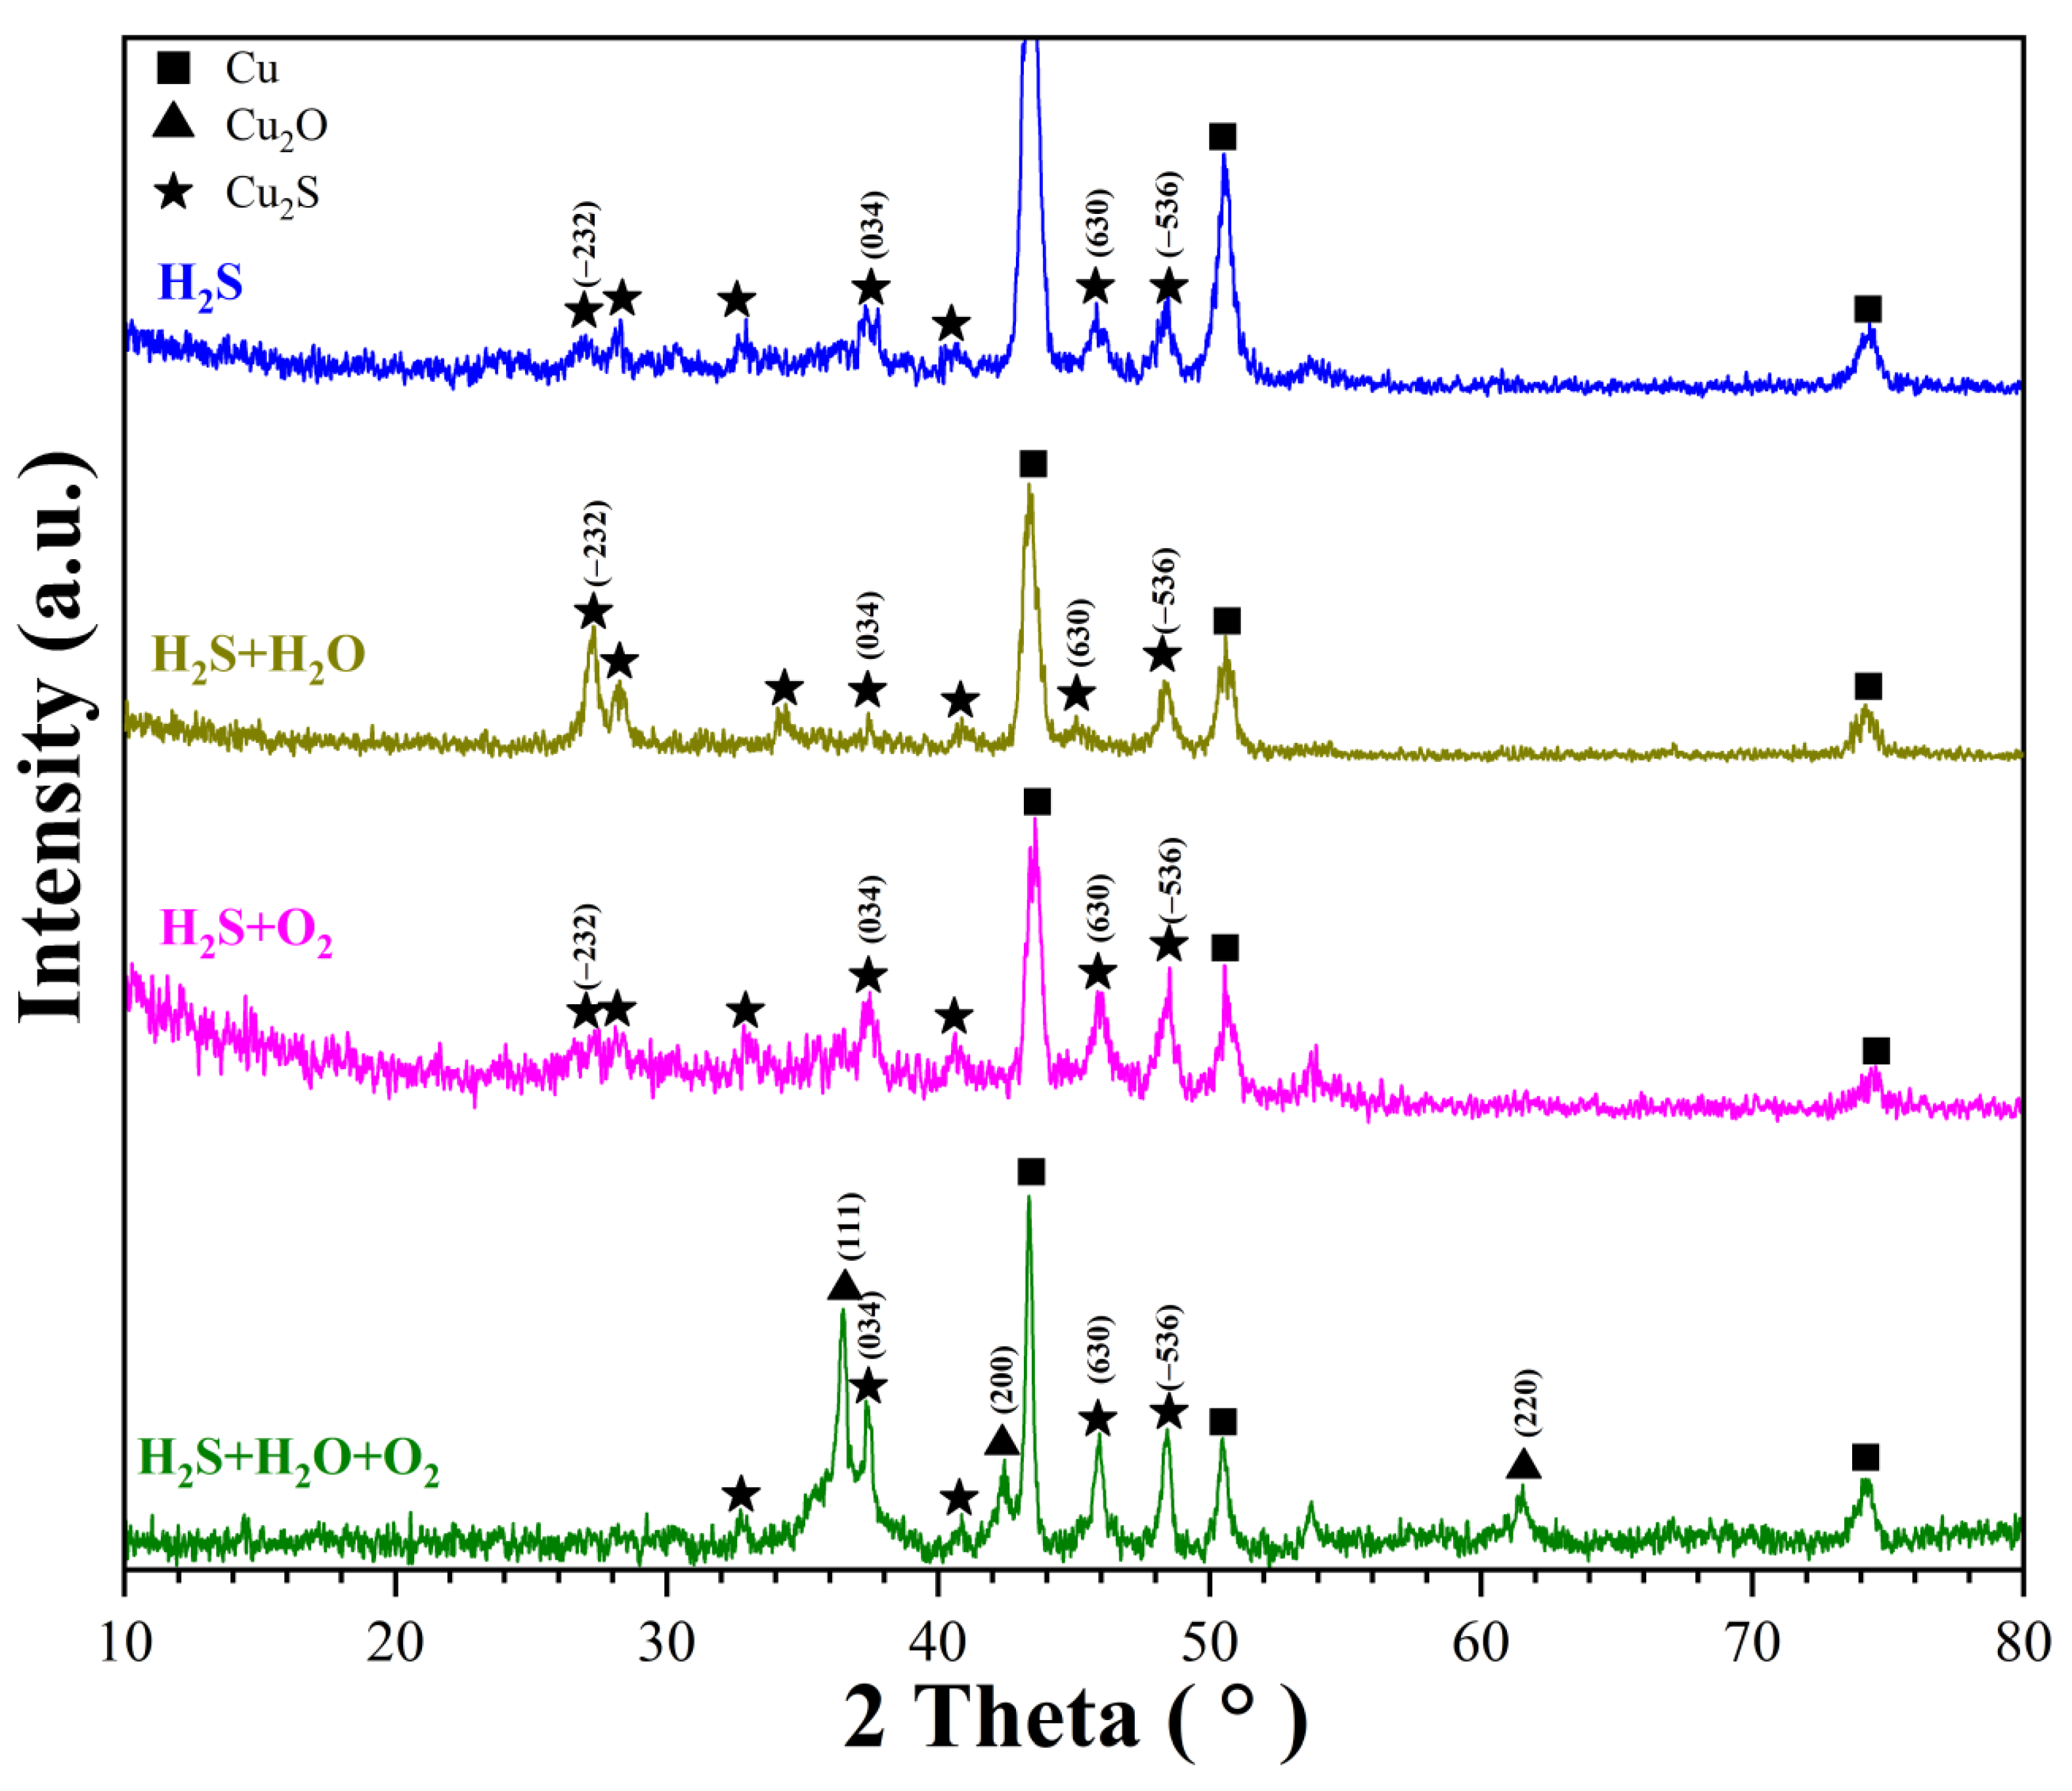
In order to further reveal the corrosion mechanism of copper sheets in different LPG environments, GIXRD was used to analyse the corroded copper sheets in the presence of H2S, H2S + H2O, H2S + O2 and H2S + H2O + O2, respectively, and the incident angle of GIXRD was 0.7°. The results in Figure 8 show that the spectrum of corroded copper in H2S-containing LPG is mainly the diffraction peaks of Cu and Cu2S, in which Cu2S preferentially grows on the (−536) crystal plane. The spectrum of corroded copper in LPG containing H2S+H2O is mainly the diffraction peaks of Cu and Cu2S, in which Cu2S preferentially grows on the (−232) crystal plane. The expected spectrum of Cu2O cannot be obtained, which has been proven by EDS. This is due to a too little amount of corrosion products. The spectrum of corrosion products in LPG containing H2S+O2 is similar to the diffraction peaks of corrosion products at H2S conditions, mainly Cu and Cu2S diffraction peaks. Similarly, Cu2S grows preferentially on the (−536) crystal plane. The spectrum of corrosion products in LPG containing H2S+O2+H2O is mainly Cu, Cu2S and Cu2O. The diffraction peak of Cu2O is obviously stronger than that of Cu2S, indicating that the conditions are more preferable to the growth of Cu2O [34,35,42]. In addition, in this circumstance Cu2S preferentially grows along the (034) crystal plane, which is different from other environmental conditions.

3.3.4. XPS Analysis of Corrosion Products

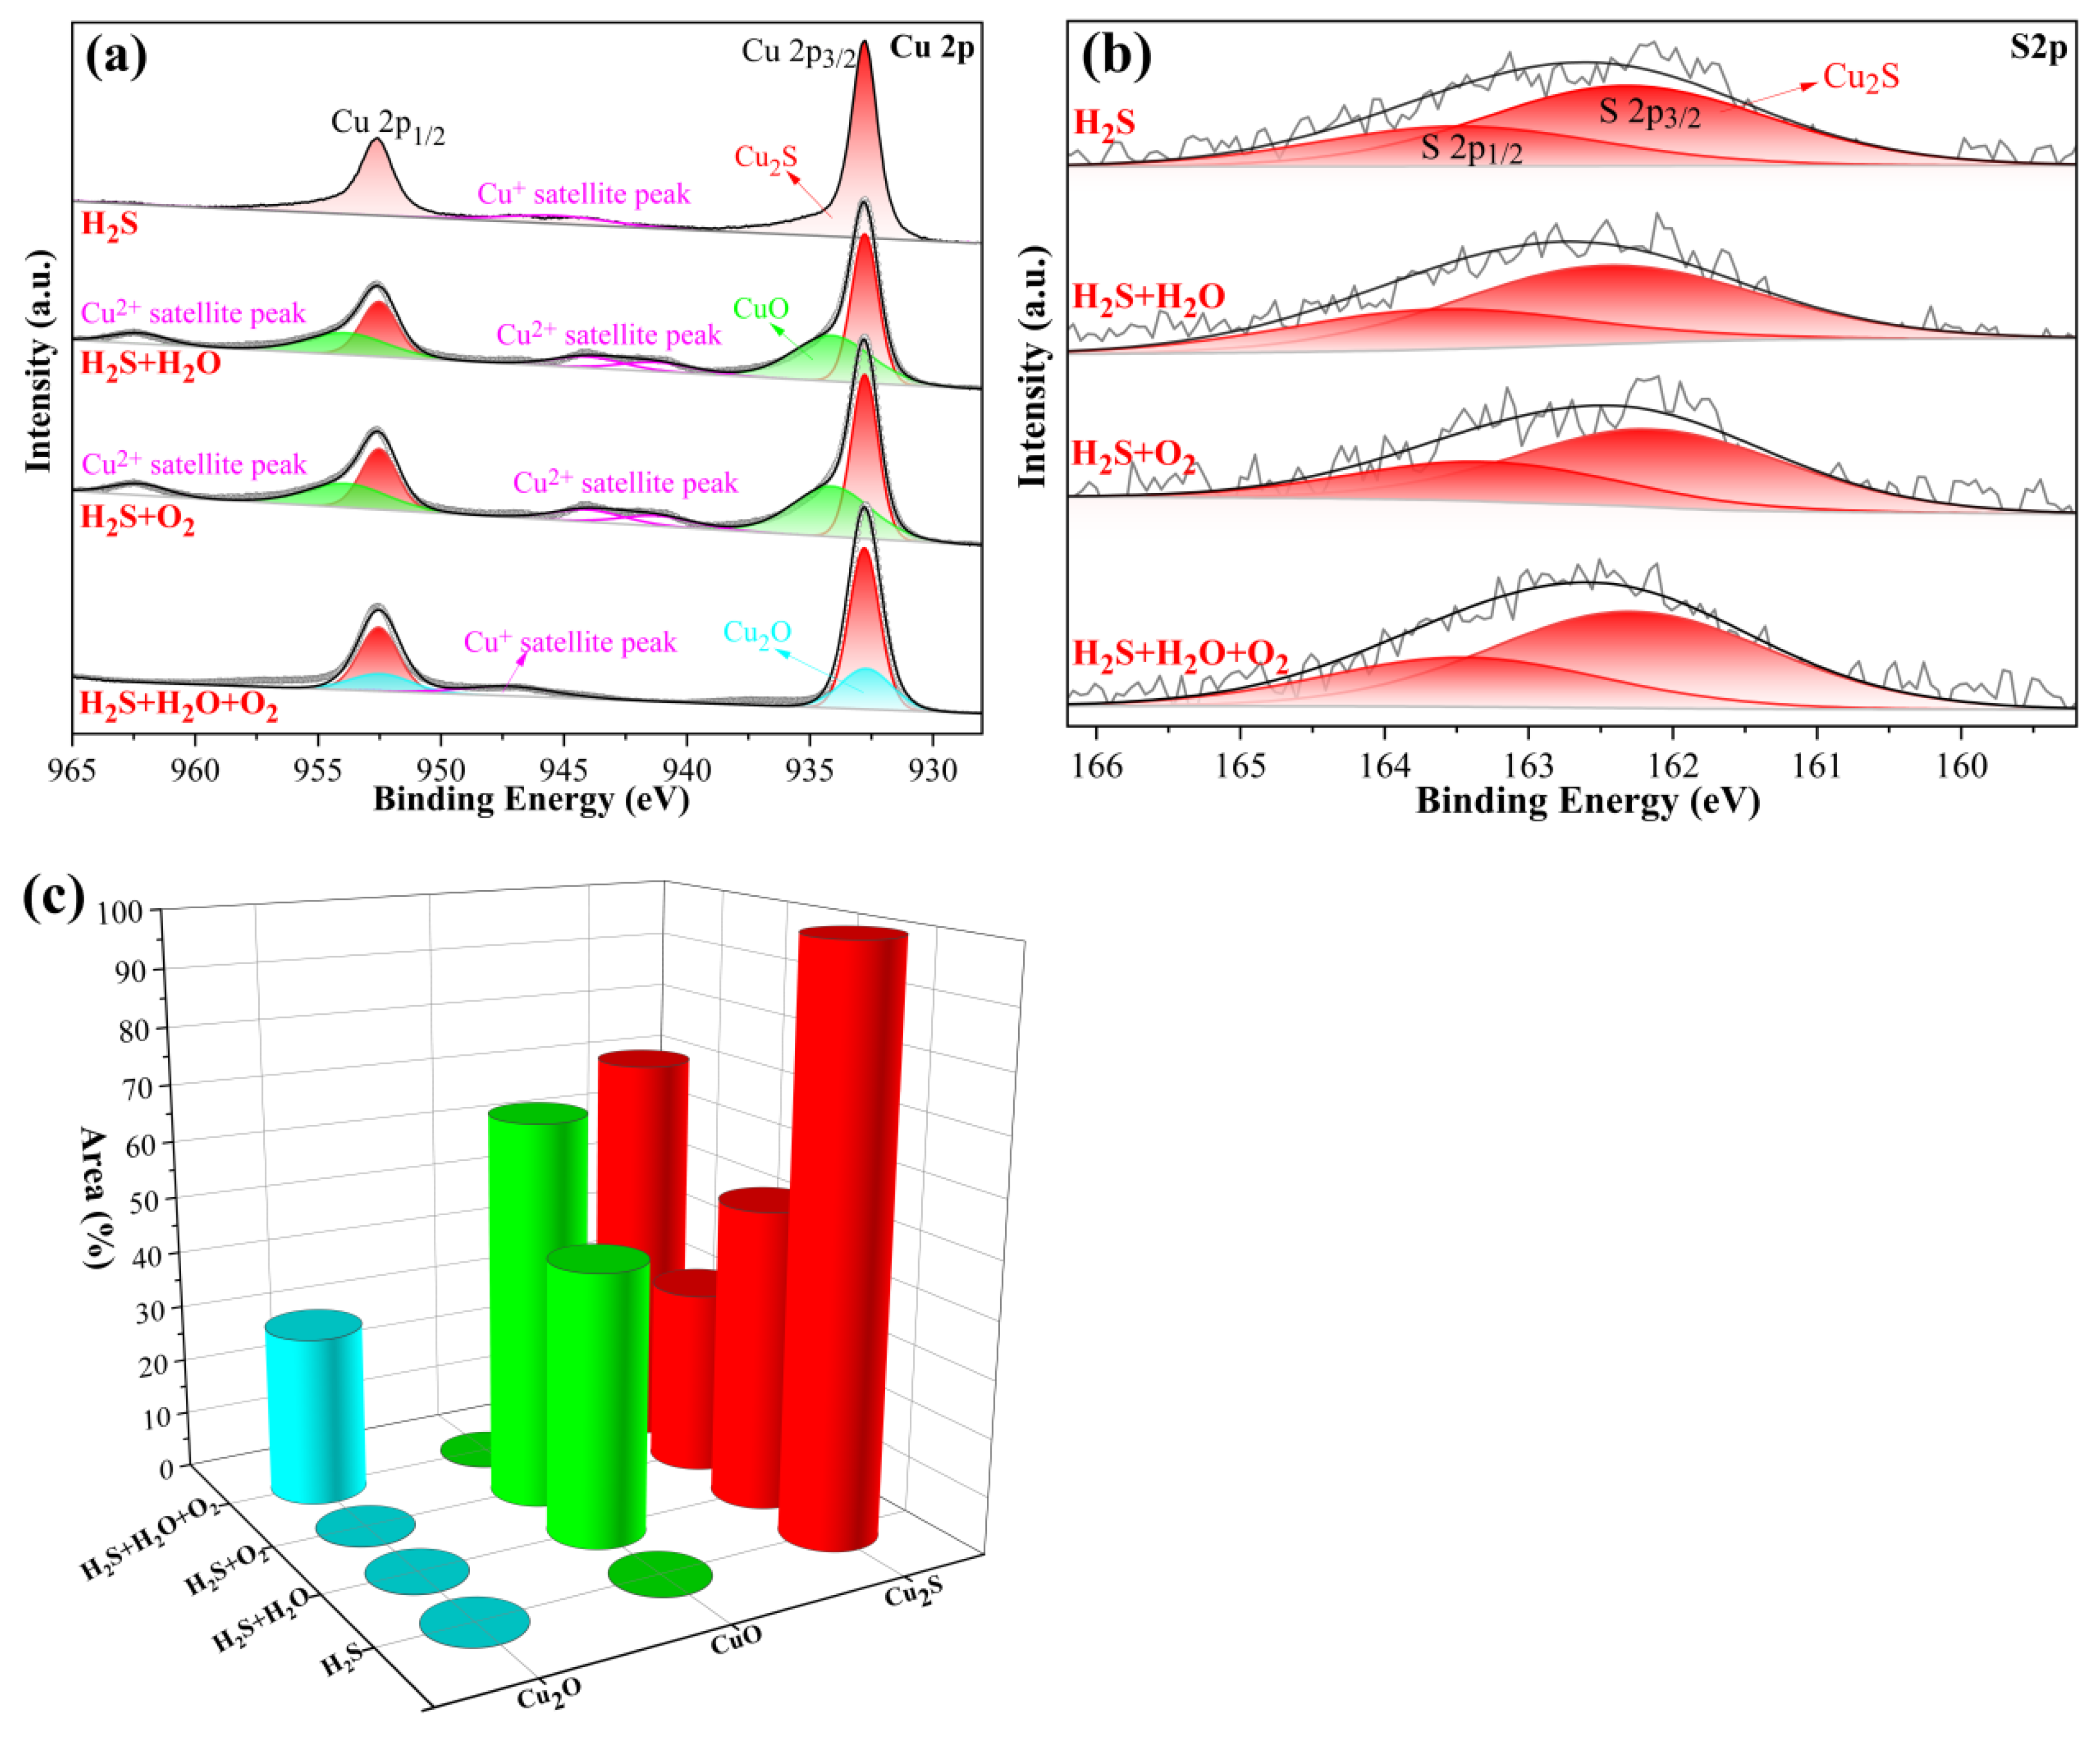
XPS was also applied to analyse the valence states of corrosion products of copper sheets in different LPG environments, including H2S, H2S + H2O, H2S + O2 and H2S + H2O + O2. The results are shown in Figure 9. Figure 9a is a comparison diagram of the Cu 2p spectrum of the corrosion products in different LPG environments. In the Cu 2p spectrum of the corrosion products in H2S, the peaks at 932.75 eV and 945 eV correspond to the characteristic peak of Cu2S and the satellite peak of Cu+ at the 2p3/2 orbital, respectively. The peaks at 932.77 eV, 934.10 eV and 943.00 eV in Cu 2p spectrum of corrosion products in H2S+H2O correspond to the characteristic peaks of Cu2S, CuO and the satellite peaks of Cu2+ at the 2p3/2 orbital, respectively. The peaks at 932.70 eV, 934.27 eV and 943.00 eV in the Cu 2p spectrum of corrosion products in H2S+O2 correspond to the characteristic peaks of Cu2S, CuO and the satellite of Cu2+ at the 2p3/2 orbit, respectively. The peaks at 932.80 eV, 932.51 eV and 945.00 eV in the Cu 2p spectrum of the corrosion products with H2S + H2O + O2 correspond to the characteristic peaks of Cu2S, Cu2O and the satellite of Cu+ at the 2p3/2 orbital, respectively, which are consistent with the XRD results. Figure 9b is the analysis result of the high-resolution S 2p spectrum. As seen in Figure 9b, in different LPG environments, the XPS signal of S is weak and exists in the form of Cu2S.
Figure 9c shows the comparative analysis results of the content of Cu2S, Cu2O and CuO in the Cu 2p spectrum in different LPG environments. The detailed information of each phase is shown in Table 4. It can be seen from Figure 9c that Cu2S exists in all four conditions, and the proportion is the highest in pure H2S. With the addition of H2O and O2, the content of Cu2S decreases and the content of CuO increases gradually. In the presence of H2O + O2, Cu2S content begins to rise again, and Cu2O appears in large quantities, which agrees with the previous EDS and XRD results.

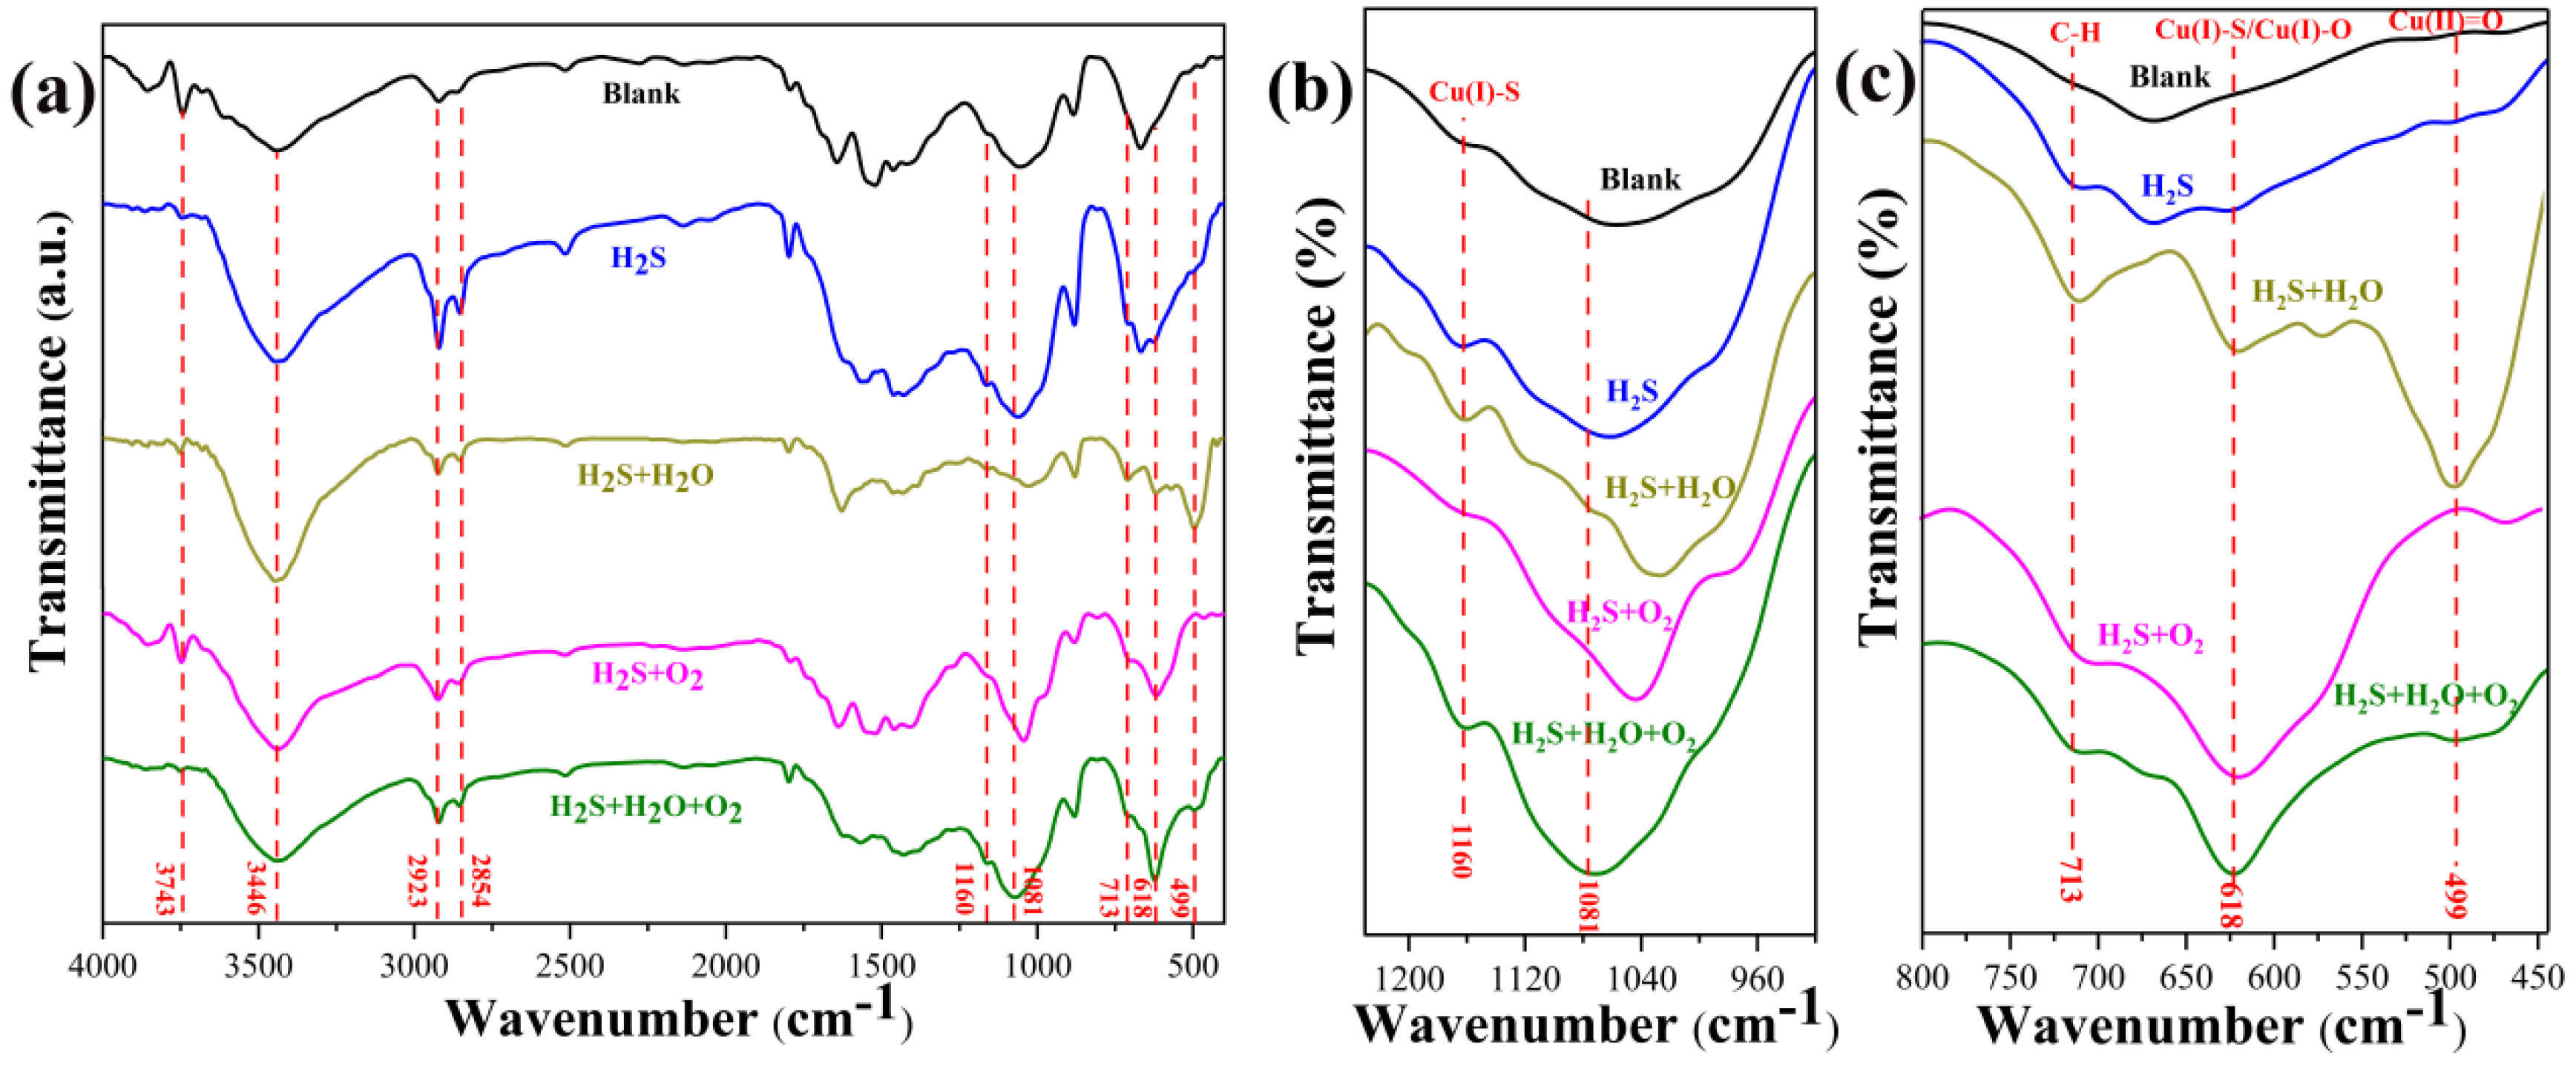
3.3.5. FTIR Analysis of Corrosion Products

FTIR was used to analyse the corrosion products in different LPG environments. The results are shown in Figure 10. It compares the FTIR spectra of copper powder and copper powder with four different corrosion products. The full FTIR spectra of all corrosion products are similar to the blank. The absorption peak at 3743 cm−1 represents the stretching vibration absorption peak of free-state O-H in the impurities on the copper powder surface. Compared with the blank, the weakening of the peak intensity is caused by the accumulation of a thick layer of corrosion products on the copper powder surface. Compared with blank, the absorption peak of 3446 cm−1 is a composite peak, which is composed of a stretching vibration absorption peak of the associative O-H and Cu(I)-S on the copper powder surface. The phenomenon of increased peak intensity is due to the presence of a large amount of Cu2S (3470 cm−1) after corrosion. The absorption peaks of 2923 cm−1 and 2854 cm−1 represent the stretching vibration absorption peaks of the C-H bond in the methylene group. The phenomenon of peak intensity enhancement is caused by the residual LPG in the corrosion products. In the FTIR spectrum of the bank, there are many unknown absorption peaks around 1500 cm−1, which should be caused by impurities of the copper powder surface. Figure 10b is an FTIR comparison of 920–1230 cm−1. Compared with the blank, the absorption peak at 1160 cm−1 is significantly enhanced, which can be attributed to the stretching vibration of Cu(I)-S (1145 cm−1). The reason why the peak intensity at this position is similar to the blank can be ascribed to little corrosion products on the copper powder surface in H2S + O2. Compared with the blank, the peak position of 1081 cm−1 appears blue-shifted, which is caused by the vibration of a large amount of Cu(I)-S (1115 cm−1). This phenomenon is more pronounced in conditions with more corrosion products. Figure 10c shows the FTIR comparison between 400 cm−1 and 800 cm−1 for the four corrosion products and the blank. Compared with the blank, the apparent enhancement of the absorption peak at 713 cm−1 is due to the in-plane rocking vibration of C-H in the methylene group of the residual LPG adsorbed in the corrosion product. As for the weak absorption peak at 619 cm−1 in H2S and H2S + H2O, it can be regarded as the stretching vibration peak of Cu(I)-S (618 cm−1). In H2S + O2 and H2S + H2O + O2, a strong absorption characteristic peak at 619 cm−1 can be regarded as the composite absorption peak of Cu2S and Cu2O (the absorption peak positions of Cu(I)-S (618 cm−1) and Cu(I)-O (614 cm−1) are very similar). The strong absorption peak at 499 cm−1 is due to the stretching vibration of Cu=O [42,43,44,45].
The results of the analysis on the differences in the absorption peaks in the FTIR reveal that Cu2S will be formed on the copper surface in the four conditions. The presence of H2O promotes the production of CuO.

3.4. Corrosion Mechanism of Copper in Different LPG Environments

Based on the results of copper corrosion tests and corrosion product analysis, the copper corrosion mechanisms of copper at different LPG environments can be proposed as follows.

3.4.1. Corrosion Mechanism in H2S

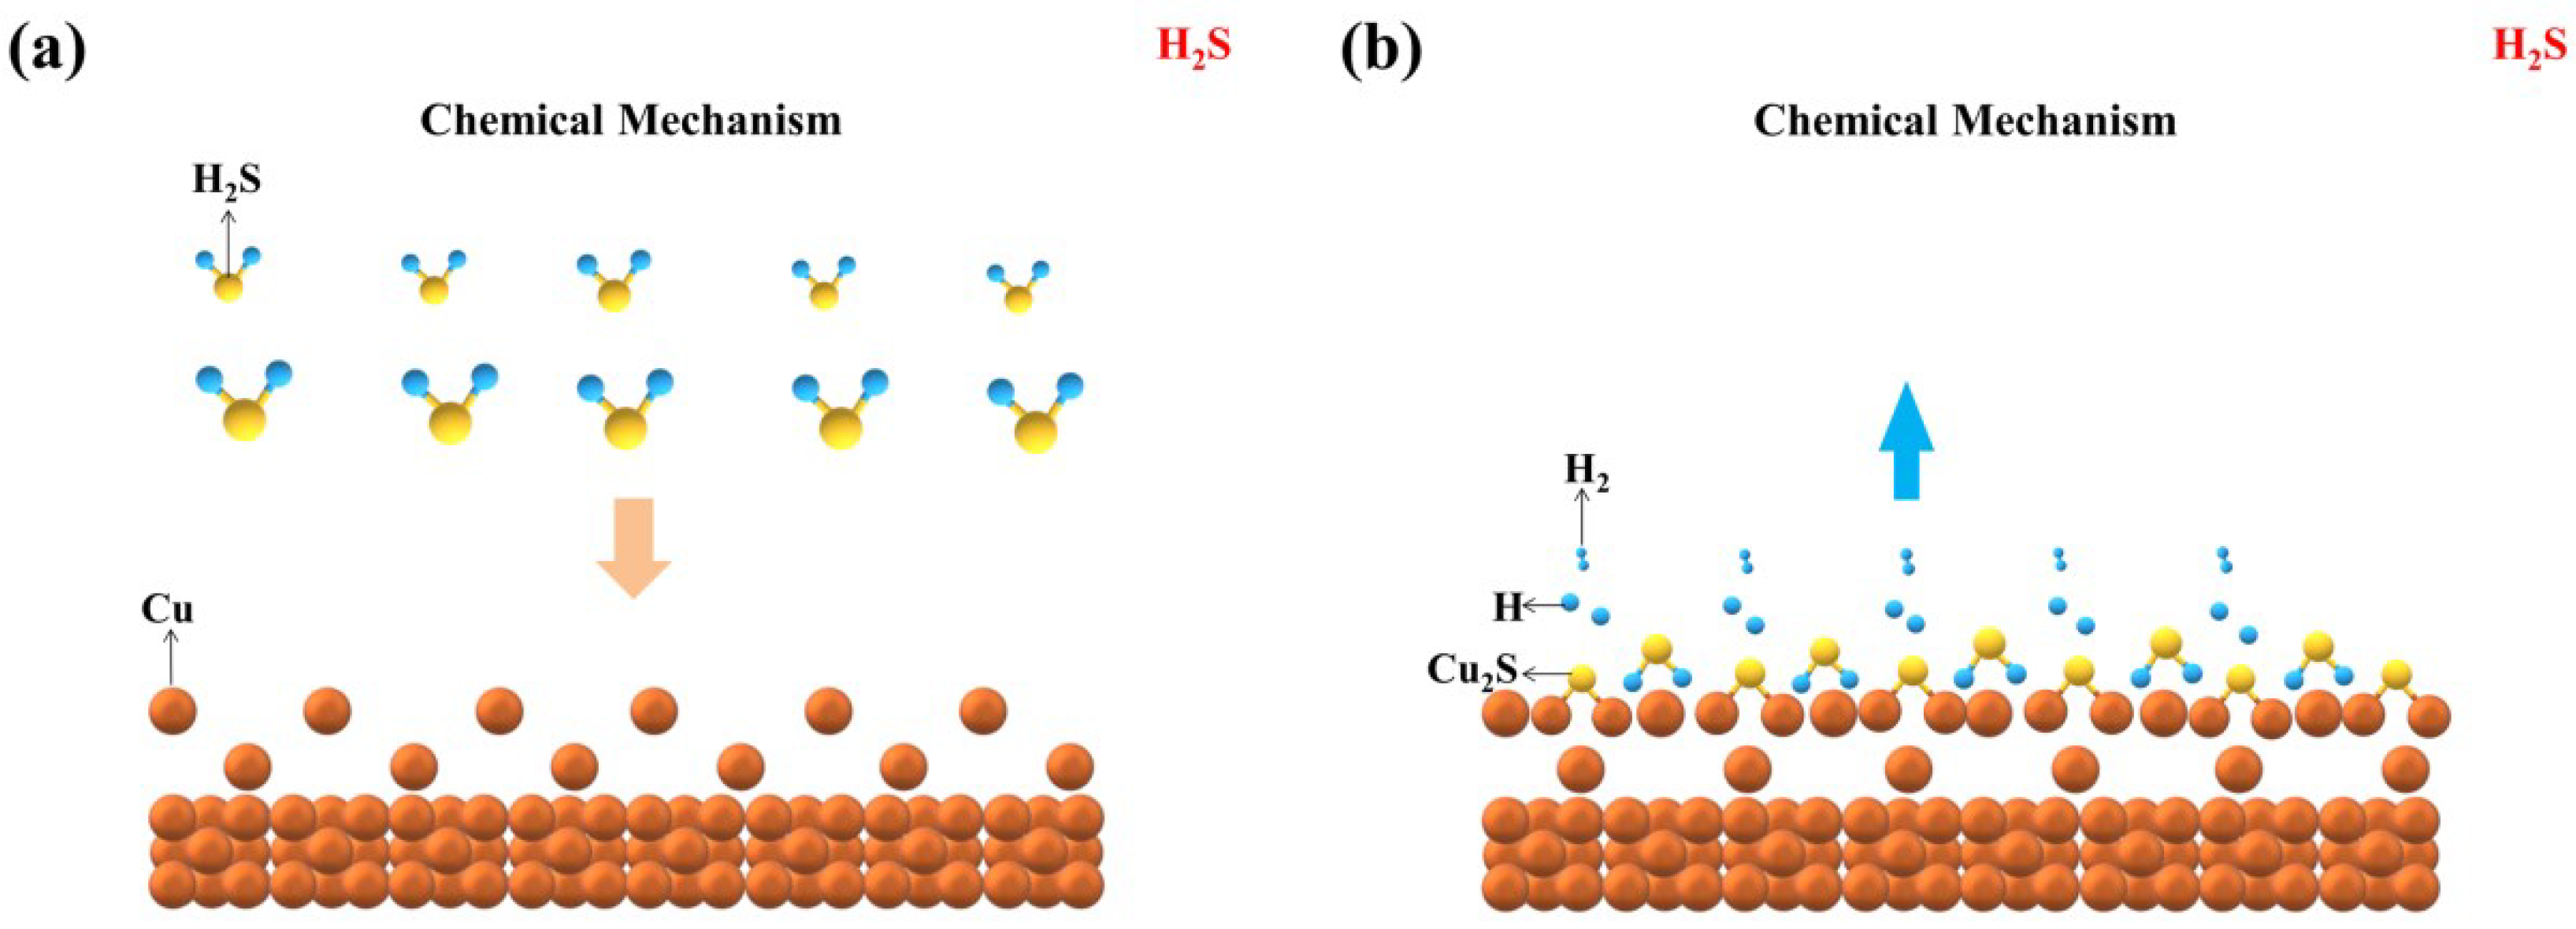
The corrosion mechanism of copper in LPG only containing H2S is a chemical corrosion process. The corrosion process is carried out according to the reaction Equations (10) and (11). Figure 11 is a schematic diagram of the corrosion steps in H2S-containing LPG. In the first step, H2S gas in the LPG is adsorbed on the copper surface. Then, H2S reacts with Cu atoms at the surface to generate H2 and Cu2S. The whole corrosion process is a chemical process. Electrochemical corrosion cannot occur due to the absence of the electrolyte.
H 2 S ( g )     H 2 S ( ads )
H 2 S ( ads ) + 2 Cu     Cu 2 S   +   H 2  

3.4.2. Corrosion Mechanism in H2S+H2O

The corrosion mechanism of copper in LPG containing H2S + H2O is an electrochemical corrosion process. The corrosion process is carried out according to the reaction Equations (12)–(16). Figure 12 shows the schematic corrosion steps in LPG with H2S + H2O. The process of electrochemical corrosion can be explained by Figure 12a–c. Firstly, H2O exists in the form of a water film on the copper surface. H2S in LPG dissolves into the water film and further hydrolyses to form a great amount of HS, H3O (hydronium ions) and a small amount of S2−. Furthermore, the process of the anodic reaction is losing electrons of a Cu atom to form Cu2S with S2−, as expressed in Equation (15). The cathodic reaction can be undertaken as Equation (16), which is the traditional hydrogen depolarization reaction. At this time, the massive consumption of S2− further promotes the dissolution and hydrolysis of H2S in LPG, which continuously accelerates the corrosion of copper and results in a great amount of Cu2S precipitation. However, when the water film is insufficient (low humidity), it is difficult to form an effective electrochemical corrosion environment. In this circumstance, the chemical process may be the main reason for corrosion. This is consistent with the results of XRD, XPS and FTIR. A small amount of CuO in XPS and FTIR is likely due to the contamination of oxidization in air.
H 2 S ( g )   H 2 S ( l )
H 2 S ( l )   + H 2 O     HS +   H 3 O +
HS + H 2 O     S 2 +   H 3 O +
2 Cu + S 2     Cu 2 S + 2 e
  2 H 3 O + + 2 e   2 H 2 O + H 2

3.4.3. Corrosion Mechanism in H2S + O2

The corrosion mechanism of copper in LPG with H2S + O2 is a chemical corrosion process. The corrosion process is carried out according to Equations (10), (11) and (17)–(19). Figure 13 displays a schematic diagram of the corrosion process in LPG containing H2S + O2. In the first step, H2S and O2 molecules in LPG adsorb on the copper surface. Then, the chemical reaction of copper with H2S and O2 molecules generate Cu2S, H2 and Cu2O, respectively. Part of Cu2O is further oxidized to CuO by O2. The corrosion mechanism shows that the presence of only O2 will not significantly promote the corrosion grade of the copper sheet, which is consistent with the experimental results. In this condition, the peak of CuO does not appear in the XRD results. However, a small amount of CuO was detected in XPS, indicating that the content of CuO is quite low in corrosion products. With the FTIR spectrum, the amount of Cu2O is significantly more than CuO, which implies Cu2O is more stable than CuO.
O 2 ( g )     O 2 ( ads )
O 2 ( ads ) + 4 Cu     2 Cu 2 O
O 2 ( ads ) + 2 Cu 2 O   4 CuO  

3.4.4. Corrosion Mechanism in H2S + H2O + O2

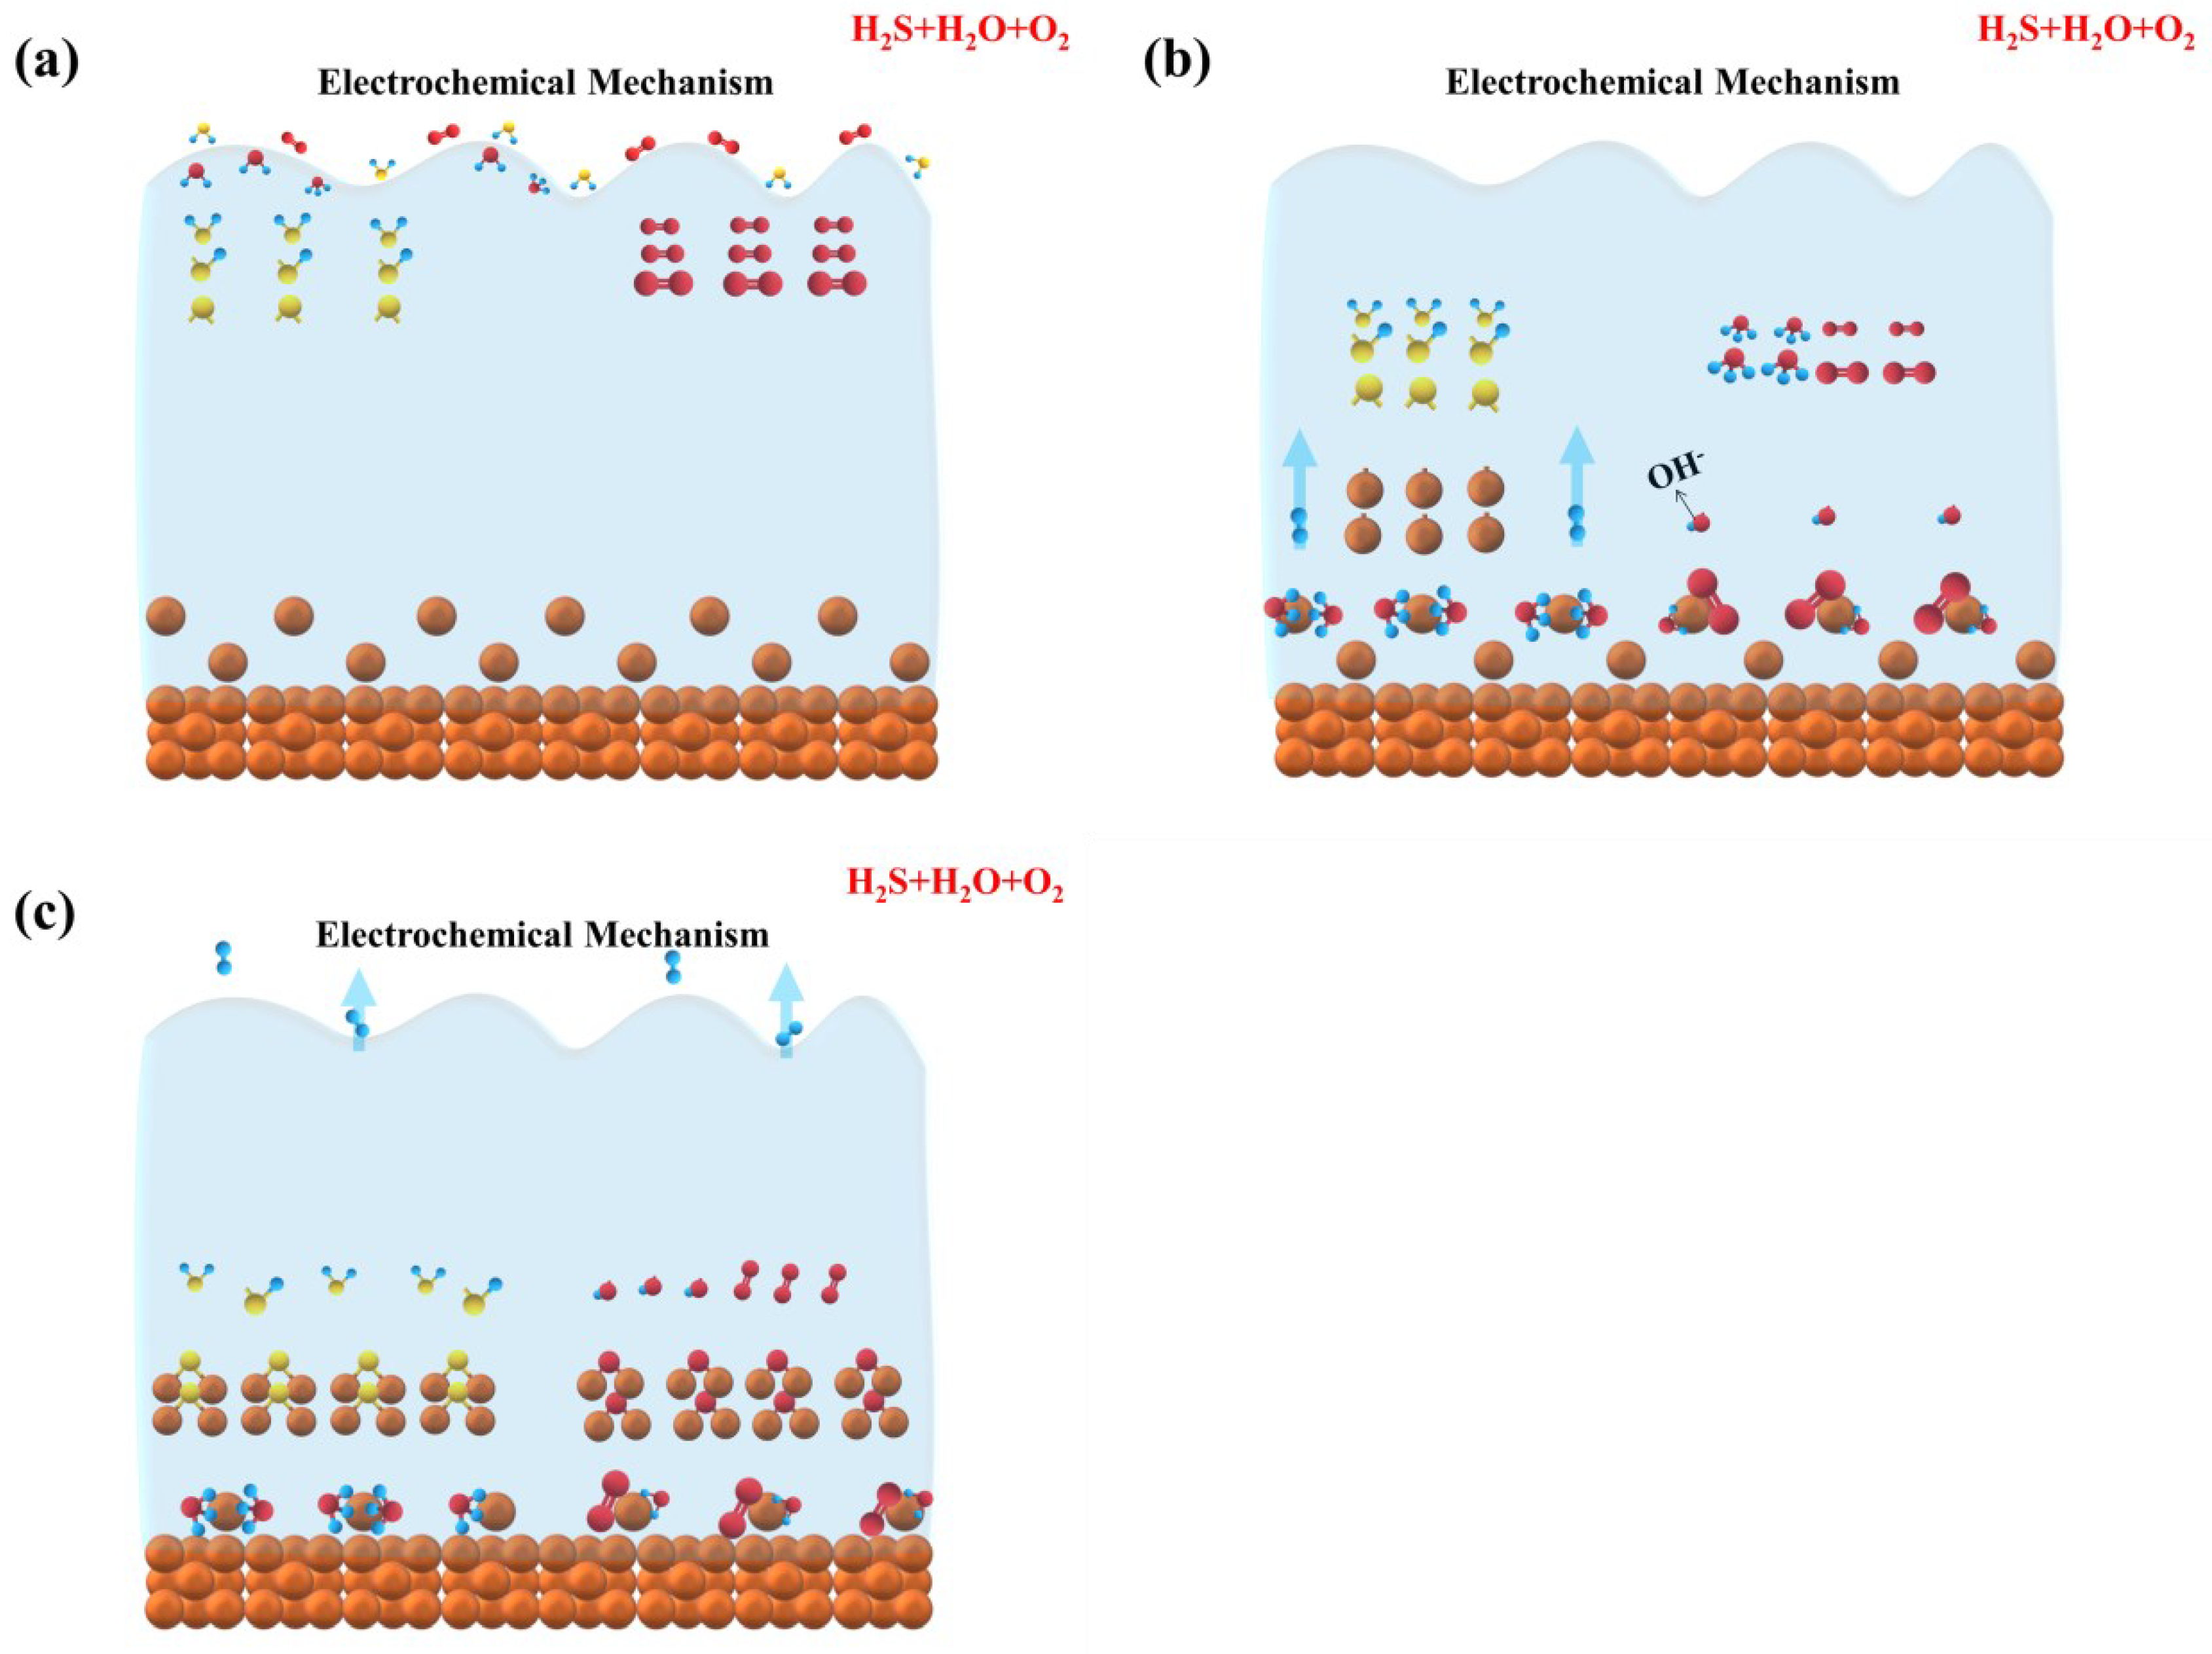
The corrosion mechanism of copper in LPG containing H2S + H2O + O2 is an electrochemical corrosion process. The corrosion process is carried out according to the Equations (12)–(16) and (20)–(22). The electrochemical corrosion process can be illustrated by the schematic diagram in Figure 14. Firstly, H2O in LPG exists in the form of a water film on the copper surface. Two electrochemical reactions happen at the interface. The dissolution of H2S in the water film leads to the electrochemical reaction in Equations (12)–(16). Meanwhile, the dissolution and diffusion of O2 also cause another electrochemical corrosion reaction, as in Equations (20)–(22), which is the oxygen depolarization process. After H2S and O2 molecules in LPG dissolve into the water film to form H2S(l) and O2(l), H2S(l) is further hydrolysed into a large amount of HS, H3O+ and a small amount of S2-. Cu loses electrons to form Cu2S and Cu2O with S2- and OH, according to the anodic reaction of Equations (15) and (22) [46]. H3O+ and O2(l) obtain electrons from copper to form H2, H2O and OH, which are regarded as cathode reactions (Equations (16) and (21)) [34,35,47]. Because the H3O+ in the water is consumed in large quantities, it is conducive to the ionization of water to move to the right to generate a large amount of OH, which increases the pH of the water film. A large amount of OH is not only conducive to the dissolution of H2S in LPG in the water film, improving the solubility of H2S, but is also conducive to the continuous hydrolysis of H2S(l) and HS in the water film to form a large amount of HS and S2−, which promotes the formation of lots of Cu2S precipitates. Thereby, the solubility of H2S in the water film is further increased to promote the corrosion of copper by H2S. Figure 14a–c are schematic diagrams of corrosion steps in LPG containing H2S + H2O + O2. Combined with the previous theoretical analysis and Figure 14, it is shown that when both O2 and H2O exist in LPG, the corrosion grade of copper will be significantly increased. A large amount of Cu2S and Cu2O will be generated, which is consistent with the previous experimental results of the synergistic effect of humidity and O2. Moreover, Cu2O is thermodynamically more stable than Cu2S (the standard free energies of formation at room temperature for Cu2O and Cu2S are −34.98 and −20.6 kcal/mole, respectively [27]), indicating that Cu2O is preferentially formed at the same conditions. Therefore, the amounts of corrosion products in Cu2O are more than Cu2S. This conclusion is consistent with the results of XRD and EDS. In addition, a large amount of Cu2O in XPS and FTIR also proves it.
O 2 ( g )     O 2 ( l )
O 2   ( l ) + 2 H 2 O + 4 e     4   OH
2 Cu + 2 OH   Cu 2 O + H 2 O + 2 e

4. Conclusions

In this paper, the influence of humidity and O2 on copper corrosion in H2S-containing LPG was studied. The corrosion products were characterized and analysed to reveal the corrosion mechanism. The following conclusions were obtained:
  • In H2S-containing LPG, RH has pronounced influence on the corrosion grade of copper. The variation in the CP with RH in LPG is a linear relationship.
  • The presence of O2 in dry H2S has limited influence on the corrosion of copper. The CP decreases linearly with the increase in O2 concentration. In the presence of different RHs, the CP always follows a negative exponential function with O2 concentration.
  • Surface morphologies of corrosion products obtained in different environments are quite different. Gas humidity and the presence of O2 notably affect the microscopic morphology of corrosion products. In individual H2S, the morphology of copper corrosion products is a regular hexagon block with sharp edges and corners. In H2S + H2O (100% RH), the morphology of copper corrosion products is uniform spherical shape. In H2S + O2, the morphology of copper corrosion products is irregular in shape and size. In H2S + H2O + O2, the morphology of the corrosion products is a regular hexagon block with sharp edges and corners, spherical and irregular in shape and size.
  • In H2S-containing LPG, RH and O2 have obvious influence on the composition and distribution of corrosion products. In individual H2S, the corrosion product of copper is only Cu2S. In H2S + H2O, corrosion products of copper are mainly Cu2S. In H2S + O2, corrosion products of copper are composed of a large amount of Cu2S and a small amount of CuO and Cu2O. In H2S + H2O + O2, corrosion products are composed of a large amount of Cu2O, Cu2S and a small amount of CuO.
  • The corrosion mechanism of copper in LPG in the presence of different corrosive gases was proposed. The corrosive gas influences the corrosion mechanism remarkably. In individual H2S and H2S + O2, the corrosion process is chemical in nature. H2S and O2 react with copper directly at the interface. The corrosion mechanism of copper in LPG containing H2S + H2O and H2S + H2O + O2 is an electrochemical corrosion process. In H2S + H2O, the corrosion proceeds with an anodic reaction of copper oxidization and a cathodic reaction of traditional hydrogen depolarization. In H2S + H2O + O2, two different electrochemical reactions happen: one is the same as in H2S + H2O, and the other electrochemical reaction displays as the corrosion of O2 in neutral medium, in which the cathodic process is oxygen depolarization.

Author Contributions

Conceptualization, H.W. and J.X.; methodology, H.W.; validation, H.W., X.L. and J.X.; formal analysis, Q.W.; investigation, Y.L.; writing—original draft preparation, X.L.; writing—review and editing, X.L.; supervision, H.W. All authors have read and agreed to the published version of the manuscript.

Funding

This research received no external funding.

Institutional Review Board Statement

Not applicable.

Informed Consent Statement

Not applicable.

Data Availability Statement

Not applicable.

Conflicts of Interest

The authors declare no conflict of interest.

References

  1. Wang, B.W.; Jiang, Z.M.; Hu, X.C.; Guo, B.L. Discussion on corrosion control of LPG copper sheet in a terminal plant of Bohai oil field. Chem. Manag. 2015, 21, 3. [Google Scholar]
  2. Yi, F.; Lu, Y.; Zhao, J.M. Influence and mechanism of sulfide in liquefied petroleum gas on copper corrosion. J. Beijing Univ. Chem. Technol. (Nat. Sci. Ed.) 2021, 48, 59–65. [Google Scholar]
  3. Zhong, X.Y. Research on Sulfur Corrosion and Removal of Light Oil Products; China University of Petroleum: Beijing, China, 2011. [Google Scholar]
  4. Halldin Stenlid, J.; Campos dos Santos, E.; Johansson, A.J.; Pettersson, L.G.M. Properties of interfaces between copper and copper sulphide/oxide films. Corros. Sci. 2021, 183, 109313. [Google Scholar] [CrossRef]
  5. Long, Y.; Song, W.; Fu, A.; Xie, J.; Feng, Y.; Bai, Z.; Yin, C.; Ma, Q.; Ji, N.; Kuang, X. Combined effect of hydrogen embrittlement and corrosion on the cracking behaviour of C110 low alloy steel in O2-contaminated H2S environment. Corros. Sci. 2022, 194, 109926. [Google Scholar] [CrossRef]
  6. Johnsen, R.; Lange, T.; Stenerud, G.; Olsen, J.S. Environmentally assisted degradation of spinodal copper alloy C72900. Corros. Sci. 2018, 142, 45–55. [Google Scholar] [CrossRef]
  7. Dou, W.; Jia, R.; Jin, P.; Liu, J.; Chen, S.; Gu, T. Investigation of the mechanism and characteristics of copper corrosion by sulphate reducing bacteria. Corros. Sci. 2018, 144, 237–248. [Google Scholar] [CrossRef]
  8. Echeverria, F.; Botero, C.A.; Correa, E.; Meza, D.; Castano, J.G.; Gomez, M.A. High resolution morphological changes of Cu, Ni, Al, and Au surfaces due to atmospheric corrosion. IEEE Trans. Device Mater. Reliab. 2017, 17, 331–339. [Google Scholar] [CrossRef]
  9. Majtás, D.; Kreislová, K.; Turek, L. Failure of electric products by H2S. Koroze Ochr. Mater. 2018, 62, 71–77. [Google Scholar] [CrossRef] [Green Version]
  10. Zhu, Z.; Zuo, X.; Ying, Z. Corrosion analysis of copper T2 exposed to polluted atmospheres and study on prediction model. Corros. Rev. 2017, 35, 35–46. [Google Scholar] [CrossRef]
  11. Odnevall, I. Atmospheric corrosion of copper in a rural atmosphere. J. Electrochem. Soc. 1995, 142, 3682–3689. [Google Scholar] [CrossRef]
  12. Monzó, J.; García-Antón, J.; Guiñón, J.L. Influence of elemental sulphur and mercaptans on corrosion of copper strips in the ASTM D-130 test by means of electronic microscopy (SEM) and energy dispersive X-ray (EDX). Fresenius J. Anal. Chem. 1991, 341, 606–610. [Google Scholar] [CrossRef]
  13. Monzó, J.; García-Antón, J.; Guiñón, J.L. Study of corrosion on copper strips by mixtures of mercaptans, sulphides and disulphides with elemental sulphur in the ASTM D-130 test by means of electron microscopy (SEM) and energy dispersive X-ray (EDX). Fresenius J. Anal. Chem. 1992, 343, 593–596. [Google Scholar] [CrossRef]
  14. Toyoda, E.; Watanabe, M.; Higashi, Y.; Tanaka, T.; Miyata, Y.; Ichino, T. Depth profiling analysis of tarnish films on copper formed during short-term outdoor exposure by glow discharge optical emission spectroscopy. Corrosion 2004, 60, 729–735. [Google Scholar] [CrossRef]
  15. Graedel, T.E.; Franey, J.P.; Gualtieri, G.J.; Kammlott, G.W.; Malm, D.L. On the mechanism of silver and copper sulfidation by atmospheric H2S and OCS. Corros. Sci. 1985, 25, 1163–1180. [Google Scholar] [CrossRef]
  16. Kong, D.; Dong, C.; Xu, A.; Man, C.; He, C.; Li, X. Effect of sulphide concentration on copper corrosion in anoxic chloride-containing solutions. J. Mater. Eng. Perform. 2017, 26, 1741–1750. [Google Scholar] [CrossRef]
  17. Su, W.; Lv, W.; Liu, Z.; Zhang, Z. Corrosion of copper exposed to Zhanjiang and Zhuhai atmospheric environments. Anti-Corros. Methods Mater. 2017, 64, 286–292. [Google Scholar] [CrossRef]
  18. Fujimoto, S.; Umemura, H.; Shibata, T. Atmospheric corrosion of electroplated cu thin film in moist oxygen environment. ECS Trans. 2006, 1, 243–247. [Google Scholar] [CrossRef]
  19. Araban, V.; Kahram, M.; Rezakhani, D. Evaluation of copper atmospheric corrosion in different environments of Iran. Corros. Eng. Sci. Technol. 2016, 51, 498–506. [Google Scholar] [CrossRef]
  20. FitzGerald, K.P.; Nairn, J.; Skennerton, G.; Atrens, A. Atmospheric corrosion of copper and the colour, structure and composition of natural patinas on copper. Corros. Sci. 2006, 48, 2480–2509. [Google Scholar] [CrossRef]
  21. Kong, D.C.; Dong, C.F.; Fang, Y.H.; Xiao, K.; Guo, C.Y.; He, G.; Li, X.G. Copper corrosion in hot and dry atmosphere environment in Turpan, China. Trans. Nonferrous Met. Soc. China 2016, 26, 1721–1728. [Google Scholar] [CrossRef]
  22. Lopesino, P.; Alcántara, J.; Fuente, D.; Chico, B.; Jiménez, J.; Morcillo, M. Corrosion of copper in unpolluted chloride-rich atmospheres. Metals 2018, 8, 866. [Google Scholar] [CrossRef] [Green Version]
  23. Yan, F.; Li, X.; Jiang, B.; Lin, D.; Fu, M.; Li, W. Initial corrosion behaviour of pure copper in atmospheric environment. IOP Conf. Ser. Earth Environ. Sci. 2019, 384, 012039. [Google Scholar] [CrossRef]
  24. Zhang, F.; Örnek, C.; Liu, M.; Müller, T.; Lienert, U.; Ratia-Hanby, V.; Carpén, L.; Isotahdon, E.; Pan, J. Corrosion-induced microstructure degradation of copper in sulphide-containing simulated anoxic groundwater studied by synchrotron high-energy X-ray diffraction and ab-initio density functional theory calculation. Corros. Sci. 2021, 184, 109390. [Google Scholar] [CrossRef]
  25. Saha, D.; Pandya, A.; Singh, J.K.; Paswan, S.; Singh, D.D.N. Role of environmental particulate matters on corrosion of copper. Atmos. Pollut. Res. 2016, 7, 1037–1042. [Google Scholar] [CrossRef]
  26. Hedin, A.; Johansson, A.J.; Lilja, C.; Boman, M.; Berastegui, P.; Berger, R.; Ottosson, M. Corrosion of copper in pure O2-free water. Corros. Sci. 2018, 137, 1–12. [Google Scholar] [CrossRef]
  27. Sharma, S.P. Reaction of copper and copper oxide with H2S. J. Electrochem. Soc. 1980, 127, 21–26. [Google Scholar] [CrossRef]
  28. Wu, T.; Zhou, Z.; Xu, S.; Xie, Y.; Huang, L.; Yin, F. A corrosion failure analysis of copper wires used in outdoor terminal boxes in substation. Eng. Failure Anal. 2019, 98, 83–94. [Google Scholar] [CrossRef]
  29. Thethwayo, B.M.; Garbers-Craig, A.M. Laboratory scale investigation into the corrosion of copper in a sulphur-containing environment. Corros. Sci. 2011, 53, 3068–3074. [Google Scholar] [CrossRef] [Green Version]
  30. Chen, J.; Qin, Z.; Martino, T.; Shoesmith, D.W. Non-uniform film growth and micro/macro-galvanic corrosion of copper in aqueous sulphide solutions containing chloride. Corros. Sci. 2017, 114, 72–78. [Google Scholar] [CrossRef]
  31. Lu, X.; Liu, Y.; Liu, M.; Wang, Z. Corrosion behaviour of copper T2 and brass H62 in simulated Nansha marine atmosphere. J. Mater. Sci. Technol. 2019, 35, 1831–1839. [Google Scholar] [CrossRef]
  32. Schindelholz, E.J.; Cong, H.; Jove-Colon, C.F.; Li, S.; Ohlhausen, J.A.; Moffat, H.K. Electrochemical aspects of copper atmospheric corrosion in the presence of sodium chloride. Electrochim. Acta. 2018, 276, 194–206. [Google Scholar] [CrossRef]
  33. Deutscher, R.L.; Woods, R. Characterization of oxide layers on copper by linear potential sweep voltammetry. J. Appl. Electrochem. 1986, 16, 413–421. [Google Scholar] [CrossRef]
  34. Tran, T.T.M.; Fiaud, C.; Sutter, E.M.M.; Villanova, A. The atmospheric corrosion of copper by hydrogen sulphide in underground conditions. Corros. Sci. 2003, 45, 2787–2802. [Google Scholar] [CrossRef]
  35. Tran, T.T.M.; Fiaud, C.; Sutter, E.M.M. Oxide and sulphide layers on copper exposed to H2S containing moist air. Corros. Sci. 2005, 47, 1724–1737. [Google Scholar] [CrossRef]
  36. Nielsen, B.C.; Doğan, Ö.N.; Howard, B.H. Effect of temperature on the corrosion of Cu-Pd hydrogen separation membrane alloys in simulated syngas containing H2S. Corros. Sci. 2015, 96, 74–86. [Google Scholar] [CrossRef]
  37. Cai, L.; Chen, M.; Wang, Y.; Chen, C.; Zhang, L.; Zhou, H.; Wu, L.; Yan, Y. Electrochemical corrosion behaviour of bronze materials in an acid-containing simulated atmospheric environment. Mater. Corros. 2019, 71, 464–473. [Google Scholar] [CrossRef]
  38. Yu, X.; Wang, Z.; Lu, Z. In situ investigation of atmospheric corrosion behaviour of copper under thin electrolyte layer and static magnetic field. Microelectron. Reliab. 2020, 108, 113630. [Google Scholar] [CrossRef]
  39. Bellakhal, N.; Draou, K.; Brisset, J.L. Electrochemical investigation of copper oxide films formed by oxygen plasma treatment. J. Appl. Electrochem. 1997, 27, 414–421. [Google Scholar] [CrossRef]
  40. ASTM Standard D-130-80, Part 23; American Society for Testing and Materials: West Conshohocken, PA, USA, 1981; p. 104.
  41. Wang, H.; Xie, J.; Yan, K.P.; Duan, M.; Zuo, Y. The nucleation and growth of metastable pitting on pure iron. Corros. Sci. 2009, 51, 181–185. [Google Scholar] [CrossRef]
  42. Persson, D.; Leygraf, C. In situ infrared reflection absorption spectroscopy for studies of atmospheric corrosion. J. Electrochem. Soc. 1993, 140, 1256–1260. [Google Scholar] [CrossRef]
  43. Zhao, W.; Babu, R.P.; Chang, T.; Odnevall, I.; Hedström, P.; Johnson, C.M.; Leygraf, C. Initial atmospheric corrosion studies of copper from macroscale to nanoscale in a simulated indoor atmospheric environment. Corros. Sci. 2022, 195, 109995. [Google Scholar] [CrossRef]
  44. Paul, A.M.; Sajeev, A.; Nivetha, R.; Gothandapani, K.; Bhardwaj, P.; Raghavan, V.; Jacob, G.; Sellapan, R.; Jeong, S.K.; Grace, A.N. Cuprous oxide/graphitic carbon nitride (g-C3N4) nanocomposites for electrocatalytic hydrogen evolution reaction. Diamond Relat. Mater. 2020, 107, 107899. [Google Scholar] [CrossRef]
  45. Shanghai Institute of Organic Chemistry of CAS. Chemistry Database. 1978–2022. Available online: http://www.organchem.csdb.cn. (accessed on 1 February 2022).
  46. Li, K.; Chen, Z.; Li, J.; Sun, X.; Xu, F.; Xu, L. Corrosion mechanism of copper immersed in ammonium sulphate solution. Mater. Corros. 2018, 69, 1597–1608. [Google Scholar] [CrossRef]
  47. Chialvo, M.R.G.; Marchiano, S.L.; Arvía, A.J. The mechanism of oxidation of copper in alkaline solutions. J. Appl. Electrochem. 1984, 14, 165–175. [Google Scholar] [CrossRef]
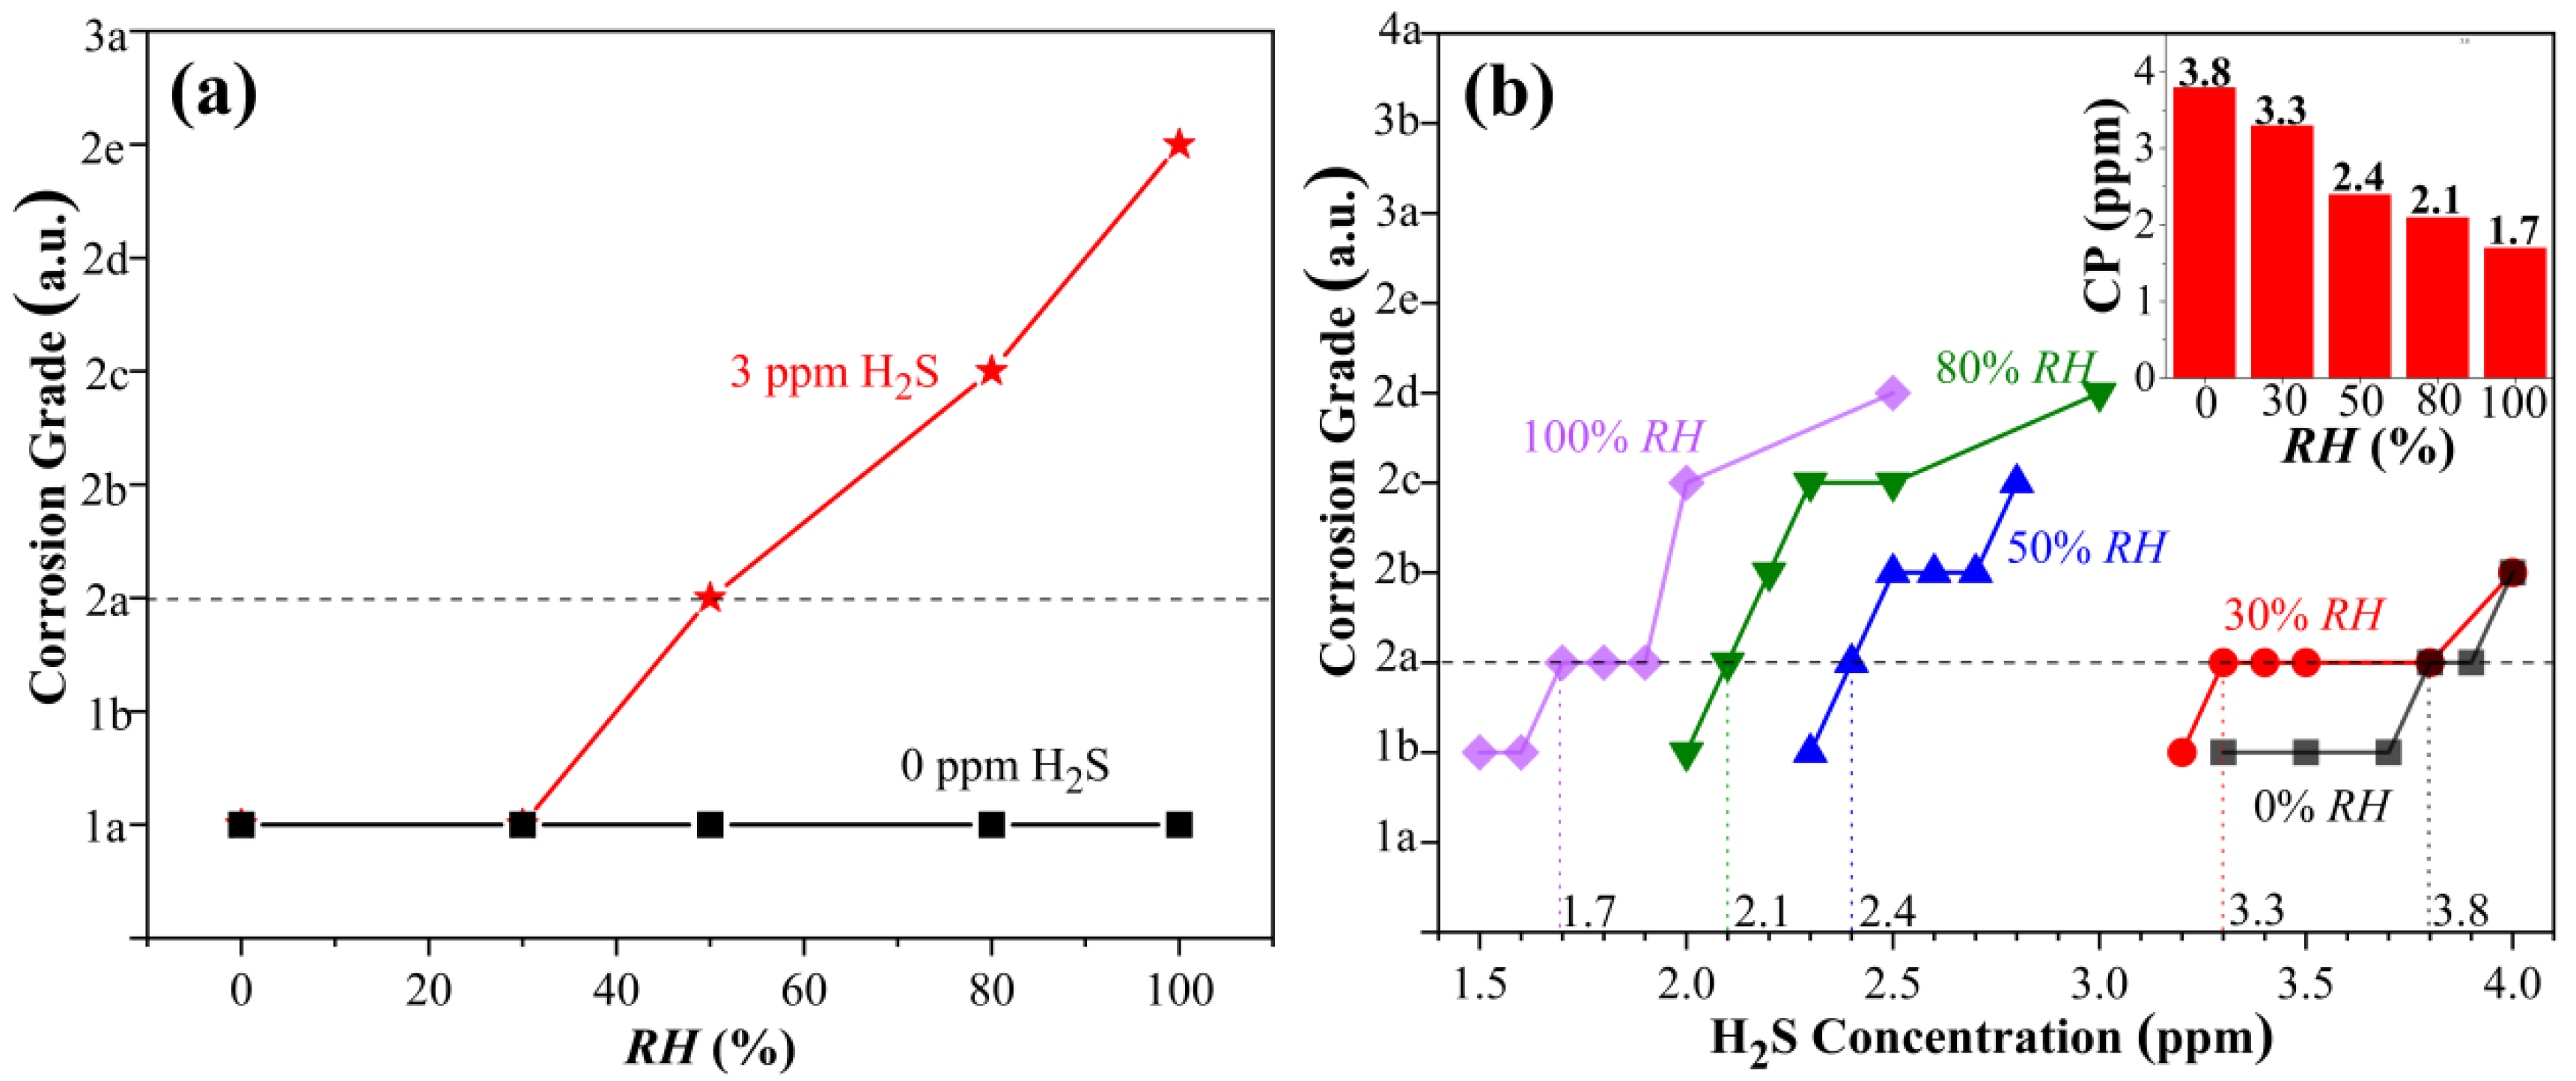
Figure 1. (a) Variation in copper corrosion grade in H2S-containing LPG with humidity; (b) the influence of H2S concentration and RH on the corrosion grade of copper in LPG.
Metals 12 02015 g001
Figure 2. The influence of RH on CP of copper corrosion in H2S-containing LPG.
Metals 12 02015 g002
Figure 3. Influence of oxygen concentration on copper corrosion grade in H2S-containing LPG at (a) 0% RH, (b) 100% RH.
Metals 12 02015 g003
Figure 4. Influence of oxygen content on CP at (a) 0% RH, (b) 30% RH, (c) 50% RH, (d) 80% RH, (e) 100% RH.
Metals 12 02015 g004
Figure 5. Fitted data of the CP in different LPG environments.
Metals 12 02015 g005
Figure 6. SEM images of corrosion products of copper sheets after corrosion tests in H2S, H2S + H2O, H2S + O2 and H2S + O2 + H2O.
Metals 12 02015 g006
Figure 7. EDS images of corrosion products in different LPG environments.
Metals 12 02015 g007
Figure 8. GIXRD patterns of corrosion products at different conditions.
Metals 12 02015 g008
Figure 9. XPS images of corrosion products in different LPG environments: (a) Cu 2p data and fits; (b) S 2p data and fits; (c) the content ratio of each phase in Cu 2p spectrum.
Metals 12 02015 g009
Figure 10. FTIR images of corrosion products on copper powder in different LPG environments: (a) FTIR full spectrum, (b) FTIR images of 920~1230 cm−1, (c) FTIR images of 445~800 cm−1.
Metals 12 02015 g010
Figure 11. Schematic diagram of corrosion steps of copper sheet in H2S-containing LPG. (a) step1. (b) step2.
Metals 12 02015 g011
Figure 12. Schematic diagram of corrosion steps of copper sheet in LPG with H2S+H2O. (a) step1. (b) step2. (c) step3.
Metals 12 02015 g012
Figure 13. Schematic diagram of corrosion steps of copper sheet in LPG with H2S + O2. (a) step1. (b) step2.
Metals 12 02015 g013
Figure 14. Schematic diagram of corrosion steps of copper sheet in LPG with H2S + H2O + O2. (a) step1. (b) step2. (c) step3.
Metals 12 02015 g014
Table 1. The components of LPG.
ComponentPropaneIsobutaneN-Butane
wt./%701416
Table 2. The grading table of copper corrosion standard swatches [40].
Corrosion LevelCopper ColourDetailed Description
1mild
discolouration
a. pale orange, almost the same as freshly polished copper
b. dark orange
2moderate
discolouration
a. fuchsia
b. lavender
c. multicoloured with lavender blue, silver or both, overlaid on fuchsia
d. silver
e. brass or golden yellow
3deep
discolouration
a. multicolour magenta overlay brass
b. multicolour (malachite green) shown by red and green, no grey
4corrosiona. transparent black, dark grey or brown with only malachite green
b. graphite or matte black
c. glossy black or jet-black glossy black
Table 3. The elemental content of corrosion products at four different corrosion conditions.
ElementH2SH2S + H2OH2S + O2H2S + O2 + H2O
wt.%Atomic%wt.%Atomic%wt.%Atomic%wt.%Atomic%
O--5.1816.612.859.208.4025.99
S9.9417.958.6613.8514.9824.103.505.40
Cu90.0682.0586.1569.5382.1766.7088.0968.60
Total100.00100.00100.00100.00100.00100.00100.00100.00
Table 4. The content ratio of each phase in the corrosion products in the Cu 2p spectrum.
ElementPeak TypeConditionBE (ev)Area%
CuCu2SH2S932.75100.00
H2S + H2O932.7752.74
H2S + O2932.7032.56
H2S + H2O + O2932.8070.26
Cu2OH2S--
H2S + H2O--
H2S + O2--
H2S + H2O + O2932.5129.74
CuOH2S--
H2S + H2O934.1047.26
H2S + O2934.2767.44
H2S + H2O + O2--
Publisher’s Note: MDPI stays neutral with regard to jurisdictional claims in published maps and institutional affiliations.