Article

Relationship between Microstructure and Corrodibility of Local Dry Underwater Laser Welded 304 Stainless Steel

Department of Industrial Laser Technology, Korea Institute of Machinery & Materials, Busan 46744, Korea
*
Author to whom correspondence should be addressed.
Metals 2022, 12(11), 1904; https://doi.org/10.3390/met12111904
Submission received: 17 October 2022 / Revised: 1 November 2022 / Accepted: 2 November 2022 / Published: 7 November 2022
(This article belongs to the Special Issue Laser Welding Technology)

Abstract

:
To understand the relationship between microstructure and corrosion, in this study, underwater bead-on-plate laser welding was compared with the in-air laser welding of 10-mm-thick 304 stainless steel plates at different laser powers (2, 4, and 6 kW). Welding was performed via local dry underwater laser welding (UWLW) using a custom-designed nozzle and a fiber laser at a water depth of 70 mm. The best weld quality was obtained in both underwater and in-air environments using 2 kW of laser power. To understand the relationship between the microstructure and corrosion resistance of 304ss in underwater laser welding (UWLW), this study was conducted using a custom-designed nozzle. The grain boundary analysis revealed that the specimen prepared by UWLW had high-angle grain boundaries content approximately 1.5 times higher than that of the specimen produced by in-air laser welding, and the fraction of the coincidence site lattice (CSL) boundaries was increased remarkably. High residual stress and microchromium precipitation were observed in the UWLW specimen, and the corrosion rate of the same at 2 kW laser power was considerably similar to that of the in-air laser weld specimen.

1. Introduction

Austenitic stainless steel has been widely used as a material in industries such as the nuclear power and marine structure industries, owing to its remarkable corrosion resistance. With aging, the parts used in these industries must be repaired and maintained underwater. Underwater welding has been studied as a repair and maintenance technique for maritime applications and nuclear facilities [1,2,3,4,5]. Over many years, various underwater welding methods have been developed. These include underwater wet welding, dry underwater welding, and local dry underwater welding [5]. Underwater arc welding, which is the most widely used method, has disadvantages such as high crack sensitivity and a significant decrease in weld strength [6,7,8]. Because of these problems, underwater wet friction taper plug welding has been studied. Xiong at al., observed the microstructural characteristics of an X52-grade welded steel pipeline that had undergone underwater wet friction taper plug welding, and evaluated the effect of the welding parameters on the microstructure. The results showed that that the microstructure of the welded joint was inhomogeneous and very different from the base metal [6]. Cui et al., investigated welding properties such as the microstructure and impact toughness of underwater welded joints prepared via friction taper plug welding. It was found that the defect-free friction taper plug welding could be obtained with a 7000 kN [9].
Recently, much research has been conducted on underwater laser welding (UWLW) [4,10,11,12,13,14]. The UWLW technique has several important advantages, such as excellent welding quality, remote operation, and low heat input [4]. In particular, compared with underwater wet laser welding, local dry UWLW can generate high-quality welded parts [6]. Fu et al., generated a stable local dry cavity around the weld area using a gas flow rate of 50 L/min and obtained welds with tensile strengths and an impact toughness that were not significantly different from those of in-air laser welds [11]. Wang et al., found that when pure nitrogen rather than other gases was used as the shielding gas, the weld region exhibited better corrosion resistance [12]. Guo et al., explored the dependence of the welding morphology and mechanical properties on various process parameters in UWLW using a custom-designed double-layer gas curtain nozzle, and suggested that underwater laser beam welding has lathy ferrite and that some equiaxed crystals were replaced by the columnar dendrites [13]. Zhang et al., investigated the relationship between the shielding condition of the local dry cavity and weld quality. The results indicated that the steady of the local dry cavity was the main factor used to monitor the underwater laser beam welding [4]. Guo et al., reported UWLW with control of various process parameters performed using a double-layer gas protective cover, and the surface appearance, microstructure, and mechanical properties were characterized [14].
However, few studies have been reported that compare the microstructural properties of weld areas prepared via UWLW and in-air laser welding. In particular, studies on the corrosion resistance properties of parts welded using local dry cavities have not been reported in detail. In this study, the grain boundary (GB) characteristics, residual stress, microhardness, and elemental distributions in the weld regions were investigated, and the relationships between these factors and corrosion occurring in the weld zone were investigated. In addition, the quality of the weld obtained under the optimal UWLW conditions was investigated by comparison with an in-air laser weld specimen.

2. Materials and Experimental Procedures

2.1. Materials and Laser Welding Process

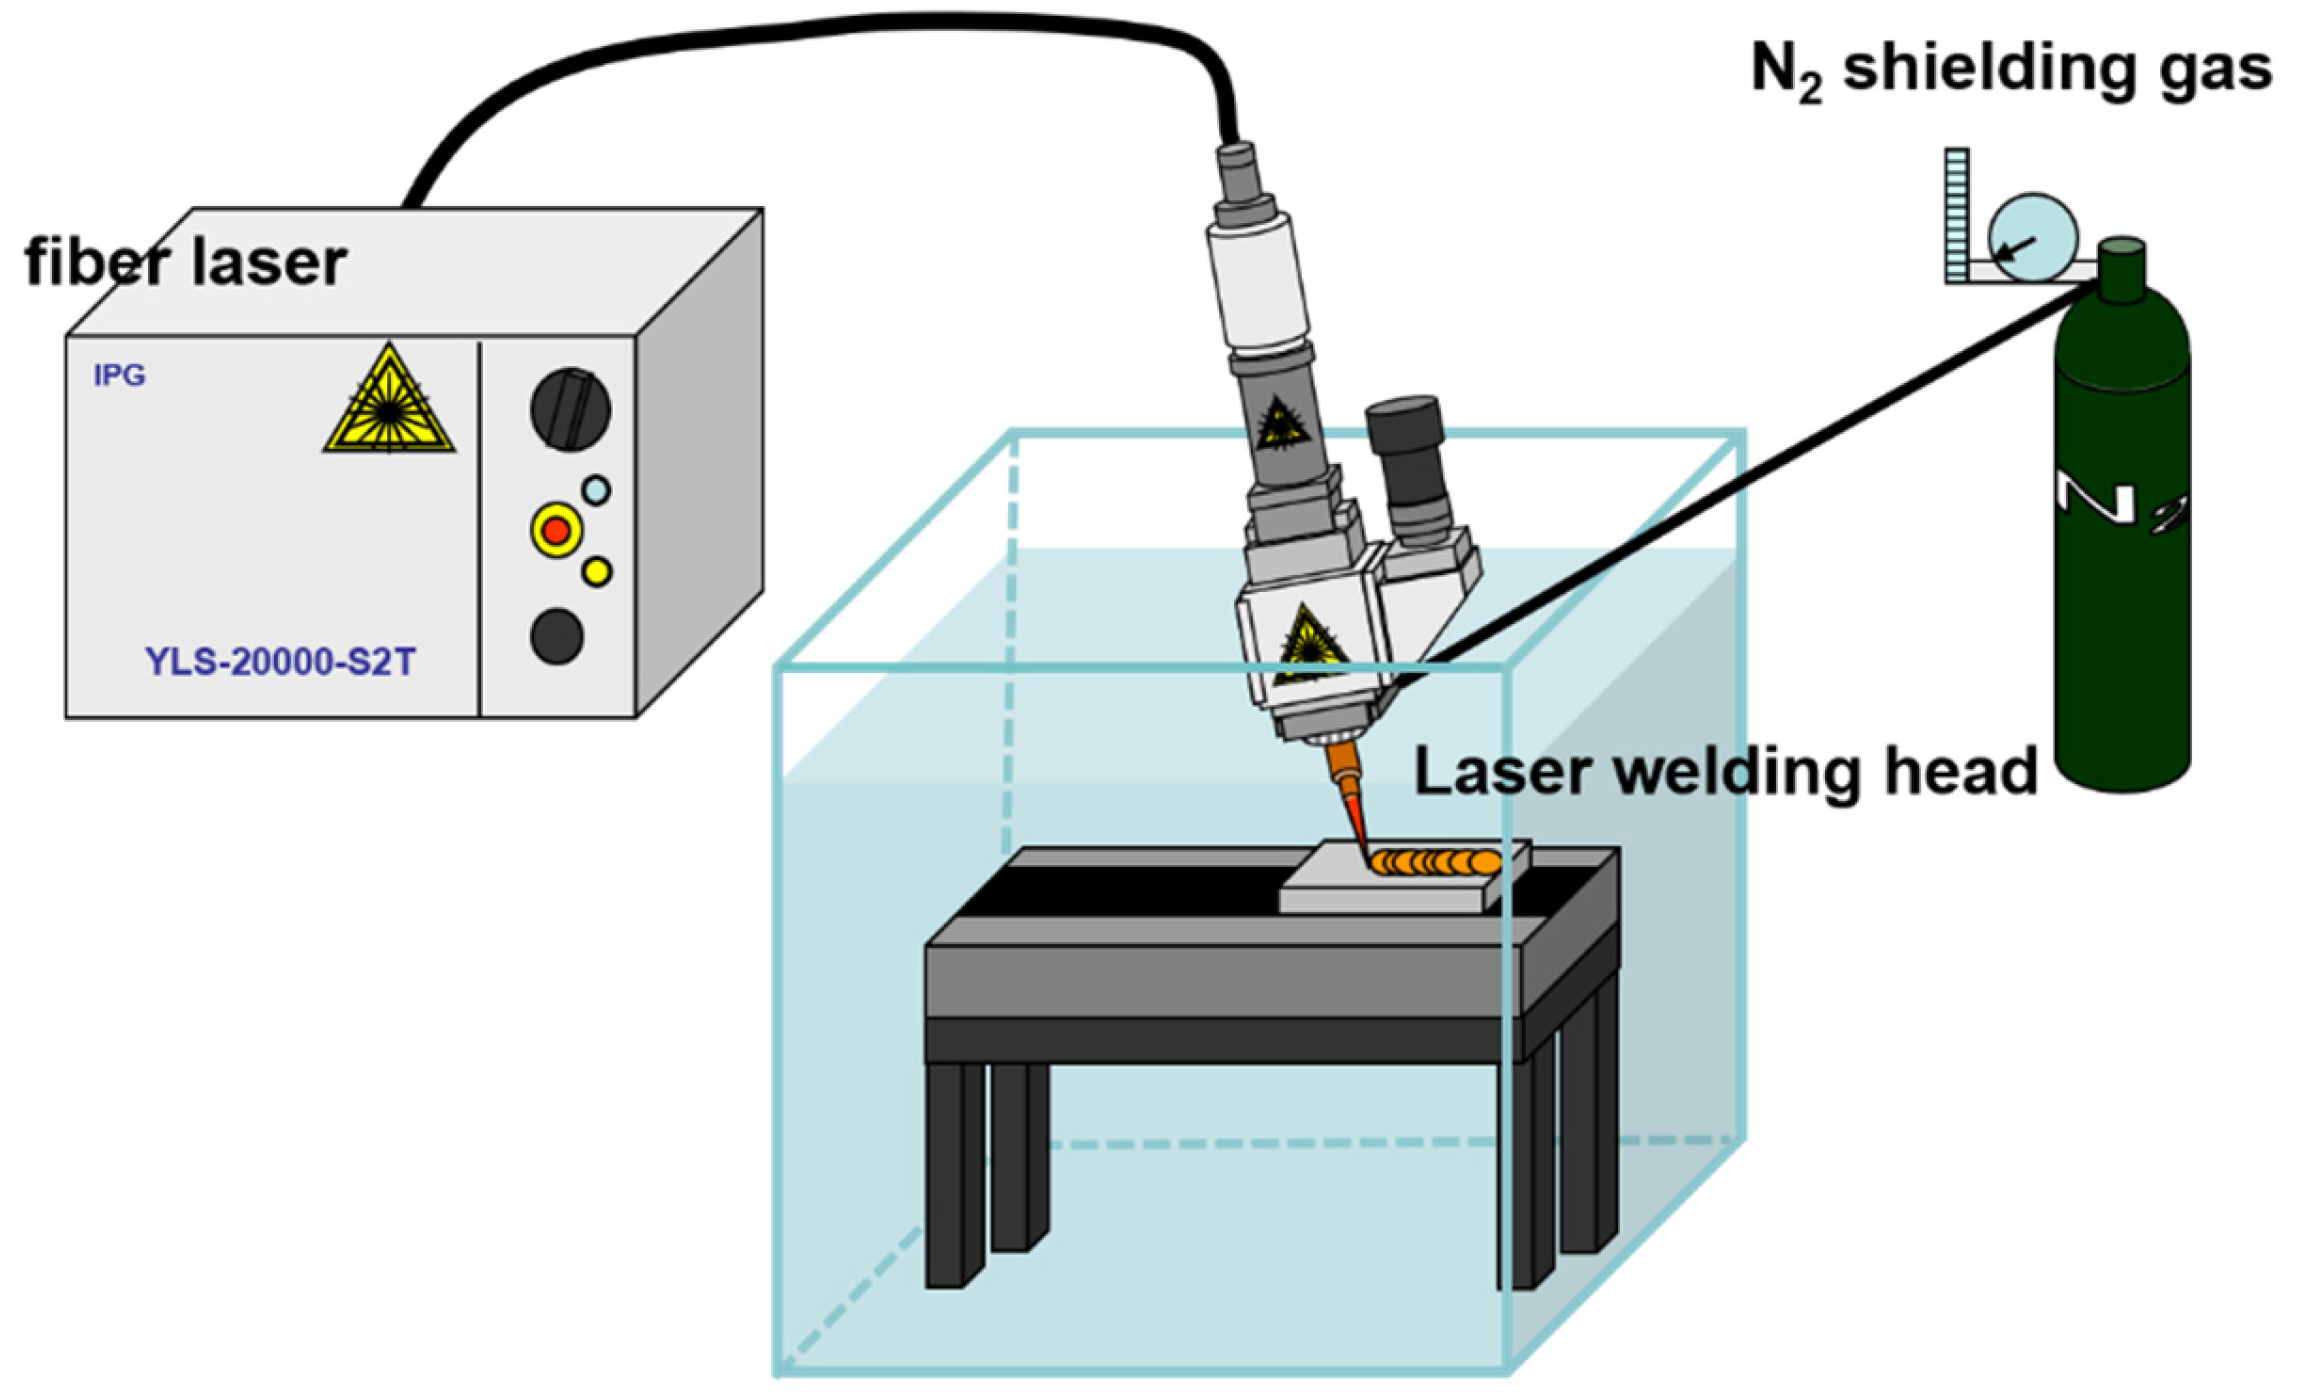
A hot-rolled 304 stainless steel (304 SS) plate was used in this study, and its chemical composition is listed in Table 1. The dimensions of the specimens were 100 mm × 100 mm × 10 mm. Figure 1 shows a schematic illustration of the local dry UWLW process. After underwater welding, it was cut into 20 mm × 20 mm × 10 mm pieces via wire-cut electro discharge machining to examine the weld microstructure.
The experimental system for the local dry UWLW is shown in Figure 2. To form a stable cavity area in water and to protect the laser welding zone in a subaqueous environment at a water depth of 70 mm, a specially designed gas-shielding nozzle was used in this study. The welding process was performed by applying the bead-on-plate method using a fiber laser (IPG, YLS-20000-S2T) with a two-axis gantry system. The maximum power was 20 kW, the diameter of the laser beam spot size was 460 µm, the laser wavelength was 1070 nm, and the focal length of the lens system at the output of the laser was 460 mm. Nitrogen (N2) at a pressure of 0.5 MPa was used in this experiment as the shielding gas. The temperature of the water was 20.8 °C. To determine the influence of the laser power, welding was performed using 2, 4, and 6 kW of power, and the travel speed was 5 mm/s. Table 2 lists the welding parameters.

2.2. Microstructure Analysis

The weld surface was examined using an optical microscope (OM, Nikon) and radiographic testing (220 Kvp, 5 mA of the capacity). Then, to analyze their microstructure, the samples underwent wire-cut electro discharge machining in the depth direction, perpendicular to the welding direction, in accordance with the method described in the ASM Handbook Volume 9, Metallography and Microstructures [15]. Subsequently, the surface in the direction perpendicular to the welding direction was ground using 2000 grit abrasive paper and then polished to 0.25 µm using diamond paste. The microstructure was etched using an etching solution consisting of a mixture of 300 mL of HCl and 100 mL of HNO3. The microstructure was observed using optical microscopy, and cross sections of the welded region were observed using field-emission scanning electron microscopy (FE-SEM, Hitachi SU5000). Vickers microhardness (Matsuzawa, MMT-X7) measurements were performed with a test load and dwell time of 300 gf and 5 s, respectively, on the cross section through the welded zone.
The microstructure was also analyzed using electron backscatter diffraction (EBSD, TSL Hikari Super). The residual stress, GB characteristics, and crystal orientation were determined from the EBSD measurements. EBSD scanning was carried out over an area of 800 µm × 1000 µm perpendicular to the welding direction, using a magnification of ×100, a voltage of 15 KeV, and a step size of 1.5 µm. For surface residual stress relief during the polishing process, ion milling (IM4000 PLUS CTC) was also performed. The diverse origins of the EBSD parameters were studied using the OIM software (EDAX, TSL). In this study, the local strain due to the welding process on the surface of the material was estimated using kernel average misorientation (KAM) values derived from EBSD. Recently, KAM has been used to quantify local microscale residual strain distributions [16,17,18,19,20]. KAM is the average misorientation value between the reference point and a point close to the reference point [17,18]. Misorientations surpassing the tolerance of 5° are neglected in this study [20].
Classification of GBs into the following three types is possible: low-angle grain boundaries (LAGBs), random high-angle grain boundaries (HAGBs), and coincidence site lattice (CSL) boundaries (3 ≤ ∑ ≤ 29) [21,22,23,24]. It is known that HAGBs are vulnerable to corrosion, while LAGBs and CSL boundaries are resistant to corrosion [17,21,22,23,24]. Electron probe microanalysis (EPMA, JXA-8530F) was also performed to investigate the elemental distribution in the welded material. This section may be divided by subheadings. It should provide a concise and precise description of the experimental results, their interpretation, as well as the experimental conclusions that can be drawn.

2.3. Corrosion Testing

Potentiodynamic polarization corrosion testing was performed according to the test method KS D ISO 17475 prescribed in the guidelines for measuring potential and potential polarization; each test was repeated twice for reproducibility [25]. From the observed polarization behavior, the corrosion potential and corrosion current density were extracted and evaluated. The potentiostatic anode polarization testing was executed using a potentiostat/galvanostat (Bio-Logic SP-240) and an electrochemical corrosion cell consisting of a working electrode (WE) and high-purity platinum mesh counter electrode (CE) connected to the anode and cathode, respectively. The test solution was a 3.5% NaCl solution, which is an environment known to facilitate corrosion, and a constant-temperature water bath was used to control and maintain the solution temperature at 25 ± 1 °C.
The open circuit potential (OCP) was measured for 1 h to ensure that the potential of the specimen reached a stable state in the solution before polarization testing was commenced. The material was anodically polarized up to a potential of +0.80 V (SCE) from -0.1 V at rate of 0.167 mV/s. Using Tafel extrapolation, the corrosion potential Ecorr and corrosion current density Icorr were estimated from the polarization curve, and the polarization behavior was analyzed.

3. Results

3.1. Surface Morphology and Radiographic Testing

Figure 3 shows photographic and radiographic images of the surface welded using different laser powers, in the air, and underwater; the welding speed and pressure of the shielding gas were kept at 0.5 mm/s and 5 bar, respectively, during the preparation of these specimens. As the laser power was increased, the weld surface morphology was increasingly irregular (Figure 3b,c,e,f). In particular, in Figure 3f, surface defects are apparent, and surface defects are also visible in Figure 3b,c,e. Among the six different welding conditions, those with laser powers of 2 kW produced the best surfaces in the welding region (Figure 3a,d). Radiographic testing demonstrated that few defects were present on the weld surface and inside the weld in these cases, indicating that the welding process was stable. Microscopy and X-ray imaging experiments at 2 kW laser power revealed no significant difference between the quality of the surfaces welded underwater and in air, and there were no obvious defects such as surface porosity in the specimen welded underwater. These observations indicate that a stable cavity and excellent protection conditions were achieved during UWLW using the custom-designed nozzle.

3.2. Analysis of Weld Area Microstructure

3.2.1. Optical Microscopy

Figure 4 shows the microstructure in a cross section through the weld area in the specimen prepared via in-air laser welding. Bands can be observed at the bottom of the weld region, and a view of these are expanded in Figure 4b. As can be seen in Figure 4c, the microstructure of the in-air laser weld zone usually consisted of cellular dendrites that started from grains at the ends of the weld region and grew along the temperature gradient toward its center. The development of cellular dendrites is known to occur when a significant temperature gradient exists during the cooling process of the weld [5,26,27]. In addition, as the cellular dendrites grew toward the center of the weld bead owing to the high cooling rate, the presence of alloying elements and impurities increased the degree of supercooling in the center of the bead, and equiaxed crystals were formed at the center of the weld bead [5]. Figure 4a shows equiaxial crystals near the welding center. Austenite and ferrite microstructure were apparent in the optical micrographs, and incomplete ferrite-to-austenite transition in laser welding is known to be caused by high cooling rates [10,26].
The microstructure in a cross section through the weld region of a specimen prepared via UWLW is shown in Figure 5. The rapidly cooled weld microstructure consisted of austenite and ferrite phases, as was seen in the specimen prepared by in-air laser welding. In Figure 5c, cellular dendrites grew rapidly from the end of the weld grain to the center of the weld bead. Additionally, it can be seen that there were ferrite crystals in the shape similar to in-air laser welding in the center of the welded area. This is because of the influence of water on the UWLW procedure: the relatively high cooling rate compared with that of in-air laser welding leads to the generation of a steep thermal gradient. As a result, cellular dendrites developed rapidly from the edge of the weld zone to its center, and the fraction of equiaxed crystals in the central area of the welding zone was reduced compared with that seen in the in-air laser weld specimen (Figure 5a) [5]. The ferrite size is strongly related to the cooling rate during the welding process [27]. Reduced heat inputs result in increased cooling rates in the welding zone, which further inhibit the ferrite-to-austenite transition and result in the formation of fine ferrite dendrites and a decrease in the average spacing between dendrites [27]. In addition, because of the steep thermal gradient, the welding width generated during the underwater process was measured 4.82 mm using optical microscope, which was narrower than that generated in air (5.31 mm). When the laser power was 4kw, the welding width was 6.08 mm for UWLW and 6.97 mm for in-air laser welding, and for 6kw of laser power, the welding width was 6.98mm for UWLW and 6.73 mm for in-air laser welding. From this, it can be seen that the welding width of UWLW was narrower than in-air laser welding due to the rapidly cooling rate from water. Figure 6 shows SEM images of magnified views of the microstructure in the central portion of the cross section of the welded specimens prepared using 2 kW of laser power. Both the in-air (Figure 6a) and underwater (Figure 6b) specimens consisted of lathy and skeletal ferrites. In particular, in Figure 6b, smaller austenite and ferrite crystals are seen in comparison with those seen in Figure 6a because of the higher cooling rate for the UWLW process [28,29,30].

3.2.2. Electron Backscatter Diffraction

It is important to investigate the residual stress and deformation in the weld area because these can result in reduced fatigue strength and corrosion [16,17,18,19,20,31,32]. The shrinkage that occurs during the cooling of weldments is known to induce tensile stress in welded parts. Moreover, volume expansion caused by the phase transition from austenite (face centered cubic, FCC) to ferrite (body centered cubic, BCC) occurring in the weld zone during the welding process induces compressive stress in the heat-affected zone (HAZ) [20,31].
Several studies involving the evaluation of residual stress using KAM have been reported in the literature, including some recent papers detailing the extraction of KAM data from EBSD results [18,19,20]. In these studies, KAM values were used to indicate the amount of plastic deformation or residual stress, but there is a limit to identifying the residual stresses of the extensive area. Therefore, the KAM map was applied to determine the local strain distributions in strained microstructures. Among the six welded specimens prepared using three different laser powers, the two specimens prepared under the optimal welding conditions (2 kW of laser power) were selected to investigate the microstructure of the weld bead in more detail. Figure 7a–c and Figure 7d–f show various maps extracted from EBSD data of specimens prepared via UWLW and in-air laser welding, respectively.
Figure 7a,d show KAM value maps obtained from EBSD measurements. In the figures, blue areas represent populations of recrystallized or relatively unstrained grains, whereas green areas represent relatively deformed or strained grains. These indicate that UWLW created high residual stress, which can be attributed to the phase transition by a high cooling rate. The average KAM value calculated by OIM software was 0.51 in underwater laser welding and 0.34 in in-air laser welding, indicating that the underwater laser welding had a higher KAM value. Figure 7b,e show inverse pole figure (IPF) maps obtained via EBSD for the specimens prepared in air and underwater. These demonstrate that the average grain size as obtained via EBSD was 10.06 µm for the underwater specimen and 11.13 µm for the in-air one, that is, UWLW results in a finer microstructure. As mentioned earlier, as the cooling was increased, the inhibition of the ferrite-to-austenite transition and grain refinement were increased.
Figure 7c,f display GB character maps illustrating the LAGB and HAGB contents. The blue lines indicate HAGBs (θ > 15°) and the red and green lines indicate LAGBs (1° < θ < 15°). The LAGB fraction of the underwater welded specimen as shown in Figure 7c was found to be 0.549, and the HAGB fraction was 0.427. Comparing these observations with Figure 7f, it can be seen that the LAGB fraction generated by UWLW was higher than that generated by in-air laser welding. Indeed, these images indicate that the specimen prepared via UWLW had a LAGB ratio approximately 1.5 times greater and a HAGB ratio approximately 0.6 times less than those of the in-air weld specimen.
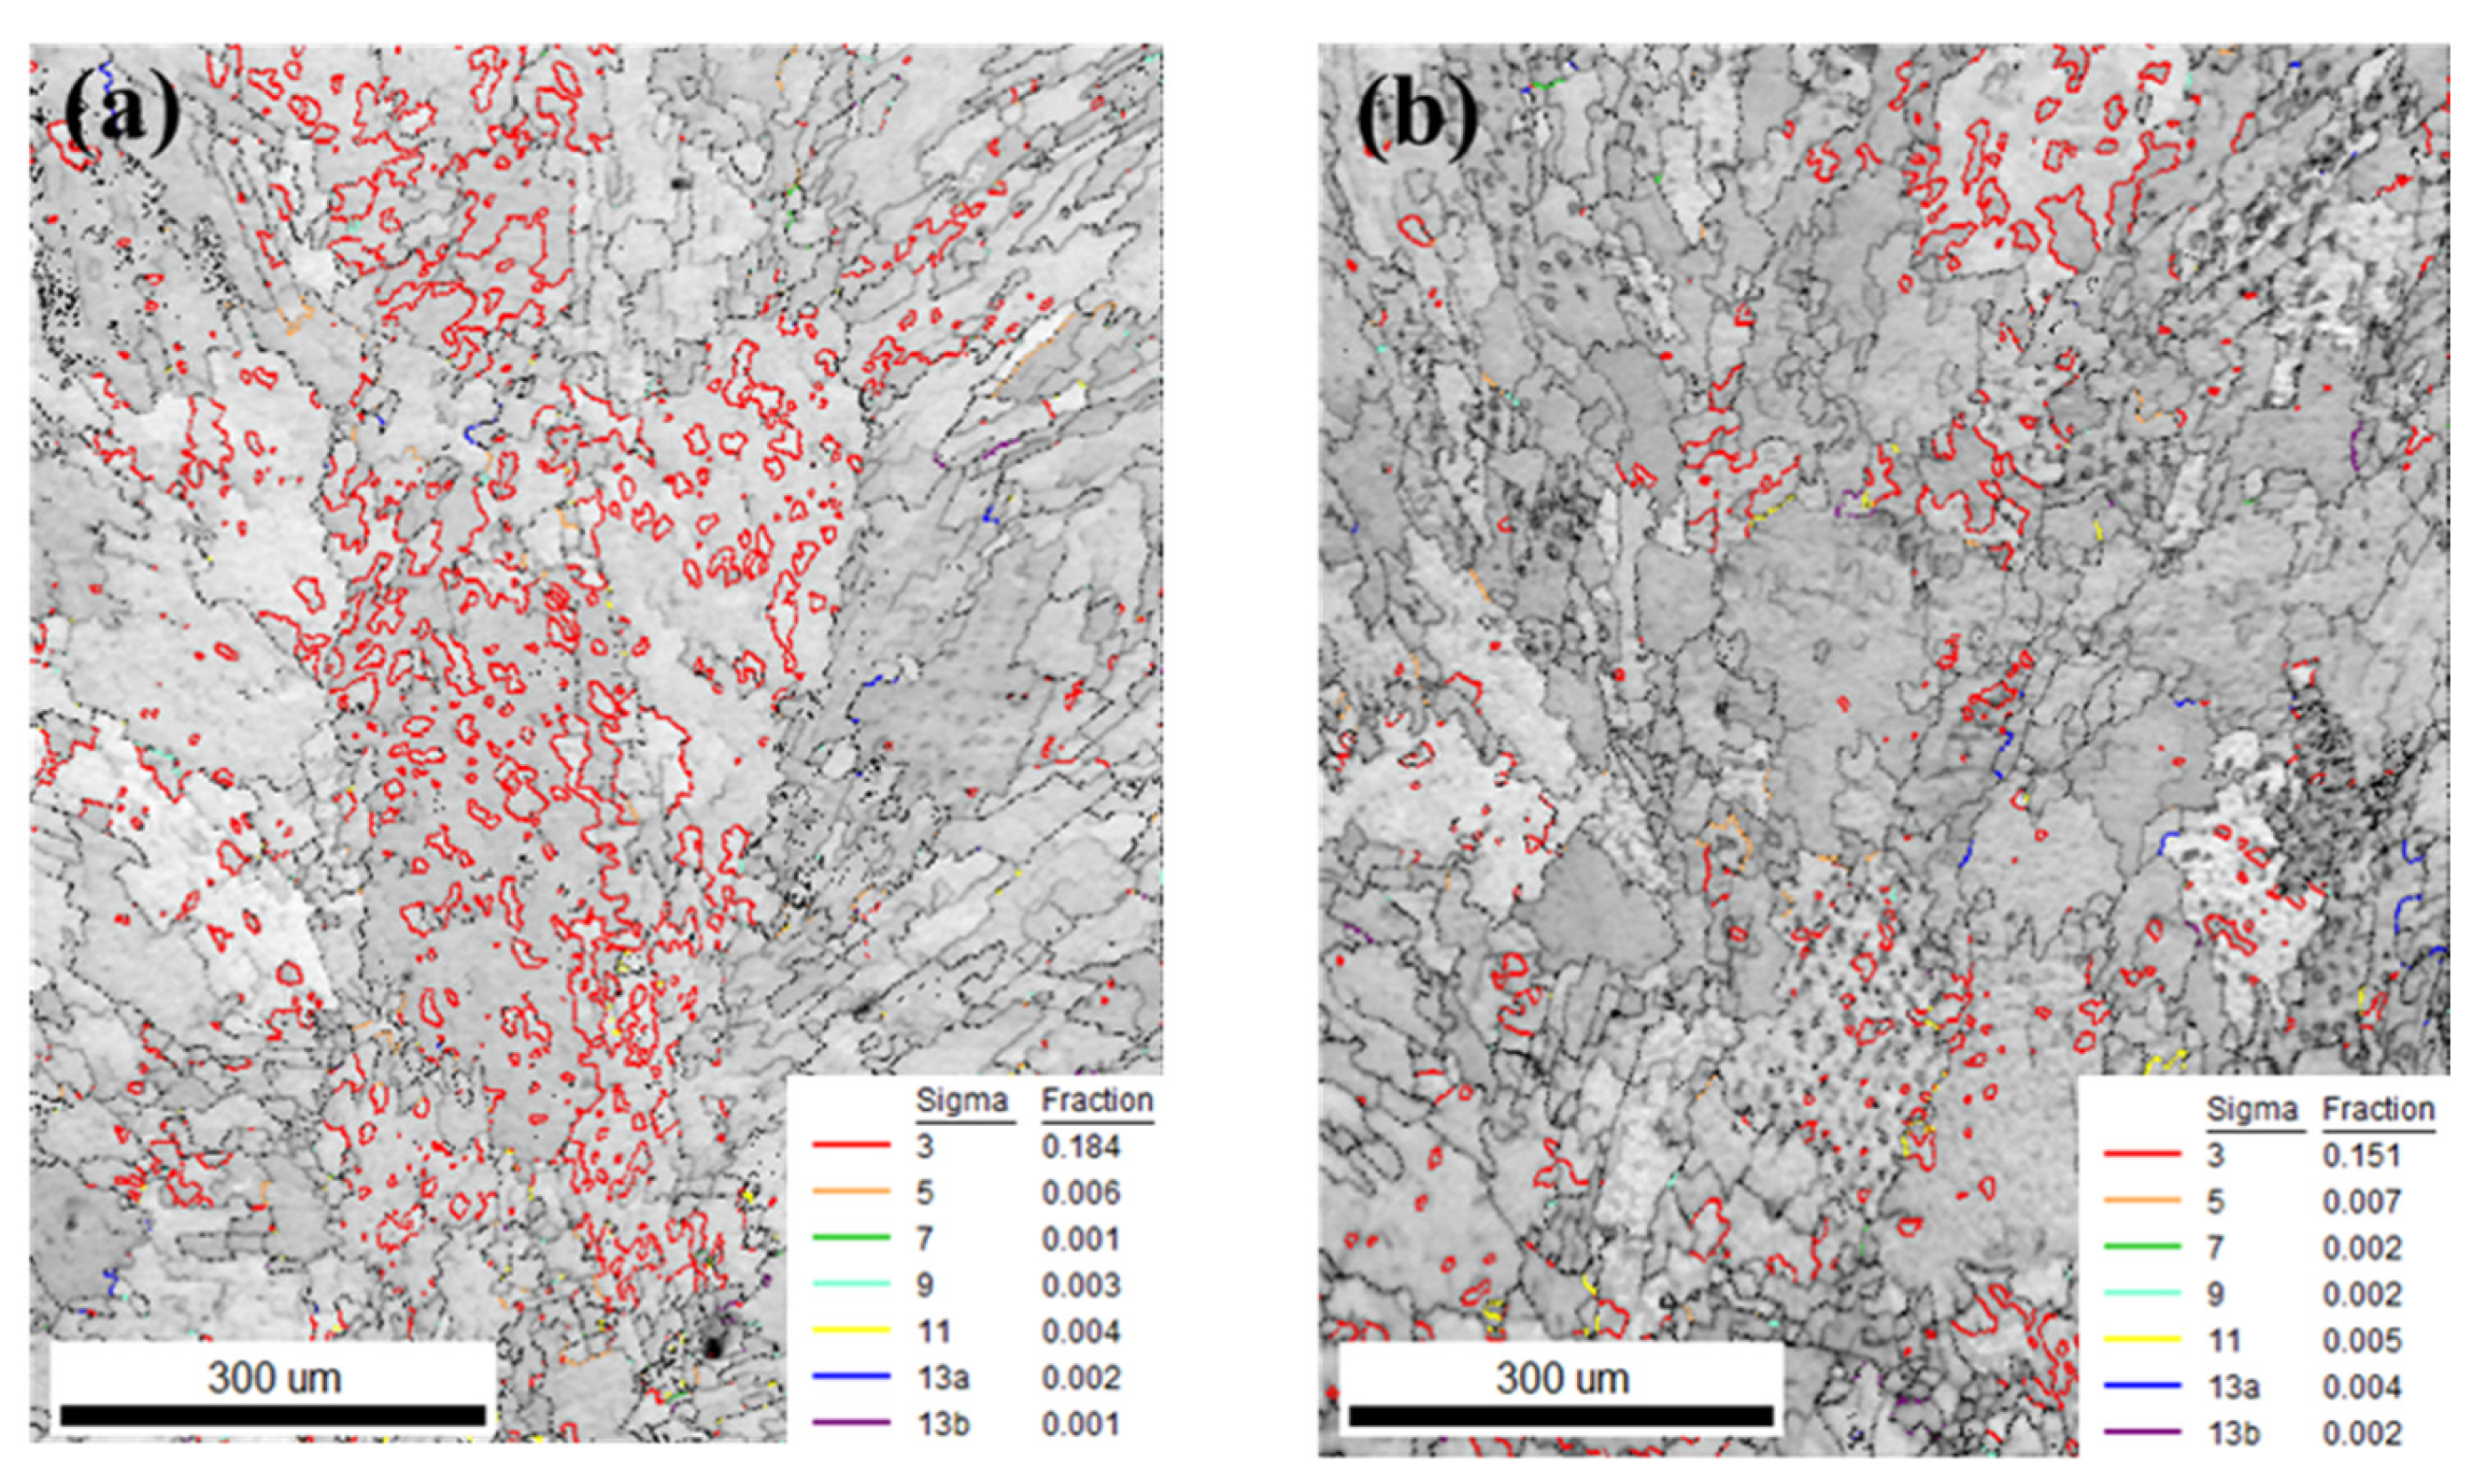
In general, it is known that HAGBs are vulnerable to corrosion, and LAGBs are highly resistant to corrosion [21,22,23,24]. GBs with low-∑ CSLs are also resistant to corrosion [22,23,33,34]. In Figure 8, the GB character map extracted from the EBSD data shows the detailed ∑-boundary structure at the center of the weld bead. In particular, in the specimen prepared via UWLW (Figure 8a), it can be seen that the fraction of the ∑3 boundaries was increased remarkably, by approximately 20%, with respect to that of the specimen prepared via in-air laser welding (Figure 8b). For low-∑ boundaries, the relationship between corrosion and GB variation is described in detail in Section 3.3.

3.2.3. Electron Probe Microanalysis

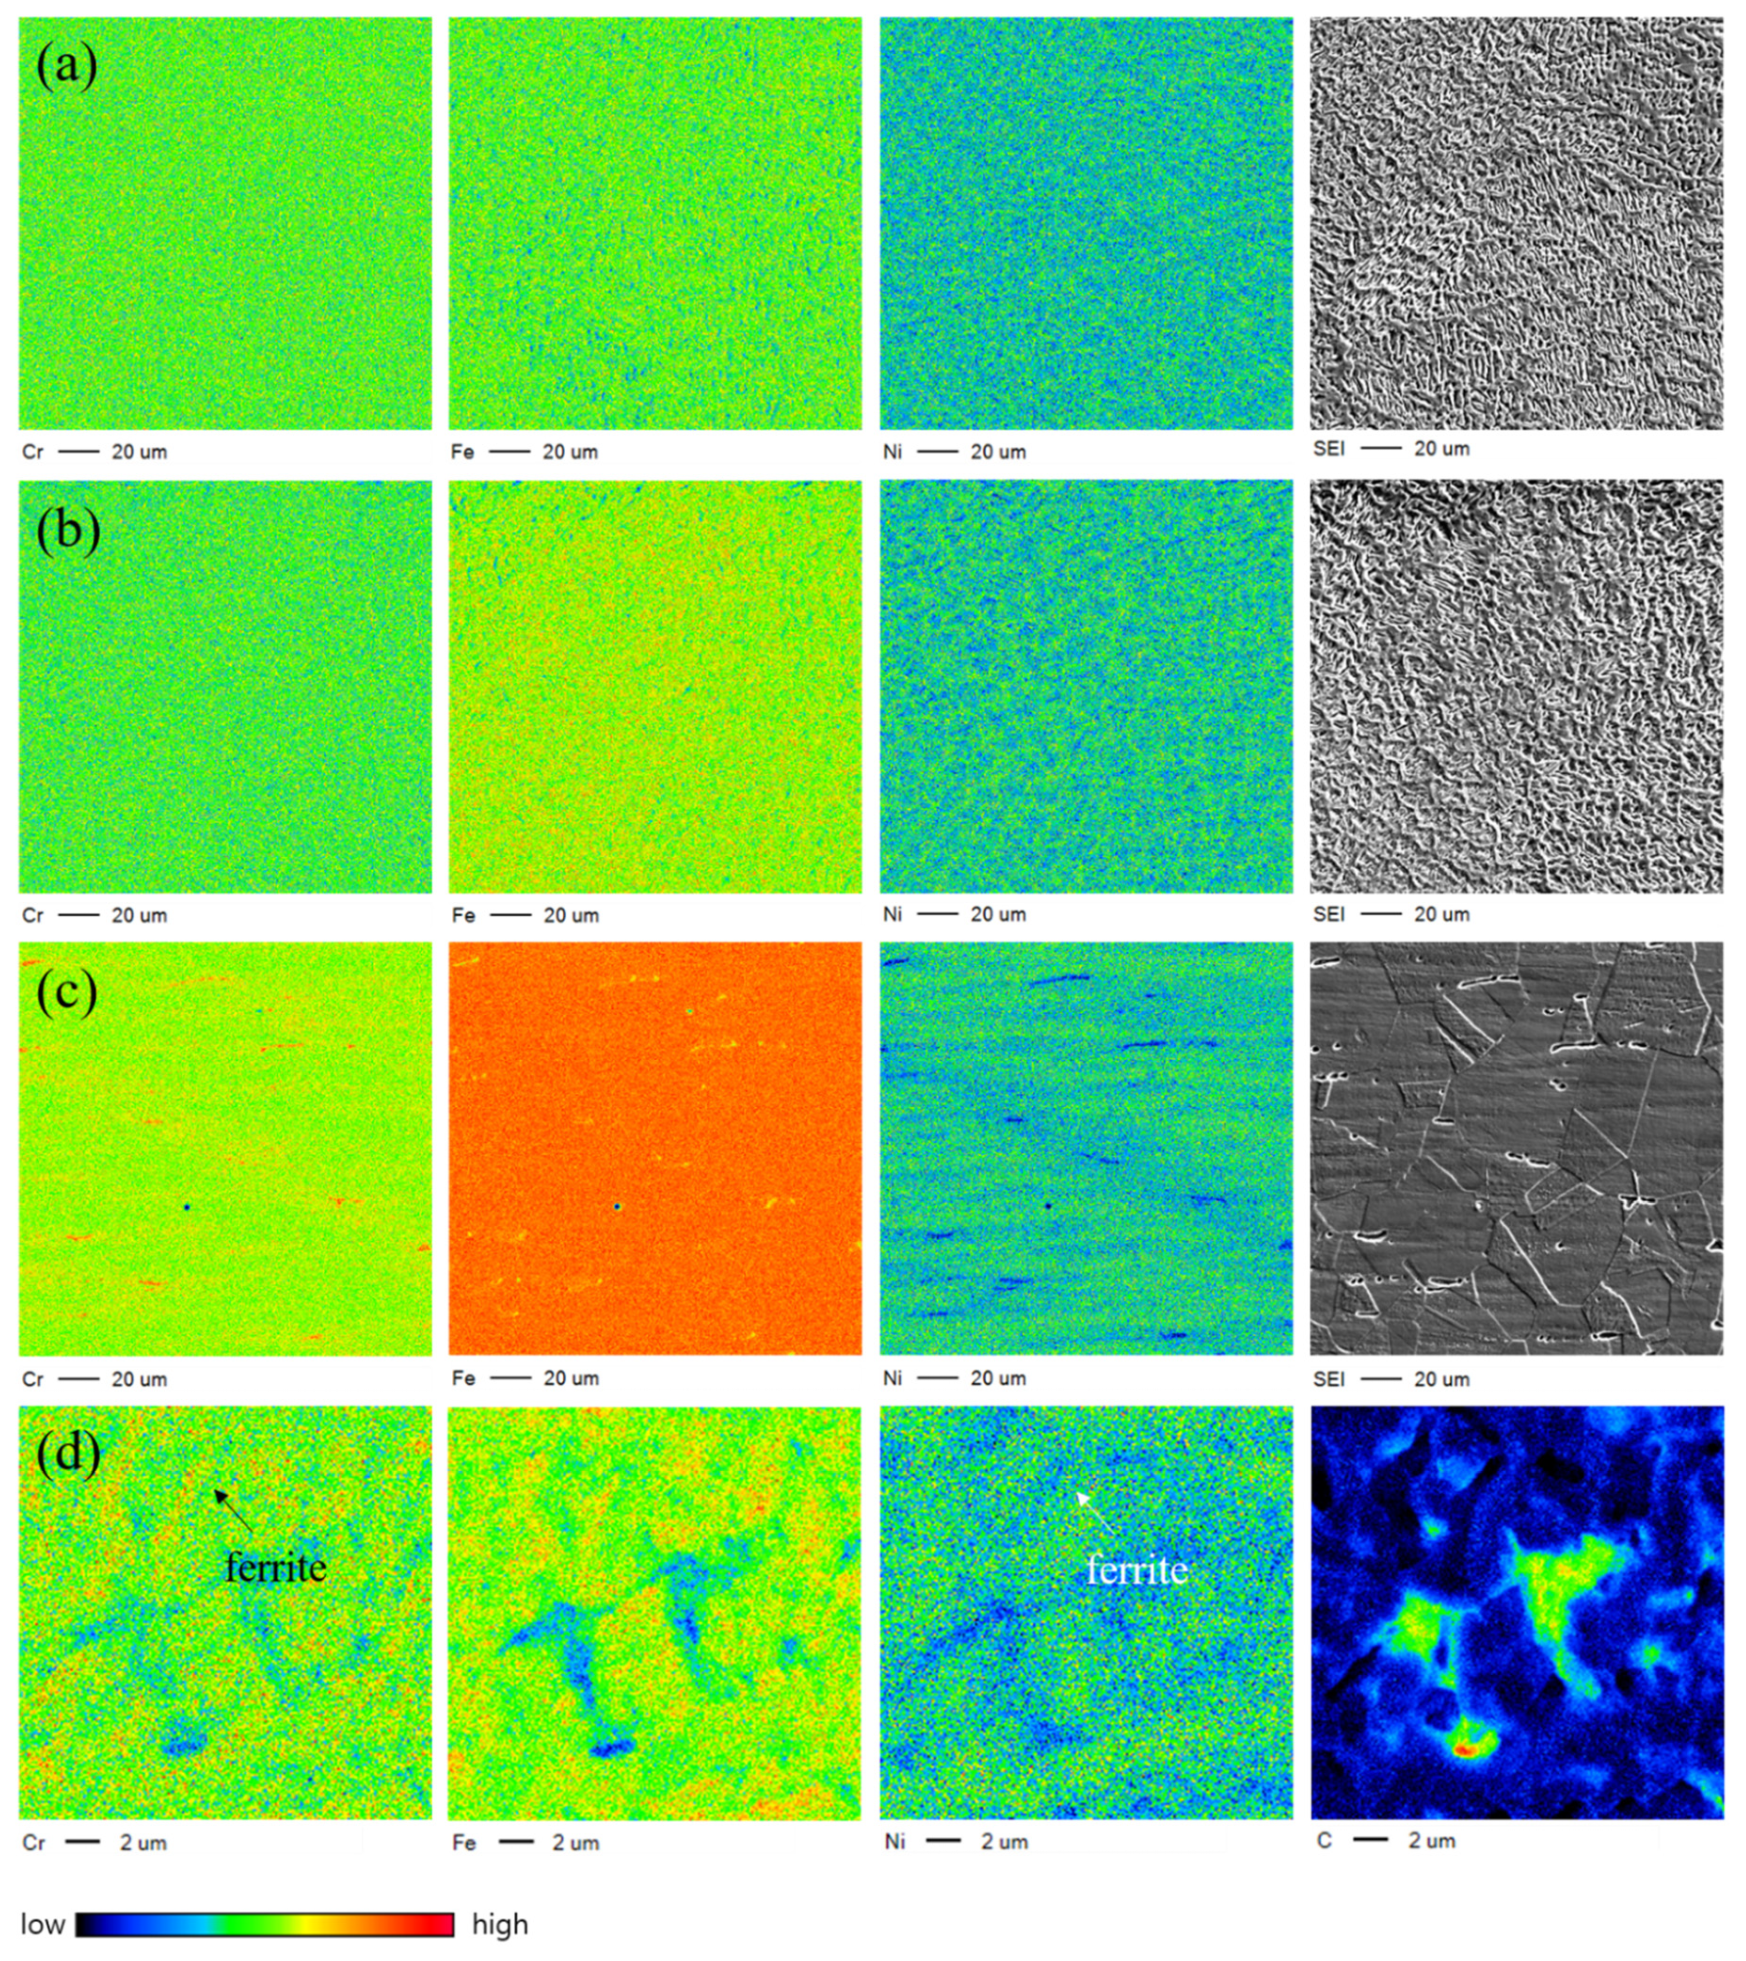
Figure 9 shows EPMA elemental distribution maps of the center of the weld and the base metal. In the maps of the base metal, hot-rolling strips corresponding to ferrite surrounded by Cr-carbides precipitated during hot rolling can be seen (Figure 9c). Cr-depleted regions formed in austenitic stainless steel, such as 304 SS, are known to be vulnerable to corrosion [35,36]. From the EPMA analysis illustrated in Figure 9a–c, no significant areas of localized Cr-carbide concentrations were found in the underwater and in-air weld zones, which contrasts with the base metal elemental distribution results (Figure 9c) that indicated the presence of Cr carbides around elongated ferrite crystals due to the hot rolling. Figure 9d highlights the microscale variation in elemental distributions of the UWLW specimen. In this figure, it is apparent that the Cr content of the ferrite phase was higher than that of the austenite phase, and the Ni content of the ferrite phase was lower than that of the austenite phase. This trend was more pronounced in the laser weld produced underwater with respect to that produced in air. As UWLW results in a higher dendrite density, Cr segregation locations are less sparse than those resulting from in-air welding [35]. Furthermore, the existence of micro-Cr carbide in the weld area of the specimen produced underwater was confirmed, and localized Cr depletion occurred within the same area. The nonuniform distribution of these elements can affect the corrosion resistance of the material.

3.2.4. Vickers Hardness

Figure 10 shows the microhardness across the weld area and beyond, and measurements indicated that the microhardness was highest for the welded area. This trend of microhardness showed typical microhardness characteristics of a welded area using a fiber laser [37]. Because of the fast cooling rate of the laser welding process, the microstructure of the fusion zone became finer than the base metal, and a higher microhardness value was obtained, which is attributed to the Hall–Petch formula [38,39]. In addition, the microhardness of the specimen prepared by UWLW was higher than that of the one prepared by in-air laser welding, which was due to the higher cooling rate compared with in-air laser welding, because of the cooling effect of the water. The microhardness of the fusion zone was observed to be high in both the specimen prepared via UWLW and that prepared via in-air laser welding, but was slightly higher in the former. This is considered to be the result of a combination of factors, such as grain refinement in the weld zone, an increase in the CSL boundary fraction, an increase in the dislocation density, and carbide formation [35,36,37,38].

3.3. Corrosion Characteristics of Weld Area

3.3.1. Potentiodynamic Polarization Corrosion Testing

Figure 11 shows the potentiodynamic anodic polarization curves measured in a 3.5% NaCl solution for specimens prepared via UWLW and in-air laser welding, and for the base metal. The corrosion potential (Ecorr) and corrosion current density (Icorr) can be determined from the polarization curves, and these are listed in Table 3. Figure 11a,b indicate similar electrochemical corrosion behavior (similar shapes of the polarization curves) for the two welds. From current density 10−9 A/cm2 to 10−7 A/cm2, a rapidly rising potential graph resulted from the partial remove of the passive film. The average values of the corrosion potential readings for the underwater weld, in-air weld, and base metal were approximately 0.066, −0.084, and −0.226 V (SCE), respectively. It can be seen that the weld region had a potential that was very different from that of the base material. In general, the higher the corrosion potential and the lower the corrosion current density, the greater the corrosion resistance. In this study, the average corrosion current density of the base material was found to be 0.68 μA/cm2, and the corrosion current densities of the water and in-air specimens were both less than 0.001 μA/cm2. In the electrochemical polarization behavior, the current density of the base material increased rapidly with the potential (Figure 11c), but in the case of the UWLW and in-air laser welding specimens (Figure 11a and Figure 11b, respectively), the current density did not show an increase up to the 0.5 V (SCE) potential value, and it exhibited passivation behavior. The corrosion rates calculated from the corrosion current densities of the specimens were <0.1 mm/year for the base metal and <0.01 mm/year for the in-air and underwater welds. These low values for the welds highlight their excellent electrochemical corrosion resistance. In addition, it should be noted that the electrochemical corrosion properties of the weld regions generated under in-air and UWLW conditions were similar.

3.3.2. Multiple Factors Govern Corrosion

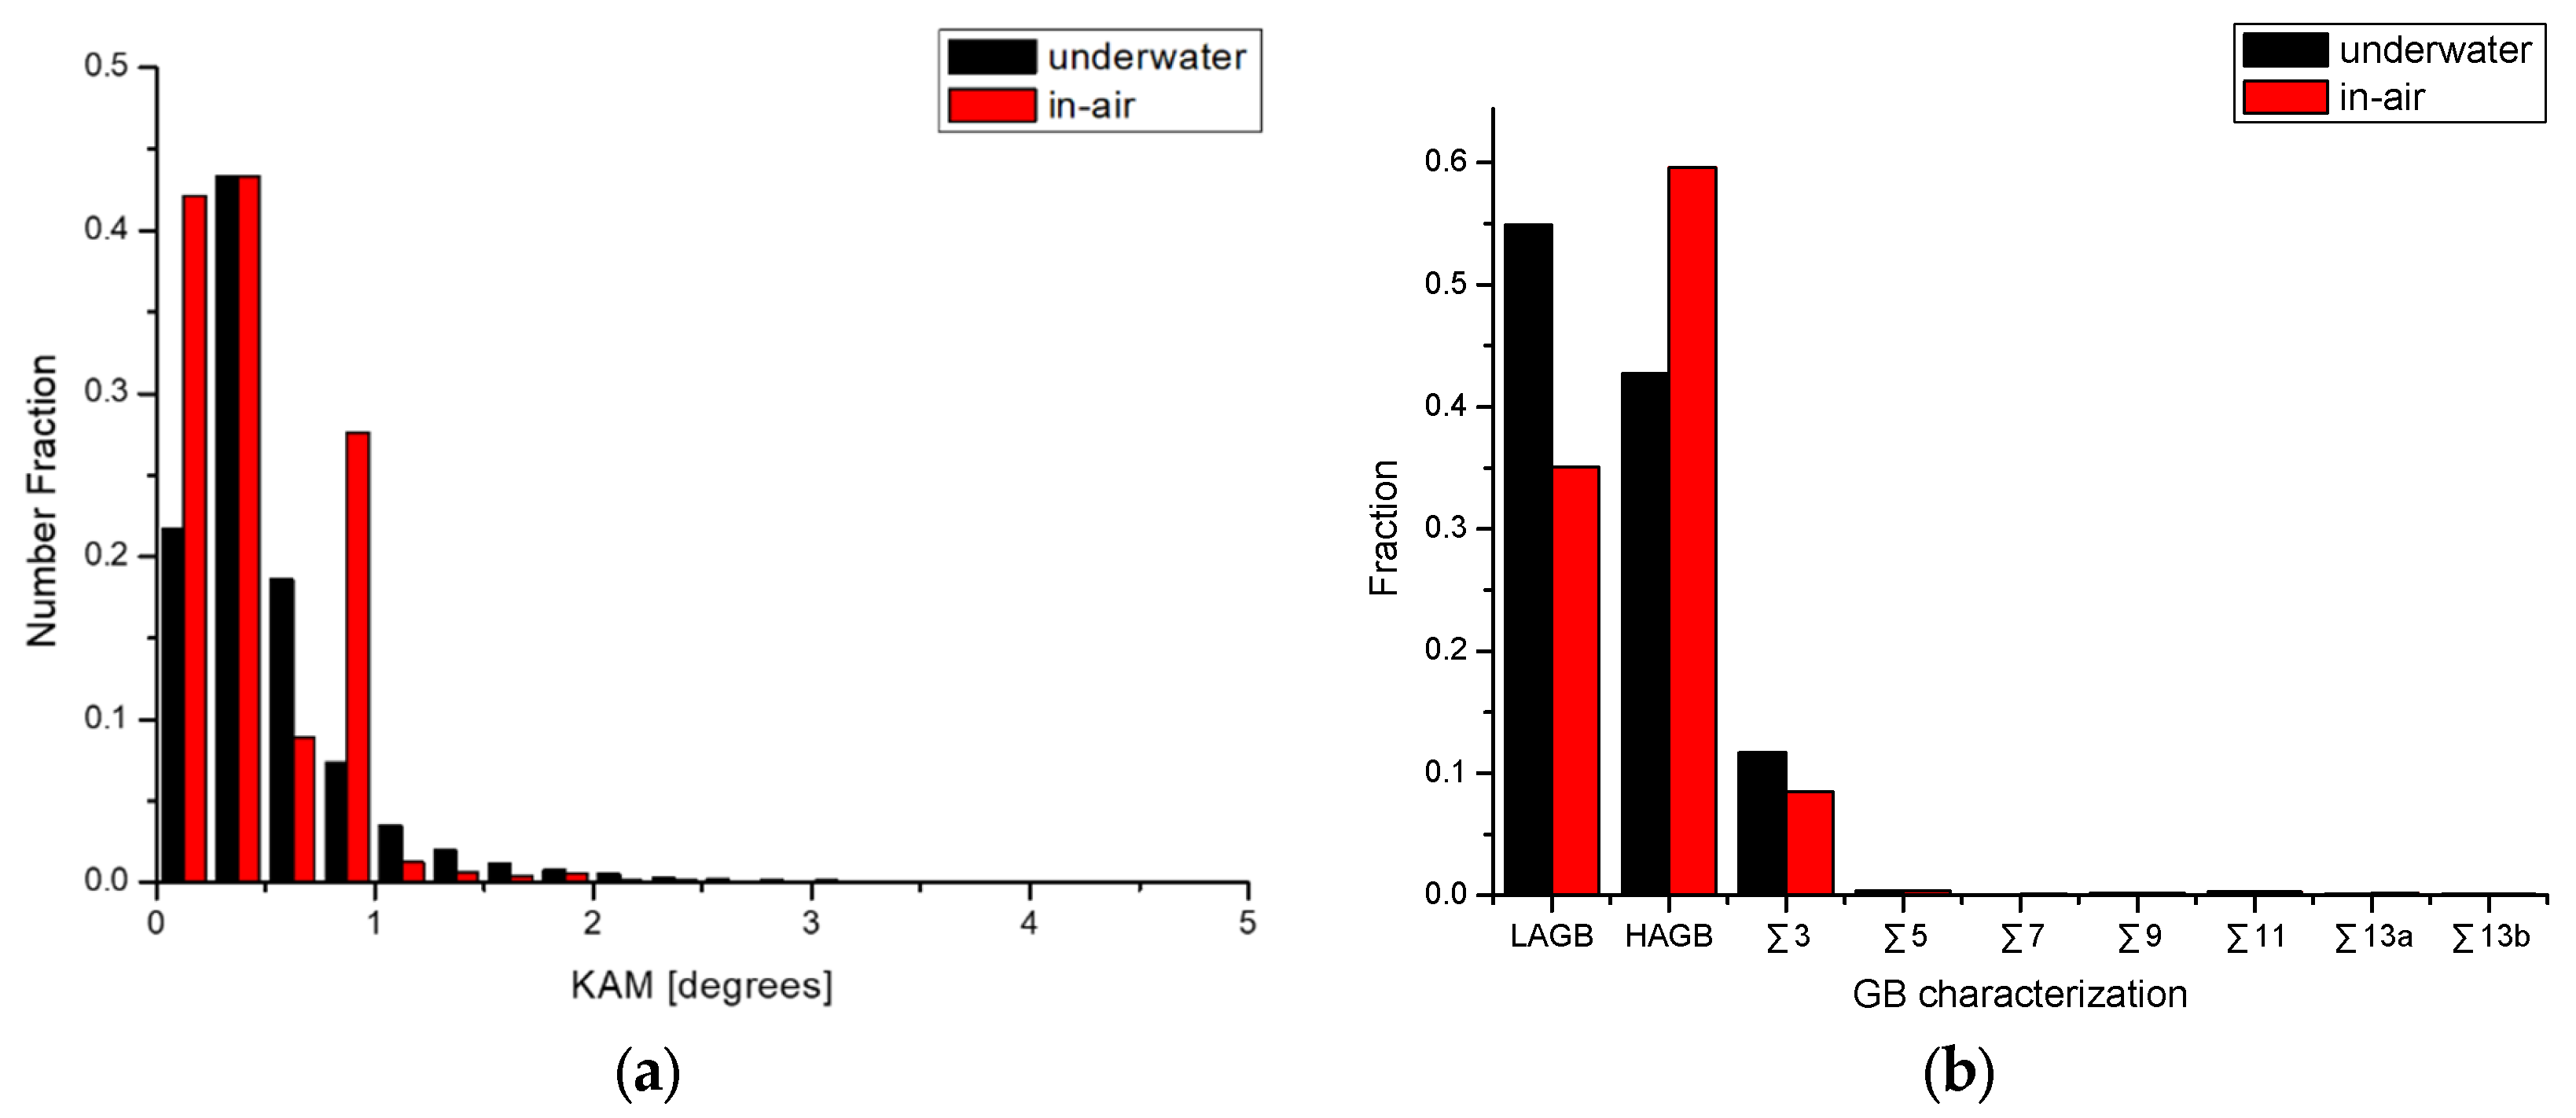
In this study, we investigated the correlation between corrosion and various factors that affect it for specimens prepared underwater and in air by laser welding. Figure 12 summarizes the KAM value and GB fractions of these specimens calculated from Figure 7 and Figure 8 using OIM software. As mentioned in Section 3.2.2, residual stress and deformation occurring in the weld area are important factors that reduce fatigue strength and cause corrosion [31]. The KAM values of the UWLW-prepared specimen were observed to be higher than those of the in-air laser welding-prepared specimen (Figure 12a). Therefore, it can be predicted that UWLW produces a higher strain rate than in-air laser welding, resulting in greater vulnerability to corrosion. In addition, the precipitates generated during the welding process also increased the corrodibility of the steel. As mentioned in Section 3.2.3, localized chromium carbide precipitation or chromium depletion inside the weld renders the material susceptible to corrosion. As shown in Figure 9, the underwater weld specimen exhibited slightly greater localized chromium carbide precipitation and chromium depletion phenomena compared with the in-air welded specimen, so it could be vulnerable to corrosion. Figure 12b shows the fractions of HAGBs, LAGBs, and CSL boundaries present in the two welds. It can be seen that in the specimen prepared by UWLW, the relative amounts of LAGBs and ∑3 boundaries, which are known to be correlated with strong corrosion resistance, were higher. However, in the in-air weld specimen, the proportion of HAGBs, which are associated with vulnerability to corrosion, was found to be greater. Therefore, contrary to our original expectations based on the existence of precipitates and the residual stress evaluation, it can be seen that UWLW produced strong corrosion resistance similar to that offered by air welding. Thus, we suggest that among the various factors that affect corrosion, the GB characteristics have the greatest influence.
To summarize, corrosion is dominated by a combination of factors, such as welding residual stress, GB size, precipitates in the grains, and GB characteristics. Among these factors, the GB properties are the most critical for determining the corrosion potential. Our results indicate that the UWLW process used in this work has potential as a technology for the maintenance and repair of structures in underwater environments. Laser welding is typically characterized by a swift cooling rate, and hence the HAZ is narrow. Therefore, in this study, the HAZ was not considered, and the corrosion tests were performed only on the welded zone. Further research on the HAZ should be carried out in the future. In addition, the study reported herein was focused on planar observations and a characterization of weld zones. Corrosion is a phenomenon that is not limited to a single plane but occurs in three dimensions. Therefore, additional research and three-dimensional investigation may be necessary to thoroughly understand the influences of the various factors on corrosion in the weld area.

4. Conclusions

In the present study, a bead-on-plate laser welding of 304 SS was performed underwater and in air using a custom-designed nozzle. Detailed microstructural analyses based on OM, SEM, EBSD, EMPA, and microhardness allowed us to compare and contrast the phases within the specimens prepared via UWLW and in-air laser welding. From these results, the correlation between corrosion and various factors affecting it was investigated. Importantly, although some differences were seen, the weld morphology and microstructures were similar. The principal conclusions are summarized below.
(1)
Using both UWLW and in-air laser welding processes, welded regions with no defects were obtained when 2 kW of laser power was used and both specimens consisted of lathy and skeletal ferrites in the center of the weld area. In particular, UWLW was characterized by the formation of fine ferrite with remarkably high microhardness because of the higher cooling rate for the process. The welding width generated during the UWLW was 3.82 mm due to the steep thermal gradient, which was narrower than that generated in air (4.8 mm).
(2)
The specimen prepared via UWLW had high residual stress because of the high cooling rate. It had a LAGB ratio approximately 1.5 times higher and a HAGB ratio approximately 0.6 times less than those of the specimen prepared via in-air laser welding. In particular, for UWLW, the fraction of the ∑3 boundaries was increased remarkably, by approximately 20%, compared with the in-air laser-welded specimen.
(3)
The UWLW specimen had a higher residual stress and relatively frequent micro-Cr carbide in the weld area than the in-air laser-welded specimen, and it was expected to be susceptible to corrosion. However, there was no significant difference between the corrosion rate of both welded specimens. It resulted from the small average grain size and excellent GB characteristic of UWLW. Corrosion was not determined by a single factor. Welding residual stress, GB size, precipitates in the grains, and GB characteristics were factors that had complex effects on the corrodibility of the welded part. However, among these factors, the GB properties were shown to have the greatest impact in our corrosion studies.

Author Contributions

Conceptualization, D.S. (Danbi Song) and S.-J.L.; methodology, D.S.(Danbi Song); software, D.S. (Danbi Song); validation, D.S. (Danbi Song), S.-J.L. and J.C.; formal analysis, D.S. (Danbi Song); investigation, D.S. (Danbi Song) and J.C.; resources D.S. (Danbi Song); data curation, D.S. (Danbi Song) and. J.C.; writing—original draft preparation, D.S. (Danbi Song); writing—review and editing, D.S. (Danbi Song), S.-J.L.; visualization, D.S. (Danbi Song); supervision, D.S. (Dongsig Shin); project administration, D.S. (Dongsig Shin); funding acquisition, D.S. (Dongsig Shin) All authors have read and agreed to the published version of the manuscript.

Funding

This work was supported by the National Research Council of Science and Technology, Republic of Korea (grant numbers NK232A, 2021); and the National Research Council of Science and Technology, Republic of Korea (grant numbers NK238A, 2022).

Data Availability Statement

The raw/processed data required to reproduce these findings cannot be shared at this time as the data also form part of an ongoing study.

Conflicts of Interest

The authors declare that they have no known competing financial interests or personal relationships that could have appeared to influence the work reported in this paper.

References

  1. Yamashita, Y.; Kawano, T.; Mann, K. Underwater laser welding by 4 kW CW YAG laser. J. Nucl. Sci. Technol. 2001, 38, 891–895. [Google Scholar] [CrossRef]
  2. Gao, H.; Jiao, X.; Zhou, C.; Shen, Q.; Yu, Y. Study on remote control underwater welding technology applied in nuclear power station. Procedia Eng. 2011, 5, 4988–4993. [Google Scholar] [CrossRef] [Green Version]
  3. Wang, J.; Sun, Q.; Zhang, T. Analysis and improvement of underwater wet welding process stability with static mechanical constraint support. J. Manuf. Processes 2018, 34, 238–250. [Google Scholar] [CrossRef]
  4. Zhang, X.; Chen, W.; Ashida, E.; Matsuda, F. Relationship between weld quality and optical emissions in underwater Nd: YAG laser welding. Opt. Lasers Eng. 2004, 41, 717–730. [Google Scholar] [CrossRef]
  5. Han, L.; Wu, X.; Chen, G.; Wang, Z.; Fan, W. Local dry underwater welding of 304 stainless steel based on a microdrain cover. J. Mater. Process. Technol. 2019, 268, 47–53. [Google Scholar] [CrossRef]
  6. Xiong, J.; Yang, X.; Lin, W.; Liu, K. Microstructural characteristics and mechanical heterogeneity of underwater wet friction taper plug welded joints for low-alloy pipeline steel. Mater. Sci. Eng. A 2017, 695, 279–290. [Google Scholar] [CrossRef]
  7. Chen, B.; Tan, C.; Feng, J. A study on the arc characteristics of underwater wet welding process. Int. J. Adv. Manuf. Technol. 2016, 86, 557–564. [Google Scholar] [CrossRef]
  8. Swierczynska, A.; Fydrych, D.; Rogalski, G. Diffusible hydrogen management in underwater wet self-shielded flux cored arc welding. Int. J. Hydro. Ener. 2017, 42, 24532–24540. [Google Scholar] [CrossRef]
  9. Cui, L.; Yang, X.; Wang, D.; Hou, X.; Cao, J.; Xu, W. Friction taper plug welding for S355 steel in underwater wet conditions: Welding performance, microstructures and mechanical properties. Mater. Sci. Eng. A 2014, 611, 15–28. [Google Scholar] [CrossRef]
  10. Guo, N.; Xing, X.; Zhao, H.; Tan, C.; Feng, J.; Deng, Z. Effect of water depth on weld quality and welding process in underwater fiber laser welding. Mater. Des. 2017, 115, 112–120. [Google Scholar] [CrossRef]
  11. Fu, Y.; Guo, N.; Cheng, Q.; Zhang, D.; Feng, J. Underwater laser welding for 304 stainless steel with filler wire. J. Mater. Res. Technol. 2020, 9, 15648–15661. [Google Scholar] [CrossRef]
  12. Wang, K.; Shao, C.; Jiao, X.; Zhu, J.; Cai, Z.; Li, C. Investigation on microstructure and properties of duplex stainless steel welds by underwater laser welding with different shielding gas. Materials 2021, 14, 4744. [Google Scholar] [CrossRef] [PubMed]
  13. Guo, N.; Fu, Y.; Xing, X.; Liu, Y.; Zhao, S.; Feng, J. Underwater local dry cavity laser welding of 304 stainless steel. J. Mater. Process. Technol. 2018, 260, 146–155. [Google Scholar] [CrossRef]
  14. Guo, N.; Cheng, Q.; Zhang, X.; Fu, Y.; Huang, L. Microstructure and mechanical properties of underwater laser welding of titanium. Materials 2019, 12, 2703. [Google Scholar] [CrossRef] [Green Version]
  15. ASM. Handbook: Metallography and Microstructure; ASM International Materials Park: Russell Township, OH, USA, 2004; Volume 9, pp. 1047–1053. [Google Scholar]
  16. Mitra, S.; Arora, K.S.; Bhattacharya, B.; Singh, S.B. Effect of welding speed on the prediction accuracy of residual stress in laser welded 1.2 mm thick dual phase steel. Lasers Manuf. Mater. Process. 2020, 7, 74–87. [Google Scholar] [CrossRef]
  17. Guo, Y.; Han, E.-H.; Wang, J. Effects of forging and heat treatments on the microstructure and oxidation behavior of 316LN stainless steel in high temperature water. J. Mater. Sci. Technol. 2015, 31, 403–412. [Google Scholar] [CrossRef]
  18. Hou, J.; Peng, Q.J.; Shoji, T.; Wang, J.Q.; Han, E.-H.; Ke, W. Effects of cold working path on strain concentration, grain boundary microstructure and stress corrosion cracking in Alloy 600. Corros. Sci. 2011, 53, 2956–2962. [Google Scholar] [CrossRef]
  19. Song, D.; Kim, S.W.; Hwang, S.S.; Kim, D.J.; Lee, C.H. In situ investigation of intergranular stress corrosion cracking initiation and coalescence and effects of geometric and microstructural characteristics. Corrosion 2018, 74, 1385–1394. [Google Scholar] [CrossRef]
  20. Zhong, W.; Lin, J.-L.; Chen, Y.; Li, Z.; An, K.; Sutton, B.J.; Heuser, B.J. Microstructure, hardness, and residual stress of the dissimilar metal weldments of SA508-309L/308L–304L. Met. Mater. Trans. A 2021, 52, 1927–1928. [Google Scholar] [CrossRef]
  21. Xu, C.; Zhang, Y.; Liu, W.; Jin, Y.; Wen, L.; Sun, D. Influence of laser-welding on microstructure and corrosion properties of twinning-induced plasticity (TWIP) steel. Materials 2020, 13, 4315. [Google Scholar] [CrossRef]
  22. Randle, V. Twinning-related grain boundary engineering. Acta Mater. 2004, 52, 4067–4081. [Google Scholar] [CrossRef]
  23. Watanabe, T. The importance of grain boundary character distribution (GBCD) to recrystallization, grain growth and texture. Scr. Met. Mater. 1992, 27, 1497–1502. [Google Scholar] [CrossRef]
  24. Liu, T.; Bai, Q.; Ru, X.; Xia, S.; Zhong, X.; Lu, Y.; Shoji, T. Grain boundary engineering for improving stress corrosion cracking of 304 stainless steel. Mater. Sci. Technol. 2019, 35, 477–487. [Google Scholar] [CrossRef]
  25. ISO 17475:2005; Corrosion of metals and alloys—Electrochemical test methods—Guidelines for conducting potentiostatic and potentiodynamic polarization measurements. International Organization for Standardization: Geneva, Switzerland, 2005.
  26. Gertsman, V.Y.; Bruemme, S.M. Study of grain boundary character along intergranular stress corrosion crack paths in austenitic alloys. Acta Mater. 2001, 49, 1589–1598. [Google Scholar] [CrossRef]
  27. Raja, V.S.; Shoji, T. Stress Corrosion Cracking: Theory and Practice; Woodhead Publishing: Cambridge, UK, 2011; pp. 427–484. [Google Scholar]
  28. HSoltani, M.; Taye, M. Comparative study of AISI 304L stainless steels joints by TIG and Nd:YAG laser welding. J. Alloys Compd. 2018, 767, 112–121. [Google Scholar] [CrossRef]
  29. Li, K.; Li, D.; Liu, D.; Pei, G.; Sun, L. Microstructure evolution and mechanical properties of multiple-layer laser cladding coating of 308L stainless steel. Appl. Surf. Sci. 2015, 340, 143–153. [Google Scholar] [CrossRef]
  30. Rama, G.D.J.; Reddy, A.V.; Rao, K.P.; Reddy, G.M.; Sundar, J.K.S. Microstructure and tensile properties of Inconel 718 pulsed Nd-YAG laser welds. J. Mater. Process. Technol. 2005, 167, 73–82. [Google Scholar] [CrossRef]
  31. Lu, B.T.; Chen, Z.K.; Luo, J.L.; Patchett, B.M.; Xu, Z.H. Pitting and stress corrosion cracking behavior in welded austenitic stainless steel. Electrochim. Acta 2005, 50, 1391–1403. [Google Scholar] [CrossRef]
  32. Unnikrishnan, R.; Idury, K.S.N.S.; Ismaila, T.P.; Bhadauria, A.; Shekhawat, S.K.; Khatirkar, K.R.; Sapate, S.G. Effect of heat input on the microstructure, residual stresses and corrosion resistance of 304L austenitic stainless steel weldments. Mater. Charact. 2014, 93, 10–23. [Google Scholar] [CrossRef]
  33. Qi, J.; Huang, B.; Wang, Z.; Ding, H.; Xi, J.; Fu, W. Dependence of corrosion resistance on grain boundary characteristics in a high nitrogen CrMn austenitic stainless steel. J. Mater. Sci. Technol. 2017, 33, 1621–1628. [Google Scholar] [CrossRef]
  34. Tan, L.; Sridharan, K.; Allen, T.R.; Nanstad, R.K.; McClintock, D.A. Microstructure tailoring for property improvements by grain boundary engineering. J. Nucl. Mater. 2008, 374, 270–280. [Google Scholar] [CrossRef]
  35. Cheng, M.; He, P.; Lei, L.; Tan, X.; Wang, X.; Sun, Y.; Li, J.; Jiang, Y. Comparative studies on microstructure evolution and corrosion resistance of 304 and a newly developed high Mn and N austenitic stainless steel welded joints. Corros. Sci. 2021, 183, 109338. [Google Scholar] [CrossRef]
  36. Fu, Z.H.; Gou, G.Q.; Zhu, Z.Y.; Ma, C.P.; Yang, W.Q.; Zhang, L.L.; Hu, Y.C.; Gao, W. Stress corrosion cracking behavior of SUS301L-MT stainless steel laser-archybrid welded joints. Corros. Sci. 2018, 143, 23–30. [Google Scholar] [CrossRef]
  37. Zhang, L.; Lu, J.Z.; Luo, K.Y.; Feng, A.X.; Dai, F.Z.; Zhong, J.S.; Luo, M.; Zhang, Y.K. Residual stress, micro-hardness and tensile properties of ANSI 304 stainless steel thick sheet by fiber laser welding. Mater. Sci. Eng. A 2013, 561, 136–144. [Google Scholar] [CrossRef]
  38. Cui, C.Y.; Cui, X.G.; Ren, X.D.; Liu, T.T.; Hu, J.D.; Wang, Y.M. Microstructure and microhardness of fiber laser butt welded joint of stainless steel plates. Mater. Des. 2013, 49, 761–765. [Google Scholar] [CrossRef]
  39. Yang, Z.; Zhu, L.; Wang, S.; Ning, J.; Dun, Y.; Meng, G.; Xue, P.; Xu, P.; Xin, B. Effects of ultrasound on multilayer forming mechanism of Inconel 718 in directed energy deposition. Addit. Manuf. 2021, 48, 102462. [Google Scholar] [CrossRef]
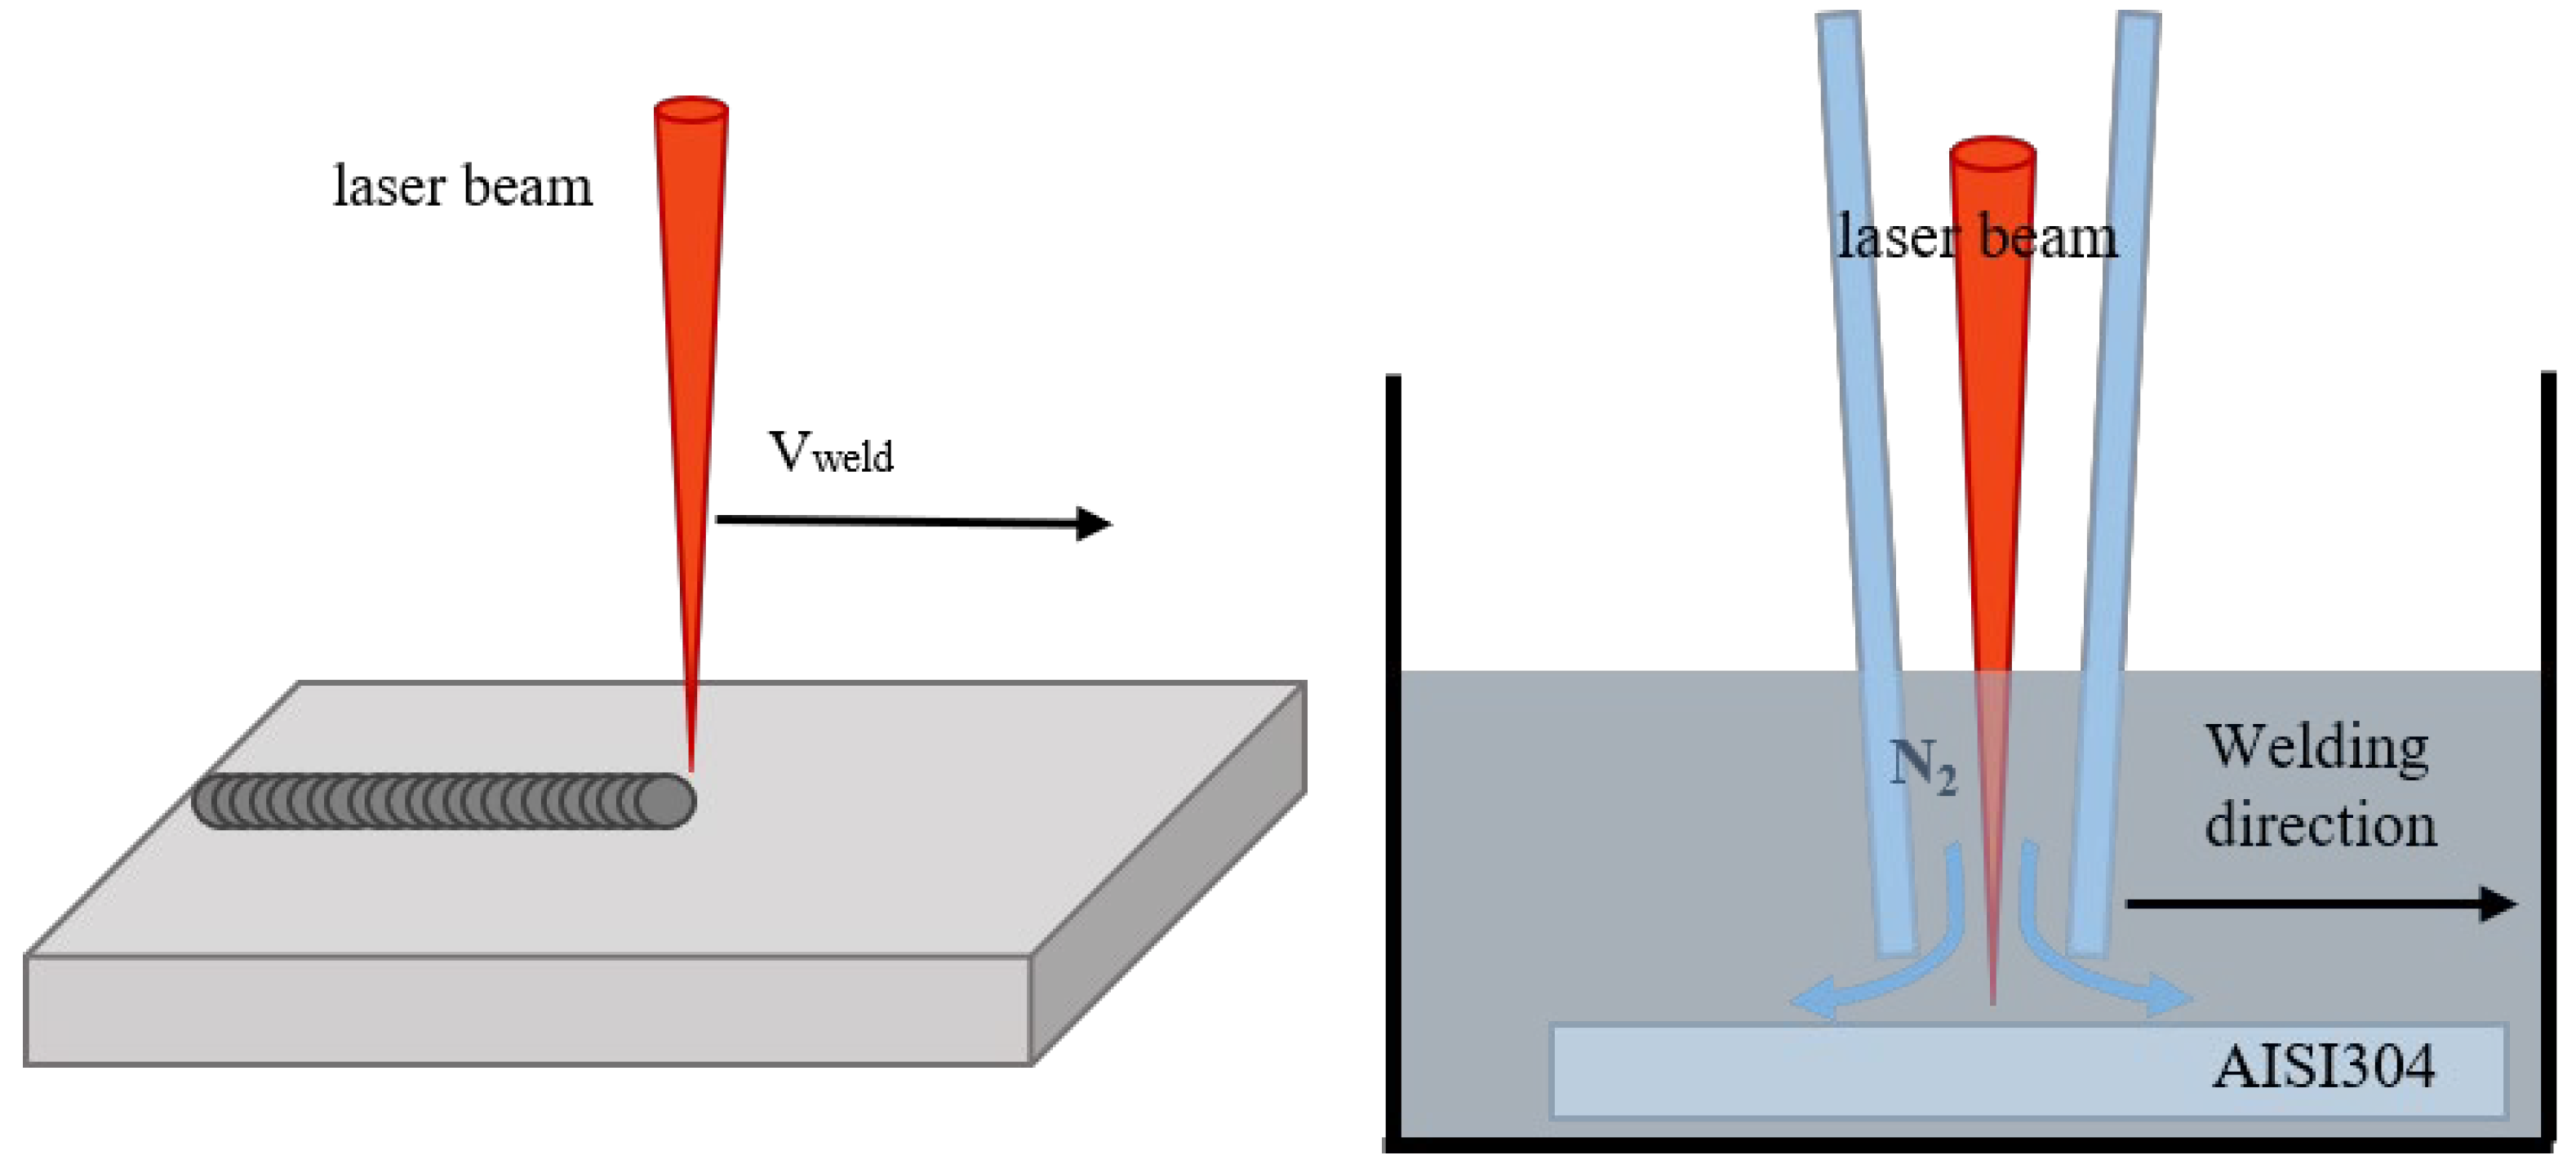
Figure 1. Schematic illustrations of local dry underwater laser welding process.
Metals 12 01904 g001
Figure 2. Schematic of local dry underwater laser welding experiment setup.
Metals 12 01904 g002
Figure 3. Photographs and X-ray images of specimens welded underwater and in air using different laser powers: (a) 2 kW, (b) 4 kW, and (c) 6 kW (all underwater); (d) 2 kW, (e) 4 kW, and (f) 6 kW (all in air).
Metals 12 01904 g003
Figure 4. Optical micrographs showing microstructure in weld area cross section for specimen prepared via in-air laser welding with laser power of 2 kW. The three right-most panels show expanded views of areas outlined by dashed red lines in the left-most panel. (a) enlarged a, (b) enlarged b, (c) enlarged c.
Metals 12 01904 g004
Figure 5. Optical micrographs showing microstructure in weld area cross section for specimen prepared via underwater laser welding with a laser power of 2 kW. The three right-most panels show expanded views of areas outlined by dashed red lines in the left-most panel. (a) enlarged a, (b) enlarged b, (c) enlarged c.
Metals 12 01904 g005
Figure 6. Scanning electron microscopy images showing expanded views of microstructure in cross sections of the center of weld zones in (a) in-air laser-welded specimen and (b) underwater laser-welded specimen.
Metals 12 01904 g006
Figure 7. Electron backscatter diffraction maps of an area in the center of the weld bead (see red dashed outlines in micrographs shown left): (a) kernel average misorientation (KAM) map, (b) inverse pole figure (IPF), and (c) grain boundary (GB) character map for specimen prepared by underwater laser welding; and (d) KAM map, (e) IPF, and (f) GB character map for specimen prepared by in-air laser welding.
Metals 12 01904 g007
Figure 8. Detailed grain boundary character maps showing the center of the weld bead in the (a) underwater laser weld specimen and (b) in-air laser weld specimen.
Metals 12 01904 g008
Figure 9. Elemental distributions (Cr, Fe, and Ni, at far left, center left, and center right, respectively) and scanning electron microscopic image (far right) obtained via electron probe microanalysis for specimens prepared by (a) underwater laser welding, (b) in-air laser welding, and (c) for the base metal; (d) expanded views of (a) highlighting an area of Cr depletion.
Metals 12 01904 g009
Figure 10. Vickers microhardness of specimens prepared by underwater laser welding and in−air laser welding.
Metals 12 01904 g010
Figure 11. Potentiodynamic anodic polarization curves for (a) underwater laser weld, (b) in−air laser weld, and (c) base metal specimens.
Metals 12 01904 g011
Figure 12. (a) Kernel average misorientation values and (b) grain boundary fractions in specimens prepared by underwater laser welding and in-air laser welding.
Metals 12 01904 g012
Table 1. Chemical composition of 304 stainless steel specimens (wt.%).
AlloyNiCrSSiMnCPFe
304 SS8180.030.10.20.080.045Bal.
Table 2. Welding parameters.
Specimen No.Laser Power
(kW)
Shielding Gas
Pressure
(Bar)
Welding
Speed
(mm/s)
Defocus
Distance
(mm)
Welding
Condition
1250.50Underwater
2450.50Underwater
3650.50Underwater
R1250.50In air
R2450.50In air
R3650.50In air
Table 3. Electrochemical data obtained from measured potentiodynamic anodic polarization curves of specimens in 3.5% NaCl solution at 25 °C.
SpecimenEcorr (V, SCE)Icorr (μA/cm3)Corrosion
(mm/Year)
Base
Metal
No.1−0.2370.7480.01
No.2−0.2150.6130.01
Average−0.2260.6800.01
In airNo.10.1200.0010.00
No.20.0120.0010.00
Average0.0660.0010.00
UnderwaterNo.1−0.0670.0000.00
No.2−0.1010.0010.00
Average−0.0840.0010.00
Publisher’s Note: MDPI stays neutral with regard to jurisdictional claims in published maps and institutional affiliations.