
Advanced Design of Block Shear Failure


Abstract
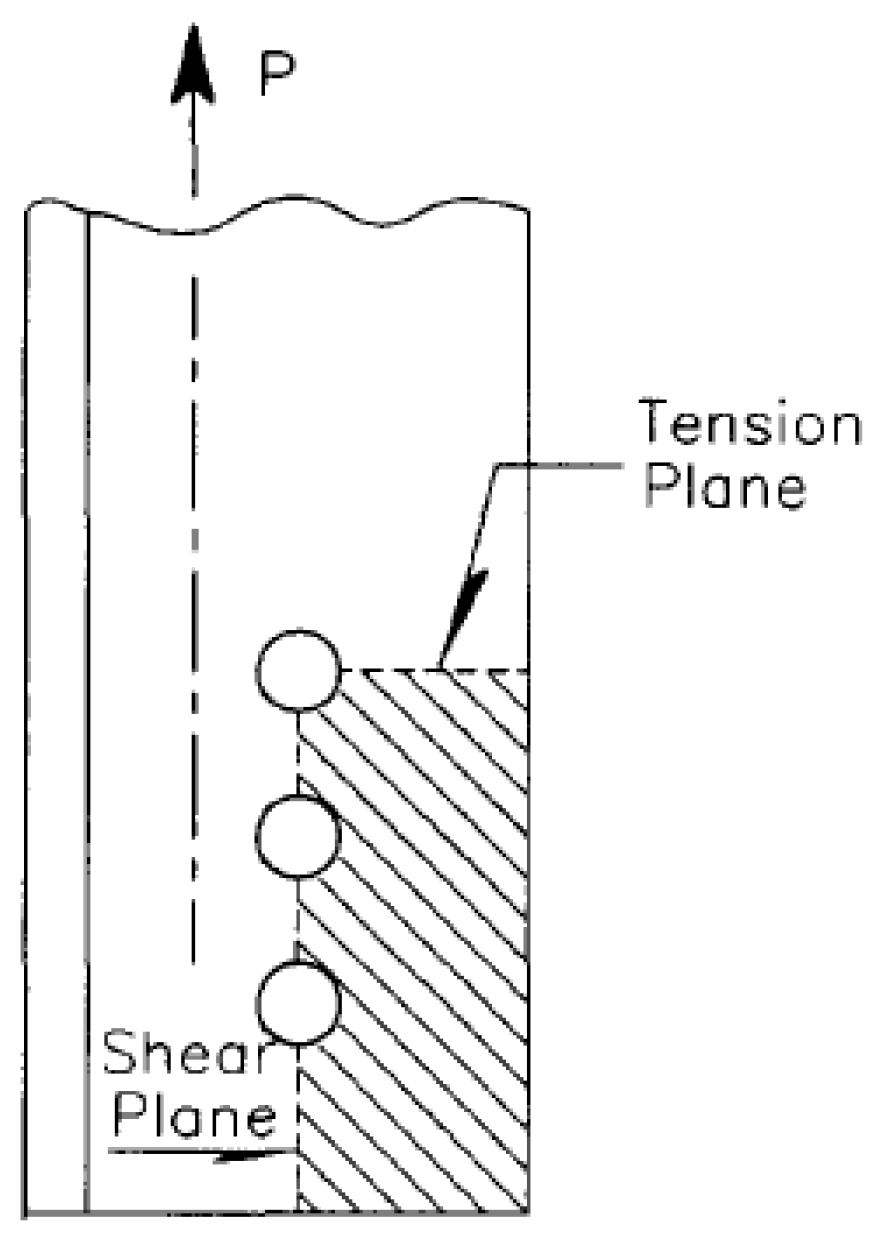
:1. Introduction
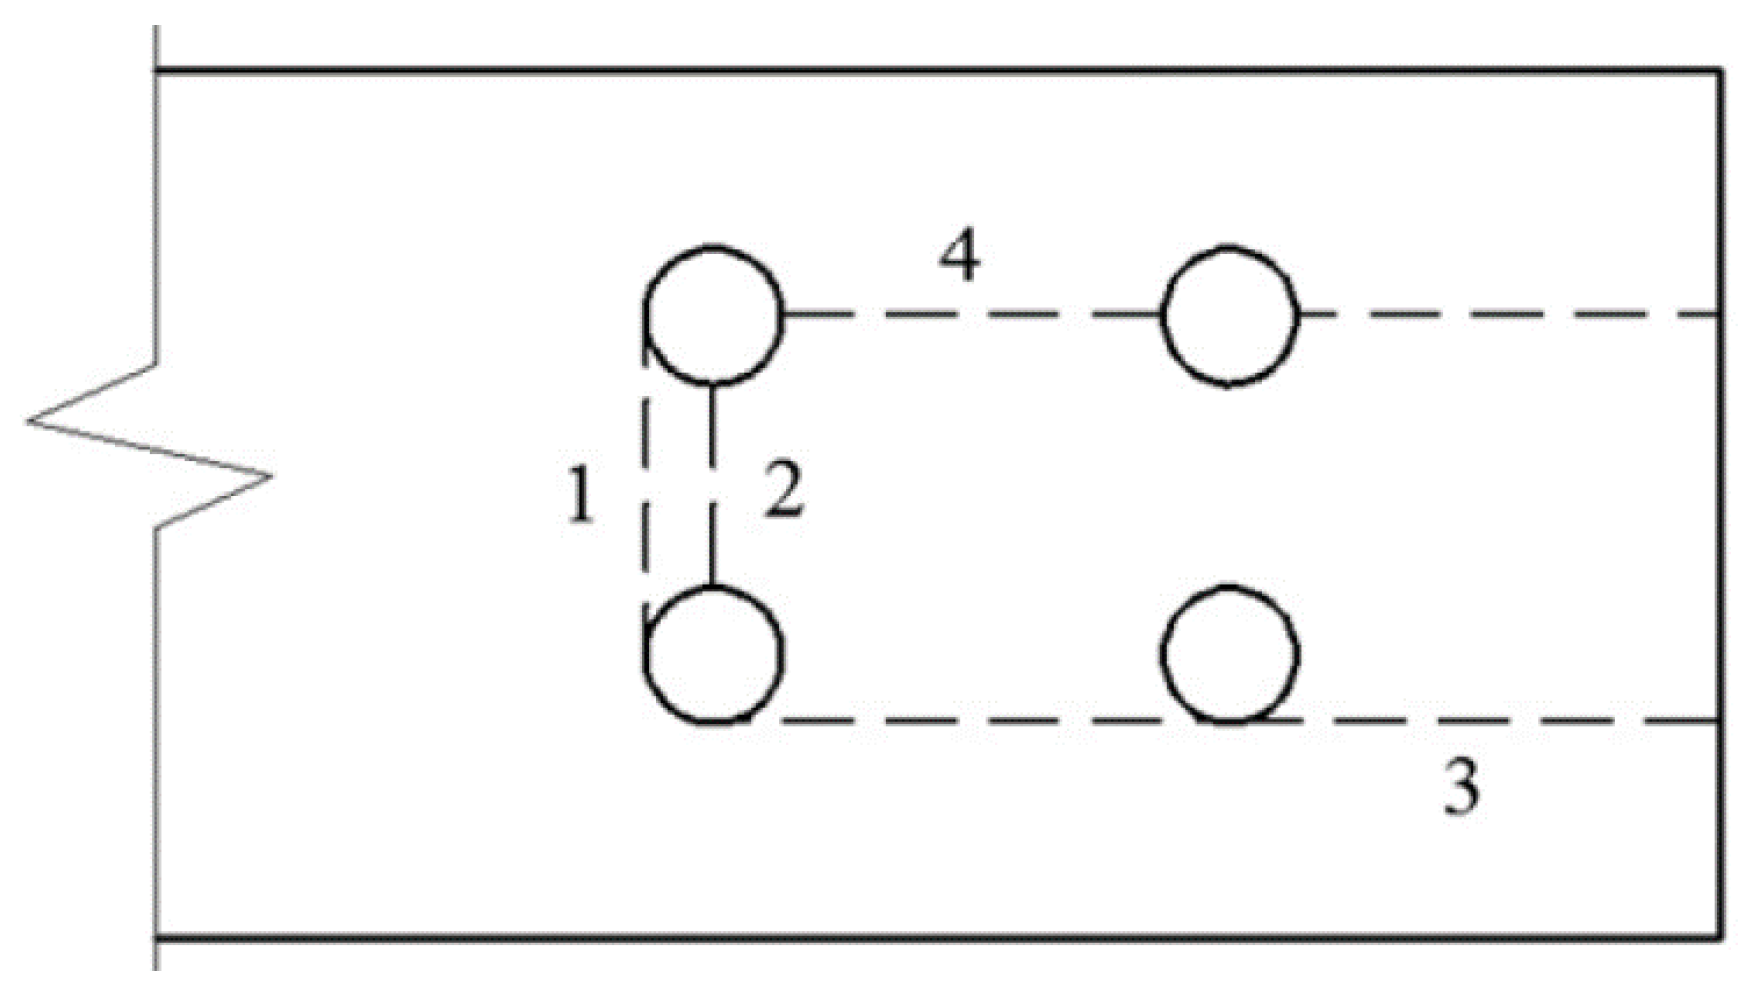
2. Analytical Models for Resistance
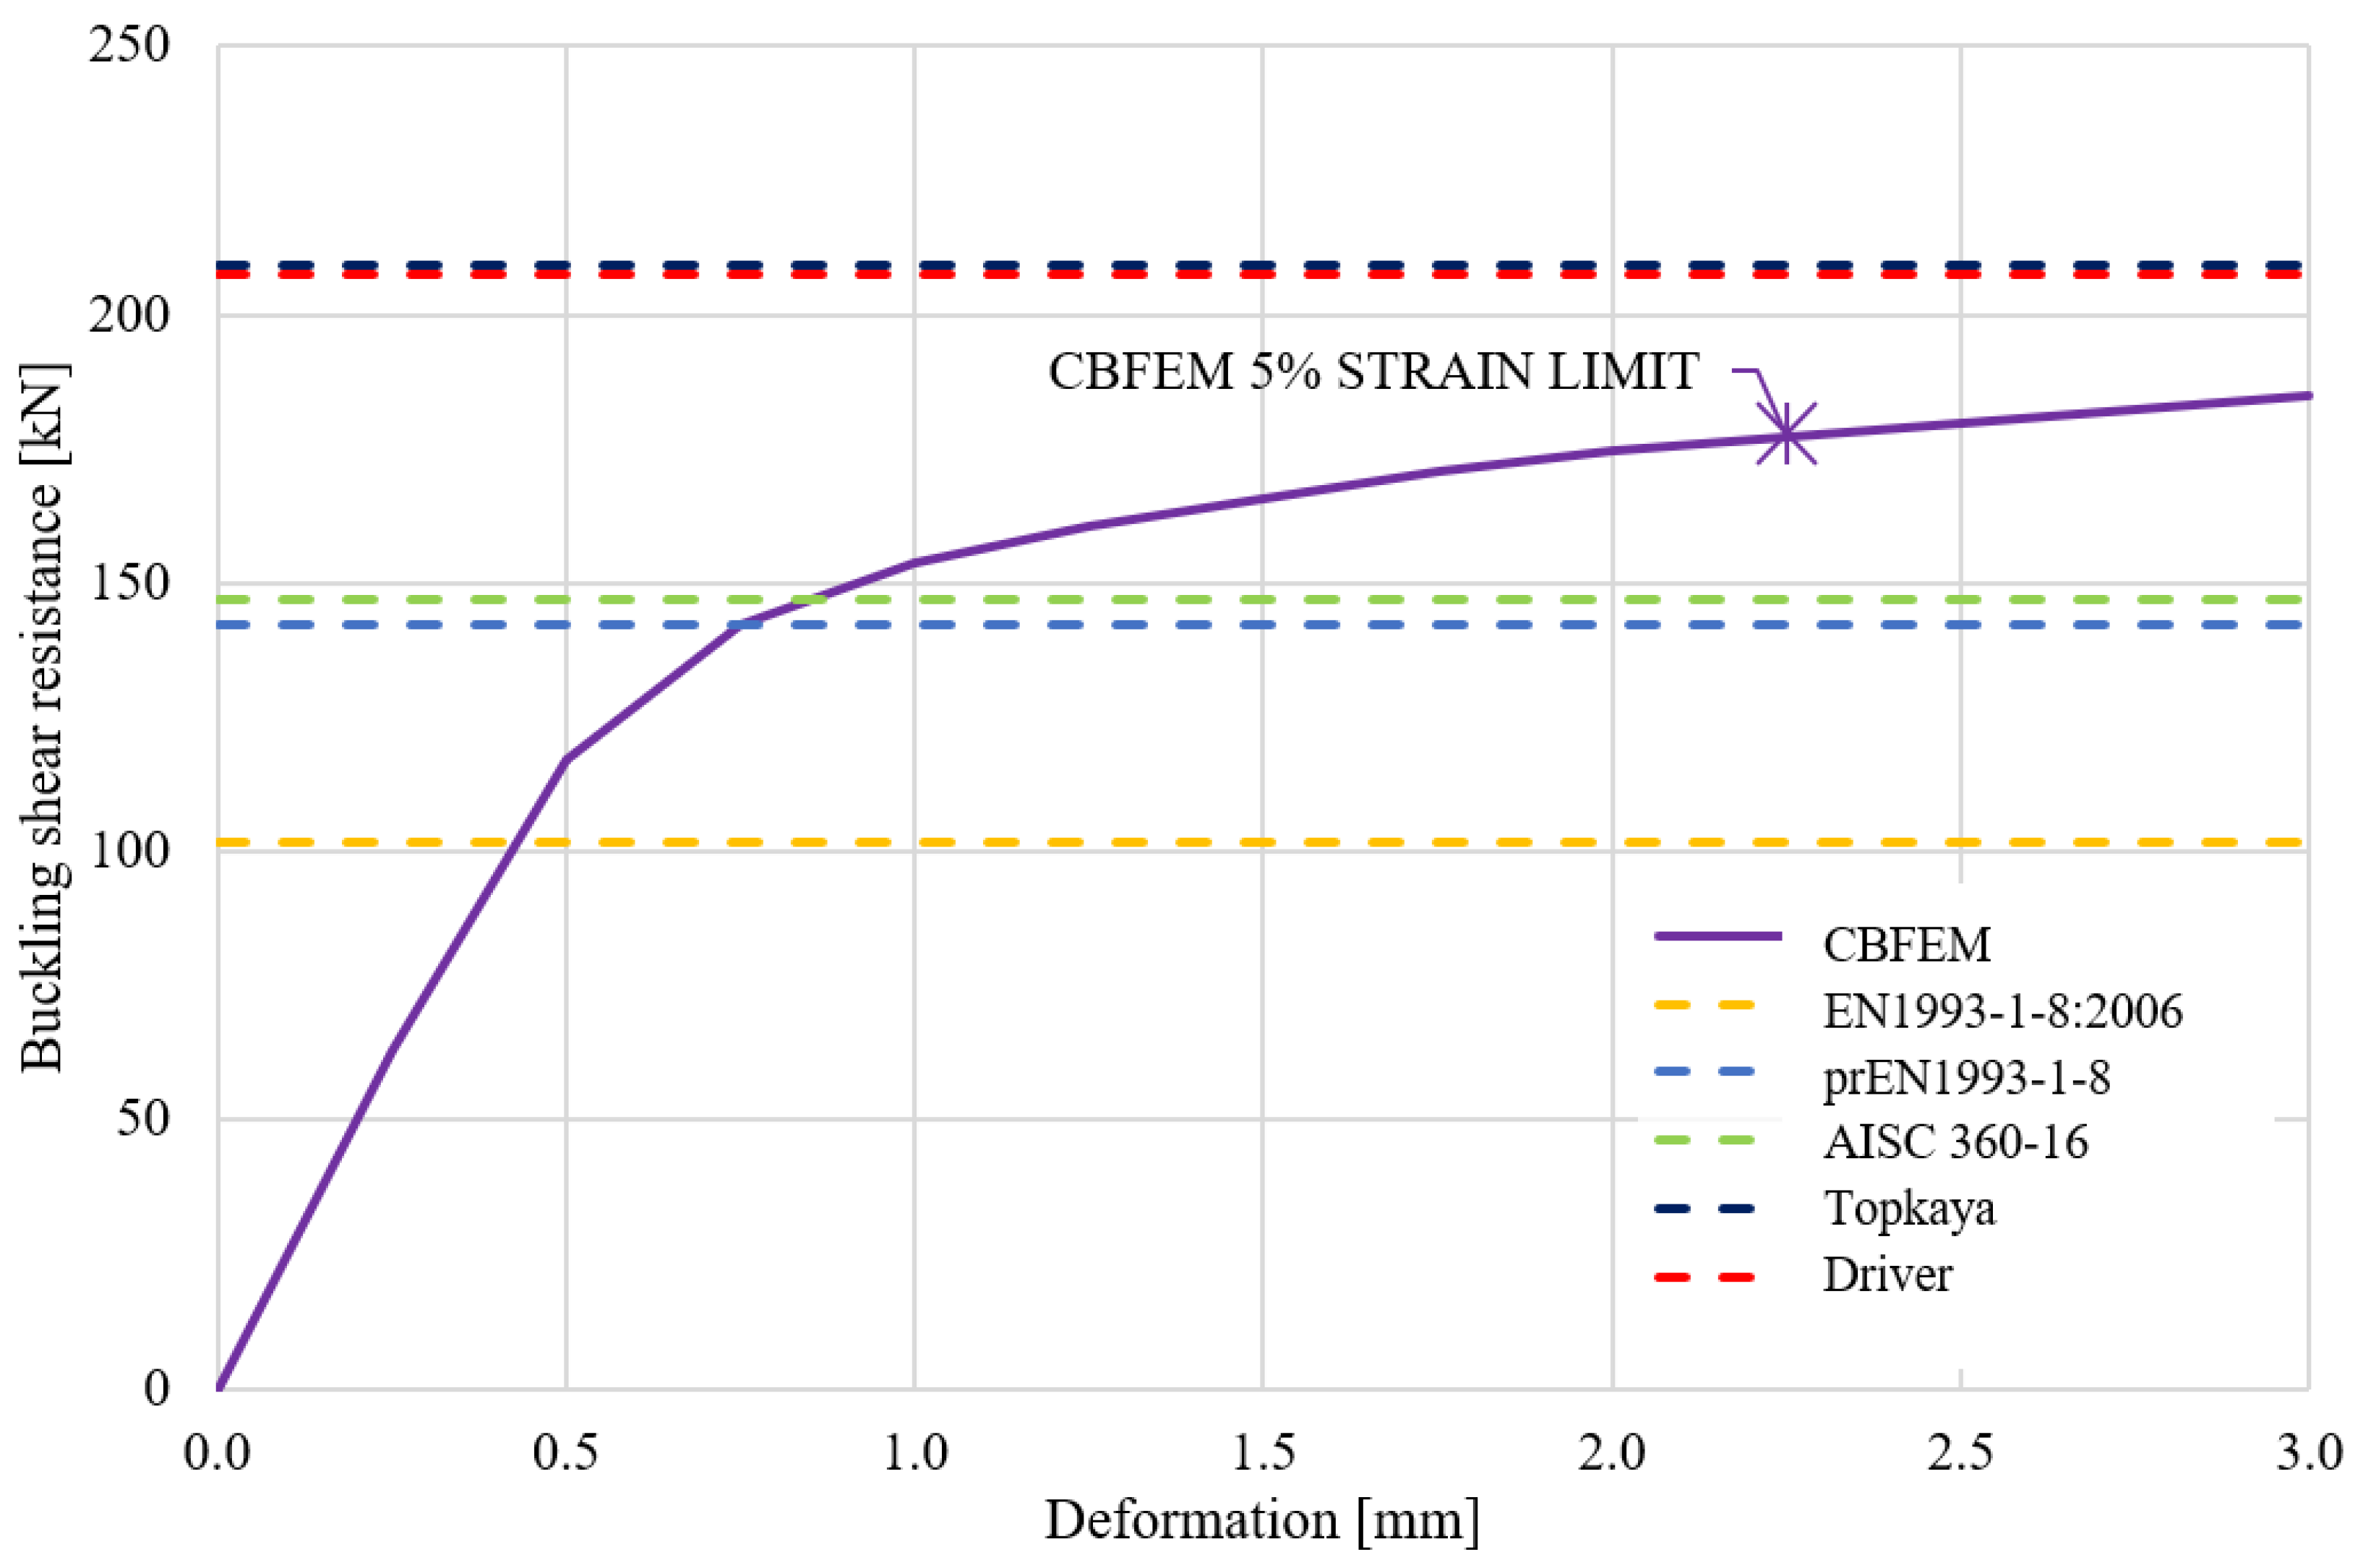
2.1. Buckling
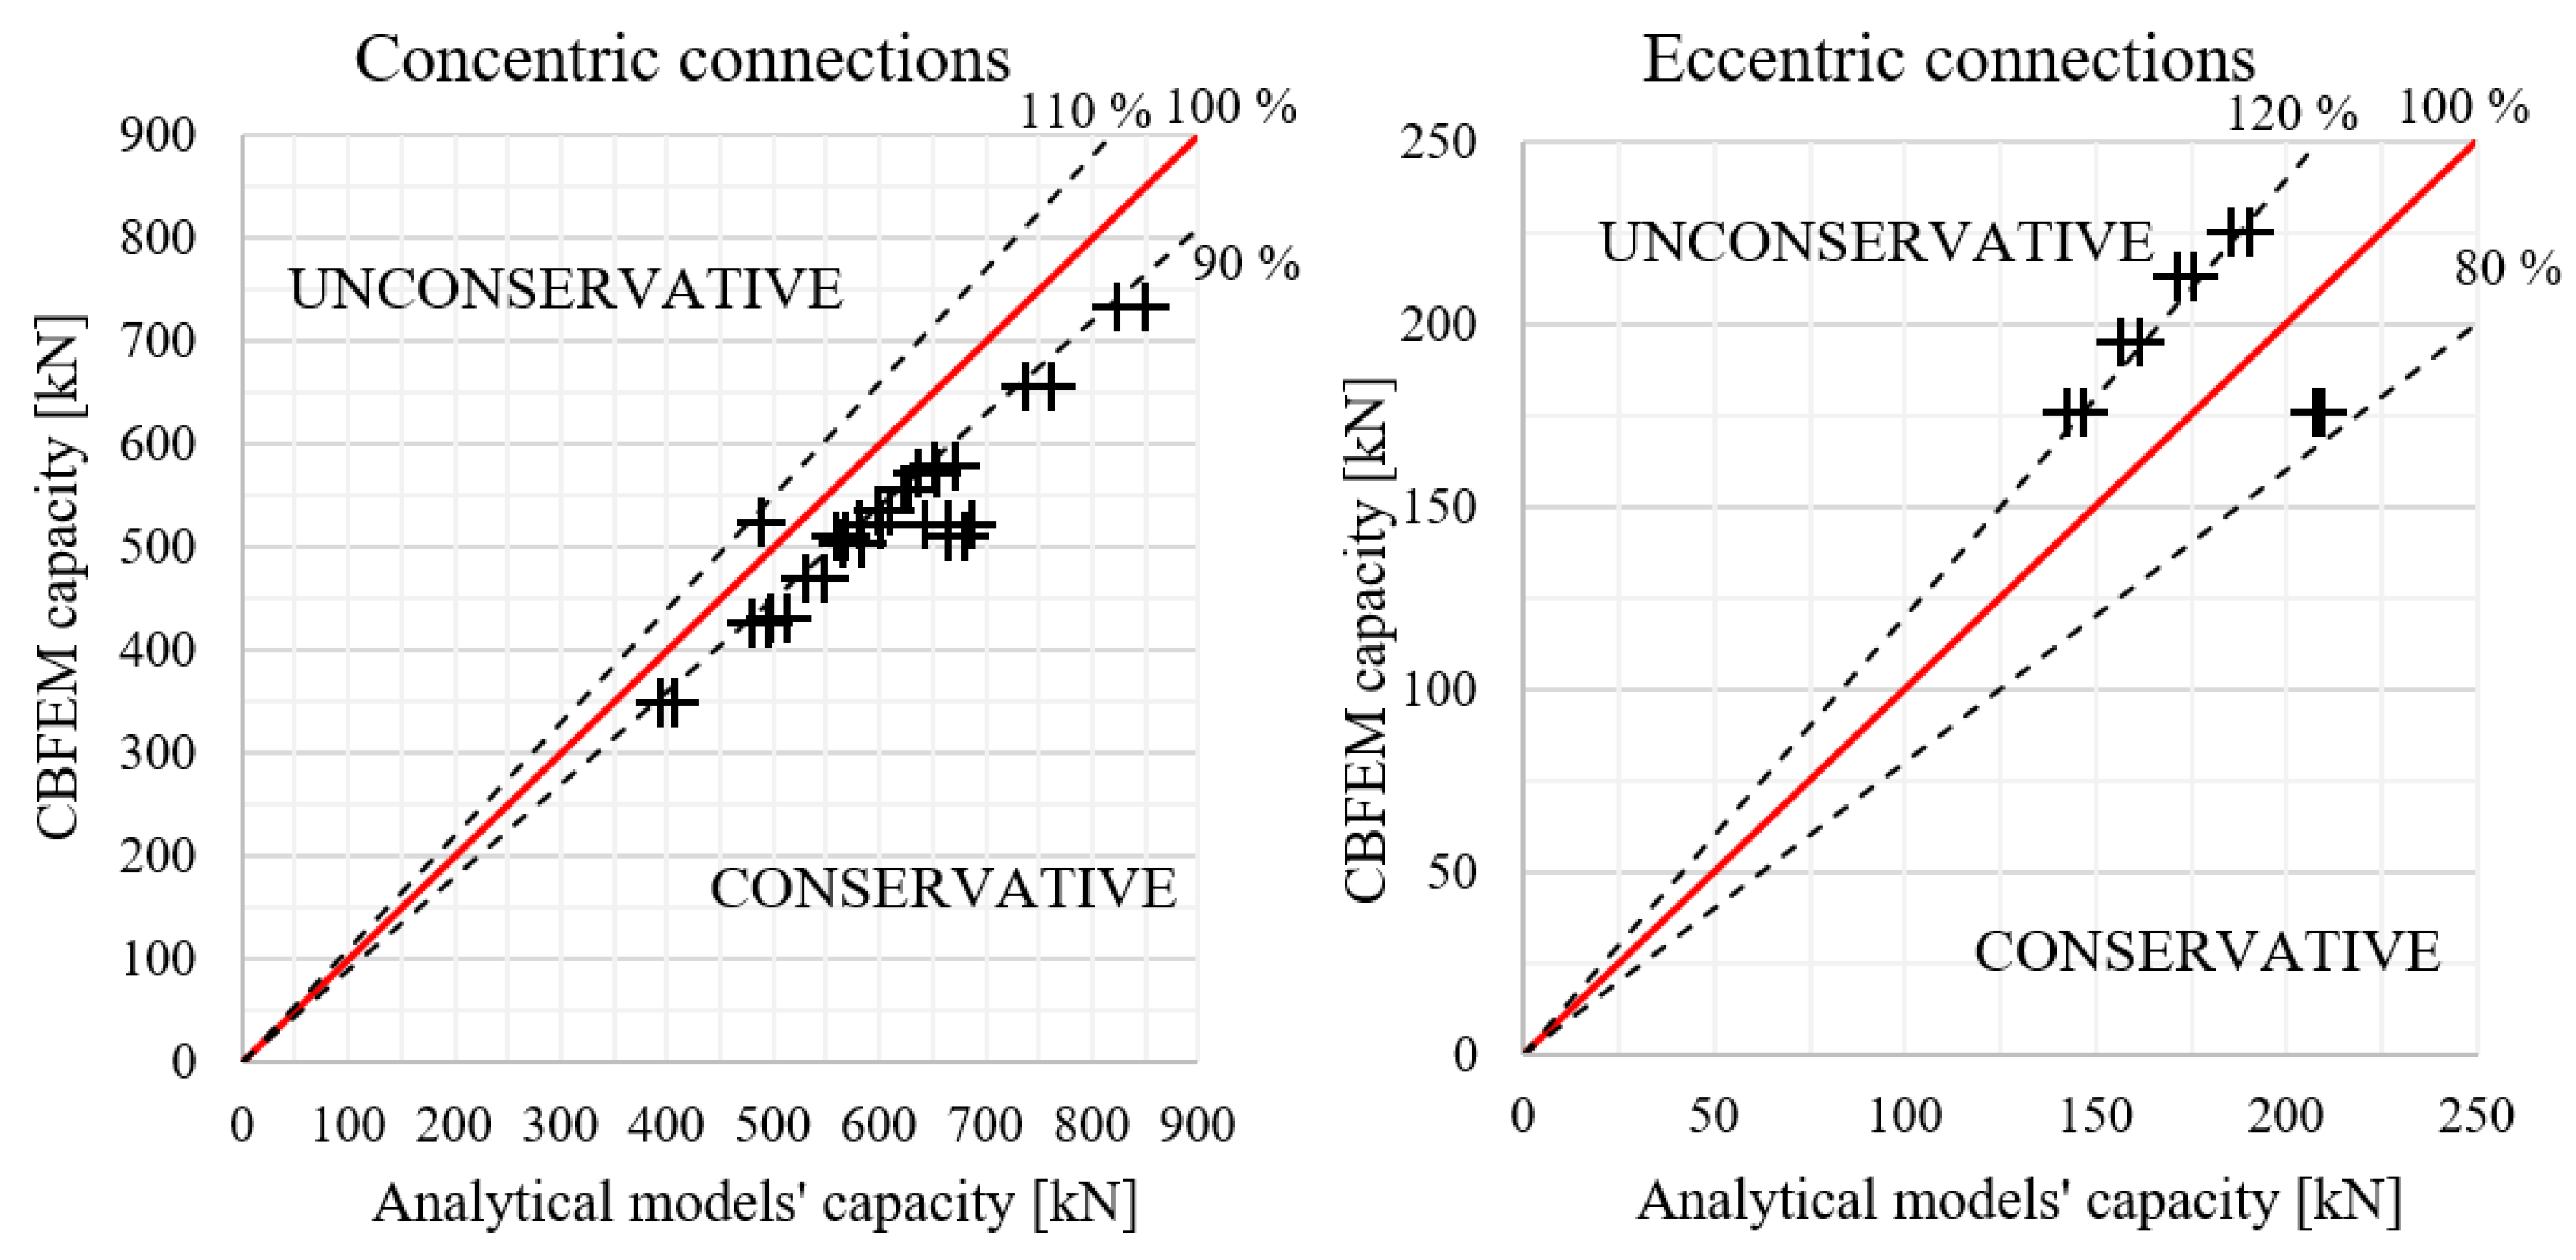
2.2. Concentric Loading
2.3. Eccentric Loading
2.4. Concentric Loading
2.5. Eccentric Loading
2.6. Research by Kim
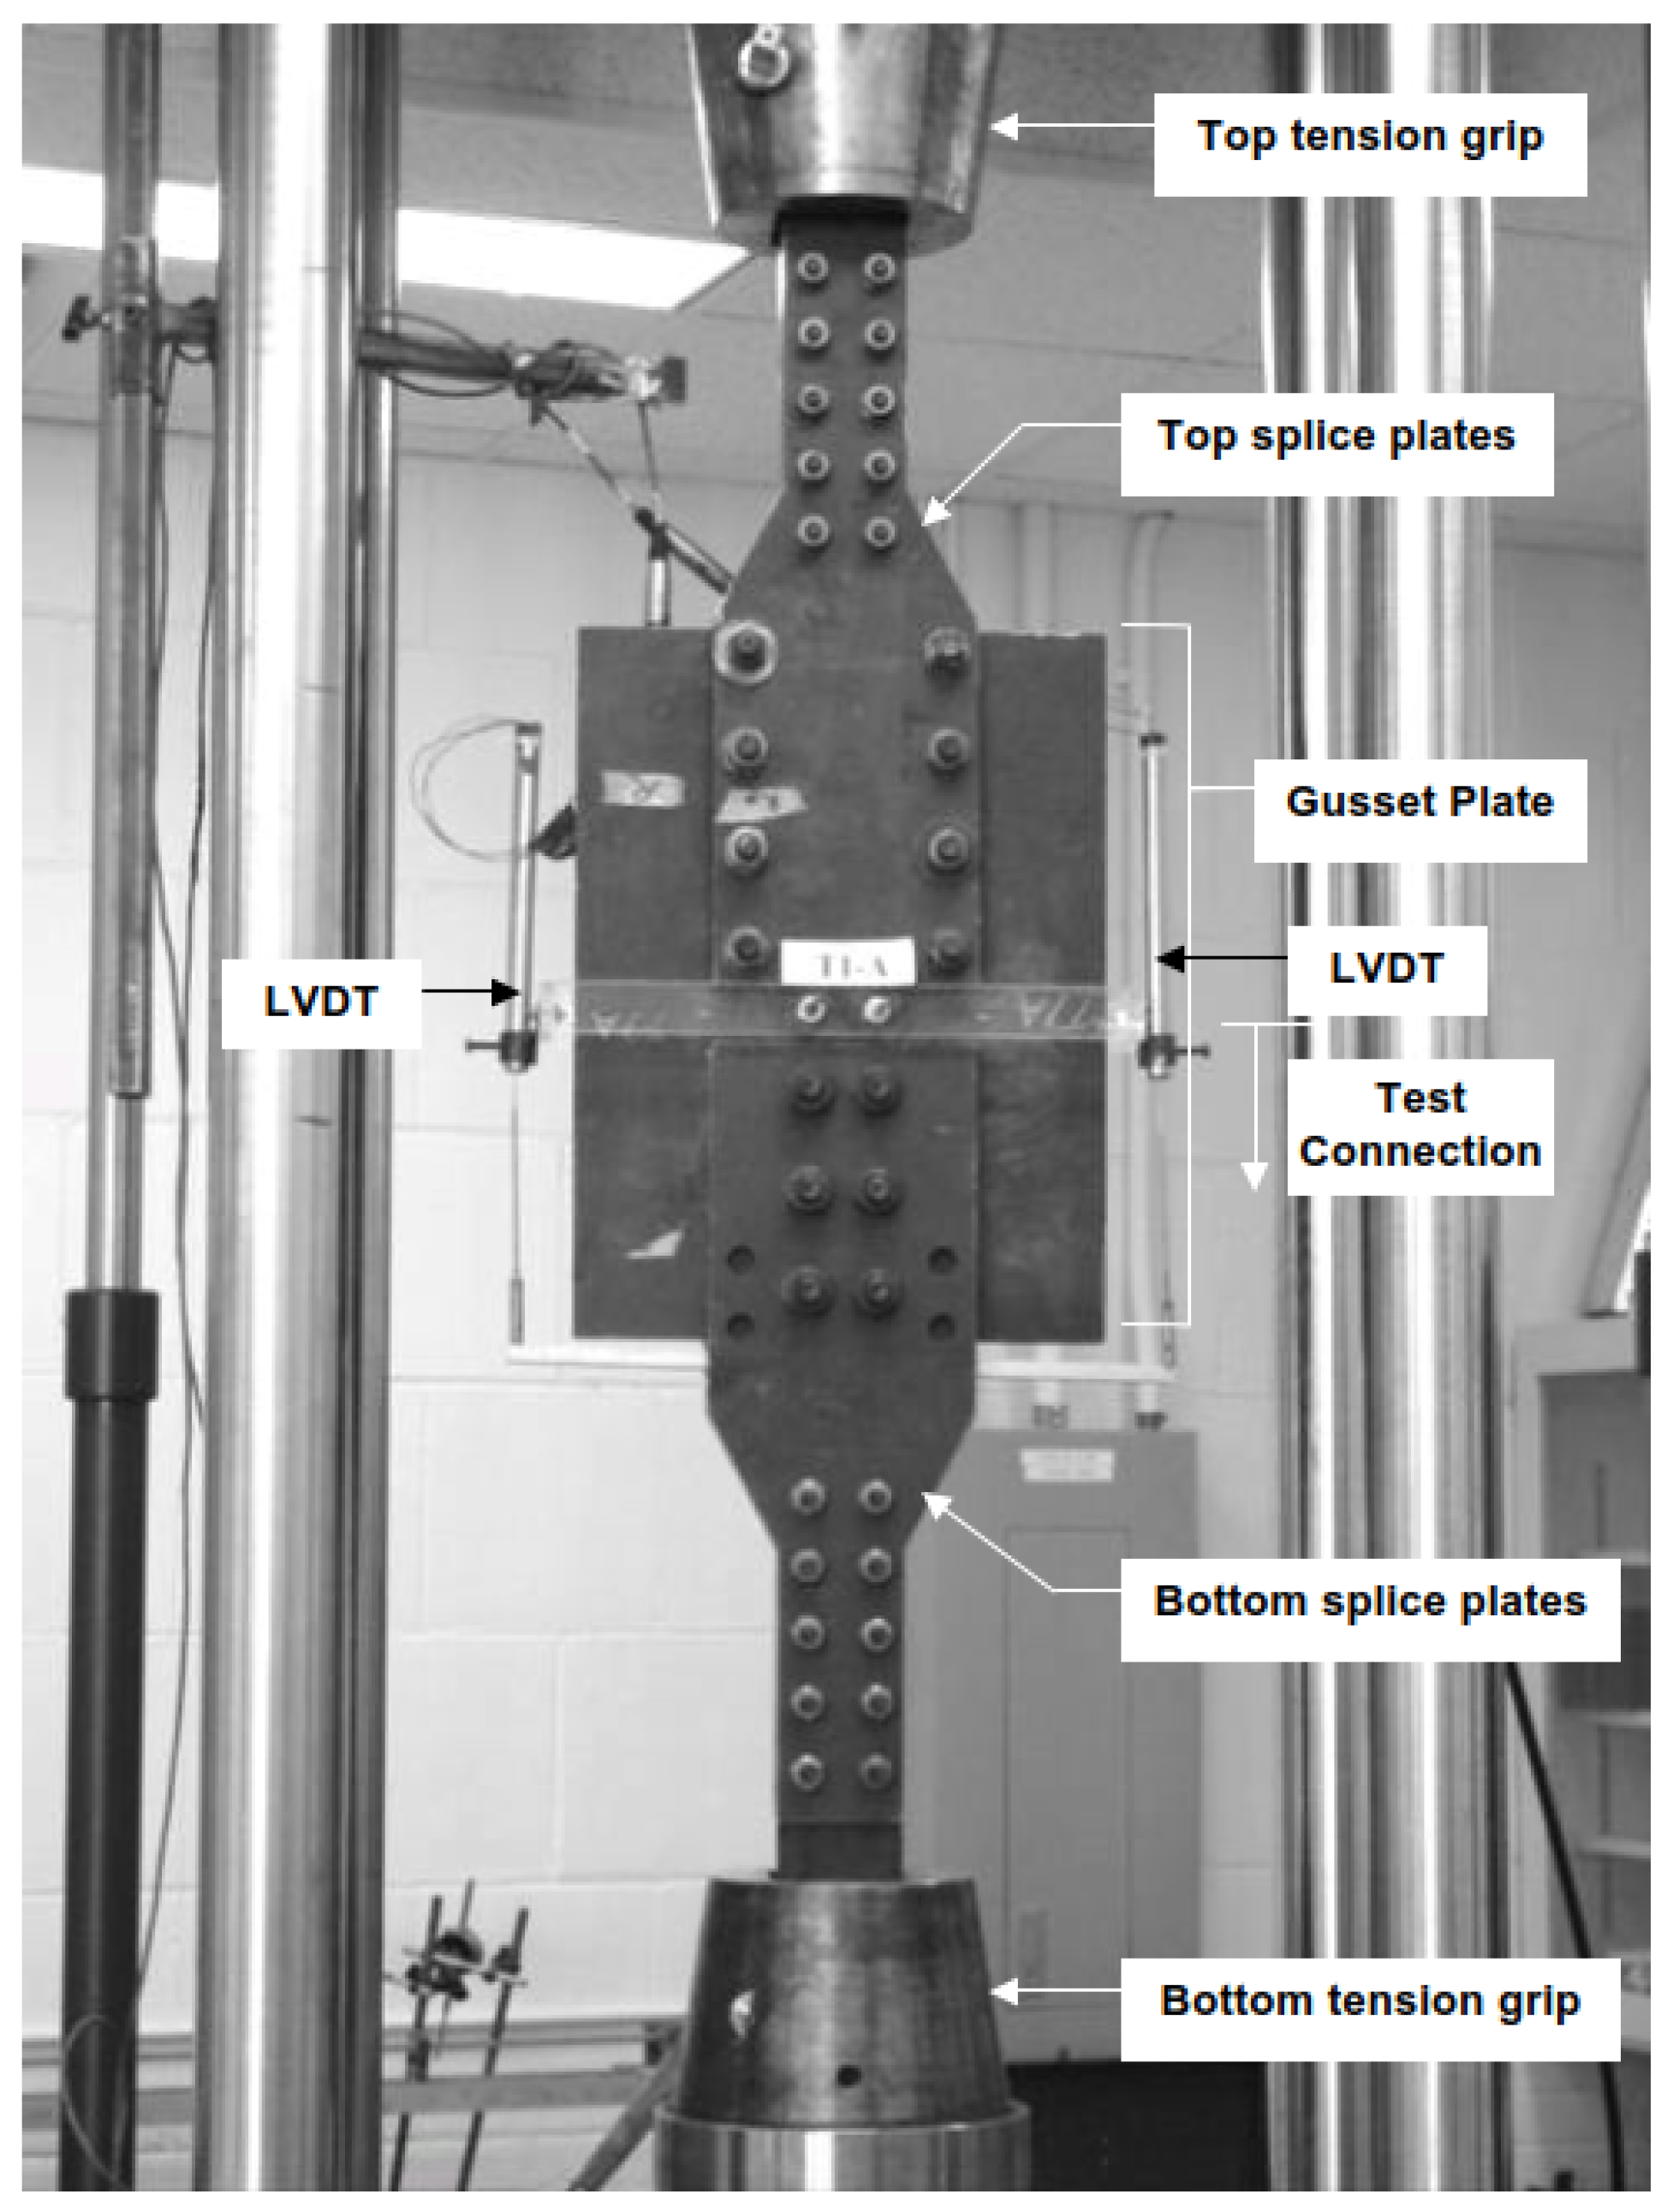
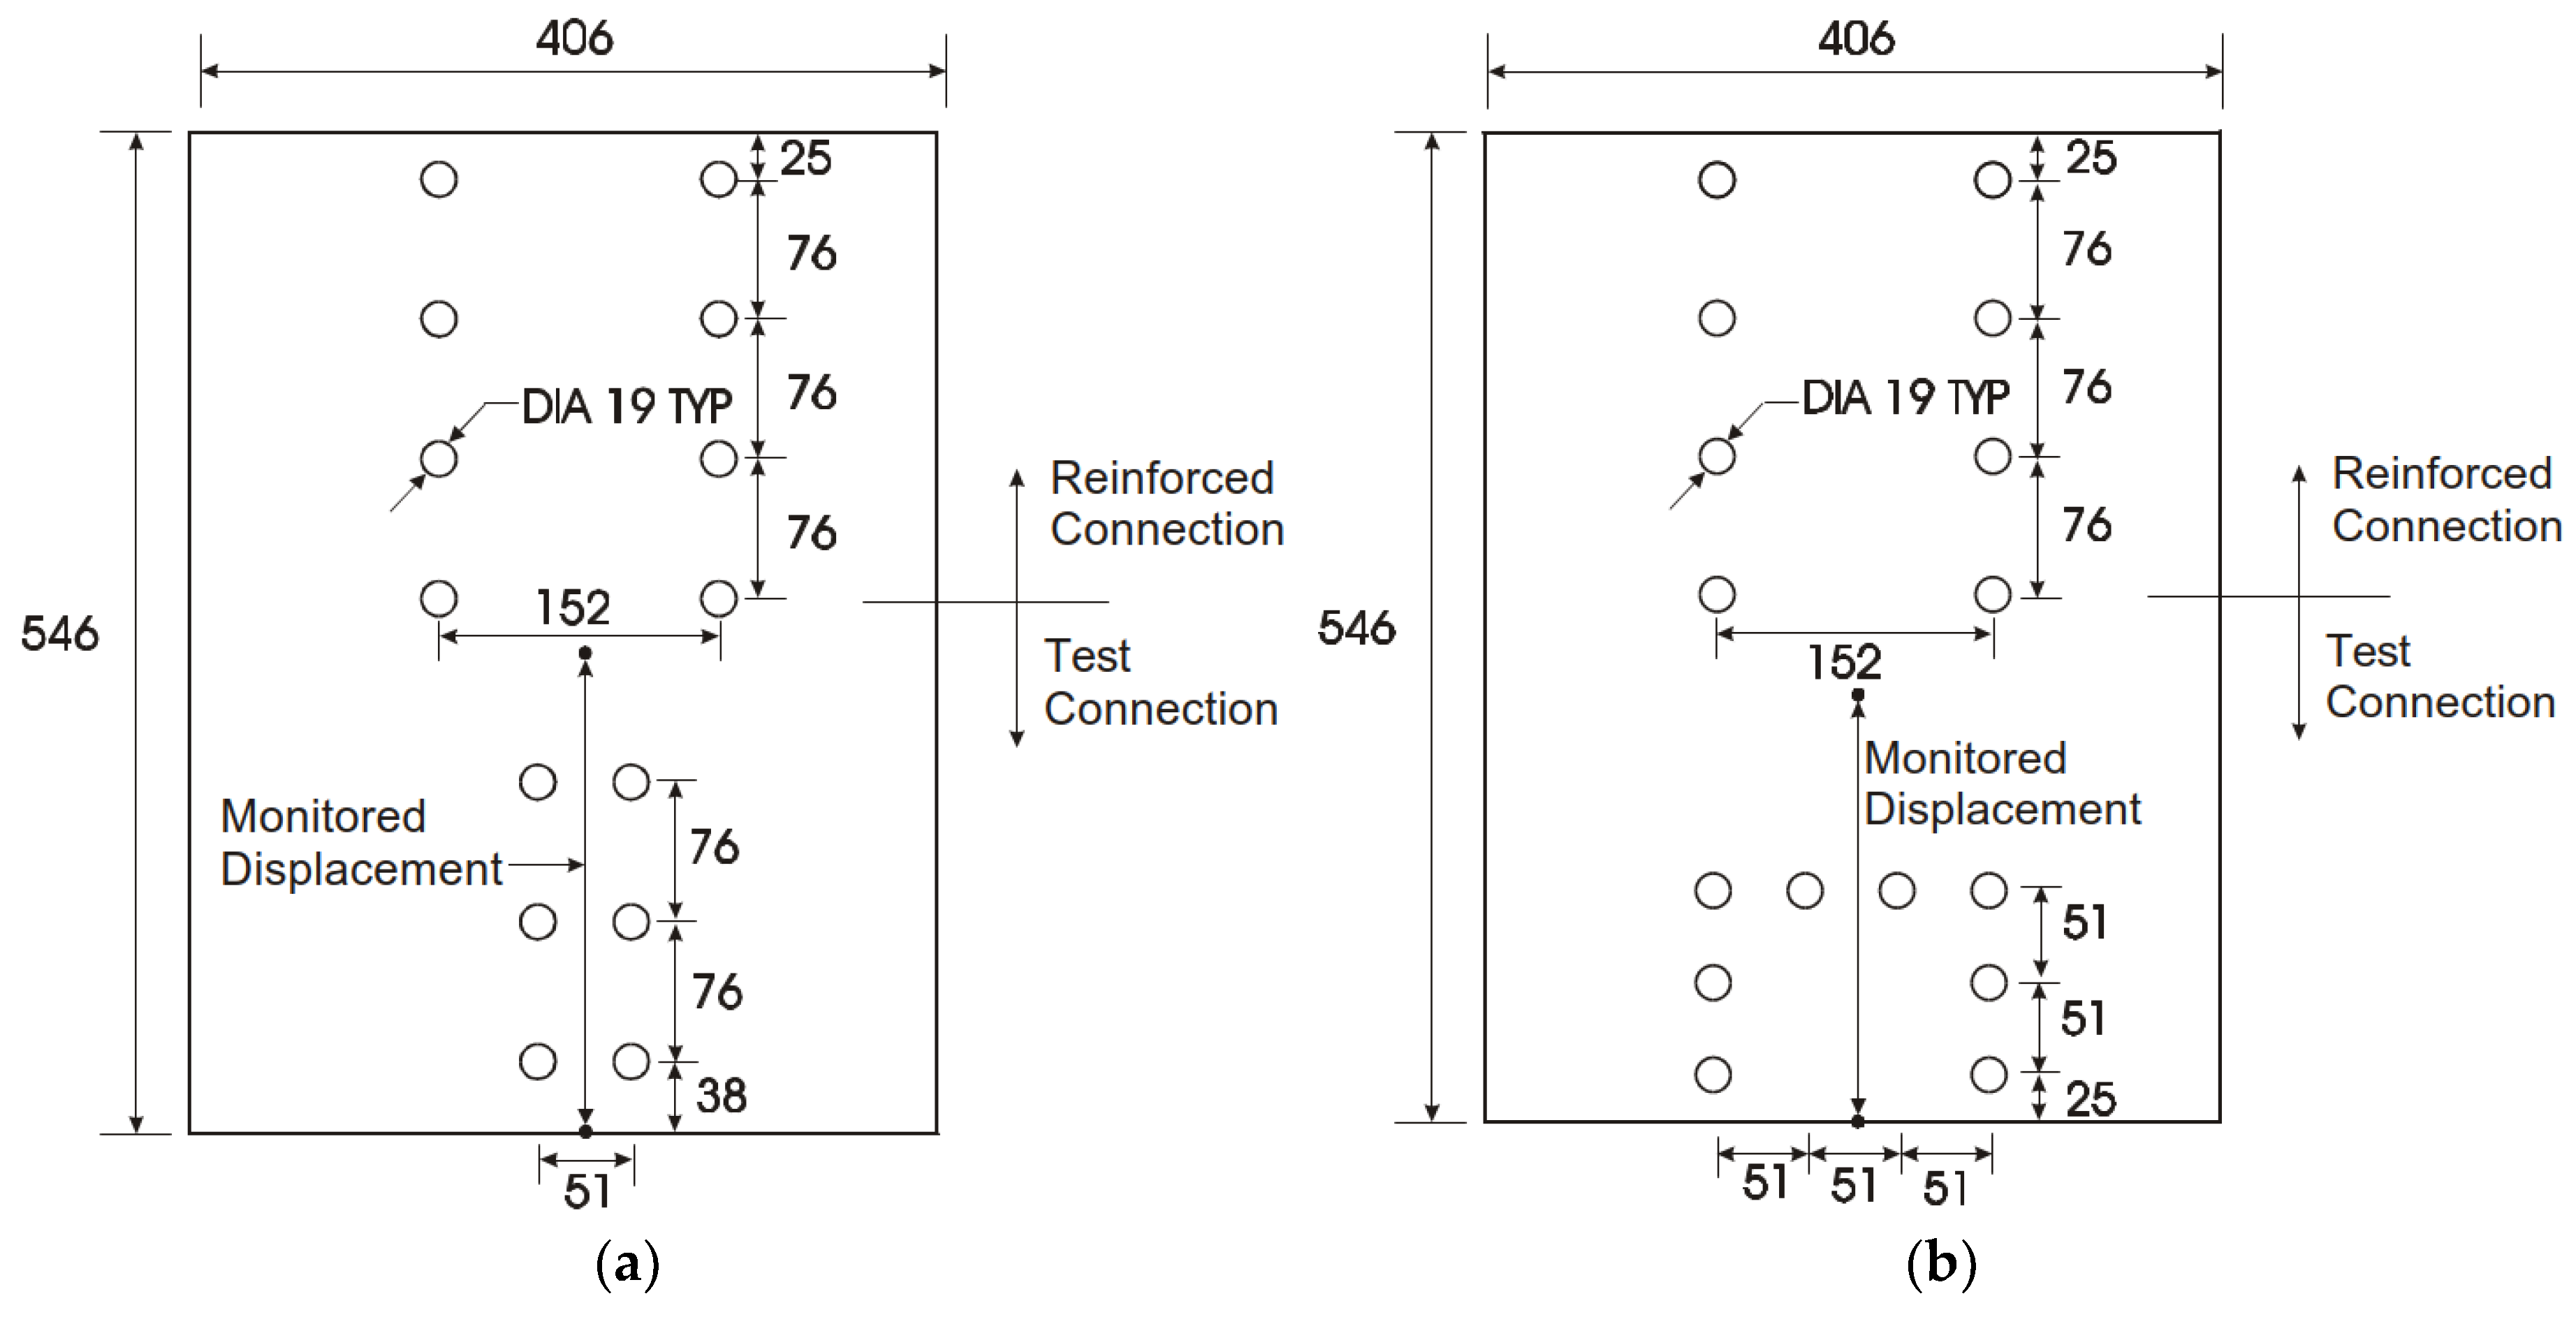
3. Experiments
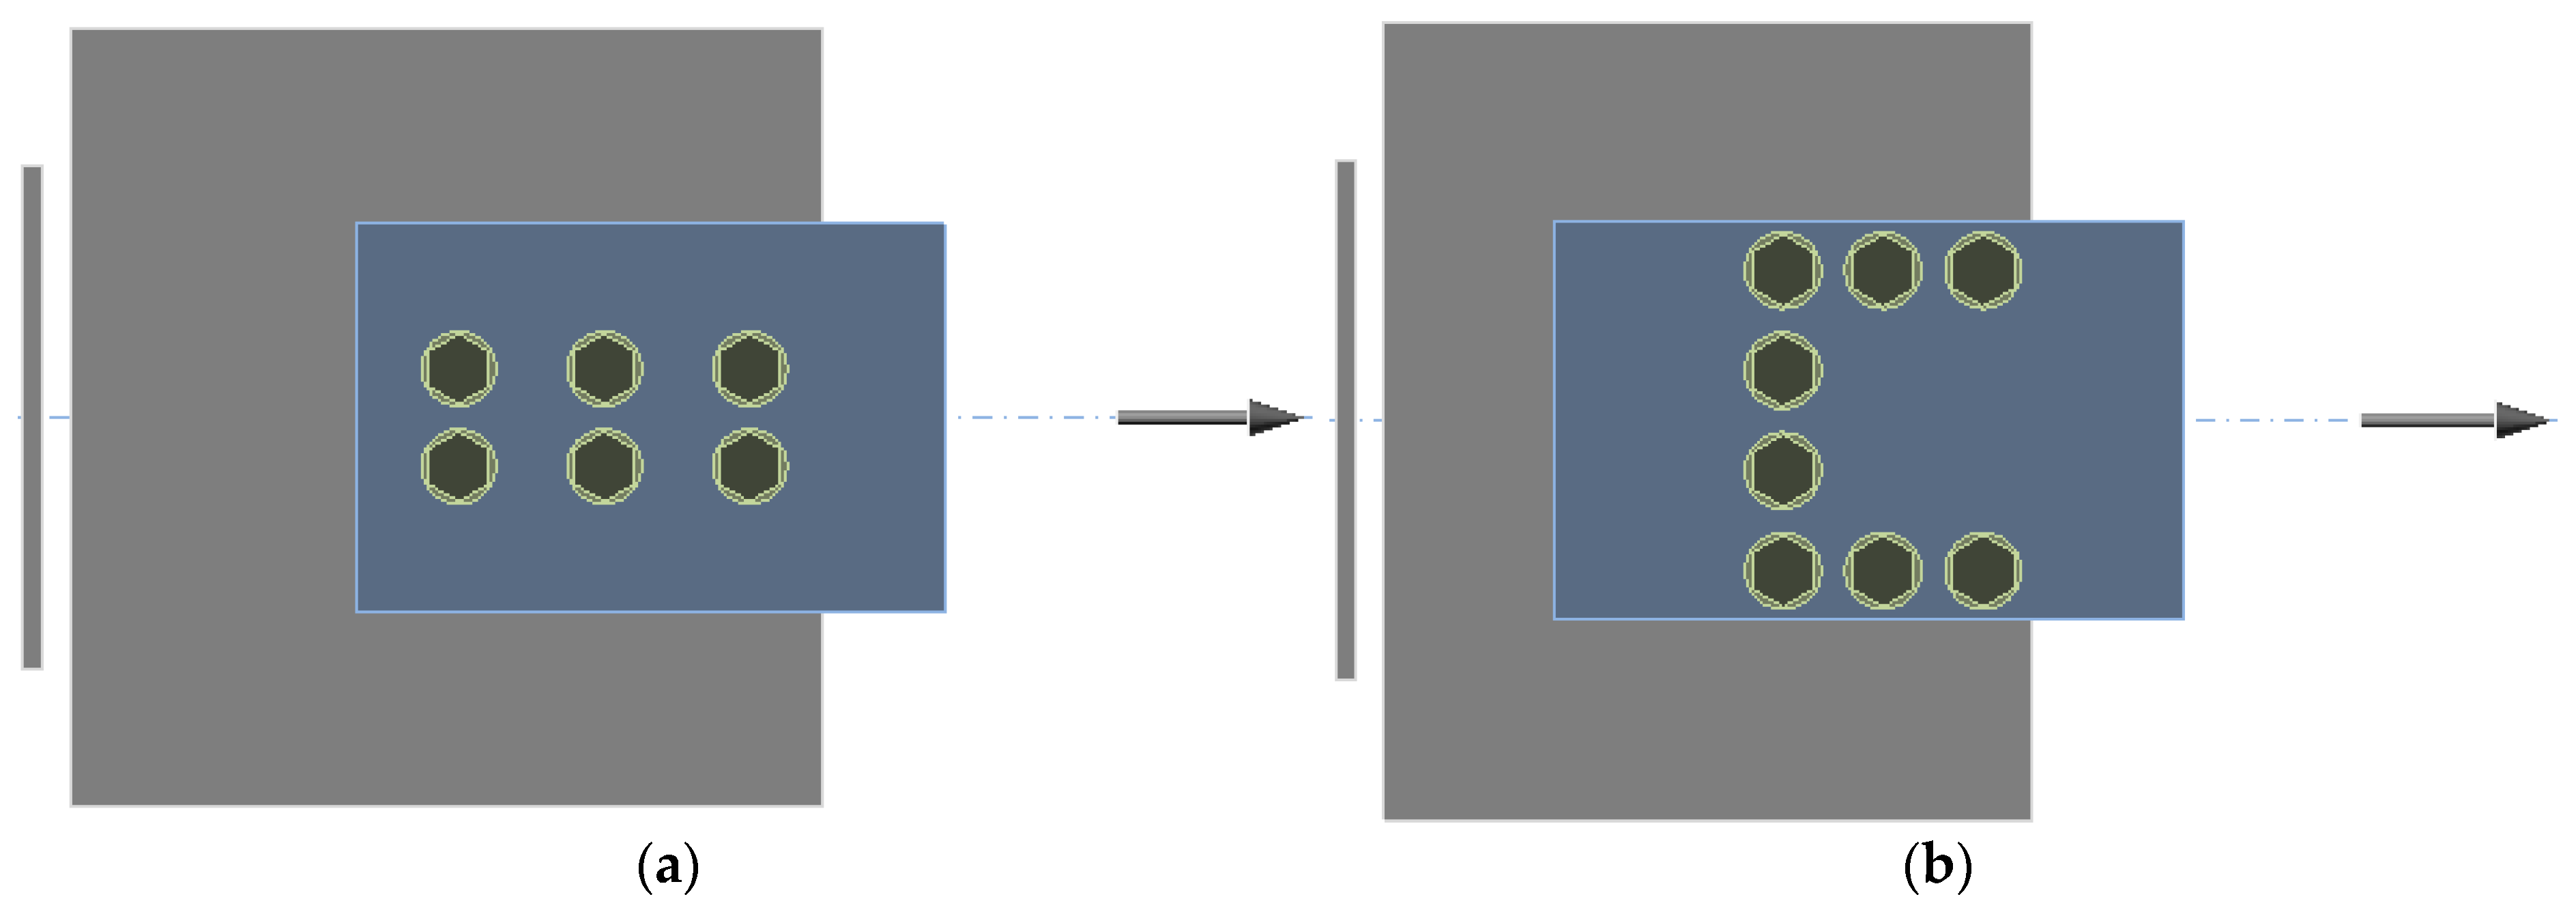
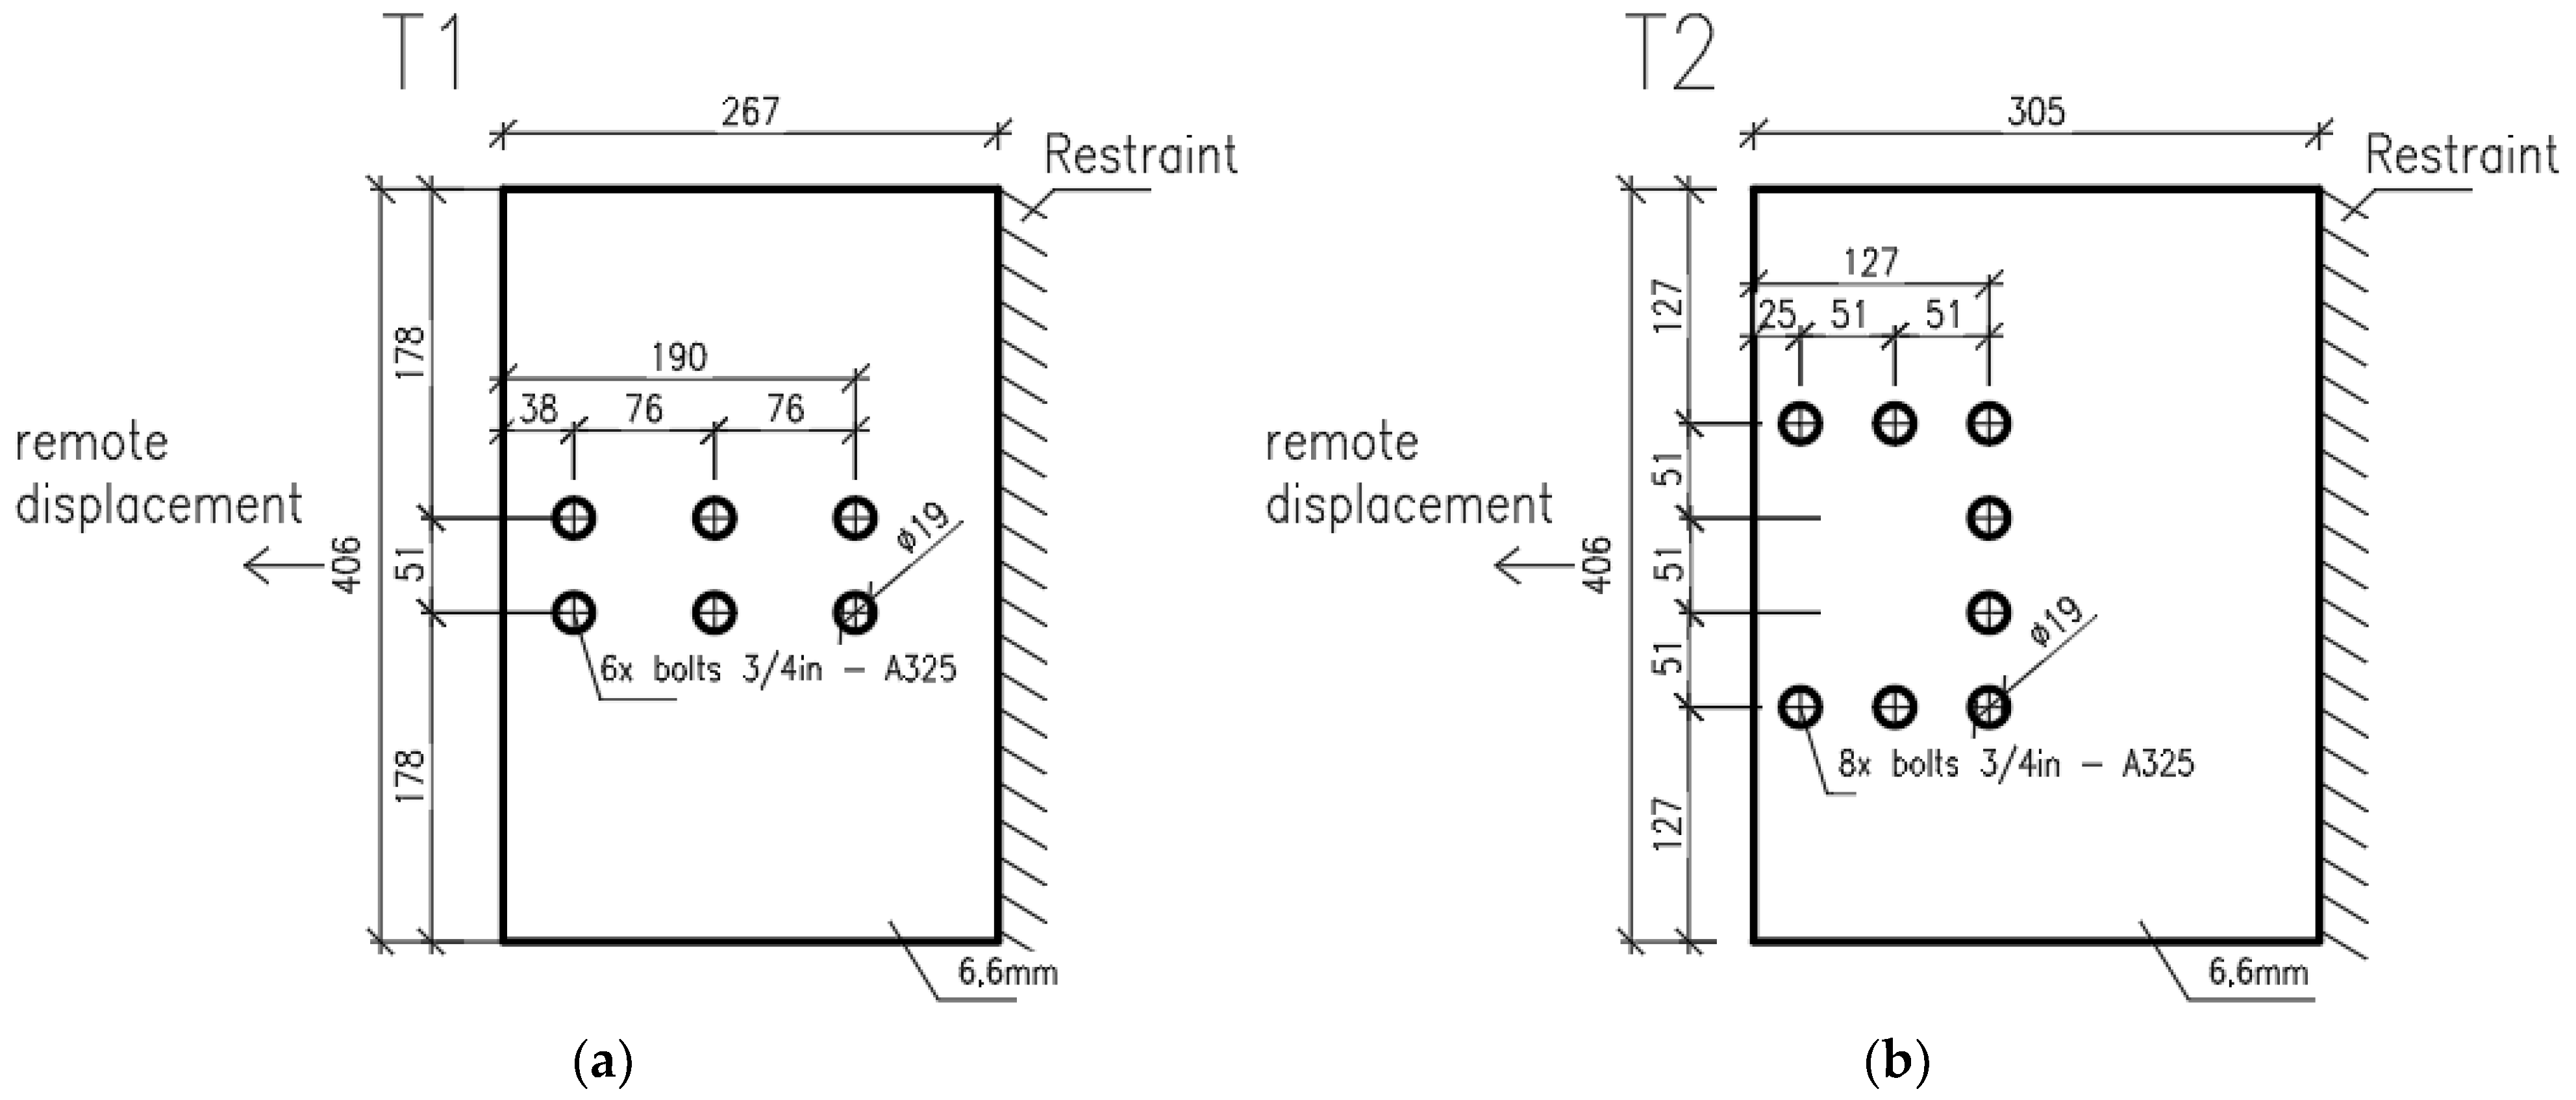
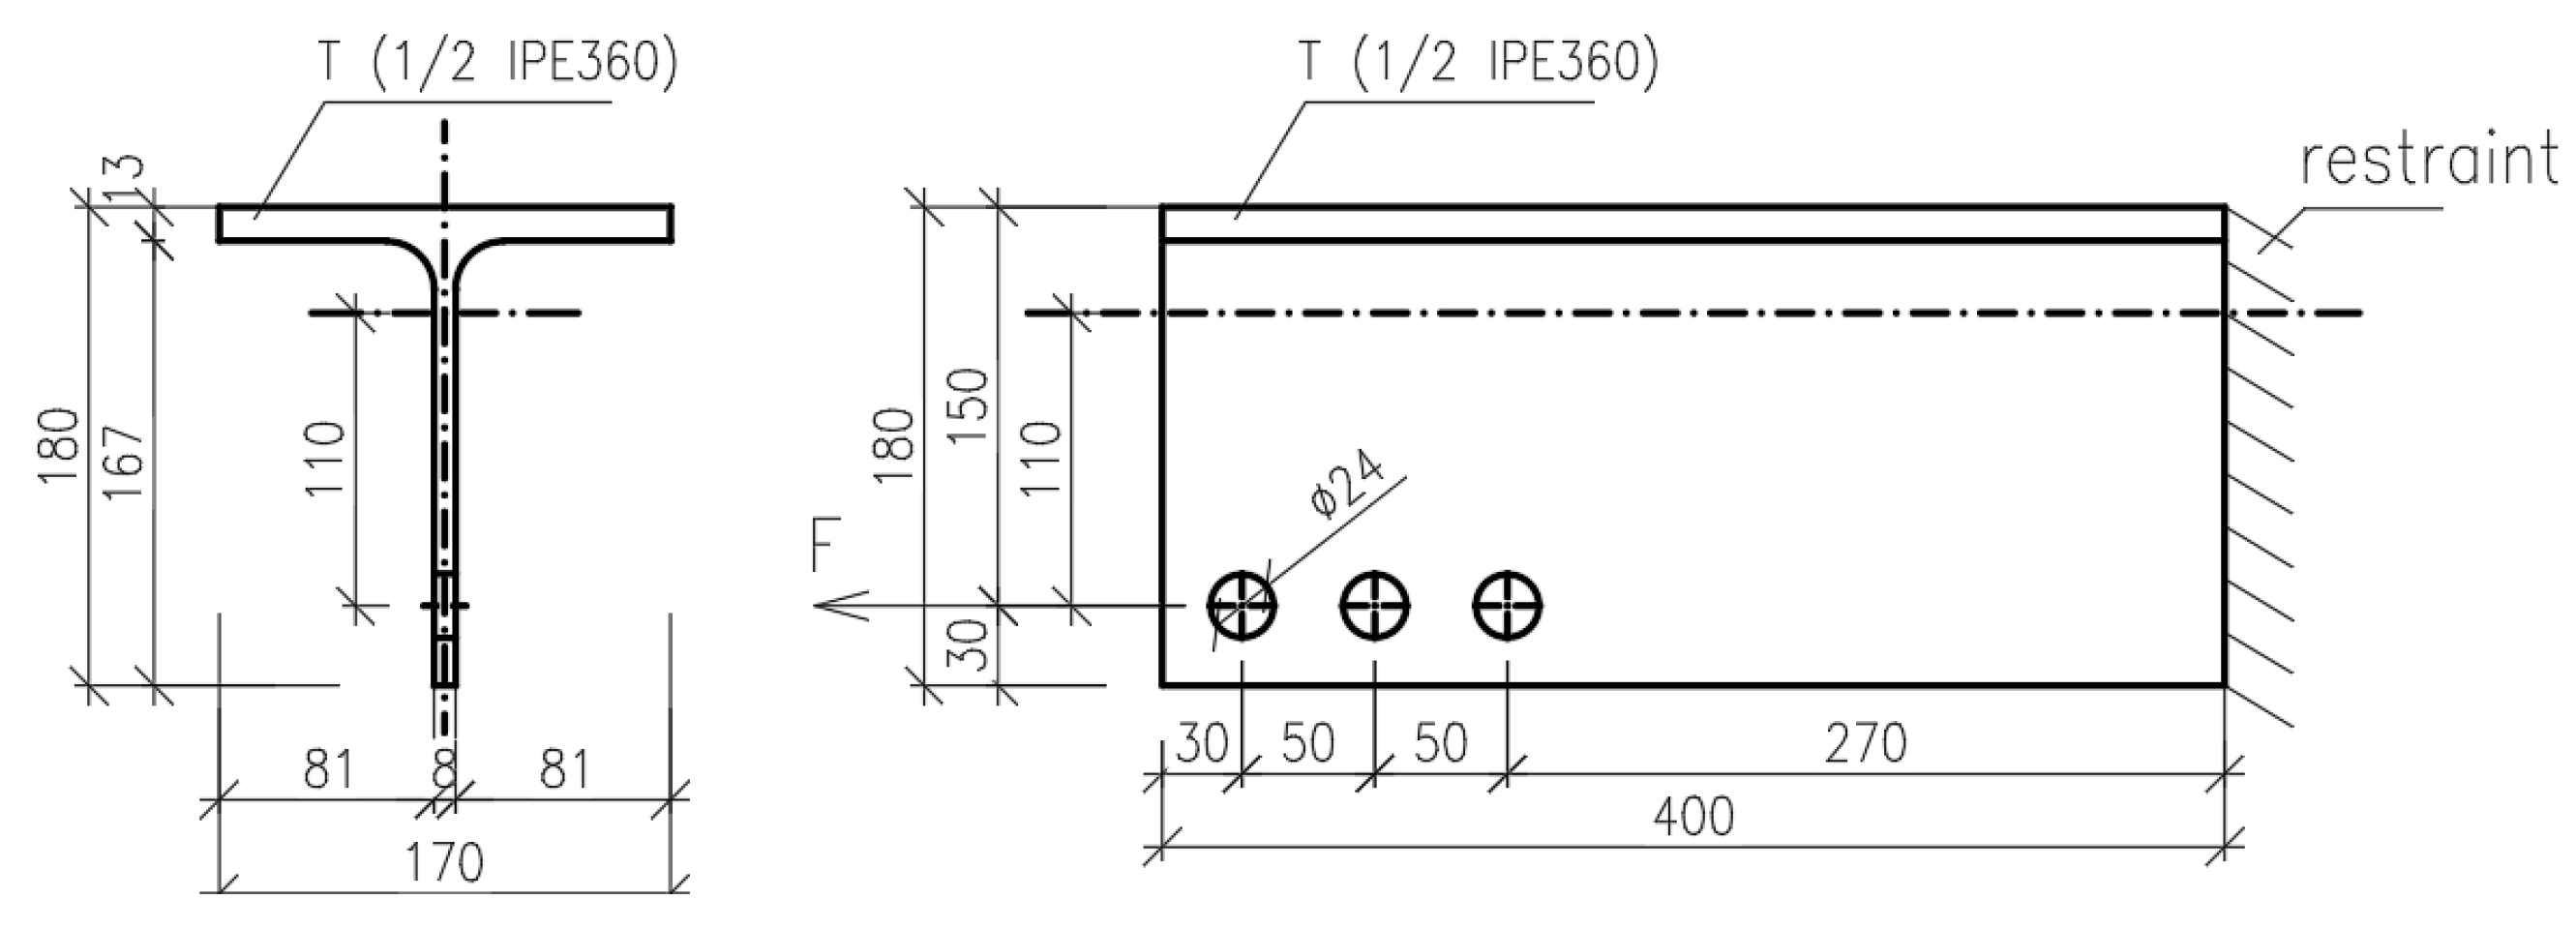
3.1. Geometry
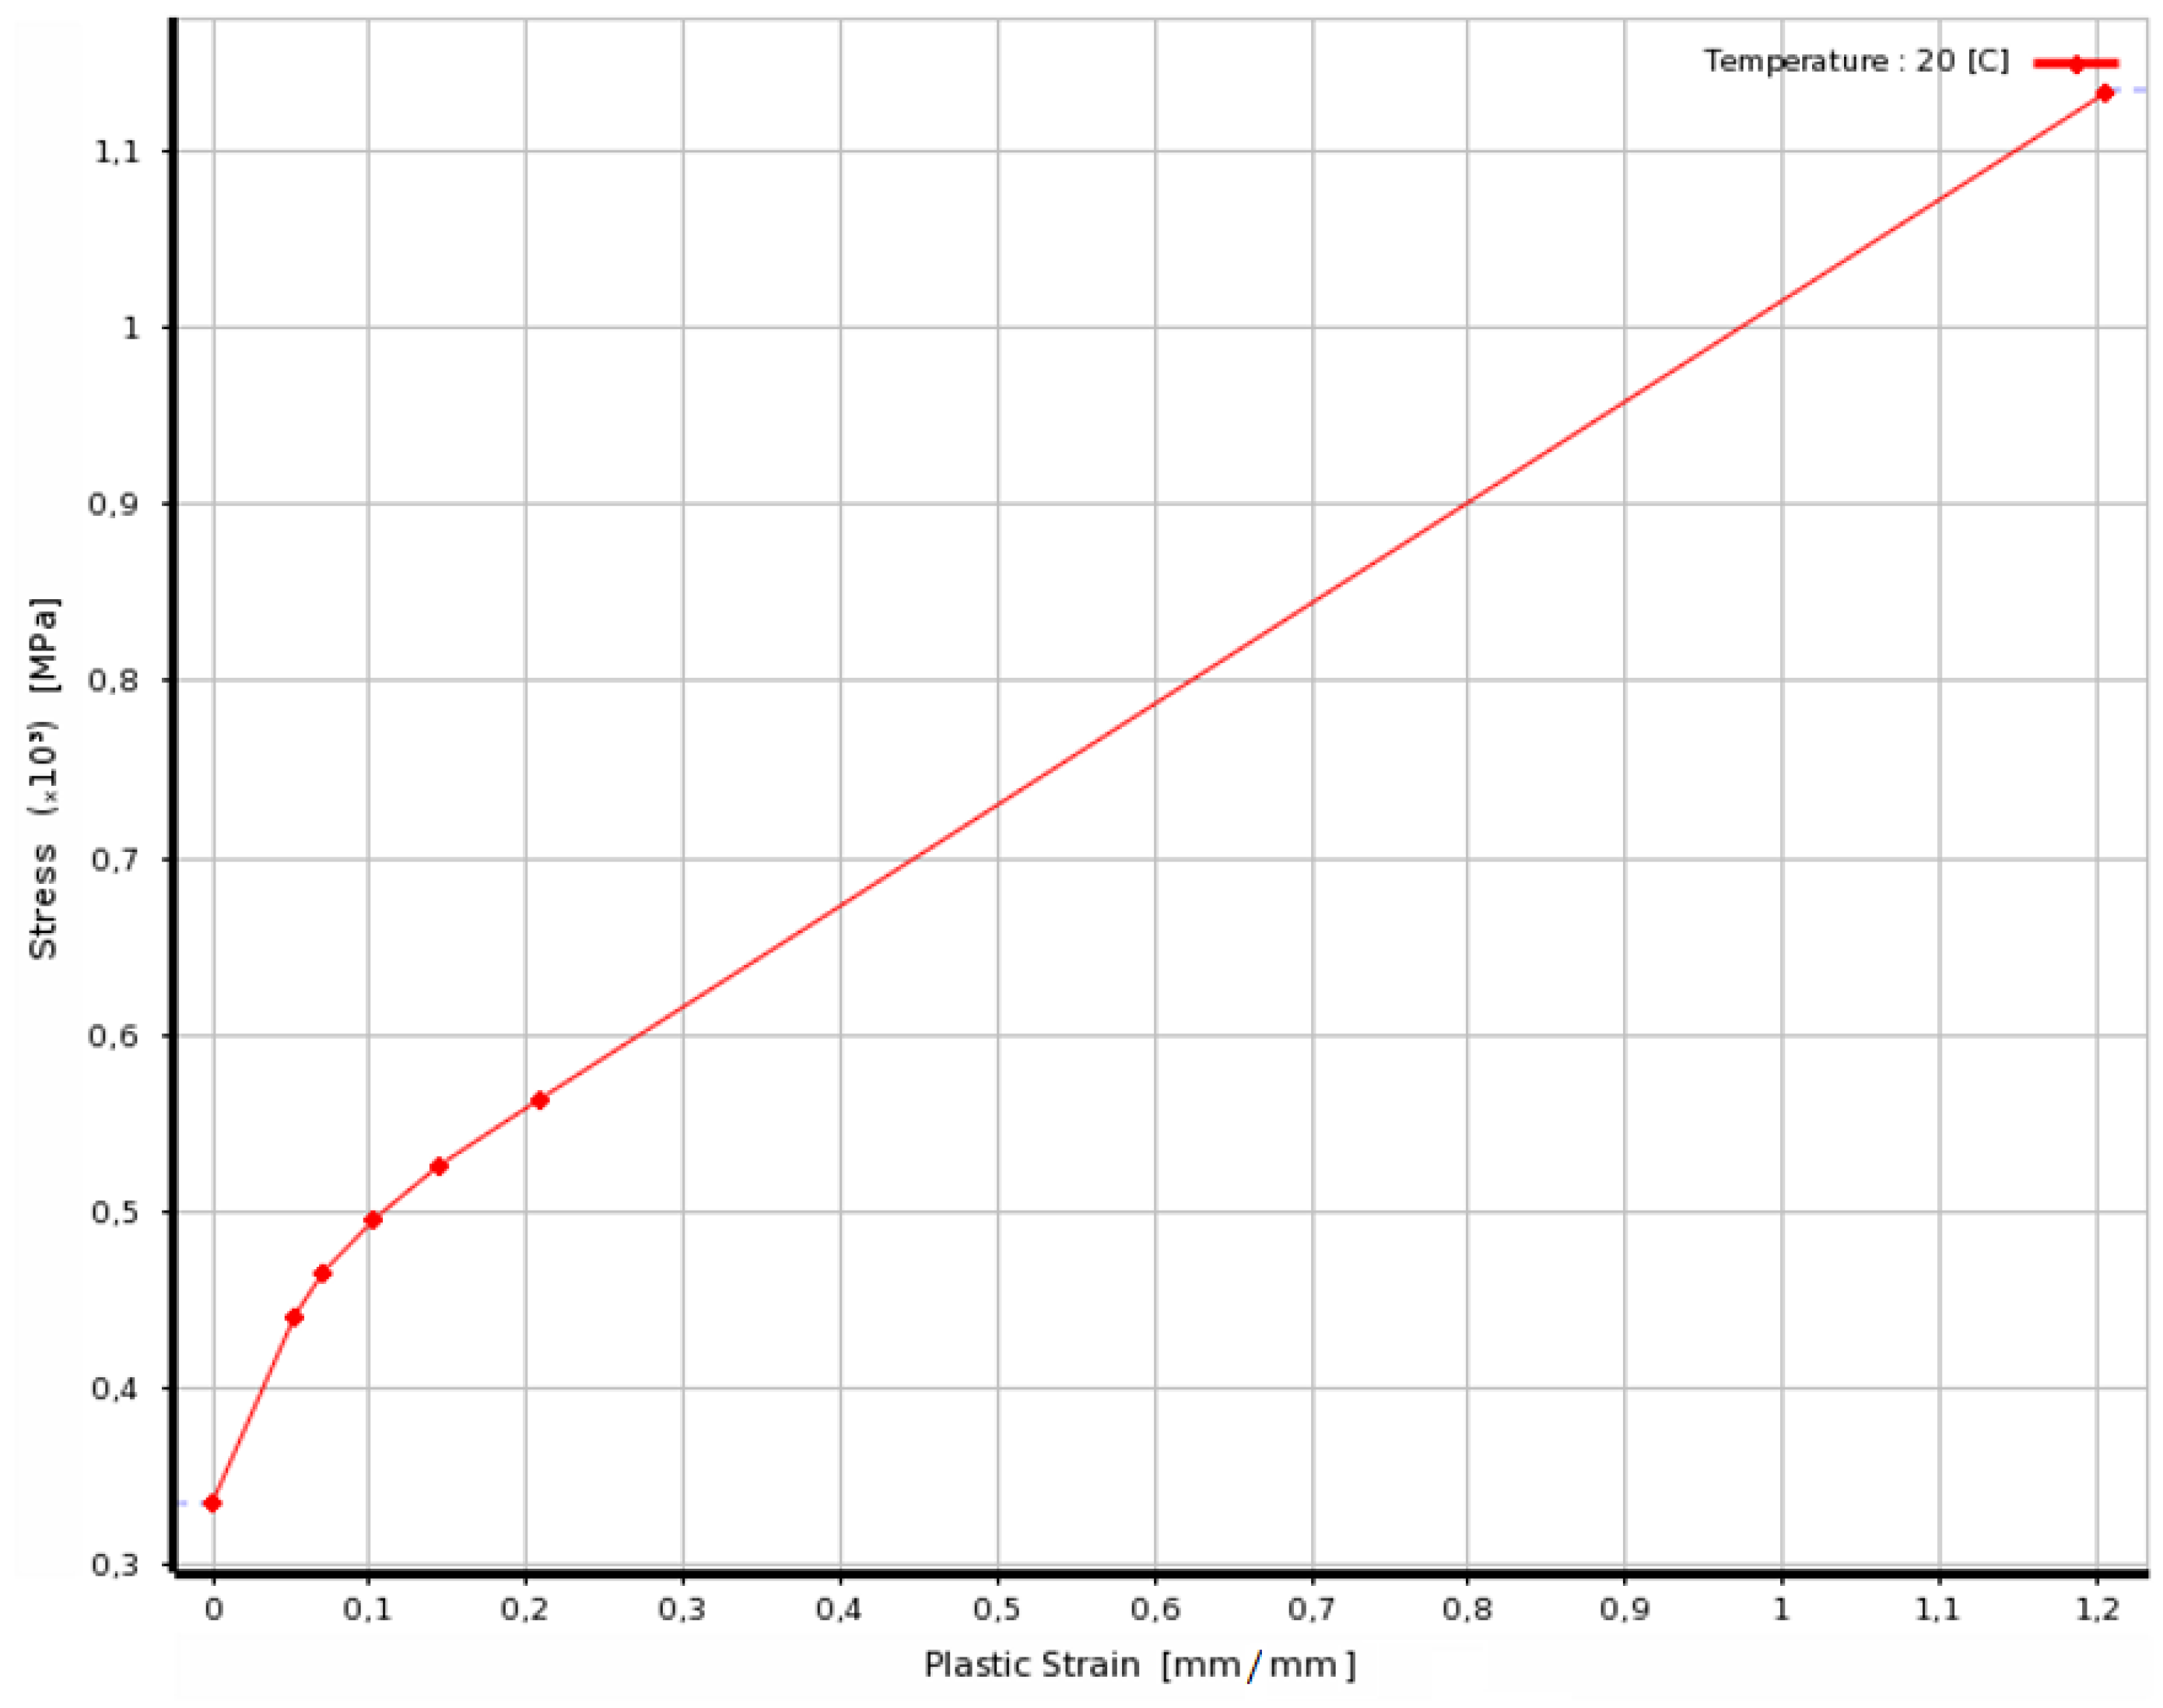
3.2. Material
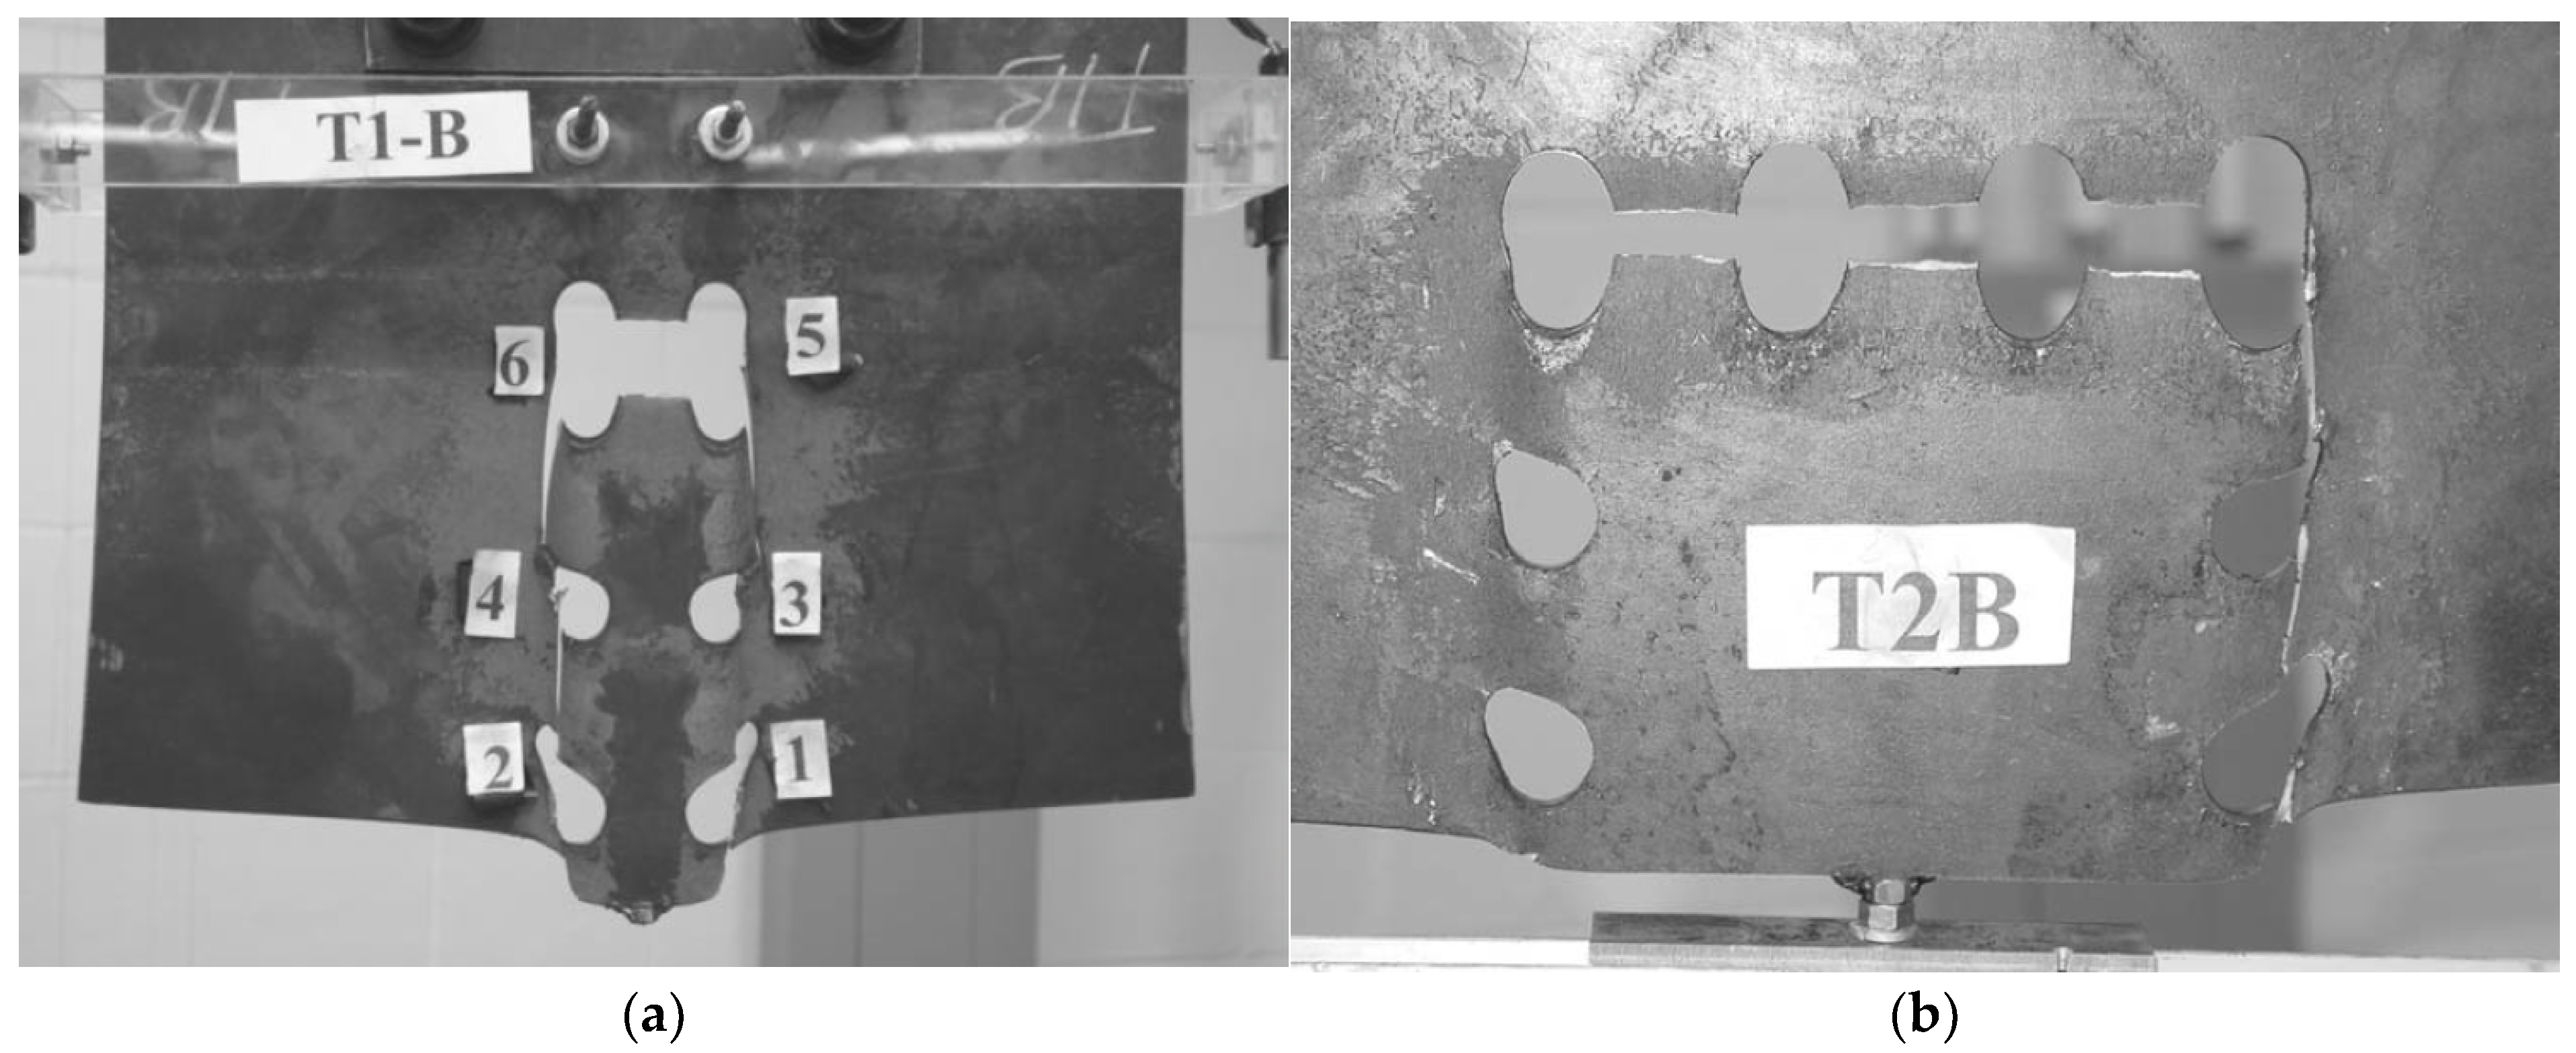
3.3. Experimental Results
4. Research-Oriented Finite Element Model
4.1. Model Geometry
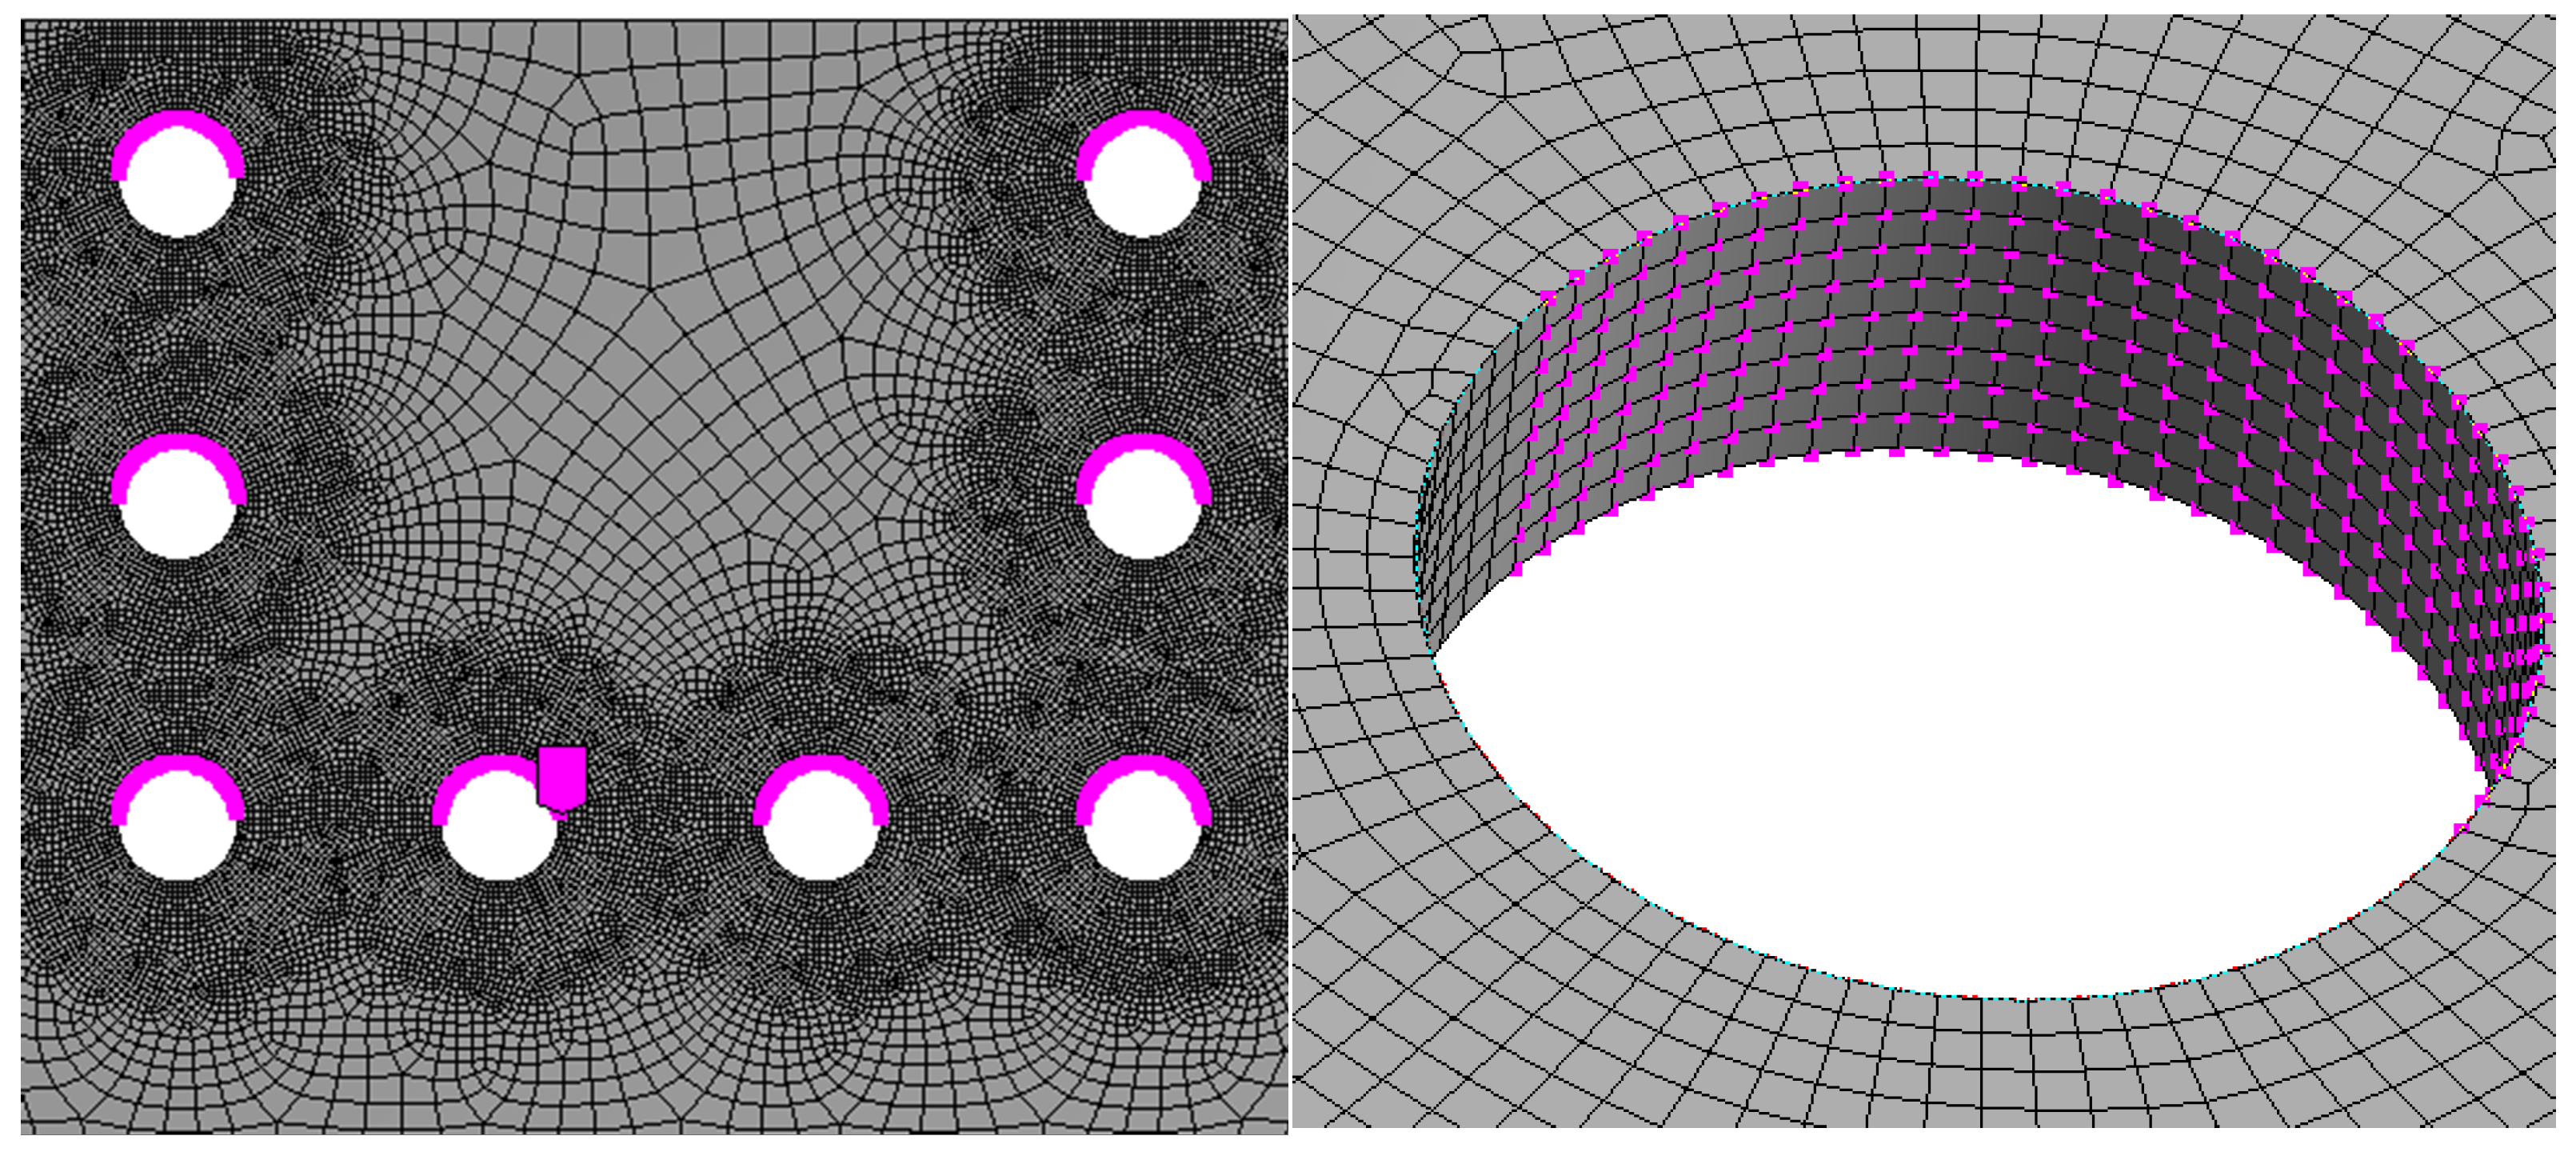
4.2. Loading and Mesh
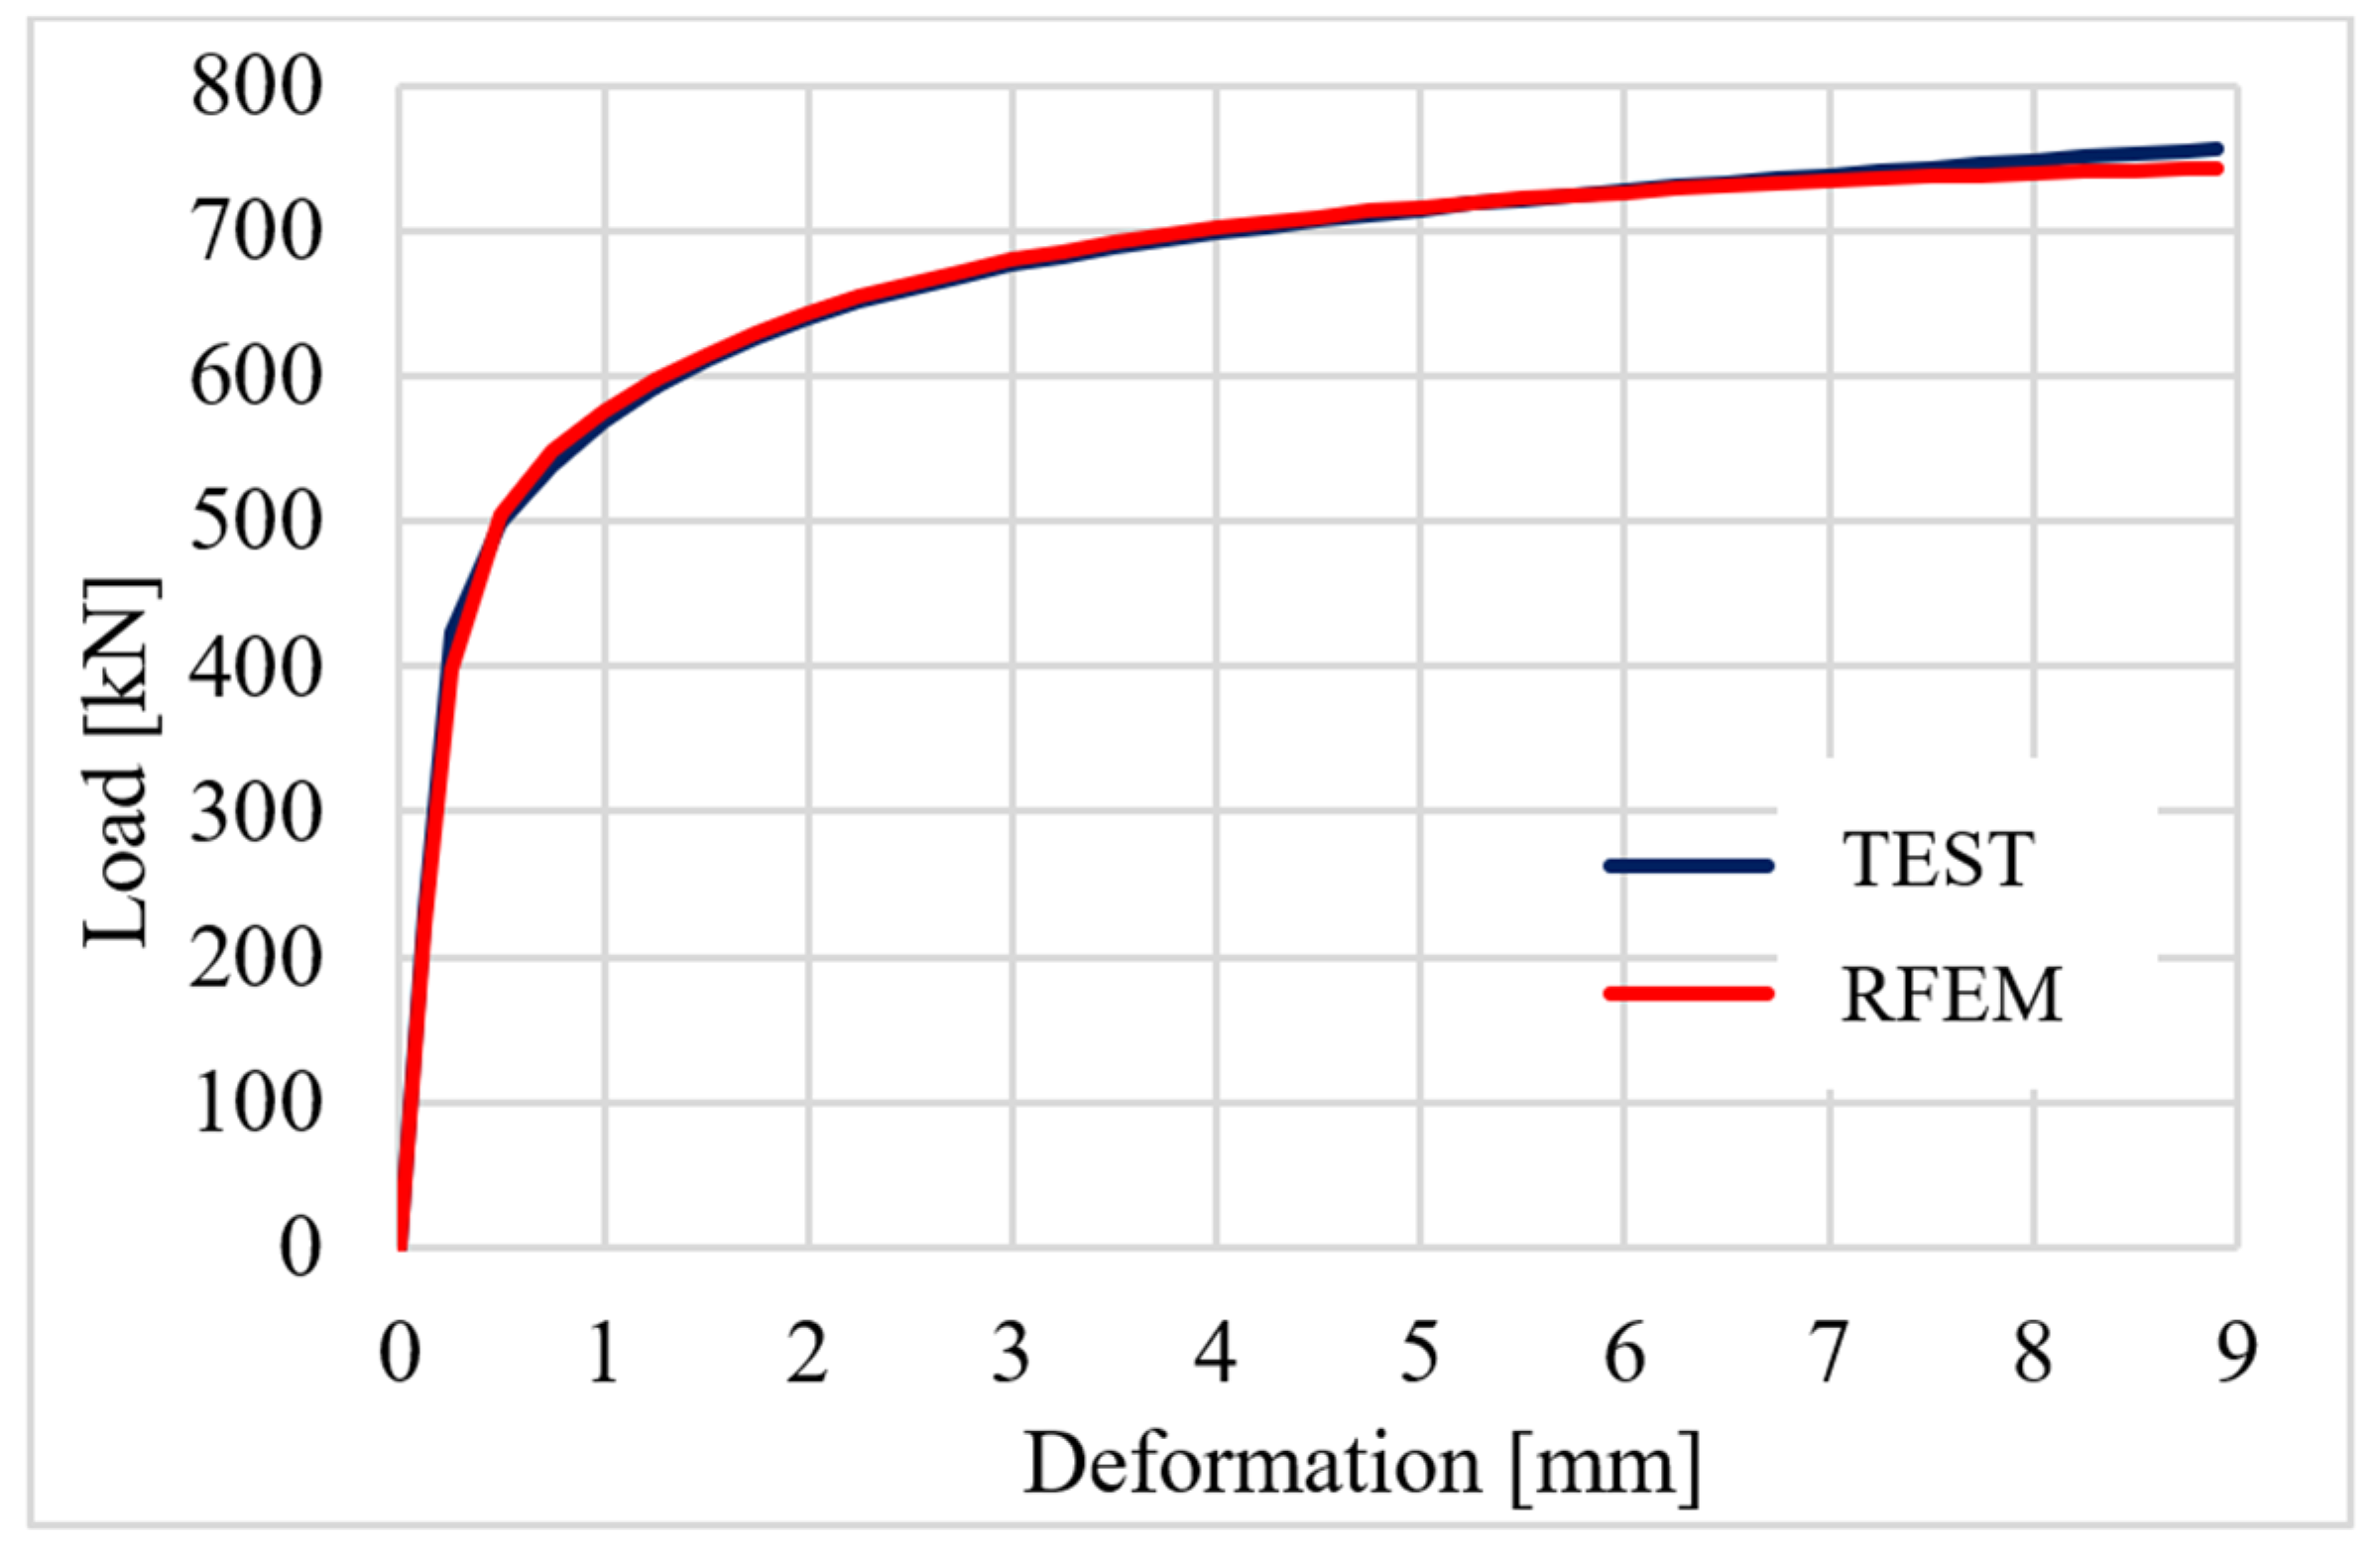
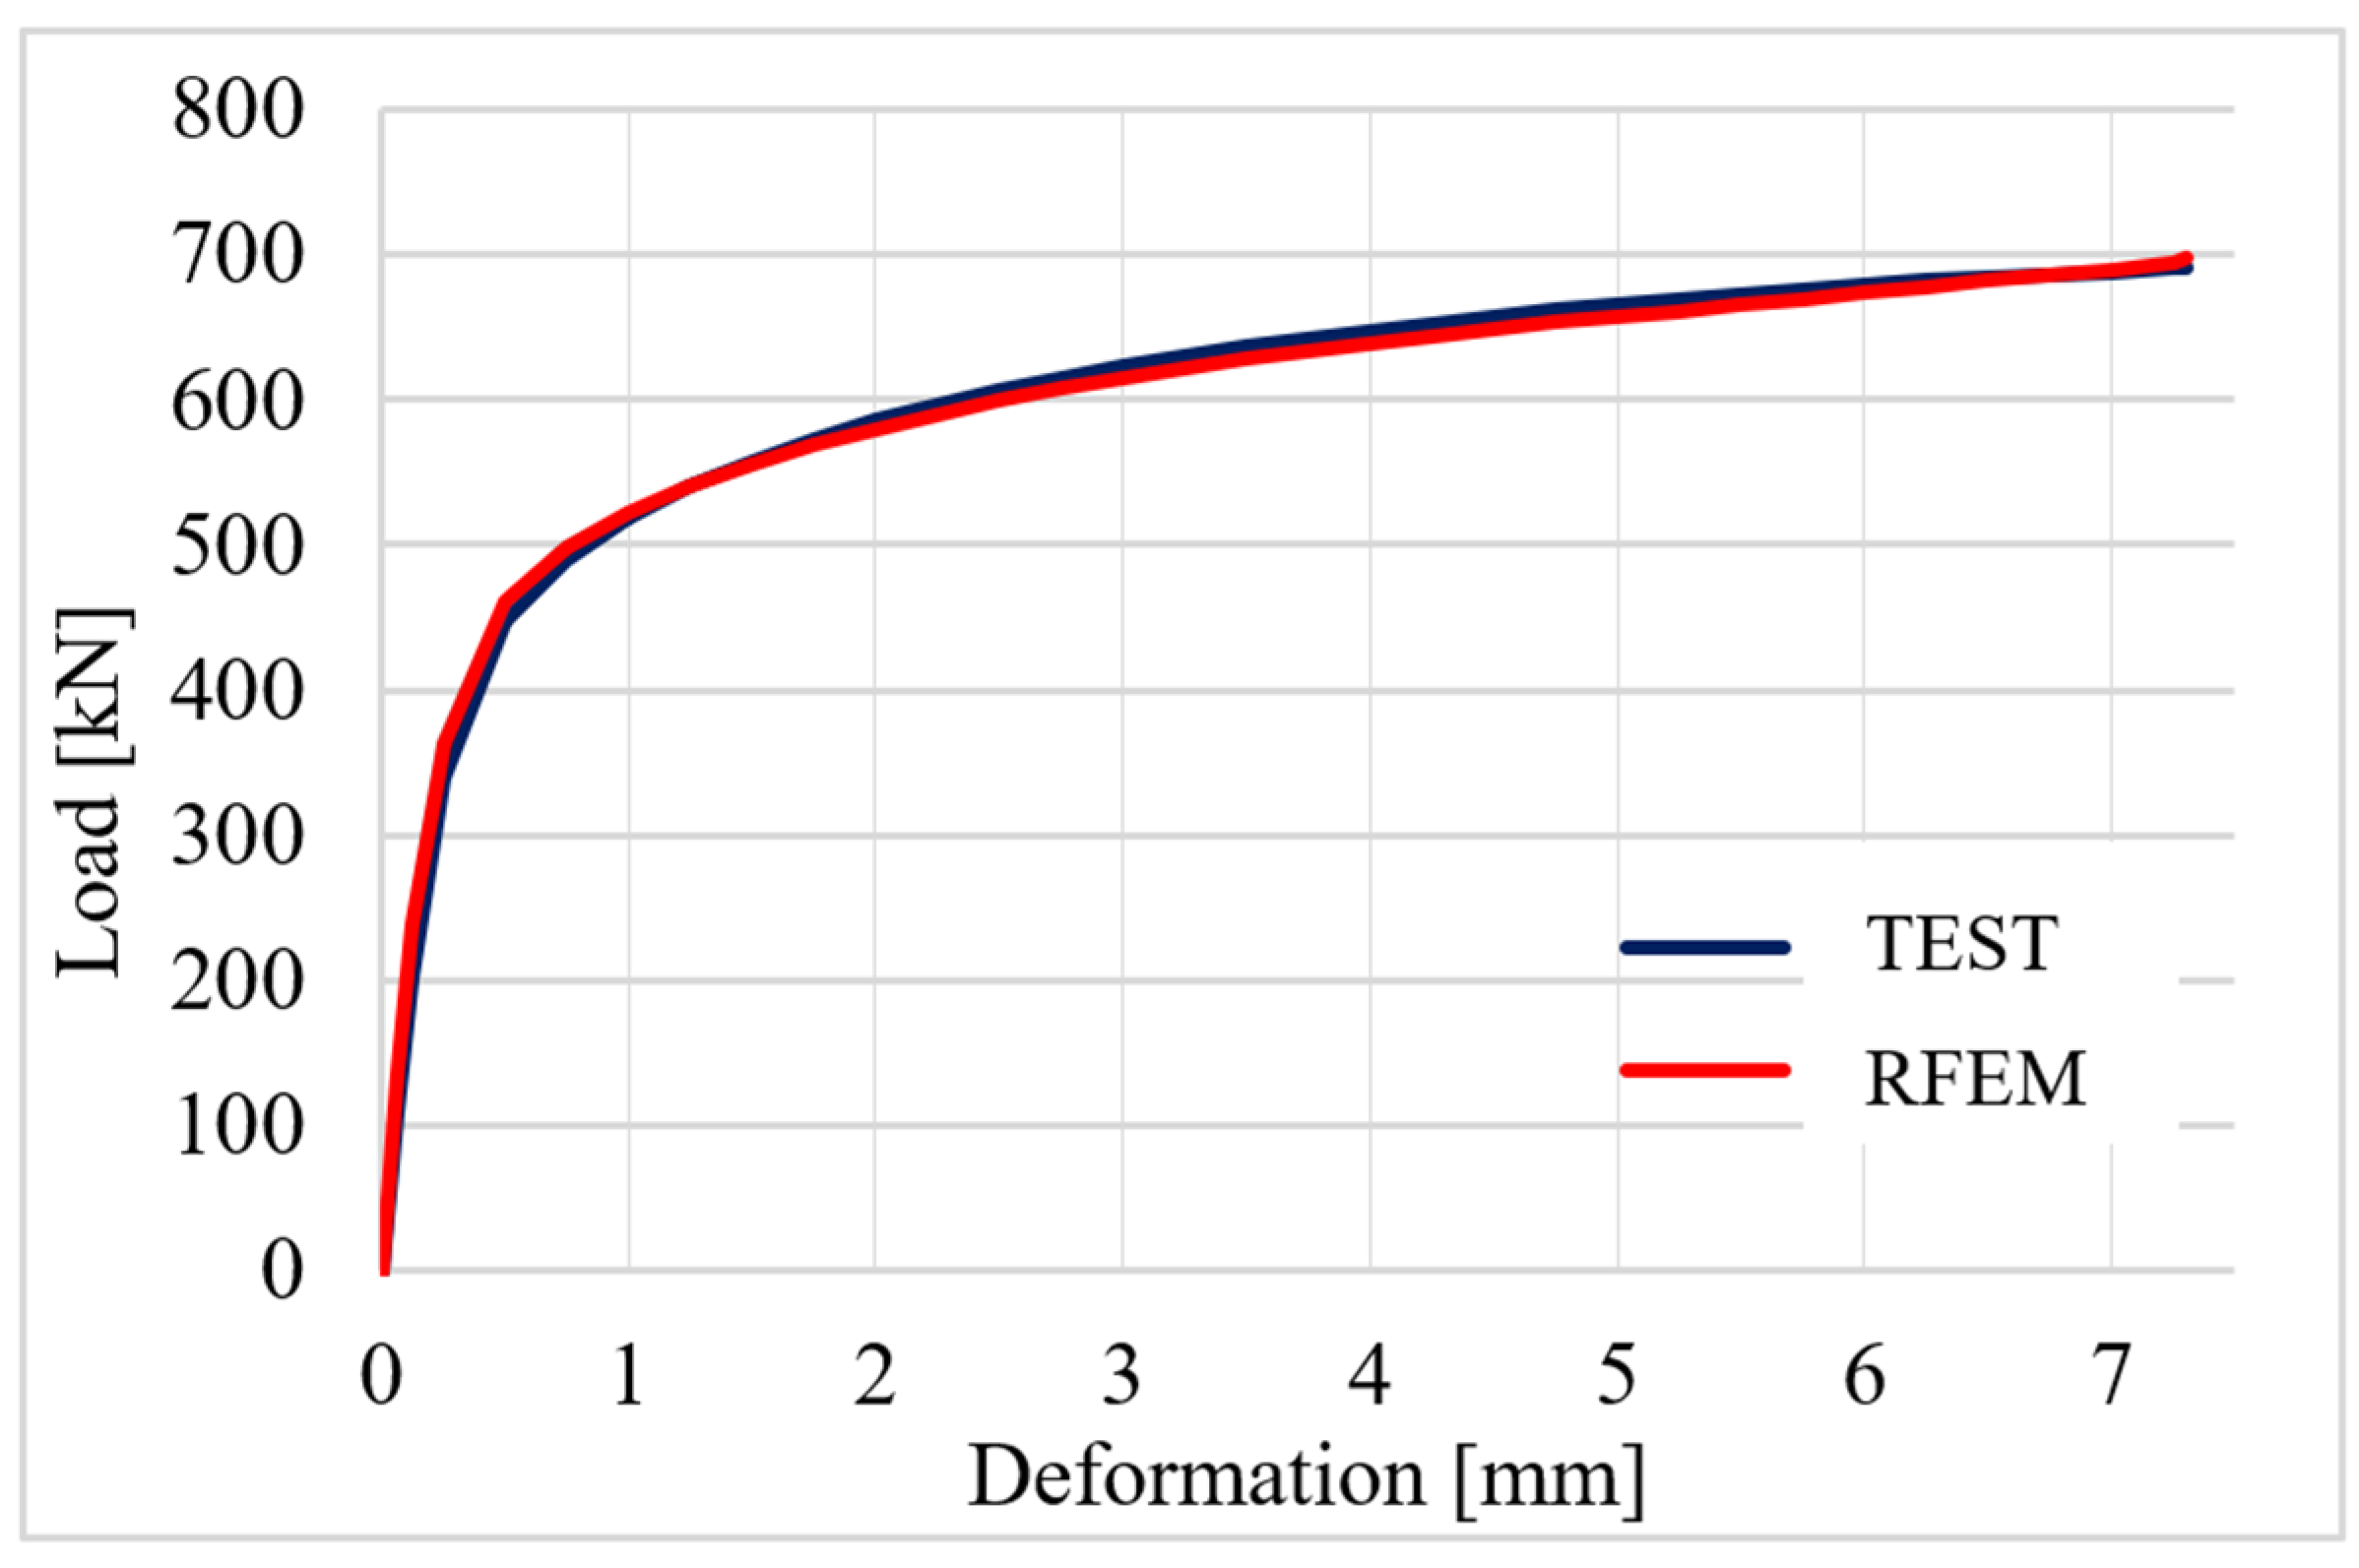
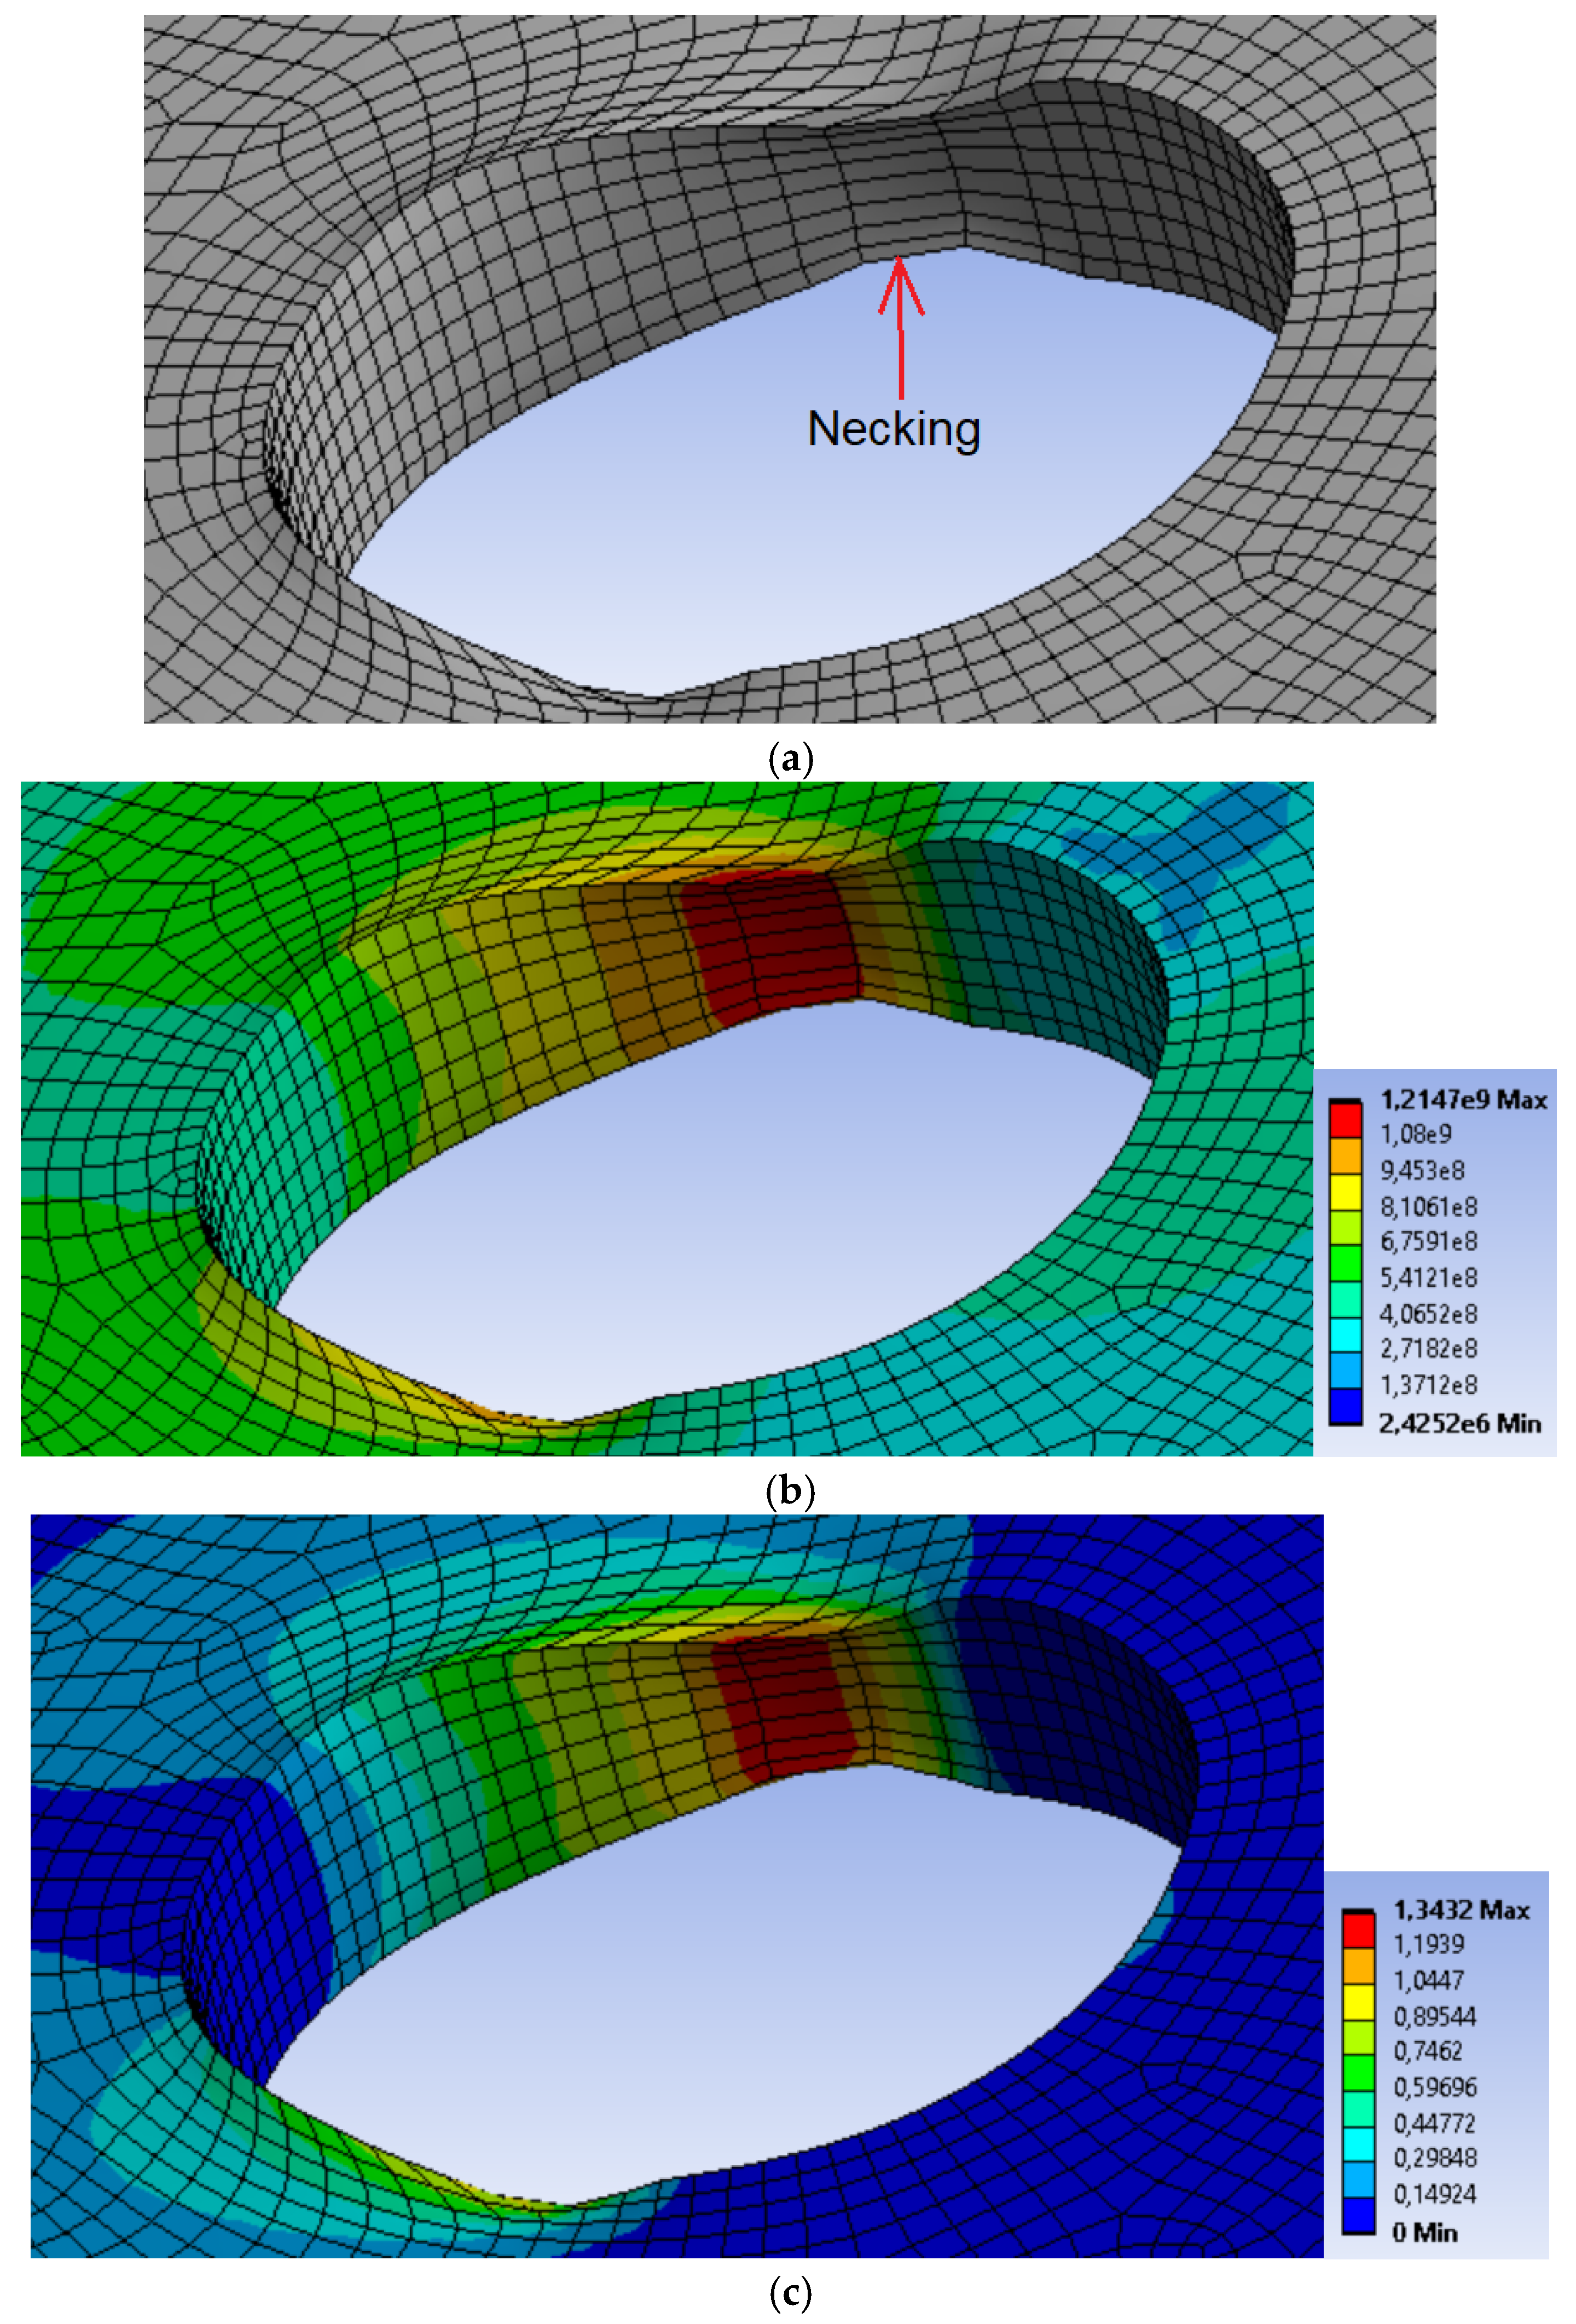
4.3. Validation
5. Design-Oriented Finite Element Analysis
5.1. Model
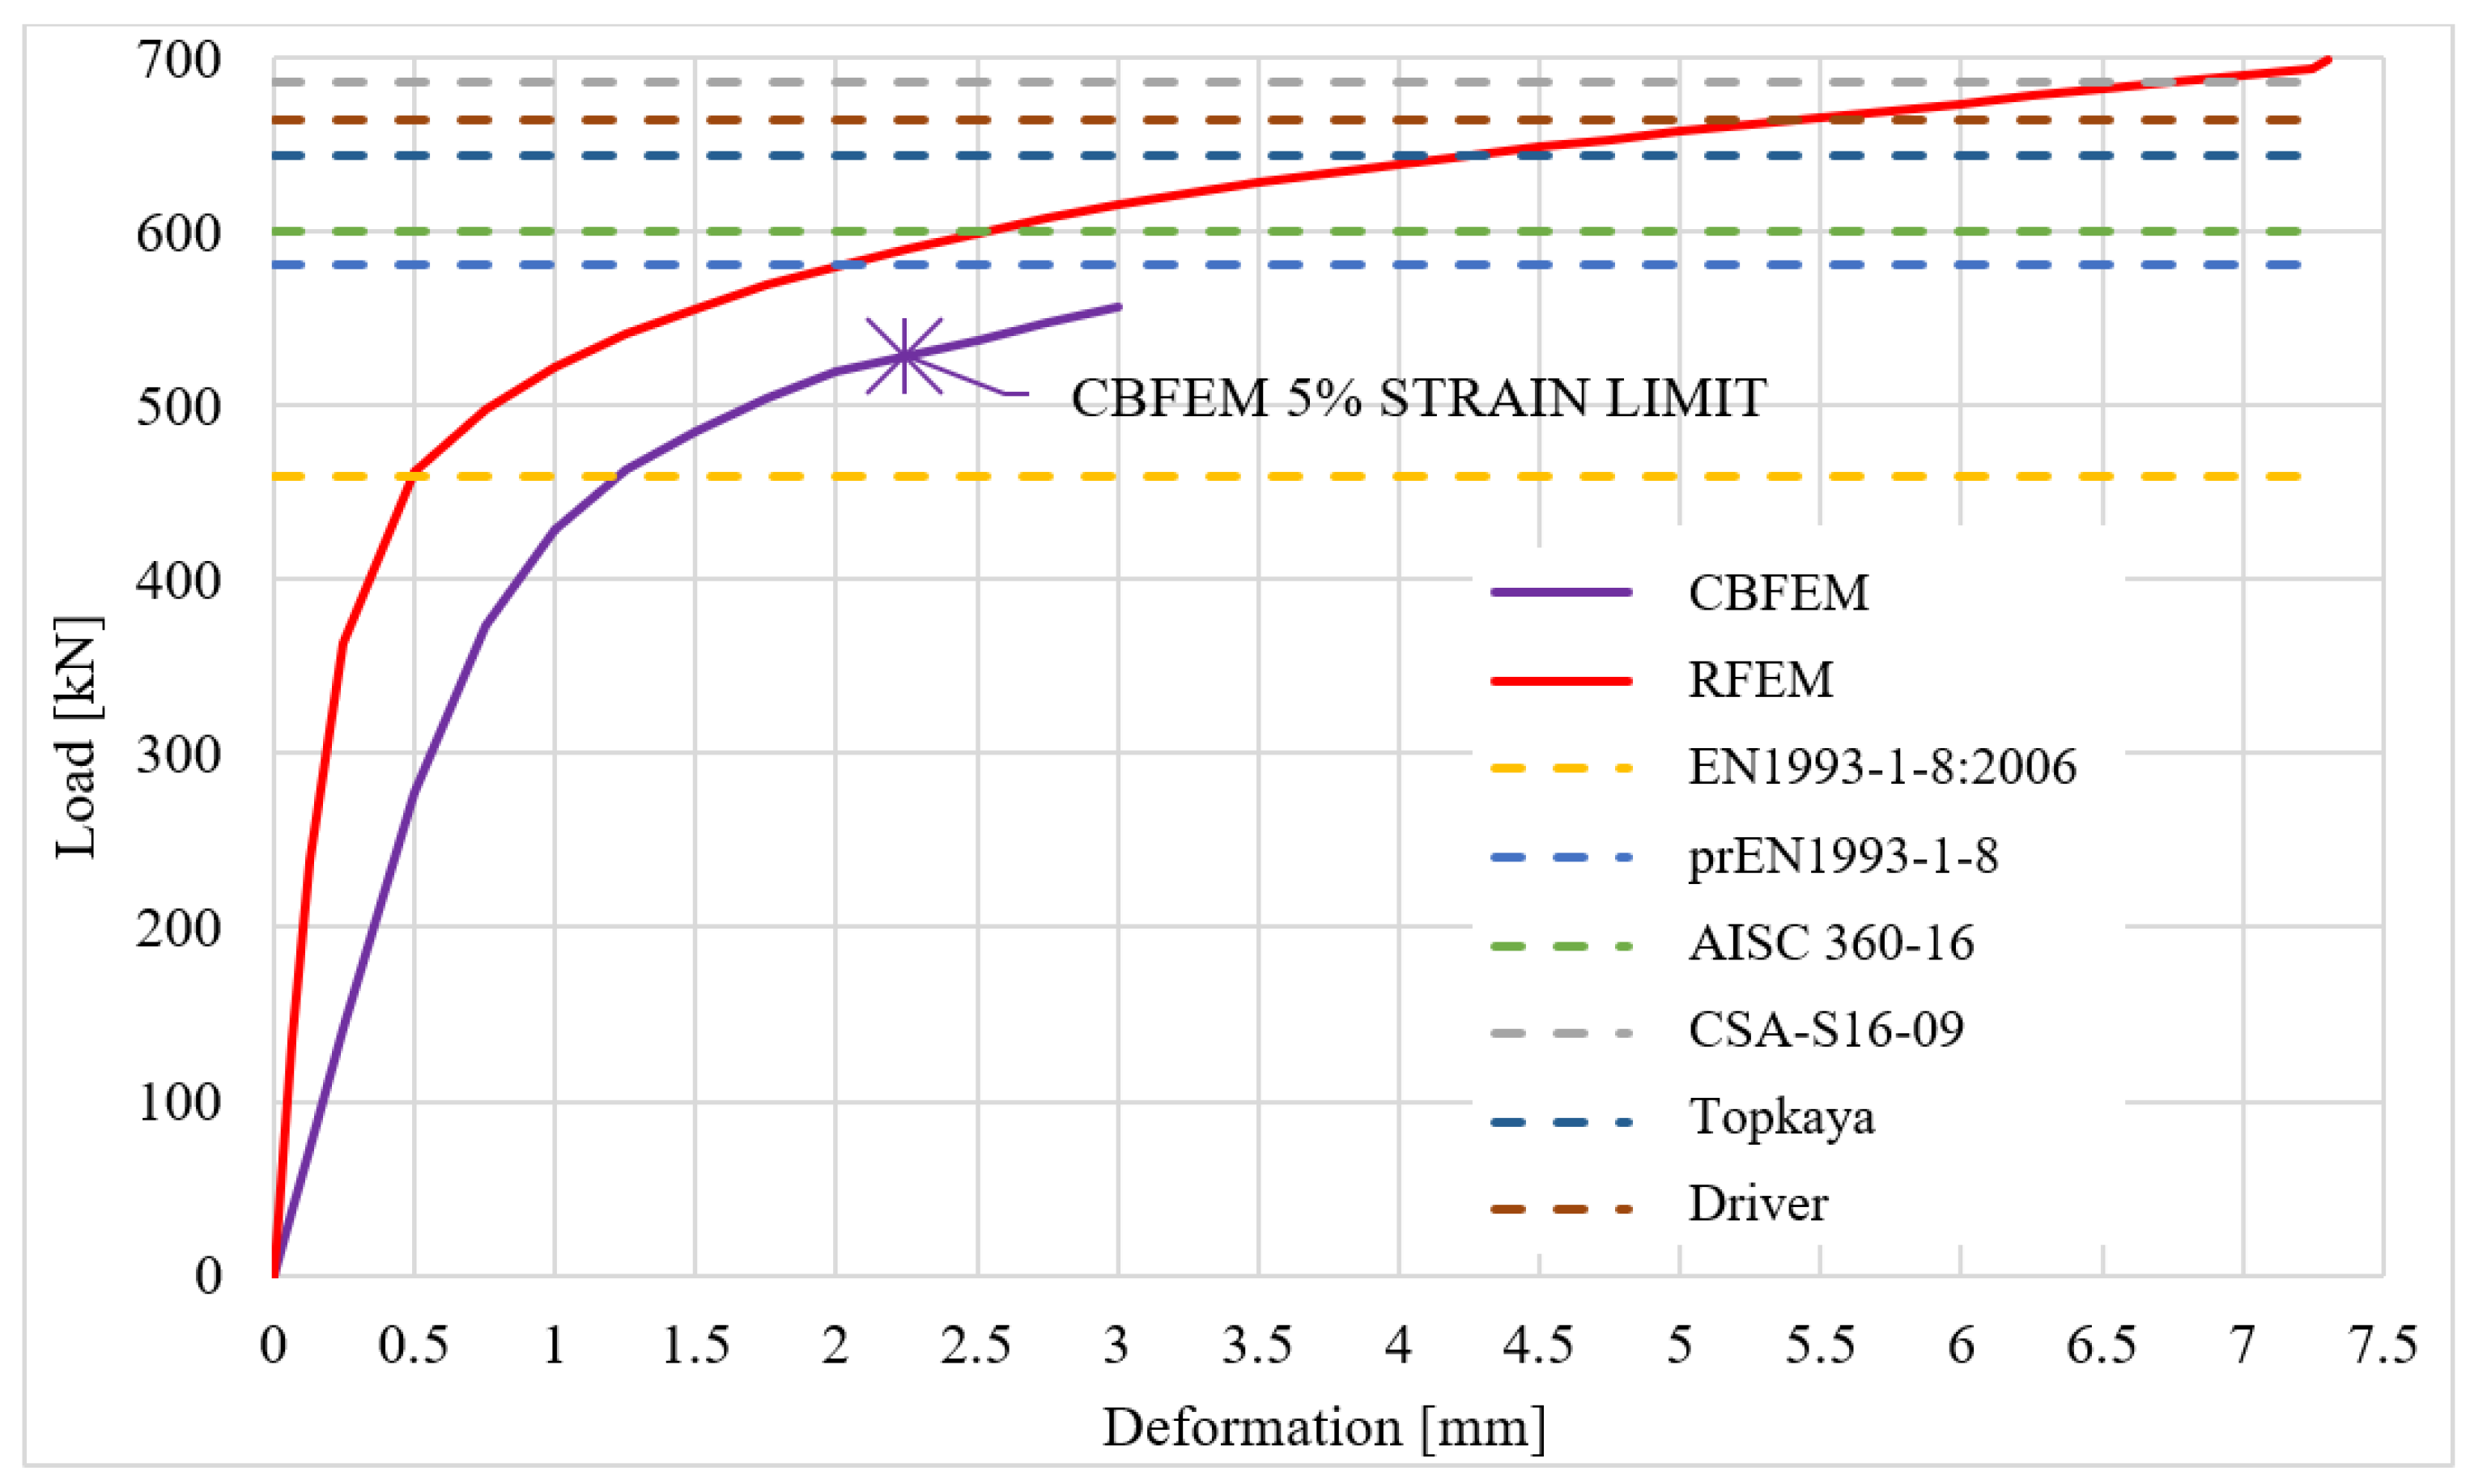
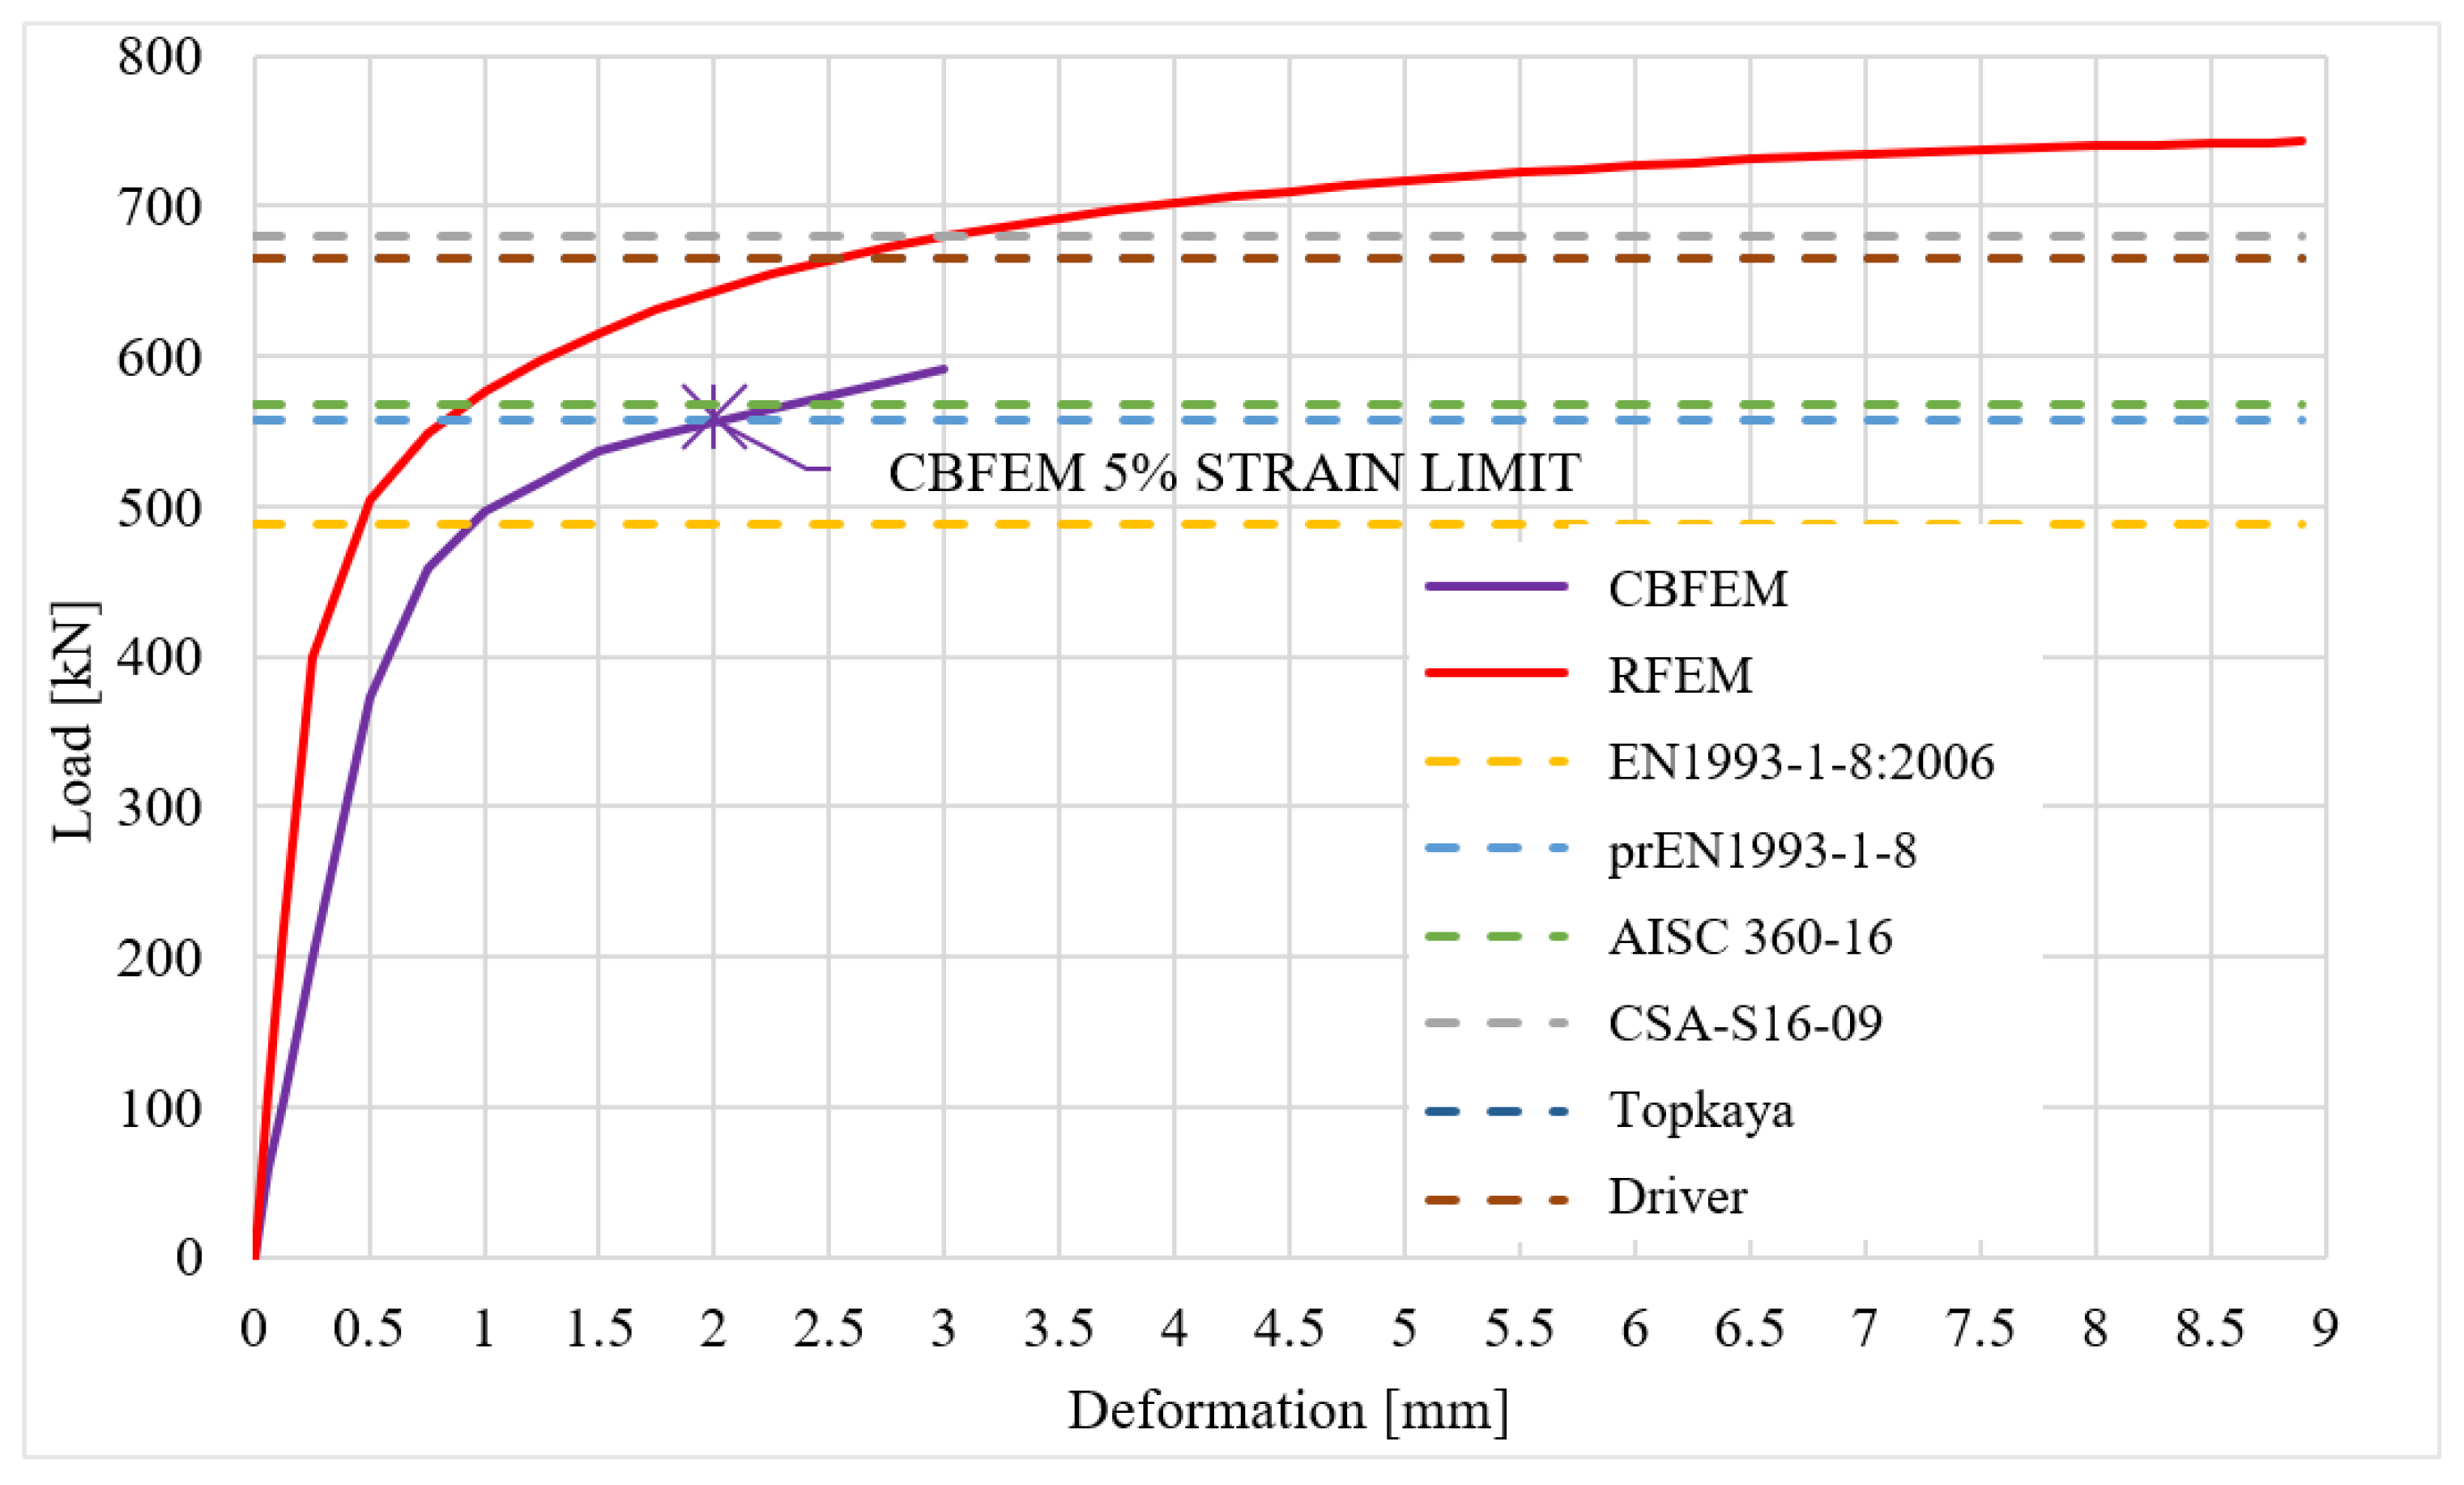
5.2. Verification
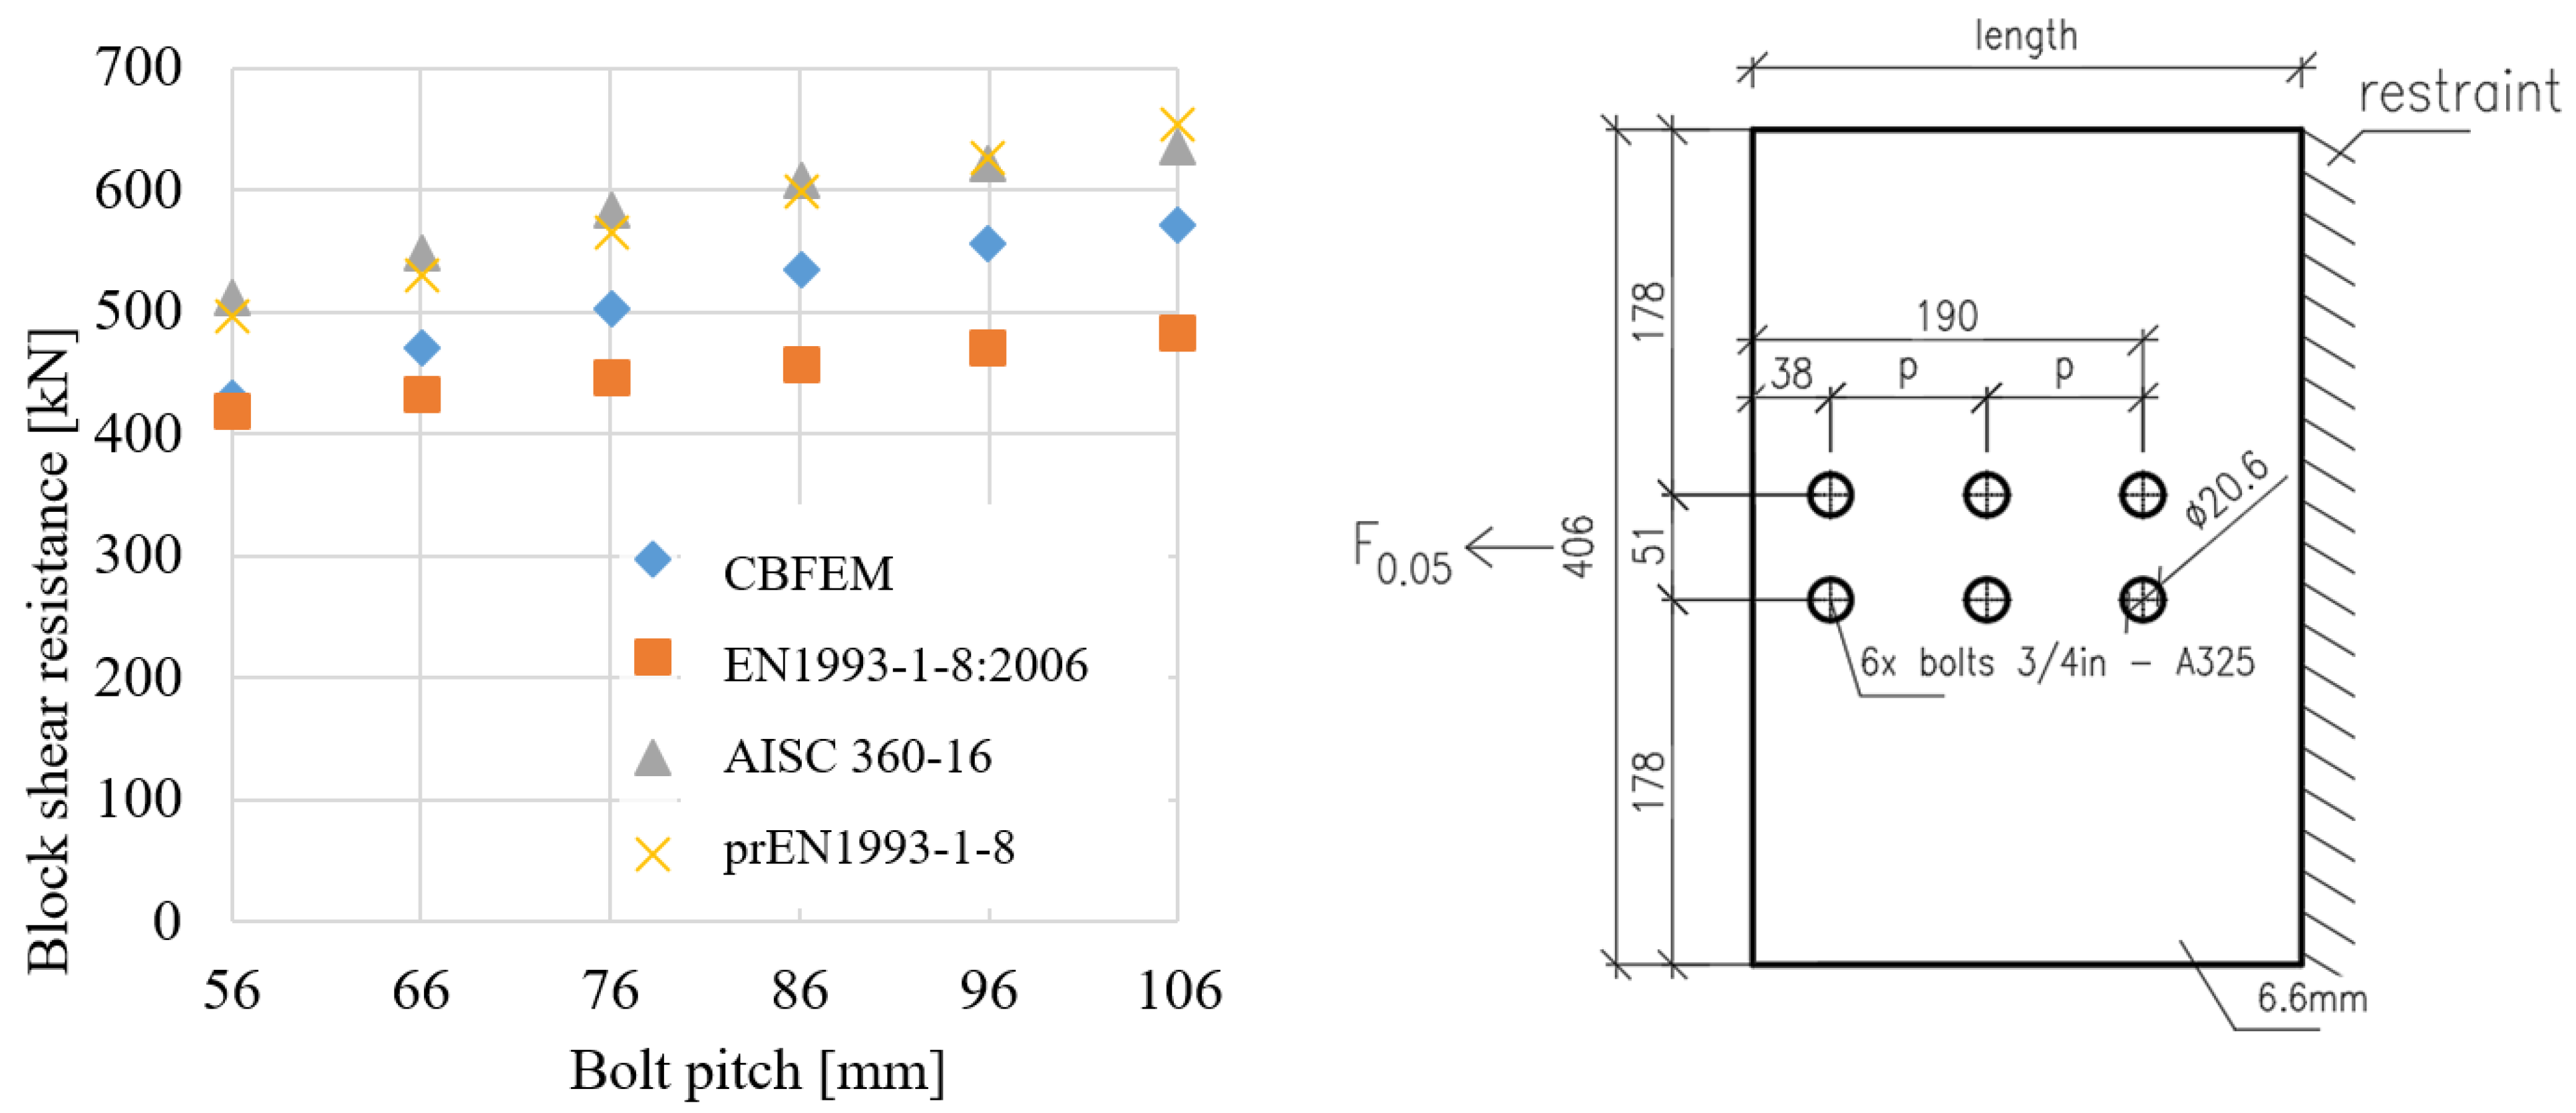
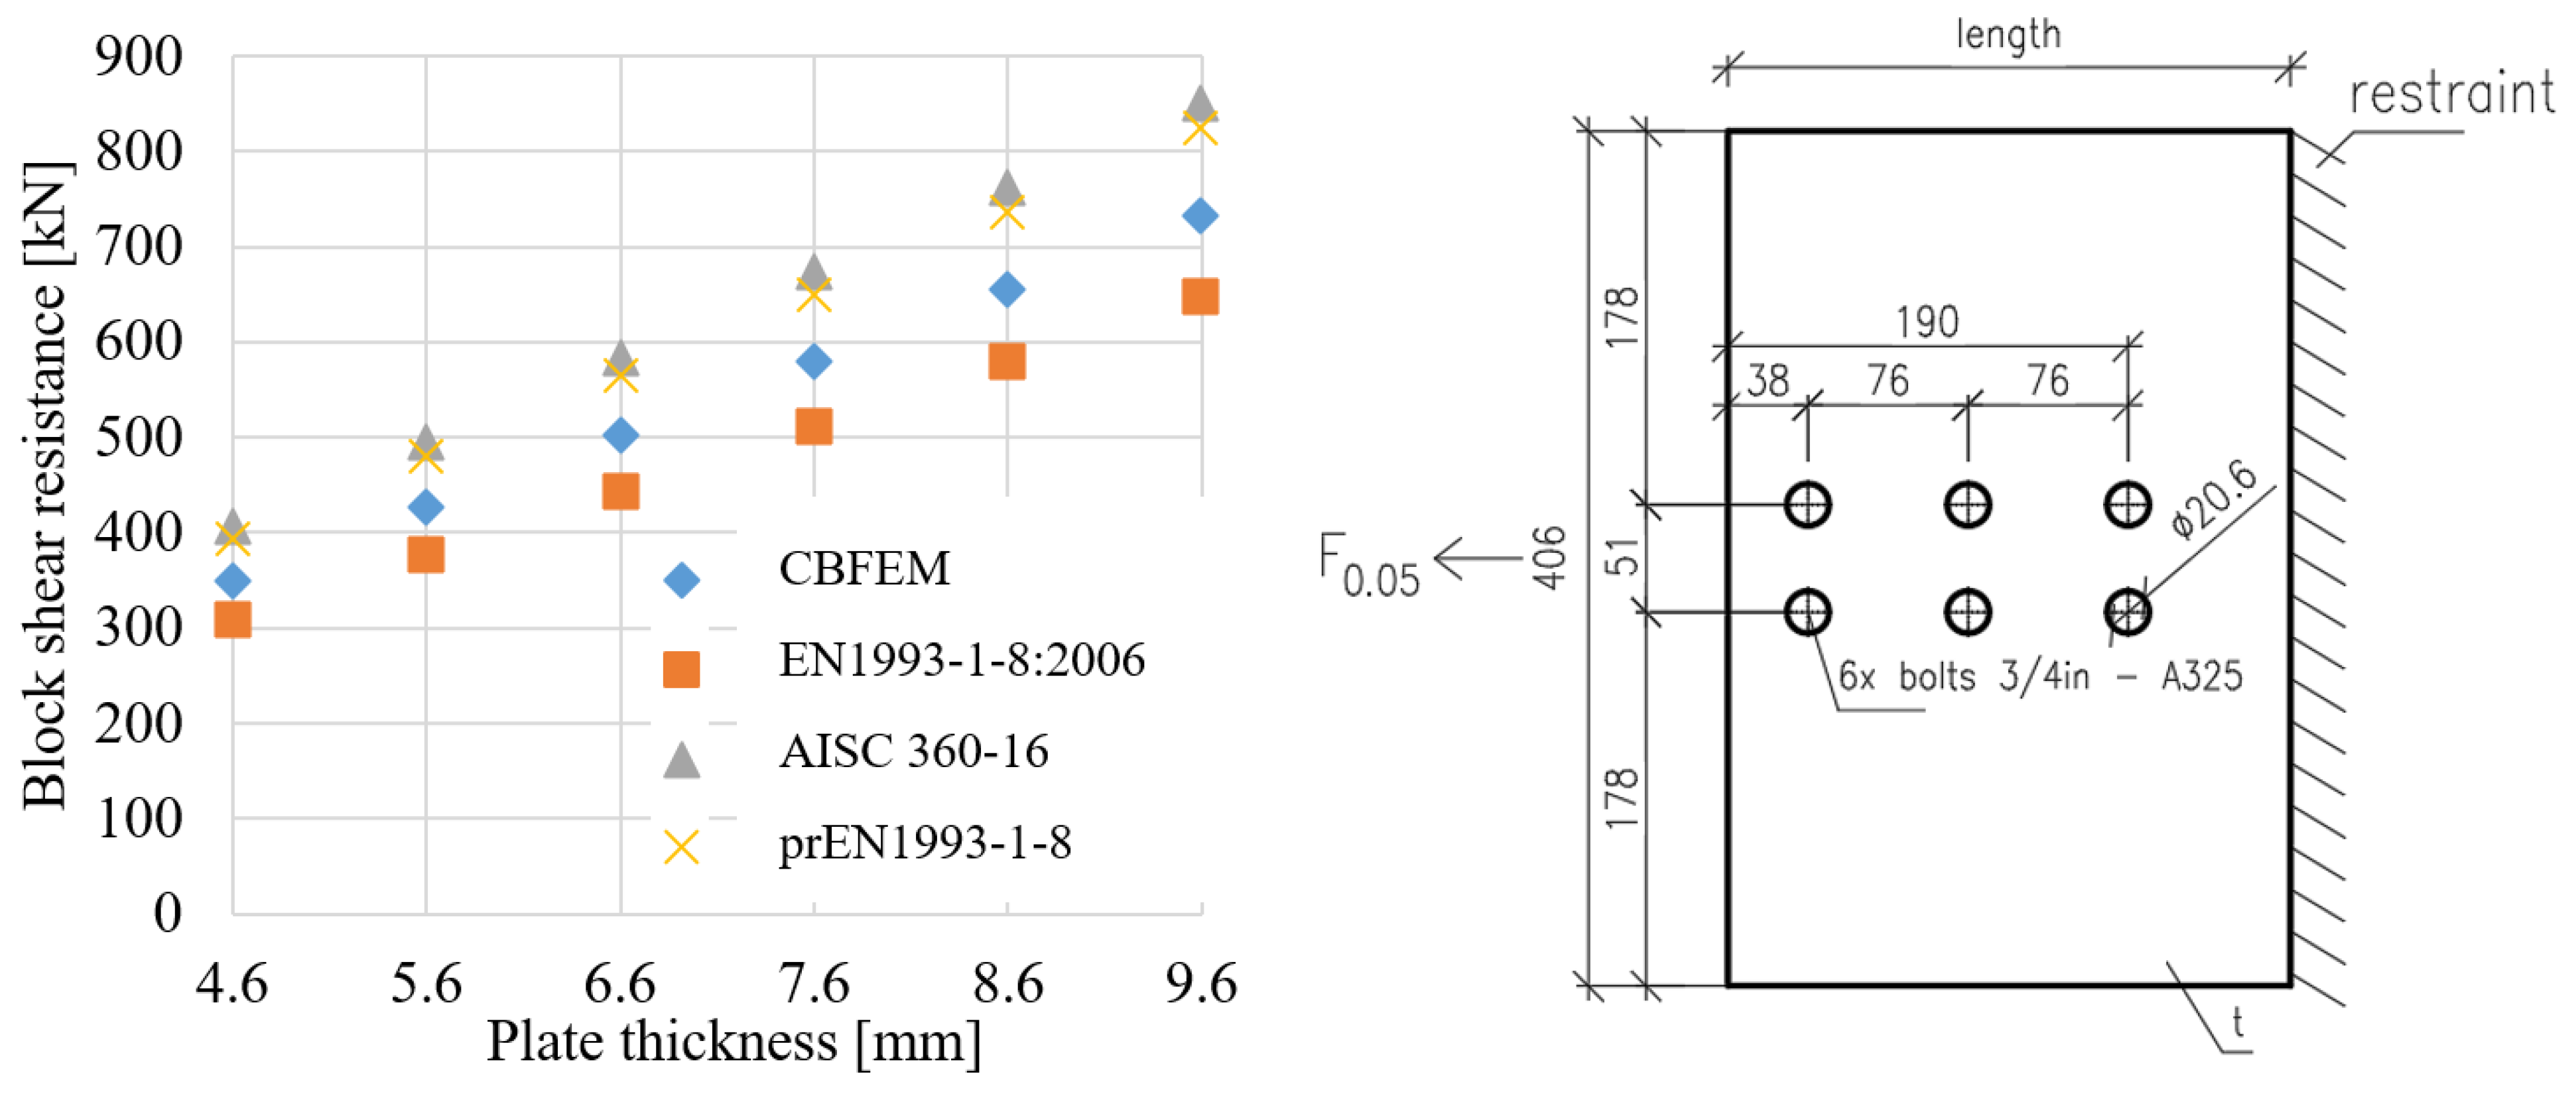
6. Sensitivity Study
7. Conclusions
Author Contributions
Funding
Data Availability Statement
Conflicts of Interest
References
- Birkemoe, P.C.; Gilmor, M.I. Behavior of Bearing Critical Double-Angle Beam Connections. Eng. J. 1978, 15, 109–115. [Google Scholar]
- Clements, D.A.; Teh, L.H. Active Shear Planes of Bolted Connections Failing in Block Shear. J. Struct. Eng. 2013, 139. [Google Scholar] [CrossRef] [Green Version]
- Teh, L.H.; Uz, M.E. Block shear failure planes of bolted connections—Direct experimental verifications. J. Constr. Steel Res. 2015, 111, 70–74. [Google Scholar] [CrossRef] [Green Version]
- Wen, H.; Mahmoud, H. Simulation of block shear fracture in bolted connections. J. Constr. Steel Res. 2017, 134, 1–16. [Google Scholar] [CrossRef]
- Topkaya, C.A. Finite Element Parametric Study on Block Shear Failure of Steel Tension Members. J. Constr. Steel Res. 2004, 60, 1615–1635. [Google Scholar] [CrossRef]
- Driver, R.G.; Grondin, G.Y.; Kulak, G.L. Unified block shear equation for achieving consistent reliability. J. Constr. Steel Res. 2006, 62, 210–222. [Google Scholar] [CrossRef]
- Grondin, G.Y.; Huns, B.B.S.; Driver, R.G. Block Shear Behaviour of Bolted Gusset Plates; Structural engineering report No. 248; University of Alberta: Edmonton, AB, Canada, 2002. [Google Scholar]
- Cunningham, T.J.; Orbison, J.G.; Ziemian, R.D. Assessment of American block shear load capacity predictions. J. Constr. Steel Res. 1995, 35, 323–338. [Google Scholar] [CrossRef]
- CEN. Eurocode 3: Design of Steel Structures—Part 1–8: Design of Joints; EN1993-1-8; CEN: Brussels, Belgien, 2006. [Google Scholar]
- American Institute of Steel Construction. Specification for Structural Steel Buildings; ANSI/AISC 360-16; American Institute of Steel Construction: Chicago, IL, USA, 2016. [Google Scholar]
- CEN. Eurocode 3: Design of Steel Structures—Part 1–8: Design of Joints; prEN1993-1-8; Final draft; CEN: Brussels, Belgien, 2020. [Google Scholar]
- Canadian Standard Association. Design of Steel Structures, CSA S16-09; Canadian Standard Association: Mississauga, ON, Canada, 2009. [Google Scholar]
- Kim, T.; Kuwamura, H. Finite element modelling of bolted connections in thin walled stainless steel plates under static shear. Thin Walled Struct. 2007, 45, 407–421. [Google Scholar] [CrossRef]
- Adewole, J.J.; Joy, O.O. Finite-element block shear failure deformation-to-fracture failure analysis. Can. J. Civ. Eng. 2020, 47, 418–427. [Google Scholar] [CrossRef]
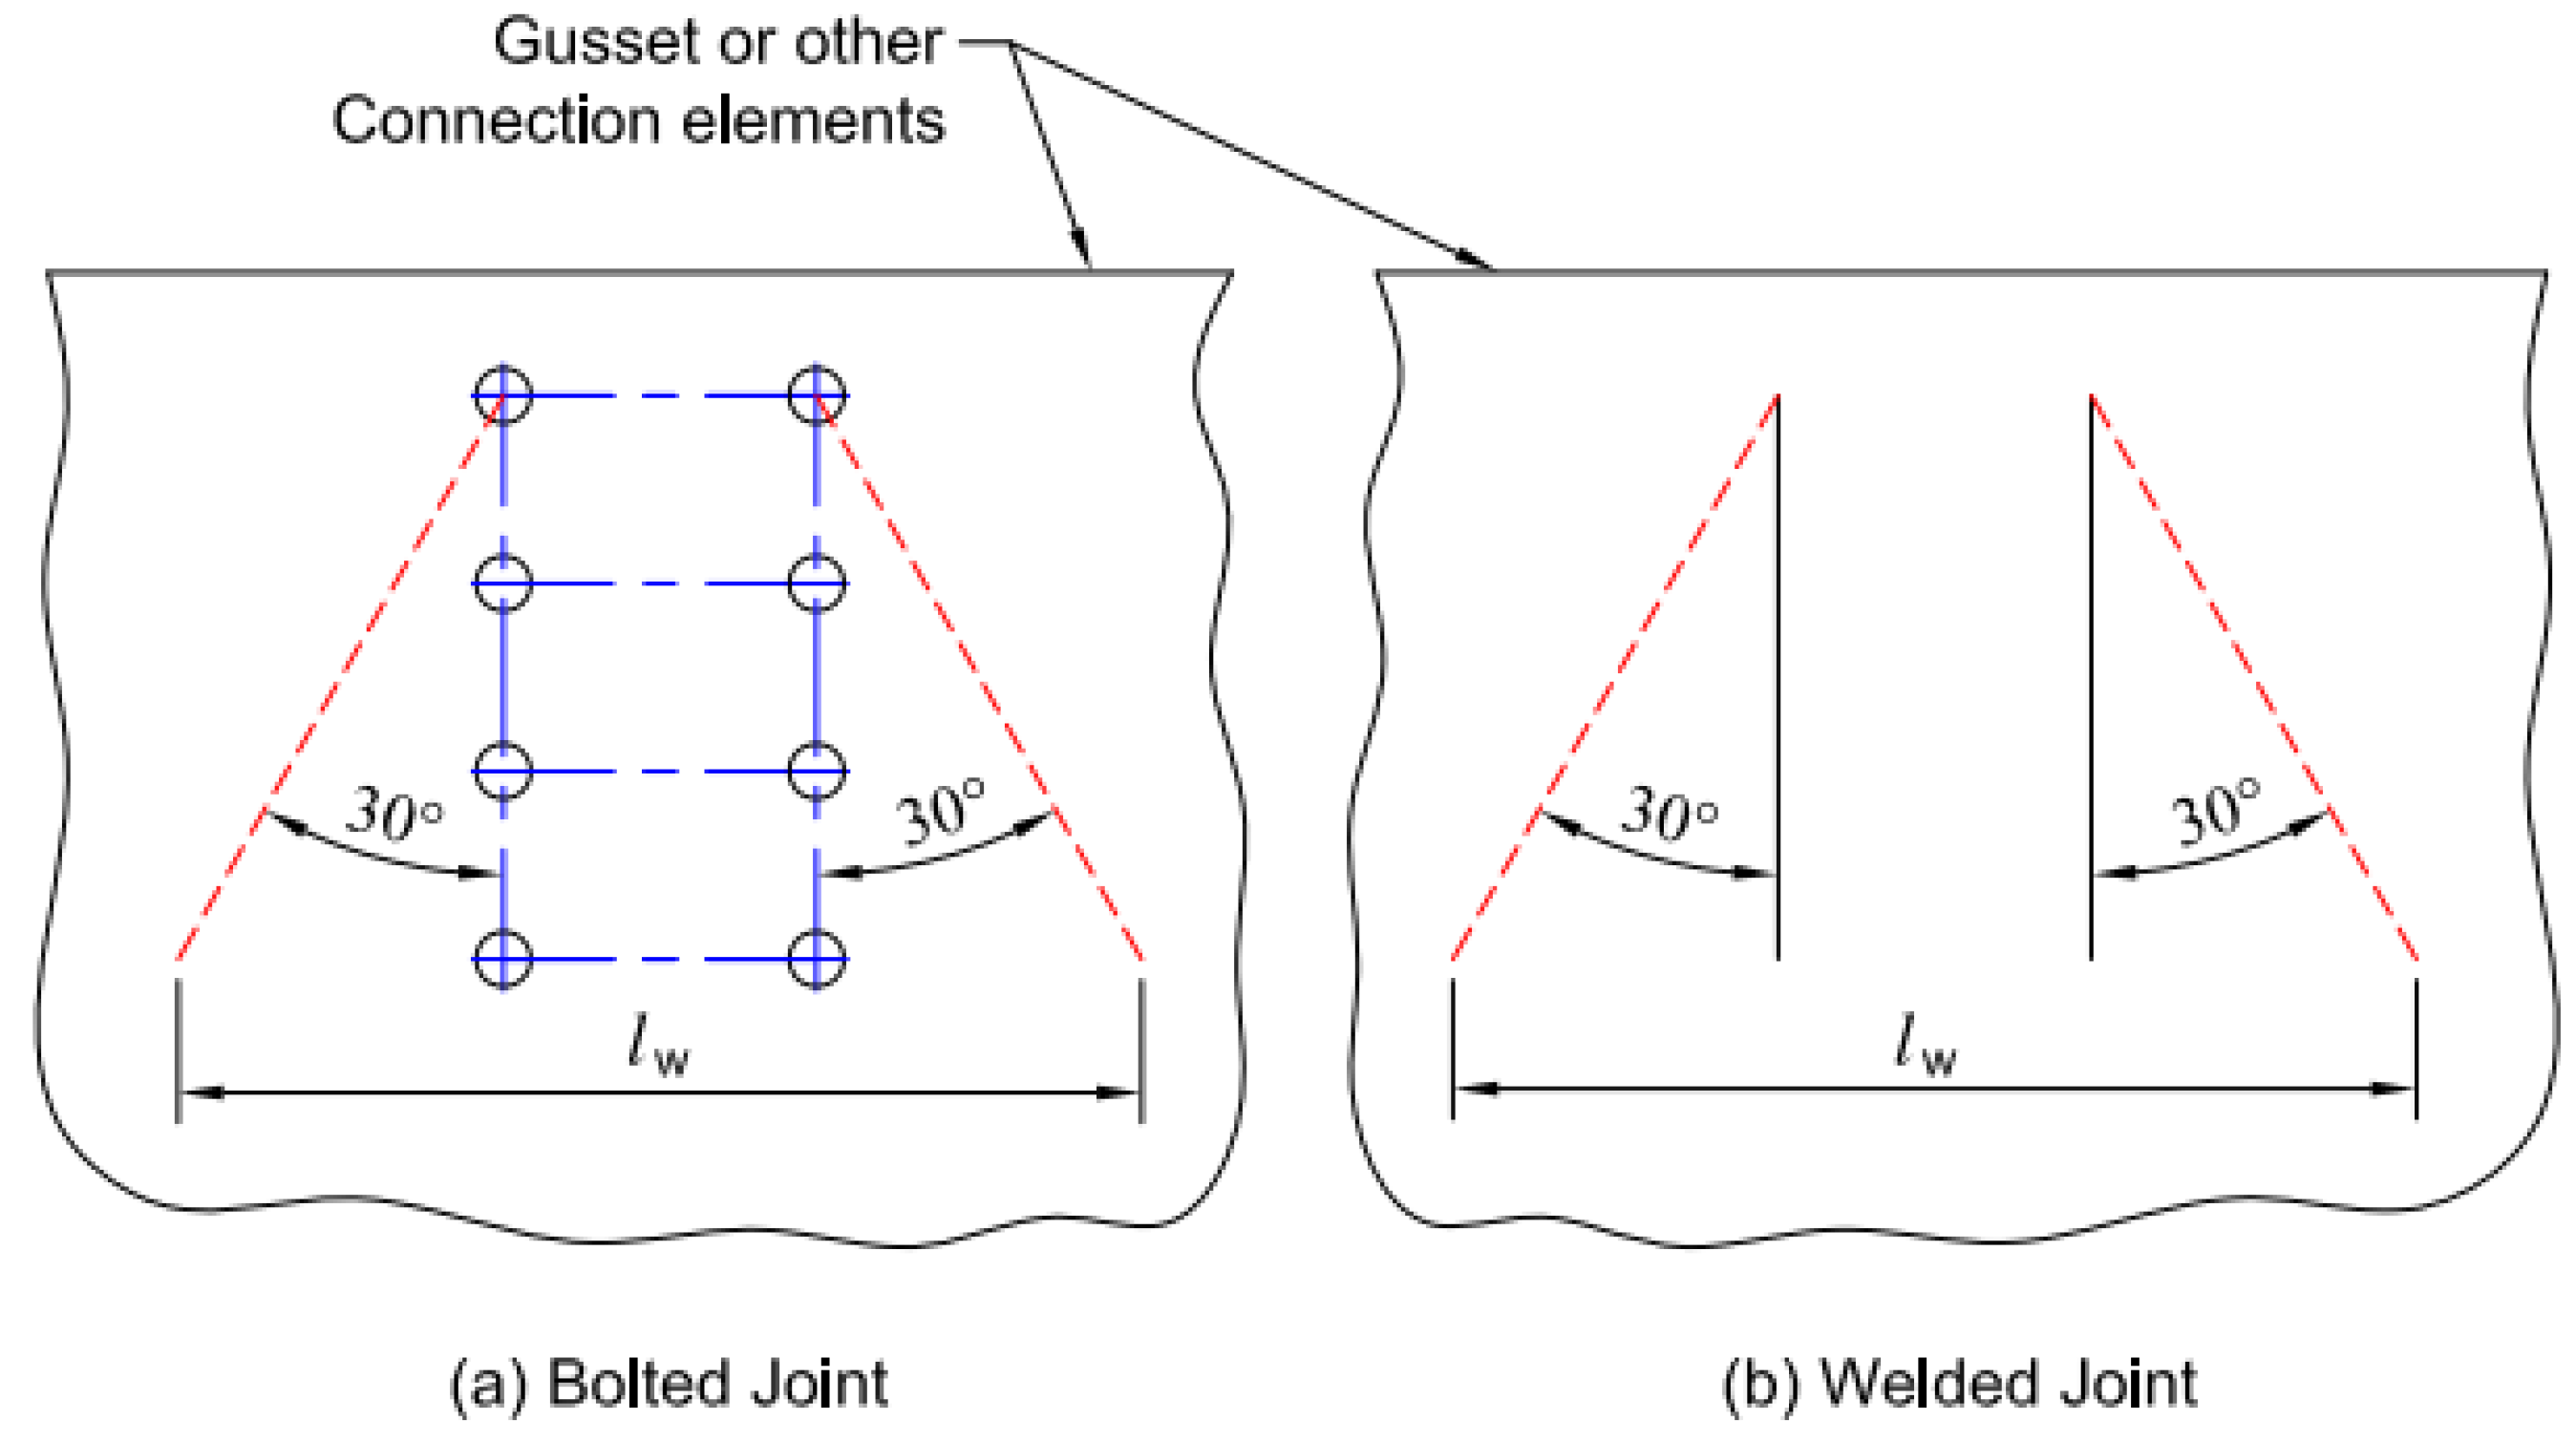
- Whitmore, R.E. Experimental Investigation of Stresses in Gusset Plates; Bulletin No. 16; Engineering Experiment Station, University of Tennessee: Knoxville, TN, USA, 1952. [Google Scholar]
- Thornton, W.A.; Carlo, L. The Whitmore Section: How to use the Whitmore method for tension and compression strength checks. In Modern Steel Construction; American Institute of Steel Construction: Chicago, IL, USA, 20 July 2011; pp. 52–56. [Google Scholar]
- Kulak, G.L.; Grondin, G.Y. Block Shear Failure in Steel Members—A Review of Design Practice. Eng. J. 2001, 38, 329–339. [Google Scholar]
- Jönsson, J. Block failure in connections—including effects of eccentric loads. In Proceedings of the 7th European Conference on Steel and Composite Structures (EUROSTEEL 2014), Napoli, Italy, 10–12 September 2014. [Google Scholar]
- Kim, T.; Hong, S.; Hwang, B.; Kim, J. Block shear capacity in cold-formed lean duplex stainless steel double-shear bolted connections. Thin Walled Struct. 2021, 161, 107520. [Google Scholar] [CrossRef]
- Ibrahimbegovic, A.; Taylor, R.L.; Wilson, E.L. A robust quadrilateral membrane finite element with drilling degrees of freedom. Int. J. Numer. Methods Eng. 1990, 30, 445–457. [Google Scholar] [CrossRef]
- Dvorkin, E.N.; Bathe, K.J. A continuum mechanics based four-node shell element for general non-linear analysis. Eng. Comput. 1984, 1, 77–88. [Google Scholar] [CrossRef] [Green Version]
- Wald, F.; Vild, M.; Kuříková, M.; Kabeláč, J.; Sekal, D.; Maier, N.; Da Silva Seco, L.; Couchaux, M. Finite-Element-Bemessung von Stahlverbindungen basierend auf der Komponentenmethode. Stahlbau 2020, 89, 482–495. [Google Scholar] [CrossRef]
- Gödrich, L.; Wald, F.; Kabeláč, J.; Kuříková, M. Design finite element model of a bolted T-stub connection component. J. Constr. Steel Res. 2019, 157, 198–206. [Google Scholar] [CrossRef]


| Plate Properties: | |
| Modulus of elasticity—E (MPa) | 197,553 |
| Static yield stress—Fy (MPa) | 336 |
| Static ultimate stress—Fu (MPa) | 450 |
| Poisson’s ratio—ν (-) | 0.3 |
| Bolts A325: | |
| Modulus of elasticity—E (MPa) | 200,000 |
| Static yield stress—Fy (MPa) | 660 |
| Static ultimate stress—Fu (MPa) | 830 |
| T1 Specimen | Values | Experiment/RFEM Ratio (-) | ||
|---|---|---|---|---|
| Compared Parameters | Units | Experiment | RFEM | |
| Nj,ini | (MN/m) | 1717.7 | 2153.4 | 0.80 |
| Fpeak | (kN) | 691.2 | 698.1 | 0.99 |
| F2mm | (kN) | 586.2 | 580.1 | 1.01 |
| F0.05 | (kN) | N/A | 486.3 | N/A |
| F2/3 | (kN) | 663.0 | 654.5 | 1.01 |
| T2 Specimen | Values | Experiment/RFEM Ratio (-) | ||
|---|---|---|---|---|
| Compared Parameters | Units | Experiment | RFEM | |
| Nj,ini | (MN/m) | 1846.4 | 1773.1 | 1.04 |
| Fpeak | (kN) | 756.0 | 742.9 | 1.02 |
| F2mm | (kN) | 639.9 | 643.3 | 0.99 |
| F0.05 | (kN) | N/A | 421.0 | N/A |
| F2/3 | (kN) | 727.0 | 726.5 | 1.00 |
| T1 Specimen | Values | CBFEM/RFEM Ratio (-) | ||
|---|---|---|---|---|
| Compared Parameters | Units | RFEM | CBFEM | |
| Nj,ini | (MN/m) | 2153.4 | 594.3 | 0.28 |
| Fpeak | (kN) | 698.1 | 523.0 | 0.75 |
| F2mm | (kN) | 580.1 | 519.7 | 0.90 |
| F0.05 | (kN) | 486.3 | 523.0 | 1.08 |
| F2/3 | (kN) | 654.5 | 519.7 | 0.79 |
| T2 Specimen | Values | CBFEM/RFEM Ratio (-) | ||
|---|---|---|---|---|
| Compared Parameters | Units | RFEM | CBFEM | |
| Nj,ini | (MN/m) | 1773.1 | 932.8 | 0.53 |
| Fpeak | (kN) | 742.9 | 554.4 | 0.75 |
| F2mm | (kN) | 643.3 | 556.3 | 0.86 |
| F0.05 | (kN) | 421.0 | 554.4 | 1.32 |
| F2/3 | (kN) | 726.5 | 556.2 | 0.77 |
Publisher’s Note: MDPI stays neutral with regard to jurisdictional claims in published maps and institutional affiliations. |
© 2021 by the authors. Licensee MDPI, Basel, Switzerland. This article is an open access article distributed under the terms and conditions of the Creative Commons Attribution (CC BY) license (https://creativecommons.org/licenses/by/4.0/).
Share and Cite
Kuříková, M.; Sekal, D.; Wald, F.; Maier, N. Advanced Design of Block Shear Failure. Metals 2021, 11, 1088. https://doi.org/10.3390/met11071088
Kuříková M, Sekal D, Wald F, Maier N. Advanced Design of Block Shear Failure. Metals. 2021; 11(7):1088. https://doi.org/10.3390/met11071088
Chicago/Turabian StyleKuříková, Marta, David Sekal, František Wald, and Nadine Maier. 2021. "Advanced Design of Block Shear Failure" Metals 11, no. 7: 1088. https://doi.org/10.3390/met11071088
APA StyleKuříková, M., Sekal, D., Wald, F., & Maier, N. (2021). Advanced Design of Block Shear Failure. Metals, 11(7), 1088. https://doi.org/10.3390/met11071088