Article

Parameter Optimization of Hybrid-Tandem Gas Metal Arc Welding Using Analysis of Variance-Based Gaussian Process Regression

1
Department of Mechanical Engineering, Hanyang University, Wangsimniro, Seongdonggu 222, Seoul 04763, Korea
2
Department of Aerospace Engineering, Iowa State University, 537 Bissell Road, Ames, IA 50011, USA
*
Author to whom correspondence should be addressed.
Metals 2021, 11(7), 1087; https://doi.org/10.3390/met11071087
Submission received: 1 June 2021 / Revised: 3 July 2021 / Accepted: 4 July 2021 / Published: 7 July 2021

Abstract

:
In this paper, the parameter optimization of the hybrid-tandem gas metal arc welding (GMAW) process was studied. The hybrid-tandem GMAW process uses an additional filler-wire with opposite polarity in contrast to the conventional tandem process. In this process, more process parameters and the relationship between the parameters causing strong nonlinearity should be considered. The analysis of variance-based Gaussian process regression (ANOVA-GPR) method was implemented to construct surrogate modeling, which can express nonlinearity including uncertainty of weld quality. Major parameters among several process parameters in this welding process can be extracted by use of this novel method. The weld quality used as a cost function in the optimization of process parameters is defined by characteristics related to penetration and bead shape, and the sequential quadratic programming (SQP) method was used to determine the optimal welding condition. This approach enabled sound weld quality at a high travel speed of 1.9 m/min, which is difficult to achieve in the hybrid-tandem GMAW process.

Graphical Abstract

1. Introduction

Gas metal arc welding (GMAW) is a crucial manufacturing technology that affects the quality and productivity of car manufacturing, shipbuilding, and plant industries. In order to increase the quality and productivity of products produced using GMAW, new processes are developed by fusion of existing processes [1,2,3]. Especially in the shipbuilding industry, the welding of thick plates mainly uses a tandem GMAW that locates two electrodes on one molten pool, which increases productivity by improving the travel speed and deposit rate. In general, to increase the travel speed and deposit rate, new approaches such as higher current engagement or electrode addition are investigated. However, those approaches frequently generate arc interference between electrodes due to duplicated electromagnetic forces or instability of the molten pool due to the induced electromagnetic forces. For these reasons, these methods degrade the quality of welding with spatters or poor bead shape. To overcome these weaknesses, as a substitute to tandem GMAW, a novel tandem GMAW process is experimentally introduced to improve productivity and welding quality. The new process has an additional filler-wire between the leading and trailing electrodes configuration of the tandem welding process. As a result, the added filler-wire is able to stabilize the molten pool by diminishing the arc interference by controlling the inter-wire distance (IWD) or the reverse current amount between the electrodes.
Many researchers have proved the benefit of this process. For example, Arita et al. [4] proposed an advanced tandem metal active gas (MAG) process, which adds filler-wire with reverse polarity to the tandem welding process. The advanced MAG process was reported to produce fewer interfering arcs between electrodes during high-speed welding processes that guarantee better stability of the molten pool than the traditional tandem process. In another study, Yokota et al. [5] argued that the advanced tandem MAG process provided more uniform bead shapes and better porosity resistance than the conventional tandem welding process. Xiang et al. [6] proposed a twin-arc integrated with cold-wire, which engages no current to the twin-wire GMAW process. They reported that the inserted cold-wire increases the deposition rate and stabilizes the molten pool by decreasing the welding arc length variations.
The previous research did not define the relations between process parameters but only reported the effects of each selected parameter on welding quality without considering correlations between process parameters. The welding process has strong nonlinearity between input process parameters and output product quality. It is also a highly coupled multivariable system. Therefore, the relation between the process parameters and the welding quality needs to be defined to acquire superior welding quality. However, the nominal mathematical surrogate model is challenging to explain the relationship between the welding quality and process parameters. Thus, nonlinear mapping-based machine learning or artificial intelligence (AI) needs to be adopted for the optimization of the welding process parameters.
Many kinds of research on welding parameter optimization, which considers the nonlinearity between input/output parameters, have been performed. For example, Kim et al. [7] researched the optimal welding condition related to the bead geometry for I-groove GMAW that used a mild steel plate and ER70S-6 wire. They proved the correlation between input parameters, such as wire feed rate, welding voltage, and welding speed, and output parameters, such as bead height, bead width, and penetration, via response surface methodology, and then acquired an optimal welding condition using a genetic algorithm (GA). They also claimed that the predicted bead height, bead width, and penetration from the surrogate model are similar to the weld bead geometry acquired from experiments. Moghaddam et al. [8] proposed the welding process modeling and parameter optimization methodology for the GMAW process that welds a V-groove on an API X42 steel plate using ER70S-6G4Si1 wire. They selected the process parameters such as nozzle-to-plate distance, welding voltage, wire feed rate, welding speed, and groove angle, and then applied BPNN (back propagation neural network) to predict the bead geometry such as bead penetration, bead width, bead height, and heat-affected zone (HAZ). PSO (particle swarm optimization) is implemented to search the optimal value of the welding process parameters. They also presented the prediction of the bead geometry using BPNN-PSO as combined BPNN and PSO is similar to the experimental geometry. Tomaz et al. [9] proposed the welding parameter optimization for the gas tungsten arc welding (GTAW) process using the AISI 1020 plate and UTP AF Ledurit 60, 68 wire. They built a database by analyzing the correlations between process parameters, such as welding current, welding speed, nozzle stand-off distance, travel angle, and wire feed pulse frequency, and output parameters, such as reinforcement, penetration, bead width, and dilution. Based on the database, an artificial neural network (ANN) has been utilized to build a surrogate model for the bead quality measurement. They implemented a genetic algorithm (GA) to find optimal welding parameters and claimed welding current and welding speed are critical for the bead quality.
Recently, as a surrogate modeling method, Gaussian process regression (GPR) based on the Bayesian estimation is exploited in the welding process modeling, and its optimization field since this model can quantify the prediction uncertainty, so it has merit to solve an optimization problem with uncertainty [10]. Dong et al. [11] predicted the welding quality by modeling the relationship between welding parameters and characteristic performance using GPR in the gas tungsten arc welding process, and Verma et al. [12] predicted the ultimate tensile strength of friction stir (FS) welded joints through the GPR model in the friction stir welding process. Tapia et al. [13] used GPR to find a combination of parameters (laser power and laser scanning speed) leading to low porosity in a selective laser melting process, and Lee [14] developed a wire arc additive manufacturing (WAAM) optimization model to improve both productivity and quality of the deposit shape by modeling process parameters using GPR.
In recent research by Lee et al. [15], the hybrid-tandem GMAW process was applied to the fillet welding of an AH36 thick plate and optimized for the specific condition with the travel speed of 1.5 m/min by configuring welding parameters. Gaussian process regression (GPR) has been adopted to find the optimized parameters. Unfortunately, if the input is high-dimensional, the GPR can be invalidated by a curse of dimensionality that reduces the performance of the model as the dimension of the input increases [16,17]. Nevertheless, the parameters which must be considered in the hybrid-tandem welding are actually more due to the combination of all three electrodes and leads than to the increase of the modeling complexity. In addition, searching for the optimal welding parameter requires a lot of experiments. For these reasons, Lee et al. used just three predefined variables, such as the current and the voltage of the leading electrode and the current of the hot-wire. Therefore, our research proposes a methodology to optimize the hybrid-tandem welding process with a minimum number of experiments for cost reduction in the AH36 plate’s horizontal fillet welding. This welding process has more parameters than the general welding process and generally shows high nonlinearity between inputs and outputs, so we use a novel analysis of variance-based Gaussian process regression method (ANOVA-GPR) to find the global optimum among several parameters.
In our ANOVA-GPR methodology, we first exploit ANOVA to select dominant parameters among many process parameters of the hybrid-tandem GMAW. Afterward, by constructing a process model using GPR, we can compensate for the disadvantage of GPR, which can be invalidated in high-dimensional inputs. Using this methodology, we can acquire the optimal values of the selected dominant parameters, and we have achieved the travel speed of the welding to 1.9 m/min, which is challenging to attain. By investigating experiment results with a variation on multiple parameters, such as current and voltage of leading and trailing electrodes, current and feed rate of filler-wire, and IWD, this research defines the coupled effects of the parameters on the objective function that indicates the penetration performance of the welding process. Finally, the proposed methodology using the ANOVA-GPR is verified by performing the hybrid-tandem experiment using the acquired optimal parameter.

2. Hybrid-Tandem GMAW PROCESS

2.1. Experimental Set-Up

Figure 1 provides an overview of the hybrid-tandem GMAW system. As welder machines for each leading and trailing electrode, Nanomatic 650 (Rexwell, Incheon, Korea) and Wavematic 500 (Hyundai Welding, Seoul, Korea) were implemented and, as a wire feeder, tigSpeed (EWM AG, Mündersbach, Germany) was selected to feed the filler-wire between these electrodes. In addition, a CS-31 auto-carriage (Koweld, Gimhae, Korea), which has three holders for electrodes and a filler-wire, controls detailed welding conditions such as the travel speed of the welding platform, contact tip to work distance (CTWD), IWD, and positions of the electrodes. The guide rollers for homogenetic welding quality were also included in the auto-carriage system that can maintain a constant distance from the web plate.
AH36 steel (Dongkuk Steel, Seoul, Korea), generally used in the welding process for shipbuilding, was selected as the main and web plates of our experiments [18,19,20]. Each plate was prepared with 1000 × 80 × 25 mm and 1000 × 80 × 15 mm, respectively. To minimize the gap of the fillet welding joint, a drill-press vise was used to clamp the main and web plates on three different points. Before our experiment, preheating of the plate was not performed. A flux-cored wire E71T-1C (KISWEL, Seoul, Korea) with a diameter of 1.4 mm was also implemented as the leading and trailing electrode and, as a filler-wire, ER70S-3 (KISWEL, Seoul, Korea) with a diameter of 1.2 mm was used. Table 1 indicates the chemical compositions of the base metal and wires used in our experiment.
The electric polarity between the leading and trailing electrodes was selected as direct current electrode positive and the opposite polarity of the filler-wire was selected as direct current electrode negative. The filler-wire was located between the leading and trailing electrodes. Each CTWD was set at 18 mm for the leading and 21 mm for trailing electrodes with ±10° travel angles. The filler-wire was located with 0° travel angle, which was the center between two electrodes, and the work angles of the three electrodes were all set to 42°. The molten pools of the electrodes were protected by 100% CO2 gas, and when we performed the experiment, the flow rate of this gas was set to 18 L/min.
The experiment was performed 5 times, each with 5 levels of process parameters at a travel speed of 1.9 m/min. Consequently, weld beads of 700 mm were obtained, respectively. The current and voltage of the leading electrodes were in the range of 360–440 A and 32–40 V and the current and voltage of the trailing electrodes were in the range of 320–400 A and 34–42 V, respectively. The filler-wire current was 60–140 A, the IWD was 20–30 mm, and the position was 1–5 as listed in Table 2.
During our experiment, the corner (root) of the fillet joint was configured as an originating point of the positions of both electrodes. The x-axis was set to the main plate direction and the z-axis was set to the web plate direction based on the originating point. The y-axis was automatically decided by the dexterous rule.
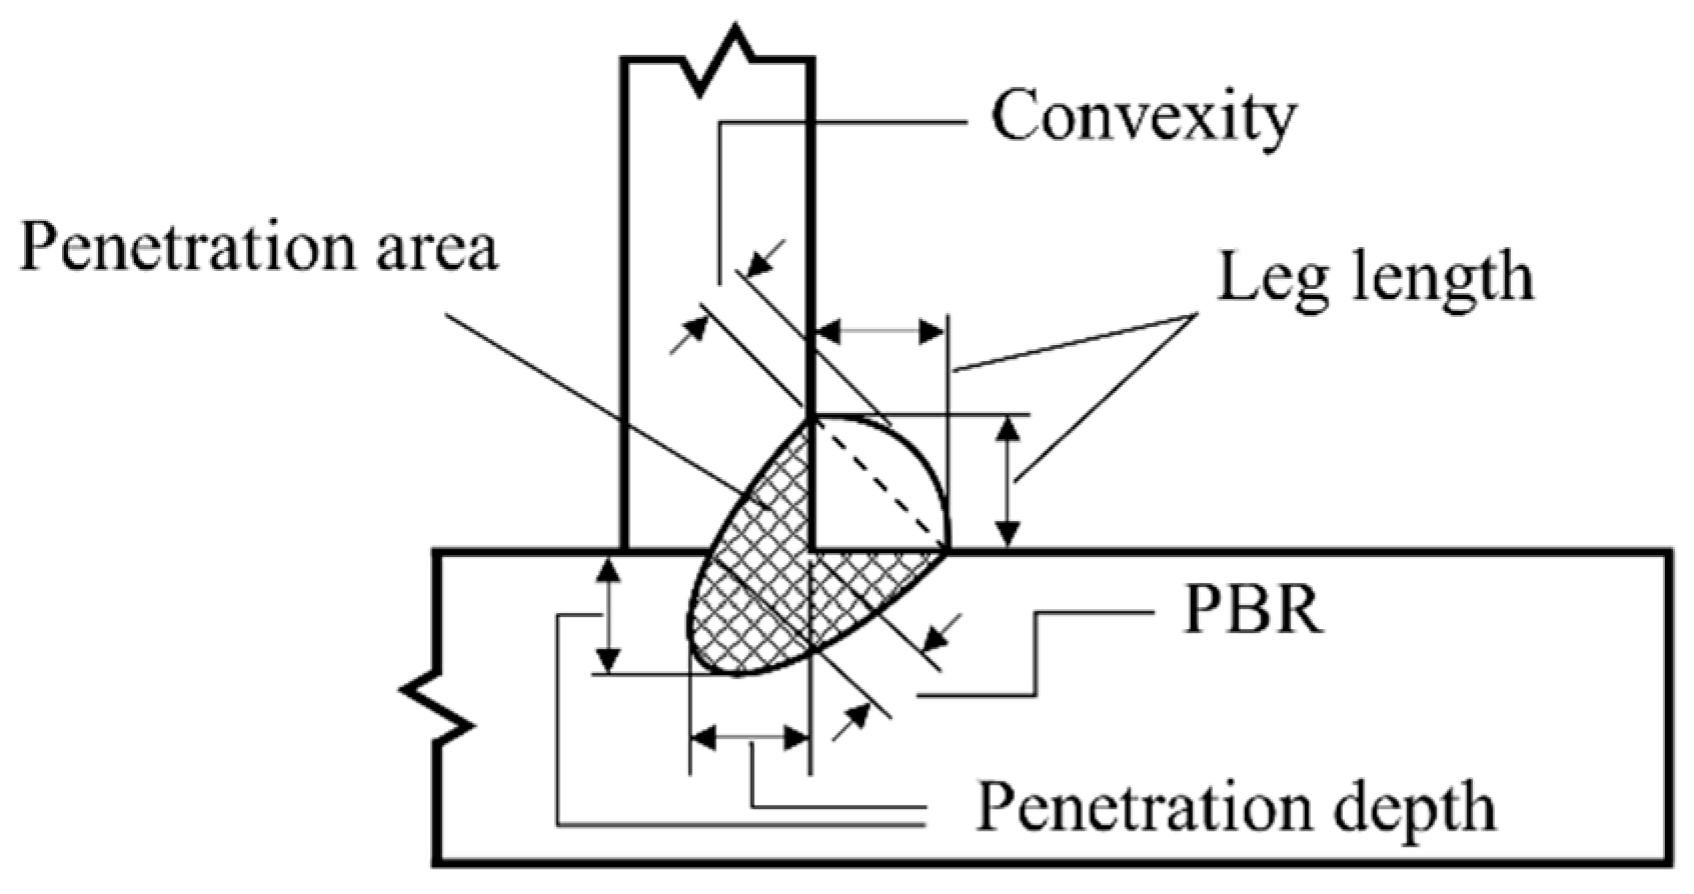
After performing welding, specimens with a thickness of 10 mm were cut in half in the y-axis direction to observe the bead and penetration shape. Each specimen was etched by 5% Nital solution and measured using an optical microscope. As shown in Figure 2, the vertical and horizontal leg lengths and penetrations, penetration beyond the root (PBR), convexity, and area of penetration are quantified for the modeling of the welding process.

2.2. Effects of Process Parameters on the Penetration Shape

Table 2 presents the experimental process parameters and their corresponding measurements of the penetration shape. The values in Table 2 are mean values for five experiments. The standard deviations are indicated in parentheses. The main process parameters considered in the experiments were the current of the leading, trailing electrodes, and filler-wire, the voltage of the leading and trailing electrodes, the distance between the leading and trailing electrodes, and the position of the electrodes. Here, each capital character L, T, and F mean leading, trailing, and filler-wire, and subscripting character c and v each indicate the current and voltage. Each parameter was categorized into 5 levels and the remaining parameters, except the target control parameter, were fixed to the mid-range values. Then, after the welding experiment, as shown in Figure 3, the macro specimen was investigated to measure the penetration shape. Here, P, L, and C each indicate penetration, leg length, and convexity, and subscription v and h each mean vertical and horizontal direction. In position 1 and 2, the leading electrode was located 2 mm and 1 mm away from the root in the x direction, and in position 4 and 5, the leading electrode was located 1 mm and 2 mm away from the root in the z direction. (The trailing electrode was located symmetrically with the leading electrode.) Additionally, in position 3, both electrodes were fed to the root. The experimental results are further investigated with the ANOVA-GPR modeling method in the following section.

3. Parameter Optimization Using the ANOVA-GPR

As mentioned in the previous section, the GPR can become invalid when the inputs are high-dimensional. The hybrid-tandem GMAW process requires high-dimensional input parameters to model the process. In other words, as Elman and Liao [21] noted, it indicates that a large number of training data points are required for the accurate GPR model. However, due to the expensive experimental costs, many training data are hard to produce for the process parameter optimization. Therefore, we used the ANOVA-GPR methodology, which has already been used by Chen and Liao [17] in the computational physics field, to find the global optimum among several parameters.

3.1. ANOVA

ANOVA is a statistical technique that assesses potential differences in a scale-level dependent variable by a nominal-level variable having two or more categories. This methodology is often used to analyze the main and interactive effects of the design of the experiment (DOE), and of which, allowed performance verification before we implemented the recursive analysis technique. Using ANOVA to ascertain the average comparison, the variance between and within the object groups are compared instead of the average. The variance between groups indicates the distribution of each group from the average value, and the variance within a group indicates the distribution of each data point from the average value, of which the ratio is defined as the F-value. Generally, the larger F-value indicates that the contribution of the group on the total average value is bigger, and the p-value is the percentage of the randomness of the calculated average. As Gallagher [22] noted, if the p-value is less than 0.05, we can assume that the average value is statistically meaningful.
In our research, among seven process parameters such as leading current and voltage, trailing current and voltage, filler-wire current, IWD, and the position of electrodes, three process parameters that dominantly affect the objective function, defining the penetration shape, were selected using ANOVA. As shown in Table 3, the analysis results using ANOVA present the F-values of leading voltage, trailing voltage, and leading current are highest in order and, at the same time, their p-values are less than 0.05, which also indicates these parameters are dominant. Therefore, GPR modeling was constructed as a function of these three parameters which have the highest F-values.

3.2. GPR Modeling

In GPR models, the information about the adjacent value around the measurement could be acquired by assuming each measurement is the collection of random variables. GPR is a non-parametric Bayesian method, so the method itself provides a principled approach to dealing with uncertainty because the uncertainty of the predictions can also be derived from the variance of the sampled functions.
In this paper, GPR was used to model the hybrid-tandem GMAW process to perform optimization of the process parameters filtered by ANOVA. The measurement data from the experiments of the previous section could be defined as a set and expressed as Equation (1):
S k = { ( x i y i k ) ; i = 1 , , n } , k = 1 , j
where x i R d and y i k R have unknown distribution. We prepared a total 15 data sets (n = 13) with 3 main parameters and 7 output measurements that can evaluate the performance of the hybrid-tandem GMAW. The model with GPR could be expressed as follows:
y = h ( x ) T β + f ( x )
where f ( x ) is a Gaussian process with a zero mean and a covariance function, k ( x , x ) . h ( x ) is a set of basis functions that transform the original feature vector x in R d into a new feature vector, and β is a scalar coefficient of the basis function. The covariance function k ( x , x ) is parameterized by a set of kernel parameters θ .
The experimental data with the selected parameters were given to the GPR toolbox of MATLAB/Simulink and a model was constructed using these data. As a covariance matrix function, the automatic relevance determination (ARD) squared exponential kernel function was selected. The detailed background information about GPR is described in the previous research of Lee et al. [15].
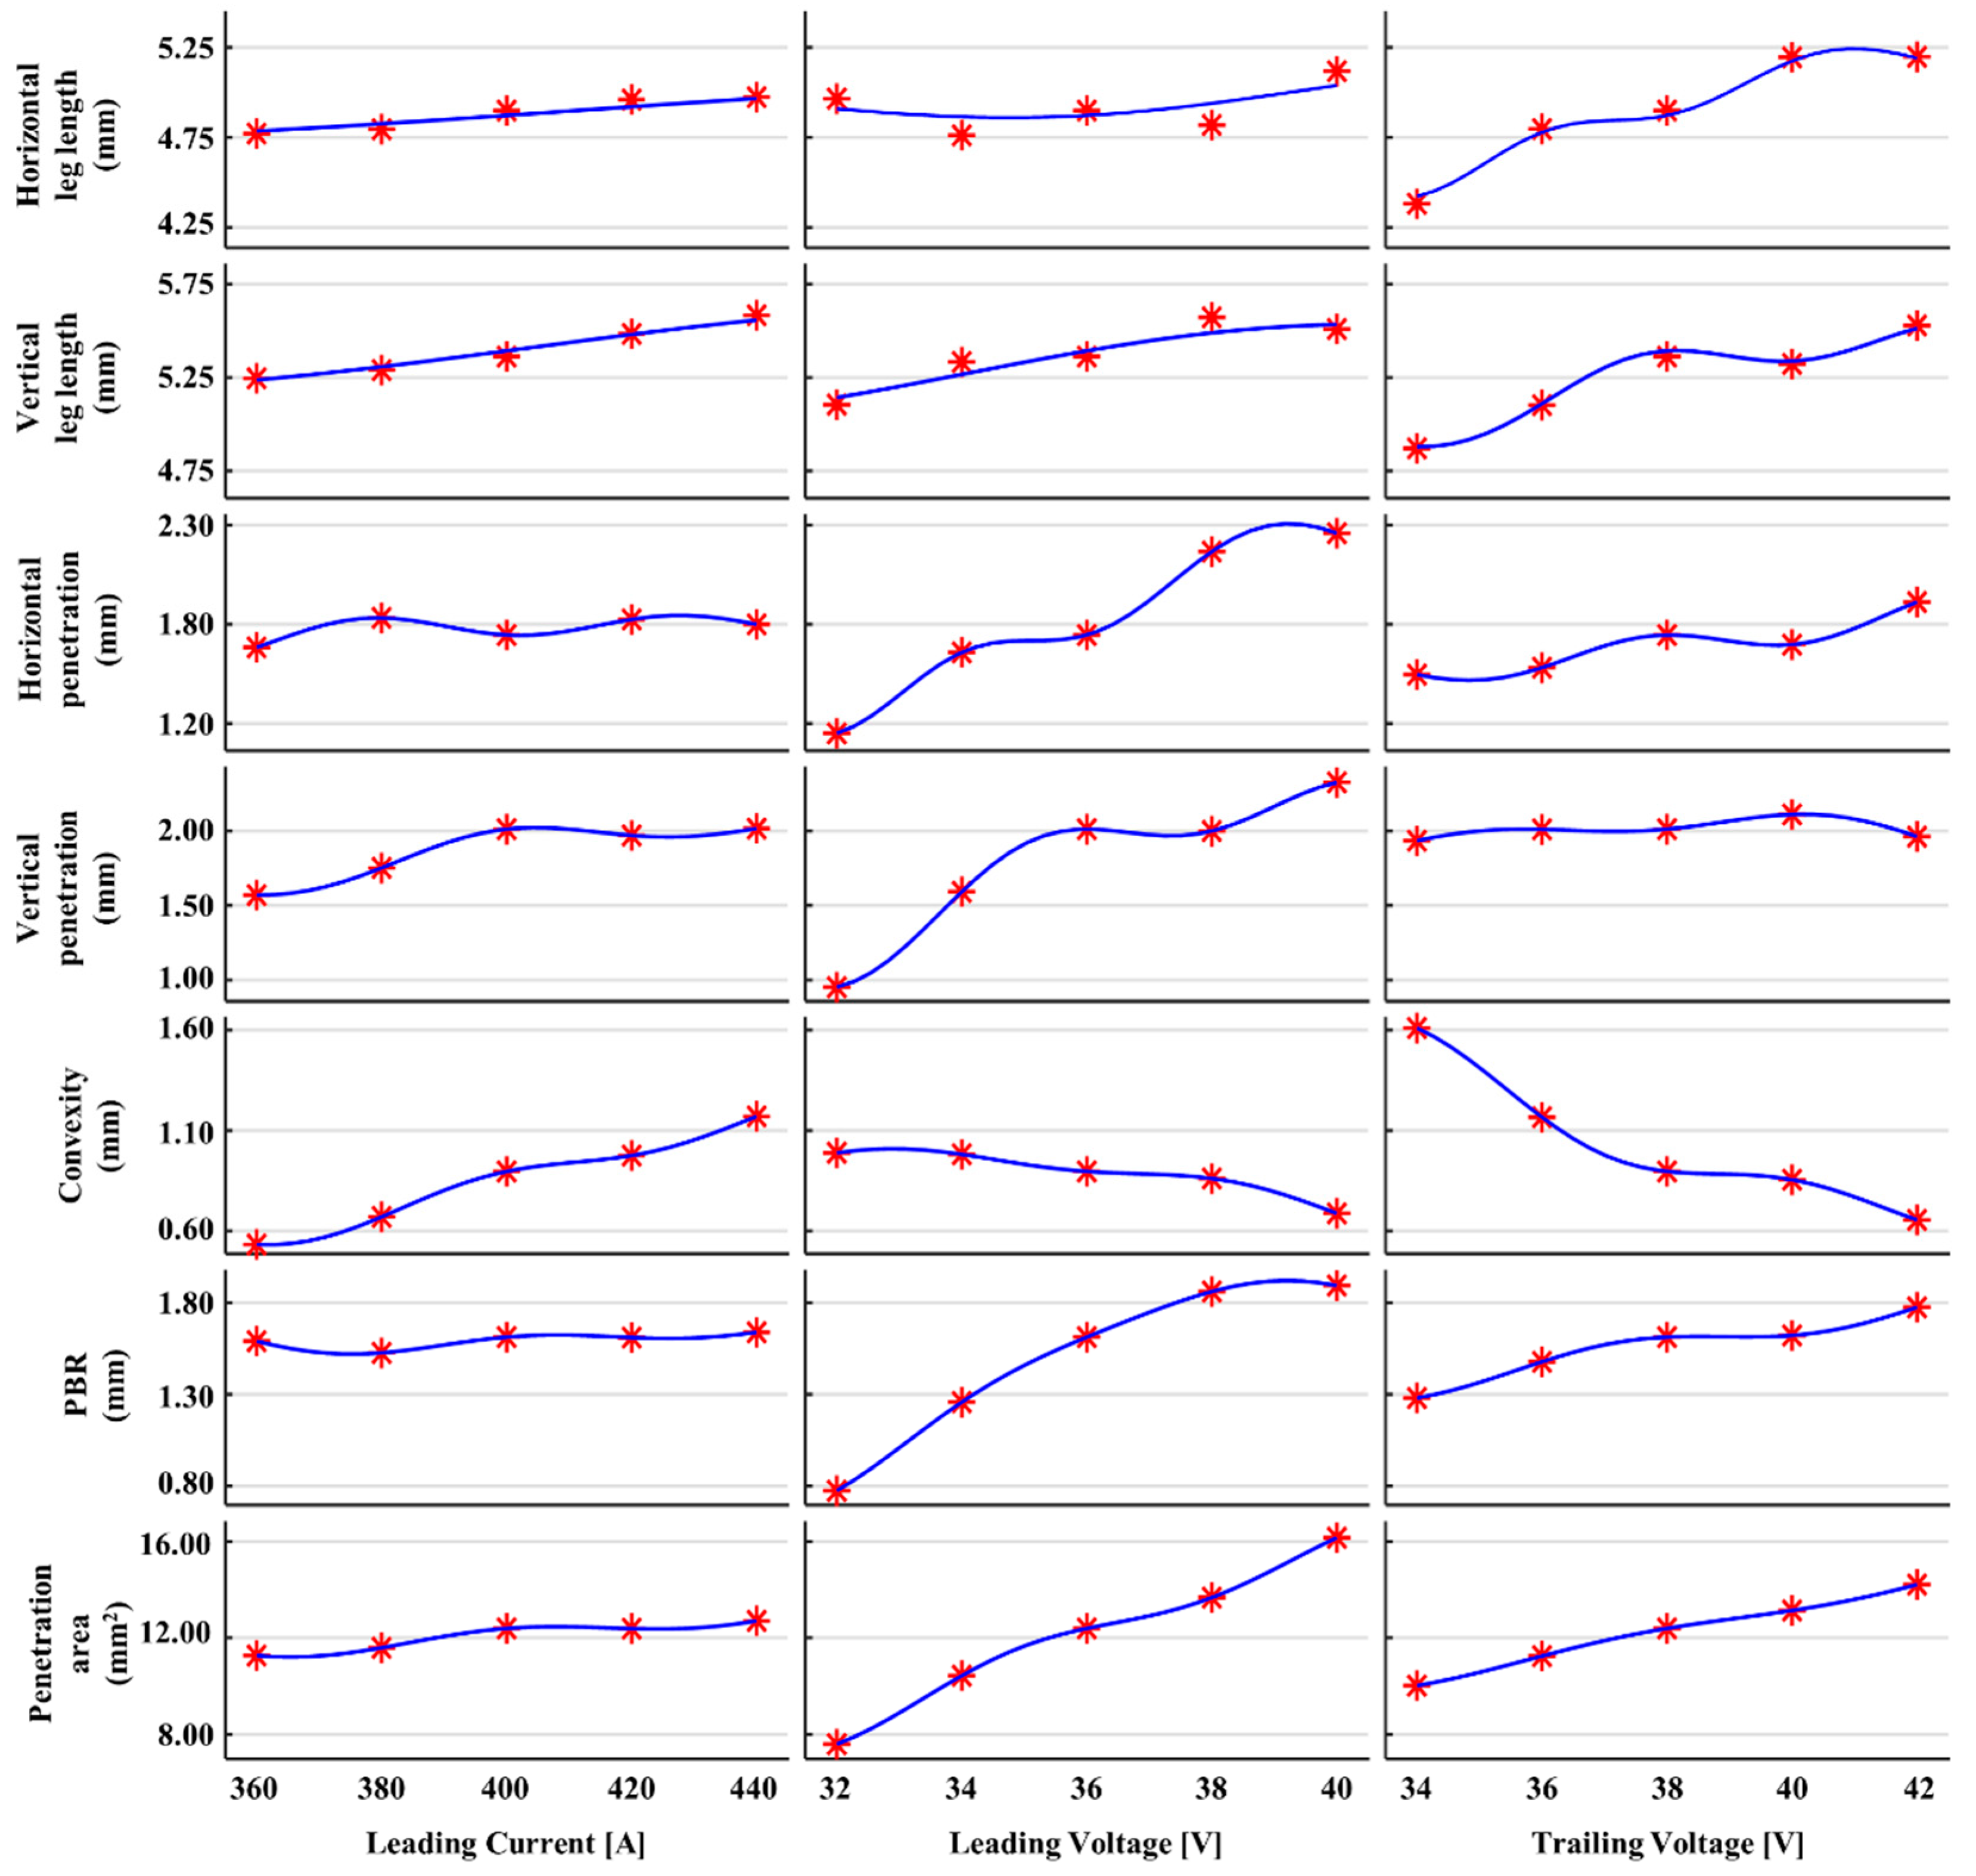
Figure 4 presents the predicted parameters and their output using GPR. Note that functions that require three parameter inputs are constructed. As shown in Figure 4 with a red asterisk, the leading voltage, trailing voltage, and leading current in Table 2 are given as a training dataset to GPR. The predicted results are presented with a blue line in Figure 4. The overall tendency discovered from Figure 4 presents the following characteristics.
The vertical and horizontal leg lengths (rows 1 and 2) increase slightly as the leading current increases. This is because when the leading current increases, the deposition rate increases as well, so both leg lengths of the weldment slightly increase accordingly. In addition, as shown in rows 1 and 2, as the leading and trailing voltages increase, the horizontal and vertical leg lengths also increase, and the effect of the trailing voltage is greater than that of the leading voltage. In general, as the leading and trailing voltages increase, the arc length of each electrode increases and the radius of the arc increases, so that the width of the molten pool increases. Thus, the increased voltage produces a wide bead in a diagonal direction from the root of the weld. In particular, the reason the trailing voltage has a greater effect on both leg lengths than the leading voltage is that the trailing electrode has a relatively higher arcing position than the leading electrode. In other words, since the CTWD of the trailing is longer than the leading, the wide molten pool created by the trailing arc, which has a radius wider than the leading arc, directly affects the horizontal and vertical leg lengths.
The convexity (row 5) increases as the leading current increases and decreases as the leading and trailing voltages increase. If only the leading current increases without increasing the leading and trailing voltage, the convexity of the bead increases. The reason is that, as mentioned previously, the amount of deposition increases with the leading current, but the width of the molten pool, which changes according to the voltage change, does not increase, and the molten metal transferred to the molten pool cannot spread widely. Conversely, when the leading and trailing voltages increase, the width of the molten pool widens and convexity decreases. In particular, the reason the convexity is greatly affected by the trailing voltage is the same as the reason the leg length previously mentioned increases.
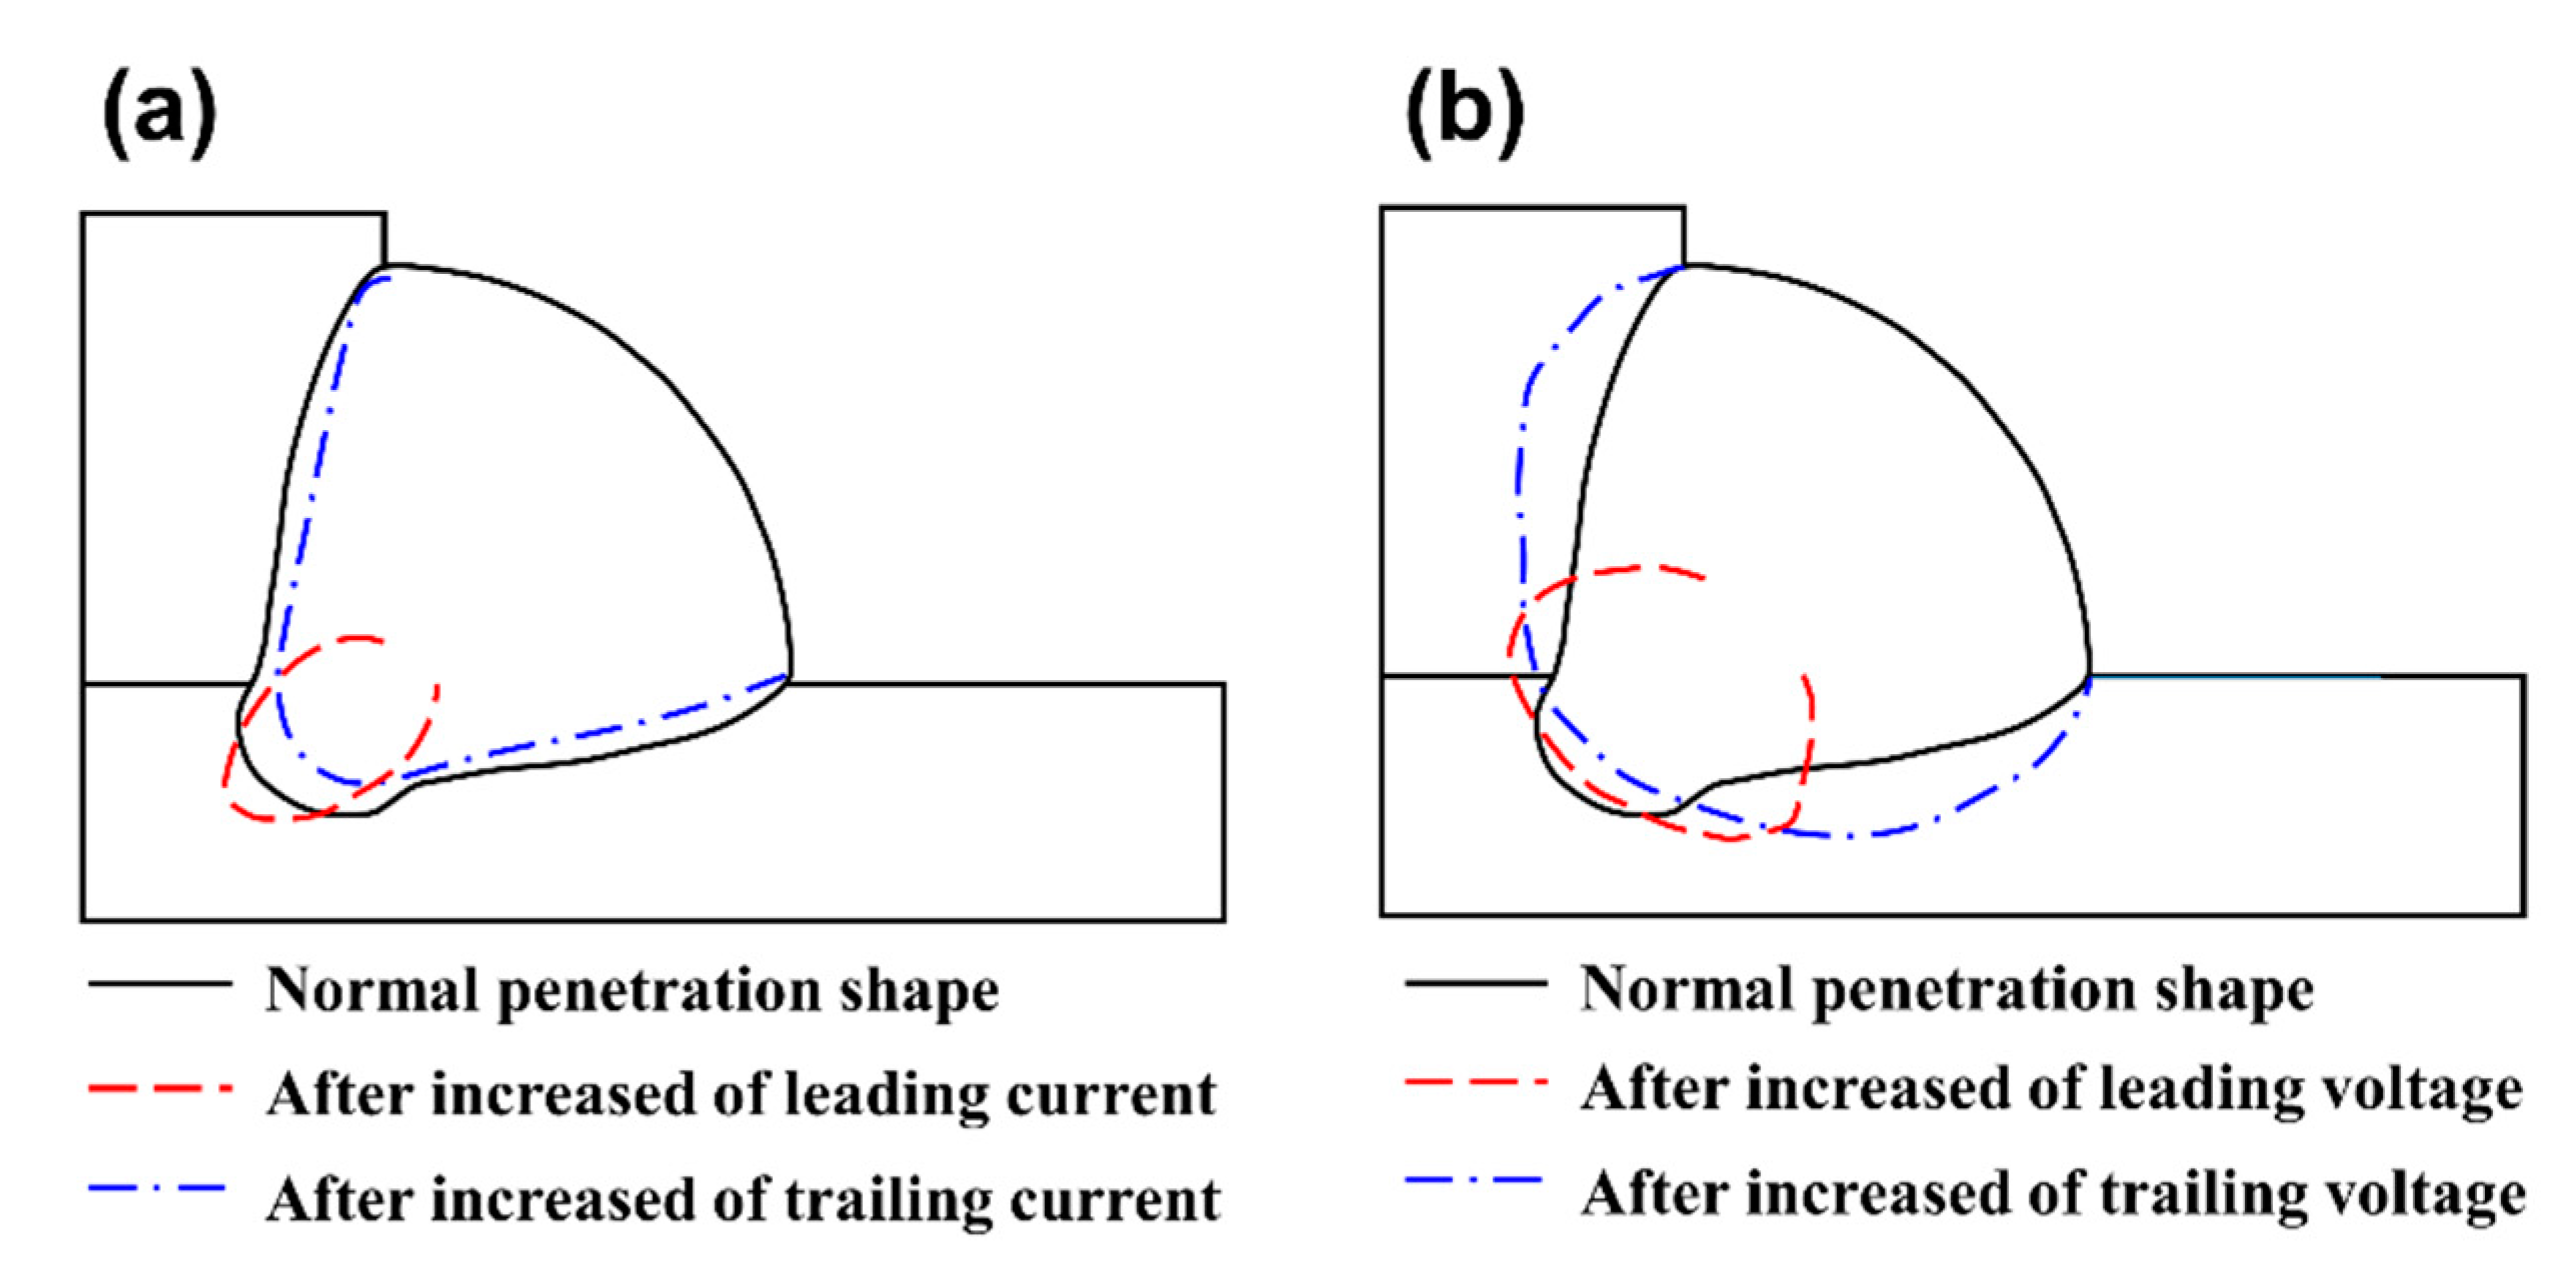
The horizontal and vertical penetrations (rows 3 and 4) are more affected by changes in the leading voltage than the leading current and trailing voltage. The reason is explained in Figure 5, which shows the change in the penetration shape according to the process parameters of the leading and trailing electrodes. As shown in Figure 5a, when the leading current increases, a deeper and narrower molten pool occurs in the same direction as the work angle. This is because, when the leading current increases in a constant voltage welder, the arc length becomes shorter, and the current density of the leading electrode increases. Accordingly, the penetration in the direction of the work angle becomes deeper. On the other hand, as shown in Figure 5b, as the leading voltage increases, the molten pool widening in the vertical direction to the work angle has a dominant effect on the horizontal and vertical penetrations.
In addition, the PBR (row 6) and penetration area (row 7) in Figure 5 are more affected by the leading and trailing voltage than the leading current. As shown in Figure 5a, as the leading current increases, the width of the molten pool by the leading arc decreases, so the PBR should decrease. However, the molten pool created by the trailing arc diminishes the effect of the leading arc. In addition, as the leading current increases, the width of the molten part decreases and the depth increases, so the shape of the penetration area changes, but the size of the area does not significantly change. On the other hand, as shown in Figure 5b, when the leading and trailing voltages increase, the PBR and penetration area are greatly increased by the widened molten pool.
The ISO welding standard recommends similar values of the horizontal and vertical leg lengths, deeper and wider penetrations, and lower convexity. In the next section, an objective function is defined, and optimal process parameters are derived to satisfy this welding standard.

3.3. Optimization Using the ANOVA-GPR

To define optimal welding parameters for the hybrid-tandem GMAW using the GPR, the three dominant parameters were selected using ANOVA and defined as input parameters with the form of Equation (3).
x = [ C L , V L , C T ]
where C L ,   V L , and C T are the current of leading electrode, the voltage of leading electrode, and the current of trailing electrode, respectively. The ranges of the input variables are C L [ 360 A   440   A ] , V L [ 32 V   40   V ] , and C T [ 320 A   400   A ] , which are implemented in the optimization process as constraints. The intermediate vector y, which is the function of x , could be defined as Equation (4).
y = [ y 1 ,   y 2 ,   y 3 ,   y 4 ,   y 5 ,   y 6 ,   y 7 ] = g ( x ) = [ P v ,   P h ,   P B R ,   P a r e a ,   L v ,   L h ,   C ]
where P v ,   P h ,   P B R ,   P a r e a ,   L v ,   L h ,   and C are the vertical penetration, the horizontal penetration, the penetration beyond the root, the penetration area, the vertical leg length, the horizontal leg length, and the convexity, respectively.
The cost function could be defined, and the goal of parameter optimization is set to maximize the objective function J ( x ) .
J ( x ) = 1 / 9 × [ 2   2   2   2   0.7   0.2   0.1 ] × [ P v   P h   P B R   P a r e a | L v L h | C | P v P h | ]
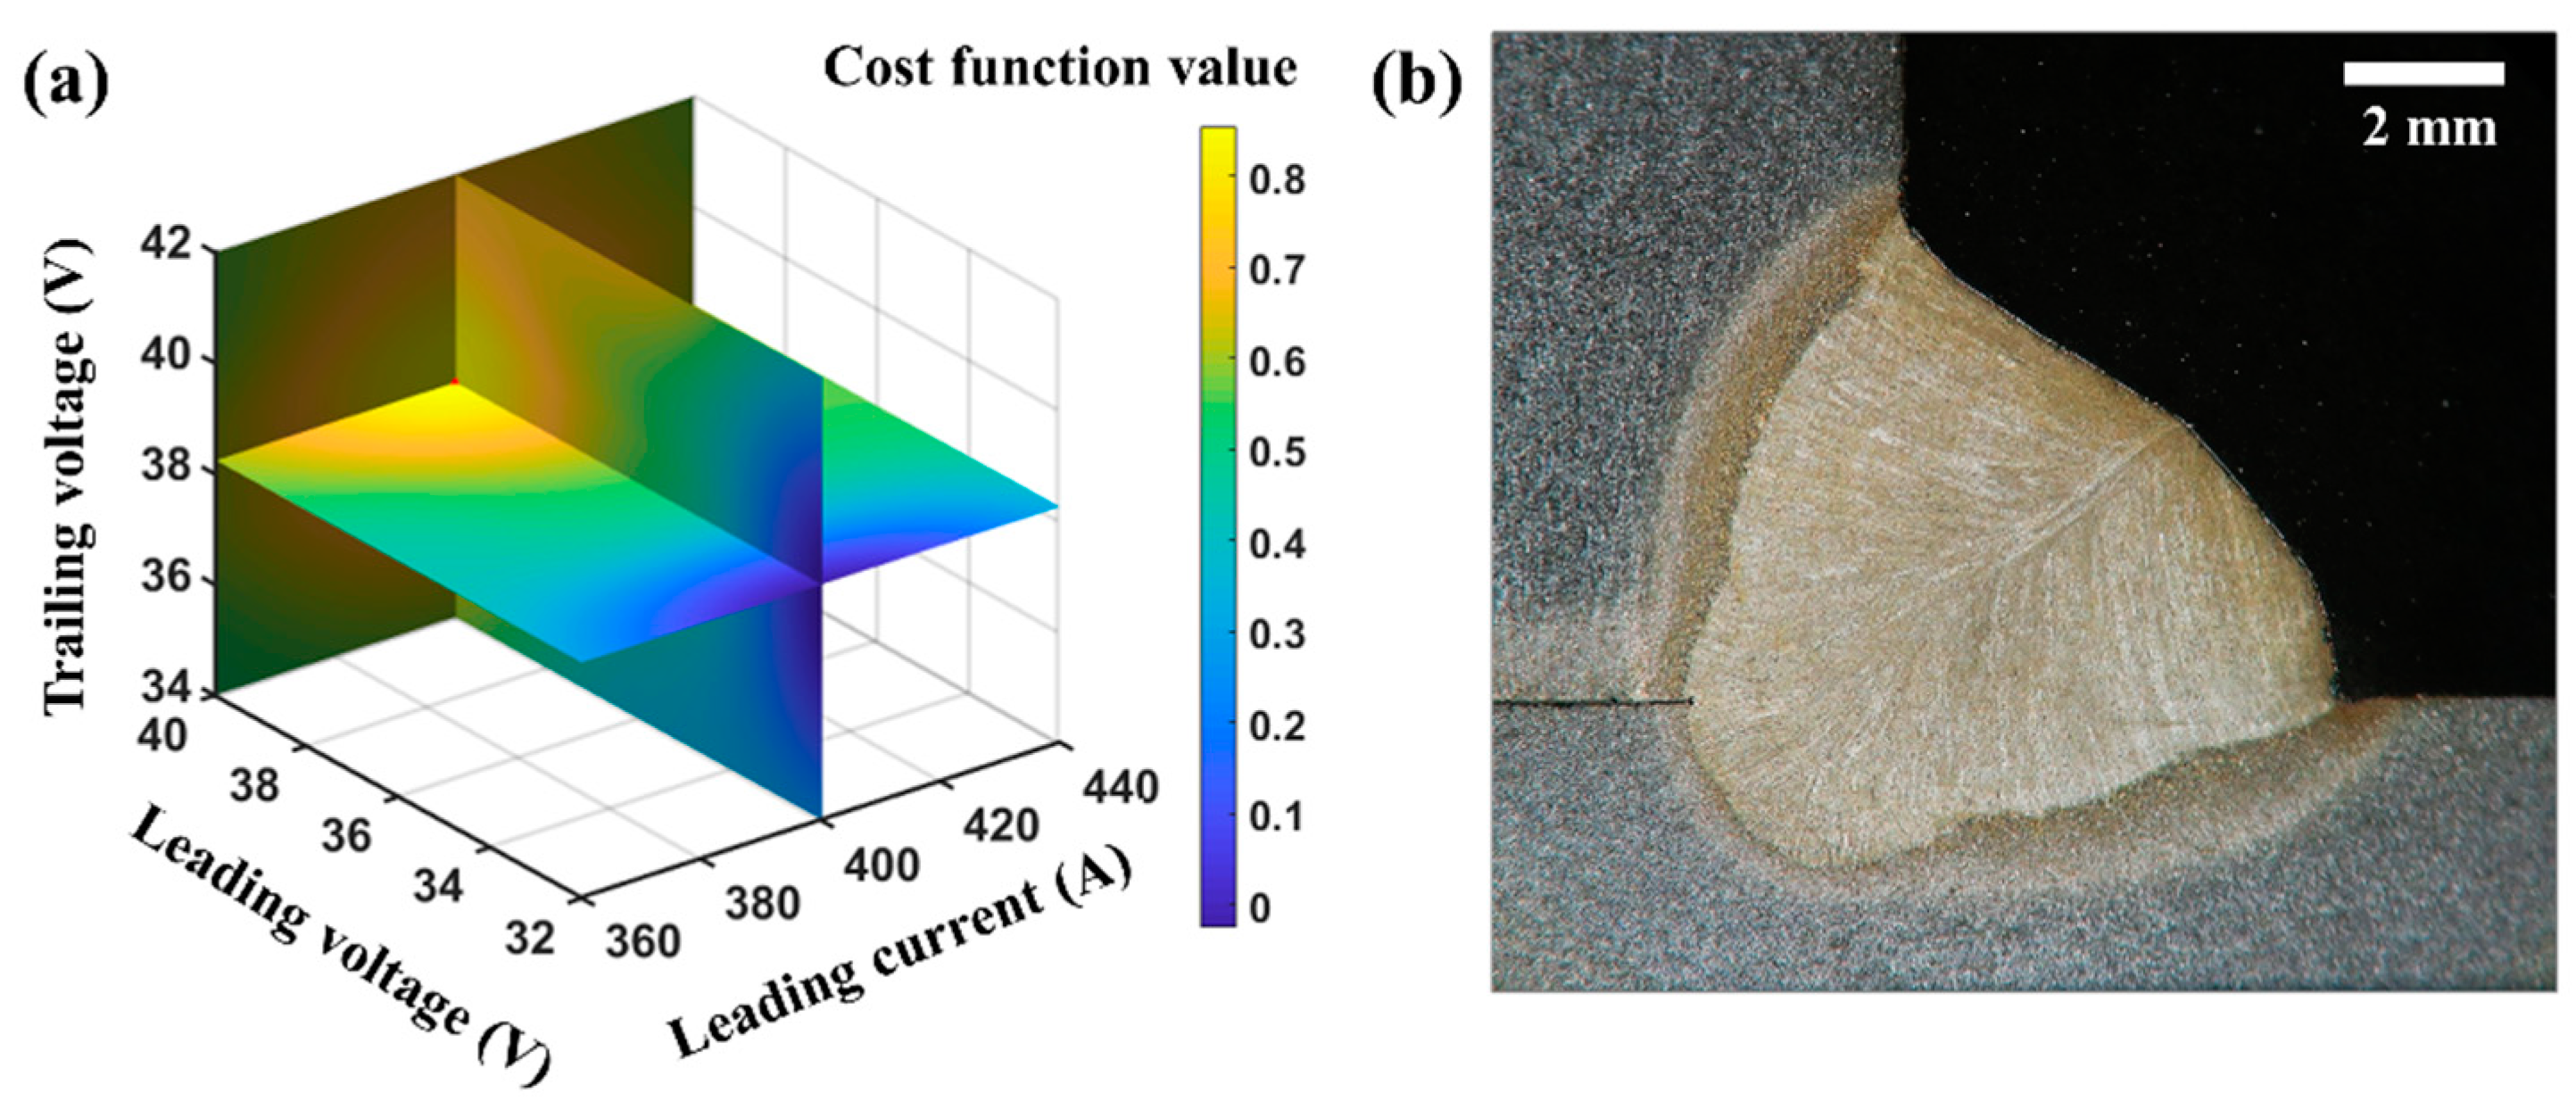
The weighting values are defined by referring to the previous research results of the authors and ISO-5817 [15]. The parameters related to the strength of the fillet joint have more weight than the parameters related to geometrical defects. As an optimizer, the sequential quadratic programming (SQP) method was selected to search for the best parameter values to minimize the cost function. As shown in Figure 6a, the optimal parameters are found to be:
x * = [ 400.22 ,  40.00 ,  38.25 ]
To verify the possibility of the local minimum, 20 different initial points were randomly selected, executed, and compared. All comparison results present close output values that are bounded in the tolerance threshold of 1e-8, which is delivered to the optimizer as a parameter.
Figure 6a presents the variation effects of the process parameters on the cost function. Each x, y, and z axis indicate the leading current, leading voltage, and trailing voltage, and the output values of the cost function are presented using a color bar. The monotonic tone of the color of this 3D plot also proves that there is no local minimum value.
Validation of the acquired optimal parameters for the hybrid-tandem GMAW using the ANOVA-GPR model was performed via the welding experiment. The cross-section image acquired from the experiment is presented in Figure 6b. Figure 6a predicts the stronger effect of the leading voltage on the welding quality than other parameters. This indicates that the increment of the leading voltage also causes only small variations on the leg length and convexity but drastically increases the depth and area of the penetration.
As shown in Table 4, the measurement results of the experiment are compared to the output of the ANOVA-GPR model. The values in Table 4 are mean values for five experiments. The standard deviations are indicated in parentheses. Because ANOVA-GPR is based on statistics, the experimental results and the output from ANOVA-GPR have errors in the range of 2.28% to 10.43%. If more experimental data can be given to ANOVA-GPR, the trust level could be improved so that ANOVA-GPR could predict the manufacturing process parameter more accurately. However, even with the limited number of experimental trials, the optimization using a surrogate model such as ANOVA-GPR can make the search for the process parameters of the hybrid-tandem GMAW easier than the experience-based and intuitive approach of the field engineer. The overall results of this paper indicate that the mixed approach of ANOVA-GPR could be applied to the hybrid-tandem GMAW and could effectively optimize the welding performance.

4. Conclusions

The major conclusions of this paper are as follows.
  • A novel hybrid-tandem GMAW process which adds the filler-wire with opposite polarity needs to consider numerous process parameters and the relation between parameters causing strong nonlinearity, compared to the conventional tandem process. To accurately present this nonlinearity and find the significant process parameters among many parameters, the ANOVA-GPR method was implemented.
  • The uncertainty of the hybrid-tandem GMAW is increased by the use of the additional filler-wire on the welding process. By adopting the ANOVA-GPR approach, we selected three major welding process parameters among several parameters related to this uncertainty and performed optimization successfully to improve the welding quality. In order to optimize the process, ISO-5817, which guides performance parameters, was used to define the cost function.
  • This approach enables a high welding speed of 1.9 m/min, which is difficult to achieve in the hybrid-tandem GMAW process. The proposed approach can be applied to another manufacturing processes that are difficult to model due to complex phenomena, and ultimately can improve the system performance.

Author Contributions

Conceptualization, J.Y.K.; methodology, J.Y.K. and D.Y.L.; software, D.Y.L.; validation, J.Y.K. and J.L.; formal analysis, J.Y.K., D.Y.L., and J.L.; investigation, J.Y.K. and J.L.; writing—original draft preparation, J.Y.K., D.Y.L. and J.L.; writing—review and editing, S.H.L.; visualization, J.L.; supervision, S.H.L.; project administration, S.H.L. All authors have read and agreed to the published version of the manuscript.

Funding

This research was funded by the Korea Institute of Energy Technology Evaluation and Planning (KETEP) and the Ministry of Trade, Industry & Energy (MOTIE) of the Republic of Korea (No. 20217710100010), the Korea Evaluation Institute of Industrial Technology (KEIT) grant funded by the Korean government (MOTIE) (No. 10062648), the MOTIE (Ministry of Trade, Industry, and Energy) in Korea, under the Human Resource Development Program for Industrial Innovation(Global) (P0017306, Global Human Resource Development for Innovative Design in Robot and Engineering) supervised by the Korea Institute for Advancement of Technology (KIAT), and the research fund of Hanyang University (HY- 202000000002700).

Conflicts of Interest

The authors declare no conflict of interest.

Nomenclature

GMAWGas Metal Arc Welding
GPRGaussian Process Regression
IWDInter-Wire Distance
MAGMetal Active Gas
GAGenetic Algorithm
RSMResponse Surface Methodology
BPNNBack Propagation Neural Network
HAZHeat-Affected Zone
PSOParticle Swarm Optimization
BPNN-PSOBack Propagation Neural Network-Particle Swarm Optimization
GTAWGas Tungsten Arc Welding
ANNArtificial Neural Network
UTSUltimate Tensile Strength
FSFriction Stir
WAAMWire Arc Additive Manufacturing
ANOVAAnalysis of Variance
ANOVA-GPRAnalysis of Variance-based Gaussian Process Regression
CTWDContact Tip to Work Distance
PBRPenetration Beyond the Root
PvVertical Penetration
PhHorizontal Penetration
PareaPenetration area
LvVertical Leg length
LhHorizontal Leg length
CConvexity
CLLeading Current
VLLeading Voltage
CTTrailing Current
VTTrailing Voltage
CFFiller-wire Current
DOEDesign of the Experiment
DOFDegree of Freedom
ARDAutomatic Relevance Determination
SQPSequential Quadratic Programming
STDStandard Deviation

References

  1. Kik, T.; Górka, J. Numerical simulations of laser and hybrid S700MC T-joint welding. Materials 2019, 12, 516. [Google Scholar] [CrossRef] [PubMed] [Green Version]
  2. Skowrόnska, B.; Chmielewski, T.; Golański, D.; Szulc, J. Weldability of S700MC steel welded with the hybrid plasma+ MAG method. Manuf. Rev. 2020, 7, 4. [Google Scholar] [CrossRef] [Green Version]
  3. Arora, H.; Kumar, V.; Prakash, C.; Pimenov, D.; Singh, M.; Vasudev, H.; Singh, V. Analysis of sensitization in austenitic stainless steel-welded joint. In Advances in Metrology and Measurement of Engineering Surfaces; Prakash, C., Krolczyk, G., Singh, S., Pramanik, A., Eds.; Springer: Singapore, 2021; pp. 13–23. [Google Scholar] [CrossRef]
  4. Arita, H.; Morimoto, T.; Nagaoka, S.; Nakano, T. Development of advanced 3-electrode MAG high-speed horizontal fillet welding process. Weld World. 2009, 53, 35–43. [Google Scholar] [CrossRef]
  5. Yokota, Y.; Shimizu, H.; Nagaoka, S.; Ito, K.; Arita, H. Development and application of the 3-electrode MAG high-speed horizontal fillet welding process. Weld World. 2012, 56, 43–47. [Google Scholar] [CrossRef]
  6. Xiang, T.; Li, H.; Gao, Y.; Zhao, S.; Lou, L.; Wang, H. Effects of pulse phase difference on metal transfer process and weld formation in the integrated circular triple-electrode GMAW. Int. J. Adv. Manuf. Technol. 2019, 102, 857–866. [Google Scholar] [CrossRef]
  7. Kim, D.; Rhee, S.; Park, H. Modelling and optimization of a GMA welding process by genetic algorithm and response surface methodology. Int. J. Prod. Res. 2002, 40, 1699–1711. [Google Scholar] [CrossRef]
  8. Moghaddam, M.A.; Golmezergi, R.; Kolahan, F. Multi-variable measurements and optimization of GMAW parameters for API-X42 steel alloy using a hybrid BPNN–PSO approach. Measurement 2016, 92, 279–287. [Google Scholar] [CrossRef]
  9. do Valle Tomaz, I.; Colaço, F.H.G.; Sarfraz, S.; Pimenov, D.Y.; Gupta, M.K.; Pintaude, G. Investigations on quality characteristics in gas tungsten arc welding process using artificial neural network integrated with genetic algorithm. Int. J. Adv. Manuf. Technol. 2021, 113, 3569–3583. [Google Scholar] [CrossRef]
  10. Rasmussen, C.E.; Williams, C.K.I. Gaussian Processes for Machine Learning (Adaptive Computation and Machine Learning); The MIT Press: Cambridge, MA, USA, 2005. [Google Scholar]
  11. Dong, H.; Cong, M.; Liu, Y.; Zhang, Y.; Chen, H. Predicting characteristic performance for arc welding process. In Proceedings of the 2016 IEEE International Conference on Cyber Technology in Automation, Control, and Intelligent Systems (CYBER), Chengdu, China, 19–22 June 2016; pp. 7–12. [Google Scholar] [CrossRef]
  12. Verma, S.; Gupta, M.; Misra, J.P. Performance evaluation of friction stir welding using machine learning approaches. MethodsX 2018, 5, 1048–1058. [Google Scholar] [CrossRef] [PubMed]
  13. Tapia, G.; Elwany, A.; Sang, H. Prediction of porosity in metal-based additive manufacturing using spatial Gaussian process models. Addit. Manuf. 2016, 12, 282–290. [Google Scholar] [CrossRef]
  14. Lee, S.H. Optimization of cold metal transfer-based wire arc additive manufacturing processes using gaussian process regression. Metals 2020, 10, 461. [Google Scholar] [CrossRef] [Green Version]
  15. Lee, D.Y.; Leifsson, L.; Kim, J.Y.; Lee, S.H. Optimisation of hybrid tandem metal active gas welding using Gaussian process regression. Sci. Technol. Weld. Join. 2020, 25, 208–217. [Google Scholar] [CrossRef]
  16. Tripathy, R.; Bilionis, I.; Gonzalez, M. Gaussian processes with built-in dimensionality reduction: Applications to high-dimensional uncertainty propagation. J. Comput. Phys. 2016, 321, 191–223. [Google Scholar] [CrossRef] [Green Version]
  17. Chen, C.; Liao, Q. ANOVA Gaussian process modeling for high-dimensional stochastic computational models. J. Comput. Phys. 2020, 416, 109519. [Google Scholar] [CrossRef]
  18. Çolak, Z.; Ayan, Y.; Kahraman, N. Weld morphology and mechanical performance of marine structural steel welded underwater in a real marine environment. Int. J. Adv. Manuf. Technol. 2020, 109, 491–501. [Google Scholar] [CrossRef]
  19. Crupi, V.; Epasto, G.; Guglielmino, E.; Marinò, A. Influence of Weld-Porosity Defects on Fatigue Strength of AH36 Butt Joints Used in Ship Structures. Metals 2021, 11, 444. [Google Scholar] [CrossRef]
  20. Pazooki, A.; Hermans, M.; Richardson, I. Control of welding distortion during gas metal arc welding of AH36 plates by stress engineering. Int. J. Adv. Manuf. Technol. 2017, 88, 1439–1457. [Google Scholar] [CrossRef] [Green Version]
  21. Elman, H.C.; Liao, Q. Reduced basis collocation methods for partial differential equations with random coefficients. SIAM/ASA J. Uncertain. Quantif. 2013, 1, 192–217. [Google Scholar] [CrossRef] [Green Version]
  22. Gallagher, E.J. P < 0.05: Threshold for decerebrate genuflection. Acad. Emerg. Med. 1999, 6, 1084–1087. [Google Scholar] [CrossRef] [PubMed] [Green Version]
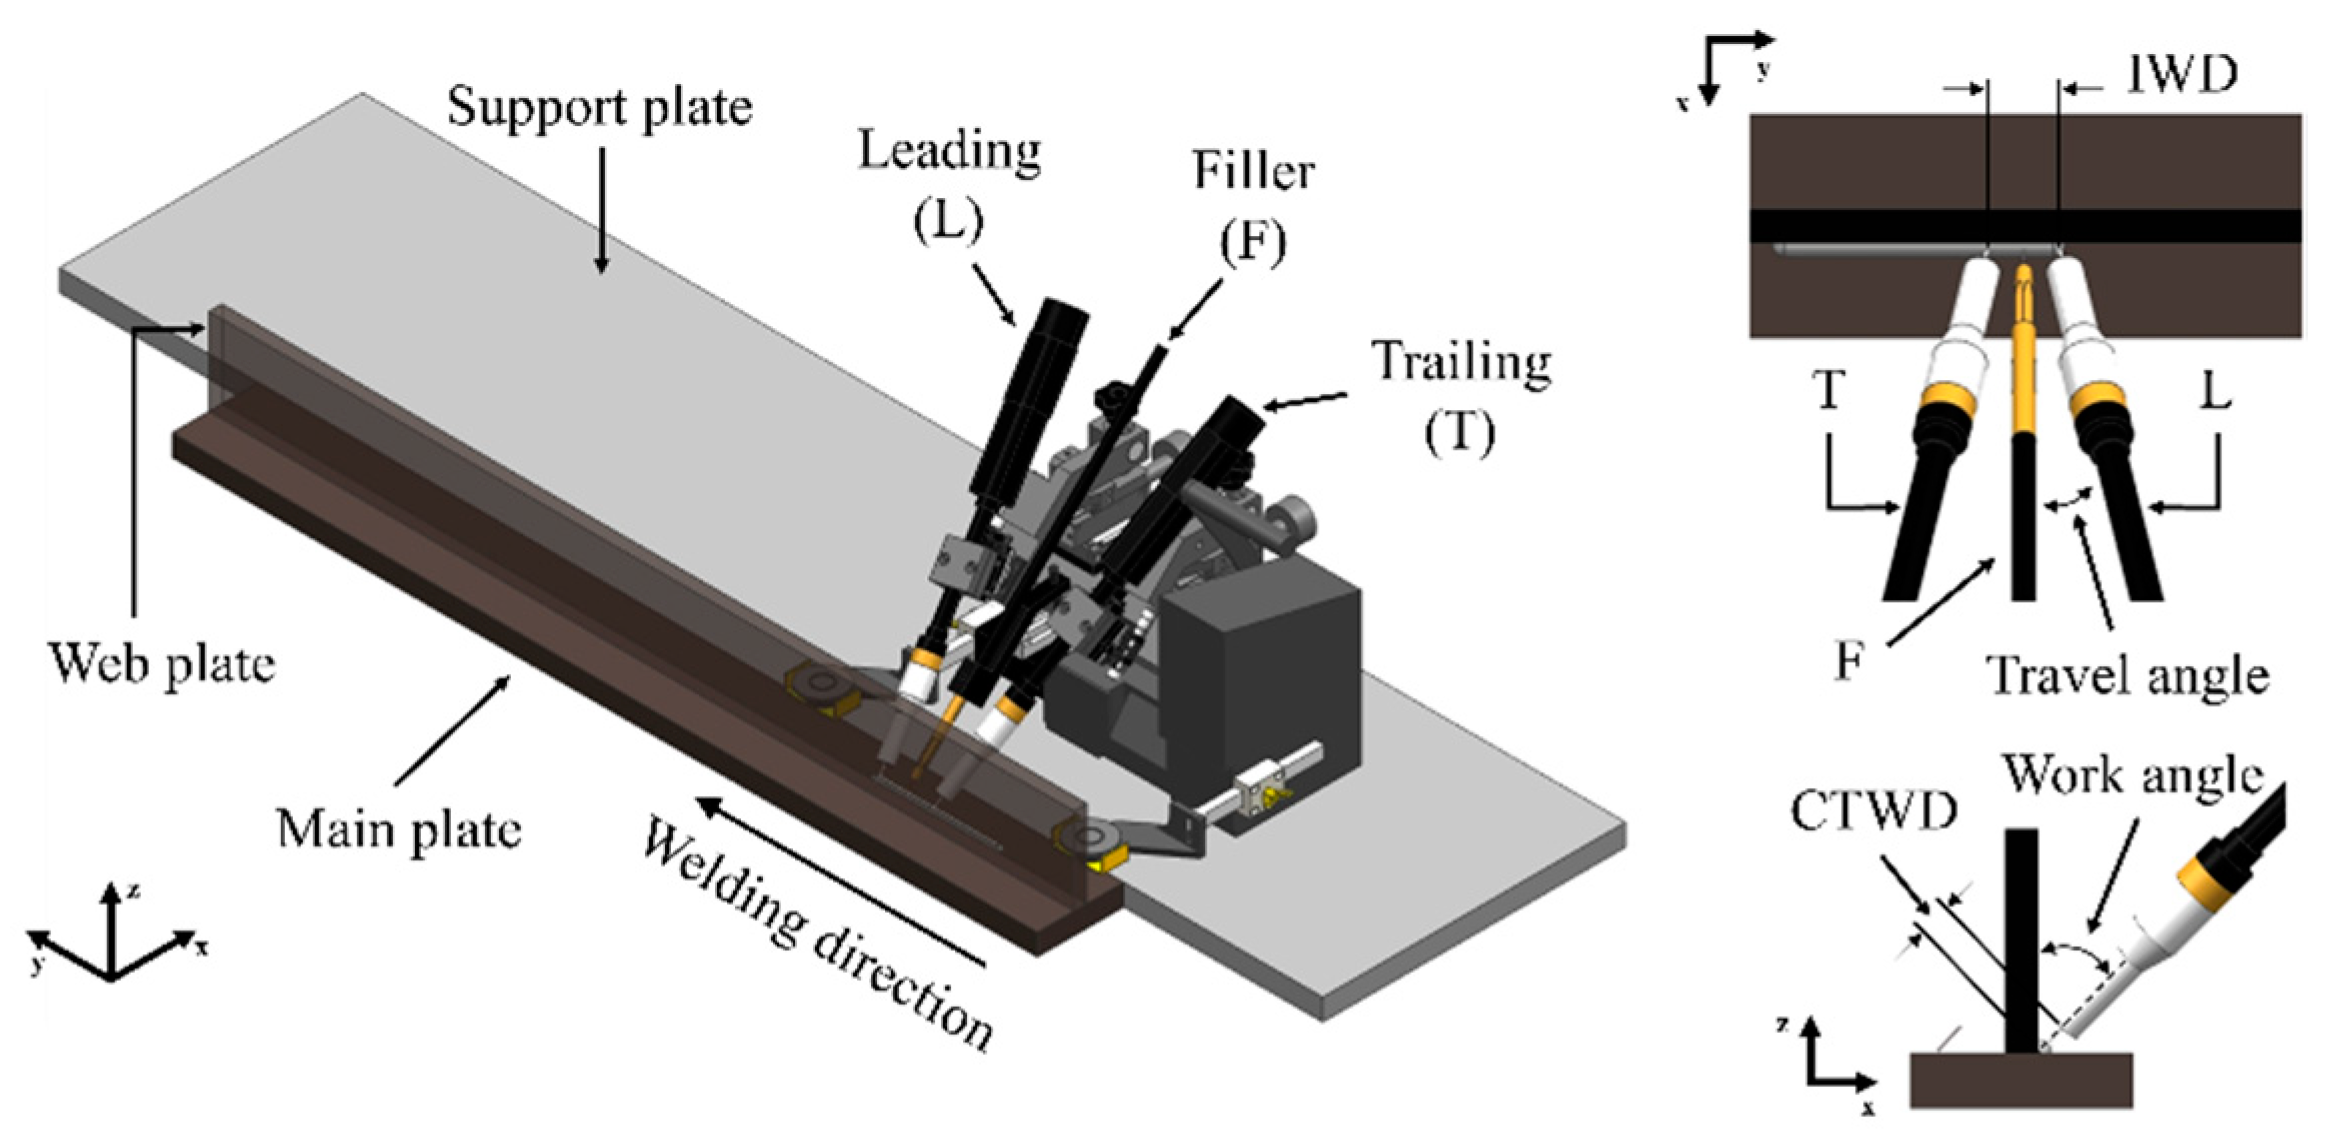
Figure 1. A schematic diagram of the hybrid-tandem GMAW experiment and the location of welding electrodes.
Metals 11 01087 g001
Figure 2. Details of the evaluation parameters.
Metals 11 01087 g002
Figure 3. Correlation of penetration shape with ranging leading current.
Metals 11 01087 g003
Figure 4. Values from the GPR model and experiment data.
Metals 11 01087 g004
Figure 5. Change of the penetration shape according to (a) leading and trailing current and (b) leading and trailing voltage.
Metals 11 01087 g005
Figure 6. (a) Cost function; (b) fusion zone shapes at optimal parameters.
Metals 11 01087 g006
Table 1. Chemical compositions of the base metal and wires.
MaterialsElement (wt %)
CSiMnPSCuNiCrMoV
AH360.1500.3601.4100.0130.0070.0100.0100.0300.0010.001
E71T-1C0.0320.5001.2500.0500.0000.0120.0200.0300.0070.019
ER70S-30.0700.6801.1700.0120.0110.1700.0100.0400.0000.003
Table 2. Correlation of penetration shape with ranging process parameters.
ParameterLevelPv
(STD)
Ph
(STD)
PBR
(STD)
Parea
(STD)
Lv
(STD)
Lh
(STD)
C
(STD)
CL
(A)
3601.571.681.5911.275.254.770.53
(0.13)(0.06)(0.07)(0.22)(0.10)(0.08)(0.05)
3801.751.831.5311.595.294.790.67
(0.08)(0.10)(0.12)(0.30)(0.11)(0.10)(0.05)
4002.011.751.6112.395.364.900.90
(0.08)(0.09)(0.10)(0.57)(0.13)(0.13)(0.05)
4201.971.821.6112.385.484.960.96
(0.22)(0.12)(0.12)(0.56)(0.09)(0.16)(0.06)
4402.021.801.6412.715.584.971.17
(0.09)(0.09)(0.10)(0.31)(0.10)(0.06)(0.13)
VL
(V)
320.951.250.777.595.114.960.99
(0.06)(0.06)(0.06)(0.26)(0.12)(0.09)(0.09)
341.591.661.2610.435.334.760.98
(0.12)(0.08)(0.10)(0.12)(0.06)(0.19)(0.08)
362.011.751.6112.395.364.900.90
(0.08)(0.09)(0.10)(0.57)(0.13)(0.13)(0.05)
382.002.171.8613.675.574.820.86
(0.23)(0.09)(0.11)(0.69)(0.14)(0.16)(0.09)
402.332.261.8916.155.515.120.69
(0.05)(0.08)(0.12)(0.78)(0.08)(0.17)(0.08)
CT
(A)
3202.221.611.5411.775.375.220.50
(0.13)(0.04)(0.05)(0.26)(0.11)(0.06)(0.04)
3402.101.651.5812.385.385.150.76
(0.08)(0.07)(0.05)(0.34)(0.07)(0.11)(0.04)
3602.011.751.6112.395.364.900.90
(0.08)(0.09)(0.10)(0.57)(0.13)(0.13)(0.05)
3801.951.861.6112.525.464.731.26
(0.22)(0.07)(0.09)(0.32)(0.11)(0.13)(0.08)
4001.991.981.6312.555.494.331.62
(0.09)(0.11)(0.09)(0.59)(0.13)(0.14)(0.14)
VT
(V)
341.941.551.2810.024.574.381.61
(0.14)(0.04)(0.08)(0.42)(0.11)(0.20)(0.07)
362.011.581.4811.245.104.801.17
(0.03)(0.10)(0.13)(0.49)(0.12)(0.12)(0.04)
382.011.751.6112.395.364.900.90
(0.08)(0.09)(0.10)(0.57)(0.13)(0.13)(0.05)
402.111.701.6213.135.325.200.86
(0.08)(0.05)(0.06)(0.36)(0.06)(0.13)(0.07)
421.961.911.7814.215.535.200.66
(0.11)(0.09)(0.08)(0.31)(0.13)(0.07)(0.03)
CF
(A)
601.931.911.6512.725.374.680.82
(0.24)(0.16)(0.10)(0.46)(0.15)(0.24)(0.08)
802.171.571.6112.465.314.960.87
(0.20)(0.18)(0.19)(0.21)(0.09)(0.23)(0.05)
1002.011.751.6112.395.364.900.90
(0.08)(0.09)(0.10)(0.57)(0.13)(0.13)(0.05)
1202.131.681.6112.355.464.950.94
(0.06)(0.07)(0.05)(0.48)(0.08)(0.09)(0.05)
1401.861.761.6012.315.444.880.97
(0.06)(0.07)(0.04)(0.53)(0.13)(0.10)(0.04)
IWD
(mm)
20.01.911.861.6613.115.495.070.86
(0.22)(0.10)(0.13)(0.46)(0.08)(0.16)(0.04)
22.52.061.591.5512.475.375.030.91
(0.08)(0.08)(0.08)(0.53)(0.08)(0.11)(0.06)
25.02.011.751.6112.395.364.900.90
(0.08)(0.09)(0.10)(0.57)(0.13)(0.13)(0.05)
27.51.801.971.6512.565.264.860.96
(0.24)(0.17)(0.10)(0.34)(0.14)(0.16)(0.08)
30.01.991.711.5511.515.164.781.00
(0.03)(0.08)(0.06)(0.40)(0.21)(0.18)(0.10)
Position12.671.660.7813.044.775.251.08
(0.10)(0.13)(0.08)(0.43)(0.19)(0.11)(0.05)
22.401.71.2912.925.175.150.78
(0.08)(0.06)(0.09)(0.42)(0.19)(0.13)(0.05)
32.011.751.6112.395.364.900.90
(0.08)(0.09)(0.10)(0.57)(0.13)(0.13)(0.05)
41.432.071.8211.735.674.820.89
(0.16)(0.14)(0.19)(0.40)(0.08)(0.17)(0.11)
51.132.602.2511.695.554.830.67
(0.05)(0.06)(0.10)(0.26)(0.04)(0.09)(0.06)
Table 3. Results of ANOVA.
ParameterDOFSum of SquaresMean of SquaresF-Valuep-Value
CL41.72040.43012.960.020
VL434.02538.506358.630.000
CT40.25110.06280.430.785
VT46.93631.734111.950.000
CF40.16330.04080.280.890
IWD40.76780.19201.320.262
Position40.62790.15701.080.366
Error23534.09720.1451--
Total26377.2694---
Table 4. Measurements from the experiment and prediction from the GPR model with optimal parameters.
Pv
(mm)
Ph
(mm)
PBR
(mm)
Parea
(mm)
Lv
(mm)
Lh
(mm)
C
(mm)
Experiment
(STD)
2.12
(0.06)
2.49
(0.11)
2.11
(0.15)
16.51
(0.65)
6.11
(0.07)
5.20
(0.26)
0.76
(0.11)
GPR2.322.251.8916.195.535.050.69
Publisher’s Note: MDPI stays neutral with regard to jurisdictional claims in published maps and institutional affiliations.