
Electrochemistry, Electrodeposition, and Photoluminescence of Eu (III)/Lanthanides (III) on Terpyridine-Functionalized Ti Nanospikes


Abstract
1. Introduction
2. Materials and Methods
3. Results and Discussion
4. Conclusions
Supplementary Materials
Author Contributions
Funding
Institutional Review Board Statement
Informed Consent Statement
Data Availability Statement
Conflicts of Interest
References
- Ricci, P.C. Assessment of crystalline materials for solid state lighting applications: Beyond the rare earth elements. Crystals 2020, 10, 559. [Google Scholar] [CrossRef]
- Monteiro, J.H.S.K. Recent Advances in Luminescence Imaging of Biological Systems Using Lanthanide (III) Luminescent Complexes. Molecules 2020, 25, 2089. [Google Scholar] [CrossRef]
- Gontcharenko, V.E.; Kiskin, M.A.; Dolzhenko, V.D.; Korshunov, V.M.; Taydakov, I.V.; Belousov, Y.A. Mono- and Mixed Metal Complexes of Eu3+, Gd3+, and Tb3+ with a Diketone, Bearing Pyrazole Moiety and CHF2-Group: Structure, Color Tuning, and Kinetics of Energy Transfer between Lanthanide Ions. Molecules 2021, 26, 2655. [Google Scholar] [CrossRef]
- Tigaa, R.A.; Ortega, R.E.; Lin, X.; Strouse, G.F. A Versatile Tripodal Ligand for Sensitizing Lanthanide (LnIII) Ions and Color Tuning. Chemistry 2021, 3, 138–145. [Google Scholar] [CrossRef]
- Kaya, E.E.; Kaya, O.; Stopic, S.; Gürmen, S.; Friedrich, B. NdFeB Magnets Recycling Process: An Alternative Method to Produce Mixed Rare Earth Oxide from Scrap NdFeB Magnets. Metals 2021, 11, 716. [Google Scholar] [CrossRef]
- Choi, E.-Y.; Jeong, S.M. Electrochemical processing of spent nuclear fuels: An overview of oxide reduction in pyroprocessing technology. Prog. Nat. Sci. 2015, 25, 572–582. [Google Scholar]
- Khan, M.M.; Ansari, S.A.; Pradhan, D.; Han, D.H.; Lee, J.; Cho, M.H. Defect-induced band gap narrowed CeO2 nanostructures for visible light activities. Ind. Eng. Chem. Res. 2014, 53, 9754–9763. [Google Scholar]
- Vita, A. Catalytic Applications of CeO2-Based Materials. Catalysts 2020, 10, 576. [Google Scholar] [CrossRef]
- Zou, F.-R.; Wang, S.-N.; Wang, F.-F.; Liu, D.; Li, Y. Synthesis of Lanthanide-Functionalized Carbon Quantum Dots for Chemical Sensing and Photocatalytic Application. Catalysts 2020, 10, 833. [Google Scholar] [CrossRef]
- Kim, D. Recent Developments in Lanthanide-Doped Alkaline Earth Aluminate Phosphors with Enhanced and Long-Persistent Luminescence. Nanomaterials 2021, 11, 723. [Google Scholar] [CrossRef]
- Bejan, D.; Bahrin, L.G.; Shova, S.; Marangoci, N.L.; Kökҫam-Demir, Ü.; Lozan, V.; Janiak, C. New Microporous Lanthanide Organic Frameworks. Synthesis, Structure, Luminescence, Sorption, and Catalytic Acylation of 2-Naphthol. Molecules 2020, 25, 3055. [Google Scholar] [CrossRef]
- Bazhenova, T.A.; Yakushev, I.A.; Lyssenko, K.A.; Maximova, O.V.; Mironov, V.S.; Manakin, Y.V.; Kornev, A.B.; Vasiliev, A.N.; Yagubskii, E.B. Ten-Coordinate Lanthanide [Ln (HL)(L)] Complexes (Ln = Dy, Ho, Er, Tb) with Pentadentate N3O2-Type Schiff-Base Ligands: Synthesis, Structure and Magnetism. Magnetochemistry 2020, 6, 60. [Google Scholar] [CrossRef]
- Hernández-Fuentes, C.; Ruiz-Guerrero, R.; Morales-Ramírez, A.d.J.; Molina-Maldonado, P.; Medina-Velazquez, D.Y. New Mononuclear Complex of Europium (III) and Benzoic Acid: From Synthesis and Crystal Structure Solution to Luminescence Emission. Crystals 2020, 10, 674. [Google Scholar] [CrossRef]
- Lu, P.; Wang, Y.; Huang, L.; Lian, S.; Wang, Y.; Tang, J.; Belfiore, L.A.; Kipper, M.J. Tb3+/Eu3+ Complex-Doped Rigid Nanoparticles in Transparent Nanofibrous Membranes Exhibit High Quantum Yield Fluorescence. Nanomaterials 2020, 10, 694. [Google Scholar] [CrossRef]
- Kim, S.; Lee, S.-H. Electrochemical Properties of NdCl3 and CeCl3 in Molten LiCl-KCl Eutectic Salt. Appl. Sci. 2020, 10, 7252. [Google Scholar] [CrossRef]
- Song, K.; Yu, H.; Zhang, J.; Bai, Y.; Guan, Y.; Yu, J.; Guo, L. Rosebengal-Loaded Nanoporous Structure Based on Rare Earth Metal-Organic-Framework: Synthesis, Characterization and Photophysical Performance. Crystals 2020, 10, 185. [Google Scholar] [CrossRef]
- Fan, X.; Gu, L.; Hu, Y.; Zhu, Q. Uniform Spheres of α-NaYF4:RE3+ (RE=Eu, Tb, Ce, Er, and Tm): Template-Free Synthesis, Multi-Color Photoluminescence, and Their Application in Cellular Imaging. Crystals 2020, 10, 119. [Google Scholar] [CrossRef]
- Cavalli, E. Development and Applications of Transition Metal or Rare Earth-Based Luminescent Inorganic Materials. Crystals 2020, 10, 1120. [Google Scholar] [CrossRef]
- Ahn, N.-K.; Swain, B.; Shim, H.-W.; Kim, D.-W. Recovery of rare earth oxide from waste NiMH batteries by simple wet chemical valorization process. Metals 2019, 9, 1151. [Google Scholar] [CrossRef]
- Cardoso, C.E.D.; Almeida, J.C.; Lopes, C.B.; Trindade, T.; Vale, C.; Pereira, E. Recovery of rare earth elements by carbon−based nanomaterials—A review. Nanomaterials 2019, 9, 814. [Google Scholar] [CrossRef]
- Joo, M.H.; Park, S.J.; Hong, S.-M.; Rhee, C.K.; Kim, D.; Sohn, Y. Electrodeposition and Characterization of Lanthanide Elements on Carbon Sheets. Coatings 2021, 11, 100. [Google Scholar] [CrossRef]
- Joo, M.H.; Park, S.J.; Jang, H.J.; Hong, S.-M.; Rhee, C.K.; Sohn, Y. Enhanced Photoluminescence of Electrodeposited Europium Complex on Bare and Terpyridine-Functionalized Porous Si Surfaces. Photochem 2021, 1, 38–52. [Google Scholar] [CrossRef]
- Joo, M.H.; Park, S.J.; Hong, S.M.; Rhee, C.K.; Sohn, Y. Electrochemical Recovery and Behaviors of Rare Earth (La, Ce, Pr, Nd, Sm, Eu, Gd, Tb, Dy, Ho, Er, Tm, and Yb) Ions on Ni Sheets. Materials 2020, 13, 5314. [Google Scholar] [CrossRef] [PubMed]
- Sahoo, J.; Jaiswar, S.; Chatterjee, P.B.; Subramanian, P.S.; Jena, H.S. Mechanistic Insight of Sensing Hydrogen Phosphate in Aqueous Medium by Using Lanthanide (III)-Based Luminescent Probes. Nanomaterials 2021, 11, 53. [Google Scholar] [CrossRef] [PubMed]
- Kang, J.-G.; Jung, Y.; Min, B.-K.; Sohn, Y. Full characterization of Eu (OH)3 and Eu2O3 nanorods. Appl. Surf. Sci. 2014, 314, 158–165. [Google Scholar] [CrossRef]
- Park, S.J.; Joo, M.H.; Hong, S.-M.; Rhee, C.K.; Kang, J.-G.; Sohn, Y. Electrochemical Eu (III)/Eu (II) Behaviors and Recovery over Terpyridyl-Derivatized Modified Indium Tin Oxide Electrode Surfaces. Chem. Eng. J. 2021, 15, 128717. [Google Scholar] [CrossRef]
- Park, S.J.; Joo, M.H.; Hong, S.-M.; Kang, J.-G.; Rhee, C.K.; Lee, S.W.; Sohn, Y. Electrochemical Eu (III) behaviors and Eu oxysulfate recovery over terpyridine-functionalized indium tin oxide electrode. Inorg. Chem. Front. 2020, 8, 1175–1188. [Google Scholar] [CrossRef]
- Joo, M.H.; Park, S.J.; Hong, S.M.; Rhee, C.K.; Sohn, Y. Electrochemical behaviors and electrodeposited materials of lanthanides (La, Ce, Pr, Nd, Sm, Eu, Gd, Tb, Dy, Ho, Er, Tm, and Yb) on terpyridine-functionalized Ti sheets. Mater. Today Commun. 2021, 27, 102305. [Google Scholar] [CrossRef]
- NIST DTSA-II Software. Available online: https://cstl.nist.gov/div837/837.02/epq/dtsa2/ (accessed on 1 May 2021).
- Wu, X.; Li, J.-G.; Zhu, Q.; Liu, W.; Li, J.; Li, X.; Sun, X.; Sakka, Y. One-step freezing temperature crystallization of layered rare-earth hydroxide (Ln2(OH)5NO3∙nH2O) nanosheets for a wide spectrum of Ln (Ln = Pr–Er, and Y), anion exchange with fluorine and sulfate, and microscopic coordination probed via photoluminescence. J. Mater. Chem. C 2015, 3, 3428–3437. [Google Scholar] [CrossRef]
- Millero, F.J.; Magdalena Santana-Casiano, J.; Gonzalez-Davila, M. The formation of Cu (II) complexes with carbonate and bicarbonate ions in NaClO4 solutions. J. Solut. Chem. 2010, 39, 543–558. [Google Scholar] [CrossRef]
- Chen, Y.; Zhang, Y.-H.; Zhao, L.-Z. ATR-FTIR spectroscopic studies on aqueous LiClO4, NaClO4, and Mg (ClO4)2 solutions. Phys. Chem. Chem. Phys. 2004, 6, 537–542. [Google Scholar] [CrossRef]
- Sohn, Y. Structural and spectroscopic characteristics of terbium hydroxide/oxide nanorods and plates. Ceram. Int. 2014, 40, 13803–13811. [Google Scholar] [CrossRef]
- Kang, J.-G.; Min, B.-K.; Sohn, Y. Synthesis and characterization of Gd (OH)3 and Gd2O3 nanorods. Ceram. Int. 2015, 41, 1243–1248. [Google Scholar] [CrossRef]
- NIST X-ray Photoelectron Spectroscopy Database, Version 4.1 National Institute of Standards and Technology, Gaithersburg. 2012. Available online: http://srdata.nist.gov/xps/ (accessed on 5 May 2021).
- Kang, J.-G.; Sohn, Y. Interfacial nature of Ag nanoparticles supported on TiO2 photocatalysts. J. Mater. Sci. 2012, 47, 824–832. [Google Scholar] [CrossRef]
- Yang, J.H.; Park, S.J.; Rhee, C.K.; Sohn, Y. Photocatalytic CO2 Reduction and Electrocatalytic H2 Evolution over Pt (0,II,IV)-Loaded Oxidized Ti Sheets. Nanomaterials 2020, 10, 1909. [Google Scholar] [CrossRef] [PubMed]
- Pawlik, N.; Szpikowska-Sroka, B.; Pisarski, W.A. Energy transfer study on Tb3+/Eu3+ co-activated sol-gel glass-ceramic materials containing MF3 (M = Y, La) nanocrystals for NUV optoelectronic devices. Materials 2020, 13, 2522. [Google Scholar] [CrossRef]


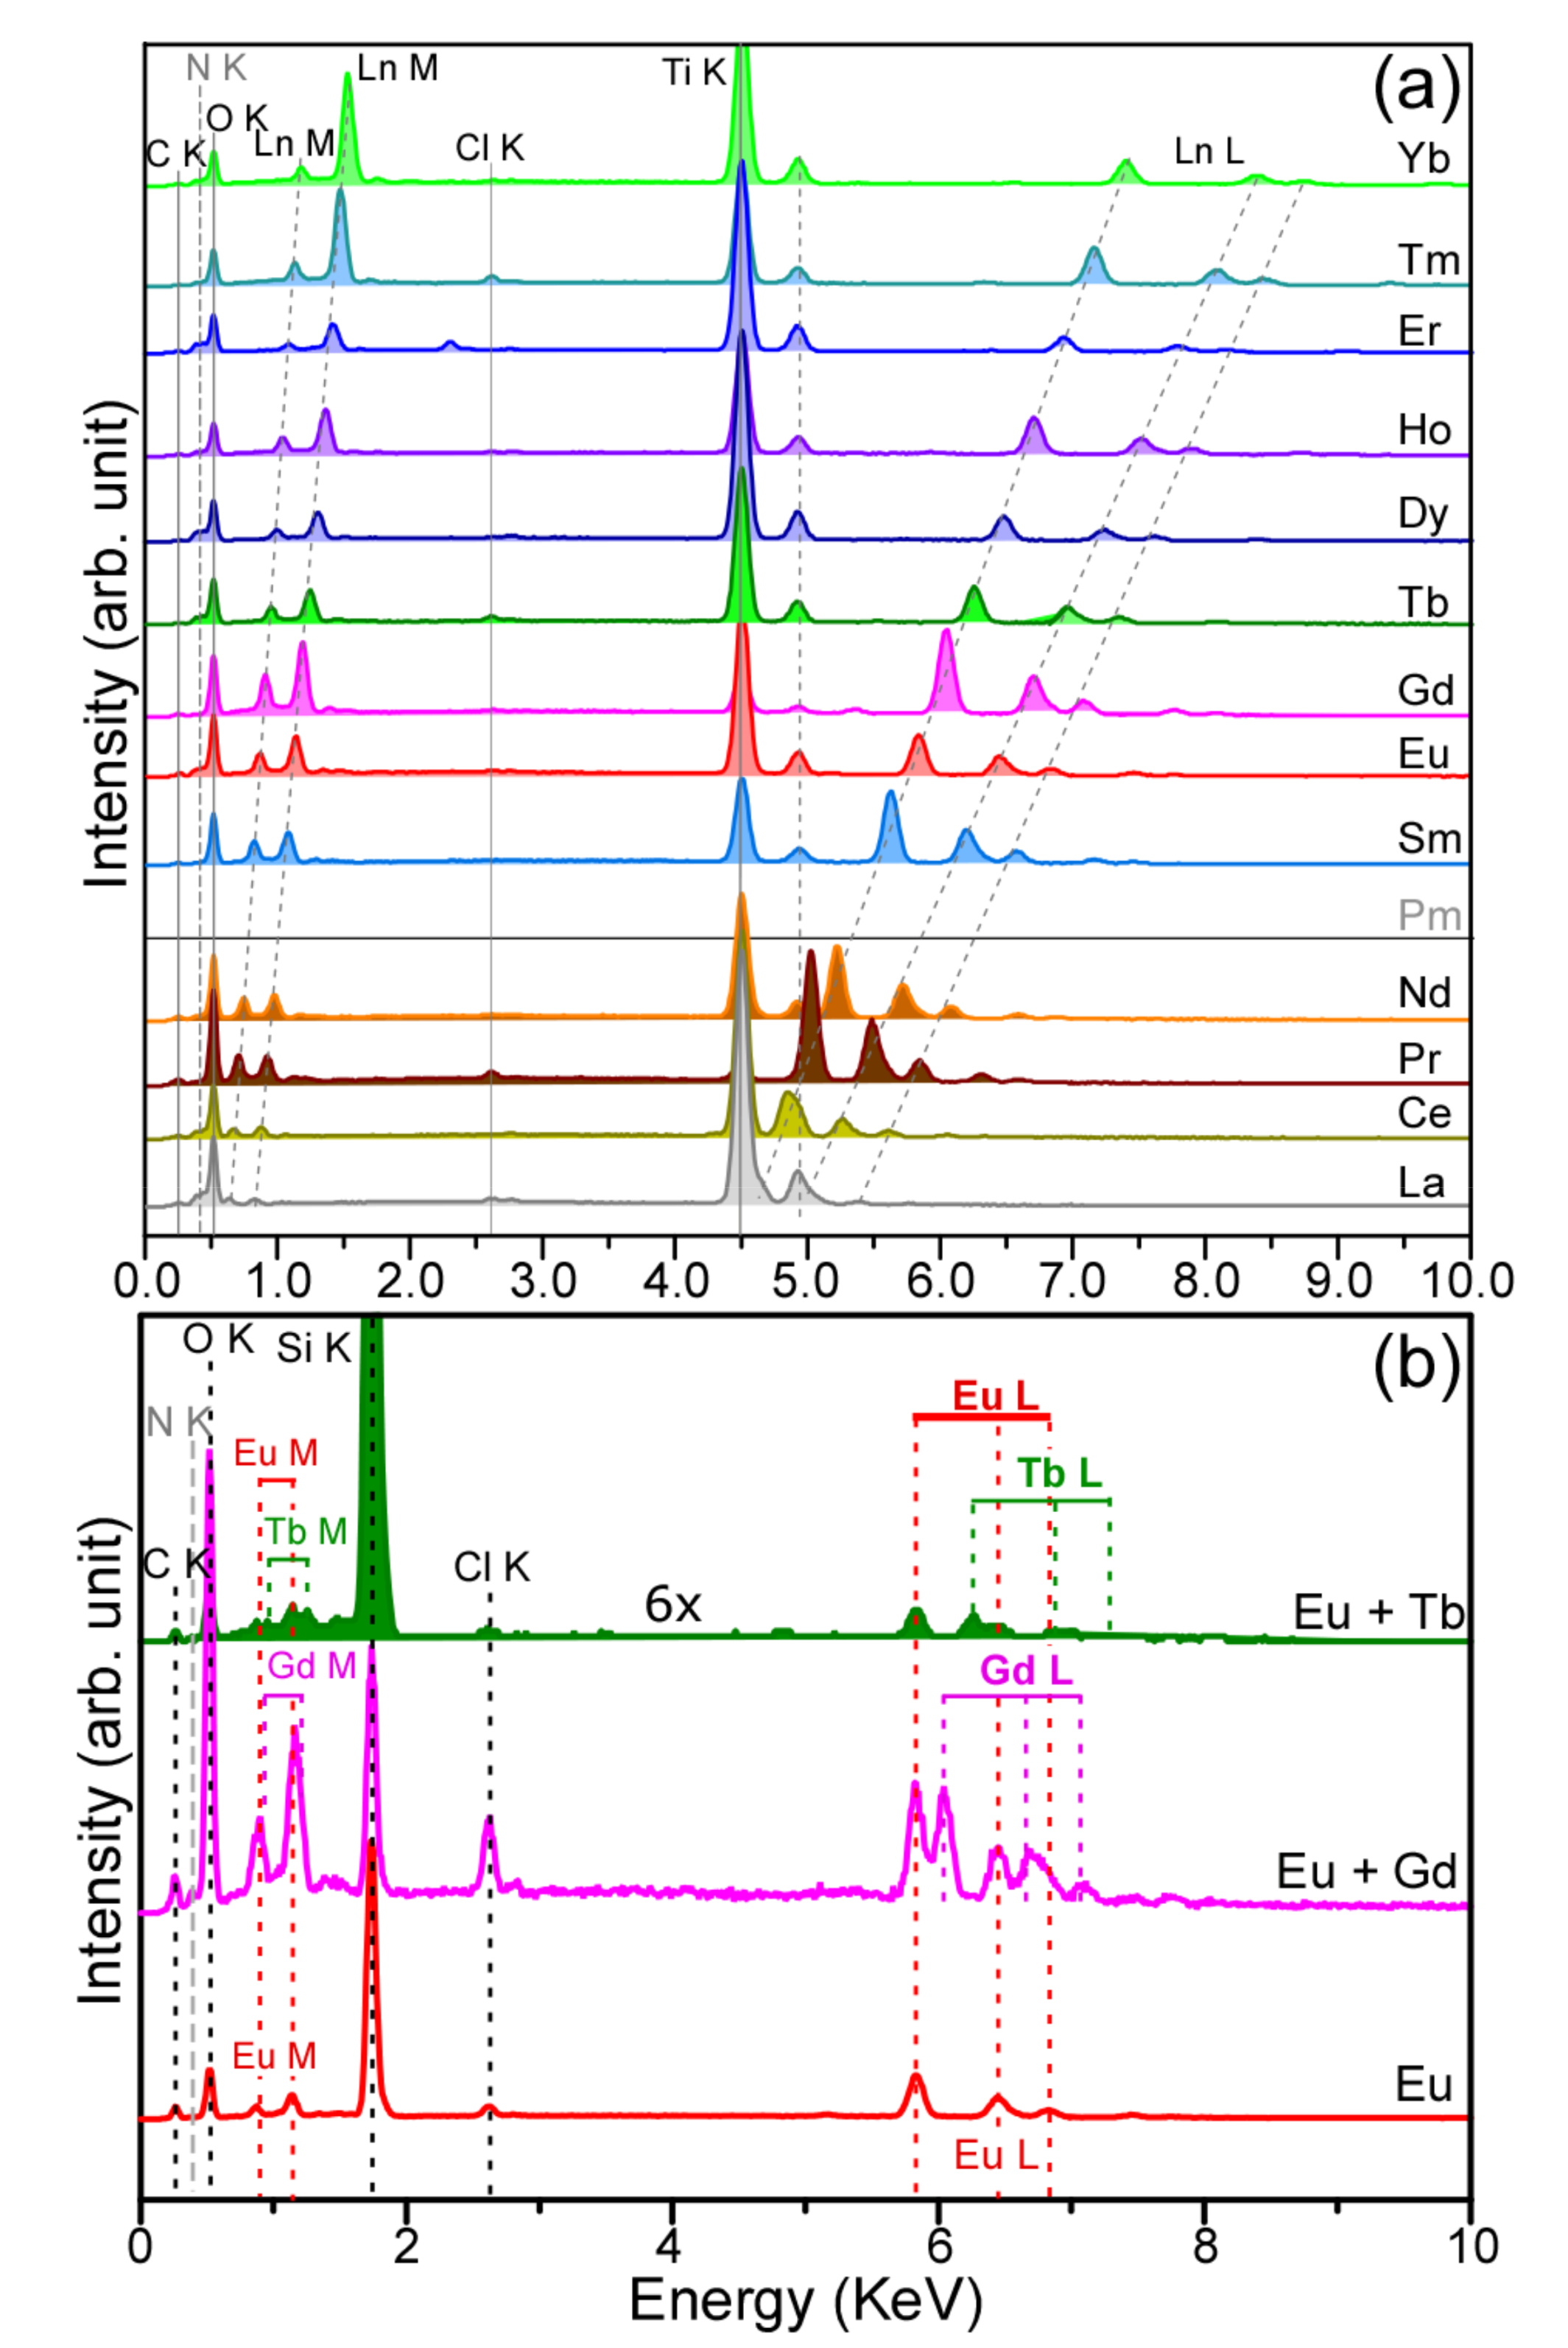
| Ln | Ln M (KeV) | Ln L (KeV) |
|---|---|---|
| La | 0.63, 0.84 | 4.67, 4.93, 5.38 |
| Ce | 0.67, 0.88 | 4.87, 5.27, 5.61 |
| Pr | 0.71, 0.92 | 5.03, 5.49, 5.85 |
| Nd | 0.75, 0.99 | 5.23, 5.72, 6.09 |
| Sm | 0.82, 1.09 | 5.64, 6.2, 6.57 |
| Eu | 0.88, 1.15 | 5.83, 6.47, 6.84 |
| Gd | 0.92, 1.20 | 6.05, 6.72, 7.11 |
| Tb | 0.95, 1.25 | 6.25, 6.97, 7.36 |
| Dy | 1.01, 1.31 | 6.49, 7.26, 7.63 |
| Ho | 1.05, 1.36 | 6.72, 7.51, 7.88 |
| Er | 1.09, 1.42 | 6.93, 7.79, 8.17 |
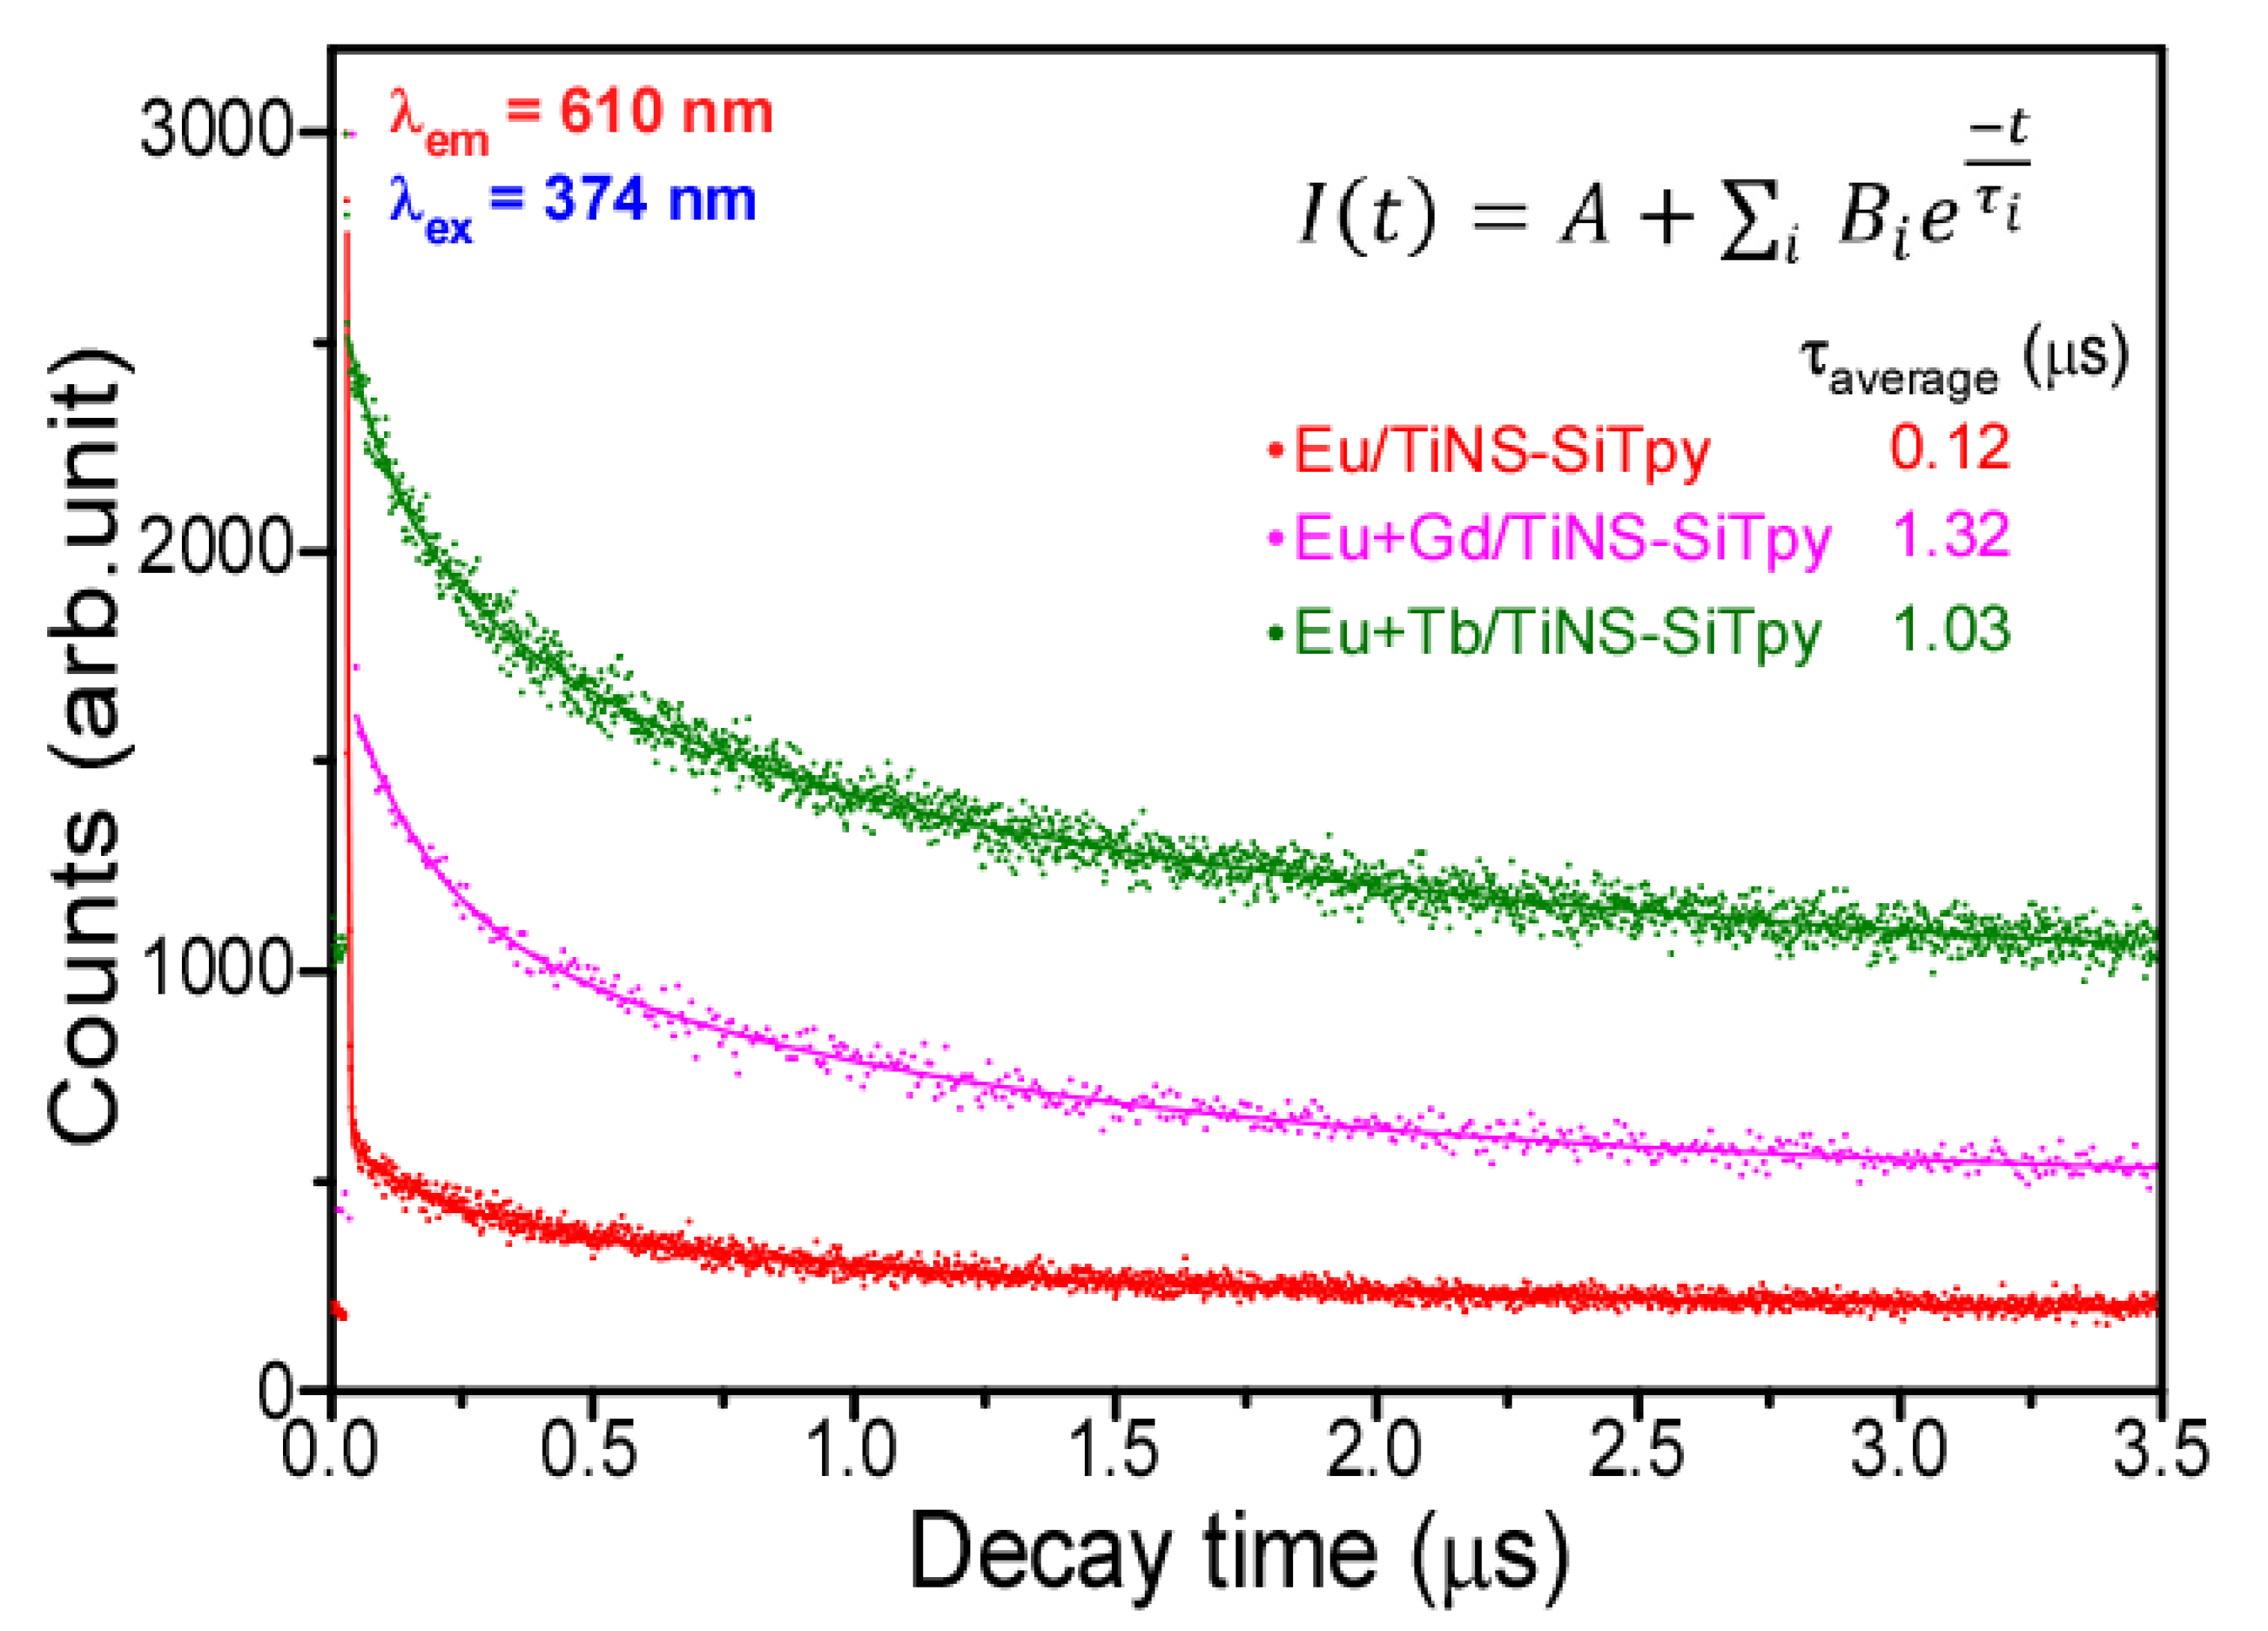
| Parameters * | Eu/TiNS-SiTpy | Eu + Gd/TiNS-SiTpy | Eu + Tb/TiNS-SiTpy |
|---|---|---|---|
| τ1 (μs) | 0.14601 | 0.92757 | 0.37351 |
| τ2 (μs) | 1.08873 | 4.52343 | 1.92062 |
| τ3 (μs) | 0.00232 | 0.15218 | 0.07966 |
| B1 | 142.7179 | 529.1066 | 545.0598 |
| B2 | 258.5388 | 225.3185 | 721.3731 |
| B3 | 2167.448 | 441.1102 | 303.7022 |
| R1 | 0.05556 | 0.442569 | 0.347142 |
| R2 | 0.100649 | 0.188467 | 0.459434 |
| R3 | 0.84379 | 0.368965 | 0.193424 |
| A | 192.6185 | 412.9804 | 943.3153 |
| χ2 | 1.04538 | 1.04873 | 1.038885 |
| τaverage (μs) | 0.11965 (±0.0366) | 1.31918 (±0.163) | 1.02747 (±0.0825) |
Publisher’s Note: MDPI stays neutral with regard to jurisdictional claims in published maps and institutional affiliations. |
© 2021 by the authors. Licensee MDPI, Basel, Switzerland. This article is an open access article distributed under the terms and conditions of the Creative Commons Attribution (CC BY) license (https://creativecommons.org/licenses/by/4.0/).
Share and Cite
Joo, M.H.; Park, S.J.; Jang, H.J.; Hong, S.-M.; Rhee, C.K.; Sohn, Y. Electrochemistry, Electrodeposition, and Photoluminescence of Eu (III)/Lanthanides (III) on Terpyridine-Functionalized Ti Nanospikes. Metals 2021, 11, 977. https://doi.org/10.3390/met11060977
Joo MH, Park SJ, Jang HJ, Hong S-M, Rhee CK, Sohn Y. Electrochemistry, Electrodeposition, and Photoluminescence of Eu (III)/Lanthanides (III) on Terpyridine-Functionalized Ti Nanospikes. Metals. 2021; 11(6):977. https://doi.org/10.3390/met11060977
Chicago/Turabian StyleJoo, Min Hee, So Jeong Park, Hye Ji Jang, Sung-Min Hong, Choong Kyun Rhee, and Youngku Sohn. 2021. "Electrochemistry, Electrodeposition, and Photoluminescence of Eu (III)/Lanthanides (III) on Terpyridine-Functionalized Ti Nanospikes" Metals 11, no. 6: 977. https://doi.org/10.3390/met11060977
APA StyleJoo, M. H., Park, S. J., Jang, H. J., Hong, S.-M., Rhee, C. K., & Sohn, Y. (2021). Electrochemistry, Electrodeposition, and Photoluminescence of Eu (III)/Lanthanides (III) on Terpyridine-Functionalized Ti Nanospikes. Metals, 11(6), 977. https://doi.org/10.3390/met11060977