Article

Characterization of Iron-Matrix Composites Reinforced by In Situ TiC and Ex Situ WC Fabricated by Casting

by
Aida B. Moreira
1,2,
Laura M. M. Ribeiro
1,2,
Pedro Lacerda
3 and
Manuel F. Vieira
1,2,*
1
Department of Metallurgical and Materials Engineering, University of Porto, R. Dr. Roberto Frias, 4200-465 Porto, Portugal
2
LAETA/INEGI—Institute of Science and Innovation in Mechanical and Industrial Engineering, R. Dr. Roberto Frias, 4200-465 Porto, Portugal
3
FERESPE, Fundição de Ferro e Aço Lda., 4760-485 Fradelos, Portugal
*
Author to whom correspondence should be addressed.
Metals 2021, 11(6), 862; https://doi.org/10.3390/met11060862
Submission received: 19 April 2021 / Revised: 13 May 2021 / Accepted: 21 May 2021 / Published: 25 May 2021

Abstract

:
In this study, the effect of microstructural characteristics on the mechanical properties of high-chromium white cast iron-matrix composites reinforced by in situ TiC and ex situ WC was investigated. To this end, two different powder mixtures (Ti + Al + graphite and WC + Fe) were compressed to produce green compacts that were inserted into the mold, before casting. The microstructure of the resulting composites and the base metal was characterized using optical microscopy (OM) and scanning electron microscopy with energy dispersive spectroscopy (SEM/EDS). The microstructural analysis revealed a sound bonding between the composite zone and the base metal. The reinforcement with WC particles showed a homogeneous distribution of the carbide particles, unlike the reinforcement with TiC particles. The mechanical properties of the reinforcements were evaluated using hardness and ball-cratering micro-abrasion tests. The results showed that both reinforcements increase the hardness and wear performance of the base material, which was the best performance achieved by the reinforcement with WC particles.

1. Introduction

The development of reinforcements for components produced by casting is appealing because it extends the applications to high-wear solicitations. The effect of the reinforcement is to increase the wear resistance over the whole surface or in the predefined area of the component, almost without the need for specialized equipment. Thus, the process of reinforcing cast components is considered a low-cost and highly efficient process.
Several studies have been conducted to investigate the production of white cast iron (WCI) parts locally reinforced with WC particles [1,2,3,4,5]. Zheng et al. [3] applied a foam of WC and Fe and concluded that the wear resistance of the composite zone was three times greater than that of the matrix, due to the WC and Fe3W3C phases formed. Li and Gao [4] used recycled tips of WC-Co and explained the low wear volume loss of the composite zone to the formation of the Fe3W3C and Co3W3C phases resulting from the partial dissolution of the WC-Co particles and the diffusion of W, C, Co, and Fe.
The production of castings locally reinforced with TiC particles formed by in situ synthesis has been reported in steels [6,7,8,9,10,11] and grey cast irons [12,13,14]. However, the application of the process to white cast iron parts is still novel [15].
Liang et al. [11] successfully reinforced austenitic manganese steel with TiC-TiB2 and reported an increase of 32 HRC relative to the base metal. He et al. [12], produced a TiC-Fe composite coating in situ on grey cast iron specimens with a hardness (68 HRC) that more than doubled the hardness of the ferrous matrix. Hu et al. [16] also investigated the reinforcement of austenitic manganese steel by combustion synthesis of Fe, Ti, and C powders and achieved a three-fold increase in hardness.
Despite the understanding acquired from previous studies, there is a need to deepen the knowledge of the effect of nature, volume fraction, size, and hardness of the phases that compose the reinforcement on its mechanical properties. Thus, in the present study, high-Cr WCI specimens locally reinforced with in situ TiC and ex situ WC were produced to investigate the relationship between microstructural features and the hardness and abrasive wear performance. For this purpose, distinct reinforcements were fabricated using two powder mixtures, one with Ti, Al, and graphite and the other with WC and Fe. Al acts as a deoxidizer and grain refiner, leading to a reduction of porosity [17] and the size of TiC particles [18], whereas Fe acts as a flux, improving the infiltration of molten metal into the compact mixture [19,20,21]. The microstructural characterization was carried out by scanning electron microscopy with energy dispersive spectroscopy (SEM/EDS) and ball-cratering micro-abrasion tests were used to investigate the abrasive wear resistance.

2. Materials and Methods

2.1. Reinforced Specimens Production

The reinforced specimens were fabricated using a pressureless casting technique, as shown schematically in Figure 1. Two different powder systems were selected to produce the green compacts—Ti + Al + graphite and WC + Fe. For this purpose, commercial powders of Ti, Al, Fe, graphite, and WC were used. The specified mean diameters and purities were as follows: Ti—43 µm and 99.5 wt.%; Al—12 µm and 99.0 wt.%; Fe—10 µm and 99.0 wt.%; graphite—43 µm and 99.0 wt.%; and WC—106 µm and 99.0 wt.%.
The Ti + Al + graphite powders were mixed in a 64:20:16 mass ratio, and the WC + Fe powders were in a volume fraction of 40:60. The powder mixtures were homogenized in a Turbula shaker-mixer for 7 h and bonded with Na2SiO3 (1.50 mL for each 7.30 g of powder). The mixtures were then cold-pressed with approximately 70 MPa in a metallic mold to produce parallelepiped compacts of 31 mm × 12 mm × 7 mm. As a final step, the green compacts were inserted in the mold cavity, and the high-Cr WCI with the following chemical composition (wt.%): 3.1% C, 0.6% Si, 0.5% Mn, 26.8% Cr, 0.3% Ni, bal. Fe, according to the ASTM A532 standard [22], was poured at 1460 °C.

2.2. Microstructural Characterization

The cast specimens were cut by wire electrical discharge machining to obtain 5 mm thick cross-section samples. These samples were metallographically prepared, that is, ground, polished, and chemically etched with 2% Nital and Beraha-Martensite reagents. The microstructures were characterized by optical microscopy (OM) using a Leica DM 4000 M with a DFC 420 camera (Leica Microsystems, Wetzlar, Germany), and scanning electron microscopy (SEM), using an FEI QUANTA 400 FEG (FEI Company, Hillsboro, OR, USA) with an energy-dispersive detector (EDS). SEM images were obtained with a backscattered (BSE) and secondary (SE) electron detectors.
The percentage of carbides was measured in SEM–BSE images using ImageJ (v.1.52, Wayne Rasband, National Institutes of Health, Bethesda, MD, USA), an open-source image analysis software. The number and magnification of the fields were selected according to their microstructural features—40 random fields with a magnification of 2000× for reinforcement with TiC particles, and 10 random fields with a magnification of 200× for reinforcement with WC particles. M7C3 carbides (from this point on referenced in the text as (Fe,Cr)7C3 carbides) quantification had to be performed using EDS maps with 500× magnification, due to the lack of contrast between the carbides and the reinforced matrix.

2.3. Mechanical Characterization

The mechanical characterization of the reinforced specimens was conducted using hardness and ball-cratering micro-abrasion tests. The bulk hardness of each specimen was measured by the Vickers hardness tests, using a nominal test force of 294.2 N, in a universal hardness tester DuraVision 20 (EMCO-TEST Prüfmaschinen GmbH, Kuchl, Austria). Moreover, seven tests were performed in each reinforced specimen. To better understand the wear mechanism, microhardness analysis of the phases was also performed in a Duramin-1 hardness tester using a load of 0.9807 N. Here, eleven measurements were carried out in each phase. Due to the small size of the TiC particles, a Micro Material NanoTest tester with a nominal test force of 40 mN was used for the hardness measurement.
The ball-cratering tests [23] were carried out in a Plint TE66 micro-scale abrasion tester (Plint & Partners Ltd., Newbury, England). The micro-abrasion tests were performed using a 0.35 g∙cm−3 concentrated slurry of SiC powders with angular morphology and a particle size between 4.5 and 6.5 µm. To passivate the specimens’ surface, NaNO2 was added to the slurry at a concentration of 10 g∙L−1. For each test, the slurry was delivered to the specimen through a peristaltic pump, at a constant rate of 3.5 mL∙min−1. Constant stirring was performed to ensure uniform dispersion of the SiC particles. A steel bearing ball with a diameter of 25 mm and 60 HRC was used, etched with 2% Nital to increase the roughness of the surface. The rotation speed was fixed at 80 rpm with a constant load of 0.25 N. Furthermore, the specimens with a thickness of 5 mm were subject to micro-abrasion with sliding distances of 15.7, 23.6, 31.4, and 39.3 m, corresponding to 200, 300, 400, and 500 revolutions of the steel bearing ball.
The worn surfaces were analyzed using SEM and the mean diameter of the resulting wear craters was measured by OM and the image processing software (ImageJ). Next, the volume of the worn material (V, in mm3) was calculated using Equation (1) [23,24].
V = π × b 4 64 × R
in which b is the crater mean diameter (mm) and R is the steel ball radius (mm). The abrasive wear rate (K, in mm3∙N−1∙mm−1) was calculated using the Archard wear equation (see Equation (2)).
K = π × b 4 64 × R × 1 S × N
where S is the sliding distance (mm) and N is the applied load (N).

3. Results and Discussion

3.1. Microstructural Characterization

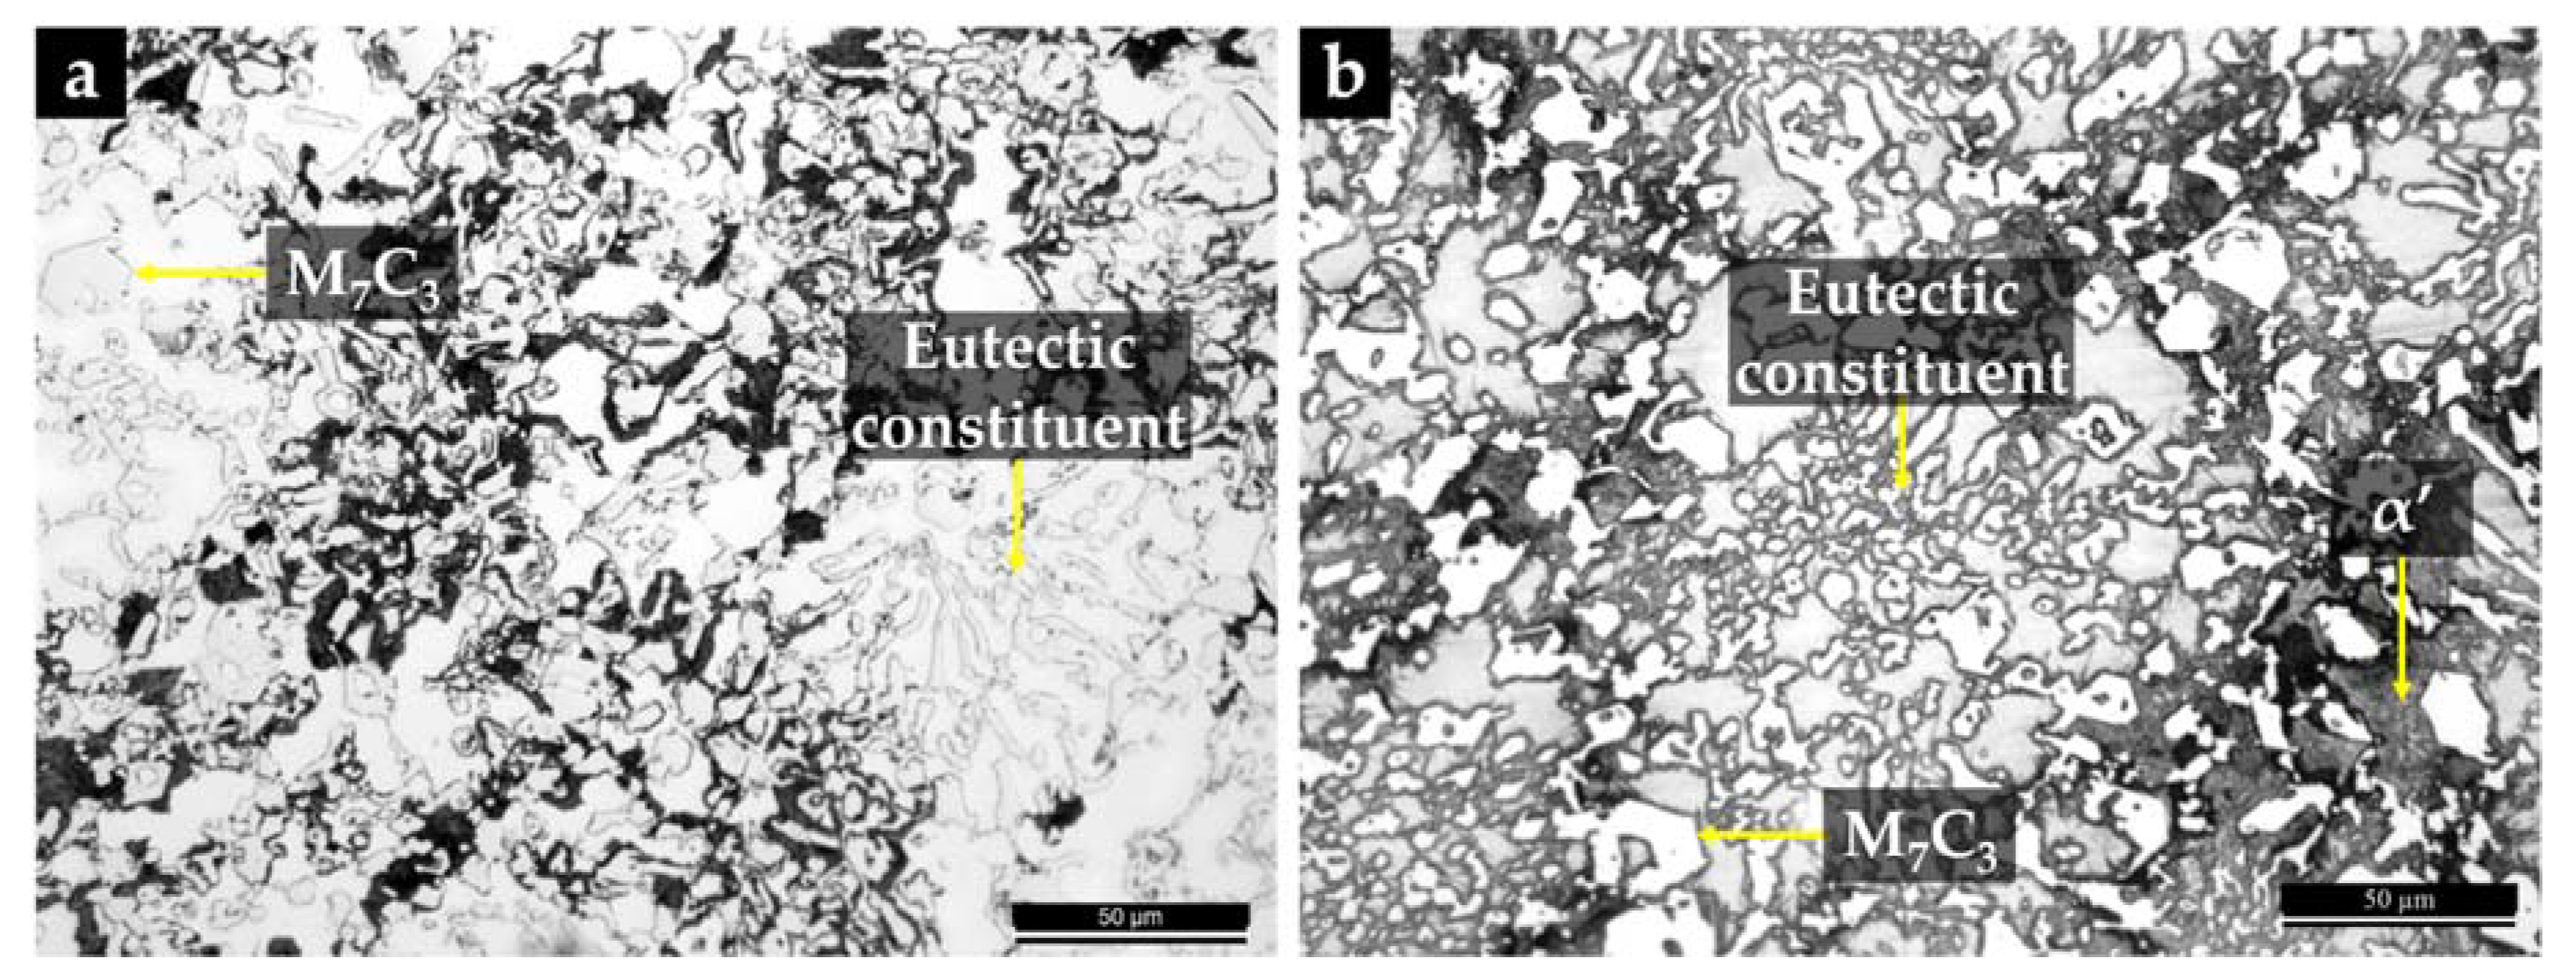
3.1.1. Optical Microscopy and EDS Analysis of the Base Metal

The OM image of the base metal after etching with 2% Nital (Figure 2a) showed large (Fe,Cr)7C3 carbides with rod-like morphology, and the eutectic constituent formed by fine (Fe,Cr)7C3 carbides and austenite (γ). These constituents were characterized in our previous studies using SEM/EDS, XRD, TEM, and EBSD techniques [5,15]. Acicular martensite (α’), which resulted from the austenite transformation during cooling, was revealed by the Beraha-Martensite reagent, as shown in Figure 2b. The SEM image and EDS/EDX map (presented in Figure 3) showed Cr-rich zones corresponding to the (Fe,Cr)7C3 carbides. The volume percent of these carbides was calculated by image segmentation and was found to be approximately 32%.

3.1.2. SEM Observations of the High-Cr WCI Matrix Composites

The microstructure of the iron-based composite reinforced with TiC particles (TiC-WCI) is shown in Figure 4. As demonstrated in our previous research [15], large (Fe,Cr)7C3 carbides were present along with networks of fine and nearly spherical TiC particles, and a eutectic constituent composed of austenite and (Fe,Cr)7C3 carbides (see Figure 4c). The volume percentages of the TiC particles network and eutectic constituent were 24% and 25%, respectively.
The SEM images showed a good infiltration of the base metal in the green compact without voids and porosities. They also revealed a non-homogeneous distribution of the TiC particles (Figure 4c), which could affect the wear resistance of the material. The fine particles of the TiC clusters showed a size of 0.30 to 2.90 µm, with an average of 1.44 µm. Several Al oxide particles, which may form from the reaction of Al powders with atmospheric air during casting, were observed in the composite and interface zones (see Figure 4b,d). These particles have been described and characterized in our previous study [15].
The microstructure of the reinforcement produced with the WC + Fe powders (WC-WCI) could be analyzed from the SEM–BSE images in Figure 5. A sound interface between the base metal and the composite zone was obtained, as shown in Figure 5a,b. Additionally, in this composite, the absence of voids and porosities suggests a good infiltration of the base metal into the green compact. Furthermore, Figure 5c shows a homogeneous dispersion of the WC particles (typically between 50 and 200 µm in size) and a considerable number of Na2SiO3 particles in the composite, in accordance with our previous results [5]. The eutectic matrix is composed of martensite and retained austenite with (Fe,Cr)7C3 carbides and M6C carbides (from this point on referenced as (Fe,W,Cr)6C carbides) (see Figure 5d), which have been extensively characterized in [5]. The amount of eutectic carbides was about 30% of the composite area, while the WC and (Fe,W,Cr)6C phases corresponded to 29%.
Table 1 summarizes the quantification of carbides present in each reinforced specimen. The reinforcement with WC particles showed the highest percentage of carbides (59%), consisting of the (Fe,Cr)7C3, WC, and (Fe,W,Cr)6C types.

3.2. Mechanical Characterization

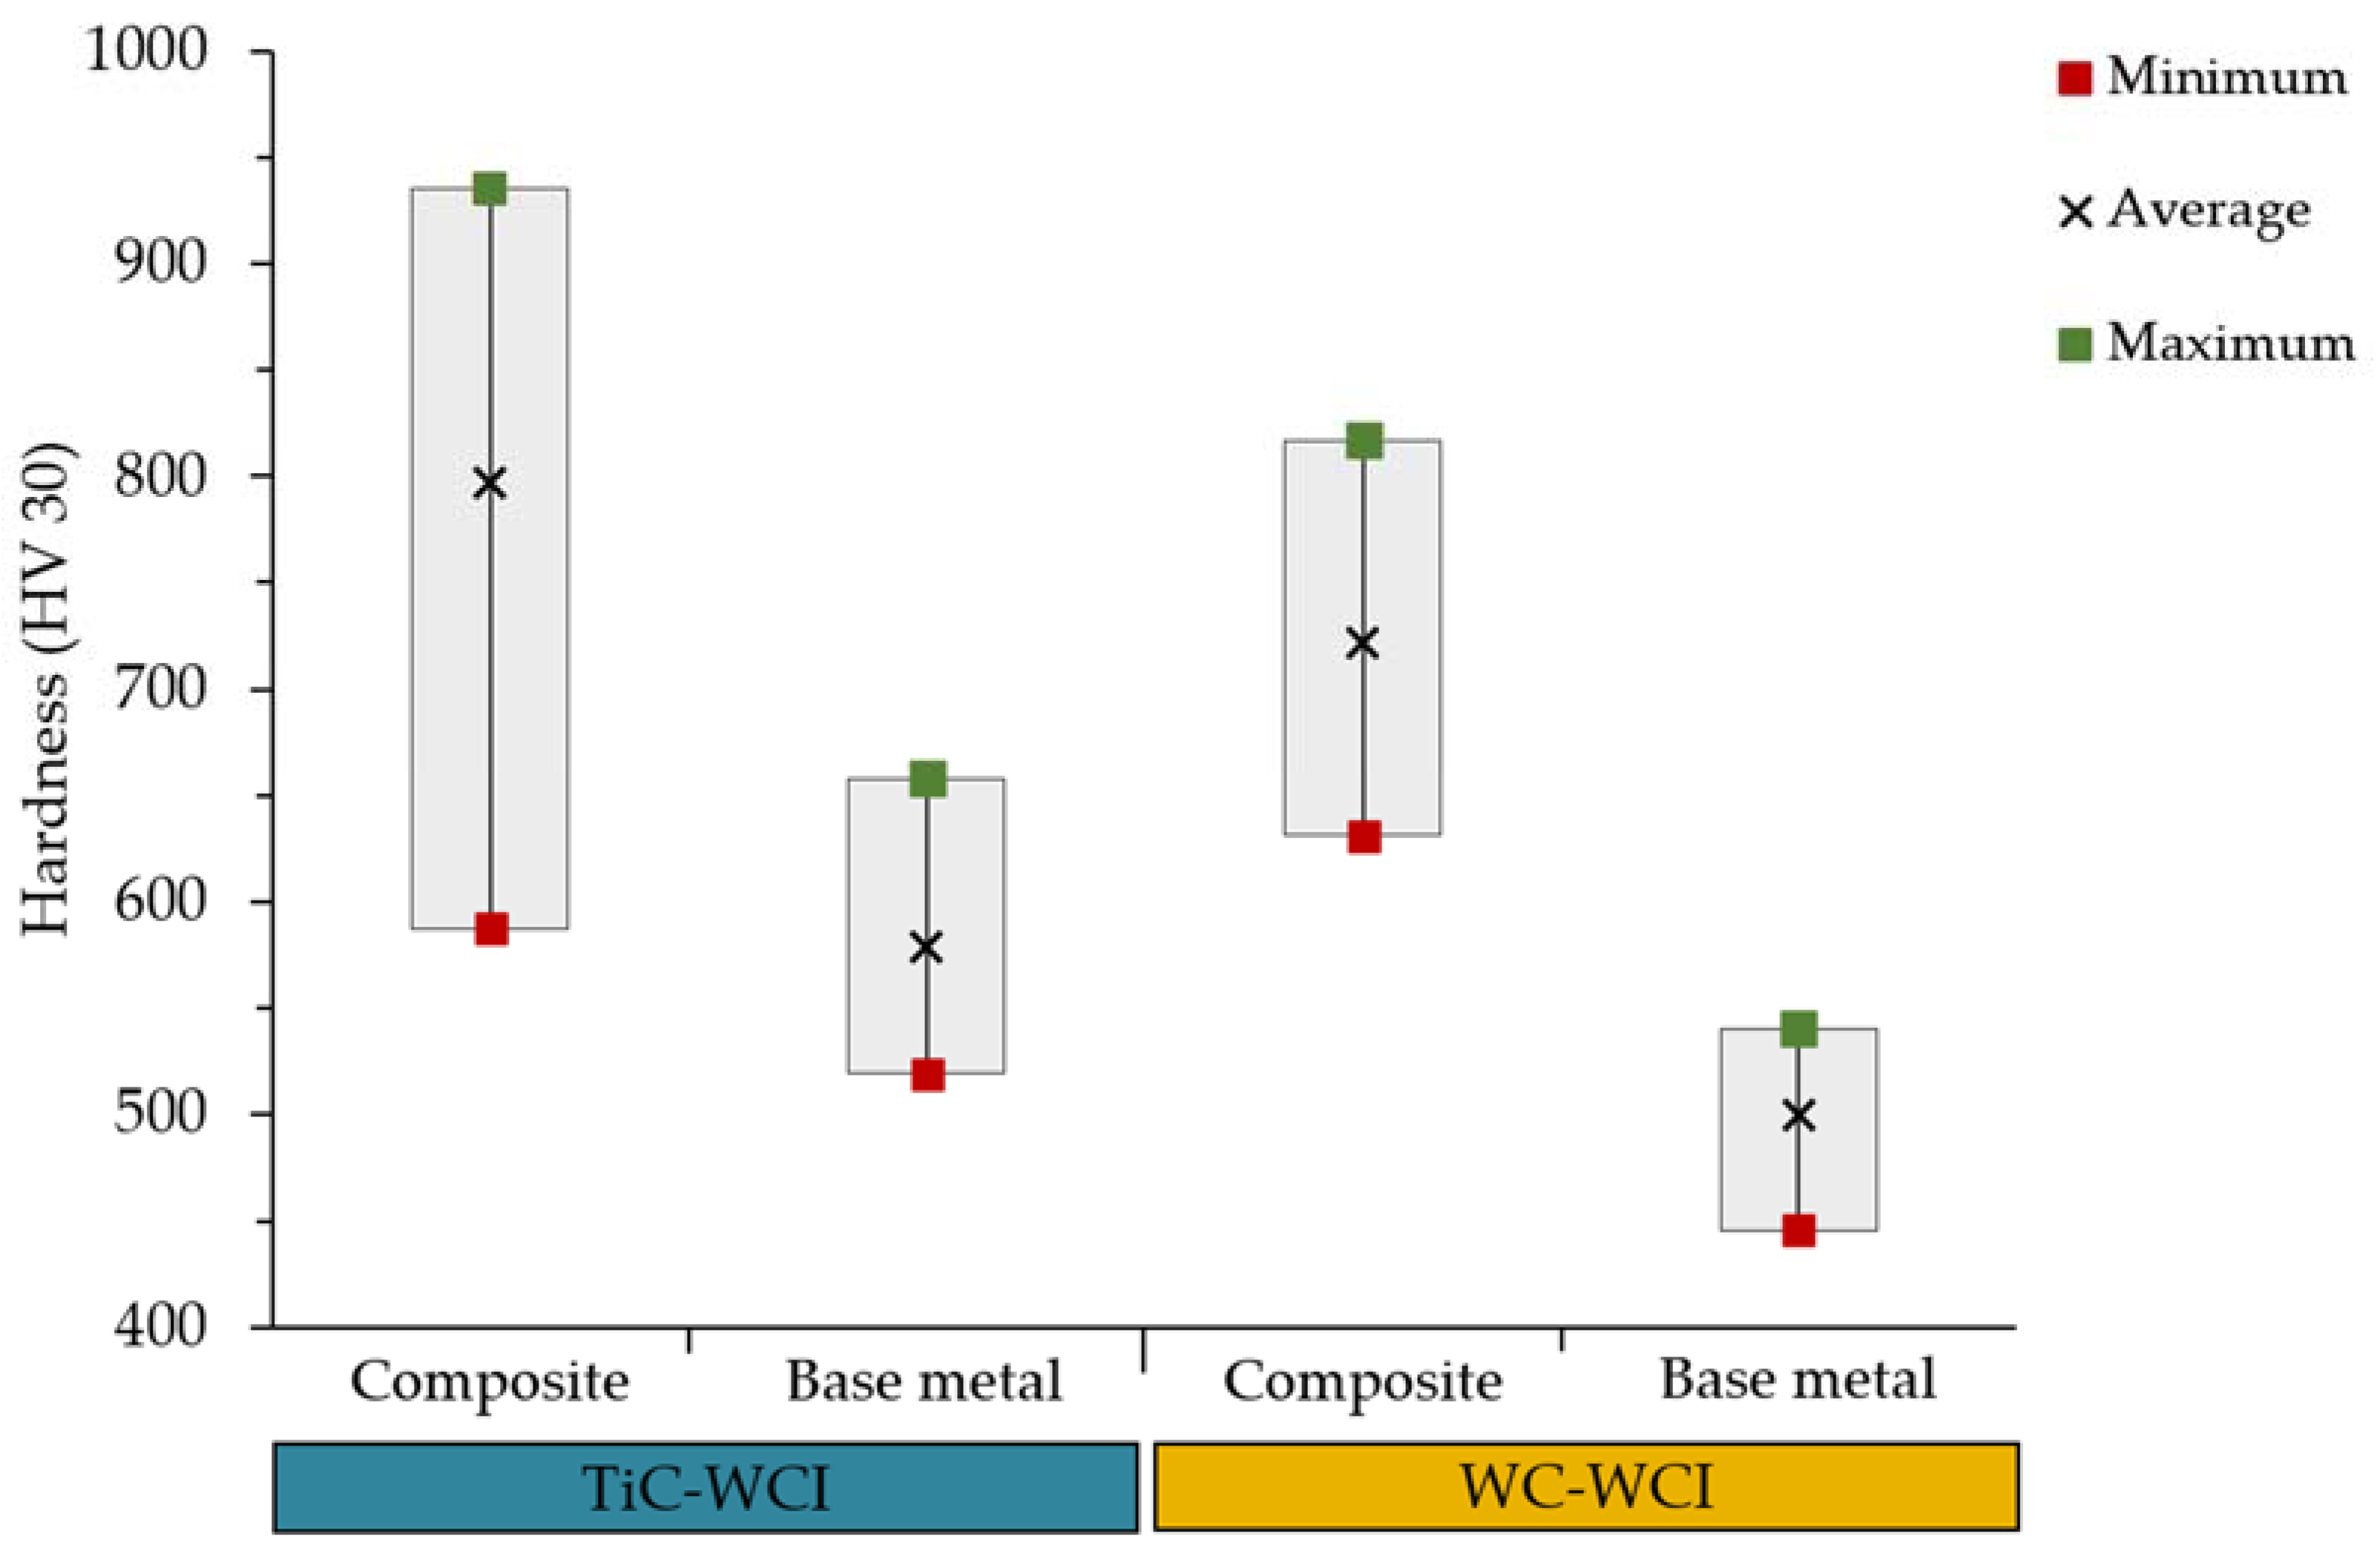
3.2.1. Hardness Results

Figure 6 shows the hardness results. The hardness variation of the base metal could be explained by microstructural heterogeneity (differences in the content of carbides, austenite, and martensite), which is a characteristic of the solidification condition. The TiC-WCI reinforcement showed the highest average hardness (797 ± 112 HV 30), which was 38% higher than the base metal hardness (579 ± 47 HV 30). Additionally, the average hardness of the WC-WCI reinforcement was 721 ± 68 HV 30, corresponding to an increase of 44% as compared to the base metal (500 ± 31 HV 30). The quantitative analysis of the microstructure shown in Table 1 indicates a higher content of carbides in the reinforcement zones, resulting in a clear improvement in hardness as compared to the base metal.
The effect of each type of carbide on the hardening of the specimens was another issue addressed. The carbides were characterized by microhardness tests and nanoindentation in the case of TiC, due to the smaller dimension of these carbides. Table 2 shows that (Fe,Cr)7C3 and TiC were the hardest carbides with similar hardness values (~15.80 GPa). These values were slightly higher than the hardness of WC and significantly higher than the hardness of (Fe,W,Cr)6C.

3.2.2. Abrasion Wear Behavior

The abrasive wear results are shown in Figure 7, in which the volume of the worn material is depicted as a function of the sliding distance for the two reinforcements and base metal. The linearity of wear versus sliding distance was observable for the three materials, meaning that the wear rate remained almost constant under the 0.25 N load. The slope of the best-fit line to the experimental points corresponds to the wear rate K according to the Archard equation [25]. Moreover, the results showed that the reinforcements had a wear rate significantly lower than the base metal, with WC-WCI being the most wear-resistant. The wear rates of TiC-WCI and WC-WCI were 70% and 40% of that of the base metal, respectively. This result was in agreement with the conclusions reached by Zhou et al. [26], which highlighted a reduction of 35% on the wear rate of the high-Cr cast iron when reinforced with 36 vol.% of WC.
Figure 8 shows that the wear rate decreased continuously with the increase of the carbide content in the microstructure. The increase of the hardness of the composite also seemed to reduce the wear rate. Nevertheless, there was no direct relationship between these two properties (the harder composite did not have the lowest wear rate).

3.2.3. Worn Surfaces Analysis

Figure 9 shows the low magnification images of the worn craters resulting from a sliding distance of 31.4 m. Figure 9b suggests that the large WC particles effectively resisted the micro-cutting action of the SiC abrasive and, as a result, the worn crater was the smallest.
SEM analysis of the worn craters was performed to analyze the wear mechanisms presented, in more detail (see Figure 10). For the base metal, it could be seen that the metallic matrix was preferentially worn, whereas the (Fe,Cr)7C3 particles were protruding, as shown in Figure 10a. The abrasion grooves observed in Figure 10b indicate a highly deformed surface, suggesting that plastic deformation was the predominant wear mechanism.
The worn surface of the TiC-WCI reinforcement (see Figure 10c,d) showed that the metallic matrix was the most worn zone. Compared to the unreinforced high-Cr WCI, shallower wear grooves along the wear direction and less plastic deformation were observed (Figure 10d). Additionally, the TiC particles were less worn and did not exhibit fracture or pull out, thus increasing the reinforcement wear performance.
Concerning the worn surface of the WC-WCI reinforcement, it is clear that the matrix was more worn than the carbide phases, as shown in Figure 10e,f. Little abrasion occurred on the large WC particles that seemed to have a protective effect on the matrix, resulting in fewer wear grooves. The protrusion height of the WC particles was high, as shown in Figure 10f, and no fracture or pull-out of the particles was observed, suggesting good adhesion to the matrix. Previous studies also showed this protective effect of the WC particles [2,3,4,21,26], which could explain the significant improvement in the wear resistance found with this type of reinforcement. On the other hand, the Na2SiO3 globules were more worn than the matrix and, therefore, did not enhance the wear performance of the material (see Figure 10f).

4. Conclusions

The microstructural analysis of high-chromium, white cast, iron-matrix composites reinforced by in situ TiC and ex situ WC revealed a sound bond between the reinforcement and the base metal for all specimens produced. Unlike TiC reinforcement, the WC reinforcement showed a homogeneous distribution of the carbide particles. Both approaches provided a significant increase in the wear resistance of the high-Cr WCI evaluated by ball-cratering, micro-abrasion tests. The best wear performance was achieved by WC reinforcement due to the higher content of homogenously dispersed carbides in the metallic matrix. Therefore, the approach using a compact mixture of WC and Fe powders is highly promising for industrial applications.

Author Contributions

Conceptualization, A.B.M.; Formal analysis, L.M.M.R. and M.F.V.; Funding acquisition, M.F.V.; Investigation, A.B.M. and P.L.; Supervision, L.M.M.R. and M.F.V.; Validation, L.M.M.R. and M.F.V.; Writing—original draft, A.B.M.; Writing—review & editing, L.M.M.R. and M.F.V. All authors have read and agreed to the published version of the manuscript.

Funding

This work was supported by FEDER through the program P2020|COMPETE, Projetos em Copromoção (project POCI-01-0247-FEDER-033417), the program P2020|Norte2020, Programas doutorais (NORTE-08-5369-FSE-000051), and by national funds through FCT–Fundação para a Ciência e a Tecnologia, under the project UIDB/50022/2020 and UIDP/50022/2020.

Institutional Review Board Statement

Not applicable.

Informed Consent Statement

Not applicable.

Data Availability Statement

Not applicable.

Acknowledgments

The authors are grateful to CEMUP (Centro de Materiais da Universidade do Porto) for expert assistance with SEM.

Conflicts of Interest

The authors declare no conflict of interest.

References

  1. Cao, G.J.; Guo, E.J.; Feng, Y.C.; Wang, L.P. Abrasion Behavior of WC Reinforced Cast Iron Surface Composite Fabricated by Cast-Infiltration Method. Adv. Mater. Res. 2012, 476–478, 555–559. [Google Scholar] [CrossRef]
  2. Zhang, G.S.; Gao, Y.M.; Xing, J.D.; Wei, S.Z.; Zhang, X.L. Interfacial Characteristics and Wear Resistance of WCp/White-Cast-Iron Composites. Adv. Mater. Res. 2007, 26–28, 293–296. [Google Scholar] [CrossRef]
  3. Zheng, K.; Gao, Y.; Tang, S.; Li, Y.; Ma, S.; Yi, D.; Zhang, Z. Interface Structure and Wear Behavior of Cr26 Ferrous Matrix Surface Composites Reinforced with CTCp. Tribol. Lett. 2014, 54, 15–23. [Google Scholar] [CrossRef]
  4. Li, Y.; Gao, Y. Three-body abrasive wear behavior of CC/high-Cr WCI composite and its interfacial characteristics. Wear 2010, 268, 511–518. [Google Scholar] [CrossRef]
  5. Moreira, A.B.; Ribeiro, L.M.M.; Lacerda, P.; Sousa, R.O.; Pinto, A.M.P.; Vieira, M.F. Preparation and Microstructural Characterization of a High-Cr White Cast Iron Reinforced with WC Particles. Materials 2020, 13, 2596. [Google Scholar] [CrossRef]
  6. Zou, B.; Shen, P.; Cao, X.; Jiang, Q. The mechanism of thermal explosion (TE) synthesis of TiC–TiB2 particulate locally reinforced steel matrix composites from an Al–Ti–B4C system via a TE-casting route. Mater. Chem. Phys. 2012, 132, 51–62. [Google Scholar] [CrossRef]
  7. Olejnik, E.; Tokarski, T.; Sikora, G.; Sobula, S.; Maziarz, W.; Szymański, Ł.; Grabowska, B. The Effect of Fe Addition on Fragmentation Phenomena, Macrostructure, Microstructure, and Hardness of TiC-Fe Local Reinforcements Fabricated In Situ in Steel Casting. Metall. Mater. Trans. A 2019, 50, 975–986. [Google Scholar] [CrossRef] [Green Version]
  8. Bai, J.; Lin, T.; Wang, Z. Research on the TiC Reinforced Steel Matrix Surface Composites Prepared by SHS Casting. Appl. Mech. Mater. 2014, 713–715, 2848–2851. [Google Scholar] [CrossRef]
  9. Yang, Y.-F.; Wang, H.-Y.; Liang, Y.-H.; Zhao, R.-Y.; Jiang, Q.-C. Effect of C particle size on the porous formation of TiC particulate locally reinforced steel matrix composites via the SHS reaction of Ni–Ti–C system during casting. Mater. Sci. Eng. A 2008, 474, 355–362. [Google Scholar] [CrossRef]
  10. Bai, J.L.; Lin, T.; Wang, Z. Effect of Different Binder on the TiC Reinforced Steel Matrix Surface Composites. Adv. Mater. Res. 2015, 1089, 11–14. [Google Scholar] [CrossRef]
  11. Liang, Y.; Zhao, Q.; Han, Z.; Zhang, Z.; Li, X.; Ren, L. Dry Sliding Friction and Wear Mechanism of TiC-TiB2 Particulate Locally Reinforced Mn-Steel Matrix Composite from a Cu-Ti-B4C System via a Self-Propagating High-Temperature Synthesis (SHS) Casting Route. Tribol. Trans. 2015, 58, 567–575. [Google Scholar] [CrossRef]
  12. He, S.; Fan, X.a.; Chang, Q.; Xiao, L. TiC-Fe-Based Composite Coating Prepared by Self-Propagating High-Temperature Synthesis. Metall. Mater. Trans. B 2017, 48, 1748–1753. [Google Scholar] [CrossRef]
  13. Olejnik, E.; Janas, A.; Kolbus, A.; Grabowska, B. Composite layers fabricated by in situ technique in Iron castings. Compos. Theory Pract. 2011, 2, 120–124. [Google Scholar]
  14. Olejnik, E.; Górny, M.; Tokarski, T.; Grabowska, B.; Kmita, A.; Sikora, G. Composite zones produced in iron castings by in-situ synthesis of TiC carbides. Arch. Metall. Mater. 2013, 58, 465–471. [Google Scholar] [CrossRef] [Green Version]
  15. Moreira, A.B.; Sousa, R.O.; Lacerda, P.; Ribeiro, L.M.M.; Pinto, A.M.P.; Vieira, M.F. Microstructural Characterization of TiC–White Cast-Iron Composites Fabricated by In Situ Technique. Materials 2020, 13, 209. [Google Scholar] [CrossRef] [Green Version]
  16. Hu, S.; Zhao, Y.; Wang, Z.; Li, Y.; Jiang, Q. Fabrication of in situ TiC locally reinforced manganese steel matrix composite via combustion synthesis during casting. Mater. Des. 2013, 44, 340–345. [Google Scholar] [CrossRef]
  17. Zou, B.; Shen, P.; Jiang, Q. Reaction synthesis of TiC–TiB2/Al composites from an Al–Ti–B4C system. J. Mater. Sci. 2007, 42, 9927–9933. [Google Scholar] [CrossRef]
  18. Choi, Y.; Rhee, S.-W. Effect of aluminium addition on the combustion reaction of titanium and carbon to form TiC. J. Mater. Sci. 1993, 28, 6669–6675. [Google Scholar] [CrossRef]
  19. Tang, S.; Gao, Y.; Li, Y. Recent developments in fabrication of ceramic particle reinforced iron matrix wear resistant surface composite using infiltration casting technology. Ironmak. Steelmak. 2014, 41, 633–640. [Google Scholar] [CrossRef]
  20. Olejnik, E.; Jesiolowska, A. Powder Composition for the Manufacture of Casting Inserts, Casting Insert and Method of Obtaining Local Composite Zones in Castings. U.S. Patent WO/2017/081665, 18 5 2018. [Google Scholar]
  21. Li, Z.; Jiang, Y.; Zhou, R.; Lu, D.; Zhou, R. Dry three-body abrasive wear behavior of WC reinforced iron matrix surface composites produced by V-EPC infiltration casting process. Wear 2007, 262, 649–654. [Google Scholar] [CrossRef]
  22. Standard Specification for Abrasion-Resistant Cast Irons. In A532/A532M–10; ASTM International: West Conshohocken, PA, USA, 2010. [CrossRef]
  23. Fine ceramics (advanced ceramics, advanced technical ceramics)—Determination of the abrasion resistance of coatings by a micro-scale abrasion test. In ISO 26424:2008; International Organization for Standardization: Geneva, Switzerland, 2008.
  24. Rutherford, K.; Hutchings, I. A micro-abrasive wear test, with particular application to coated systems. Surf. Coat. Technol. 1996, 79, 231–239. [Google Scholar] [CrossRef]
  25. Archard, J.F. Contact and Rubbing of Flat Surfaces. J. Appl. Phys. 1953, 24, 981–988. [Google Scholar] [CrossRef]
  26. Zhou, R.; Jiang, Y.; Lu, D. The effect of volume fraction of WC particles on erosion resistance of WC reinforced iron matrix surface composites. Wear 2003, 255, 134–138. [Google Scholar] [CrossRef]
Figure 1. Schematic view of the fabrication steps for the production of reinforced samples (adapted from [15]).
Metals 11 00862 g001
Figure 2. OM images of the high-Cr WCI in the as-cast condition after chemical etching with 2% Nital (a) and Beraha-Martensite (b).
Metals 11 00862 g002
Figure 3. SEM–BSE image of the microstructure of the high-Cr WCI (a) and energy-dispersive spectroscopy (EDS) elemental mapping (b) with a superposition of Cr (pink) and Fe (blue).
Metals 11 00862 g003
Figure 4. SEM-BSE images of the TiC-WCI reinforcement: (a) base metal and composite zone, (b) interface at higher magnification, (c) composite zone at higher magnification, and (d) TiC particles, showing a round morphology.
Metals 11 00862 g004
Figure 5. SEM–BSE images of the microstructure of the WC-WCI reinforced specimen. (a) Base metal and composite zone, (b) interface zone at higher magnification, (c) composite zone at higher magnification, and (d) WC particles, (Fe,W,Cr)6C and (Fe,Cr)7C3 precipitates.
Metals 11 00862 g005
Figure 6. Comparison of the hardness between the base metal and the reinforcements produced.
Metals 11 00862 g006
Figure 7. Volume of worn material as a function of the sliding distance under a constant load of 0.25 N for the reinforcements and the base metal.
Metals 11 00862 g007
Figure 8. Wear rate results as a function of (a) bulk hardness and (b) percentage of carbides.
Metals 11 00862 g008
Figure 9. OM images of the worn craters corresponding to a sliding distance of 31.4 m. (a) TiC-WCI reinforcement, (b) WC-WCI reinforcement, and (c) base metal.
Metals 11 00862 g009
Figure 10. SEM images of the wear craters after a sliding distance of 39.3 m. (a,b) Base metal, (c,d) the TiC-WCI reinforcement, and (e,f) WC-WCI reinforcement; (a,c,e) show the regions close to the edge of the crater, and (b,d,f) show the regions on the surface of the crater.
Metals 11 00862 g010
Table 1. Quantification of carbides in the microstructure of the reinforced specimens.
Average Content of Carbides
(Fe,Cr)7C3TiCWC + (Fe,W,Cr)6CTotal
TiC-WCI25%24%-49%
WC-WCI30%-29%59%
Base metal32%--32%
MorphologyRod and blade-likeRound and polygonalPolygonal-
Table 2. Hardness of the carbides detected in the microstructure of the reinforced specimens.
(Fe,Cr)7C3TiCWC(Fe,W,Cr)6C
HV 0.11633 ± 183 (15.80 ± 1.79 GPa)-1558 ± 166 (15.28 ± 1.63 GPa)1118 ± 262 (10.85 ± 257 GPa)
Nanohardness-15.80 ± 4.86 GPa--
Publisher’s Note: MDPI stays neutral with regard to jurisdictional claims in published maps and institutional affiliations.

