Abstract
With the improvement in technology, additive manufacturing using metal powder has been a go-to method to produce complex-shaped components. With complex shapes being printed, the residual stresses (RS) developed during the printing process are much more difficult to control and manage, which is one of the issues seen in the field of AM. A simplified finite element-based, layer-by-layer activation approach for the prediction of residual stress is presented and applied to L-shaped samples built in two different orientations. The model was validated with residual stress distributions measured using neutron diffraction. It has been demonstrated that this simplified model can predict the trend of the residual stress distribution well inside the parts and give insight into residual stress evolution during printing with time for any area of interest. Although the stress levels predicted are higher than the measured ones, the impact of build direction on the development of RS during the building process and the final RS distributions after removing the base plate could be exploited using the model. This is important for finalizing the print orientation for a complex geometry, as the stress distribution will be different for different print orientations. This simplified tool which does not need high computational power and time can also be useful in component design to reduce the residual stresses.
1. Introduction
Additive manufacturing (AM) can be described as a method of manufacturing a component with a layer-by-layer approach, which means the component is built with the addition of the new material in layers. For AM, various kinds of processes and materials have been developed [1]. Among them, the laser-based powder fusion (LBPF) method is one of the key methods for manufacturing metal components. For manufacturing parts which are complex in nature where various parts are combined in one single component rather than having different components assembled together, this AM technique is the most suitable one. With various features combined, this AM technique is the most suitable one.
In LBPF, for each geometry and new material, different process parameters must be fine-tuned to obtain the best out of it, and these are intertwined, causing a significant effect on the outcome of the product. Localized heating due to laser irradiation and subsequent cooling causes a significant thermal gradient between the layers being printed. This, in turn, causes expansion and contraction of the layers in a periodical manner. The periodical cycle of heating and cooling leads to incompatibility between the successive layers, which causes the residual stresses (RS) to develop [2]. These RS are in self-equilibrium when no external loads are being applied and they can lead to crack formation, geometrical distortion of the part during printing, and failure of the build, or the re-coater system as well [3]. Furthermore, they are known to affect the fatigue properties of the component in both a positive and negative manner. Tensile RS at the surface will promote crack initiation and assist in crack opening and growth, while compressive RS will hinder the crack growth under fatigue loading.
While the processing parameters are of most importance in AM, finalizing a definite window of processing for a particular kind of material and geometry has been performed mostly based on trial-and-error methods, which can be both time-consuming and economically not viable. To overcome this, various types of simulation strategies have been developed to simulate the process of manufacturing. A common aim of the simulations has been to predict the best parameters for particular metal systems and geometries. A considerable number of AM process parameters can be altered to obtain the desired part properties, and simulation tools are becoming more and more popular to obtain a part from design to production in a short time.
Two different approaches on the simulation front can be identified, namely micro-level- and macro-level-based simulation, respectively [4]. Most of the micro-level simulations are focused on understanding the laser’s interaction with the powder and are used to obtain a better picture of the melt pool dynamics, formation of sputter and keyholes, and phase changes in the material, etc. [5,6,7,8]. These kinds of simulations can provide quite accurate results but are limited to small scales only and are not feasible for simulating the build-up process for an entire part due to the excessive computational power required. The macro-level simulations are frequently based on finite element models for the prediction of distortion and residual stresses in AM parts without considering the micro-level interaction of the laser [9,10,11,12]. Within the macro model approach, some researchers have used 2D models with detailed laser movement but without considering the complex phenomenon of the melt pool consolidation dynamics. Heat flux is used as the load to reduce the computation time; however, these approaches are more applicable to single-layer simulations [13,14,15]. Such simulations with exact laser movements and element-wise reactivation can predict the stresses and deformations in the range of 30% in comparison to the experimentally evaluated results [16], but require very fine mesh and small increments. Making the exact simulation of laser interaction to its true size will lead to large computation time. Thus, these kinds of models are restricted to a single layer simulation or even to single track simulations [17,18]. Multi-track simulations have also been introduced but they are also limited to one or a few layers [8,19,20,21] because of the aforementioned reasons.
In order to reduce the time of computation for the 3D models but retain reasonable accuracy, researchers in previous studies have tried to simulate printing of multiple layers at once and apply aggregated heat flux derived from the laser movement on top of the combined layers instead of the laser movement as the heat input [22,23,24]. Denlinger et al. [25] have used a dynamic mesh coarsening algorithm combined with aggregated heat flux where the coarser mesh is used for the layers which are already printed, while a finer mesh is used for the new layer being activated. Further, An et al. [26] have used aggerated heat flux as input without considering the laser scan strategies, and big combined layers were used (0.6mm each layer). Validation was made by neutron diffraction RS measurements on a couple of lines along the height of the as-built parts with the base plate intact. Similarly, Williams et al. [27] have used a temperature close to the melting temperature of the material as heat input instead of heat flux and neglected the interaction with the base plate. The heat dissipation through the base plate has been modeled by giving very high convection boundary conditions to the surfaces to the parts attached to the base plate without using the base plate; the mechanical boundary conditions were applied such that the component was fixed. With this approach, they have shown that using a sequentially coupled thermomechanical model and activating the combined layer, comprising up to 16 real layers at once, can predict decent accuracy in results when compared to the more detailed work presented by Denlinger et al. [25]. A few of the previous studies in the AM field have used the inherent strain or eigenstrain method to predict the residual stresses [28]. This method of application, however, requires a very good prediction of the initial strain field and requires calibration for each material system and each set of parameters used.
The present work describes a macro-scale, fully coupled thermomechanical approach for RS prediction, utilizing a combined layer reactivation technique as mentioned earlier, where multiple real layers are combined into one layer and the temperature field is used as heat input. The approach is similar to Williams et al. [27]; however, the interaction with the base plate and modeling of heat dissipation to the powder bed is considered, which makes the model close to reality. Here, the heat dissipation to the powder bed is also modeled with radiation and convection. Further, the model is verified by a more extensive experimental analysis of several cross-sections. For the implementation of the model, the commercial software ABAQUS (V6.12, Dassault Systèmes, Johnston, RI, USA) [29] has been used. Further, the model has been applied to study variation in RS magnitude and distribution with regard to the build orientation for L-shaped samples made of Inconel718 (In718) and validated experimentally using neutron diffraction measurements from our previous study [30], where detailed investigation on three differently built orientations with regard to RS was presented. In the following sections, first, the general outline of the model is presented and then, the application of the model for L-shaped samples made from In718 is discussed for different build orientations. Finally, the comparison between the simulated and experimentally measured values and the distribution of the stress is presented before conclusions are drawn.
2. Model Description
The model relies on the assumption that the RS starts to develop once the temperature in the heated zone drops below the melting temperature; this is generated due to the local temperature gradient between the layers, owing to the rapid cooling during manufacturing. In the real manufacturing process, the material behavior is more complex as it involves laser interaction with powder, phase transformations, melt pool formation, etc. All these aspects and material behavior are difficult to replicate in models and are computationally expensive to study. The model neglects all the complex laser interactions by using a predefined temperature, as mentioned earlier. This kind of simplification of the process makes it less time consuming for the simulation.
In order to make the simplified model close to reality, the cooling process while printing and while the part is inside the powder bed is modeled using conduction radiation and convection. All these phenomena are time-dependent, so transient equations for both thermal and mechanical analysis are used. Here, the mechanical analysis is performed in sync with the thermal analysis step.
The governing equations for transient heat conduction can be written as:
where ρ is the material density, Cp is the specific heat capacity, T is the temperature, t is time, Q is the rate of internal heat generation, and q is the heat flux. We also assume that the studied material is isotropic in nature.
The heat flux q is given by Fourier’s law as
where k is the temperature-dependent thermal conductivity and is the local temperature gradient.
For radiation, the Stefan–Boltzmann law is used:
where ε is the surface emissivity, σ is the Stefan–Boltzmann constant, Ts is the surface temperature and is the ambient temperature.
Convection heat transfer is given as
where h is the heat transfer coefficient.
The non-linear mechanical analysis is simplified to quasi-static conditions [31,32,33,34] and is shown below
where σ is the second-order stress tensor. Furthermore,
where C is the fourth-order elastic stiffness tensor, while εe is the second-order elastic strain tensor. The total strain tensor ε, consisting of the elastic stain εe, the plastic strain εp, and the thermal strain εth is given by:
where a linear isotropic behavior has been assumed for the elastic and thermal parts. For the plastic part, an isotropic behavior based on von Mises equivalent stress and linear isotropic hardening has been adopted. As our aim is to establish a simplified model and due to the lack of anisotropic temperature-dependent material data, an isotropic behavior is assumed.
The application of the model to a horizontally built L-shaped sample can be seen in Figure 1. Initially, the geometry of interest including the base plate can either be imported or created in ABAQUS itself. Further, the part is created together with the base plate but sectioned into two separate entities in ABAQUS using a sectioning tool. This way of creating both part and base plate removes the need for defining the contact pair properties between the part and the base plate. Additionally, the part is sliced into multiple sections in the build directions. These sections represent the combination of multiple real layers of the printing process; the size of each combined layer can be chosen based on the process. In a real case scenario, most of the layers are typically 30 to 50 microns thick. For the current study, 10 real layers of 50 microns are combined into 1. The choice of 10 layers as the starting point was based on various literature sources [24,25,26,27] and before finalizing the combined layer size, it was tested with smaller and bigger combined layers as well. From the initial simulations, it was found that 10 real layers are a good compromise between the accuracy and time needed for simulation, as smaller layers increased the time needed for simulation and bigger layers further decreased the accuracy. Further, temperature-dependent material properties such as thermal conductivity, specific heat capacity, Young’s modulus, yield strength, the coefficient of thermal expansion, etc., need to be assigned to the part and the base plate.
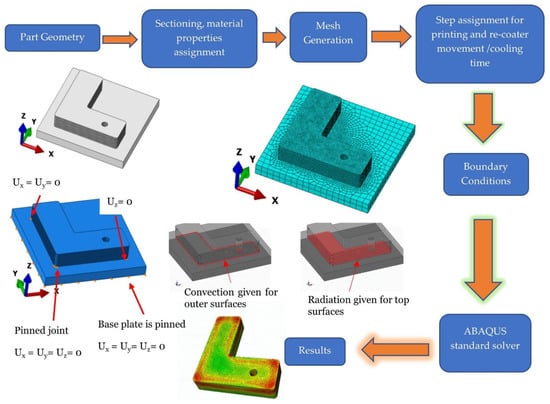
Figure 1.
Application of model in L-shaped sample.
In order to replicate the real printing process of layer addition and movement of the part into the powder bed, the Step module in ABAQUS is used to separate the process of printing and subsequent movement of the part into the powder bed. A specific time is assigned for each printing step, which, in turn, is calculated for printing the combined layer based on the laser speed and scan strategy being used in the real print process. Furthermore, each cooling step is assigned a time based on the time needed for the movement of the part into the powder bed and for the re-coater system to apply a new layer of powder.
Boundary conditions for heat transfer are in the form of radiation and convection and are given to the part using the interaction module of ABAQUS.
Radiation is prescribed on the top surface of the combined layer for the time it is being printed. For the other surfaces which are submerged in the powder bed, convection is used as a simplified mechanism for heat transfer to the powder. As for the mechanical boundary conditions, the base plate is fixed using pinned boundary conditions at all the edges, restricting the movement in all directions as shown in Figure 1 for a horizontal build sample. Similar mechanical boundary conditions were prescribed to other build orientation samples as well.
Finally, for the load, the temperature is applied in ABAQUS as a predefined field for the entire part at the beginning of the simulation. This allows the elements for each combined layer to be activated, with temperature prescribed with the help of the interaction module as mentioned before. The selection of the temperature depends upon the material being investigated as this model assumes that the RS starts to develop when the material starts to solidify. For the mesh, 8 node linear elements with reduced integration (C3D8RT) are used for more efficient computation time and they can be generated using a sweep or structured technique where it is applicable.
At the very first step, after all the boundary conditions and the loads are defined, all the combined layers present in the main part are deactivated and only the base plate is kept active using the interaction module of ABAQUS. Subsequently, each layer is activated in sequence using the stress-free element activation technique of ABAQUS, such that all the stresses in the element are zero at the instance of activation. Finally, when the entire part is activated, and it is cooled down to room temperature, the base plate is removed. For the base plate removal, elements for the entire base plate are deactivated with proper implementation of mechanical boundary conditions, such that the process of removal in real life with a wire electric discharge machine (EDM) is realized by allowing it to move in one direction (Z-direction) at one side of the part and other movements are fixed. In a real case scenario, a few additional layers are printed on top of the base plate to account for the material being removed during EDM cutting before starting to print the real part. However, this additional layer of allowance is not added in the current work as detailed EDM process simulation is out of the scope of the current work.
3. Application of the Model to L-Shaped Samples
L-shaped samples made from In718 were studied with two different build orientations, namely horizontally built (HB) and vertically built (VB). The dimension of the L-shape sample is 55 mm × 10 mm × 20 mm with a hole of 5 mm in diameter in one of the side bars. Details regarding printing parameters can be found in [30]. For each build orientation, the part geometry was first sliced into combined layers and then, each layer was assigned a printing time and cooling time. The information for the time of the printing and powder bed movement is taken from the machine itself and the time for the combined layer was calculated according to the size of the combined layer. As for the predefined temperature, 1500 K was used for all the samples, and for the base plate, a temperature of 500 K was used as it was heated to 473 K in the real case. For the base plate, Stainless Steel (SS316L) was used as material. As it has been assumed that the RS starts to develop once the part starts to solidify, the temperature of 1500 K was chosen for it which is close to the melting temperature of In718 which is in the range of 1533–1609 K [35]. As for the convection and radiation for the part, a heat transfer coefficient of 15 W/m2K and an emissivity of 0.3 was used, respectively. The physical properties for In718 used in the simulation are presented in Table 1. The temperature-dependent mechanical properties for the additively manufactured parts, in general, are difficult to find. In the current work, temperature-dependent values for the yield strength and Young’s modulus were scaled down from aged wrought In718 to match up with the data observed for as-built LPBF In718 at room temperature. In the literature, for different techniques of AM, values of mechanical properties for as-built conditions have been reported in a variety of ranges. For example, values for the Young’s modulus for the LBPF process at room temperature have been reported from as low as 114 GPa to as high as 210 GPa [36,37,38,39]. These differences in mechanical properties reported by various researchers are related to the diverse nature of the AM processes and the influence of the processing parameters used while printing. Thus, empirical values of 180 GPa for Young’s modulus and 800 MPa for the yield strength at room temperature are used based on a previously reported work [38] to scale down the values from the aged wrought In718 found in [40] to obtain the mechanical properties as close to the as-built AM In718, as illustrated in Figure 2 and Figure 3. Properties of SS316L used for the base plate are taken from [41]. Boundary conditions were applied as mentioned in the general outline of the model. For the final setup, a minimum of one element in the thickness direction (build direction) for each combined layer was finalized after a check of independence of the computed result on mesh size using various mesh sizes with multiple elements. For the HB sample, the total number of nodes was 56,204 and the wall clock time was 8579 s (~2.3 h); similarly, for the VB sample, the total number of nodes was 72,724 and the wall clock time was 116,216 s (~33 h). All the simulations were performed in a workstation equipped with an Intel® Xeon® V6 quad-core processor.

Table 1.
Properties of Inconel718, adapted with permission from ref. [25] 2021 Elsevier.
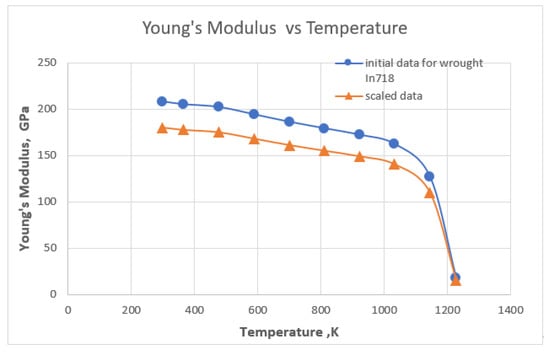
Figure 2.
Initial and scaled temperature-dependent Young Modulus.
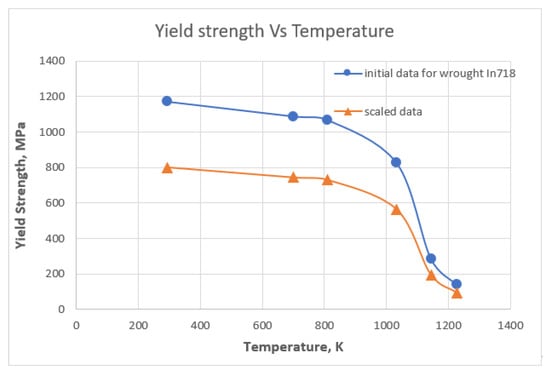
Figure 3.
Initial and scaled temperature-dependent yield strength.
4. Results
4.1. HB Sample
The change in temperature in a typical activation cycle (heating and cooling of one combined layer) is illustrated by Figure 4a,b. At the moment of activation of a new combined layer, a uniform temperature field was applied to the reactivated block of the combined layers (Figure 4a). Cooling through the different boundaries resulted in temperature redistribution. As Figure 4b shows, before activating the next layer, temperatures were changed both along the build direction and inside each build layer as well as in the base plate. The corresponding RS distributions on the outer surfaces are presented as von Mises stresses in Figure 5a,b. By definition, the surface von Mises stresses in the new combined layer was zero at the moment of activation (Section 2) but increased as the cooling proceeded. Before the next combined layer was activated, high von Mises stresses were developed in the already built layers, while low von Mises stresses were formed in the base plate. When all the layers were activated (the whole part was built) and cooled down to room temperature, high surface stresses were retained in both the part and the base plate (Figure 5c). Stress evolution with time in a specific layer is exemplified by Figure 6, which demonstrates changes in stresses parallel to the build direction (BD) in a layer 2 mm from the base plate. Tensile residual stresses are observed in a small surface region after the layer is printed and moved into the powder bed (Figure 6a). As new layers are continuously added above it, i.e., the height of the part increases successively, the width of the tensile region also increases but remains almost constant as the total printed height reaches 10 mm (Figure 6b). The stress distribution remains almost unchanged until the entire part is printed and cooled down, (Figure 6c). As soon as the base plate is removed, the change in the stress distribution is observed as seen in Figure 6d, owing to the relaxation.
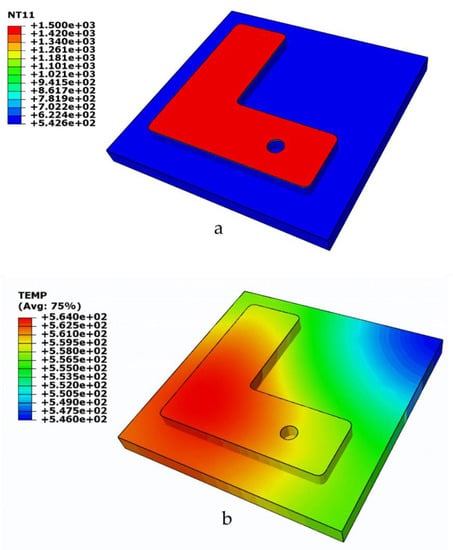
Figure 4.
Temperature distribution (K) at various stages during printing: (a) when a new layer is activated, (b) just before a new layer is added.
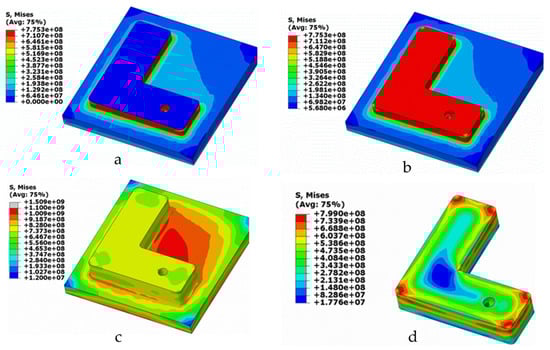
Figure 5.
von Mises stress distribution in Pa for horizontally built (HB) sample at various stages while printing (a) when a new layer is activated, (b) just before a new layer is added, (c) when the entire part is cooled down with base plate, and (d) after removal of the base plate.
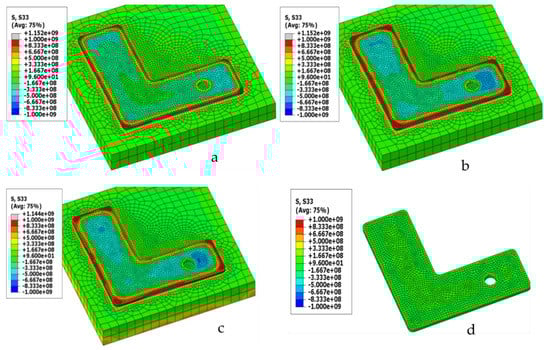
Figure 6.
Stress evolution [Pa] in building direction for a layer at 2mm away from base plate for HB sample (sections above the current layers are removed for visualization) (a) just after new layer is printed and moved into powder bed. (b) When part height reached at 10 mm. (c) All layers are printed and cooled down to room temperature. (d) After removal from base plate.
The stress maps in Figure 7 for a vertical cut through the mid-width of the side bar with the hole reveal detailed stress distributions inside the part together with the base plate. Looking at the stress distribution in the build direction S33, the base plate, in general, is in compression and the top layers of the parts are in tension. On the other hand, for the stress component which is normal to the cross-section (S22), the base plate shows tensile stresses which are balanced by the stress distribution in the part.
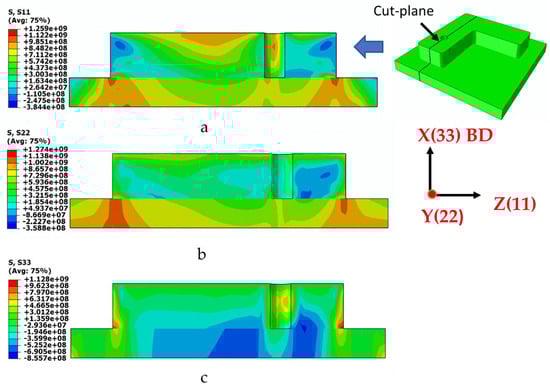
Figure 7.
Cross-section view of the stress build up after the part is cooled to room temperature: (a) stresses in Z-direction, (b) stresses in Y-direction, (c) stresses in X -direction (building direction). (Note: stresses are in [Pa].).
The subsequent removal of the base plate by deactivating the entire baseplate resulted in a significant change in stress distribution as mentioned earlier. Near the contact area with the base plate, the von Mises stresses in the range of ~700 MPa (Figure 5c) were reduced to approximately 170 MPa (Figure 5d). A closer comparison of stress distributions at selected cross-sections before and after the removal of the base plate is presented and discussed in Section 4.3.
4.2. VB Sample
Changes in the von Mises stress distributions when printing in the vertical configuration can be derived by comparing Figure 8a,b. With the increase in the part height, the difference in von Mises stress is smaller between the part and base plate, which is due to the smaller area of the part section being printed compared to the base plate. When the plate is cooled down and subsequently removed, it retains the high values of the von Mises stress compared to the horizontal build sample, with slight relaxation observed near the area connected to the base plate (Figure 8c,d). From comparing Figure 8b,c, cooling to room temperature when the whole part is built does not seem to induce a large change in the von Mises stress. RS variation in the vertical, as well as transverse directions, is obvious in both figures, which is also shown in Figure 9 for RS distribution in a vertical cross-section cutting through the hole. For the stress parallel to the build direction S11 (Figure 9a), compressive stresses were observed inside and tensile stresses in the outer surface regions. As for the stress transverse to the build directions (Figure 9b,c), the part is in low compression, while the base plate is in tension.
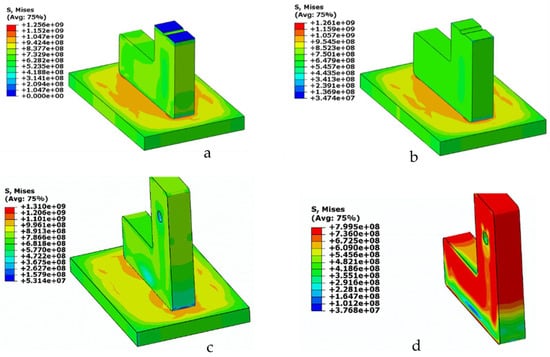
Figure 8.
von Mises stress distribution in Pa for VB at various stages while printing (a) when a new layer is activated, (b) just before a new layer is added, (c) when the entire part is cooled down with base plate, and (d) when base plate is removed. (Note: stresses are in Pa scale.)
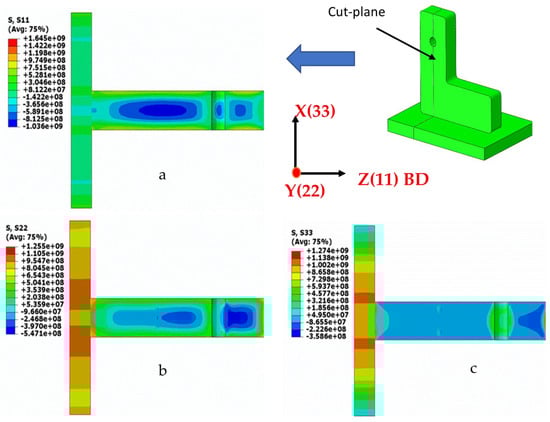
Figure 9.
Cross-section view of the stress build up after the part is cooled to room temperature (a) stresses in Z-direction (building direction), (b) stresses in Y-direction, (c) stresses in X-direction. (Note: stresses are in Pa scale.).
The removal of the base plate also caused stress relaxation, but the changes are, in general, much smaller than for the HB sample (Figure 5 and Figure 6). Significant stress relaxation is observed near the surface connected to the base plate (Figure 8c,d). However, in the rest of the sample that is further away from the base plate (5mm and above), the stress relaxation was very low and von Mises stresses in the range of ~800 MPa were retained. Due to a smaller area of contact between the sample and the base plate, the influence of the base plate removal is limited to the small volume close to it. Detailed stress distributions for selected cross-sections and the effect of cutting is discussed in Section 4.3.
Further, in the case of the VB sample, the evolution of stresses during printing can be examined in detail. For example, the effect of sample geometry on RS development is illustrated in Figure 10 where stress parallel to BD at the cross-section 4 mm away from the base plate is presented for different printing stages. When the build height reaches 20 mm, the RS field has been changed from a smaller tensile region at the surface and more distributed compressive region (Figure 10a) to a distribution with a greater tensile region near the surface and higher bulk compression (Figure 10b). As the building continues with a smaller cross-section, the compressive stress in the area below the newly built region increases (Figure 10c). However, with increasing new layers, the effect diminishes and once the entire part is printed and cooled down to room temperature, the stress distribution changes, which can be seen in Figure 10d. Finally, when the base plate is removed, the stress is relaxed as the mechanical constraints are removed (Figure 10e).
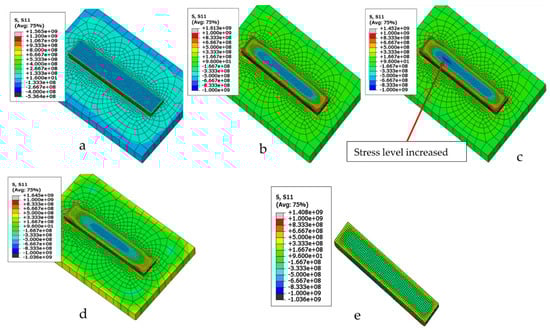
Figure 10.
Stress evolution [Pa] in building direction at a cross-section 4 mm away from base plate (sections above the current layers are removed for visualization): (a) when the new combined layer is cooled, (b) when the geometry change happens at height of 20 mm, (c) when the build height reaches 40 mm, (d) when the entire part is cooled down to room temperature, (e) when the base plate is removed.
Further analysis at the distance of 4 mm from the base plate of the VB sample is focused on the stress development in the building direction for elements at the mid thickness (X = 0, Y = 5, Z = 4)) and on the surface of the part (X = 0, Y = 0, Z = 4)). As revealed by Figure 11, as soon as the layer is activated and the temperature gradient starts to form between the newly printed layer and the layer below, stresses of compressive and tensile nature in the building direction developed for the central and outer element, respectively. The stresses continue to increase but with a reducing rate as new layers are being added. Eventually, the stresses reach a more or less saturation state when the newly printed layers are sufficiently far away (approximately after 30 layers for the central element and 12 layers for the surface elements) and possess little influence. Once the entire part is printed and starts to cool down to room temperature, the developed stresses slowly relax, and they attain the plateau when the part reaches the base plate temperature. Finally, when the part is removed from the base plate, relaxation is observed for both elements.
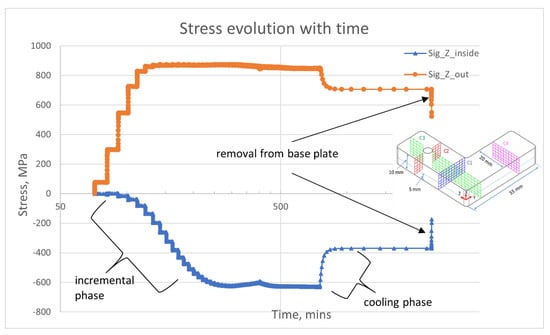
Figure 11.
Stress evolution of elements in building direction for VB sample.
4.3. Comparison of Predicted RS with Experimental Analysis
For validation of the model, the results from simulations are compared in Figure 12 and Figure 13 with residual stress distributions obtained by neutron diffraction measurements for selected cross-sections. The RS measurements were performed at the KOWARI beamline at ANSTO [42]. The measurements were made on samples removed from the base plate. Details of the neutron diffraction experiments can be found in [30], in which a comprehensive study of residual stresses in L-shaped In718 by neutron diffraction measurement was presented.
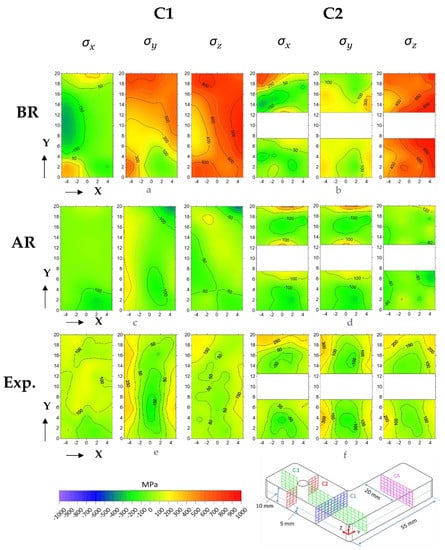
Figure 12.
Stress distribution for HB sample at cross-section C1 and C2. (a,b)-Results from simulation before base plate removal, (c,d)-Results from simulation after removal of the base plate, (e,f)-Experimental results reprinted from ref. [30].
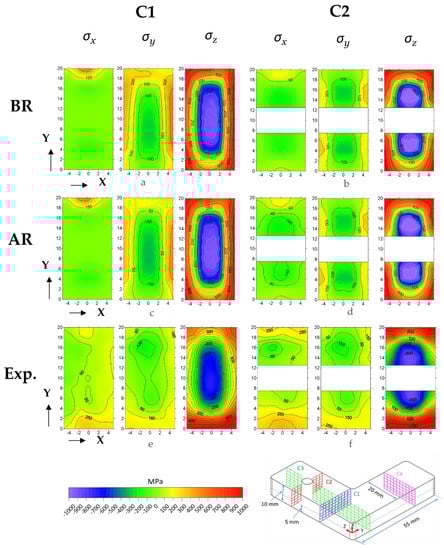
Figure 13.
Stress distribution for VB at cross-section C1 and C2: (a,b)-Results from simulation before base plate removal, (c,d)-Results from simulation after removal of the base plate, (e,f)-Experimental results reprinted from ref. [30].
In order to have a more representative comparison of the simulation-based results with the experimental data, simulated stresses were extracted at element integration points corresponding to the points measured in the experiment. Figure 12a–d and Figure 13a–d show the stress distribution on the selected cross-sections C1 and C2 extracted from the simulation both before and after the removal of the base plate.
As Figure 12c–f and Figure 13c–f show, the simulation and the experiment reveal similar residual stress distributions when the parts are removed from the base plate. In general, tensile residual stresses are dominant in the outer surface region and compressive residual stresses at the bulk for both samples. When comparing the predicted stress distributions to the measured ones, the simplified model can generate similar stress distribution. The model is also able to predict the influence of the change in the geometry and the influence of the build orientation as well.
In the case of the HB sample before the base plate removal (BR), the stress normal to the cross-section (σz) (Figure 12a,b) is primarily in tension, which is balanced by the compressive stress in the base plate. The level of the maximum residual stresses for the as-built part is high, at the level of 900 MPa. Such high levels of residual stresses might cause ripping of the part from the base plate, which is the most common effect of high RS in the AM process. They can also lead to significant flex in the part if the part is not stiff enough to sustain the deflection.
As the height of the sample in HB condition is only 10 mm, the entire part plays a significant role in the stress balance and when the base plate is removed, significant relaxation of RS in the whole part occurred as shown by the von Mises stress changes in Figure 5, stress change in building direction in Figure 6, and the redistribution of residual stresses in C1 and C2 (Figure 12a–d). The high tensile stresses were greatly reduced to low tensile or even compressive stresses after the sample was sliced off from the base plate. It can be deduced that due to the smaller height and larger contact between the sample and base plate, the influence of the base plate on RS development is significant.
In the case of the VB sample, due to the smaller contact area, layers near the base plate play a more important role in balancing the stress before the base plate is removed. This can also be further inferred from Figure 13a–f which only reveal a minor change in the distribution of σz, which is normal to the cross-section after the removal of the base plate. In addition to a small contact area with the base plate, the cross-section C1 and C2 being far away from the base plate is another reason for the small effect. The effect of the removal on the stress redistribution has been discussed earlier for the lower section of the samples that are close to the base plate (Figure 10).
Further, to make a more detailed comparison between the simulated and the measured samples, the RS for the mid-thickness line or the center of the cross-sections at X = 0 (Figure 13) are presented for all sections C1, C2, C3, and C4 for both the HB and VB samples. As can be seen from Figure 14, Figure 15, Figure 16 and Figure 17, for the VB sample, the stress distribution trend is in good agreement with the experimentally measured one with larger deviations in stress magnitude for the stress components parallel (σz) to the build direction. Similarly, for the HB sample, Figure 18, Figure 19, Figure 20 and Figure 21 also show that the stress distribution trends are in good agreement with the experimentally measured ones and again, the greatest deviation in stress magnitude is observed in the stress components parallel (σx) to the build direction. For the stress perpendicular to the cross-section. i.e., σz for C1 and C2 and σy for C3 and C4, the stresses predicted are within a range of a maximum 35% higher than experimentally measured.
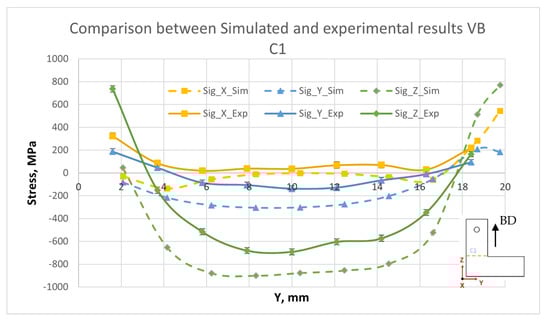
Figure 14.
Comparison between experiment and simulation results for VB sample cross-section C1.
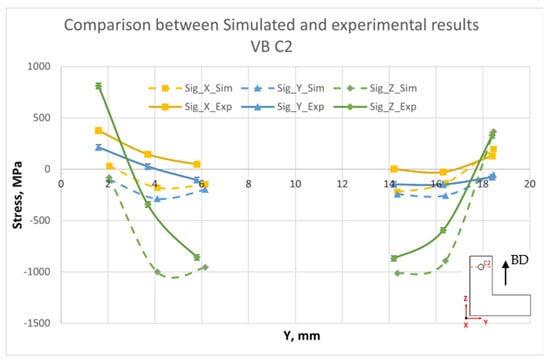
Figure 15.
Comparison between experiment and simulation results for VB sample cross-section C2.
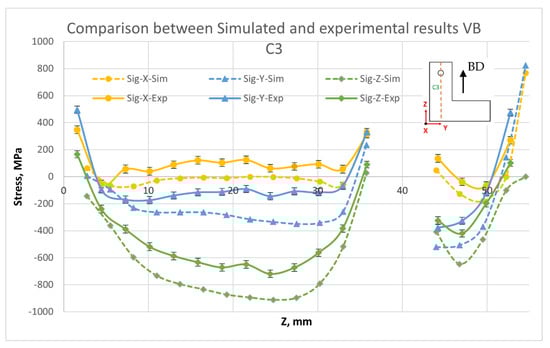
Figure 16.
Comparison between experiment and simulation results for VB sample cross-section C3.
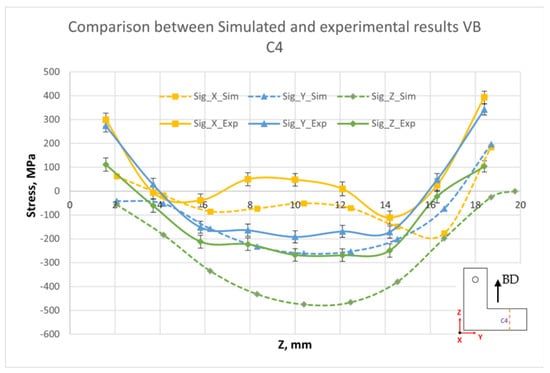
Figure 17.
Comparison between experiment and simulation results for VB sample cross-section C4.
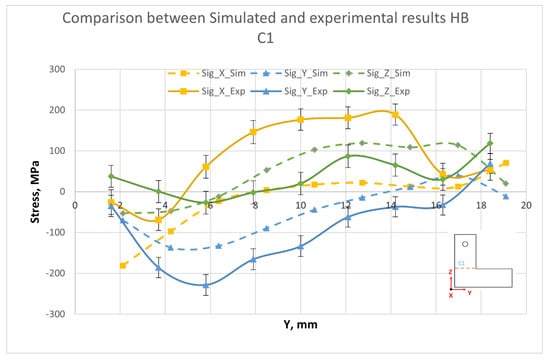
Figure 18.
Comparison between experiment and simulation results for HB sample cross-section C1.
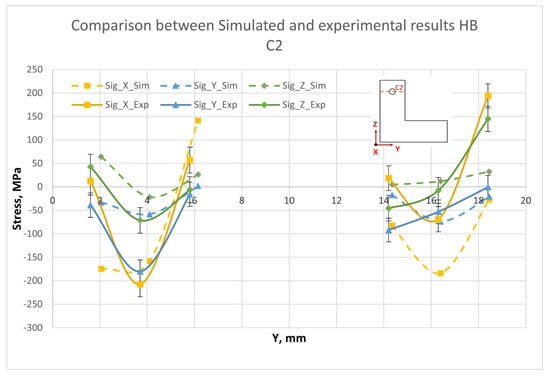
Figure 19.
Comparison between experiment and simulation results for HB sample cross-section C2.
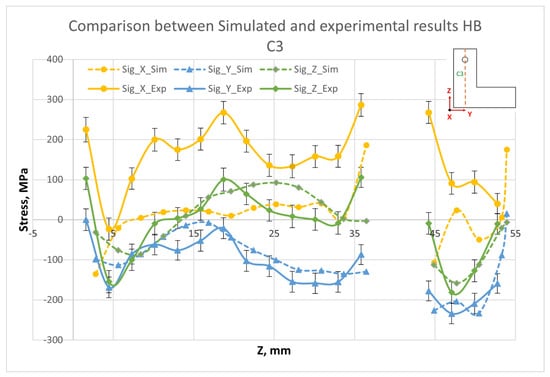
Figure 20.
Comparison between experiment and simulation results for HB sample cross-section C3.
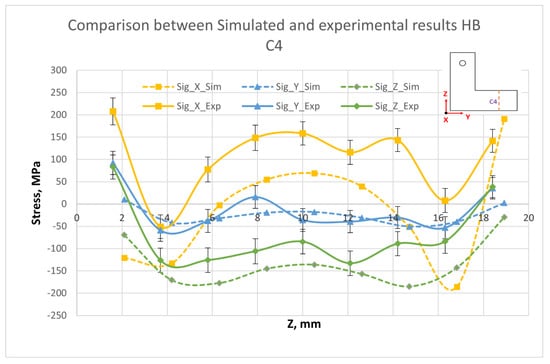
Figure 21.
Comparison between experiment and simulation results for HB sample cross-section C4.
The VB sample is less affected by the removal of the base plate, and the presented stresses are then mainly related to the building process.
The above comparisons confirm that the simplified model can capture the characteristics of residual stress distributions related to the sample geometry and building direction. The deviation in the stress magnitude also indicates that simplifications employed to reduce the computational time contribute to the overprediction of residual stresses. Two main sources of error are the use of the combined layer approach and the simplified load of a uniform temperature field. With such simplifications, the thermal effect of the moving laser spot on the already solidified materials around the melt pool is not being captured, which can result in higher residual stresses. Another possible contribution can be from the assumption of the boundary conditions for heat dissipation. In the model, we consider convection only when the part is submerged into the powder bed whereas, in the real process, there is conduction taking place through the powder particles as well to some extent, which is difficult to model accurately. A further source of error can be related to uncertainties in the temperature-dependent thermomechanical properties used as input and the material behavior chosen for the simulations. As mentioned previously, the material was considered to be isotropic in nature, but in real cases, the AM material behavior seems to be anisotropic [38]. Additionally, the material in powder form will have different temperature-dependent properties than the bulk materials [43,44] and a slight change in these properties can lead to a significant variation in the stress distribution, as the model is dependent upon them. However, with the capability to replicate residual stress distribution with good accuracy, the model can be used in part design and process parameter selection with regard to minimizing residual stresses.
The model can be further improved by using a smaller combined layer size together with incorporating smaller mesh size and real laser movements for more precise heat input instead of using temperature as heat input. However, the computational time will drastically increase with these kinds of complex real-world implementations. The gain in the prediction with the complex interaction can be overshadowed by the time required for the computation. In this current work, simulations which are not presented here show that using finer mesh and smaller layer sizes increases the computation time, whilst gain in the accuracy is minimum. For example, in the case of the VB sample, using a finer mesh with two elements for each combined layer in building direction resulted in 167,029 nodes which took a wall clock time of 62 h for simulation to complete. However, the gain in the results was less than 2% for stress in building direction in comparison to using only one element in building direction. Due to the excessive lead time for the computation, the complex models are confined to either one track of few layers simulations as mentioned earlier.
5. Summary and Conclusions
A simplified model to predict residual stresses in parts manufactured using the laser powder bed fusion method was set up based on a commercially available FEM software and validated by results from neutron diffraction experiments. Based on the results, the following conclusions can be drawn:
The model can predict the variation in the distribution of the stresses in the L-shaped sample due to different build orientations both before and after the base plate has been removed. It has shown that RS state can change significantly once the part is removed from the base plate. However, this depends upon the amount of contact area between the part and the base plate.
From the model, RS are the lowest in the HB sample as in the experiments and it has shown a bigger change in RS state before and after the removal of the base plate in comparison to other samples due to the large contact area between the part and the base plate.
Variation in the stress field due to geometrical changes and features such as holes are also predicted by the model.
The distribution trends of the stresses in all the samples are in good agreement with the experimentally measured ones but with higher magnitude, especially in the building direction. Higher levels of stress are due to various simplified assumptions used for the model.
The model can be incorporated into the design and production process as a tool to have an efficient quality control and modification of geometry of critical areas in the part if the stress predicted is out of the normal range. It can also be used to finalize the print orientation based on the RS levels as well as the part geometry. Some print orientations and part geometry will require support structures; the model can also be exploited to check if the support structure and print orientation are a good combination or not.
Furthermore, it can be developed to capture different laser scan strategies; however, this will lead to an increase in computational time. Reliable temperature-dependent mechanical data and detailed modeling of the boundary conditions for heat dissipation during additive manufacturing are also important for a more accurate prediction of residual stress magnitudes.
Author Contributions
Conceptualization, P.P., S.S., K.S. and J.M.; methodology, P.P., S.S., R.P.; software, P.P. and S.S.; validation, P.P., S.S., K.S., J.M., V.L., and R.P.; formal analysis, P.P., S.S., S.P., and R.P.; investigation, P.P., S.S., K.S., J.M. and V.L.; resources, J.M., R.P., V.L., S.H., and S.P.; data curation, P.P.; writing—original draft preparation, P.P., R.P.; writing—review and editing, P.P., R.P., S.S., K.S., and J.M.; visualization, P.P., S.S., R.P.; supervision, S.S., K.S., J.M., R.P. and S.H.; project administration, R.P.; funding acquisition, R.P. and S.H. All authors have read and agreed to the published version of the manuscript.
Funding
This research is funded by the Swedish Foundation for Strategic Research (Stiftelsen för Strategisk Forskning, SSF), (grant number GSn15–0008) within the Swedish national graduate school in neutron scattering (SwedNess).
Institutional Review Board Statement
Not applicable.
Informed Consent Statement
Not applicable.
Data Availability Statement
Data can be made available upon request.
Acknowledgments
The neutron diffraction experiments were conducted at the Australia Nuclear Science and Technology Organization’s (ANSTO) KOWARI beamline through proposal P7182. The authors gratefully acknowledge the support provided by the ANSTO during the experiment. The Additive Manufacturing Research Laboratory (AMRL) at RISE IVF is acknowledged for manufacturing all the specimens and the Lighter Academy as well as the Centre for Additive Manufacturing—Metal (CAM2) financed by the Swedish Governmental Agency of Innovation Systems (Vinnova) for their financial support.
Conflicts of Interest
The authors declare no conflict of interest.
References
- ASTM International. ISO/ASTM52900–15, Standard Terminology for Additive Manufacturing–General Principles–Terminology; ASTM International: West Conshohocken, PA, USA, 2015. [Google Scholar] [CrossRef]
- Mercelis, P.; Kruth, J. Residual stresses in selective laser sintering and selective laser melting. Rapid Prototyp. J. 2006, 12, 254–265. [Google Scholar] [CrossRef]
- Buchbinder, D.; Meiners, W.; Pirch, N.; Wissenbach, K.; Schrage, J. Investigation on reducing distortion by preheating during manufacture of aluminum components using selective laser melting. J. Laser Appl. 2014, 26, 012004. [Google Scholar] [CrossRef]
- Megahed, M.; Mindt, H.-W.; N’Dri, N.; Duan, H.; Desmaison, O. Metal additive-manufacturing process and residual stress modeling. Integr. Mater. Manuf. Innov. 2016, 5, 61–93. [Google Scholar] [CrossRef]
- Schilp, J.; Seidel, C.A.M.; Krauss, H.; Weirather, J. Investigations on Temperature Fields during Laser Beam Melting by Means of Process Monitoring and Multiscale Process Modelling. Adv. Mech. Eng. 2014, 6. [Google Scholar] [CrossRef]
- Song, B.; Dong, S.; Liao, H.; Coddet, C. Process parameter selection for selective laser melting of Ti6Al4V based on tem-perature distribution simulation and experimental sintering. Int. J. Adv. Manuf. Technol. 2012, 61, 967–974. [Google Scholar] [CrossRef]
- Yin, J.; Zhu, H.; Ke, L.; Lei, W.; Dai, C.; Zuo, D. Simulation of temperature distribution in single metallic powder layer for laser micro-sintering. Comput. Mater. Sci. 2012, 53, 333–339. [Google Scholar] [CrossRef]
- Bayat, M.; Mohanty, S.; Hattel, J.H. Multiphysics modelling of lack-of-fusion voids formation and evolution in IN718 made by multi-track/multi-layer L-PBF. Int. J. Heat Mass Transf. 2019, 139, 95–114. [Google Scholar] [CrossRef]
- Mukherjee, T.; Zhang, W.; DebRoy, T. An improved prediction of residual stresses and distortion in additive manufac-turing. Comput. Mater. Sci. 2017, 126, 360–372. [Google Scholar] [CrossRef]
- Dunbar, A.J.; Denlinger, E.R.; Gouge, M.F.; Michaleris, P. Experimental validation of finite element modeling for laser powder bed fusion deformation. Addit. Manuf. 2016, 12, 108–120. [Google Scholar] [CrossRef]
- Korsunsky, A.M.; Jun, T.-S. Eigenstrain Analysis of Residual Stresses Due To Welding and Post-Weld. In Proceedings of the Minerals, Metals and Materials Society-3rd International Conference on Processing Materials for Properties (PMP III), Bangkok, Thailand, 7–10 December 2008; Volume 2, pp. 738–743. [Google Scholar]
- Denlinger, E.R.; Jagdale, V.; Srinivasan, G.; El-Wardany, T.; Michaleris, P. Thermal modeling of Inconel 718 processed with powder bed fusion and experimental validation using in situ measurements. Addit. Manuf. 2016, 11, 7–15. [Google Scholar] [CrossRef]
- Matsumoto, M.; Shiomi, M.; Osakada, K.; Abe, F. Finite element analysis of single layer forming on metallic powder bed in rapid prototyping by selective laser processing. Int. J. Mach. Tools Manuf. 2002, 42, 61–67. [Google Scholar] [CrossRef]
- Van Belle, L.; Vansteenkiste, G.; Boyer, J.C. Comparisons of Numerical Modelling of the Selective Laser Melting. Key Eng. Mater. 2012, 504–506, 1067–1072. [Google Scholar] [CrossRef]
- Bai, P.-K.; Cheng, J.; Liu, B.; Wang, W.-F. Numerical simulation of temperature field during selective laser sintering of polymer-coated molybdenum powder. Trans. Nonferrous Met. Soc. China 2006, 16, s603–s607. [Google Scholar] [CrossRef]
- Denlinger, E.R.; Irwin, J.; Michaleris, P. Thermomechanical Modeling of Additive Manufacturing Large Parts. J. Manuf. Sci. Eng. 2014, 136, 061007. [Google Scholar] [CrossRef]
- Antony, K.; Arivazhagan, N.; Senthilkumaran, K. Numerical and experimental investigations on laser melting of stain-less steel 316L metal powders. J. Manuf. Process. 2014, 16, 345–355. [Google Scholar] [CrossRef]
- Bayat, M.; Mohanty, S.; Hattel, J.H. A systematic investigation of the effects of process parameters on heat and fluid flow and metallurgical conditions during laser-based powder bed fusion of Ti6Al4V alloy. Int. J. Heat Mass Transf. 2019, 139, 213–230. [Google Scholar] [CrossRef]
- Hussein, A.; Hao, L.; Yan, C.; Everson, R. Finite element simulation of the temperature and stress fields in single layers built without-support in selective laser melting. Mater. Des. 2013, 52, 638–647. [Google Scholar] [CrossRef]
- Parry, L.; Ashcroft, I.A.A.; Wildman, R.D.D. Understanding the effect of laser scan strategy on residual stress in selec-tive laser melting through thermo-mechanical simulation. Addit. Manuf. 2016, 12, 1–15. [Google Scholar]
- Hodge, N.E.; Ferencz, R.M.; Solberg, J.M. Implementation of a thermomechanical model for the simulation of selective laser melting. Comput. Mech. 2014, 54, 33–51. [Google Scholar] [CrossRef]
- Li, C.; Liu, J.; Fang, X.; Guo, Y. Efficient predictive model of part distortion and residual stress in selective laser melting. Addit. Manuf. 2017, 17, 157–168. [Google Scholar] [CrossRef]
- Li, C.; Liu, J.; Guo, Y. Prediction of Residual Stress and Part Distortion in Selective Laser Melting. Procedia CIRP 2016, 45, 171–174. [Google Scholar] [CrossRef]
- Li, L.; Pan, T.; Zhang, X.; Chen, Y.; Cui, W.; Yan, L.; Liou, F. Deformations and stresses prediction of cantilever structures fabricated by selective laser melting process. Rapid Prototyp. J. 2021, 27, 453–464. [Google Scholar] [CrossRef]
- Denlinger, E.R.; Gouge, M.; Irwin, J.; Michaleris, P. Thermomechanical model development and in situ experimental validation of the Laser Powder-Bed Fusion process. Addit. Manuf. 2017, 16, 73–80. [Google Scholar] [CrossRef]
- An, K.; Yuan, L.; Dial, L.; Spinelli, I.; Stoica, A.D.; Gao, Y. Neutron residual stress measurement and numerical modeling in a curved thin-walled structure by laser powder bed fusion additive manufacturing. Mater. Des. 2017, 135, 122–132. [Google Scholar] [CrossRef]
- Williams, R.J.; Davies, C.M.; Hooper, P.A. A pragmatic part scale model for residual stress and distortion prediction in powder bed fusion. Addit. Manuf. 2018, 22, 416–425. [Google Scholar] [CrossRef]
- Jun, T.-S.; Korsunsky, A.M. Evaluation of residual stresses and strains using the Eigenstrain Reconstruction Method. Int. J. Solids Struct. 2010, 47, 1678–1686. [Google Scholar] [CrossRef]
- Dassault Systèmes Simulia. Abaqus 6.12 CAE User’s Manual; Abaqus 6.12; Dassault Systèmes: Johnston, RI, USA, 2012; p. 1174. [Google Scholar]
- Pant, P.; Proper, S.; Luzin, V.; Sjöström, S.; Simonsson, K.; Moverare, J.; Hosseini, S.; Pacheco, V.; Peng, R.-L. Mapping of residual stresses in as-built Inconel 718 fabricated by laser powder bed fusion: A neutron diffraction study of build orientation influence on residual stresses. Addit. Manuf. 2020, 36, 101501. [Google Scholar]
- Denlinger, E.R.; Heigel, J.C.; Michaleris, P. Residual stress and distortion modeling of electron beam direct manufacturing Ti-6Al-4V. Proc. Inst. Mech. Eng. Part B J. Eng. Manuf. 2015, 229, 1803–1813. [Google Scholar] [CrossRef]
- Heigel, J.; Michaleris, P.; Reutzel, E. Thermo-mechanical model development and validation of directed energy deposition additive manufacturing of Ti–6Al–4V. Addit. Manuf. 2015, 5, 9–19. [Google Scholar] [CrossRef]
- Irwin, J.; Michaleris, P. A Line Heat Input Model for Additive Manufacturing. J. Manuf. Sci. Eng. 2016, 138, 111004. [Google Scholar] [CrossRef]
- Cheng, B.; Shrestha, S.; Chou, K. Stress and deformation evaluations of scanning strategy effect in selective laser melt-ing. Addit. Manuf. 2016, 12, 240–251. [Google Scholar]
- In718 Properites. Available online: https://www.specialmetals.com/assets/smc/documents/inconel_alloy_718.pdf (accessed on 2 February 2020).
- Cakmak, E.; Watkins, T.R.; Bunn, J.R.; Cooper, R.C.; Cornwell, P.A.; Wang, Y.; Sochalski-Kolbus, L.M.; Dehoff, R.R.; Babu, S.S. Mechanical Characterization of an Additively Manufactured Inconel 718 Theta-Shaped Specimen. Metall. Mater. Trans. A Phys. Metall. Mater. Sci. 2016, 47, 971–980. [Google Scholar] [CrossRef]
- Blackwell, P. The mechanical and microstructural characteristics of laser-deposited IN718. J. Mater. Process. Technol. 2005, 170, 240–246. [Google Scholar] [CrossRef]
- Deng, D.; Peng, R.L.; Brodin, H.; Moverare, J. Microstructure and mechanical properties of Inconel 718 produced by selective laser melting: Sample orientation dependence and effects of post heat treatments. Mater. Sci. Eng. A 2018, 713, 294–306. [Google Scholar] [CrossRef]
- Popovich, V.; Borisov, E.; Sufiiarov, V.; Masaylo, D.; Alzina, L. Impact of heat treatment on mechanical behaviour of Inconel 718 processed with tailored microstructure by selective laser melting. Mater. Des. 2017, 131, 12–22. [Google Scholar] [CrossRef]
- Yilbas, B.; Akhtar, S.; Karatas, C. Laser surface treatment of Inconel 718 alloy: Thermal stress analysis. Opt. Lasers Eng. 2010, 48, 740–749. [Google Scholar] [CrossRef]
- Sandvik. Sanmac 316. 2013. Available online: http://www.smt.sandvik.com/en/materials-center/material-datasheets/bar-and-hollow-bar/bar/sanmac-316316l/ (accessed on 22 May 2021).
- Kirstein, O.; Luzin, V.; Garbe, U. The Strain-Scanning Diffractometer Kowari. Neutron News 2009, 20, 34–36. [Google Scholar] [CrossRef]
- Gusarov, A.; Kruth, J.-P. Modelling of radiation transfer in metallic powders at laser treatment. Int. J. Heat Mass Transf. 2005, 48, 3423–3434. [Google Scholar] [CrossRef]
- Jiang, W.; Dalgarno, K.W. Finite Element Analysis of Residual Stresses and Deformations in Direct Metal SLS Process. In Proceedings of the International Solid Freeform Fabrication Symposium, Austin, TX, USA, 5–7 August 2002. [Google Scholar]


Publisher’s Note: MDPI stays neutral with regard to jurisdictional claims in published maps and institutional affiliations. |
© 2021 by the authors. Licensee MDPI, Basel, Switzerland. This article is an open access article distributed under the terms and conditions of the Creative Commons Attribution (CC BY) license (https://creativecommons.org/licenses/by/4.0/).