Article

Composition Stability and Cr-Rich Phase Formation in W-Cr-Y and W-Cr-Ti Smart Alloys

by
Damian Sobieraj
1,†,
Jan S. Wróbel
1,*,†,
Mark R. Gilbert
2,†,
Andrey Litnovsky
3,4,†,
Felix Klein
3,†,
Krzysztof J. Kurzydłowski
5,† and
Duc Nguyen-Manh
2,6,*,†
1
Faculty of Materials Science and Engineering, Warsaw University of Technology, ul. Wołoska 141, 02-507 Warsaw, Poland
2
United Kingdom Atomic Energy Authority, Culham Science Centre, Abingdon, Oxon OX14 3DB, UK
3
Forschungszentrum Jülich GmbH, Institut für Energie- und Klimaforschung, 52425 Jülich, Germany
4
National Research Nuclear University MEPhI, Kashirskoe Sh. 31, 115409 Moscow, Russia
5
Faculty of Mechanical Engineering, Białystok University of Technology, ul. Wiejska 45C, 15-351 Białystok, Poland
6
Department of Materials, University of Oxford, Parks Road, Oxford OX1 3PH, UK
*
Authors to whom correspondence should be addressed.
These authors contributed equally to this work.
Metals 2021, 11(5), 743; https://doi.org/10.3390/met11050743
Submission received: 26 March 2021 / Revised: 24 April 2021 / Accepted: 28 April 2021 / Published: 30 April 2021

Abstract

:
W-Cr-Y smart alloys are potential material candidates for plasma facing components due to their protective behaviour during the loss-of-coolant accident (LOCA), while maintaining beneficial properties of W during the normal operation of the fusion power plant. During plasma exposure, the lighter alloying elements are preferentially sputtered at the surface, but in case of a LOCA, the plasma quenches and sputtering stops and diffusion of the alloying elements to the surface becomes intensive. The diffusion of Cr to the surface due to alloying elements (Y, Ti) yields a protective oxide layer stopping the sublimation of WO 3 . The phase stability and short-range ordering of ternary alloys in W-Cr-Y(Ti) systems has been investigated, using combination of Density Functional Theory (DFT) and Cluster Expansion (CE) methods with Monte-Carlo (MC) simulations. It has been found out from the DFT calculations, that all pairs in the W-Cr-Y system have positive values of the enthalpy of mixing, while most of the Cr-Ti and Ti-W binary structures have negative enthalpies of mixing. The shift in the short-range order as a function of temperature between Cr and W has been predicted as a result of Y addition in W-Cr-Y alloys compared to W 70 Cr 30 , by around 400 K towards lower temperatures. A strong tendency towards clustering of Y has been observed even at elevated temperatures (1800 K). The decrease of the order–disorder transition temperature (ODTT) as a result of the Y addition has been observed, while the addition of Ti has not shown any significant changes in the ordering of W-Cr-Ti alloys compared to W-Cr alloy. Our MC simulations showed that for the W 70 Cr 29 Y 1 alloy the enthalpy of mixing (H m i x ) value is positive in the whole analysed temperature range. Free energy of mixing above 1000 K has been calculated from the first nearest neighbours approximation for W 70 Cr 29 Y 1 and W 70 Cr 29 Ti 1 alloys. The results of the present investigations provide an insight enabling for optimizing chemical composition of materials for future plasma facing components.

Graphical Abstract

1. Introduction

Plasma-Facing-Materials (PFM) for the first wall of future fusion power plants are required to possess extraordinary properties while being able to withstand very high temperatures and radiation damage. High melting point, low erosion yield from plasma particles, low tritium retention, resistance towards neutron irradiation, and stability during failure/abnormal event are examples of required properties for potential candidates for European demonstration fusion power plant (DEMO) devices [1,2]. Currently, tungsten (W) is the leading PFM contender, but its advantages are coupled with brittle failure regimes due to low fracture toughness, which restrict the temperature range at which it could be operating, while also creating several fabrication difficulties. To challenge those obstacles, numerous strategies such as different alloying elements or nanostructure engineered W are being investigated, as well as the W potential as a thick coating on metal substrates [3]. Binary W-based alloys have been thoroughly investigated, with some of them showing deterioration of the mechanical properties, whereas for others, transmutation-induced precipitations were observed under neutron irradiation [4]. Further development of new W-based alloys for PFM is then required to enable the use of fusion energy in future power plants [5].
While the neutron-induced embrittlement and the intrinsic brittleness of W are vital points of research, the safety of the future fusion power plant in case of an accident is another field that should be taken into consideration. The accident scenario involves a total loss of active cooling, referred to as loss-of-coolant-accident (LOCA), and simultaneous air ingress into the vacuum vessel. Due to the nuclear decay heat of the walls, the temperature above 1200 K will be reached within three days and remain at those levels for several weeks. Increased temperature and conditions inside the reactor would cause the formation of the volatile WO 3 and the release of radioactive W to the environment. The expected activity of W at the first wall after 5 full power years is 8.74 × 10 14 Bq/kg [6]. The passive mitigation of those consequences during the LOCA is crucial and major task towards increased the safety of future fusion power plants.
Smart alloys are potential candidates for plasma facing material components due to their protective behaviour during the LOCA, while maintaining beneficial properties of W during the normal operation of the fusion power plant. During plasma exposure, the lighter alloying elements are sputtered at the surface, and as a result, there is an almost pure W layer and a concentration gradient in the alloying elements, which causes diffusion of the alloying elements to the surface. Alloying elements are then sputtered again, and an equilibrium state is reached with a depletion zone of a few tens of nanometres. In case of a LOCA, the plasma quenches, sputtering stops, and diffusion of the alloying elements to the surface become intensive because of the onset of intensive oxidation. The diffusion of Cr to the surface due to alloying elements (Y, Ti) yields a protective oxide layer stopping the sublimation of WO 3 [7,8,9,10].
Recently a progress has been made in the development and physics understanding of oxidation resistant W-based smart alloys with the addition of Cr as a main alloying element to form a protective oxide layer, and Y in concentrations around 1 at.% to support the protective Cr 2 O 3 formation and stability [11,12,13,14]. Samples in the form of thin films have been deposited using the magnetron sputtering. Measurements proved the feasibility of concept behind W-based smart alloys, as the oxide layers were primary observed to be growing at the surface which decreases the risk of spallation due to volume expansion. It has been also found out, that internal oxides remain immobile and oxygen that passes without reacting, diffuses into the alloy forming internal oxides. Experimental study suggested that the concentration of Y of more than 1.5 at.% destabilizes the protective oxide layer and causes breakaway oxidation. There has been a layer of Y observed at the grain boundaries which reduced the oxidation rate by decreasing the diffusion of O and Cr. In that study it has also been concluded that Y appeared to be stabilizing the Cr-W phase as an effect of grain boundary pinning by nano-particles as well as by the increased solubility of Cr in W originating from the change in the configurational entropy of the system.
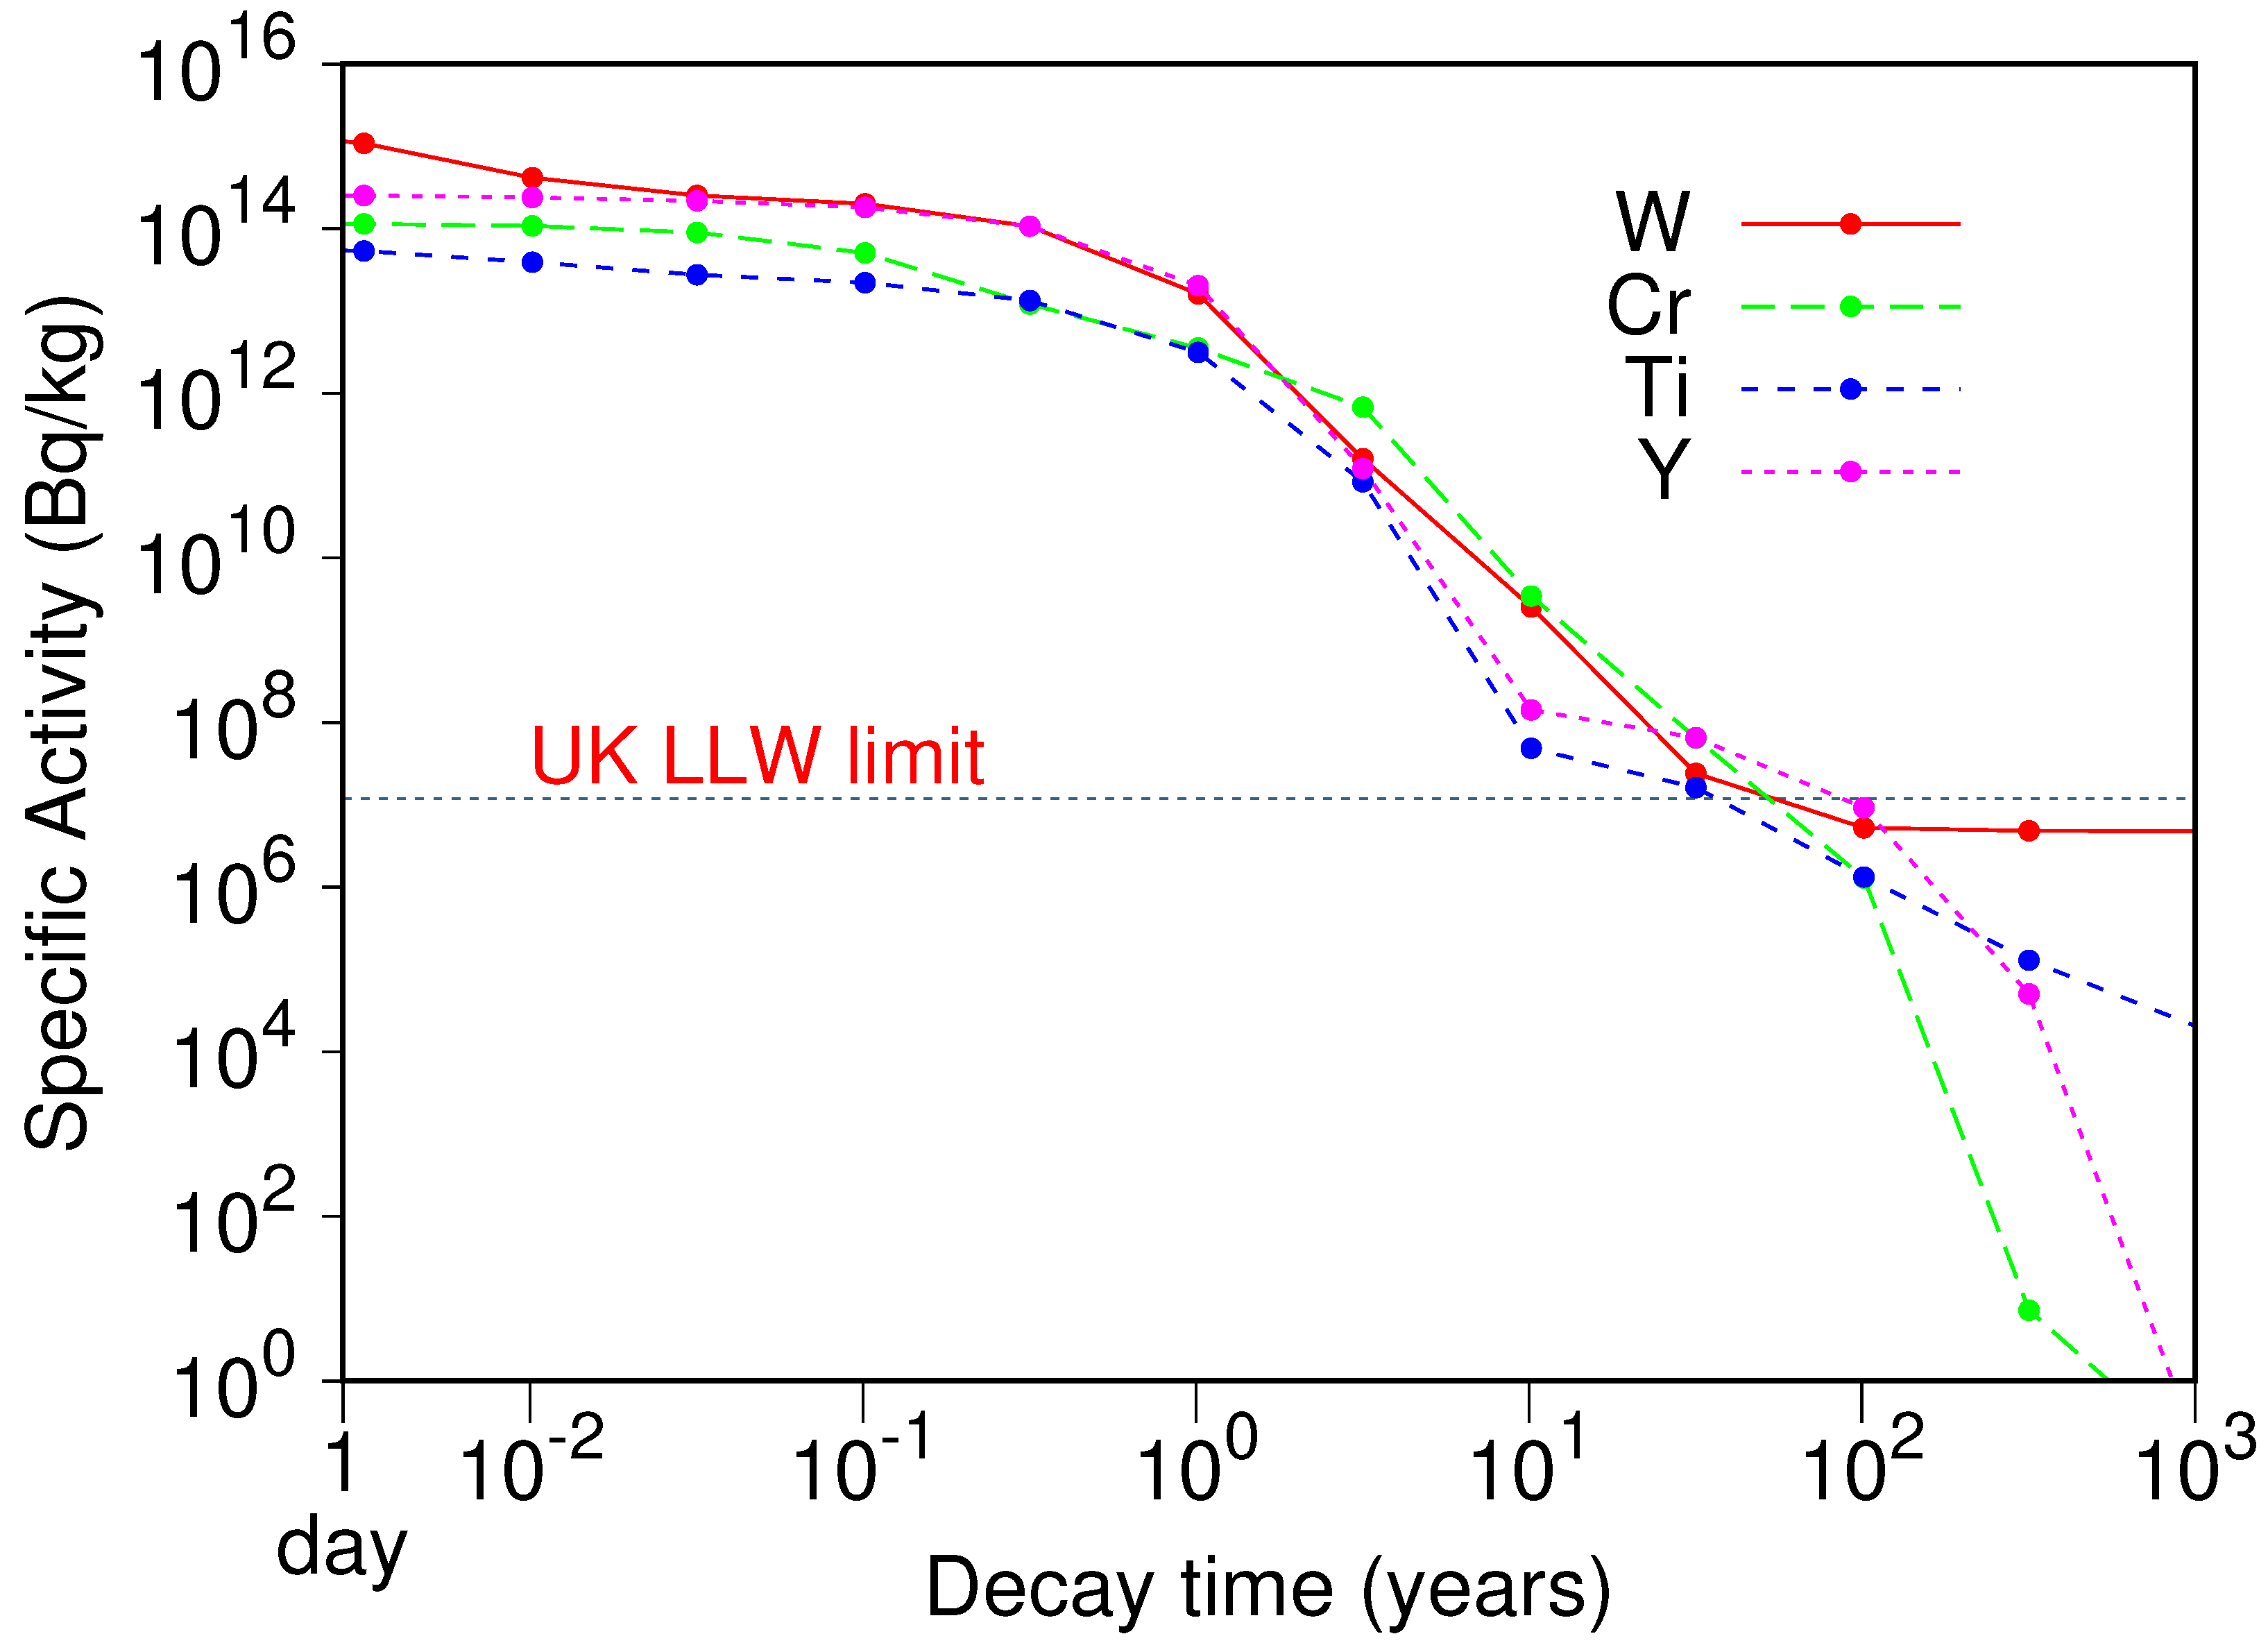
Before describing the model that will be used to study the behaviour of ternary W-based alloys, it is useful to consider the relative nuclear response of W and the three alloying elements being considered here. Figure 1 shows the predicted evolution in composition of the four different pure elements as if they were exposed to a 2-year continuous (full-power) irradiation under the conditions expected for the first wall of a typical fusion reactor. Here, the neutron flux and spectrum has been taken from predictions in the equatorial outboard first wall of a recent conceptual design for a DEMO [15]. Two years of continuous full power operation is representative of the overall exposure expected for first wall components in DEMO (which will have pulsed operational campaigns of roughly five years between maintenance periods) [16,17]. The inventory code FISPACT-II [18] was used to predict change in composition due to the transmutation, which is shown in the plots by the growth in concentration (defined in units of atomic parts per million or appm) of elements different from the original element (i.e., not W, Cr, Ti, or Y, which are shown as the nearly constant horizontal lines at 1e6 appm in each graph). FISPACT-II, using the latest TENDL (truly general-purpose nuclear data library) nuclear data libraries [19], can also evolve compositions after irradiation during decay cooling and subsequently derive the total activity of the material at each time based on the half-lives of the decaying radionuclides in the composition. Figure 2 shows the results of this activity evolution, measured in Becquerels per kg of each element, for 1000 years after the end of the 2-year exposure.
Figure 1 demonstrates that W suffers the most severe transmutation, potentially growing several atomic % ( 1 × 10 4 appm equates to 1 atomic %) of transmutant elements during exposure. The alloying elements Ti, Cr, and Y show at least an order of magnitude lower transmutation rates. Similarly, the activation results (Figure 2) show that W produces the highest long-term activity, potentially only just reaching the UK’s limit for low-level waste (LLW) [20] 100 years after the end of reactor exposure and having a significant long-term residual activity caused by long-lived states of 186 Re ( 186 m Re has a half-life, T 1 / 2 of 2 × 10 5 years). However, at intermediate timescales, ranging from 50 to just over 100 years of decay, pure Y has slightly higher activity than W, Cr, or Fe, with the drop to low-activity delayed by the combined presence of 85 Kr (T 1 / 2 = 10.8 years) and 90 Sr (28.8 years) radioisotopes [21]. In the present case, it takes several decades longer for Y to reach the LLW limit than W, even though it is eventually (beyond 200 years) much less active. Thus, high concentrations of this element could produce a delay in disposal (or recycling) of a W-alloy. Ti and Cr decay to activities below the LLW limit at least as quickly as W in this simulation (representing one of the most severe exposure conditions in DEMO), and so their use in a W-alloy is unlikely to cause any long-term waste issues in comparison to pure W.

2. Computational Methodology

2.1. DFT Computational Details

DFT calculations were performed using Vienna Ab-initio Simulation Package (VASP) together with the projector augmented wave (PAW) method [22,23,24,25]. The generalized gradient approximation (GGA-PBE) was used for exchange and correlation functional [26]. The acceleration of DFT calculations was achieved by using PAW potentials without semi-core p electron contribution [27]. Since the difference between values of the enthalpy of mixing of anti-ferromagnetic and non-magnetic Cr-rich structures is small [28], the magnetism was not taken into consideration in the present study. The Monkhorst-Pack mesh [29] of k points in the Brillouin zone, with k-mesh spacing of 0.2 Å 1 , was used to calculate the total energies. For a 2-atom bcc cubic cell, this corresponds to 14 × 14 × 14 k-point mesh. The plane-wave cut-off energy value was set to 400 eV for the carried calculations. The force components were relaxed to 10 3 eV/Å, and the total energy convergence criterion was set to 10 6 eV/cell.

2.2. Cluster Expansion Formalism

The stability of the system is determined by the mixing energy, which can be obtained for the K-component bcc alloy from DFT calculations using the equation:
E m i x b c c ( σ ) = E t o t b c c σ p = 1 K c p E t o t b c c ( p )
where E t o t b c c ( σ ) is a total energy per atom of the alloy in a bcc structure represented by a vector of configurational variables σ , c p is the average concentration of a given element, and E t o t b c c ( p ) is the total energy of pure element p in a bcc structure.
In the present study, the CE Hamiltonian has been developed [30,31,32,33,34,35,36,37,38] for the ternary bcc Cr-W-Y system following methodology explained in Refs. [27,39], where the enthalpy of mixing is described as a summation of effective cluster interactions (ECIs) of all considered clusters in the system. In the particular case of the 3-component bcc Cr-W-Y system ( K = 3 ), where the five smallest 2-body and three smallest 3-body clusters were considered, the enthalpy of mixing can be computed using:
H m i x ( σ ) = | ω | , n , s J | ω | , n ( s ) m | ω | , n ( s ) Γ | ω | , n ( s ) ( σ ) = = J 1 , 1 ( 0 ) Γ 1 , 1 ( 0 ) + s J 1 , 1 ( s ) Γ 1 , 1 ( s ) + + n = 1 5 s m 2 , n ( s ) J 2 , n ( s ) Γ 2 , n ( s ) + + n = 1 3 s m 3 , n ( s ) J 3 , n ( s ) Γ 3 , n ( s ) ,
where each cluster ω is defined by its size | ω | ( | ω | = 1, 2 and 3 for the point, pair and 3-body clusters, respectively), the label n describing the shell number and the decoration of cluster by point functions ( s ) (see Table 1). The summation is performed over all clusters ω that are not equivalent to each other via symmetry operations applied to a bcc lattice, m | ω | , n ( s ) is the number of clusters equivalent by symmetry to the considered cluster, J | ω | , n ( s ) are the concentration-independent effective cluster interactions (ECIs), derived from a set of DFT calculations using the structure inversion method, and Γ | ω | , n ( s ) ( σ ) are the average correlation functions defined as a product of point functions of occupation variables on a specific cluster ω averaged over all the clusters ω that are equivalent by symmetry to cluster ω [40].
The summation over all possible decorations of clusters s in Equation (2) differs for point, pair, and 3-body clusters. In a 3-component system, besides the zero-point function, there are also 2 non-zero point functions, which means that there are 2 possible decorations of the point cluster. The cluster of two sites ( | ω | = 2 ) can be decorated in ( K 1 ) | ω | = ( 3 1 ) 2 = 4 ways, namely ( s ) = ( 1 , 1 ) , ( 1 , 2 ) , ( 2 , 1 ) and ( 2 , 2 ) . Due to symmetry reasons ( 1 , 2 ) = ( 2 , 1 ) , therefore there are 3 required ECIs to describe the interactions in each 2-body cluster in ternary system. Analogically, the number of required ECIs goes up to six for 3-body clusters.
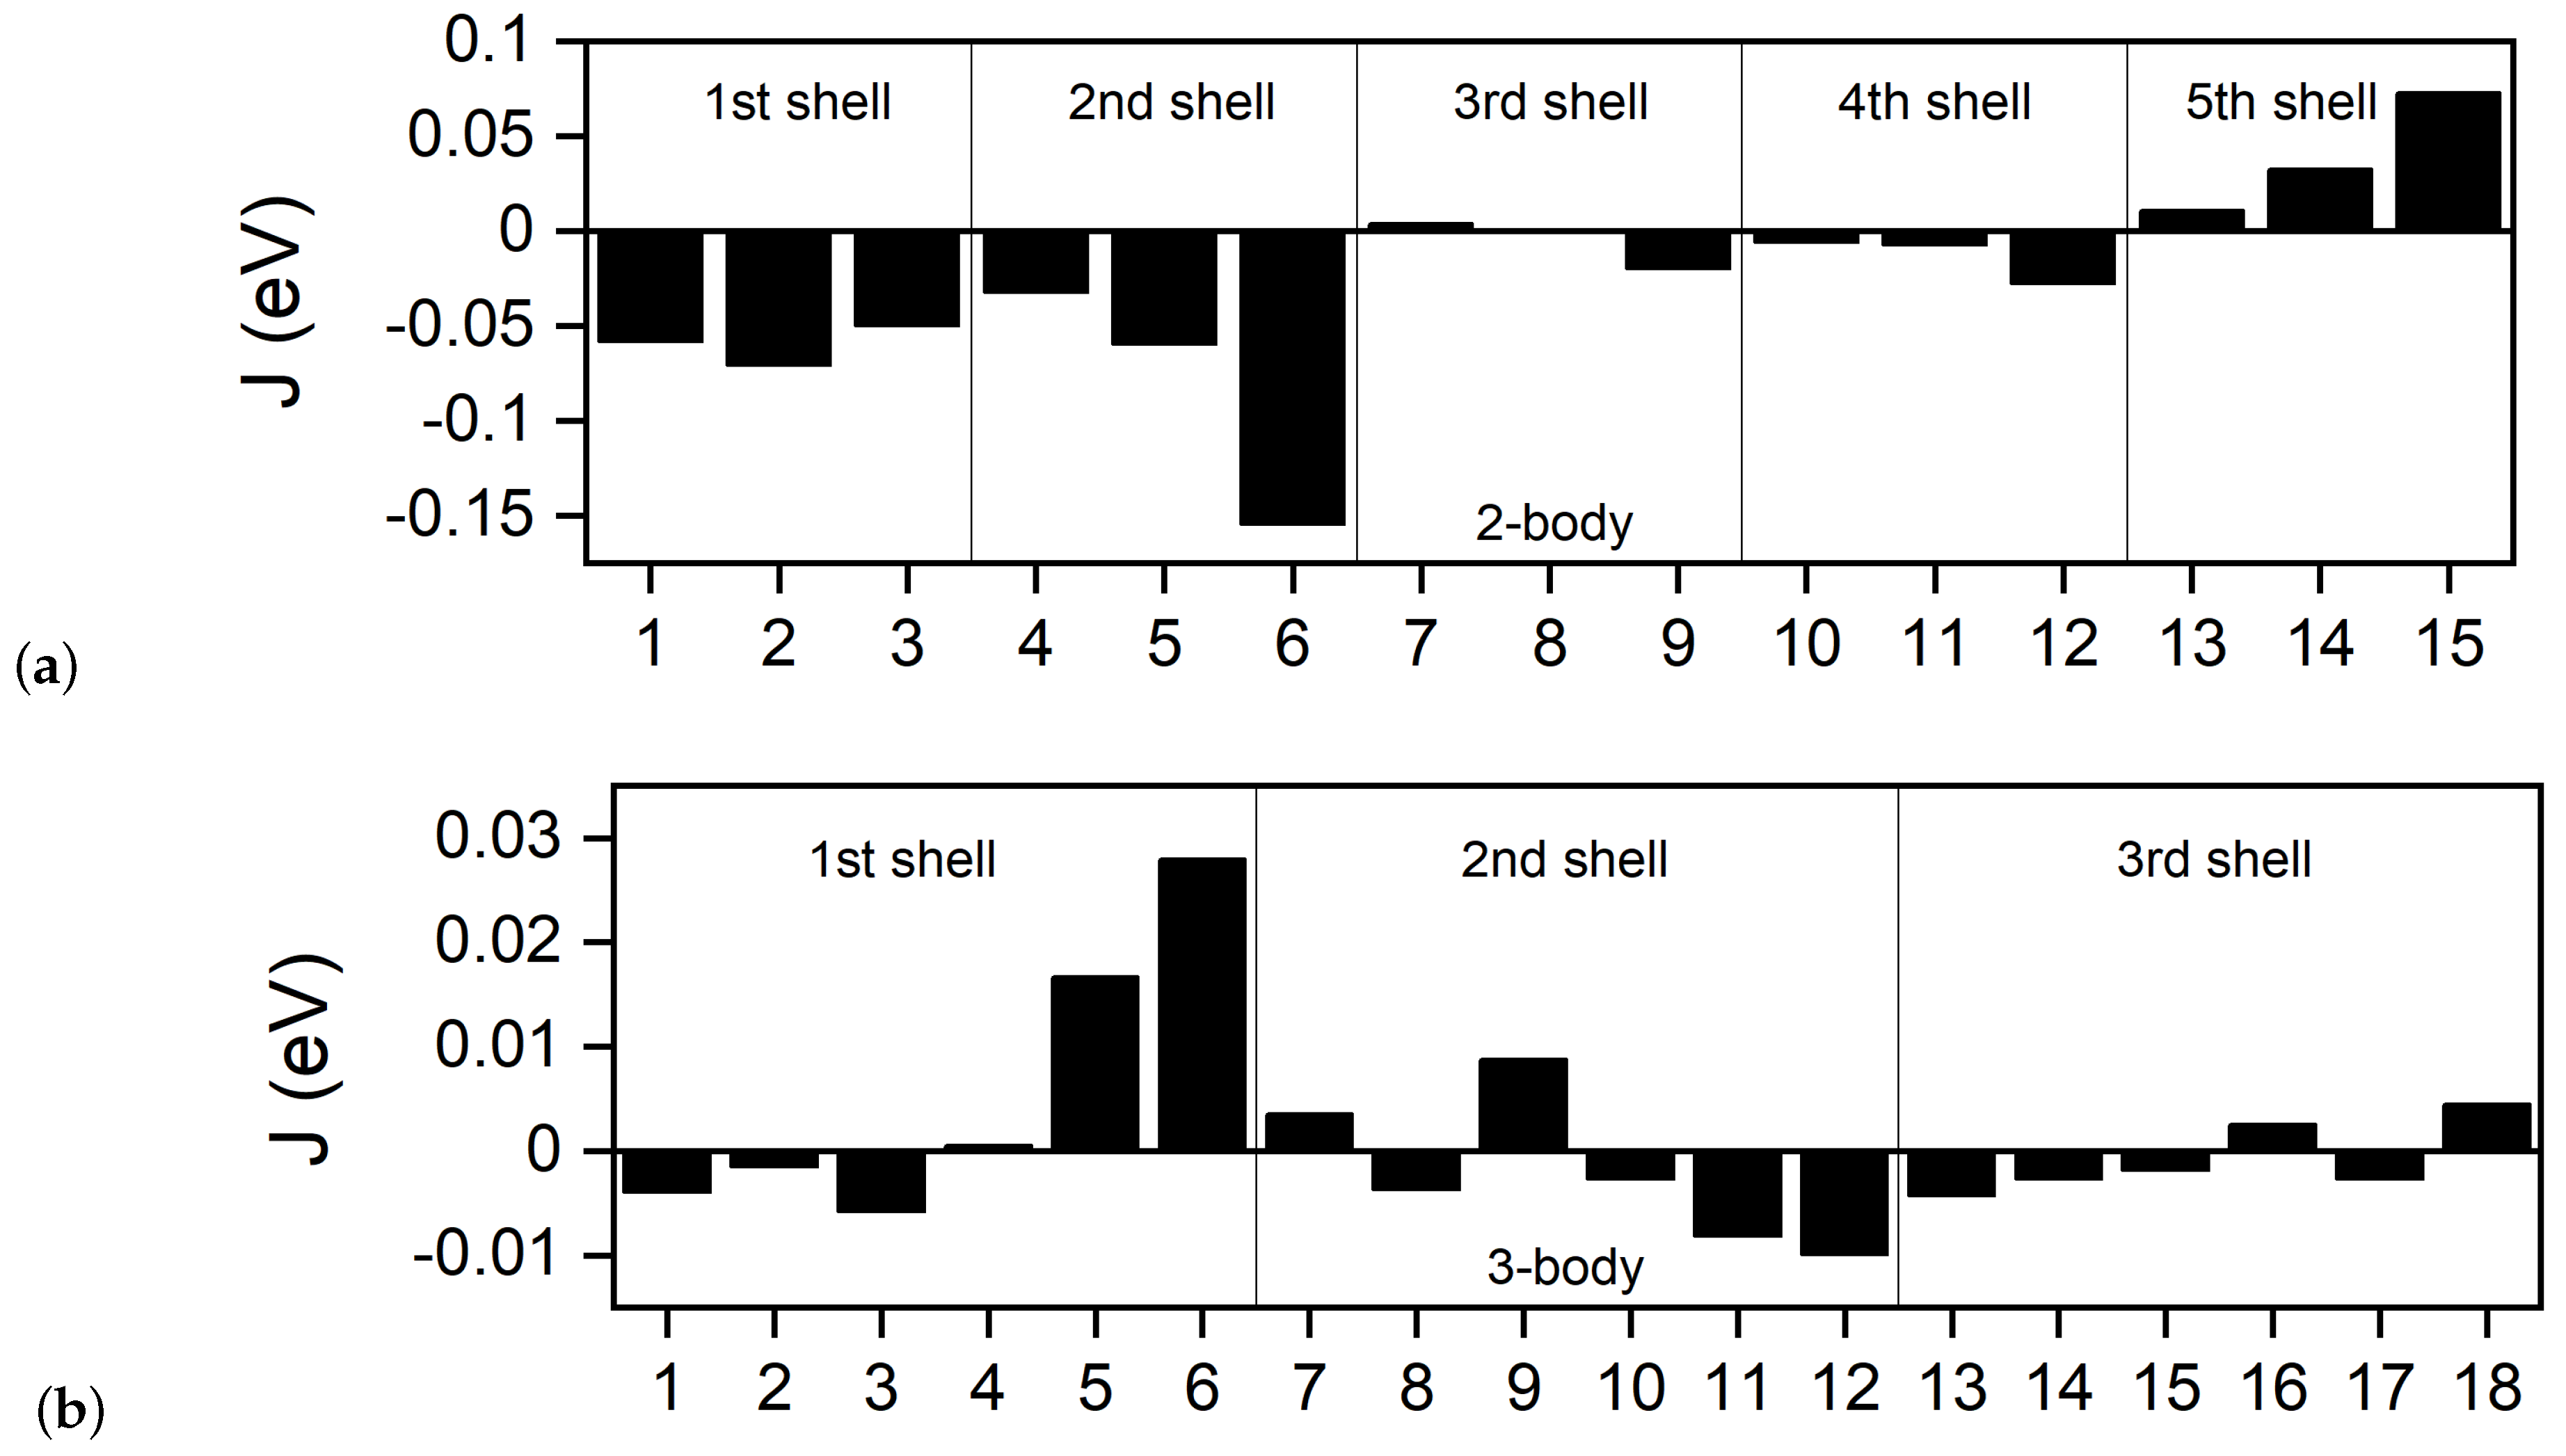
Thirty three ECIs for a 3-component Cr-Y-W system obtained with the CE Hamiltonian mapping are given in Figure 3. Fifteen 2-body and eighteen 3-body interaction parameters were derived (pairs with up to fifth nearest neighbour and three smallest 3-body clusters were used). Numbers 1–3, 4–6, 7–9, 10–12, and 13–15 in Figure 3a denote pairs with first, second, third, fourth, and fifth nearest neighbours, respectively. Numbers 1–6, 7–12, and 13–18 in Figure 3b denote three smallest 3-body clusters. The most significant interactions have been noted between pairs with first and second nearest neighbours, but strong interaction between pairs with fifth nearest neighbours has also been observed. In Table 1, the value of ECIs for the Cr-W-Y system along with the description of considered clusters are given.
The ATAT package was used to perform the mapping of the DFT energies into CE Hamiltonian [41]. Initial values of the ECIs provided a starting point for iterated fitting process of the CE parameters, which in turn was achieved by new structures generation. The final database consisted of 521 structures (3 pure elements, 431 binary, and 87 ternary structures). The cross-validation error value between DFT and CE enthalpies of mixing obtained from the final interation was 15.8 meV/atom, which proves that the final set of effective cluster interactions accurately describes the enthalpy of mixing for Cr-W-Y system.

2.3. Chemical Short-Range Order Parameters

A 10 × 10 × 10 bcc unit cells containing 2000 atoms were used to perform the Monte Carlo simulations. Simulations were carried out by quenching down an alloy from a disordered state from high temperature 3000 down to 100 K, with a temperature step Δ T = 100 K. 2000 MC steps were performed at both accumulation and thermalization stages. The Warren–Cowley Short-Range Order (SRO) parameter that was used in the present study can be calculated from the average pair probabilities y n i j , obtained for an alloy structure at considered temperature, as follows [42,43]:
α n i j = 1 y n i j c i c j
where i and j are nearest neighbour atoms of n-th shell, while c i and c j are their concentrations. The y n i j values can be obtained by the inversion of pair correlation matrix, see Equation (10) from Ref. [44] and Equation (11) from Ref. [45], or by using the analytical formulas explained in Ref. [46]. It should be noted that pair correlation functions, used in both above-mentioned methods, are dependant on the composition of alloy and temperature, and they are averaged at the accumulation stage of MC simulations over 2000 MC steps per atom at each temperature. For the bcc lattice, the average SRO parameter can be calculated using first and second nearest neighbours as follows [47]:
α a v g i j = 8 α 1 i j + 6 α 2 i j 14
where α 1 i j and α 2 i j denote the SRO parameters for the 1st and 2nd nearest neighbours, respectively. Positive values of the SRO parameter indicate the possibility of segregation between atoms i and j, negative values point to the possibility of ordering between atoms, while values close to 0 support the formation of the disordered solid solutions.
Temperature dependant pair probabilities from the 1st nearest neighbours have been used to compute the composition dependant configuration entropy contribution to the free energy of mixing [45]:
S c o n f ( T ) = + 7 s y 1 , 1 ( s ) [ σ , T ] l o g [ y 1 , 1 ( s ) [ σ , T ] ] 4 s y 2 , 1 ( s ) [ σ , T ] l o g [ y 2 , 1 ( s ) [ σ , T ] ]
The entropy of mixing ( S m i x ), which indicates the effect of short-range ordering in reference to a random configuration, has been obtained as follows:
S m i x ( T ) = S r a n d S c o n f ( T )
where S r a n d is the entropy of a random configuration which can be calculated as [39]:
S r a n d = k B i c i l n ( c i )
From Equations (5)–(7), one can then calculate the free energy of mixing as follows:
F m i x ( T ) = H m i x ( T ) T S m i x ( T )
In the Monte Carlo simulations, Equation (2) has been used to obtain the enthalpy of mixing of alloy structures in 10 × 10 × 10 bcc unit cell. Similarly, as in the case of SRO parameters and configurational entropy, the H m i x value at finite temperature is obtained from the temperature dependant pair correlation functions and is averaged over 2000 MC steps per atom at the accumulation stage.

3. Phase Stability of Derivative Cr-W-Y Alloys

3.1. Phase Stability at 0 K

DFT and CE methods were applied to calculate the enthalpy of mixing values for all 521 bcc structures present in the created Cr-W-Y database. Enthalpy of mixing values for each binary subsystem have been analysed to understand what kind of phase stabilities are expected in the ternary system. Positive values of the enthalpy of mixing suggest possible tendency for atoms to segregate, negative values imply that there might be a tendency towards formation of the brittle intermetallic phases, while values close to 0 eV/atom promote the formation of disordered solid solutions.
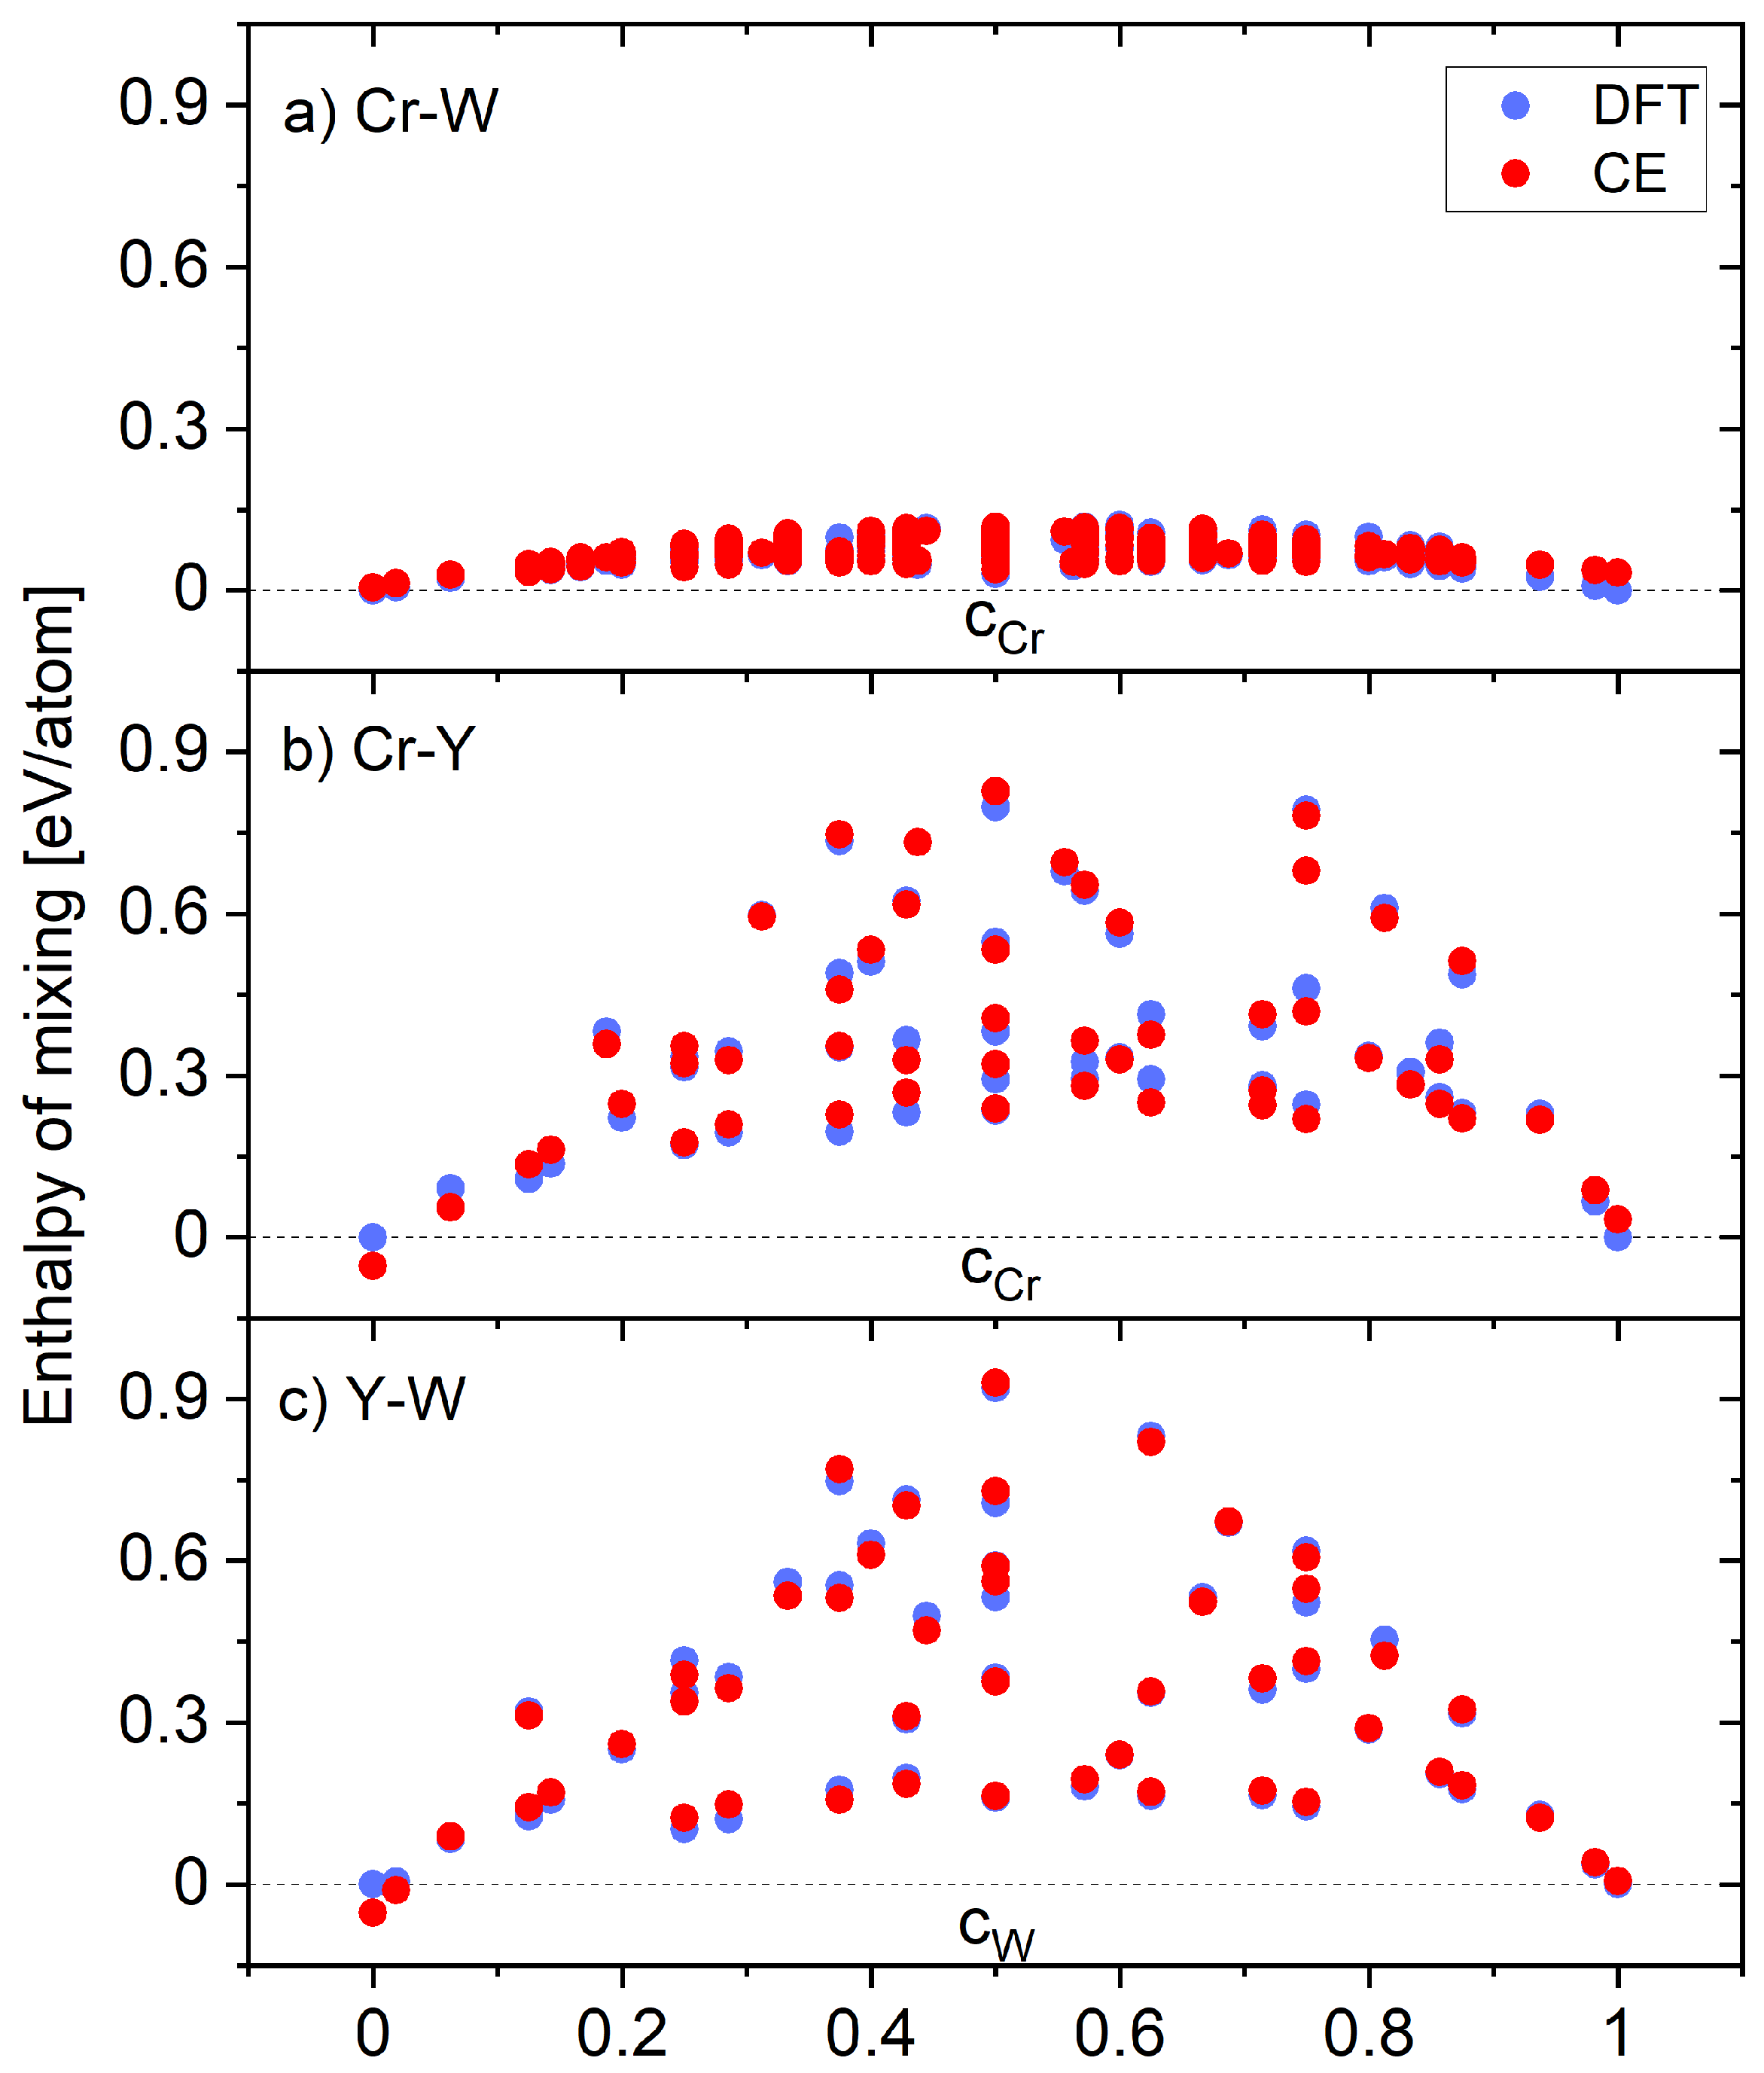
In Figure 4, the enthalpy of mixing values are given for Cr-W, Cr-Y, and Y-W binary structures studied in our ternary database. Initial 58 binary bcc structures compositions and atomic positions, which served as a baseline for CE structures generation, have been derived from Ref. [33]. Most of the compositions were analysed at multiple atomic configurations, thus for a specific composition, there are numerous points in Figure 4, representing structures with different phase stabilities. For example, in generating data for CE method at 50-50 composition of a binary alloy in bcc lattice [34,35,36], the DFT calculations were normally performed for 6 different structures (B2, B32, B11, tP8-L44-1, tP8-L44-2, tP8-L44-3 according to the notation in Ref. [33]) with their enthalpy of mixing values being dependant on the atomic positions. It has been observed that all structures in 3 binary systems in Cr-W-Y ternary system had positive enthalpies of mixing, with values for binary Cr-Y and Y-W systems reaching almost 1 eV/atom while being significantly higher than those for binary Cr-W (values up to 117 meV/atom). For all three binary systems, the most positive values of enthalpy of mixing are observed for structures with equal compositions of both elements.

3.2. Finite Temperature Phase Stability and Order-Disorder Transition Temperatures of Cr-W-Y Smart Alloys

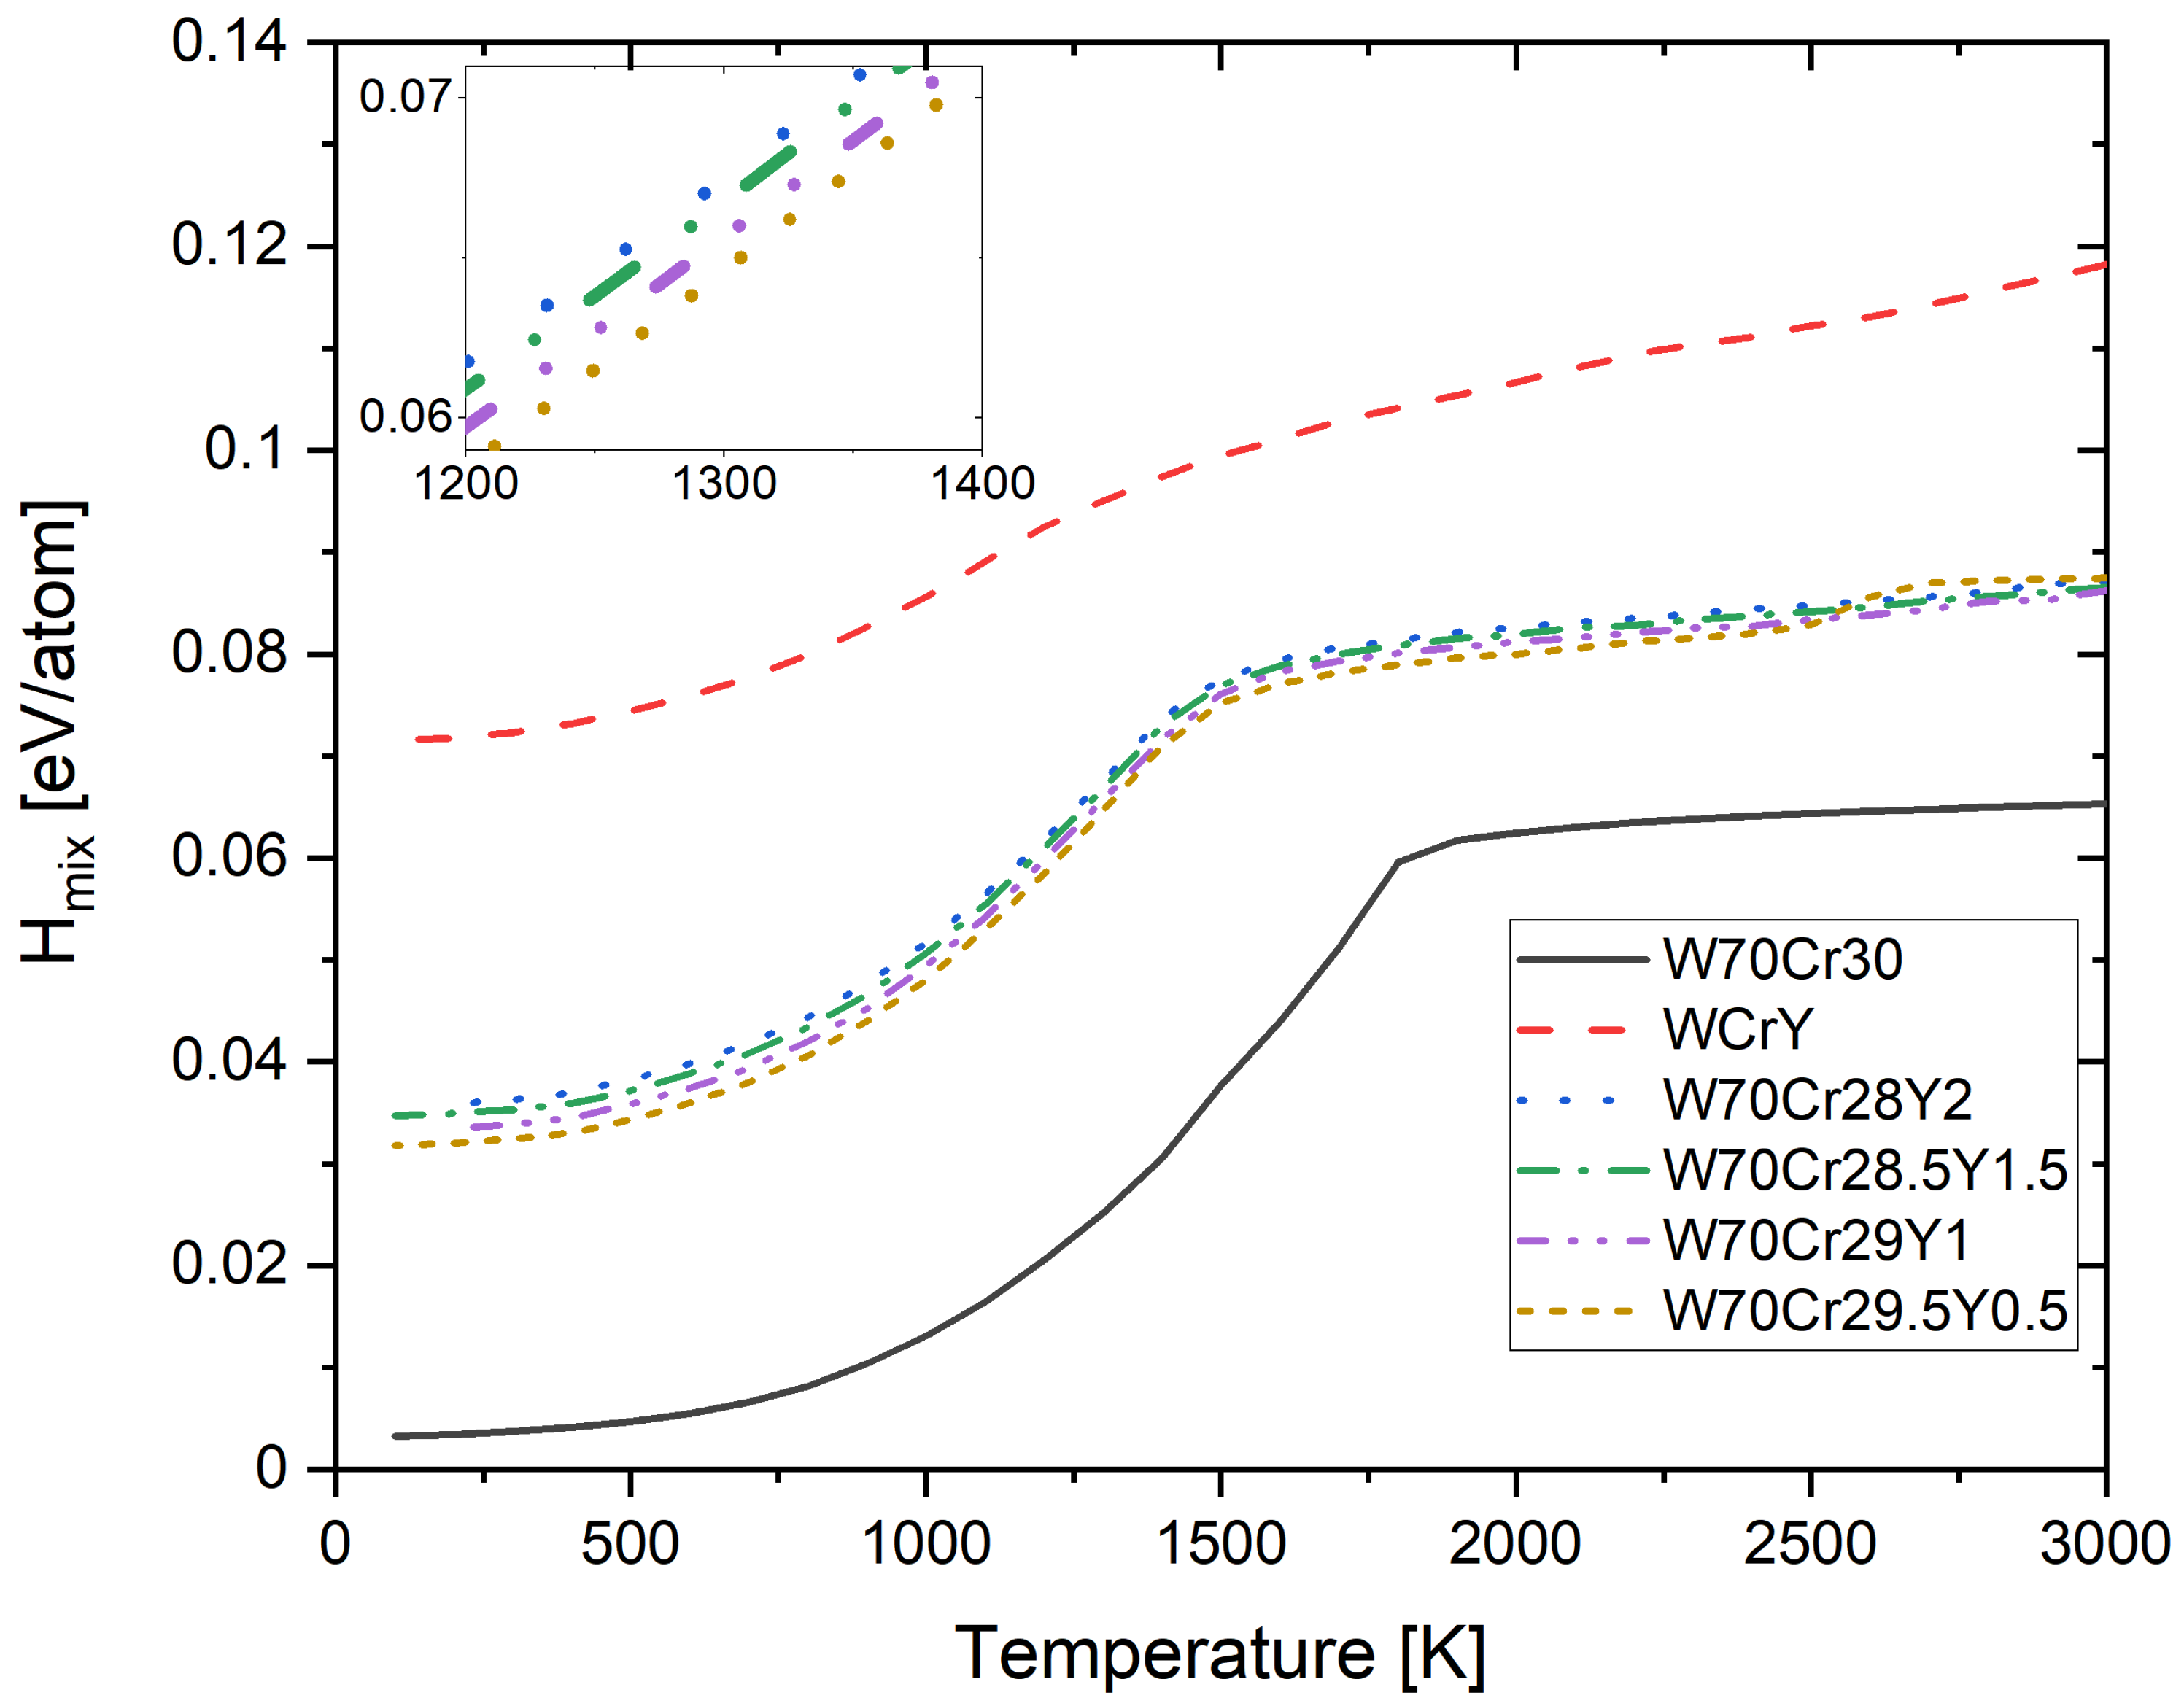
In Figure 5, the enthalpy of mixing as a function of temperature for W 70 Cr 30 , equiatomic WCrY and derivative W 70 Cr ( 30 x ) Y x , for x = ( 0.5 ; 1 ; 1.5 ; 2 ) alloys is given. The lowest enthalpy of mixing values in the whole temperature range have been observed for W 70 Cr 30 alloy, with values close to 0 meV/atom at 100 K, up to 63 meV/atom at 3000 K. It has been observed that even slight addition of yttrium (0.5 at.%) results in the significant increase of the enthalpy of mixing values in the whole temperature range. The W 70 Cr 29.5 Y 0 . 5 alloy has around 30 meV/atom higher enthalpy of mixing values than the W 70 Cr 30 alloy. Further additions of Y up to 2 at.% did not result in significant enthalpy of mixing changes, with its values increasing by around 1 meV/atom per 0.5 at.% additional Y concentration.
The ODTT has been previously investigated [27] as the temperature, at which an alloy starts to become a disordered solid solution. It has been calculated from the enthalpy of mixing plots as the highest temperature at which the inflection points were observed. It can also be computed from the SRO as a function of temperature plots, and it has been found out that those values are be the same. By using this method, one can analyse the influence of the specific elements and their pair concentrations on the ODTT, which allows us to find the optimal composition of an alloy with the lowest temperature of the disordered solid solution presence.
In Table 2, the order–disorder transition temperatures are given for equiatomic composition and several derivative alloy compositions considered in the Cr-Y-W system. For alloys found in the Cr-Y-W system, the lowest ODTT have been observed for equiatomic alloy, 1100 K for WCrY. The W 70 Cr 30 alloy, which serves as a baseline for understanding the influence of the additions of Y, has shown 1700 K ODTT, which is close to 1820 K, the temperature at which there is experimentally observed solid solution in W 70 Cr 30 alloys [48]. A 0.5–2 at.% addition of Y has lowered the ODTT to 1300 K for W 70 Cr 29.5 Y 0.5 , W 70 Cr 29 Y 1 , W 70 Cr 28.5 Y 1.5 , and W 70 Cr 28 Y 2 alloys, respectively. It should be noted that contrary to previous work on the Cr-Ta-Ti-V-W system [27], where the transition between the disordered state and the ordering of an alloy has been observed, in Cr-Y-W system one can observe the transition towards atom segregation, which is related to the positive values of the enthalpy of mixing (see Figure 5).

3.3. Short-Range Ordering in Derivative Cr-W-Y Alloys

The Warren–Cowley SRO parameter defined by Equation (3) was used to determine the tendency toward ordering/segregation between specific atoms. The average SRO parameters were calculated using Equation (4) from the first and second nearest neighbours SRO parameters.
In Figure 6, the average short-range order parameters for W 70 Cr 30 , equiatomic WCrY, W 70 Cr 29.5 Y 0.5 , W 70 Cr 29 Y 1 , W 70 Cr 28.5 Y 1.5 , and W 70 Cr 28 Y 2 alloys are given. It has been observed that for all five alloys containing Y, the SRO parameter values for the Cr-W pair are coming close 0 above 1500 K, while being positive below that temperature. The most positive SRO parameter values have been observed for the Cr-Y pair. By comparing Figure 6b–e to Figure 6a, it can be concluded that even a small addition of Y (0.5 at.%) resulted in lowering the order–disorder transition temperature for the Cr-W pair from 1700 K for W 70 Cr 30 to 1300 K for alloys containing 0.5–2 at.% of yttrium. No significant differences in SRO parameters below 2500 K between four alloys presented in Figure 6b–e have been observed. In the equiatomic Cr-W-Y alloy (Figure 6f), both Cr-Y and Y-W pairs have shown very strong positive SRO parameter values, even at high temperatures, indicating strong segregation between atoms in those pairs.
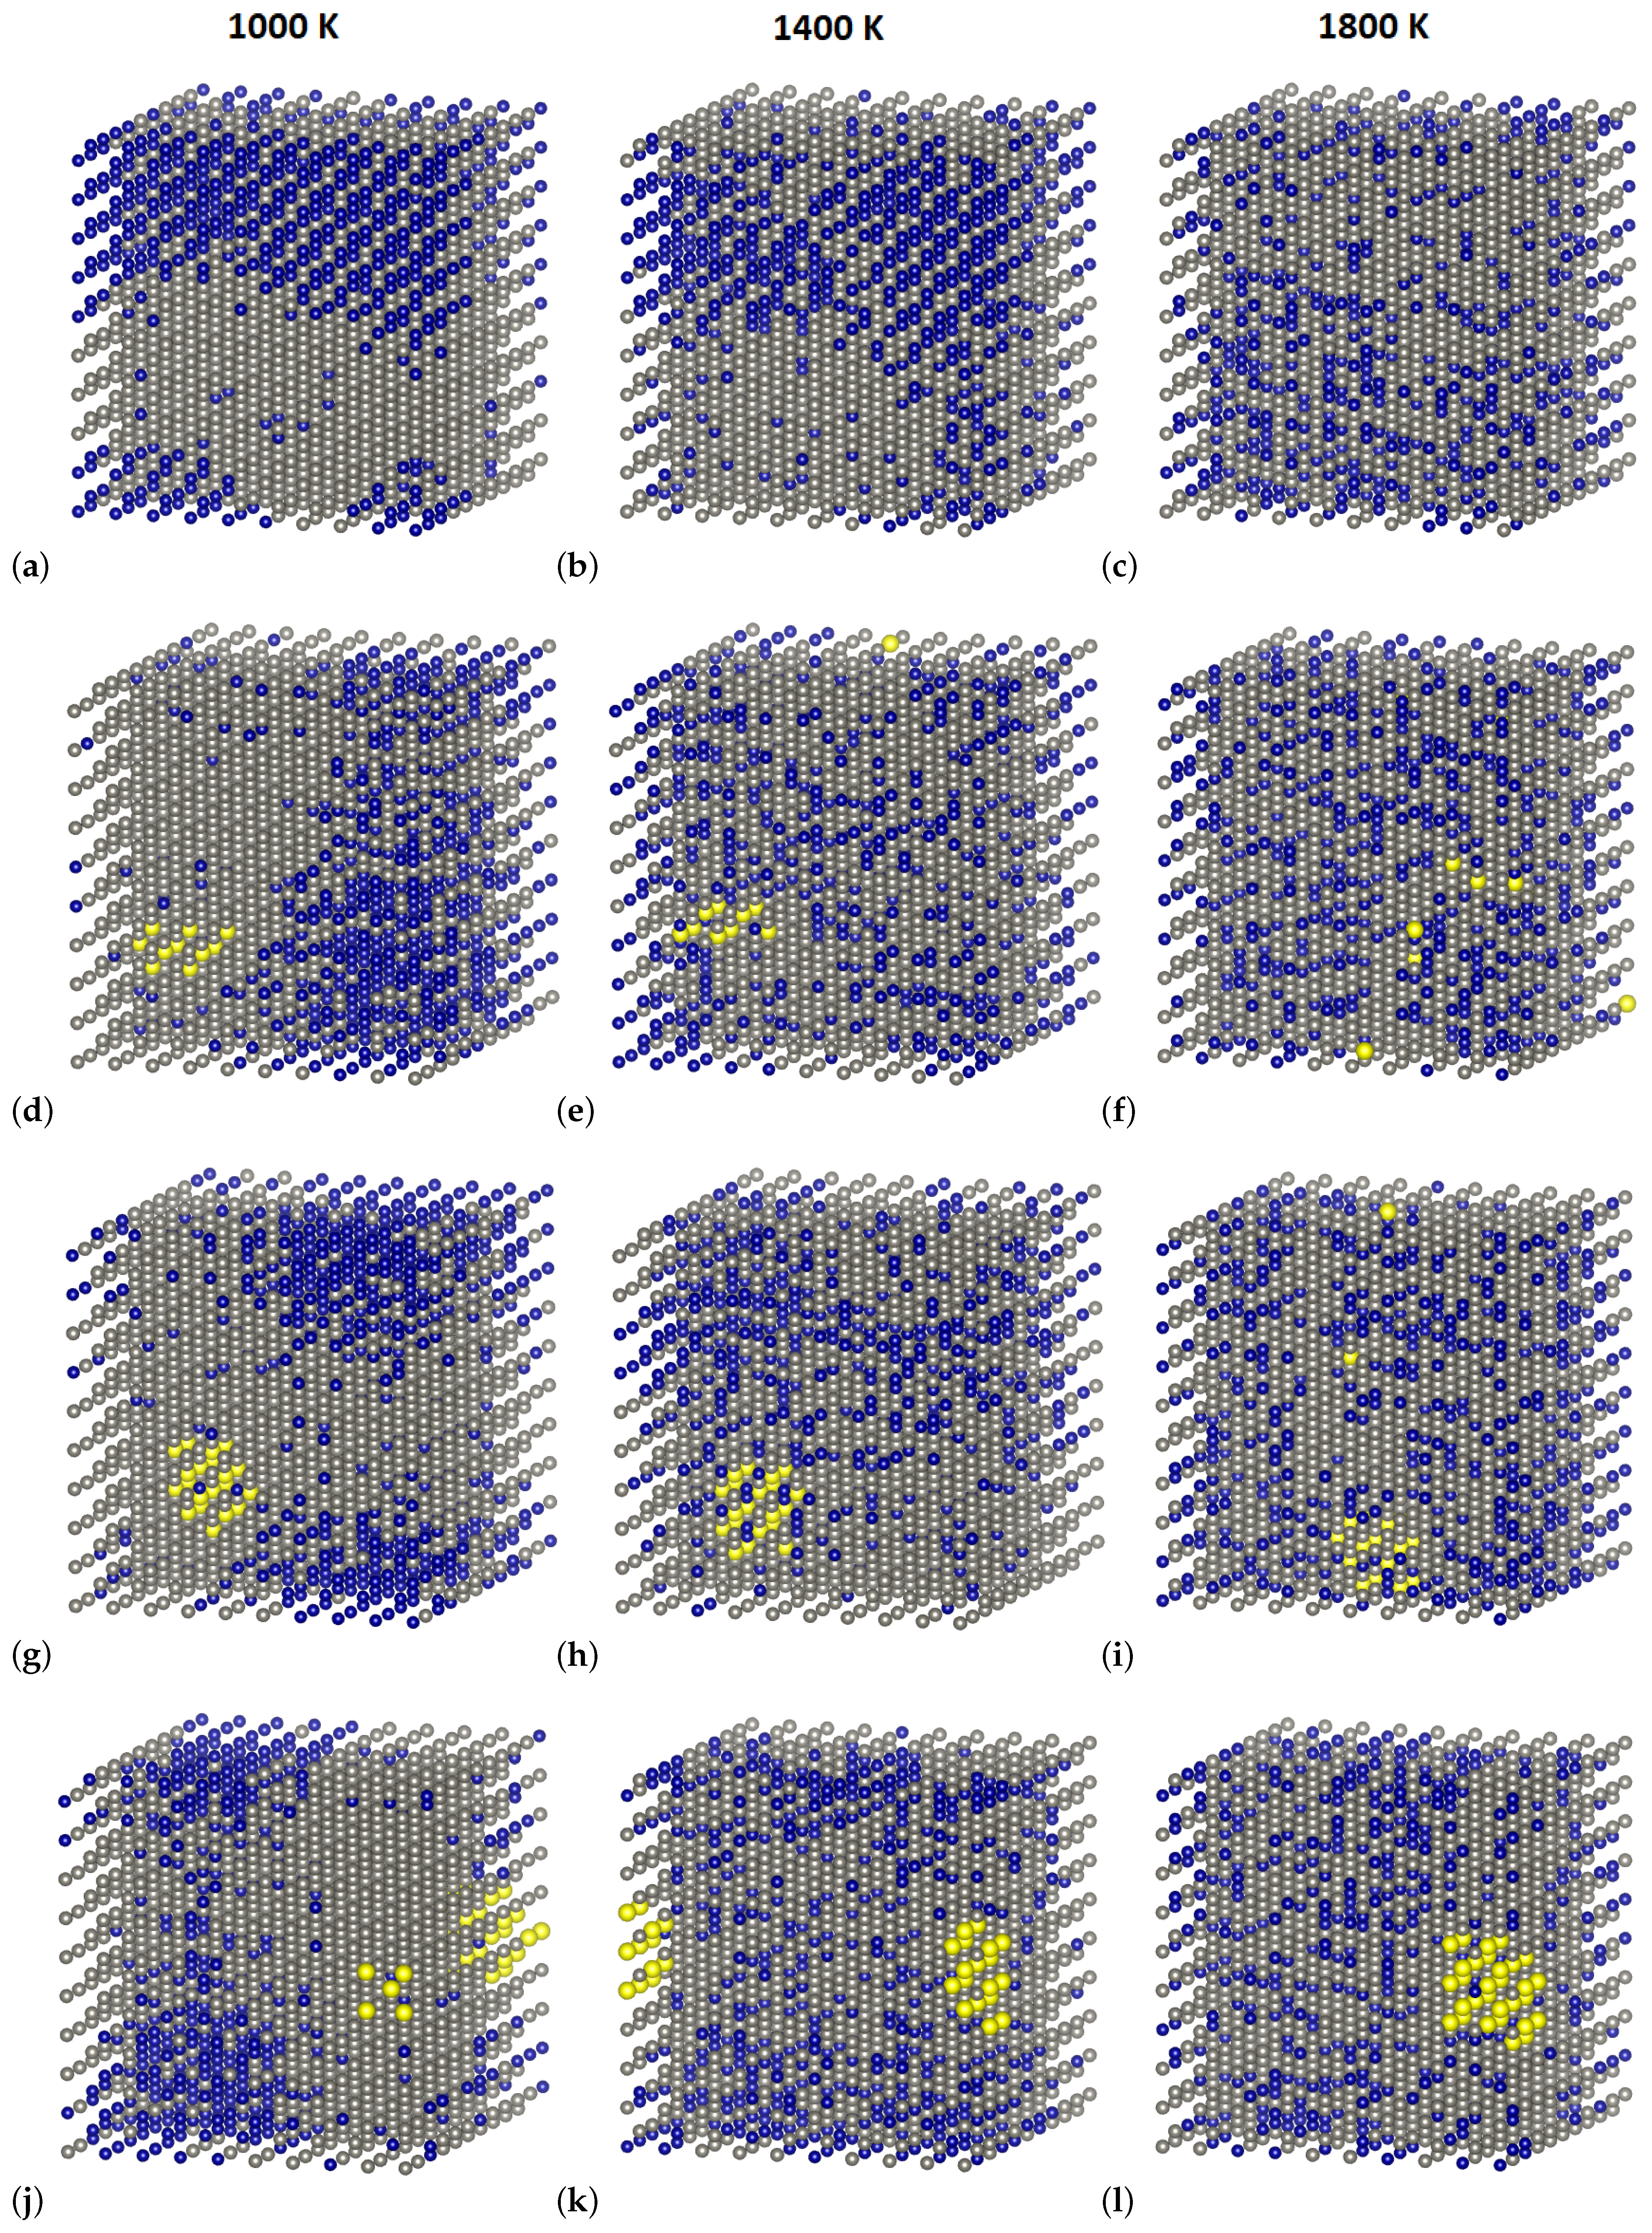
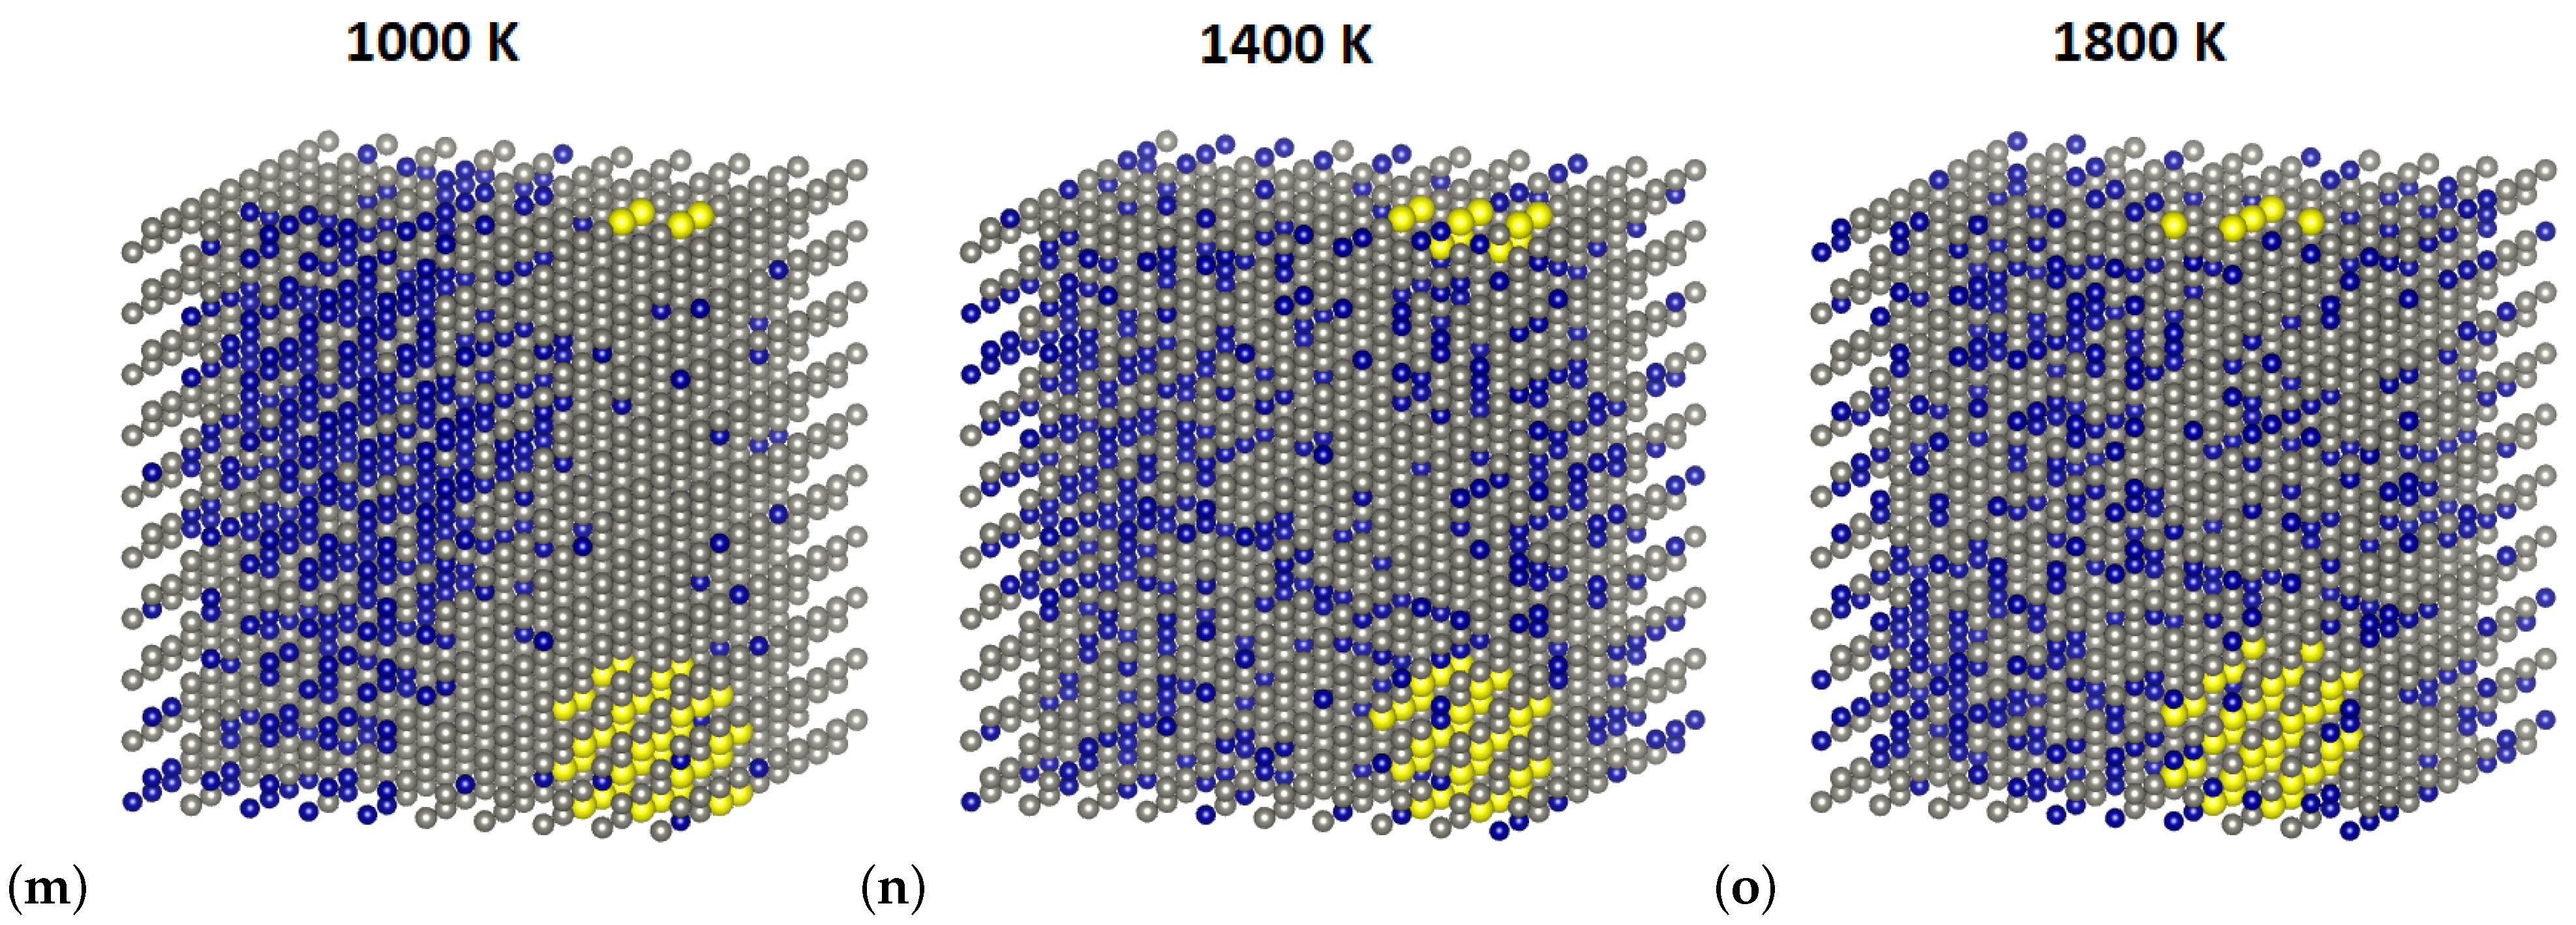
In Figure 7, image structures for the derivative W 70 Cr 30 , W 70 Cr 29.5 Y 0.5 , W 70 Cr 29 Y 1 , W 70 Cr 28.5 Y 1.5 , and W 70 Cr 28 Y 2 alloys at three different temperatures (1000, 1400, and 1800 K) are given. A very strong tendency towards clustering has been observed for Y atoms at 1000 and 1400 K for all alloys containing Y (Figure 7a,b,d,e,g,h,j,k,m,n). It has been noted that at 1800 K for the W 70 Cr 29.5 Y 0.5 alloy, which contains the least amount of Y, clustering of yttrium was no longer observed. Based on Figure 7, it has been concluded that 1 at.% is the minimum concentration of Y required to observe the clustering at 1800 K (Figure 7i). In Figure 7a–c, image structures for W 70 Cr 30 alloy are given at 1000, 1400, and 1800 K, respectively. It has been observed that there is a strong segregation between Cr and W atoms even at 1400 K, while in alloys containing Y, there has been no segregation between Cr and W atoms observed. This is in agreement with ODTT presented in Table 2, where it has been shown that the presence of Y in Cr-W alloys decreases the ODTT.
In Figure 8, the average SRO parameter values for Cr-W pair in W 70 Cr 30 , W 70 Cr 29.5 Y 0.5 , W 70 Cr 29 Y 1 , W 70 Cr 28.5 Y 1.5 , and W 70 Cr 28 Y 2 alloys have been given. It has been observed that the addition of Y, even in very small concentration (0.5 at.%), had a significant influence on the ordering of the Cr-W pair. A shift on the average SRO plot by around 400 K has been observed, resulting in lower ODTT for alloys with addition of Y (1300 K) compared to the W 70 Cr 30 alloy (1700 K). These results are in agreement with ODTT derived from the enthalpies of mixing in Figure 5 and presented in Table 2. No significant influence of continual increase of the Y concentration by 0.5 up to 2 at.% on the Cr-W average SRO, compared to the alloy with 0.5 at.% yttrium, has been observed.

3.4. Free Energy of Mixing of Derivative Cr-W-Y Alloys

In Figure 9, the free energy of mixing, entropy, and enthalpy of mixing has been given for W 70 Cr 29 Y 1 alloy. Entropy contribution to the F m i x has been calculated using the 1st nearest neighbours approximation (1NN). Positive value of the free energy of mixing has been observed in the whole temperature range, with values close to 0 at 1000 K to over 70 meV/atom at 3000 K. The calculated entropy contribution to the free energy of mixing of W 70 Cr 29 Y 1 alloy can be validated by the experimental data suggesting that Y appears to be stabilizing the Cr-W phase via the change in configurational entropy of the system, which increases the solubility of Cr in W [49].

4. Phase Stability of Derivative Cr-Ti-W Alloys

4.1. Phase Stability at 0 K

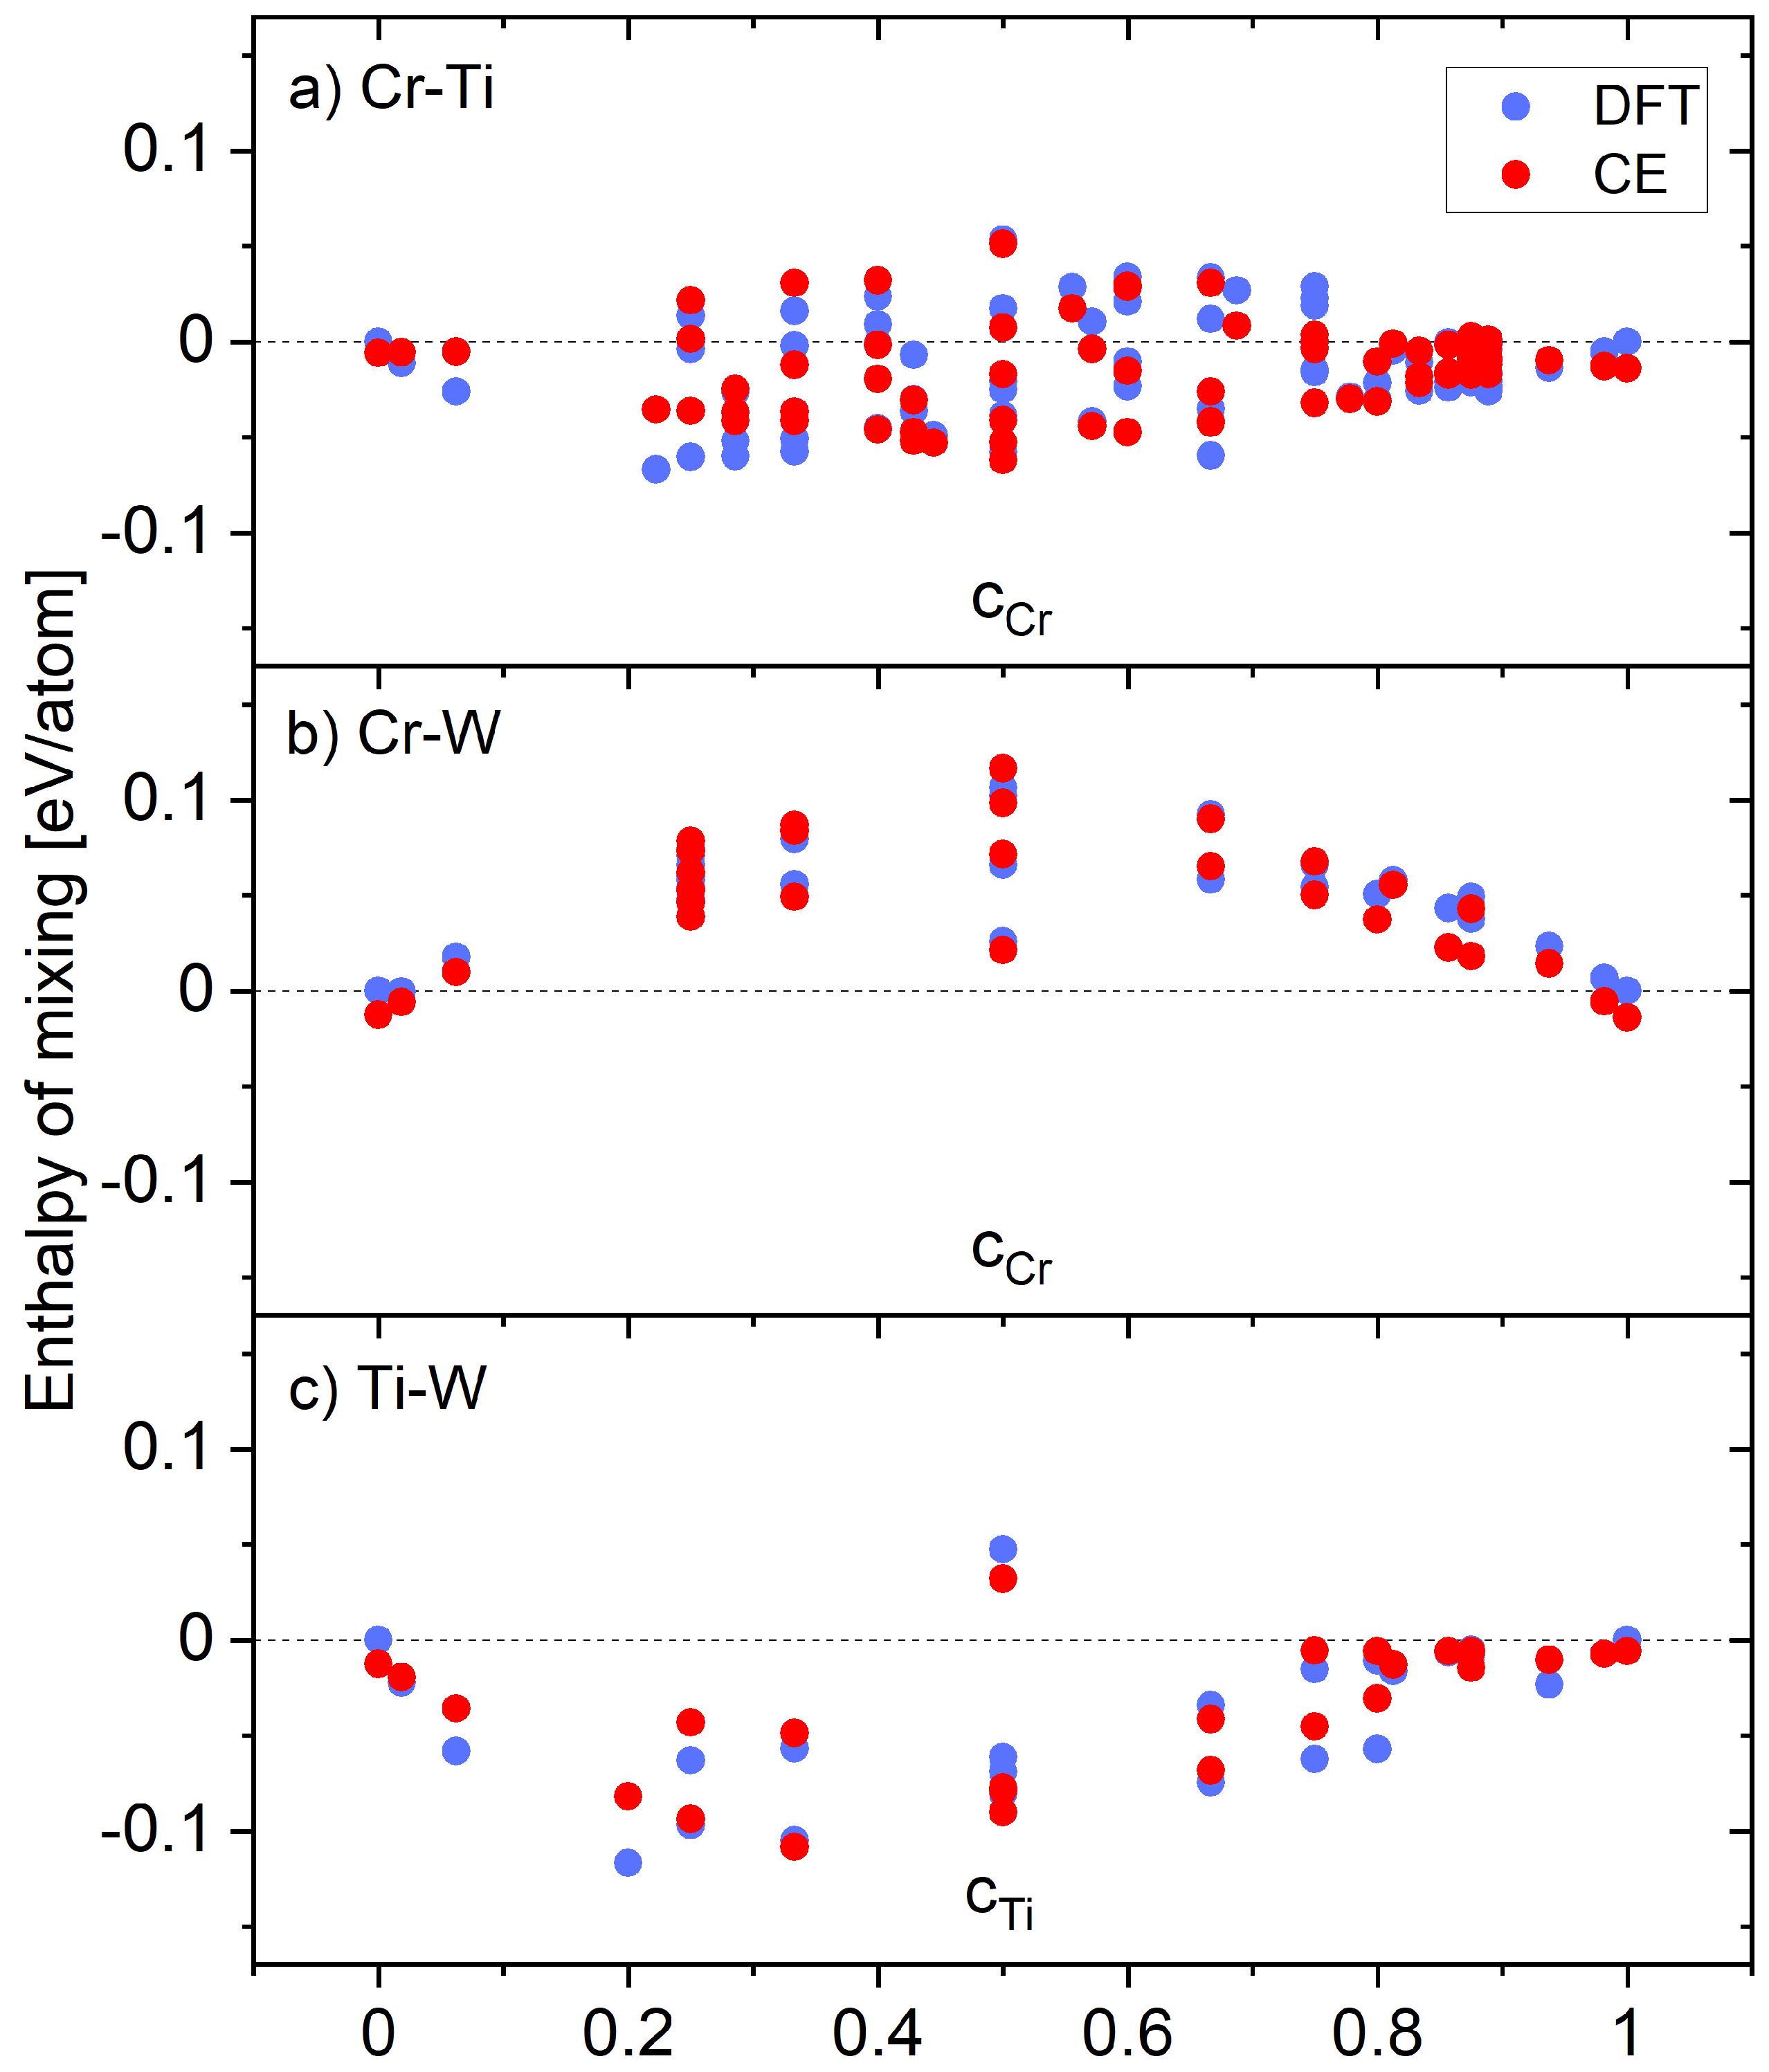
Enthalpies of mixing for binary structures in Cr-Ti-W system were calculated using DFT and CE methods using our previously created model for quinary Cr-Ta-Ti-V-W system [27] and are given in Figure 10. Similarly to the Cr-W-Y case, the enthalpies of mixing were calculated for multiple configurations at a given composition, resulting in the range of values dependant on the atomic positions in specific structures. For the Cr-Ti binary subsystem, there have been observed structures with negative, as well as positive, values of the enthalpy of mixing in the whole concentration range. The lowest value among Cr-Ti binaries has been computed for the Cr 2 Ti 7 structure, with a value as low as −67 meV/atom. In the Cr-W binary subsystem, almost all structures had positive values of the enthalpy of mixing, with the highest one reaching 130 meV/atom at 50-50 composition. Only one structure had a positive value of the enthalpy of mixing in the Ti-W binary subsystem, with the rest being negative, and the lowest observed value being the −117 meV/atom for the TiW 4 structure.

4.2. Finite Temperature Phase Stability and Order–Disorder Transition Temperatures of Cr-Ti-W Alloys

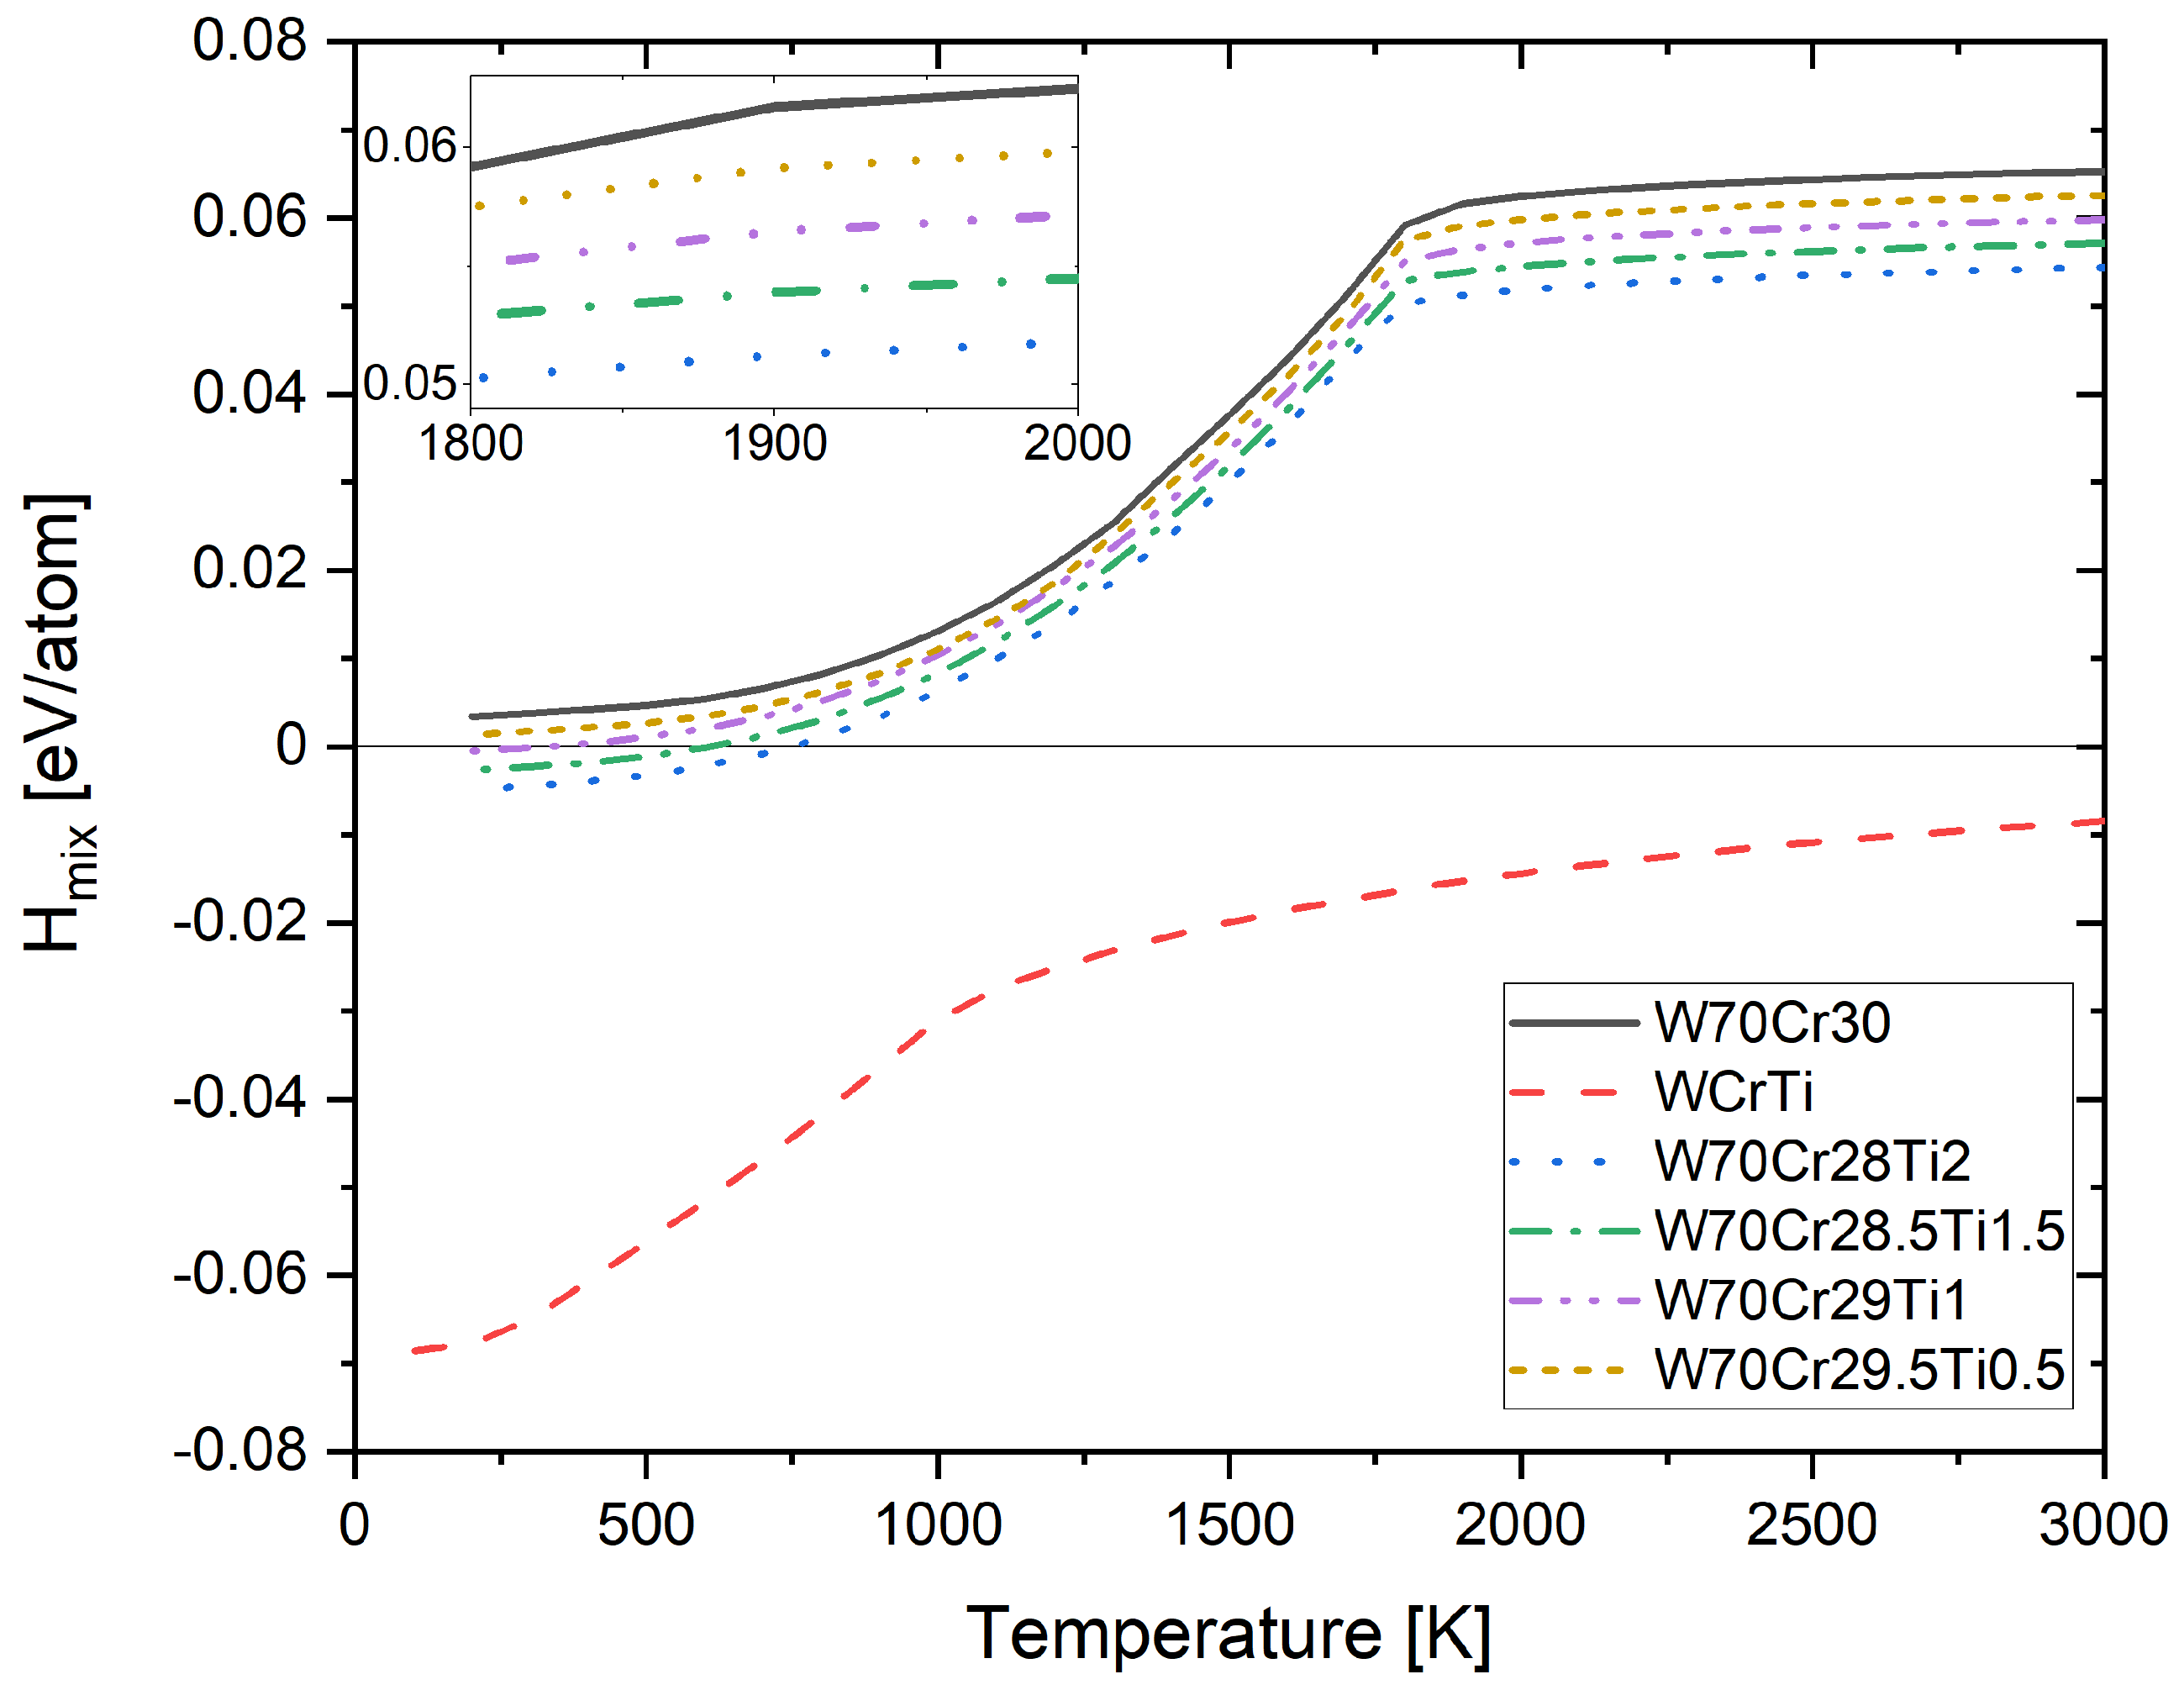
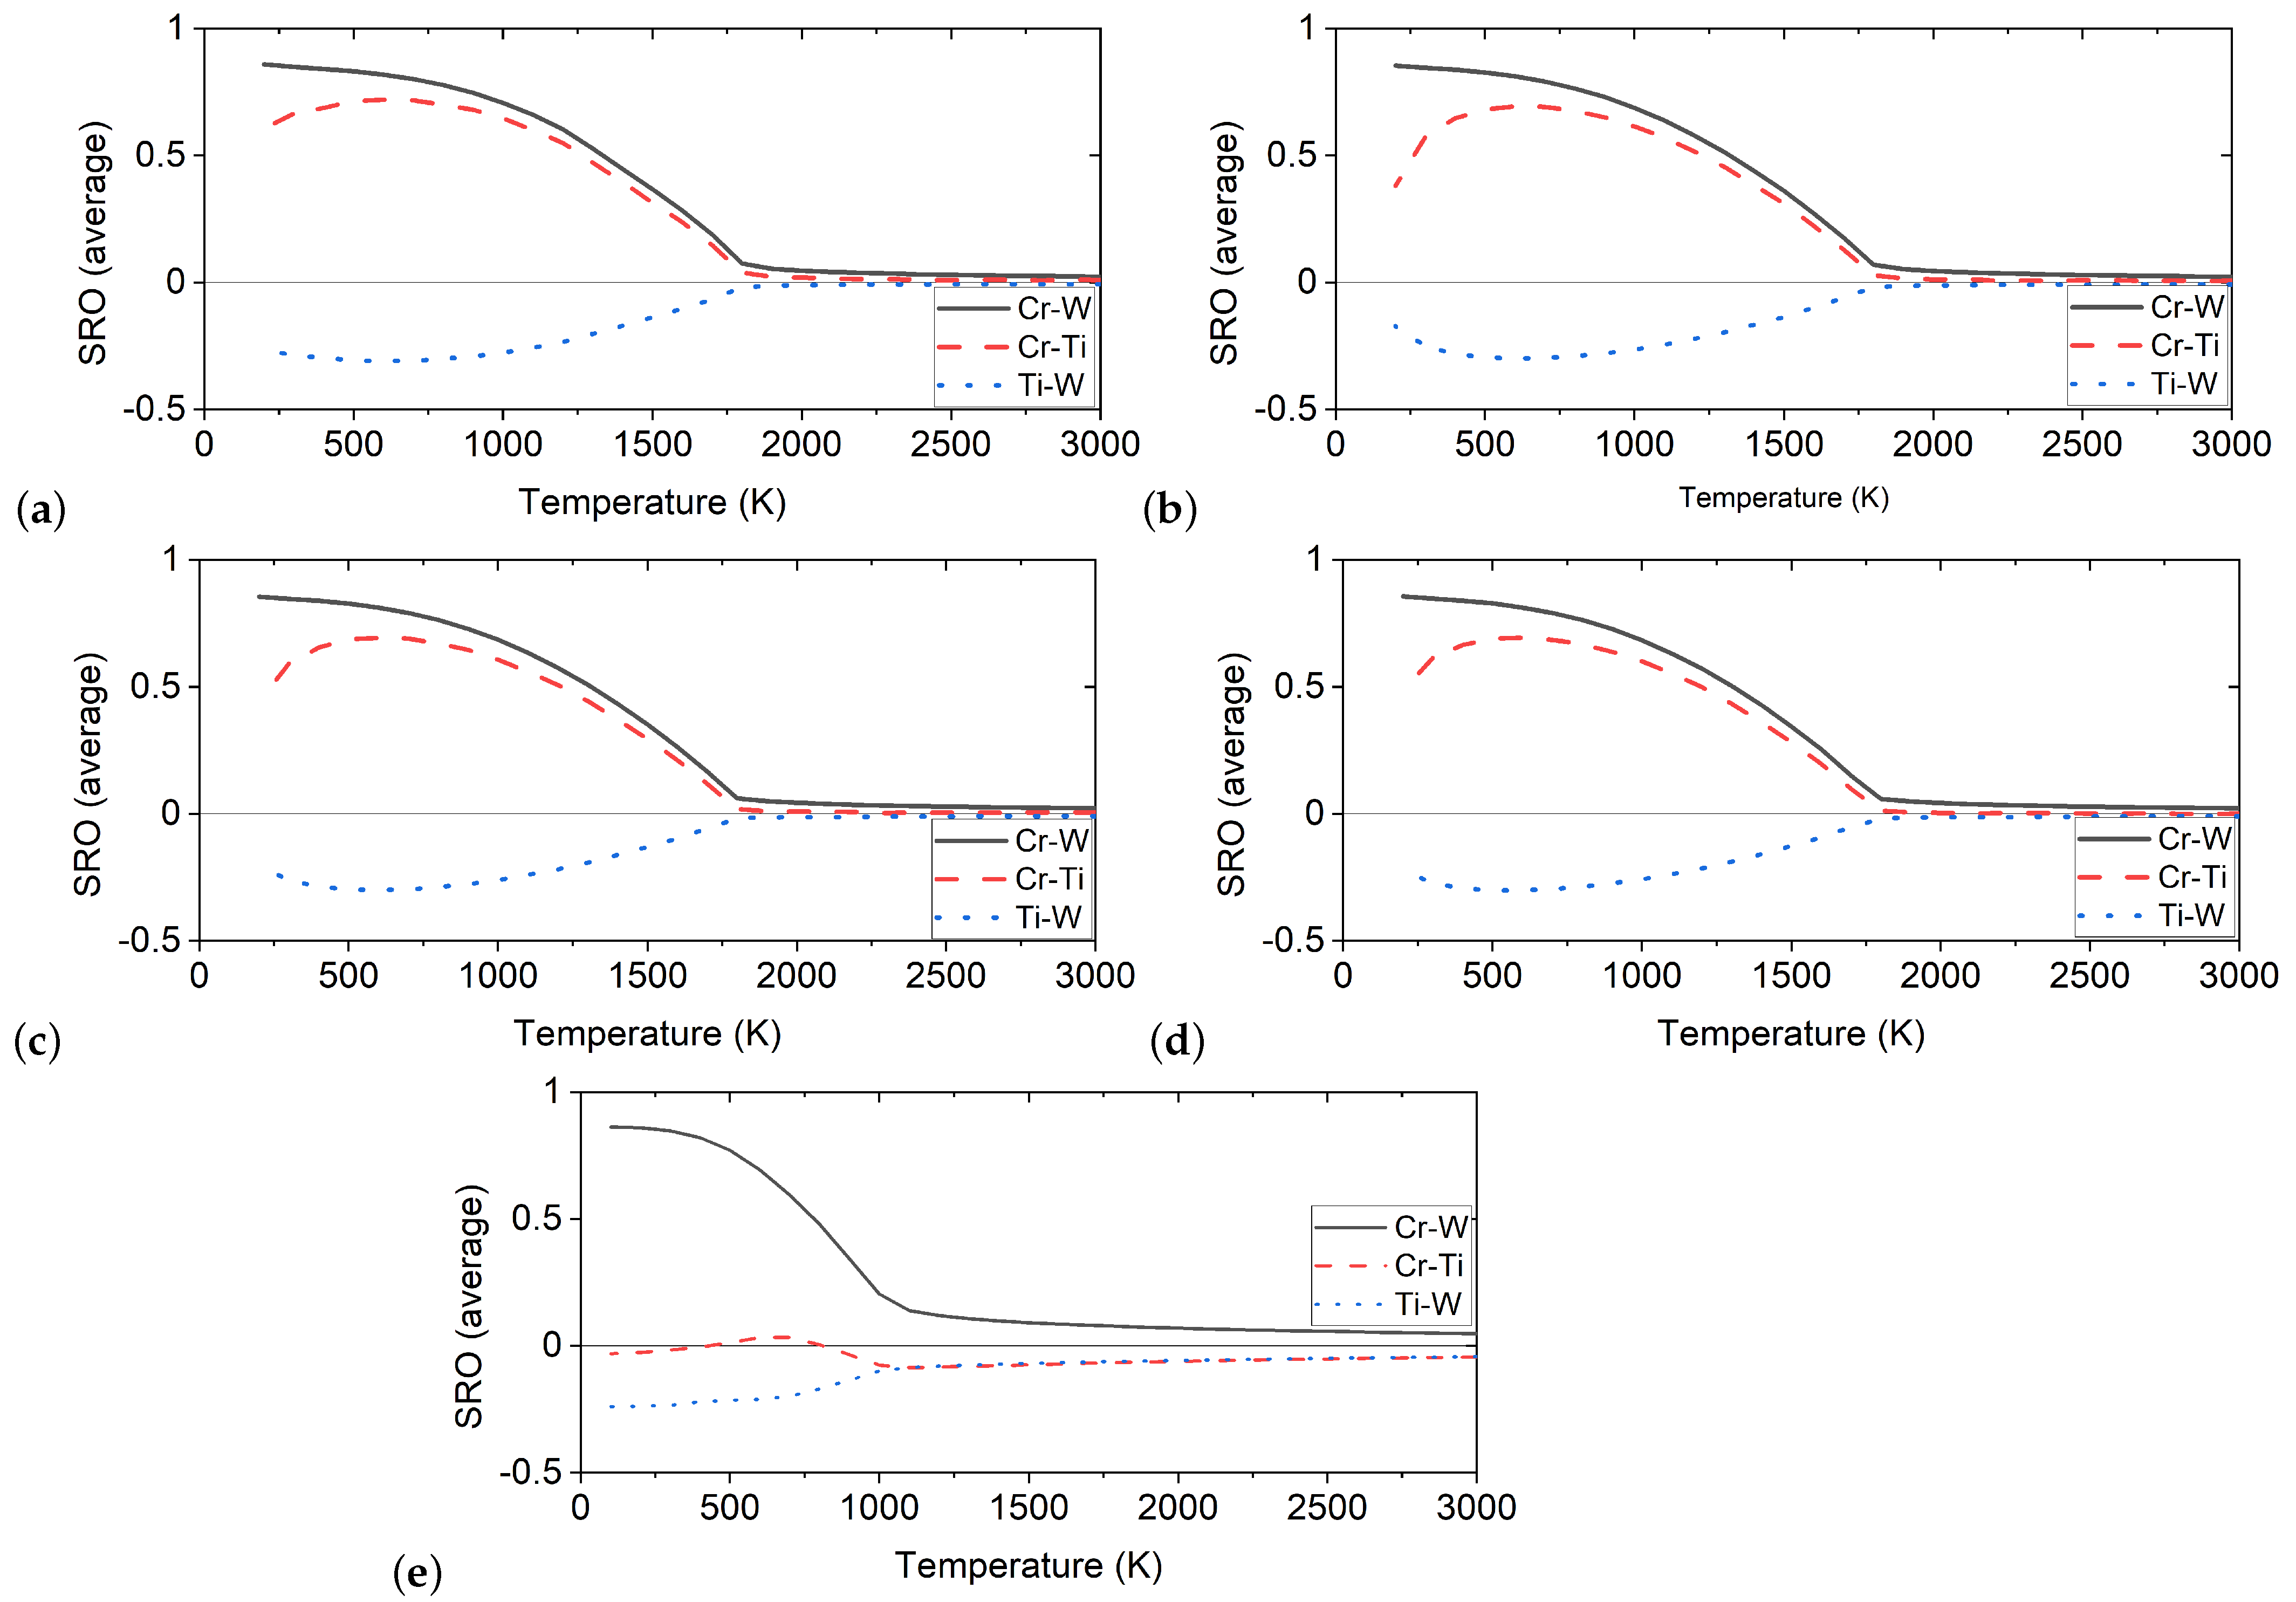
In Figure 11, the enthalpy of mixing as a function of temperature for W 70 Cr 30 , equiatomic WCrTi and derivative W 70 Cr ( 30 x ) Ti x , for x = ( 0.5 ; 1 ; 1.5 ; 2 ) alloys is given. The highest enthalpy of mixing possess the W 70 Cr 30 alloy, with 4 meV/atom at low temperatures, up to 66 meV/atom at 3000 K. By replacing 0.5 at.% of Cr with Ti, the enthalpy of mixing slightly decreased by around 2 meV/atom in the whole temperature range. Further addition of Ti in the place of Cr (up to 2 at.%) results in the same trend with the enthalpy of mixing decreasing by around 2 meV/atom for every 0.5 at.% of Ti added. The lowest enthalpy of mixing in the whole temperature range has been observed for the equiatomic WCrTi alloy, with −69 meV/atom at 100 K up to −9 meV/atom at 3000 K. Despite the positive enthalpy of mixing of structures in the binary Cr-W system, the enthalpy of mixing for the equiatomic WCrTi alloy has been negative in the whole temperature range due to the introduction of Ti. Such shift of the tendency from clustering towards preference for ordering can be explained by the strong attraction between Ti and W, and the slight attraction between Cr and Ti (see Figure 10 and Figure 12e), which despite segregation between Cr and W atoms enables the alloy to become ordered and more stable.
In Table 3, the order–disorder transition temperatures are given for several equiatomic and derivative alloys found in the Cr-Ti-W system. The lowest ODTT have been observed for equiatomic alloy, namely 900 K for WCrTi. The W 70 Cr 30 alloy, which serves as a baseline for understanding the influence of the additions of Ti and Y, has shown 1700 K ODTT. The addition of Ti has not shown any influence on the ODTT.

4.3. Short-Range Ordering in Derivative Cr-Ti-W Alloys

In Figure 12, the average short-range order parameters for ternary W 70 Cr 29.5 Ti 0.5 , W 70 Cr 29 Ti 1 , W 70 Cr 28.5 Ti 1.5 , W 70 Cr 28 Ti 2 , and equiatomic WCrTi alloys are given. Negative values of the SRO parameter have been observed for Ti-W pair below 1800 K, indicating attraction between those atoms, while both Cr-Ti and Cr-W have shown strongly positive SRO parameter values below 1800 K. There have not been any observed differences in Cr-W pair behaviour in W 70 Cr 30 alloy (Figure 6a) compared to alloys containing up to 2 at.% of Ti (Figure 12a–d).
In Figure 13, structure images for W 70 Cr 29 Ti 1 alloy at 1000 K, 1400 K, and 1800 K have been given. It has been observed that, contrary to the behaviour of Y, Ti is not forming Ti-rich clusters even at low temperatures. Ti atoms are mostly spread within the W-rich regions, which is consistent with results presented in Figure 12b, where it has been shown that the Ti-W pair has negative SRO parameters and thus a tendency to attract each other.
In Figure 14, the average SRO parameter values for Cr-W pair in W 70 Cr 30 , W 70 Cr 29.5 Ti 0.5 , W 70 Cr 29 Ti 1 , W 70 Cr 28.5 Ti 1.5 , and W 70 Cr 28 Ti 2 alloys have been given. It has been observed that the addition of Ti, did not have any significant influence on the ordering of Cr-W pair compared to the W 70 Cr 30 . The observed ODTT has been the same for all analysed alloys (1700 K) and is in agreement with the ODTT derived from enthalpies of mixing (Figure 11) and presented in Table 3.

4.4. Free Energy of Mixing of Derivative Cr-Ti-W Alloys

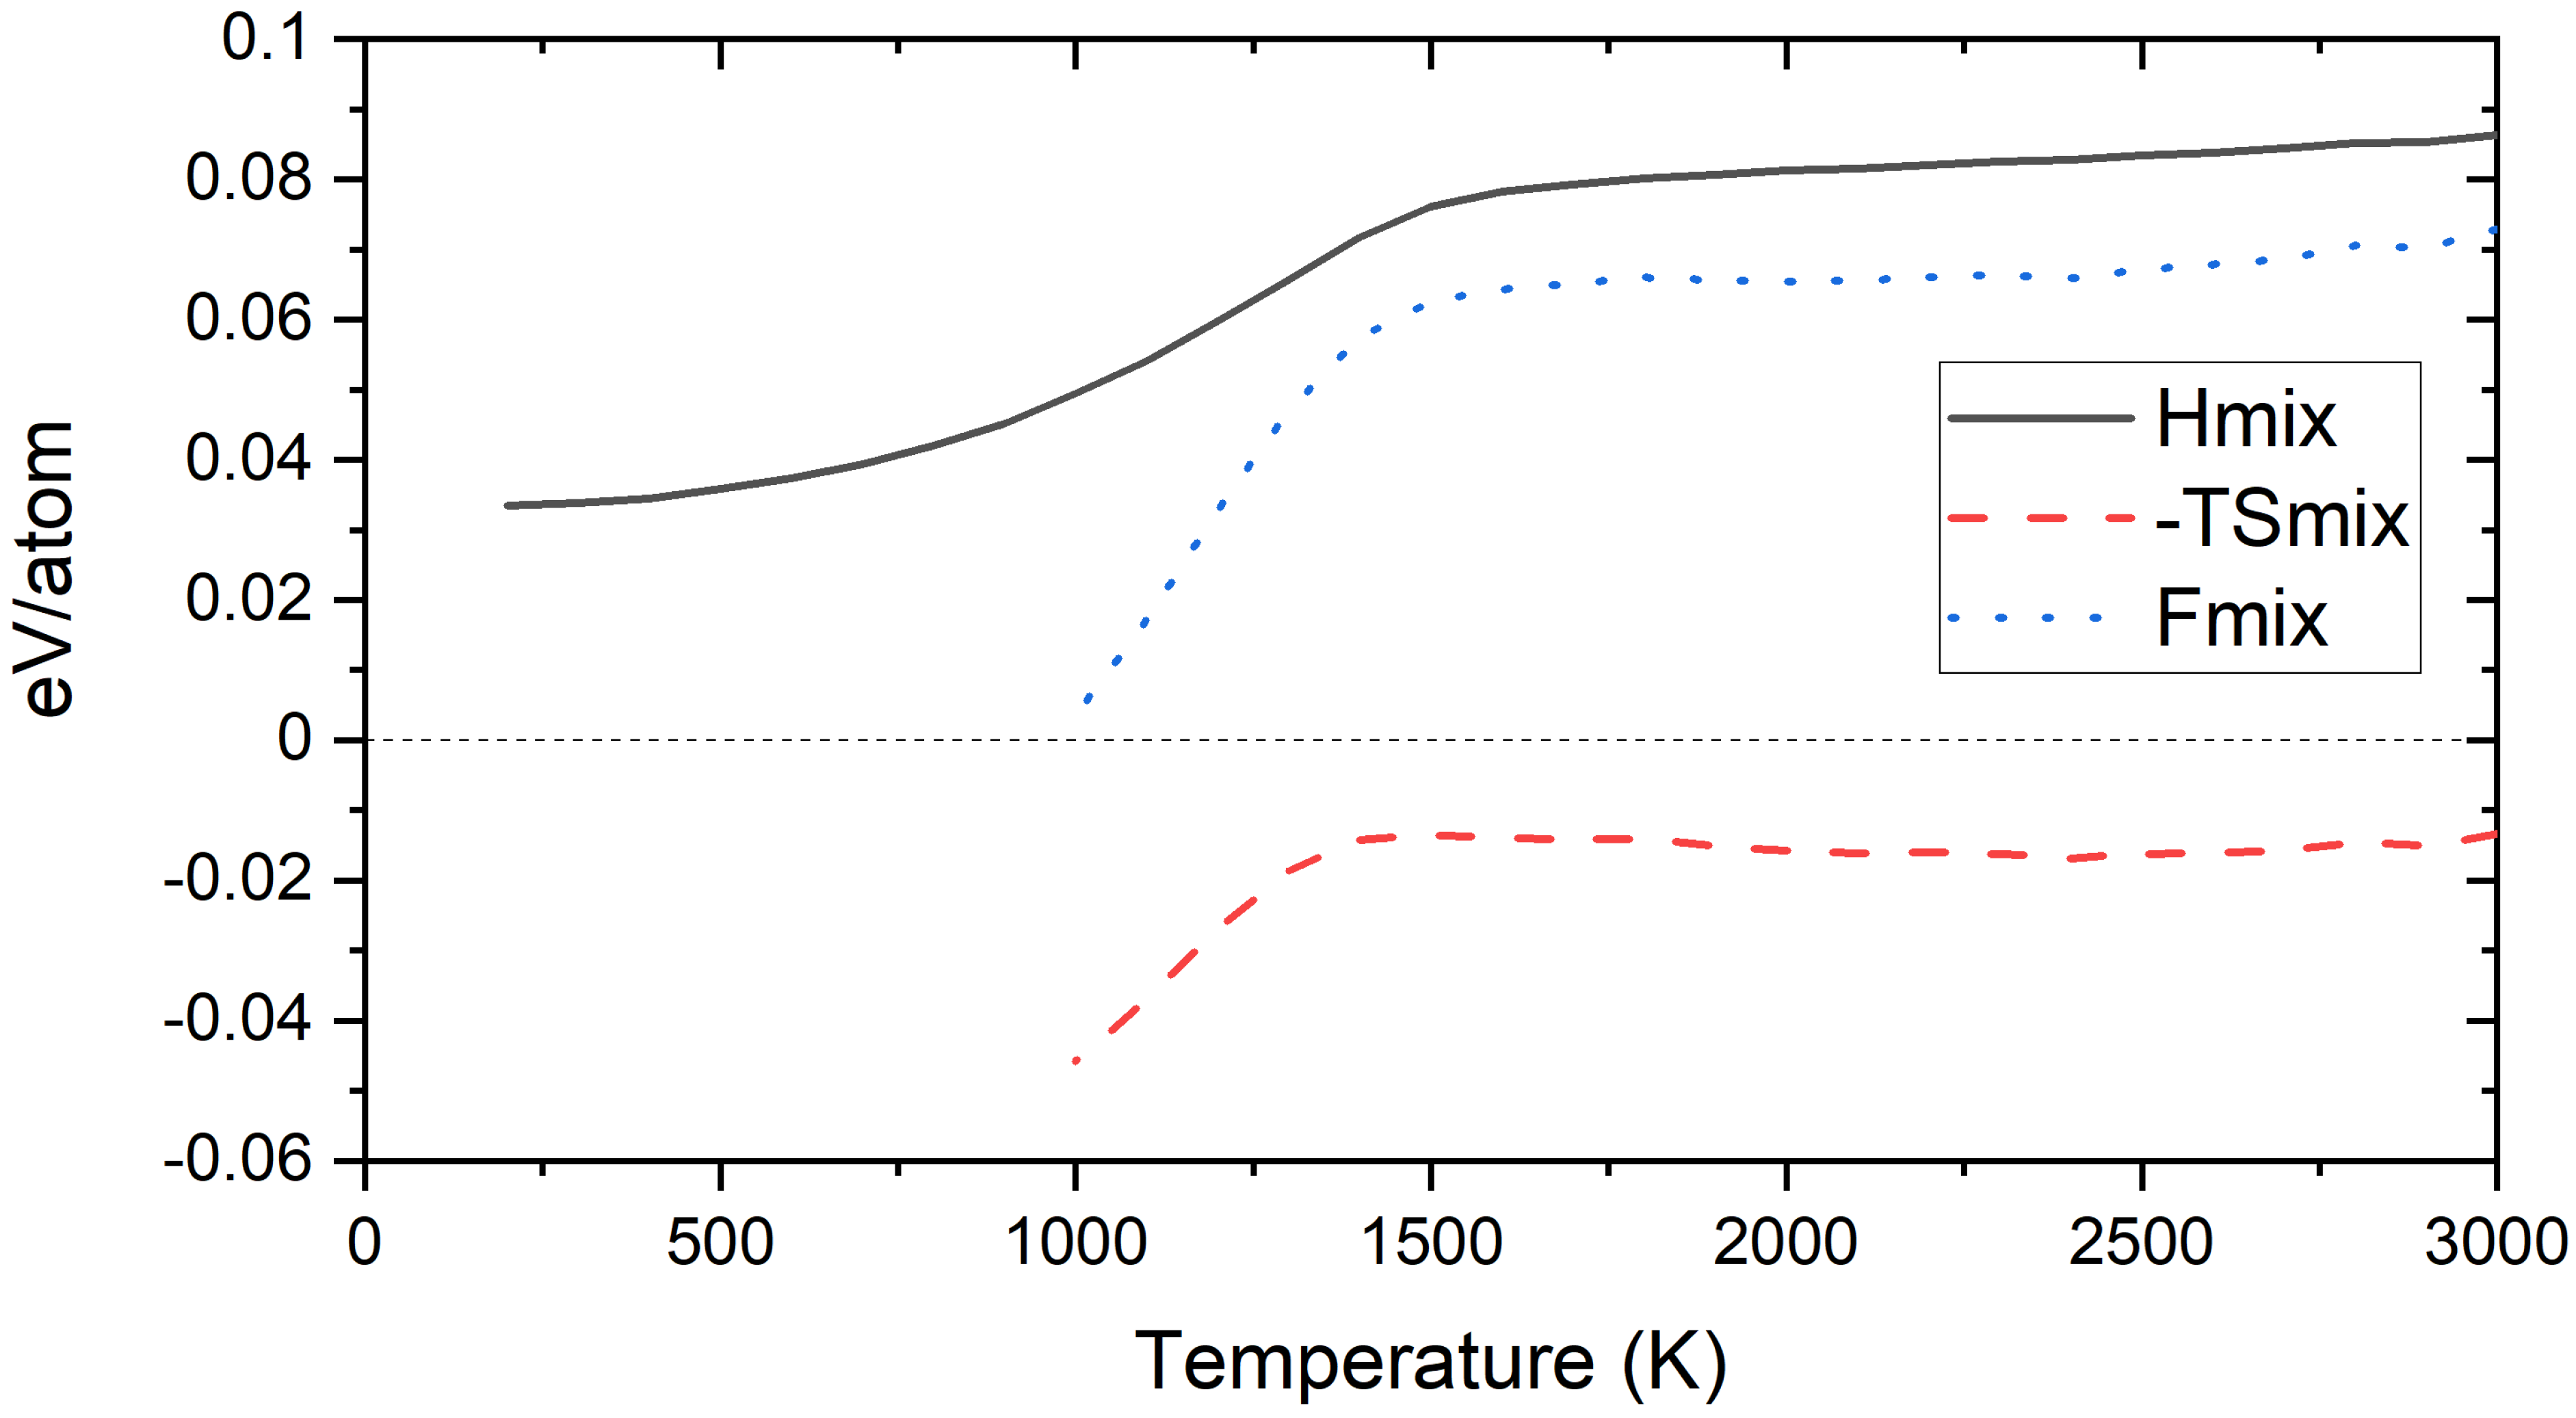
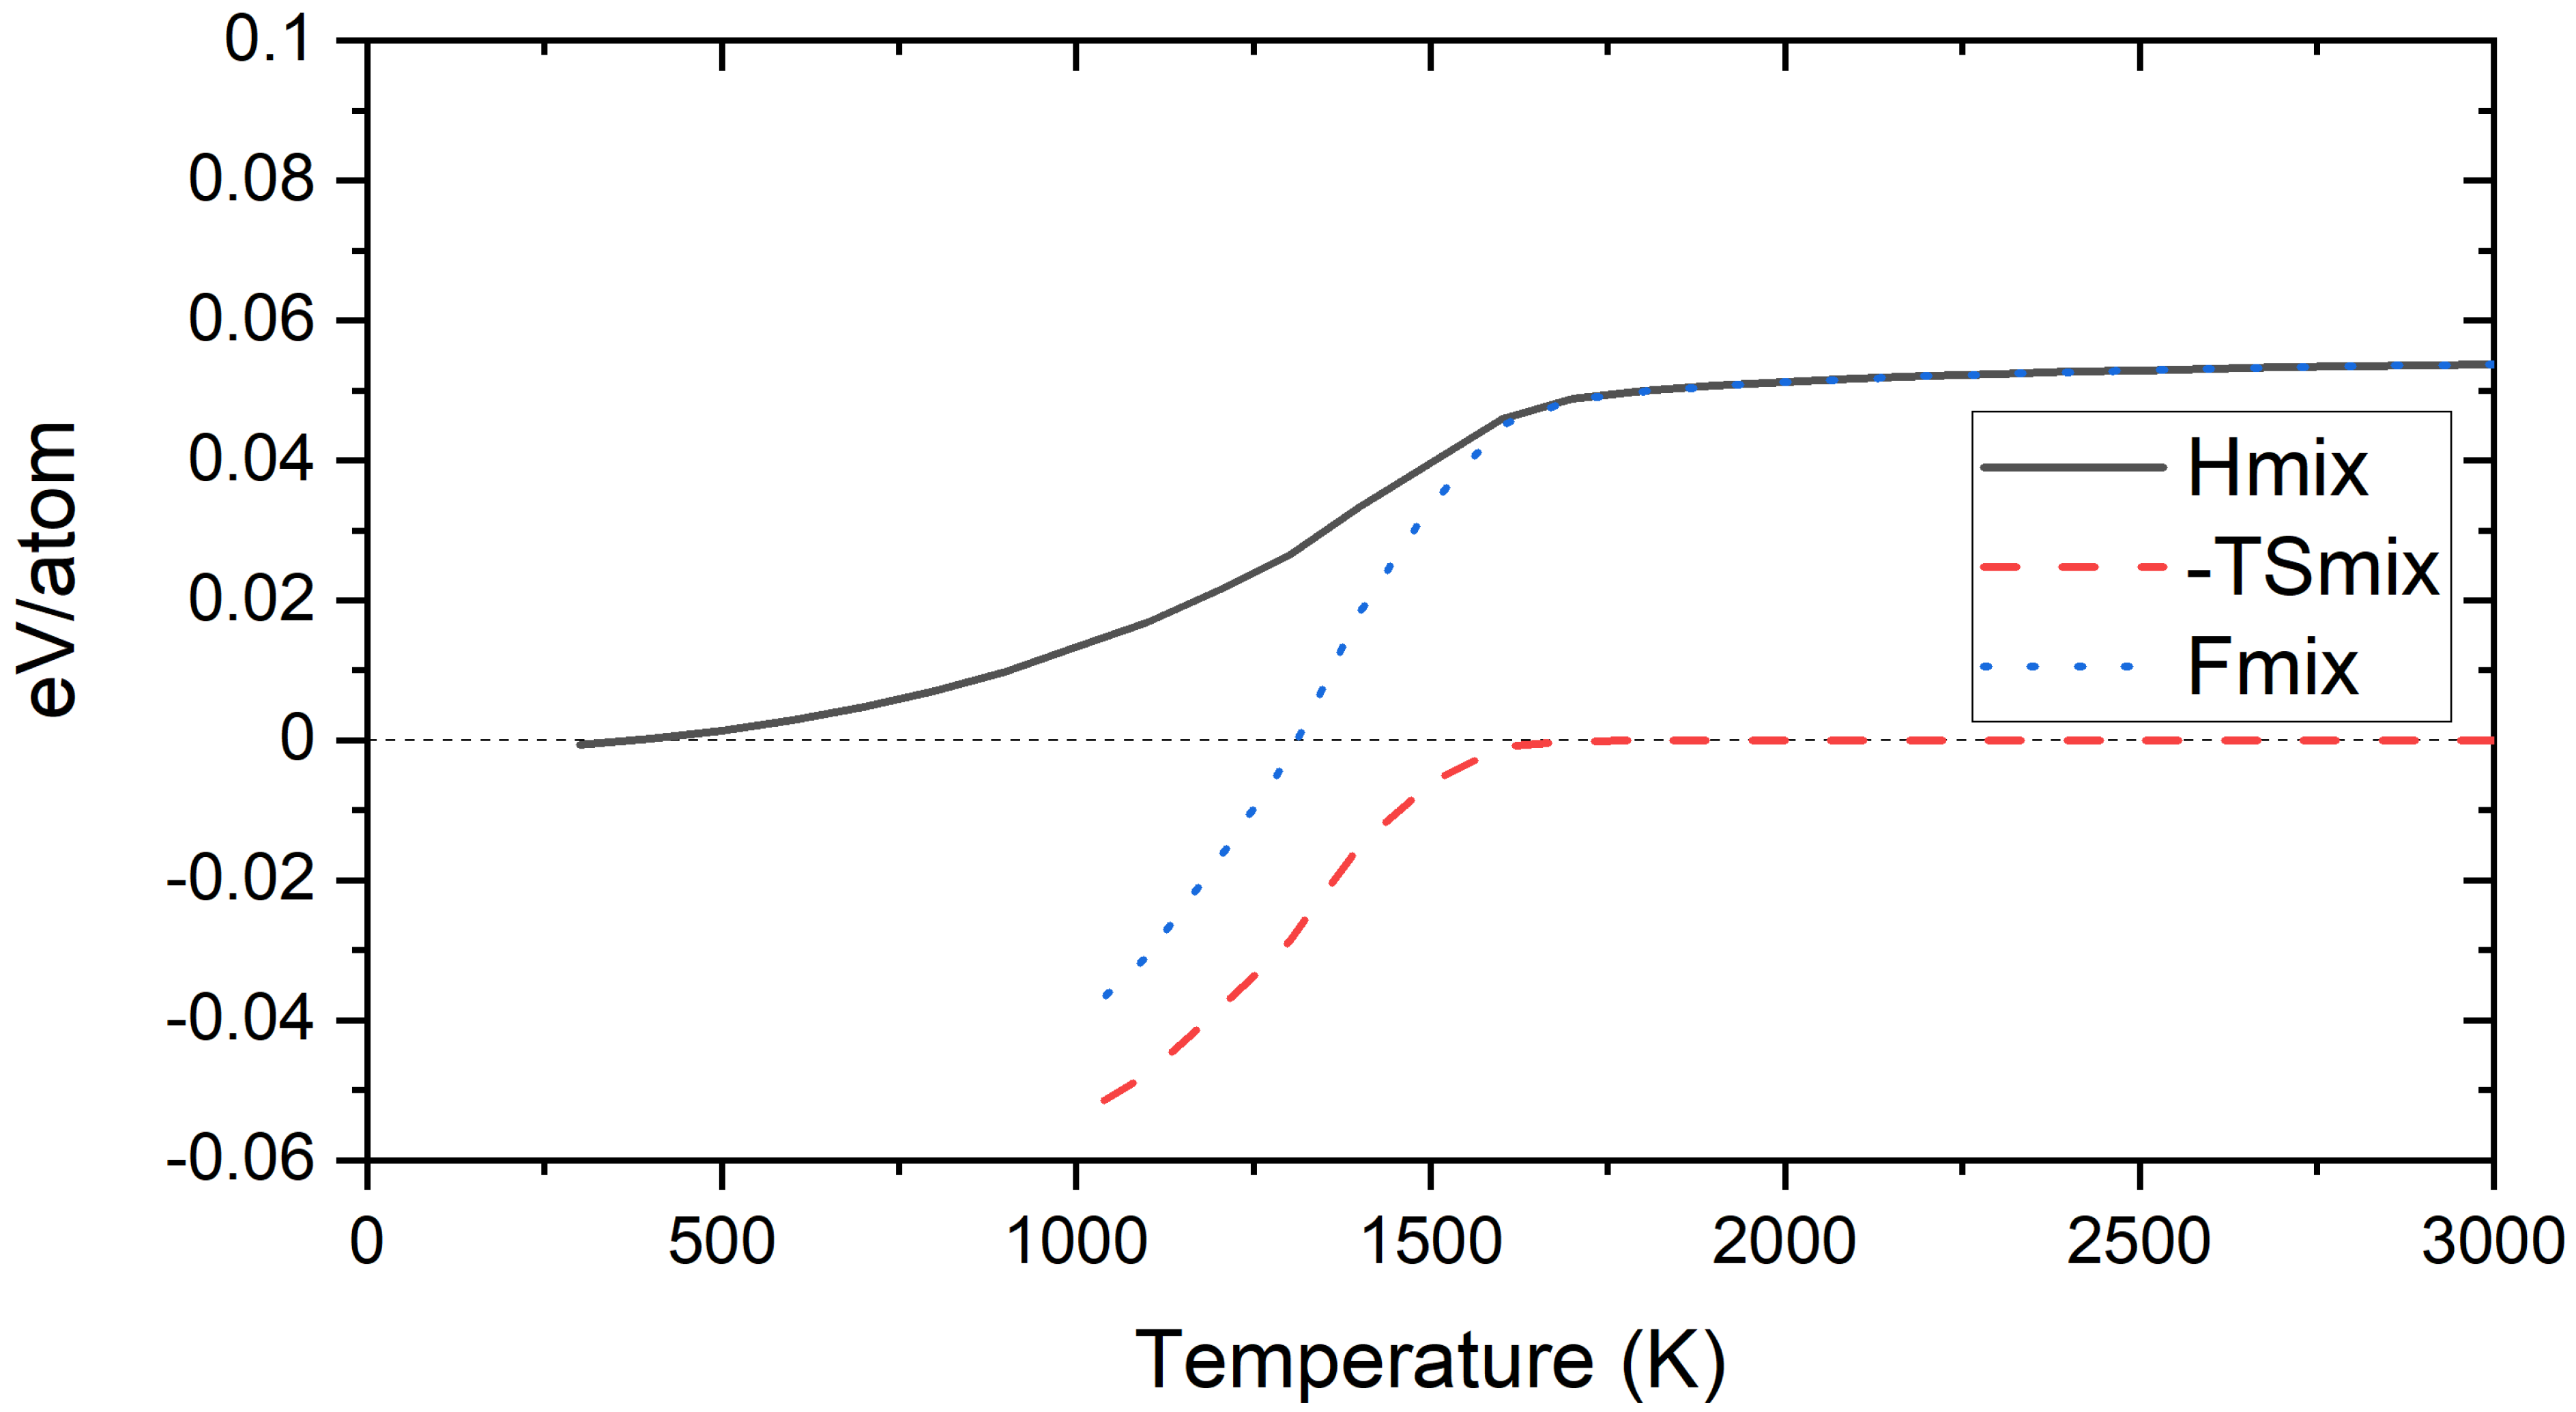
In Figure 15, the free energy of mixing, entropy, and enthalpy of mixing has been given for W 70 Cr 29 Ti 1 alloy. Entropy contribution to the F m i x has been calculated using the 1st nearest neighbours approximation (1NN). A negative value of the free energy of mixing has been observed below 1300 K, as low as −40 meV/atom at 1000 K, and positive above 1300 K up to 52 meV/atom at 3000 K.

5. Conclusions

A DFT-based Cluster Expansion model has been developed for the ternary bcc Cr-W-Y system. All binary structures investigated in this system from DFT calculations showed positive enthalpies of mixing, with Cr-Y and W-Y pairs being much more positive than Cr-W pairs. Previously developed model for quinary Cr-Ta-Ti-V-W system has been used to analyse ternary Cr-Ti-W alloys. Most of the Cr-Ti and Ti-W binary structures had negative values of the enthalpy of mixing.
CE Hamiltion for MC simulations has been developed to analyse the phase stability and the short-range ordering in the derivative W 70 Cr ( 30 x ) Y x (for x = ( 0.5 ; 1 ; 1.5 ; 2 ) ) alloys. The addition of Y to W 70 Cr 30 alloy, even at very low concentrations, resulted in the decrease of the ordering between Cr and W by 400 K from 1700 to 1300 K. A strong tendency towards clustering at elevated temperatures, as high as the 1800 K, has been observed for Y atoms in alloys containing at least 1 at.% yttrium.
Monte–Carlo simulations for derivative ternary W 70 Cr ( 30 x ) Ti x (for x = ( 0.5 ; 1 ; 1.5 ; 2 ) ) alloys based on the previously created Cr-Ta-Ti-V-W system have been carried out to compare the influence of the Ti on the ordering in W 70 Cr 30 alloy. The addition of Ti has not shown any influence on the ODTT of analysed alloys, as the ODTT for alloys containing between 0.5 at.% and 2 at.% of Ti had ODTT of 1700 K, same as the W 70 Cr 30 alloy.
The difference in the ODTT and clustering of the W 70 Cr ( 30 x ) Y x alloys compared to the W 70 Cr ( 30 x ) Ti x alloys can be explained by the nature of interactions between atoms in those alloys. As shown in Figure 12, the SRO parameter for Ti-W pair is negative, which results in Ti atoms to be present inside W-rich regions and it can be observed in Figure 13. The attraction between Ti and W inhibits formation of Ti-rich clusters. The SRO parameter is positive for all pairs in Cr-W-Y system, which results in separation between Cr-rich, W-rich, and Y-rich regions and favours Y-rich clusters formation.
Our MC simulations showed that for the W 70 Cr 29 Y 1 alloy the enthalpy of mixing value is positive in the whole analysed temperature range. Free energy of mixing has also been derived from the first nearest neighbours approximation for the W 70 Cr 29 Y 1 and W 70 Cr 29 Ti 1 alloys, at temperatures above 1000 K. It has been found out, that for the W 70 Cr 29 Y 1 alloy the F m i x value is positive in the whole analysed temperature range, while for the W 70 Cr 29 Ti 1 the F m i x is negative below 1300 K.
The results of the present investigations provide an insight enabling for optimizing chemical composition of materials for future plasma facing components. The differences between yttrium and titanium influence on the Cr-W phase stability may be found helpful for selecting alloying elements beyond Ti/Y for PFM. Present study suggests, that highly positive values of the enthalpy of mixing between the alloying element and Cr/W, may result in the decrease of the ODTT of studied alloys.

Author Contributions

Conceptualization, D.S., J.S.W., M.R.G., A.L., F.K., K.J.K., and D.N.-M.; data curation, D.S. and J.S.W.; formal analysis, D.S., J.S.W., and D.N.-M.; funding acquisition, J.S.W., A.L., and D.N.-M.; investigation, D.S., J.S.W., M.R.G., A.L., F.K., K.J.K., and D.N.-M.; methodology, D.S., J.S.W., and D.N.-M.; project administration, J.S.W., A.L., and D.N.-M.; resources, J.S.W. and D.N.-M.; supervision, J.S.W., A.L., and D.N.-M.; validation, J.S.W. and A.L.; visualization, D.S. and M.R.G.; writing—original draft, D.S., J.S.W., M.R.G., and D.N.-M.; writing—review and editing, D.S., J.S.W., M.R.G., A.L., F.K., K.J.K., and D.N.-M. All authors have read and agreed to the published version of the manuscript.

Funding

This work has been carried out within the framework of the EUROfusion Consortium and has received funding from the Euratom research and training programme 2014–2018 and 2019–2020 under grant agreement No. 633053. The views and opinions expressed herein do not necessarily reflect those of the European Commission. The work at Warsaw University of Technology has been carried out as a part of an international project co-financed from the funds of the program of the Polish Minister of Science and Higher Education entitled “PMW” in 2019; Agreement No. 5018/H2020-Euratom/ 2020/2. MRG and DNM acknowledge funding from the RCUK [grant number EP/T012250/1].

Institutional Review Board Statement

Not applicable.

Informed Consent Statement

Not applicable.

Data Availability Statement

The data presented in this study are available on request from the corresponding author. The data are not publicly available due to large size of files.

Acknowledgments

The simulations were carried out with the support of the Interdisciplinary Centre for Mathematical and Computational Modelling (ICM), University of Warsaw, under grant No. GB79-6. JSW and DNM would like to acknowledge the support from high-performing computing facility MARCONI (Bologna, Italy) provided by EUROfusion.

Conflicts of Interest

The authors declare no conflict of interest.

Abbreviations

The following abbreviations are used in this manuscript:
1NNFirst Nearest Neighbours
BCCBody-Centered Cubic
CECluster Expansion
DEMOEuropean demonstration fusion power plant
DFTDensity Functional Theory
LLWLow Level Waste
LOCALoss-Of-Coolant Accident
MCMonte Carlo
ODTTOrder-Disorder Transition Temperature
PFMPlasma-Facing-Materials
PAWProjector Augmented Wave
SROShort-Range Order
TENDLTruly general-purpose nuclear data library
VASPVienna Ab-initio Simulation Package

References

  1. Klein, F.; Gilbert, M.R.; Litnovsky, A.; Gonzalez-Julian, J.; Weckauf, S.; Wegener, T.; Schmitz, J.; Linsmeier, C.; Bram, M.; Coenen, J.W. Tungsten–chromium–yttrium alloys as first wall armor material: Yttrium concentration, oxygen content and transmutation elements. Fusion Eng. Des. 2020, 158, 111667. [Google Scholar] [CrossRef]
  2. Litnovsky, A.; Schmitz, J.; Klein, F.; De Lannoye, K.; Kreter, A.; Rasinski, M.; Coenen, J.W.; Linsmeier, C.; Gonzalez-Julian, J.; Bram, M.; et al. Smart Tungsten-based Alloys for a First Wall of DEMO. Fusion Eng. Des. 2020, 159, 111742. [Google Scholar] [CrossRef]
  3. Riccardi, B.; Montanari, R.; Casadei, M.; Costanza, G.; Filacchioni, G.; Moriani, A. Optimisation and characterisation of tungsten thick coatings on copper based alloy substrates. J. Nucl. Mater. 2006, 352, 29–35. [Google Scholar] [CrossRef] [Green Version]
  4. Lloyd, M.J.; Abernethy, R.G.; Gilbert, M.R.; Griffiths, I.; Bagot, P.A.J.; Nguyen-Manh, D.; Moody, M.P.; Armstrong, D.E.J. Decoration of voids with rhenium and osmium transmutation products in neutron irradiated single crystal tungsten. Scr. Mater. 2019, 173, 96–100. [Google Scholar] [CrossRef]
  5. El-Atwani, O.; Li, N.; Li, M.; Devaraj, A.; Baldwin, J.K.S.; Schneider, M.M.; Sobieraj, D.; Wróbel, J.S.; Nguyen-Manh, D.; Maloy, S.A.; et al. Outstanding radiation resistance of tungsten-based high-entropy alloys. Sci. Adv. 2019, 5, aav2020. [Google Scholar] [CrossRef] [Green Version]
  6. Gilbert, M.R.; Eade, T.; Bachmann, C.; Fischer, U.; Taylor, N.P. Activation, decay heat, and waste classification studies of the European DEMO concept. Nucl. Fusion 2017, 57, 046015. [Google Scholar] [CrossRef] [Green Version]
  7. Schmitz, J.; Litnovsky, A.; Klein, F.; De Lannoye, K.; Kreter, A.; Rasinski, M.; Breuer, U.; Gonzalez-Julian, J.; Bram, M.; Coenen, J.W.; et al. On the plasma suitability of WCrY smart alloys—the effect of mixed D+Ar/He plasmas. Phys. Scr. 2020, T171, 014002. [Google Scholar] [CrossRef]
  8. Schmitz, J.; Litnovsky, A.; Klein, F.; Tan, X.Y.; Breuer, U.; Rasinski, M.; Ertmer, S.; Kreter, A.; Gonzalez-Julian, J.; Bram, M.; et al. Argon-seeded plasma exposure and oxidation performance of tungsten-chromium-yttrium smart alloys. Tungsten 2019, 1, 1–3. [Google Scholar] [CrossRef] [Green Version]
  9. Klein, F.; Litnovsky, A.; Wegener, T.; Tan, X.Y.; Gonzalez-Julian, J.; Rasinski, M.; Schmitz, J.; Linsmeier, C.; Bram, M.; Coenen, J.W. Sublimation of advanced tungsten alloys under DEMO relevant accidental conditions. Fusion Eng. Des. 2019, 146A, 1198–1202. [Google Scholar] [CrossRef]
  10. Tan, X.Y.; Klein, F.; Litnovsky, A.; Wegener, T.; Schmitz, J.; Linsmeier, C.; Coenen, J.W.; Breuer, U.; Rasinski, M.; Li, P.; et al. Evaluation of the high temperature oxidation of W-Cr-Zr self-passivating alloys. Corros. Sci. 2019, 147, 201–211. [Google Scholar] [CrossRef]
  11. Klein, F.; Wegener, T.; Litnovsky, A.; Rasinski, M.; Tan, X.Y.; Schmitz, J.; Linsmeier, C.; Coenen, J.W.; Du, H.; Mayer, J.; et al. On Oxidation Resistance Mechanisms at 1273 K of Tungsten-Based Alloys Containing Chromium and Yttria. Metals 2018, 8, 488. [Google Scholar] [CrossRef] [Green Version]
  12. Klein, F.; Wegener, T.; Litnovsky, A.; Rasinski, M.; Tan, X.Y.; Gonzalez-Julian, J.; Schmitz, J.; Bram, M.; Coenen, J.W.; Linsmeier, C. Oxidation resistance of bulk plasma-facing tungsten alloys. Nucl. Mater. Energy 2018, 15, 226–231. [Google Scholar] [CrossRef]
  13. Litnovsky, A.; Wegener, T.; Klein, F.; Linsmeier, C.; Rasinski, M.; Kreter, A.; Tan, X.Y.; Schmitz, J.; Mao, Y.; Coenen, J.W.; et al. Oxidation resistance of bulk plasma-facing tungsten alloys. Plasma Phys. Control. Fusion 2017, 59, 064003. [Google Scholar] [CrossRef]
  14. Litnovsky, A.; Wegener, T.; Klein, F.; Linsmeier, C.; Rasinski, M.; Kreter, A.; Unterberg, B.; Coenen, J.W.; Du, H.; Mayer, J.; et al. Smart tungsten alloys as a material for the first wall of a future fusion power plant. Nucl. Fusion 2017, 57, 066020. [Google Scholar] [CrossRef]
  15. Fischer, U.; Bachmann, C.; Catalan, J.P.; Eade, T.; Flammini, D.; Gilbert, M.R.; Jaboulay, J.-C.; Konobeev, A.; Leichtle, D.; Lu, L.; et al. Methodological approach for DEMO neutronics in the European PPPT programme: Tools, data and analyses. Fusion Eng. Des. 2017, 123, 26–31. [Google Scholar] [CrossRef]
  16. Federici, G.; Biel, W.; Gilbert, M.R.; Kemp, R.; Taylor, N.; Wenninger, R. European DEMO design strategy and consequences for materials. Nucl. Fusion 2017, 57, 092002. [Google Scholar] [CrossRef] [Green Version]
  17. Federici, G.; Bachmann, C.; Barucca, L.; Biel, W.; Boccaccini, L.; Brown, R.; Bustreo, C.; Ciattaglia, S.; Cismondi, F.; Coleman, M.; et al. DEMO design activity in Europe: Progress and updates. Fusion Eng. Des. 2018, 136, 729–741. [Google Scholar] [CrossRef]
  18. Sublet, J.-C.; Eastwood, J.W.; Morgan, J.G.; Gilbert, M.R.; Fleming, M.; Arter, W. FISPACT-II: An Advanced Simulation System for Activation, Transmutation and Material Modelling. Nucl. Data Sheets 2017, 139, 77–137. [Google Scholar] [CrossRef]
  19. Koning, A.J.; Rochman, D.; Sublet, J. TENDL-2019; Release Date: 31 December 2019. Available online: https://tendl.web.psi.ch/tendl_2019/tendl2019.html (accessed on 29 April 2020).
  20. Gilbert, M.R.; Eade, T.; Rey, T.; Vale, R.; Bachmann, C.; Fischer, U.; Taylor, N. Waste implications from minor impurities in European DEMO materials. Nucl. Fus. 2019, 59, 076015. [Google Scholar] [CrossRef] [Green Version]
  21. Gilbert, M.R.; Sublet, J.-C. Handbook of Activation, Transmutation, and Radiation Damage Properties of the Elements Simulated Using FISPACT-II & TENDL-2015; Magnetic Fusion Plants, CCFE-R(16)36, UKAEA 2016. Available online: http://fispact.ukaea.uk (accessed on 29 April 2020).
  22. Blöchl, P.E. Projector augmented-wave method. Phys. Rev. B 1994, 50, 17953–17978. [Google Scholar] [CrossRef] [PubMed] [Green Version]
  23. Kresse, G.; Furthmiiller, J. Efficient iterative schemes for ab initio total-energy calculations using a plane-wave basis set. Phys. Rev. B 1996, 54, 11169. [Google Scholar] [CrossRef]
  24. Kresse, G.; Furthmiiller, J. Efficiency of ab initio total energy calculations for metals and semiconductors using a plane-wave basis set. Comput. Mater. Sci. 1996, 6, 15–50. [Google Scholar] [CrossRef]
  25. Hafner, J. Ab-initio simulations of materials using VASP: Density-functional theory and beyond. J. Comput. Chem. 2008, 29, 2044–2078. [Google Scholar] [CrossRef]
  26. Perdew, J.P.; Burke, K.; Ernzerhof, M. Generalized Gradient Approximation Made Simple. Phys. Rev. Lett. 1997, 77, 3865. [Google Scholar] [CrossRef] [PubMed] [Green Version]
  27. Sobieraj, D.; Wróbel, J.S.; Rygier, T.; Kurzydłowski, K.J.; El-Atwani, O.; Devaraj, A.; Martinez, E.; Nguyen-Manh, D. Chemical short-range order in derivative Cr-Ta-Ti-V-W high entropy alloys from the first-principles thermodynamic study. Phys. Chem. Chem. Phys. 2020, 22, 23929. [Google Scholar] [CrossRef] [PubMed]
  28. Pankhurst, D.A.; Nguyen-Manh, D.; Pettifor, D.G. Electronic origin of structural trends across early transition-metal disilicides: Anomalous behavior of CrSi2. Phys. Rev. B 2004, 69, 075113. [Google Scholar] [CrossRef]
  29. Monkhorst, H.J.; Pack, J.D. Special points for Brillouin-zone integrations. Phys. Rev. B 1976, 13, 5188. [Google Scholar] [CrossRef]
  30. De Fontaine, D. The number of independent pair-correlation functions in multicomponent systems. J. Appl. Crystallogr. 1971, 4, 15–19. [Google Scholar] [CrossRef]
  31. Sanchez, J.M.; Ducastelle, F.; Gratias, D. Generalized cluster description of multicomponent systems. Physica A 1984, 128, 334–350. [Google Scholar] [CrossRef]
  32. Sanchez, J.M. Foundations and Practical Implementations of the Cluster Expansion. J. Phase Equilibria Diffus. 2017, 38, 238–251. [Google Scholar] [CrossRef] [Green Version]
  33. Nguyen-Manh, D.; Lavrentiev, M.Y.; Dudarev, S.L. Magnetic origin of nano-clustering and point defect interaction in Fe-Cr alloys: An ab initio study. J. Comput. Aided Mater. Des. 2007, 14, 159–169. [Google Scholar] [CrossRef]
  34. Lavrentiev, M.Y.; Drautz, D.; Nguyen-Manh, D.; Klaver, T.P.C.; Dudarev, S.L. Monte Carlo study of thermodynamic properties and clustering in the bcc Fe-Cr system. Phys. Rev. B 2007, 75, 014208. [Google Scholar] [CrossRef] [Green Version]
  35. Nguyen-Manh, D.; Lavrentiev, M.Y.; Dudarev, S.L. The Fe—Cr system: Atomistic modelling of thermodynamics and kinetics of phase transformations. C. R. Phys. 2008, 9, 379–388. [Google Scholar] [CrossRef]
  36. Muzyk, M.; Nguyen-Manh, D.; Kurzydłowski, K.J.; Baluc, N.L.; Dudarev, S.L. Phase stability, point defects, and elastic properties of W-V and W-Ta alloys. Phys. Rev. B 2011, 84, 104115. [Google Scholar] [CrossRef] [Green Version]
  37. Wu, Q.; He, B.; Song, T.; Gao, J.; Shi, S. Cluster expansion method and its application in computational materials science. Comput. Mater. Sci. 2016, 125, 243–254. [Google Scholar] [CrossRef]
  38. Chinnappan, R.; Panigrahi, B.K.; van de Walle, A. First-principles study of phase equilibrium in Ti-V, Ti-Nb, and Ti-Ta alloys. Calphad 2016, 54, 125–133. [Google Scholar] [CrossRef] [Green Version]
  39. Wróbel, J.S.; Nguyen-Manh, D.; Lavrentiev, M.Y.; Muzyk, M.; Dudarev, S.L. Phase stability of ternary fcc and bcc Fe-Cr-Ni alloys. Phys. Rev. B 2015, 91, 024108. [Google Scholar] [CrossRef] [Green Version]
  40. Connolly, J.W.D.; Williams, A.R. Density-functional theory applied to phase transformations in transition-metal alloys. Phys. Rev. B 1983, 27, 5169. [Google Scholar] [CrossRef]
  41. Van de Walle, A.; Asta, M.; Ceder, G. The alloy theoretic automated toolkit: A user guide. Calphad 2002, 26, 539–553. [Google Scholar] [CrossRef] [Green Version]
  42. Warren, B.E. X-ray Diffraction; Dover: New York, NY, USA, 1990. [Google Scholar]
  43. Cowley, J.M. An Approximate Theory of Order in Alloys. Phys. Rev. 1950, 77, 669. [Google Scholar] [CrossRef]
  44. Fernández-Caballero, A.; Fedorov, M.; Wróbel, J.S.; Mummery, P.M.; Nguyen-Manh, D. Configurational Entropy in Multicomponent Alloys: Matrix Formulation from Ab Initio Based Hamiltonian and Application to the FCC Cr-Fe-Mn-Ni System. Entropy 2019, 21, 68. [Google Scholar] [CrossRef] [PubMed] [Green Version]
  45. Fedorov, M.; Wróbel, J.S.; Fernadez-Caballero, A.; Kurzydłowski, K.J.; Nguyen-Manh, D. Phase stability and magnetic properties in fcc Fe-Cr-Mn-Ni alloys from first-principles modeling. Phys. Rev. B 2020, 101, 174416. [Google Scholar] [CrossRef]
  46. Fernández-Caballero, A.; Wróbel, J.S.; Mummery, P.M.; Nguyen-Manh, D. Short-Range Order in High Entropy Alloys: Theoretical Formulation and Application to Mo-Nb-Ta-V-W System. J. Phase Equilibria Diffus. 2017, 38, 391–403. [Google Scholar] [CrossRef] [Green Version]
  47. Mirebeau, I.; Hennion, M.; Parette, G. First Measurement of Short-Range-Order Inversion as a Function of Concentration in a Transition Alloy. Phys. Rev. Lett. 1984, 53, 687–690. [Google Scholar] [CrossRef]
  48. Naidu, S.V.N.; Sriramamurthy, A.M.; Rao, P.R. The Cr-W (Chromium-Tungsten) system. Bull. Alloy Phase Diagr. 1984, 5, 289. [Google Scholar] [CrossRef]
  49. Klein, F. Studies of Oxidation Resistant Tungsten Alloys at Temperatures of 1100 K to 1475 K. Ph.D. Thesis, Ruhr-Universität Bochum, Universitätsbibliothek, Bochum, Germany, 2020. [Google Scholar]
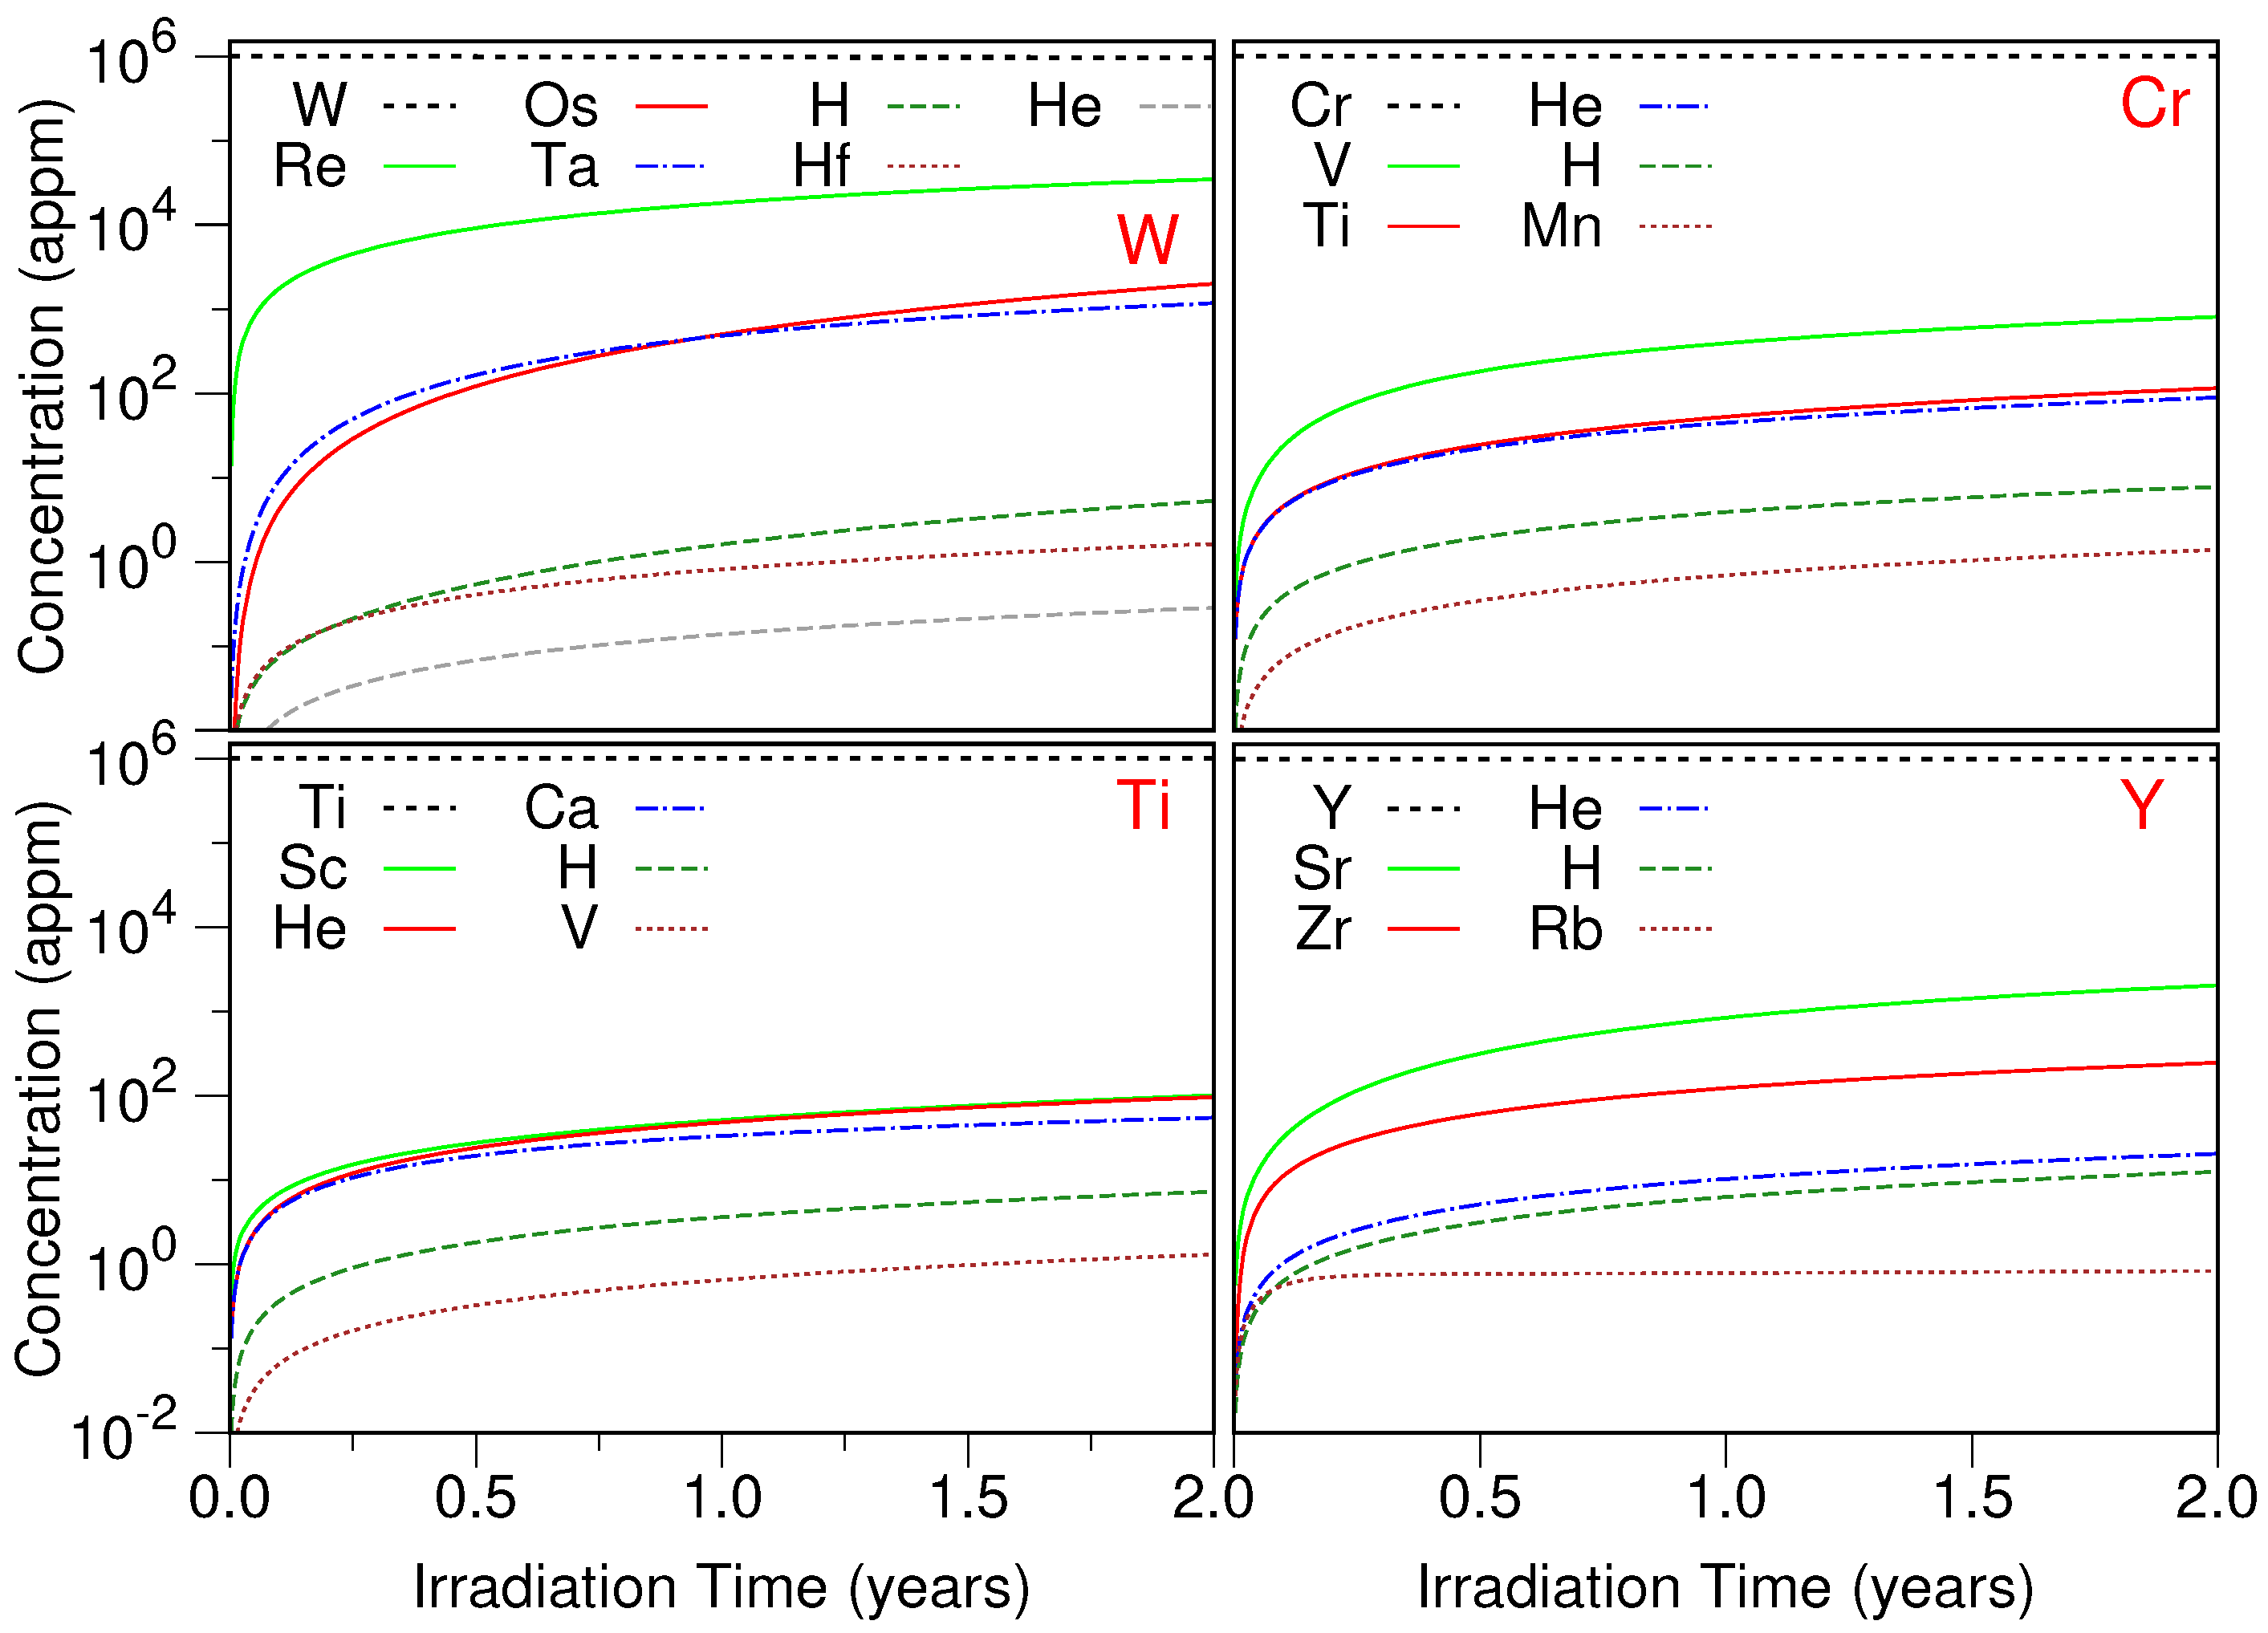
Figure 1. Transmutation (burn-up) response of W, Ti, Cr, and Y under a typical fusion first wall irradiation exposure.
Metals 11 00743 g001
Figure 2. Radiological response represented by total activity in Bq/kg of W, Ti, Cr, and Y during decay cooling following a two full power year exposure under typical fusion first wall conditions, in reference to UK LLW (low level waste) limit.
Metals 11 00743 g002
Figure 3. Effective cluster interactions obtained from Cluster Expansion Hamiltonian for (a) pairs with up to fifth nearest neighbour and (b) three smallest 3-body clusters.
Metals 11 00743 g003
Figure 4. Enthalpies of mixing of bcc binary structures for (a) Cr-W, (b) Cr-Y, and (c) Y-W systems from DFT (blue) and CE (red) simulations.
Metals 11 00743 g004
Figure 5. Enthalpy of mixing as a function of temperature for W 70 Cr 30 , equiatomic WCrY, and derivative W 70 Cr ( 30 x ) Y x , for x = ( 0.5 ; 1 ; 1.5 ; 2 ) alloys. The inset is a zoomed area of the presented plot.
Metals 11 00743 g005
Figure 6. Average short-range order parameters for ternary (a) W 70 Cr 30 , (b) W 70 Cr 29.5 Y 0.5 , (c) W 70 Cr 29 Y 1 , (d) W 70 Cr 28.5 Y 1.5 , (e) W 70 Cr 28 Y 2 , and (f) WCrY alloys.
Metals 11 00743 g006
Figure 7. Structure images obtained from MC for (ac) W 70 Cr 30 , (df) W 70 Cr 29.5 Y 0.5 , (gi) W 70 Cr 29 Y 1 , (jl) W 70 Cr 28.5 Y 1.5 , (mo) W 70 Cr 28 Y 2 alloys at 1000 K (left column), 1400 K (middle column) and 1800 K (right column).
Metals 11 00743 g007aMetals 11 00743 g007b
Figure 8. Cr-W average SRO comparison between W 70 Cr 30 and derivative W 70 Cr ( 30 x ) Y x , for x = ( 0.5 ; 1 ; 1.5 ; 2 ) alloys.
Metals 11 00743 g008
Figure 9. Free energy calculations from 1NN approximation for W 70 Cr 29 Y 1 alloy.
Metals 11 00743 g009
Figure 10. Enthalpies of mixing of bcc binary structures for (a) Cr-Ti, (b) Cr-W, and (c) Ti-W systems from DFT (blue) and CE (red) simulations.
Metals 11 00743 g010
Figure 11. Enthalpy of mixing as a function of temperature for W 70 Cr 30 , equiatomic WCrTi, and derivative W 70 Cr ( 30 x ) Ti x , for x = ( 0.5 ; 1 ; 1.5 ; 2 ) alloys. The inset is a zoomed area of the presented plot.
Metals 11 00743 g011
Figure 12. Average short-range order parameters for ternary (a) W 70 Cr 29.5 Ti 0.5 , (b) W 70 Cr 29 Ti 1 , (c) W 70 Cr 28.5 Ti 1.5 , (d) W 70 Cr 28 Ti 2 , and (e) WCrTi alloys.
Metals 11 00743 g012
Figure 13. Structure images obtained from MC for W 70 Cr 29 Ti 1 alloy at (a) 1000 K, (b) 1400 K, and (c) 1800 K. W (grey), Cr (blue), Ti (green).
Metals 11 00743 g013
Figure 14. Cr-W average SRO comparison between W 70 Cr 30 and derivative W 70 Cr ( 30 x ) Ti x , for x = ( 0.5 ; 1 ; 1.5 ; 2 ) alloys.
Metals 11 00743 g014
Figure 15. Free energy calculations from 1NN approximation for W 70 Cr 29 Ti 1 alloy.
Metals 11 00743 g015
Table 1. Effective cluster interactions obtained for the Cr-W-Y system. Cluster size is denoted by | ω | , shell label is denoted by n, ( s ) are the decorations of the clusters, m | ω | , n ( s ) denotes multiplicities, and J | ω | , n ( s ) are the concentration-independent effective cluster interactions in meV.
| ω | n ( s ) Coordinates m | ω | , n ( s ) J | ω | , n ( s )
11(0)(0,0,0)1538.452
(1) 1257.288
(2) 1211.843
21(1,1)(0, 0, 0; 1 2 , 1 2 , 1 2 )4−58.172
(1,2) 8−70.914
(2,2) 4−50.004
22(1,1)(0,0,0; 1,0,0)3−32.089
(1,2) 6−59.610
(2,2) 3−154.668
23(1,1)(0,0,0; 1,0,1)63.656
(1,2) 120.321
(2,2) 6−19.614
24(1,1)(0,0,0; 1 1 2 , 1 2 , 1 2 )12−5.678
(1,2) 24−7.450
(2,2) 12−27.653
25(1,1)(0,0,0; 1,1,1)410.940
(1,2) 832.636
(2,2) 472.744
31(1,1,1)(1,0,0; 1 2 , 1 2 , 1 2 ; 1,1,1)12−3.971
(2,1,1) 24−1.483
(1,2,1) 12−5.822
(2,2,1) 240.522
(2,1,2) 1216.694
(2,2,2) 1227.950
32(1,1,1)( 1 2 ,− 1 2 ,− 1 2 ; 0,0,0; − 1 2 ,− 1 2 , 1 2 )123.509
(2,1,1) 24−3.726
(1,2,1) 128.773
(2,2,1) 24−2.666
(2,1,2) 12−8.127
(2,2,2) 12−9.910
33(1,1,1)(0,0,1; 0,0,0; 0,1,0)12−4.250
(2,1,1) 24−2.652
(1,2,1) 12−1.870
(2,2,1) 242.550
(2,1,2) 12−2.719
(2,2,2) 124.426
Table 2. Order–disorder transition temperatures for alloys in Cr-W-Y system.
AlloyODTT [K]
W 70 Cr 30 1700
WCrY1100
W 70 Cr 29.5 Y 0.5 1300
W 70 Cr 29 Y 1 1300
W 70 Cr 28.5 Y 1.5 1300
W 70 Cr 28 Y 2 1300
Table 3. Order–disorder transition temperatures for alloys in Cr-Ti-W system.
AlloyODTT [K]
W 70 Cr 30 1700
WCrTi900
W 70 Cr 29.5 Ti 0.5 1700
W 70 Cr 29 Ti 1 1700
W 70 Cr 28.5 Ti 1.5 1700
W 70 Cr 28 Ti 2 1700
Publisher’s Note: MDPI stays neutral with regard to jurisdictional claims in published maps and institutional affiliations.