Article

Phase Field Simulation of AA6XXX Aluminium Alloys Heat Treatment

by
Antonis Baganis
1,*,
Marianthi Bouzouni
1,2,* and
Spyros Papaefthymiou
1,*
1
Laboratory of Physical Metallurgy, Division of Metallurgy and Materials, School of Mining and Metallurgical Engineering, 9, Her. Polytechniou Str., Zografos, 15780 Athens, Greece
2
Department of Physical Metallurgy and Forming, Hellenic Research Centre for Metals (ELKEME S.A.), 61st km Athens-Lamia Nat. Road, Oinofyta, 32011 Viotia, Greece
*
Authors to whom correspondence should be addressed.
Metals 2021, 11(2), 241; https://doi.org/10.3390/met11020241
Submission received: 2 January 2021 / Revised: 15 January 2021 / Accepted: 26 January 2021 / Published: 1 February 2021
(This article belongs to the Special Issue Structure-Properties-Processing Relationships in Metallic Materials)

Abstract

:
Heat treatment has a significant impact on the microstructure and the mechanical properties of Al-Mg-Si alloys. The present study presents a first Phase-Field modelling approach on the recrystallisation and grain growth mechanism during annealing. It focuses on the precipitate fraction, radius, and Mg-Si concentration in the matrix phase, which are used as input data for the calculation of the yield strength and hardness at the end of different ageing treatments. Annealing and artificial ageing simulations have been conducted on the MultiPhase-Field based MICRESS@ software, while the ThermoCalc@ software has been used to construct the pseudo-binary Al-Mg phase-diagrams and the atomic-mobility databases of MgxSiy precipitates. Recrystallisation simulation estimates the recrystallisation kinetics, the grain growth, and the interface mobility with the presence/absence of secondary particles, selecting as annealing temperature 400 °C and a microstructure previously subjected to cold rolling. The pinning force of secondary particles decelerates the overall recrystallisation time, causing a slight decrease in the final grain radius due to the reduction of interface mobility. The ageing simulation examines different ageing temperatures (180 and 200 °C) for two distinct ternary systems (Al-0.9Mg-0.6Si/Al-1.0Mg-1.1Si wt.%) considering the interface energy and the chemical free energy as the driving force for precipitation. The combination of Phase-Field and the Deschamps–Brechet model predicted the under-ageing condition for the 180 °C ageing treatment and the peak-ageing condition for the 200 °C ageing treatment.

1. Introduction

Nowadays, the demand to reduce the overall automobile weight as a prerequisite for improved fuel efficiency has increased the interest for the lightweight aluminium alloys, which combine a high strength to weight ratio, an excellent response to mechanical and chemical corrosion, and superb formability and weldability [1]. Among the different series of aluminium alloys, vital is the role of the heat-treated 6XXX alloys, with Mg and Si as the main alloying elements, which are used in a wide range of technological sectors, including the automobile for automotive skins, the naval industry for marine vessels, and the aerospace industry for missiles, as well as extrusion profiles and pipelines [1,2,3]. The conventional processing of AA6XXX aluminium alloys consists of a thermomechanical treatment, usually rolling or extrusion, and a subsequent heat treatment including annealing and isothermal artificial ageing. The annealing treatment includes successive and competitive stages of recovery, static recrystallisation, and grain growth resulting in microstructures consisting of un-deformed equiaxed fine grains. The difference in stored volume energy between the deformed non-recrystallized and undeformed recrystallized grains acts as a driving force for the annealing, while nanoparticles, primarily iron intermetallic particles, retard recrystallisation through the Zener pinning action [4].
The artificial ageing leads to the successive precipitation of MgxSiy intermetallic particles, which improve the yield strength and hardness of Al-Mg-Si alloys impeding the dislocation movement by shearing or bypassing (Orowan Loop) mechanism [1].
The optimization of AA6XXX alloys processing requires the development of fast, precise and versatile modelling techniques for both the annealing and the isothermal artificial ageing treatment. For both processes, the semi-empirical JMAK equations, which rely on randomness, have extensively been used [5]. However, Lan et al. [6] and Jou et al. [7] have shown that the Phase-Field modelling more accurately approached the analytical solution of recrystallisation in comparison to the JMAK model. For the isothermal artificial ageing process, numerous models have been proposed, considering the alloying elements concentration and the ageing conditions (time and temperature) in order to predict the precipitation volume fraction and radius, and their contribution to the overall strengthening of the alloy. These models lie on both the atomistic scale, as the Kinetic Monte Carlo approach [8], and the mesoscale, like the Kampman–Wagner [9] and the KiNG model [10], while the thermodynamic approach of CALPHAD has also been taken into account [11].
One of the most prominent numerical approaches for the evolution of precipitation mechanism is the mesoscale based MultiPhase-Field modelling, which incorporates the thermodynamic equations of Gibbs–Thompson that describe the dissolution/growth—of precipitates—and the Onsager equations, which describe the dissipation of free energy [12], while it can be coupled with the CALPHAD approach. In the MultiPhase-Field approach, microstructure is represented continuously using an order parameter φ, as a function of position and time, with a specific order parameter attributed to every single phase or even every grain of the system taking the value 0 for the matrix and the value 1 for precipitates. The interfaces are set as narrow regions, whose phase-field variables vary gradually between their values in the neighbouring grains, in the range 0 < φ < 1, so that the model is described as a diffuse-interface approach, which secures an accurate and computationally flexible description of interfaces and their importance for the precipitation phenomena. The MultiPhase-Field models can insert, concurrently, the reduction of chemical free energy, the interface energy, and the elastic energy as driving force for the evolution of microstructure during ageing, while they can beneficially deal with phenomena, which are characterized by the overlap between the diffusion fields of particles which grow from different locations [13,14]. Phase-Field modelling has been used for various phase transformation simulations including solidification [15], martensite transformation [16], the αγ transformation [17], and the ageing of nickel superalloys [18,19] and 2XXX aluminium alloys [20]. The use of Phase-Field approach for numerical simulation and microstructure evolution of the aged Al-Mg-Si alloys is an innovative and demanding procedure considering the absence of literature and the time consumable simulation.
The current work is divided into the annealing and the ageing simulation. The annealing simulation focuses on the recrystallisation and grain growth mechanism, identifying the impact of secondary particles-pinning force on the recrystallisation kinetics and the average radius of recrystallized grains. The ageing simulation examines the evolution of the volume fraction and the radius of precipitates for varying ageing conditions and chemical compositions, while estimating the yield strength and hardness by the end of every single ageing simulation.

2. Materials and Methods

2.1. Al-Mg Phase Diagrams

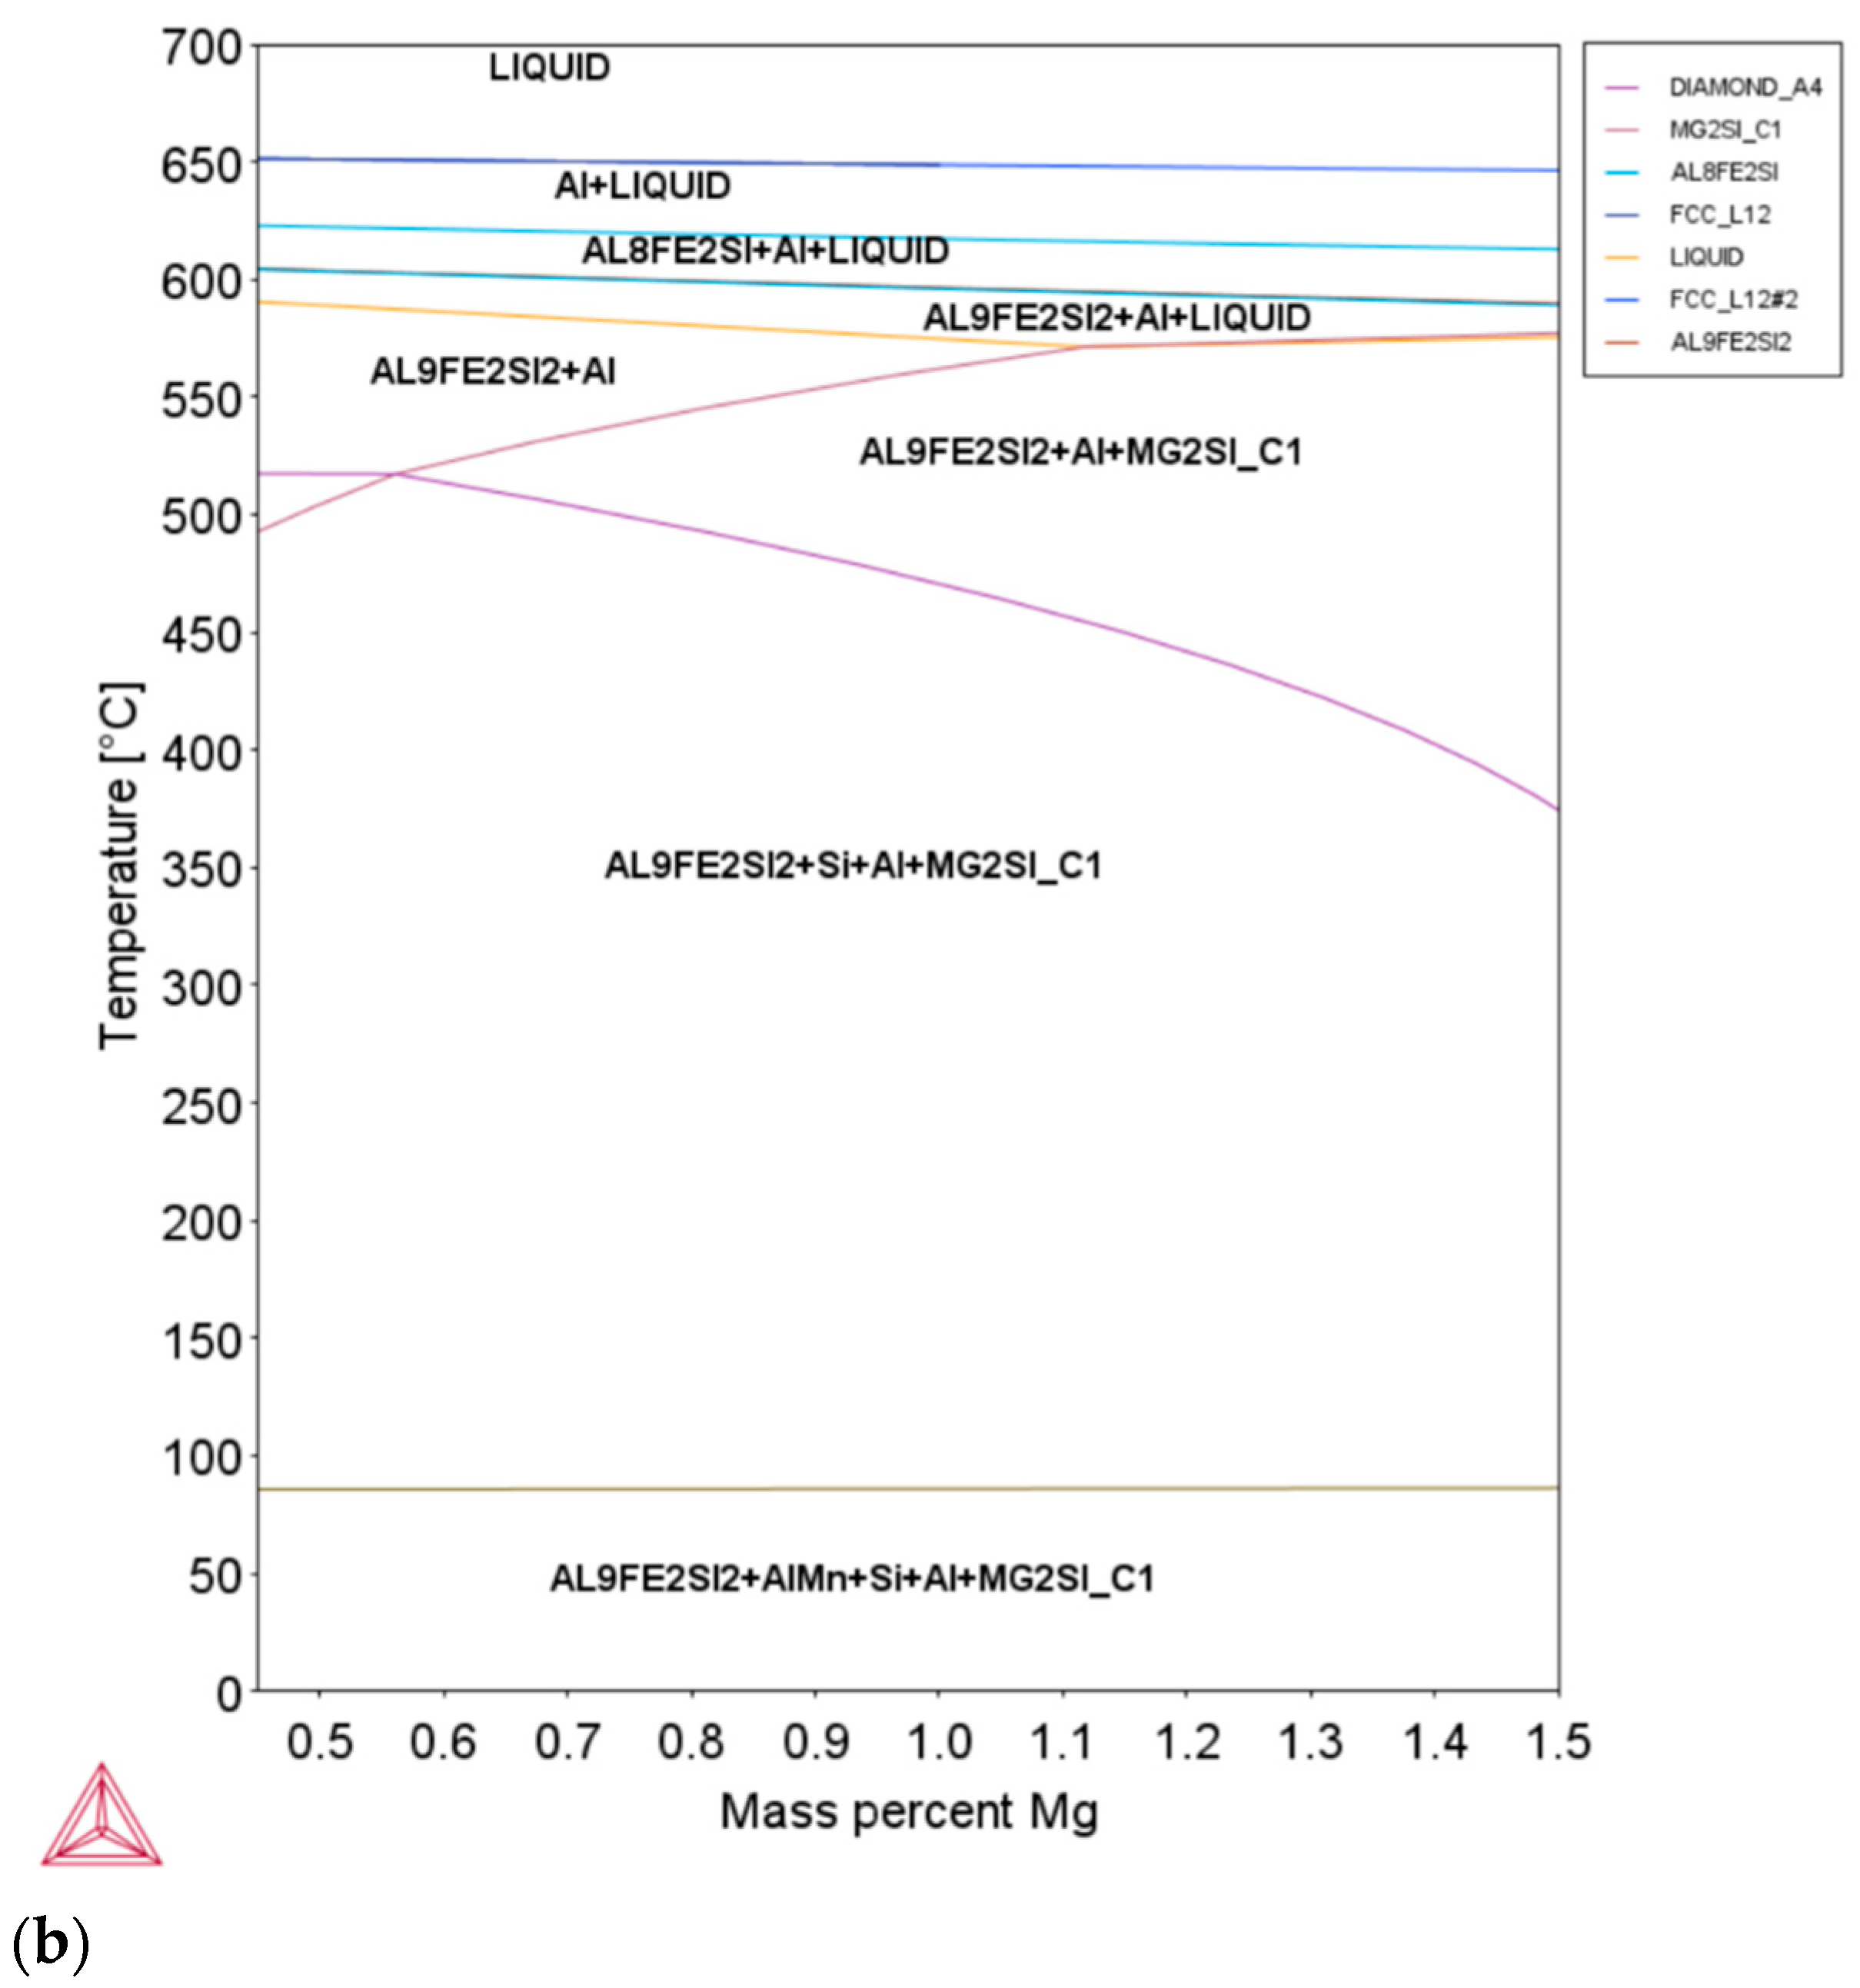
The row of the simulation’s steps is depicted in Figure 1. Al-Mg pseudo-binary phase diagrams are constructed with constant Si wt.% with the use of the ThermoCalc®® software (version 2019b, Royal Institute of Technology-KTH, Stockholm, Sweden) based on the TCAL4 thermodynamic database of aluminium alloys. Based on literature [2,4], two distinct chemical compositions are selected, Table 1, attributed to AA6061-AA6063 (1st case) and AA6082 (2nd case), respectively. The constructed phase diagrams are illustrated in Figure 2.

2.2. Phase-Field Modelling

For the simulation of Al-Mg-Si alloys heat treatment, the MultiPhase-Field based MICRESS®® software (version 6.402) has been used, a computational tool developed by ACCESS e.V. research centre at the RWTH Aachen University in Germany. The equation of the phase-field variable (φ) of the recrystallisation mechanism is given in Equation (1), where τ is the kinetic parameter, e is the energy gradient coefficient, g(φ) is a double-well function with heigh h, p(φ) is the interpolation function, while the difference between the free energy of the deformed and the undeformed-recrystallized microstructure (fDeffRex) acts as the driving force for the recrystallisation mechanism [6]. The evolution of precipitate phase order parameter ( φ ˙ p ) is given in Equation (2), based on the modification of Steinbach’s proposal [21] for the solid–liquid systems, where μpm, σpm, lpm, ΔGpm describe the interface mobility, interface energy, interface width, and the driving force, respectively, while φm is the order parameter of the matrix phase.
φ t   =   ( 1 τ ) [ e 2 2 φ h ( g φ ) +   p / φ ( f D e f f R e x ) ]
φ ˙ p   =   μ p m [ σ p m { 2 φ p ( φ p φ m l p m 2 ) ( φ p φ m ) } + Δ G p m ( 1 l p m ) φ p φ m ]

2.3. Annealing Treatment Simulation

For the annealing treatment simulation, through MICRESS®® software, a suitable file has been created including the necessary parameters (Table 2) that describe the recrystallisation and grain growth mechanism, while the recovery mechanism is not taken into account. The estimation of the energy threshold (ΔΕ), as a driving force of recrystallisation, is given in Equation (3), where μ is the shear modulus, b the burger vector, and pi the dislocation density, attributed to cold rolling of Al-Mg-Si alloys [22]. The simulated microstructure consists only of the matrix aluminium phase, whereas the impact of the secondary iron phase and MgxSiy nanoparticles is taken into consideration via their pinning action. Cube texture [22,23] appears to be the most important crystallographic component of Al-Mg-Si alloys rolling and extrusion, and consequently its respective Miller indices have been inserted to the deformed microstructure. For the avoidance of a possible overlapping among the initial grains, the Voronoi tessellation has been enacted. Seeds of the recrystallized grains are set to nucleate on both the interior of the deformed grains and the interfaces. Two simulations have been conducted: One with the presence of pinning action, and one without the pinning action.
ΔΕ = 0.5μb2pi

2.4. Isothermal Artificial Ageing Simulation

For the case of isothermal artificial ageing simulation, mesh analysis is conducted, considering the importance of high resolution in depicting the nanoscopic size of precipitation particles and in calculating their critical curvature. The main parameters of mesh analysis are given in Table 3. For both the mesh analysis and the subsequent ageing simulations, the overall microstructure has been set equal to 20 × 20 μm2. In order to insert a sufficient number of matrix phase grains, they are set to have a quite low average diameter, between 7.7 and 10 μm, which lies in the lower price range [26,27,28], while the ageing temperature does not permit recrystallisation to take place. It is worth noting that the applied values of the Al matrix grain diameter are not the same as the grain size estimated in the recrystallisation simulation. The reason for this variation is the necessity to insert a quite large number of Al grains (13) in the overall microstructure so as to be able to have a representative depiction of the spatial distribution of precipitate particles. As in the case of annealing, the Voronoi tessellation has been used for the improvement of the initial microstructure. An equal and quite large number of seeds are set to precipitate on both the interior of the matrix phase grains and the interfaces (3.75 particles/μm2), while a shield distance (1 μm) and shield time have been set (1 s) for the nucleation and the initial growth or precipitates. It is worth noting, that the incubation time is considered to be negligible. For the ageing simulation, the ternary Al-Mg-Si system is used, as Mg and Si are the alloying elements which participate in the β-series particles (MgxSiy).
Using ThermoCalc®®, the necessary thermodynamic (TCAL4) and mobility (MOBAL3) databases of MgxSiy phase have been constructed and inserted to MICRESS file, through TQ interface. Precipitate particles are considered to have spherical morphology, with constant chemical formula (Mg2Si). The main parameters of ageing simulations are given in Table 4. The mobility pre-factors were adjusted, after trial-and-error sequences, to stabilize the matrix phase grains. The prices of molar volumes were taken from ThermoCalc@. Given that precipitates are assumed to have spherical morphology, the elastic driving force has not been considered, as according to studies [30] it appears to have insignificant effect on the overall volume fraction of precipitates. Overall, 4 ageing simulations have been conducted, considering the ternary systems Al-0.9Mg-0.6Si and Al-1.0Mg-1.1Si (wt.%) for each of the following conditions: 180 °C-8 h [1,5,31], 200 °C-8 h [1,32].

2.5. Yield Strength and Hardness estimation

The outputs of MultiPhase-Field analysis are used so as to estimate the yield strength and hardness, calculated via Equations (4) and (9), respectively [9,34]. The value of yield strength (σys) is calculated as the sum of the grain-boundary strengthening (Δσgb), the solid solution strengthening (Δσss), the modulus strengthening (Δτms), and the precipitation strengthening (Δτppt), based on Deschamps–Brechet model [34]. In Equation (5), kj and cij are the scaling factor and the weight % concentration, respectively, of j solute elements, where j = Mg and Si. In Equations (6)–(8), r is the radius and f the volume fraction of precipitates, b is a parameter equal to 0.5, while rc is the transition radius from shearing (Equation (6)) to bypassing mechanism (Equation (8)). The term G expresses the shear modulus of Al matrix phase, whereas the term ΔG describes the difference of shear modulus between the matrix phase and the precipitates. The basic parameters for the yield strength and hardness calculation are given in Table 5.
σ y s   =   Δ σ g b +   Δ σ s s + M Δ τ m s 2 + Δ τ p p t 2
Δ σ s s   =   j k j C i j 2 / 3
σ p p t   =   1 b r ( 2 β G b 2 ) 1 2 ( 3 f 2 π ) 1 / 2 [ ( 2 β G b 2 ) ( r r c ) ] 3 / 2
Δ τ m s   =   0.9 ( r f ) ( Γ b ) ( Δ G G ) 3 / 2 ( 2 b l n ( 2 r b f )   ) 3 / 2
σ p p t   =   1 b r ( 2 β G b 2 ) 1 2 ( 3 f 2 π ) 1 2 ( 2 β G b 2 ) 3 / 2
HV   =   0.33 σ y + 16

3. Results

3.1. Al-Mg Phase Diagrams

Figure 2 illustrates the binary Al-Mg phase diagrams, with constant Si concentration (wt.%) equal to 0.6 and 1.1. In both cases, for temperatures above 650 °C, the microstructure includes only the liquid phase while, during undercooling, the formation of iron-intermetallic phases has been observed at 620 °C. For the lower Si concentration (0.6 wt.%), the iron intermetallic phase has a general chemical formula of Al8Fe2Si, attributed to the general category of α-AlFeSi particles, having spherical morphology and cubic crystal structure. After the end of solidification and about the range 620–580 °C, Al8FeSi will be transformed to Al9Fe2Si2, attributed to the general category of β-AlFeSi particles, needle-shaped, having a hexagonal crystal structure [35,36]. On the contrary, for a higher Si concentration (1.1 wt.%) the transformation α-AlFeSi to β-AlFeSi is achieved before the completion of solidification. For each case, β-AlFeSi remains thermodynamically stable until room temperature. For the β-phase (Mg2Si), the temperature range of formation depends on the Mg and Si concentration. For Mg concentration equal to 0.45%, Mg2Si is thermodynamically stable from 450–500 °C, for Mg concentration equal to 0.9%, Mg2Si is thermodynamically stable from 500–550 °C, while for Mg concentration equal to 1.0%, Mg2Si is thermodynamically stable from 550–600 °C, just after the solidification.
The constructed phase diagrams confirmed the importance of Si content for the composition and temperature stability of iron-intermetallic phases. It is worth mentioning, that the microstructure phases, depicted in the constructed diagrams, are attributed to equilibrium conditions, far beyond those appearing during the conventional processing, as infinite time is given for the formation of phases like AlMn and diamond Si. Consequently, the aforementioned phases are not anticipated to participate during the ageing treatment. On the other side, the equilibrium conditions of phase diagrams reason the absence of metastable MgxSiy phases. The quenching, after the end of annealing, prevents the formation of Mg2Si phases at low temperatures, as described by the phase-diagrams. Consequently, it is imperative to conduct the ageing treatment above 150 °C for precipitates being able to nucleate, grow, and coarsen, but lower than 300 °C so as to prevent the recrystallisation of the matrix phase.

3.2. Recrystallisation and Grain Growth Simulation

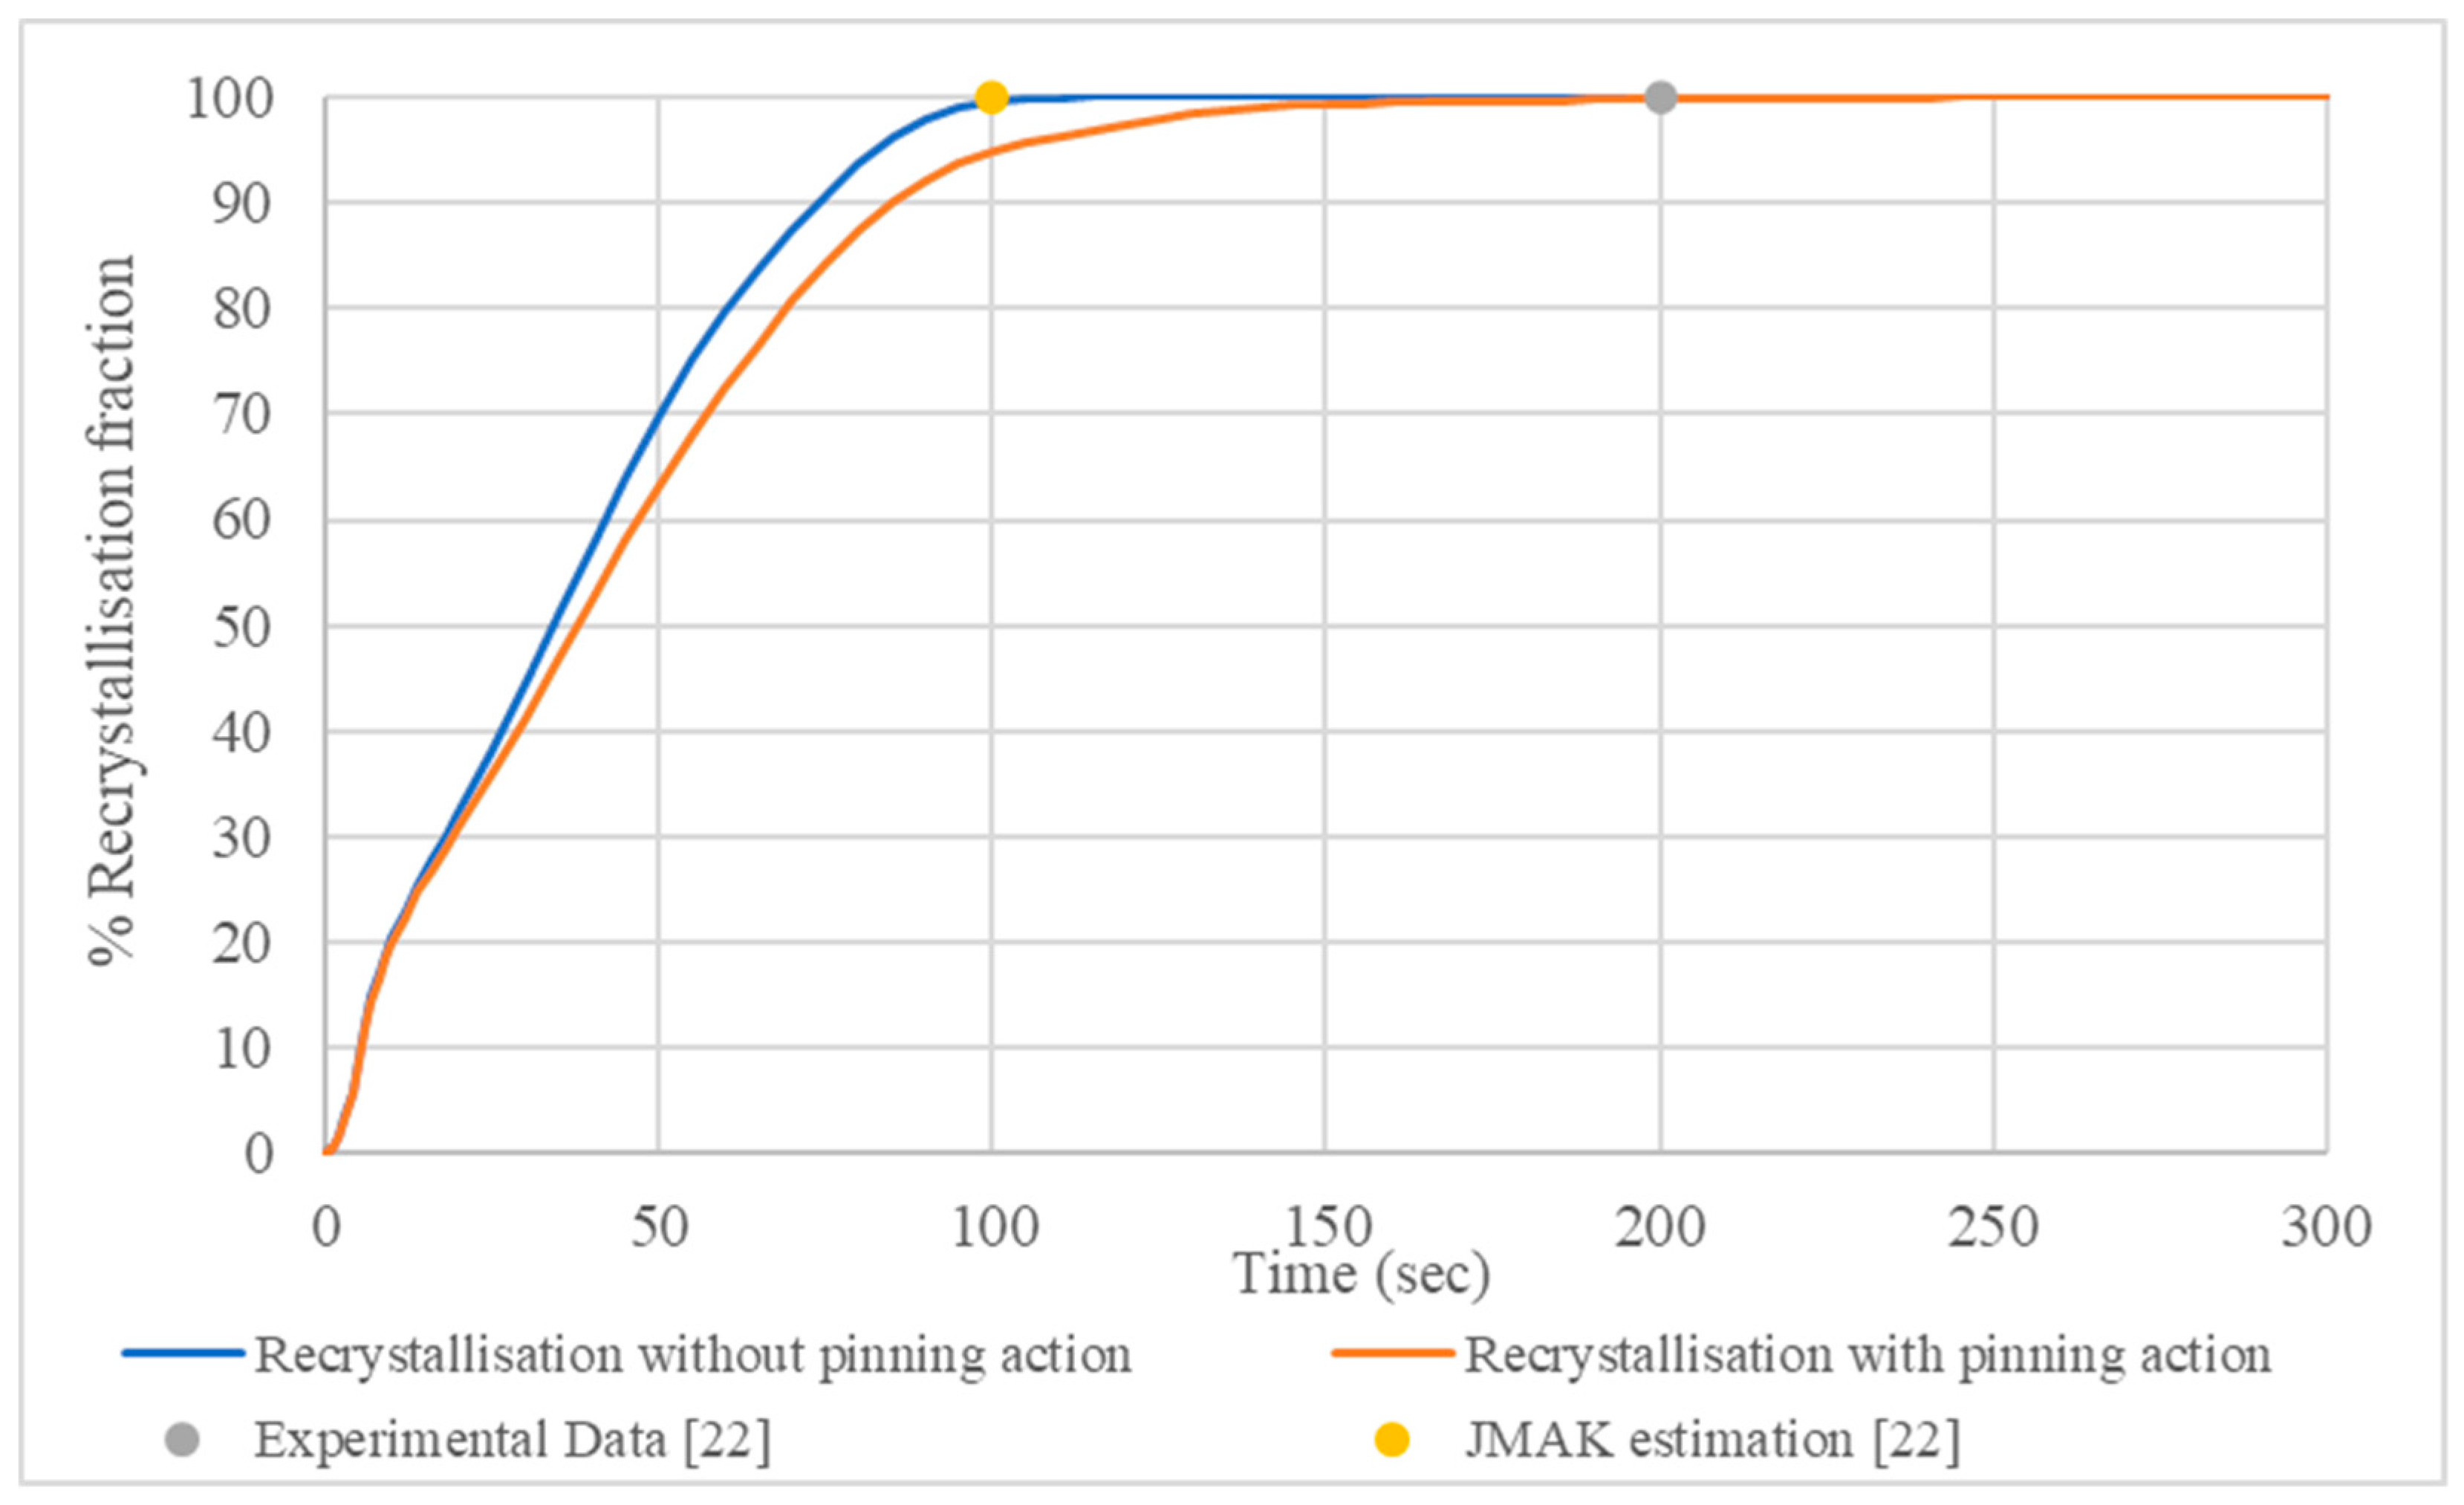
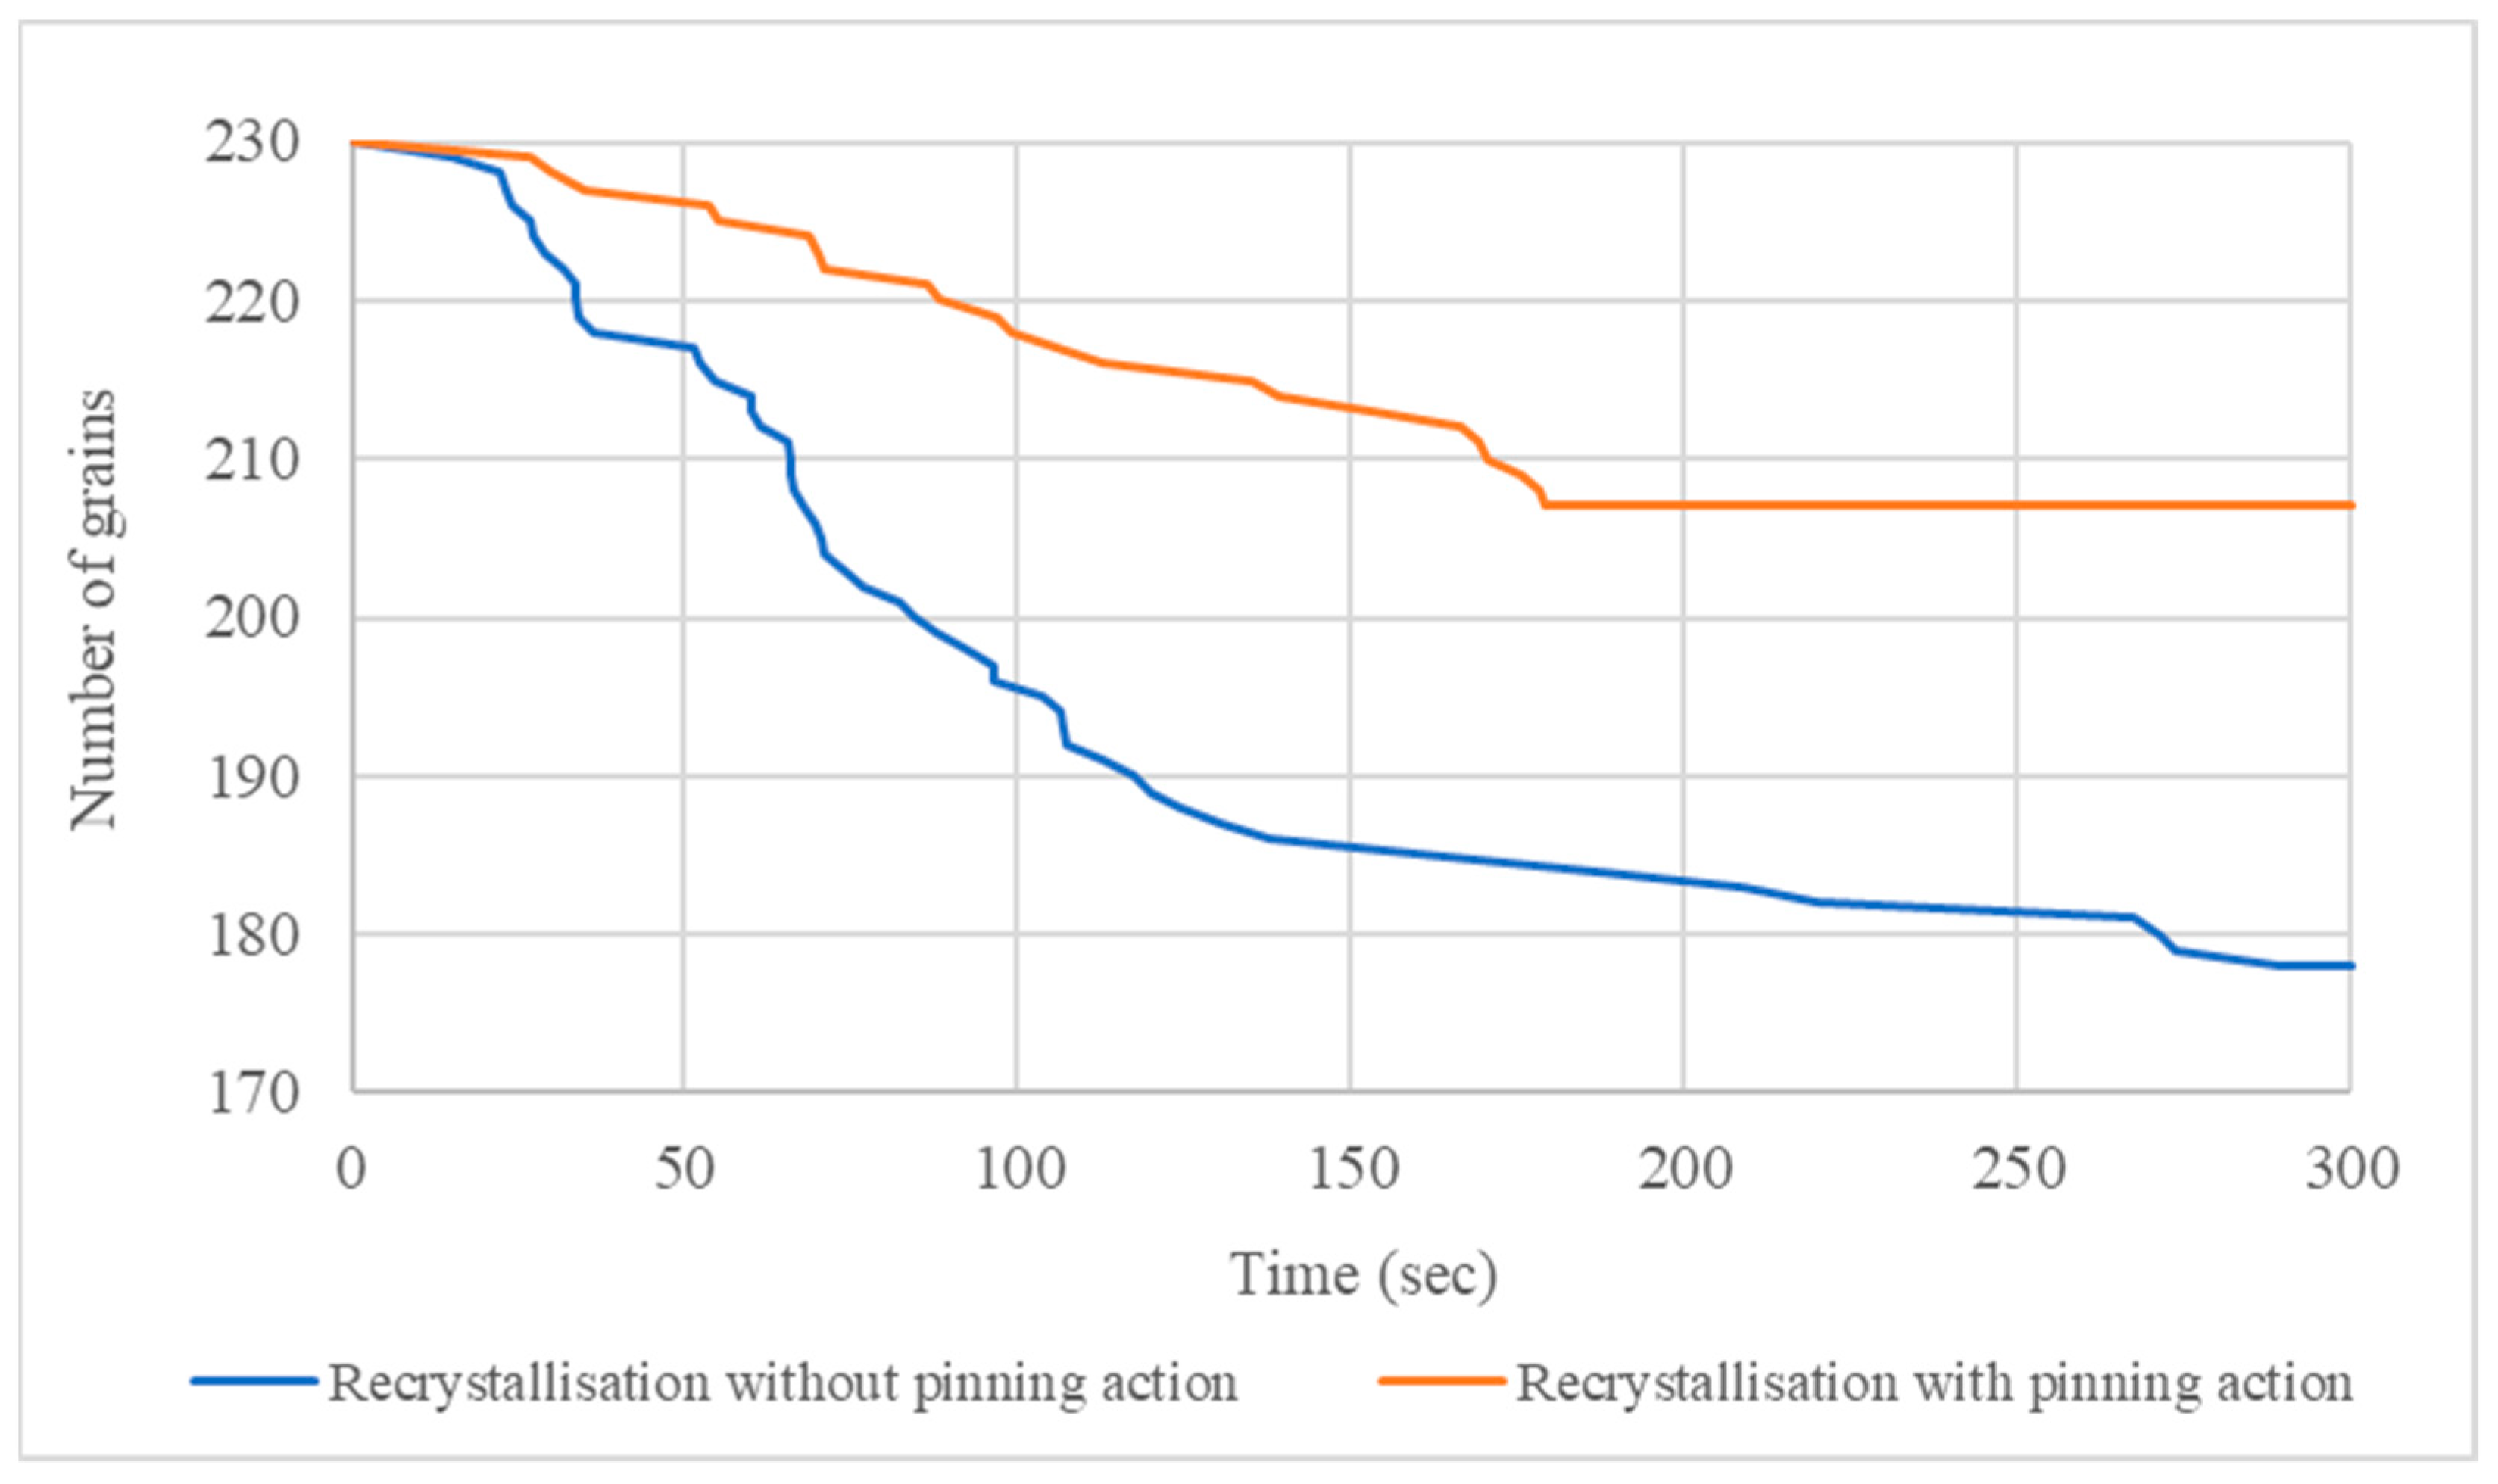
The temporal evolution of recrystallized fraction is illustrated in Figure 3. It can be seen that the presence of pinning action affects recrystallisation kinetics, causing a slight deceleration of the mechanism as the fully recrystallized microstructure is achieved after t = 150 s, while the fully recrystallized microstructure is achieved without the action of nanoparticles after t = 100 s. Similarly, a slight deviation is noticed for the average radius of the recrystallized grains, Figure 4, where the action of pinning force causes an average reduction of about 1 μm. The difference between the two cases is noticed for the overall number of recrystallized grains. For both cases, the initial deformed microstructure consists of 230 grains. During the simulation, the number of grains is reduced, as the most developed grains move competitively through the interface of their neighbouring grains and grow at the expense of the smaller ones that shrink.
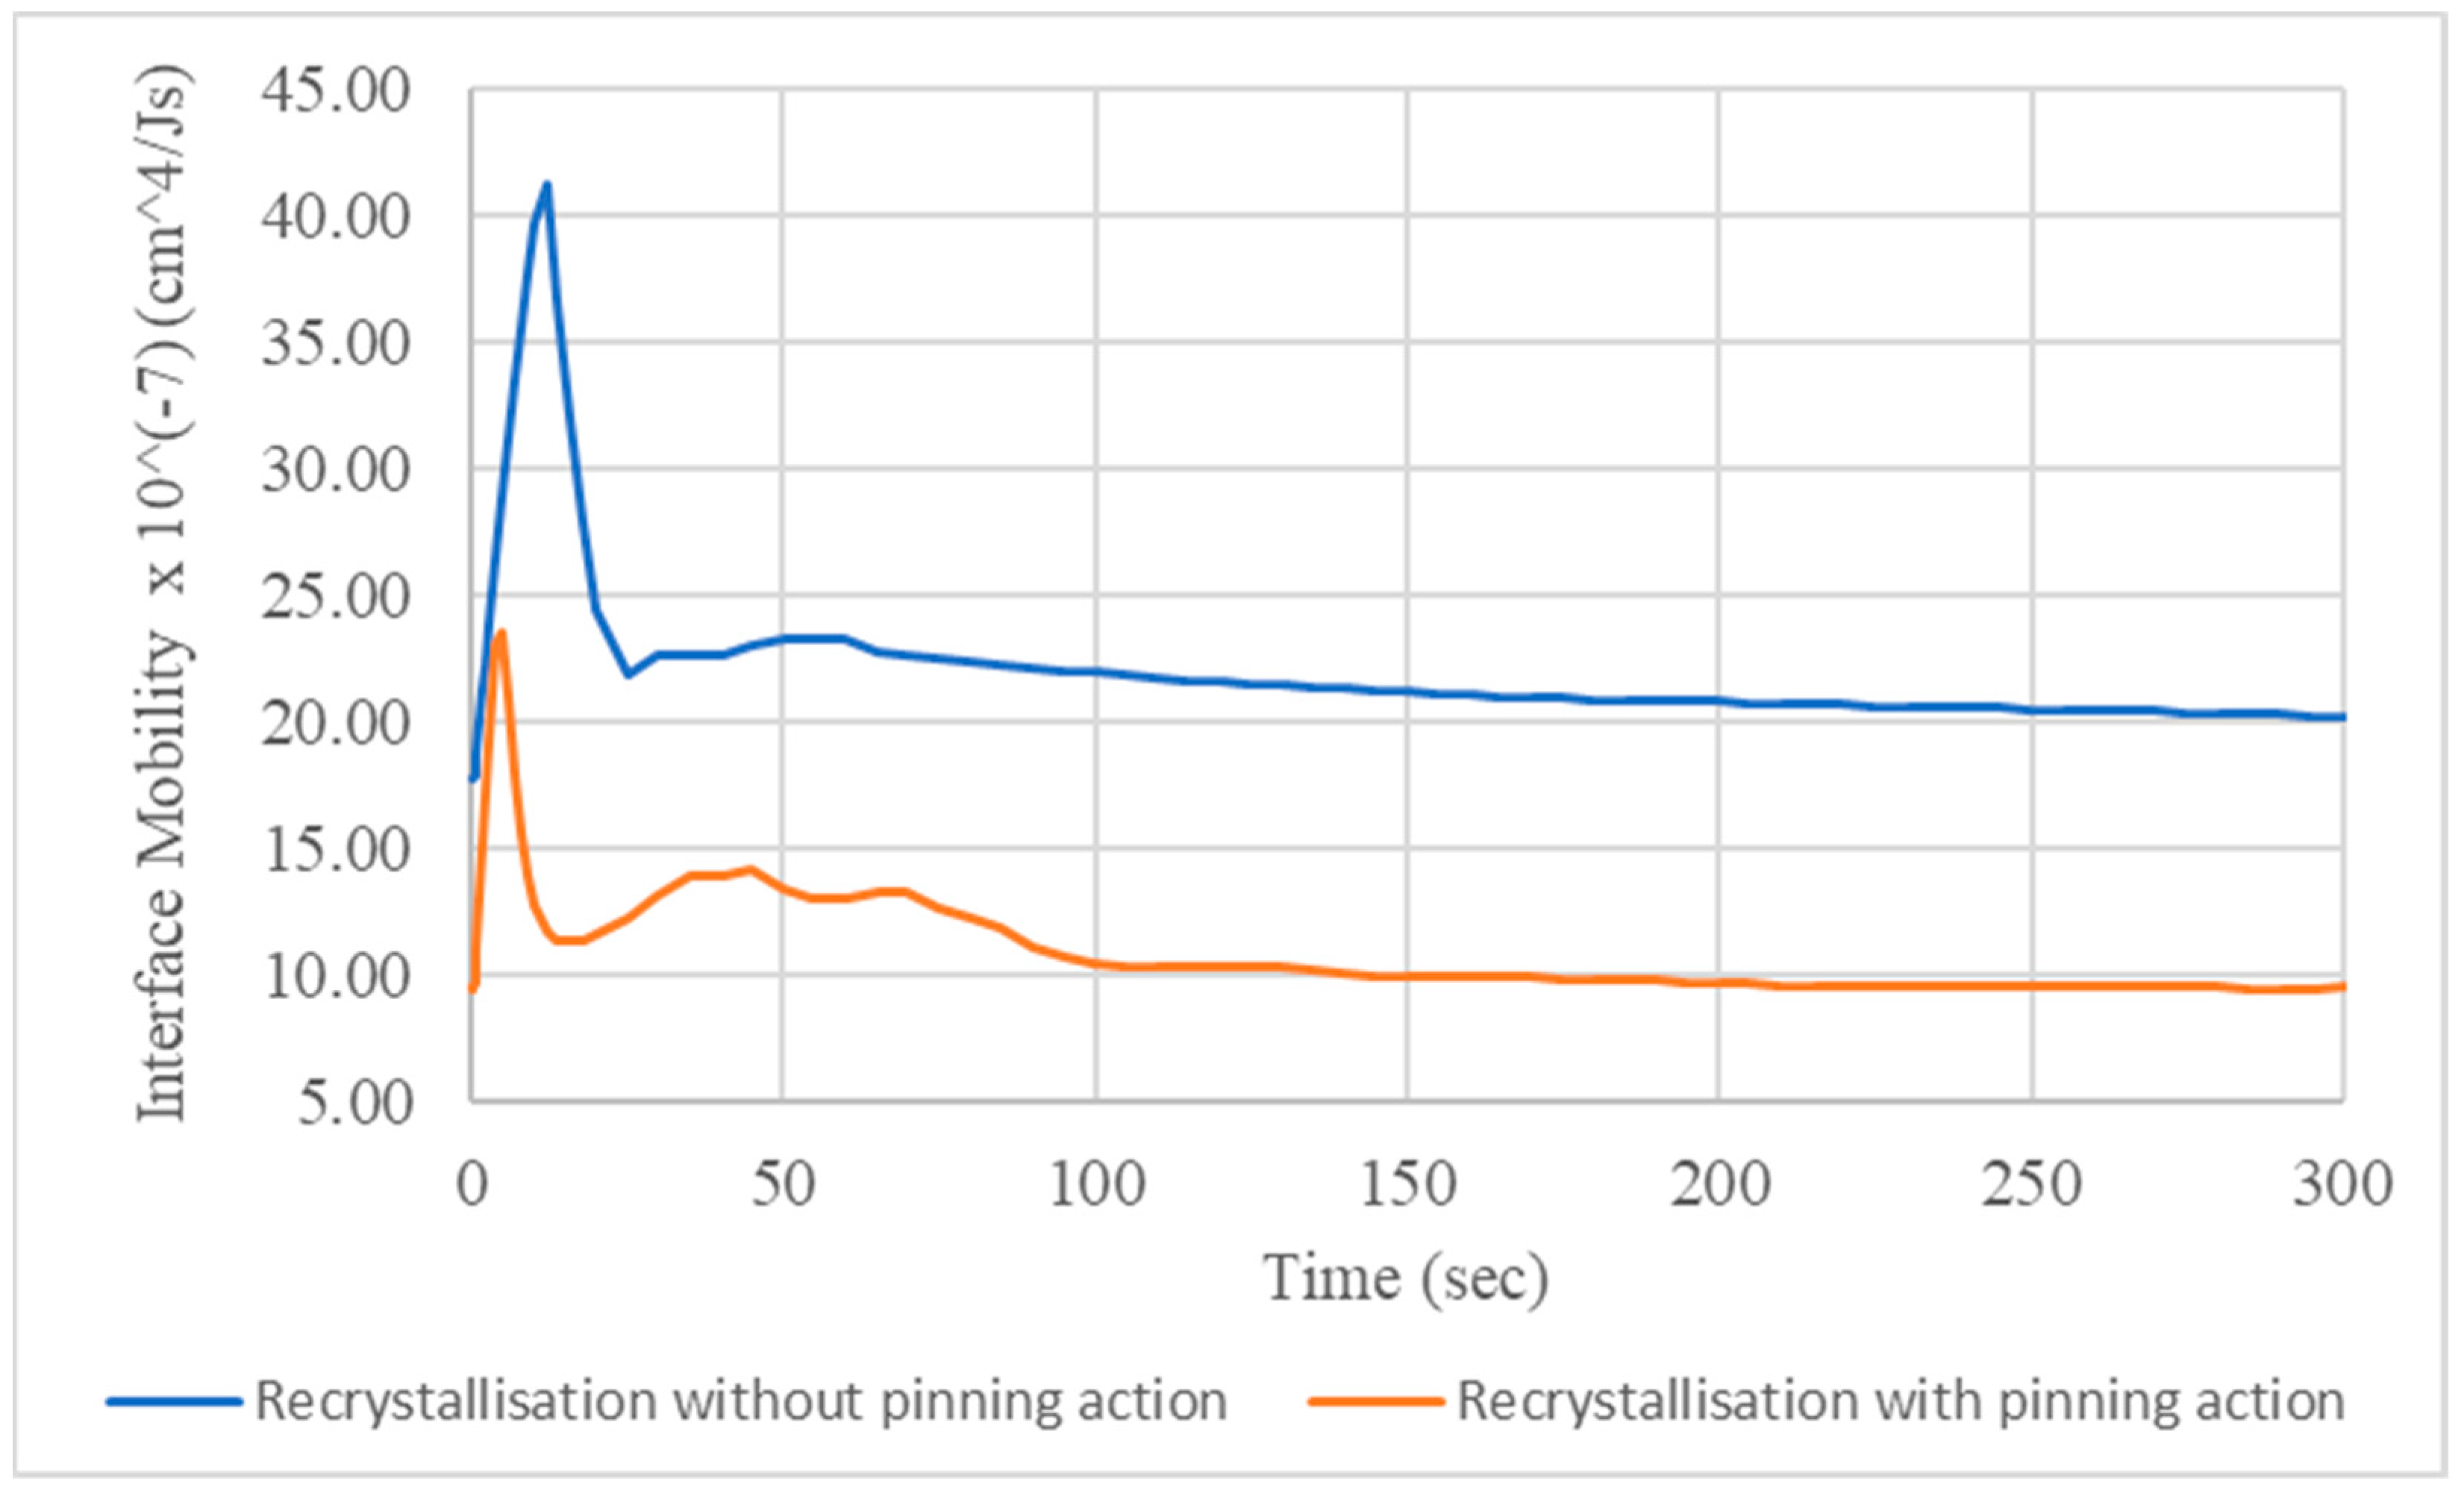
The presence of the secondary particles, through their pining impact, results in a lower decrease of the overall number of grains, the number of which is stabilized between 150–200 s. The evolution of the grain’s number is depicted in Figure 5. The aforementioned differences between the two simulations can be explained by their difference in the average value of interface mobility, as illustrated in Figure 6. As anticipated, the pinning action causes lower values of interface mobility with the deviation of the two cases remaining constant throughout the simulation.

3.3. Isothermal Artificial Ageing Simulation

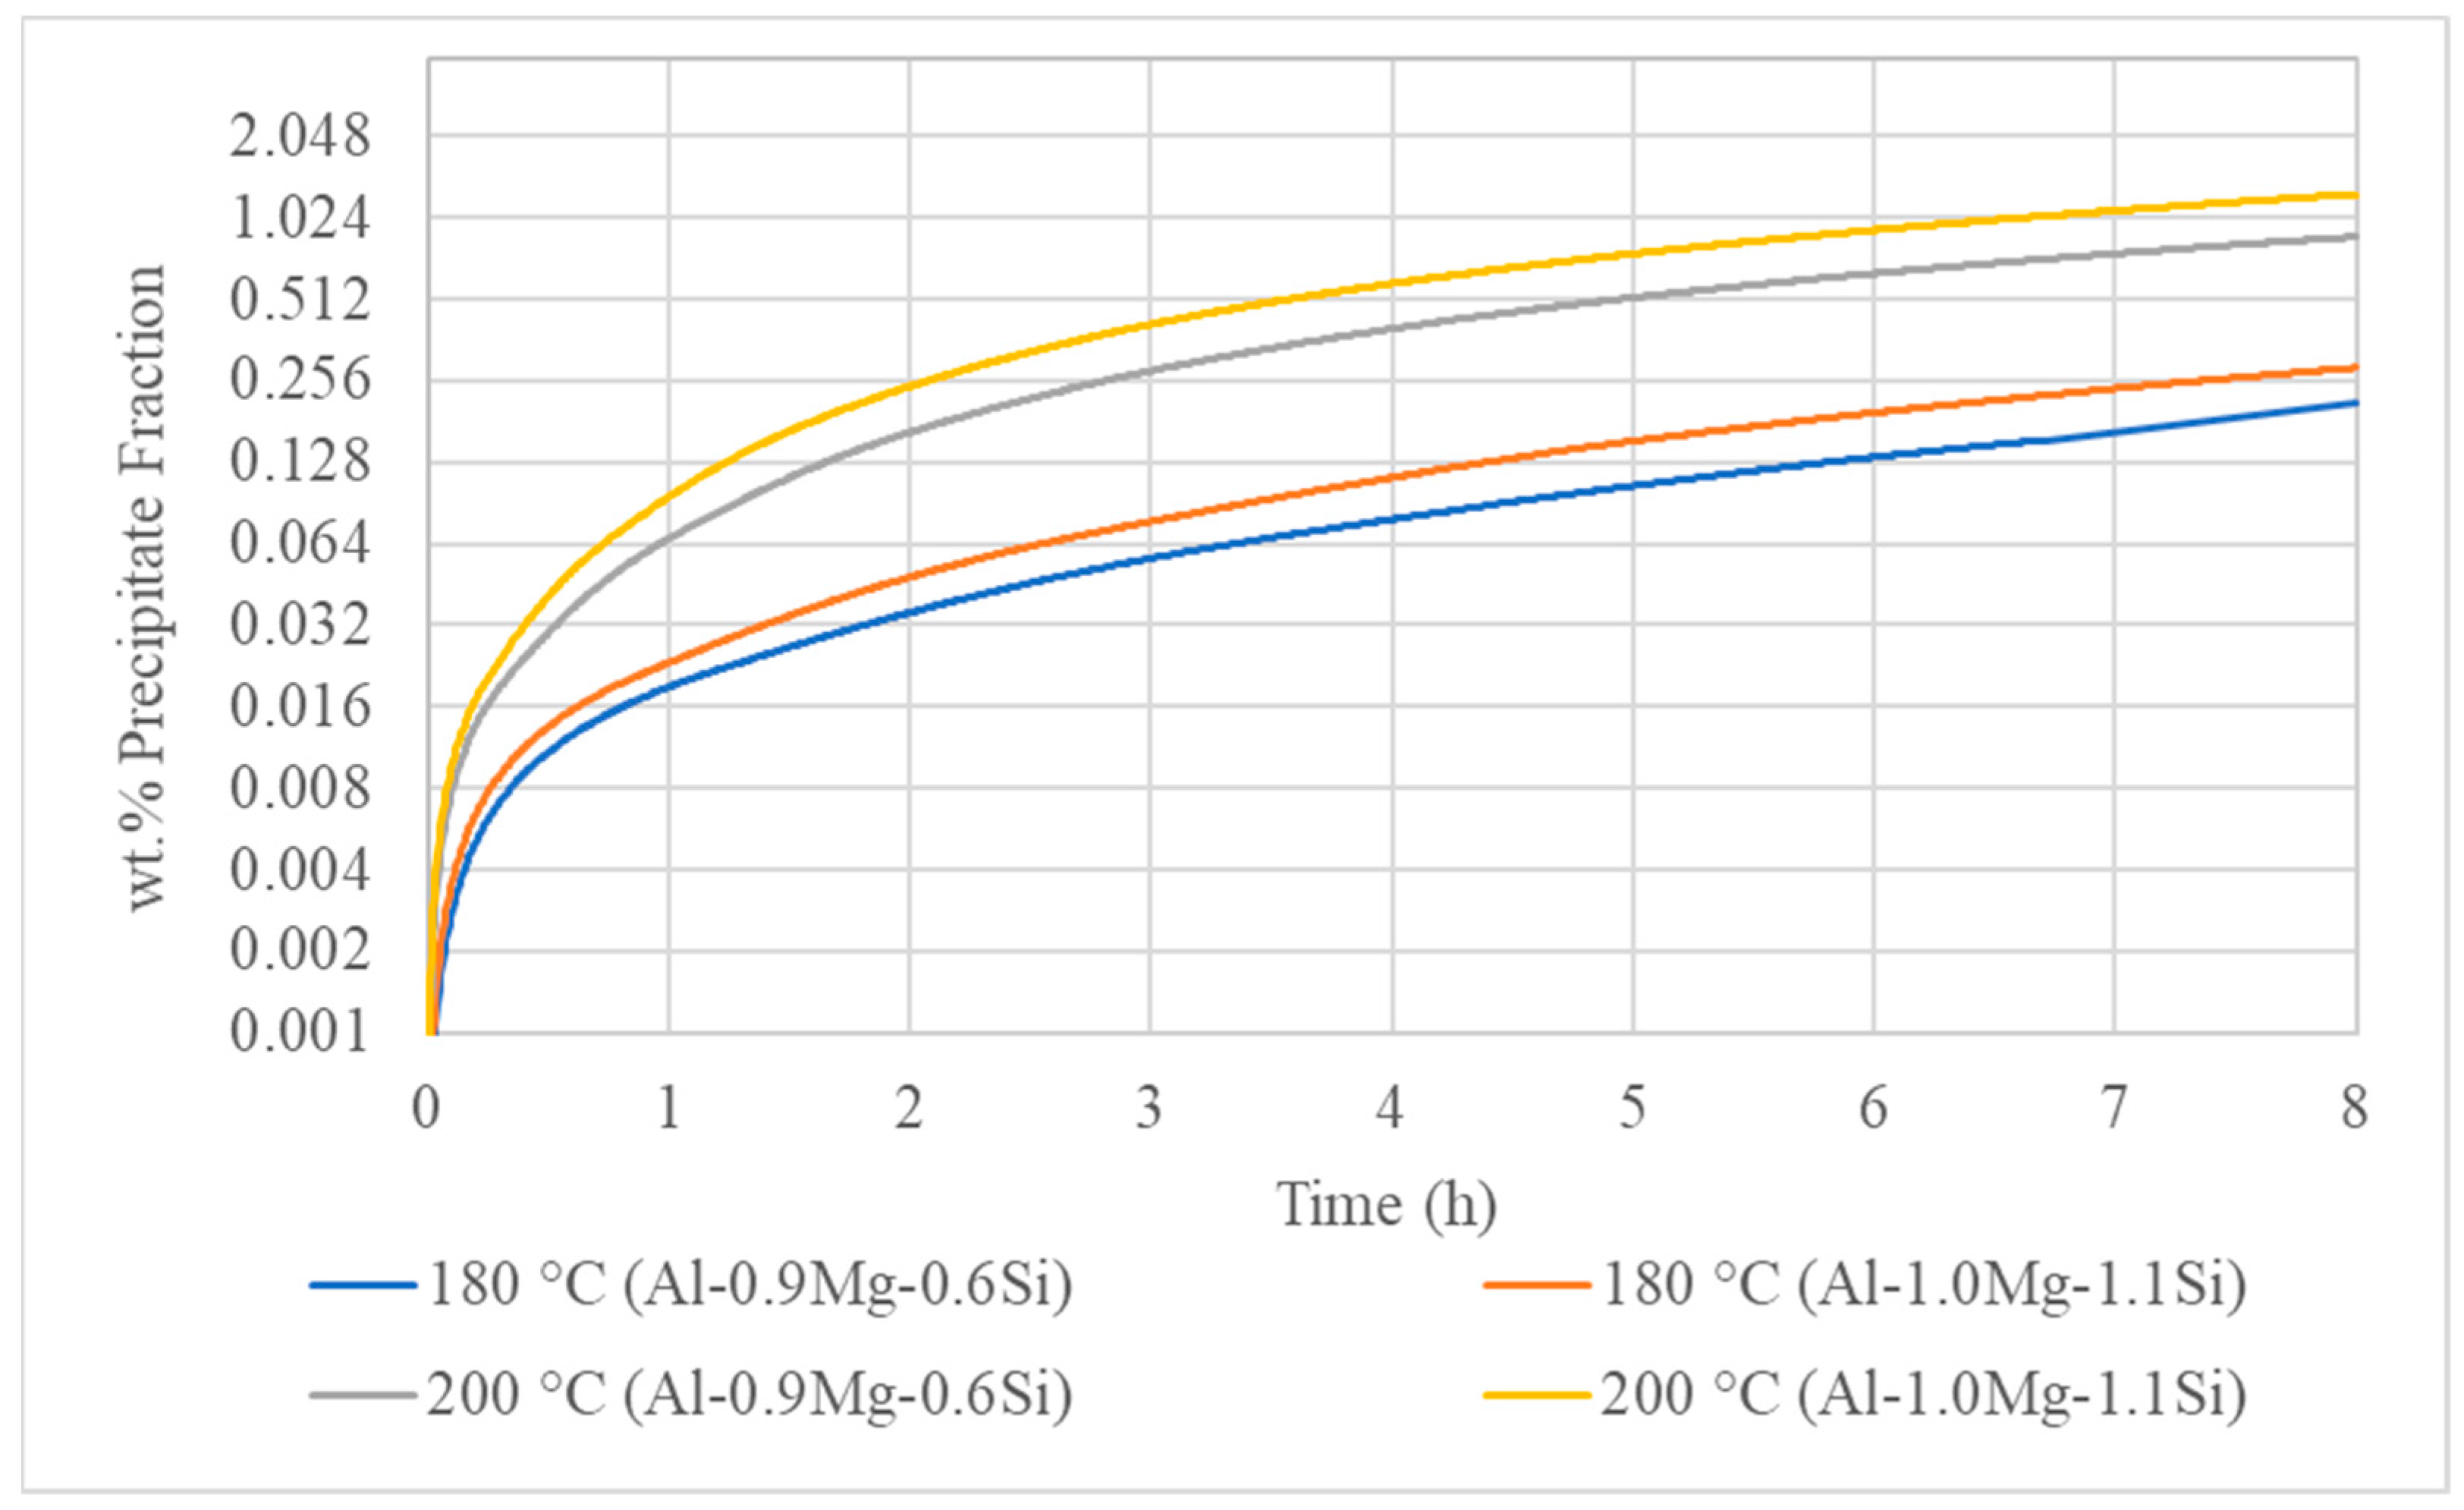
Figure 7 depicts the mesh analysis for the 220 °C-4 h simulation of the Al-0.9Mg-0.6Si ternary system. For the lower values of cells (500–800–1100), severe deviation is estimated among the successive simulations, for the precipitate fraction, in the range between 20–30%. On the contrary, the analysis with 1700–2000 cells, appears to provide much more similar results, with a slight deviation, lower than 2%. Such a deviation can be thought of as acceptable, and consequently, between the two analyses, the 1700 × 1700 is selected due its lower overall simulation time. The analysis of 1700 × 1700 cells, with cell dimension equal to 11.8 nm and interface width equal to 35.4 nm (3 × 11.8), will be implemented for the subsequent ageing simulations. Choosing the 1700 × 1700 cells, Figure 8 presents the precipitate fraction for the 180–200 °C ageing simulations.
For the 180 °C ageing, the estimated wt.% of Mg2Si is quite low, equal to 0.21 for the ternary Al-0.9Mg-0.6Si and 0.29 for Al-1.0Mg-1.1Si. For the higher ageing temperature of 200 °C, a significant increase is recorded as the precipitate fraction reaches the value 0.87 for the ternary Al-0.9Mg-0.6Si and the value 1.25 for the ternary system Al-1.0Mg-1.1Si.
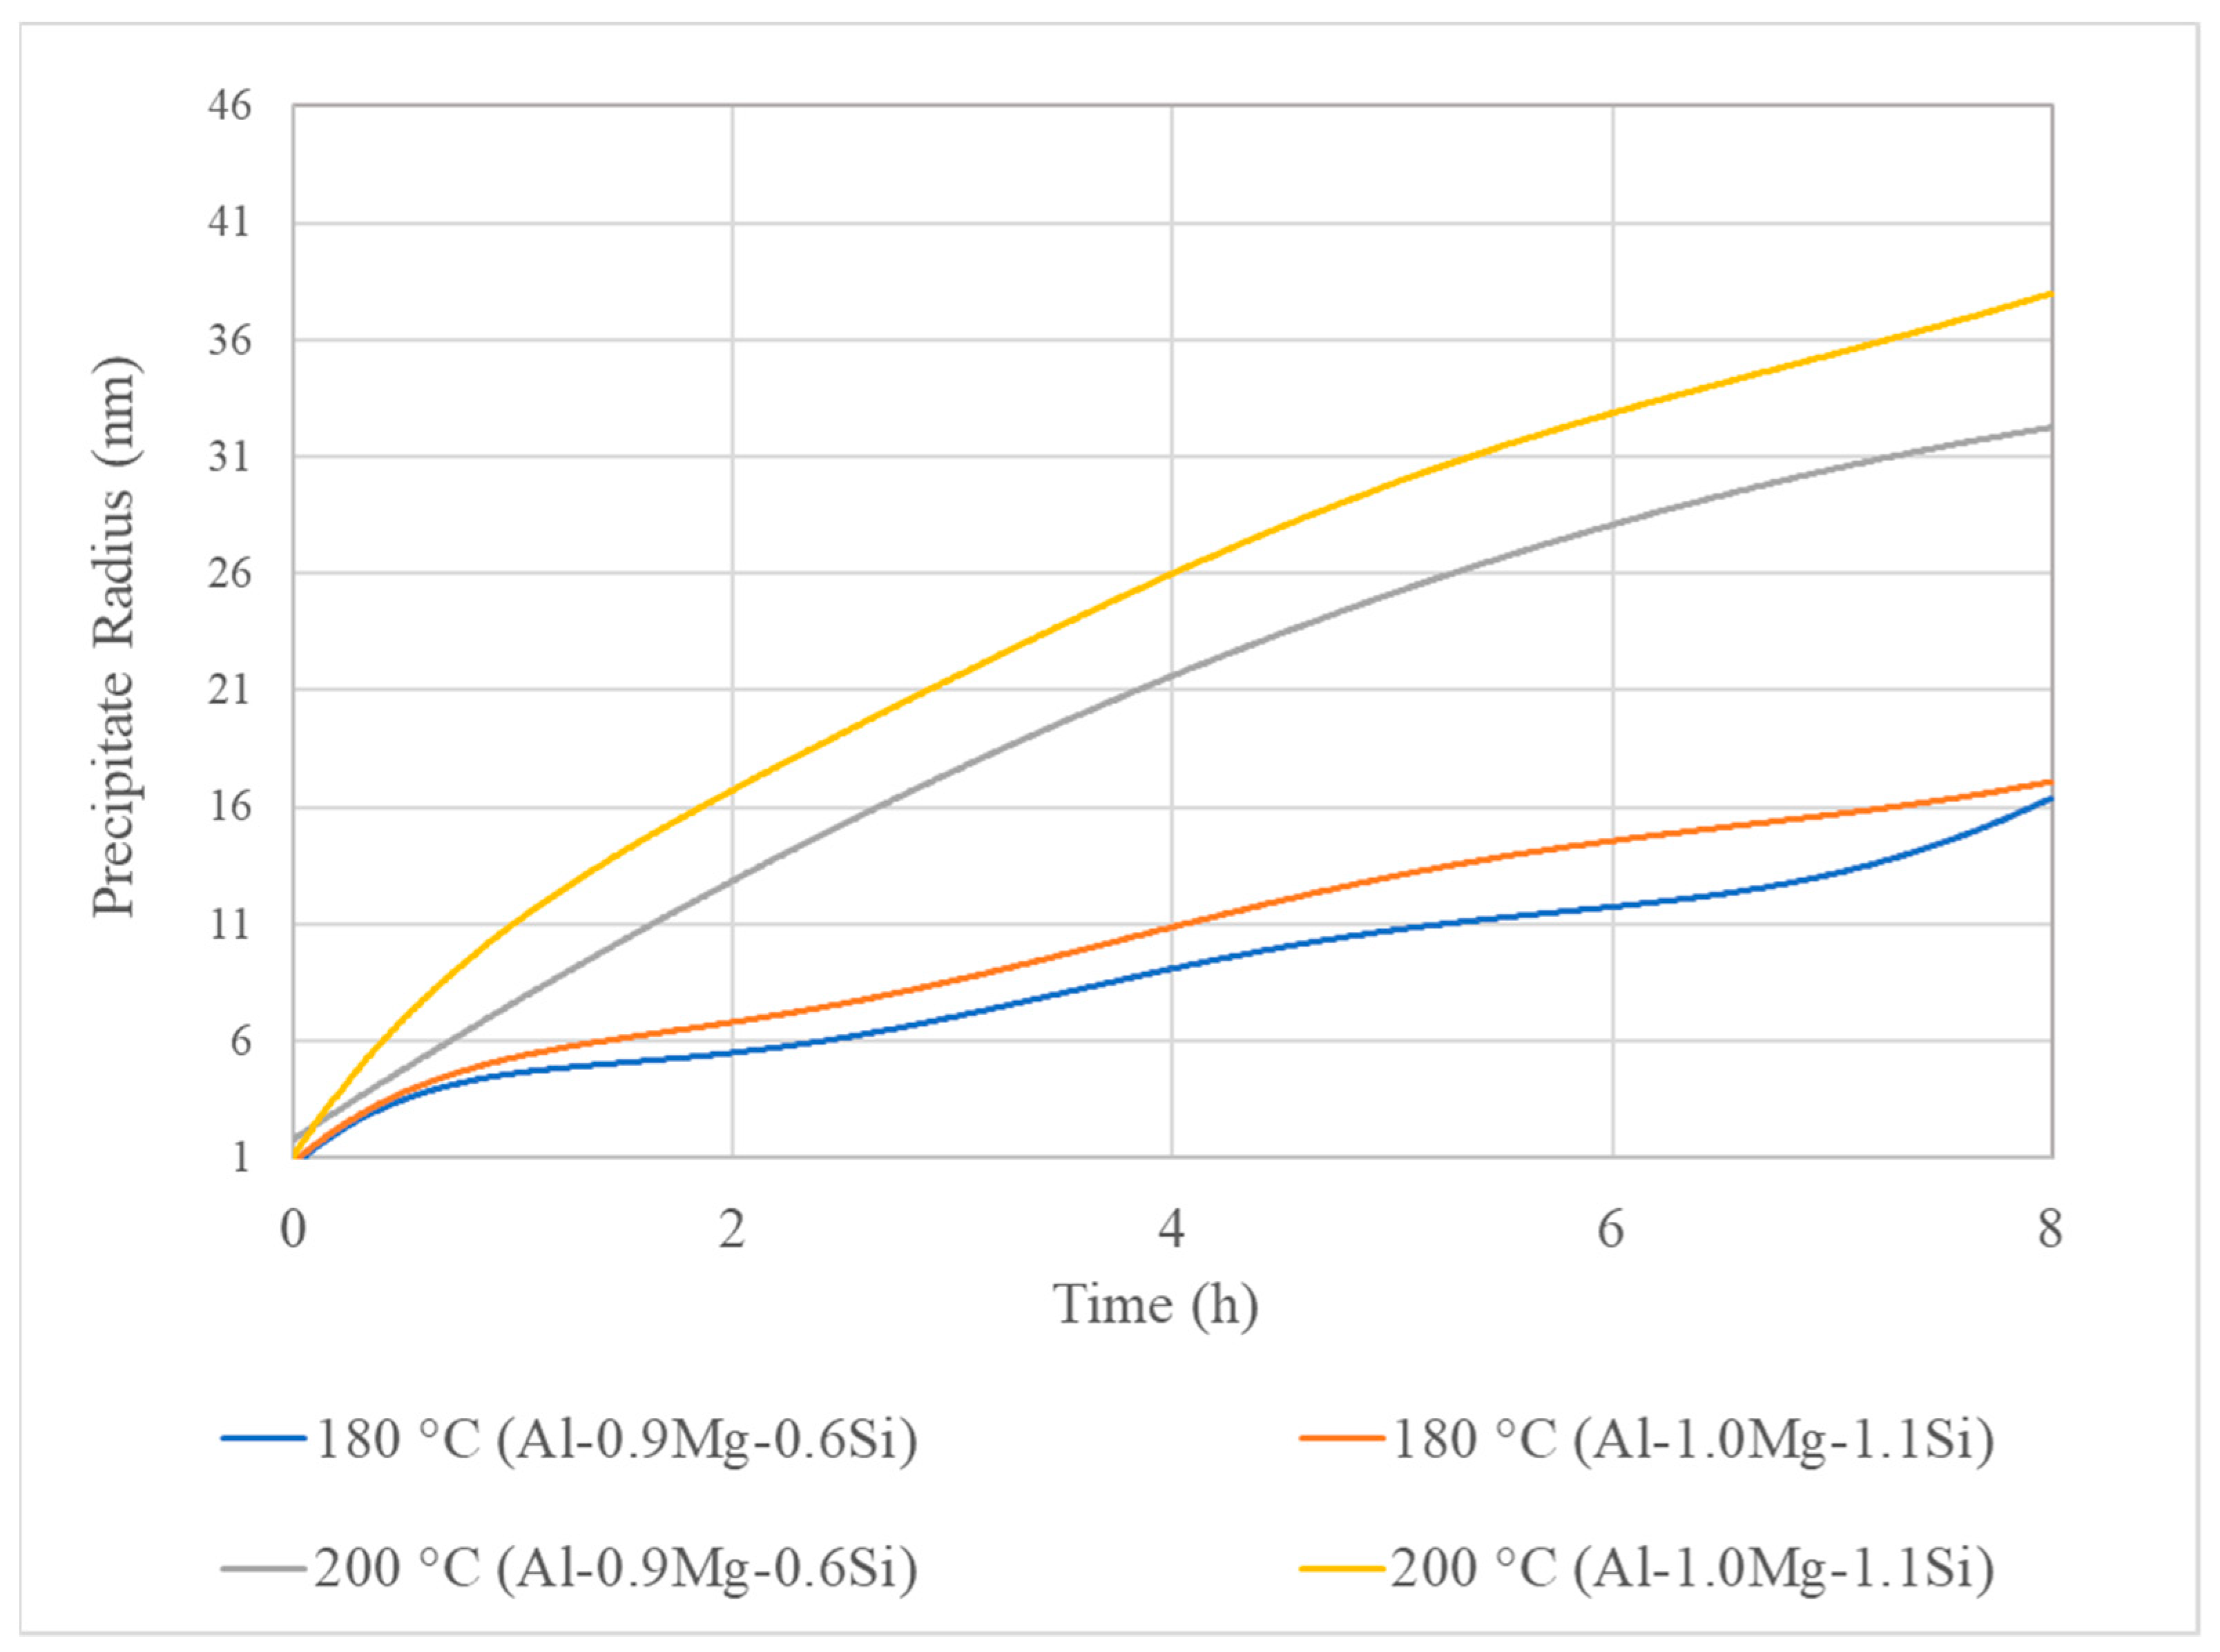
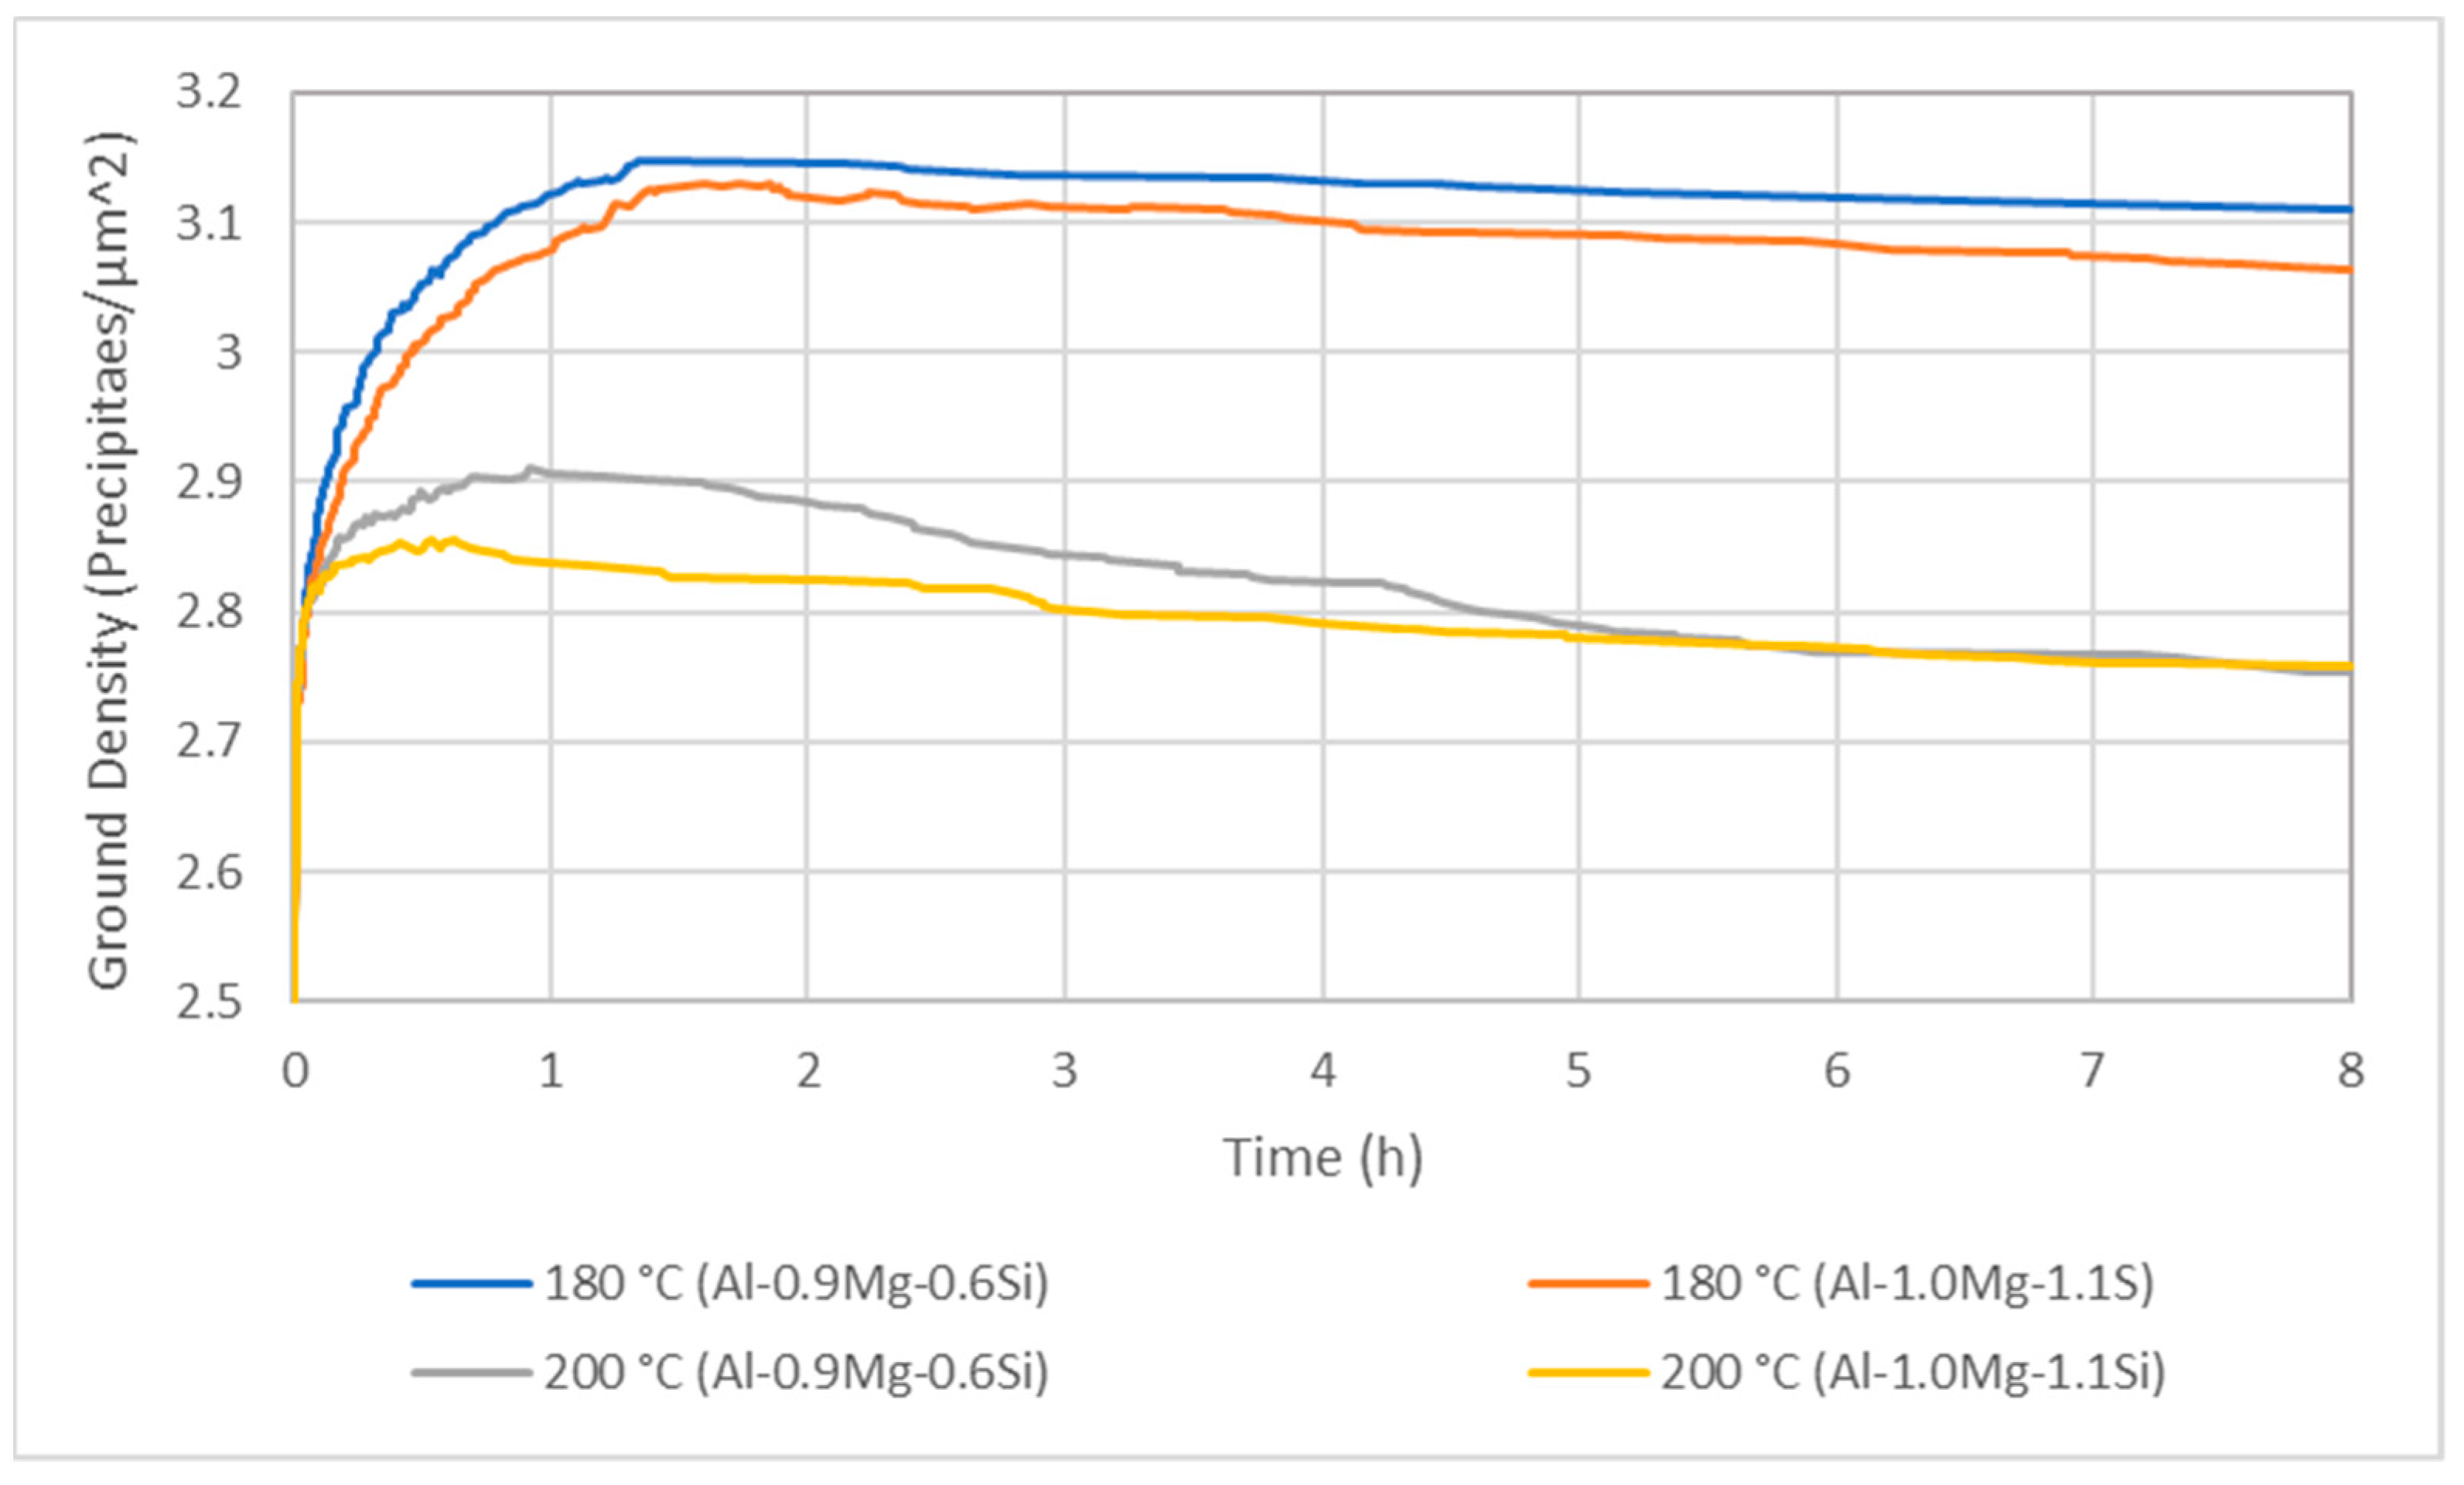
As illustrated by Figure 9, the precipitate average radius records its lower values for the 180 °C ageing simulation, equal to 16.4 nm for Al-0.9Mg-0.6Si and 17 nm for Al-1.0Mg-1.1Si. For 200 °C ageing, the average radius significantly increases, reaching the value 32.2 nm for the ternary Al-0.9Mg-0.6Si and 37.9 nm for Al-1.0Mg-1.1Si system. For constant ageing temperature, the two compositions record similar values, with a slightly higher price achieved by the Al-1.0Mg-1.1Si system. From both Figure 9 and Figure 10, it can be seen that for the 180 and 200 °C simulations, precipitates and their average radius are rapidly grown, while their increasing rate reaches a plateau after 4 h of ageing. Given that all simulations begin with the same number of Mg2Si grains and the same overall study surface, Figure 10 depicts the evolution of precipitate’s density.
It can be seen that, in every simulation, a slight decrease of precipitate density is recorded as the thermodynamically unstable precipitates are dissolved providing Mg and Si content for the growth of the thermodynamically stable precipitates. It is also observed that for the lower ageing temperatures (180 °C), with the lowest precipitate fractions, precipitate density appears to have its highest values. On the other side, the 200 °C ageing simulations, attributed to the maximum precipitate fraction, have the lowest values of precipitate density. This contradiction between the precipitate fraction and density is explained by the fact that the rise of ageing temperature results in the increase of the average precipitate radius, although the overall number of precipitates is reduced.
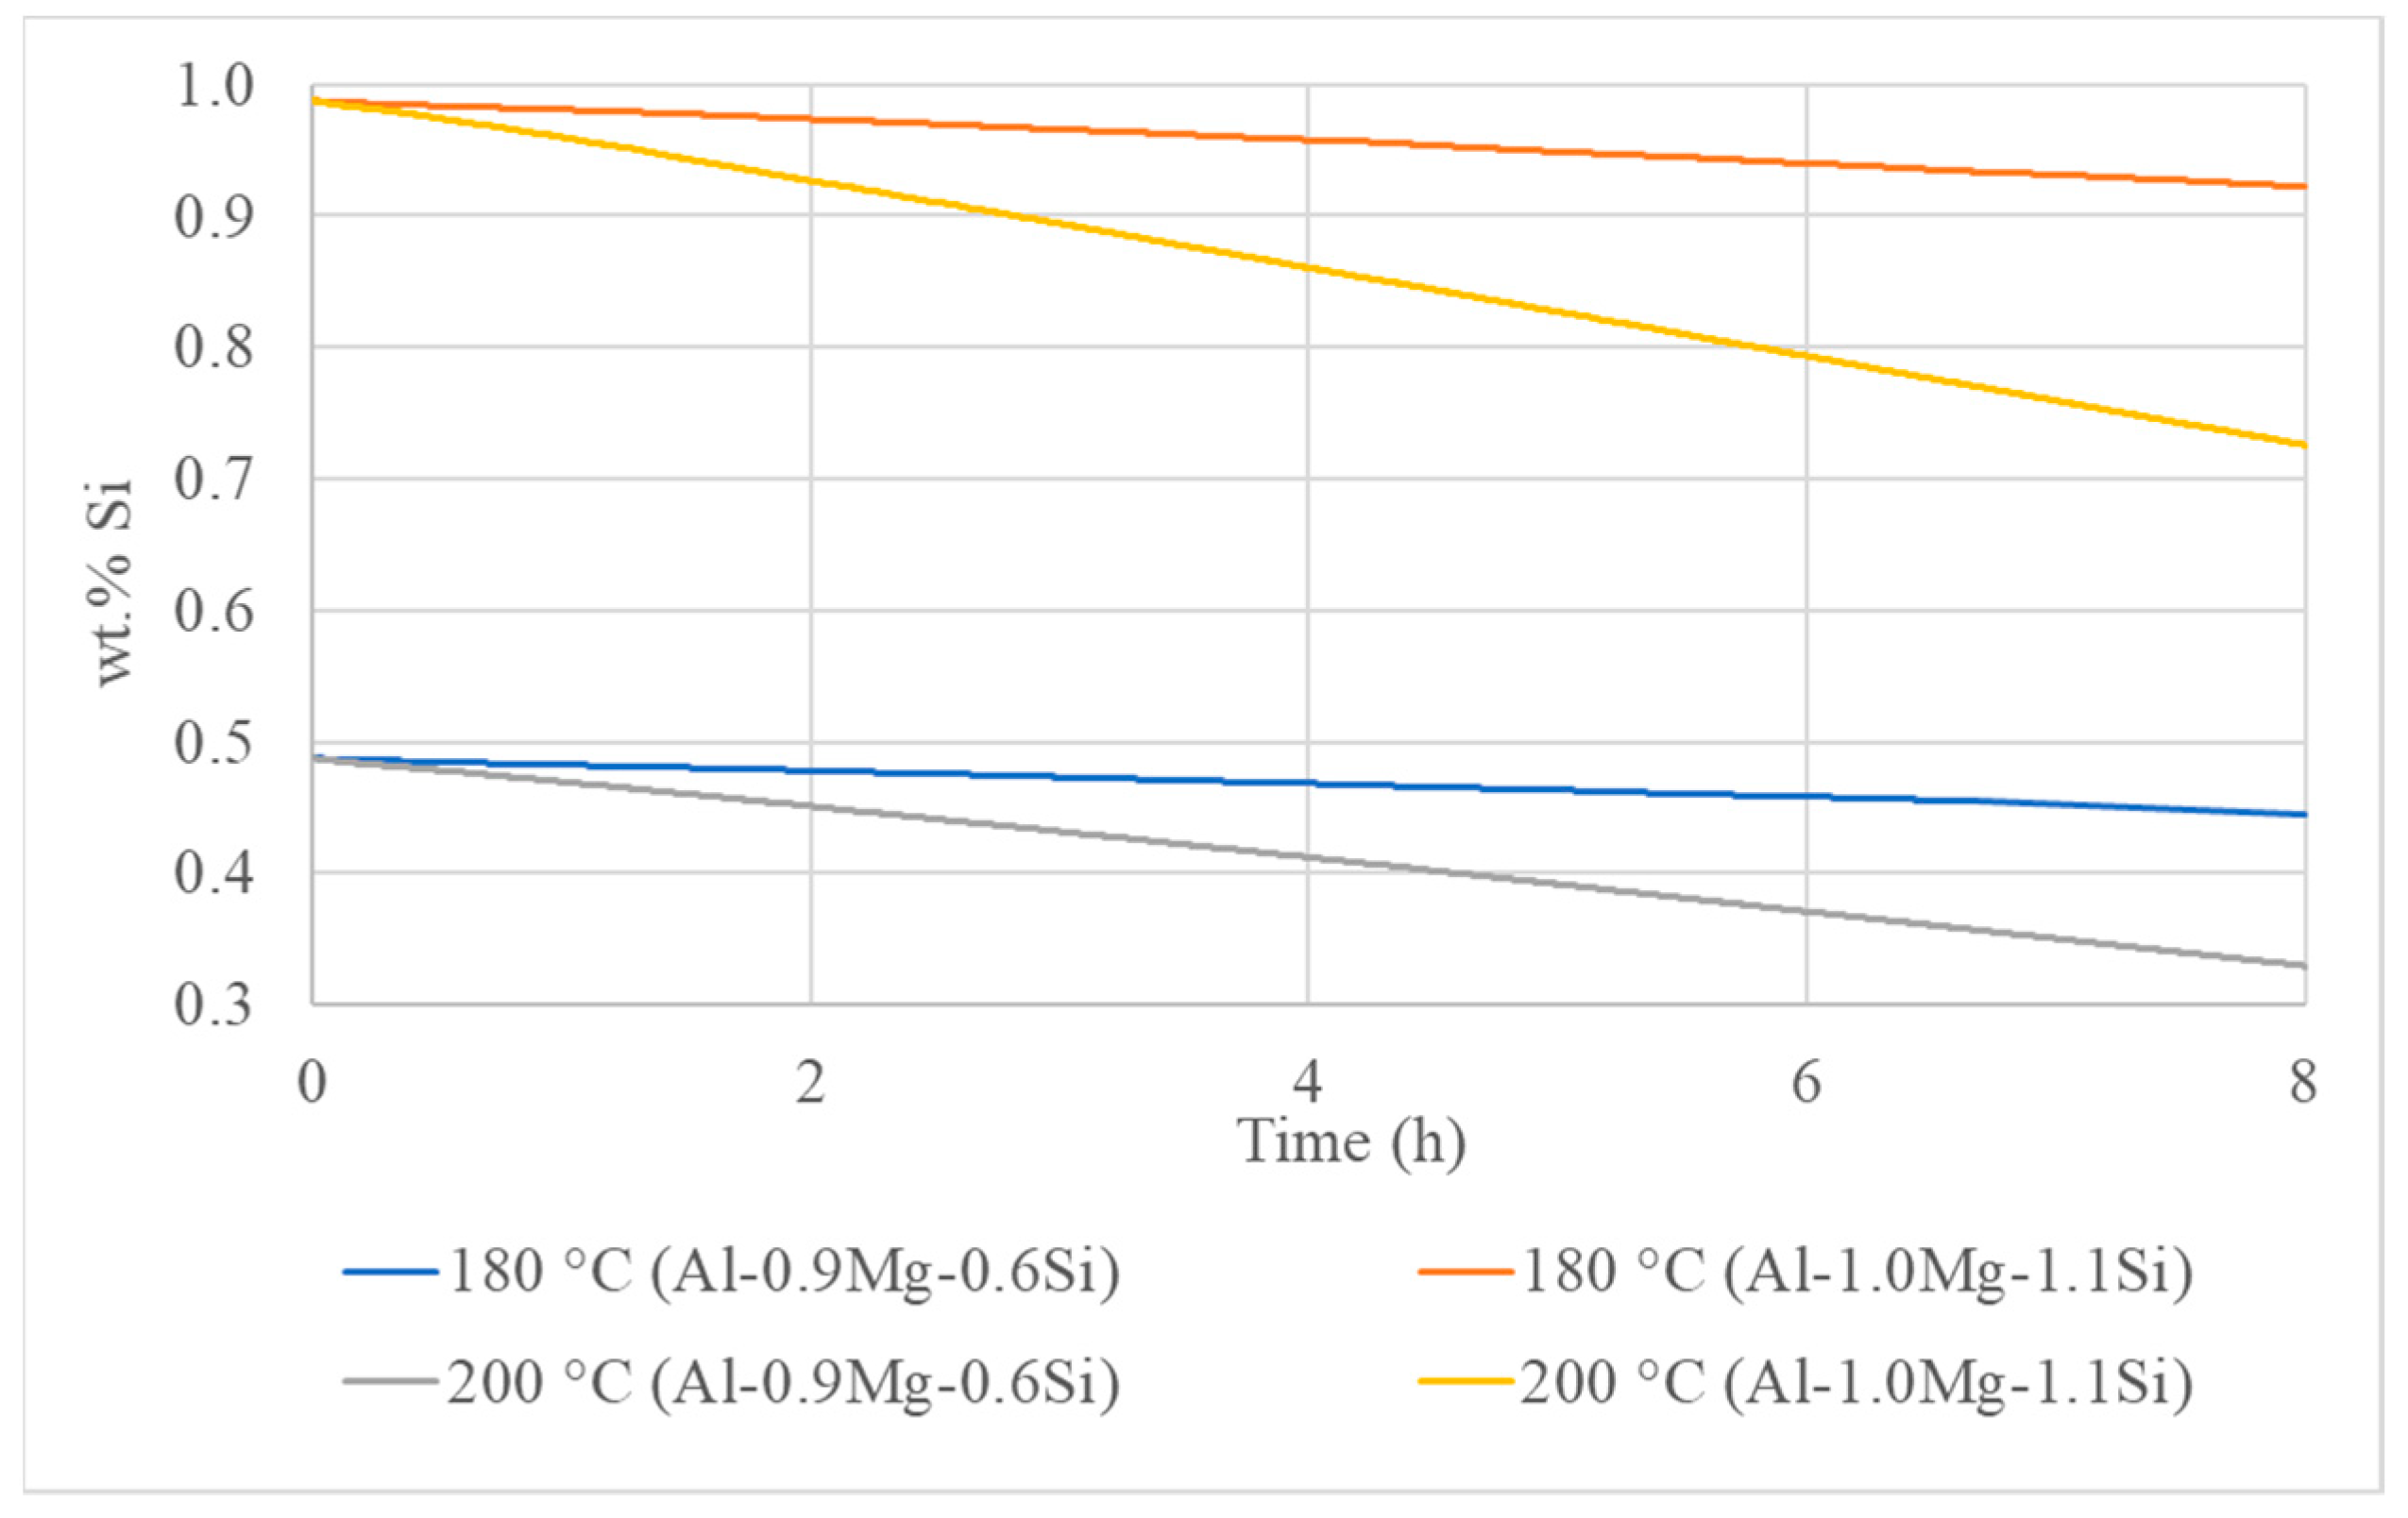
Figure 11 depicts the variation of Mg and Si concentration in the matrix. Mg and Si concentrations in Mg2Si are constant, 63% and 37%, respectively. The conducted simulations do not consider the iron intermetallic particles, which restrict the available Si, based on Equation (10), as long as the presence of iron intermetallic phases reduces the available Si for the Mg2Si precipitation.
A posteriori, Equation (10) is implemented, taken the composition of Mn kai Fe from Table 1, so as to identify if the absence of iron particles resulted in an overestimation of available Si, and consequently, an overestimation of precipitate fraction and radius. Figure 12 presents the availability of Si for precipitation based on the restriction of Equation (10). As anticipated, Mg and Si concentrations in the matrix decreased, as the volume fraction of precipitates increased, with the most significant reduction estimated in the 200 °C ageing simulation, where the highest value of precipitates is recorded. The variation of Mg concentration in the matrix phase is most significant in comparison to Si, as Mg has higher concentration in Mg2Si phase, rather than Si. Based on Figure 12, it can be estimated that the absence of iron phases in simulation microstructure does not lead to overestimation of precipitate volume fraction as Si concentration has a surplus in the matrix.
c e f f Si   =   c o Si     0.25 ( c o Fe   +   c o Mn )
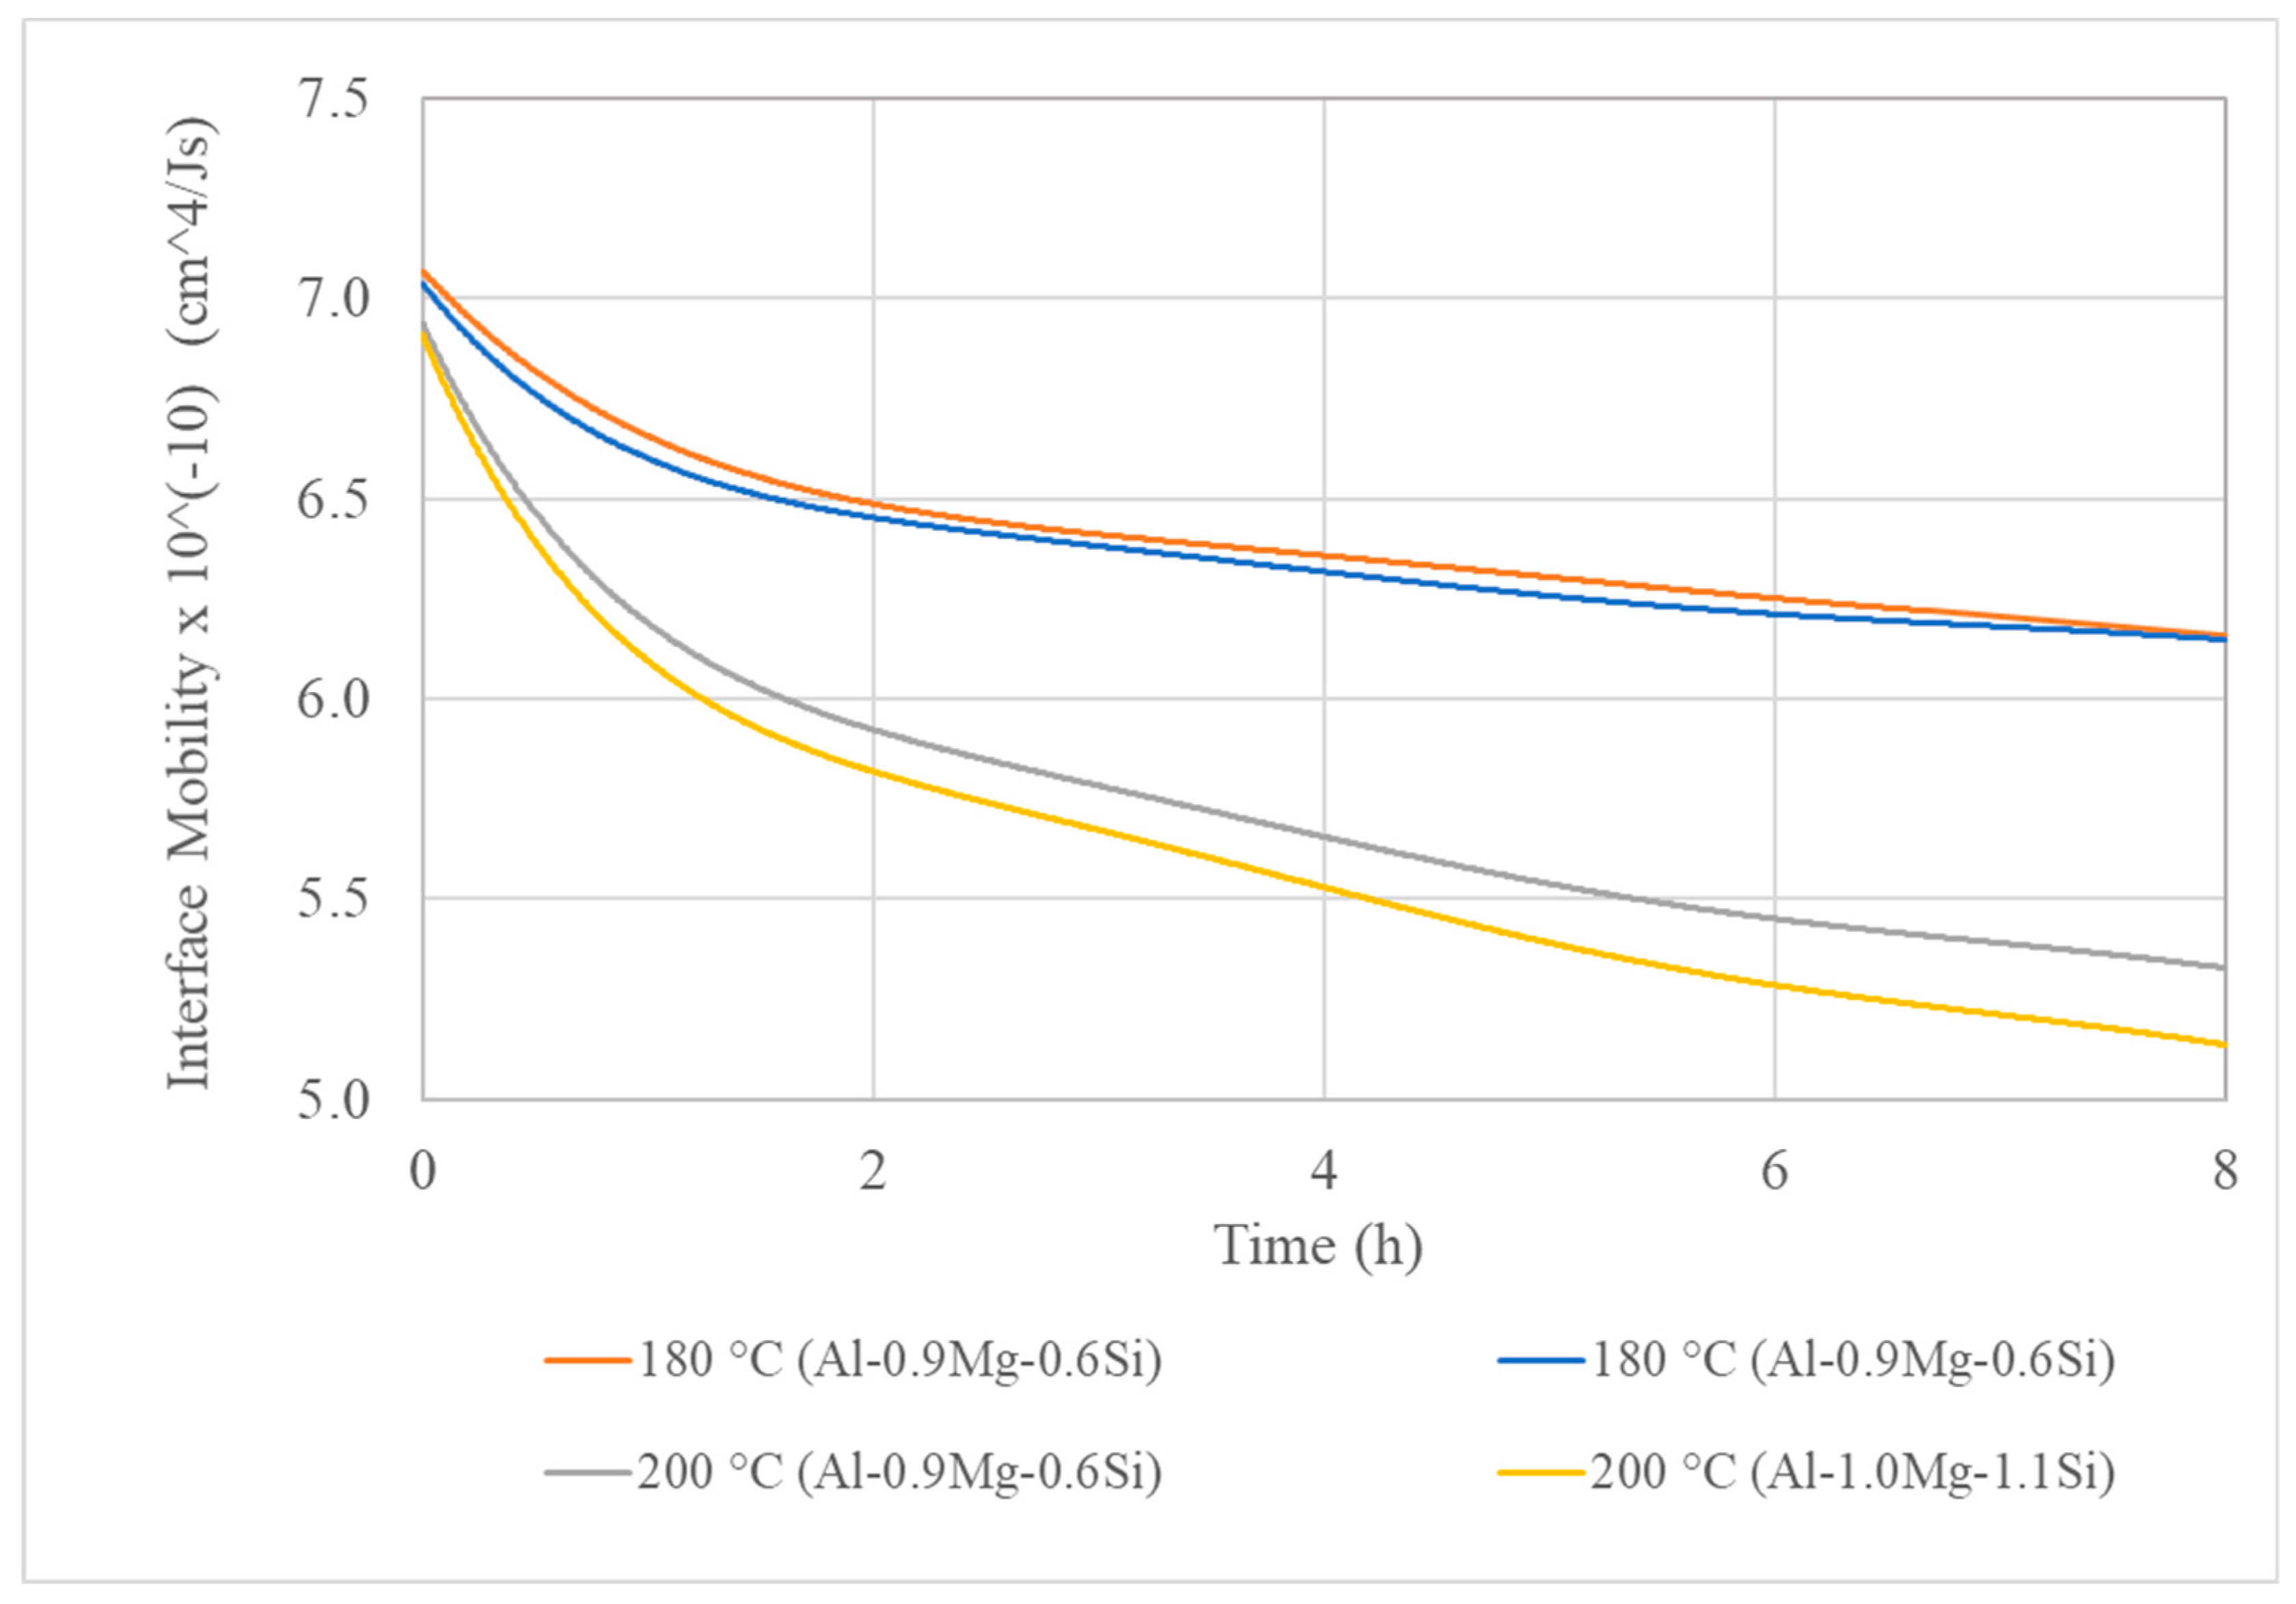
Figure 13 presents the microstructure simulation by the end of each ageing simulation. It can be seen that there is a mutual distribution of precipitates, both on the bulk region of the matrix phase grains, the interfaces, and the triple junctions. At the initial ageing steps, particles precipitated primarily in the bulk region, while some precipitate free zones were present in the microstructure. Around the triple junctions, some precipitation-free zones have been noticed, as the formation of particles in the triple junctions depletes the availability of Mg and Si for further precipitation. Figure 14 presents the interface mobility, and Table 6 the diffusion coefficients of Mg and Si in matrix phase calculated by ThermoCalC@. The interface mobility records its highest values for the lower temperature of 180 °C, and its lower value for the highest ageing temperature of 200 °C. On the contrary, diffusion coefficients of Mg and Si in the matrix phase are increased for higher ageing temperatures with the Si coefficient having a slightly higher value than its Mg counterpart. As the ageing temperature is increased, the diffusion mechanism is getting more important, while for lower ageing temperatures, the interface mechanism is of greater importance. Diffusion coefficients in precipitates are considered equal to zero, as Mg2Si are stoichiometric intermetallic compounds with standard chemical composition and minimum solubility.
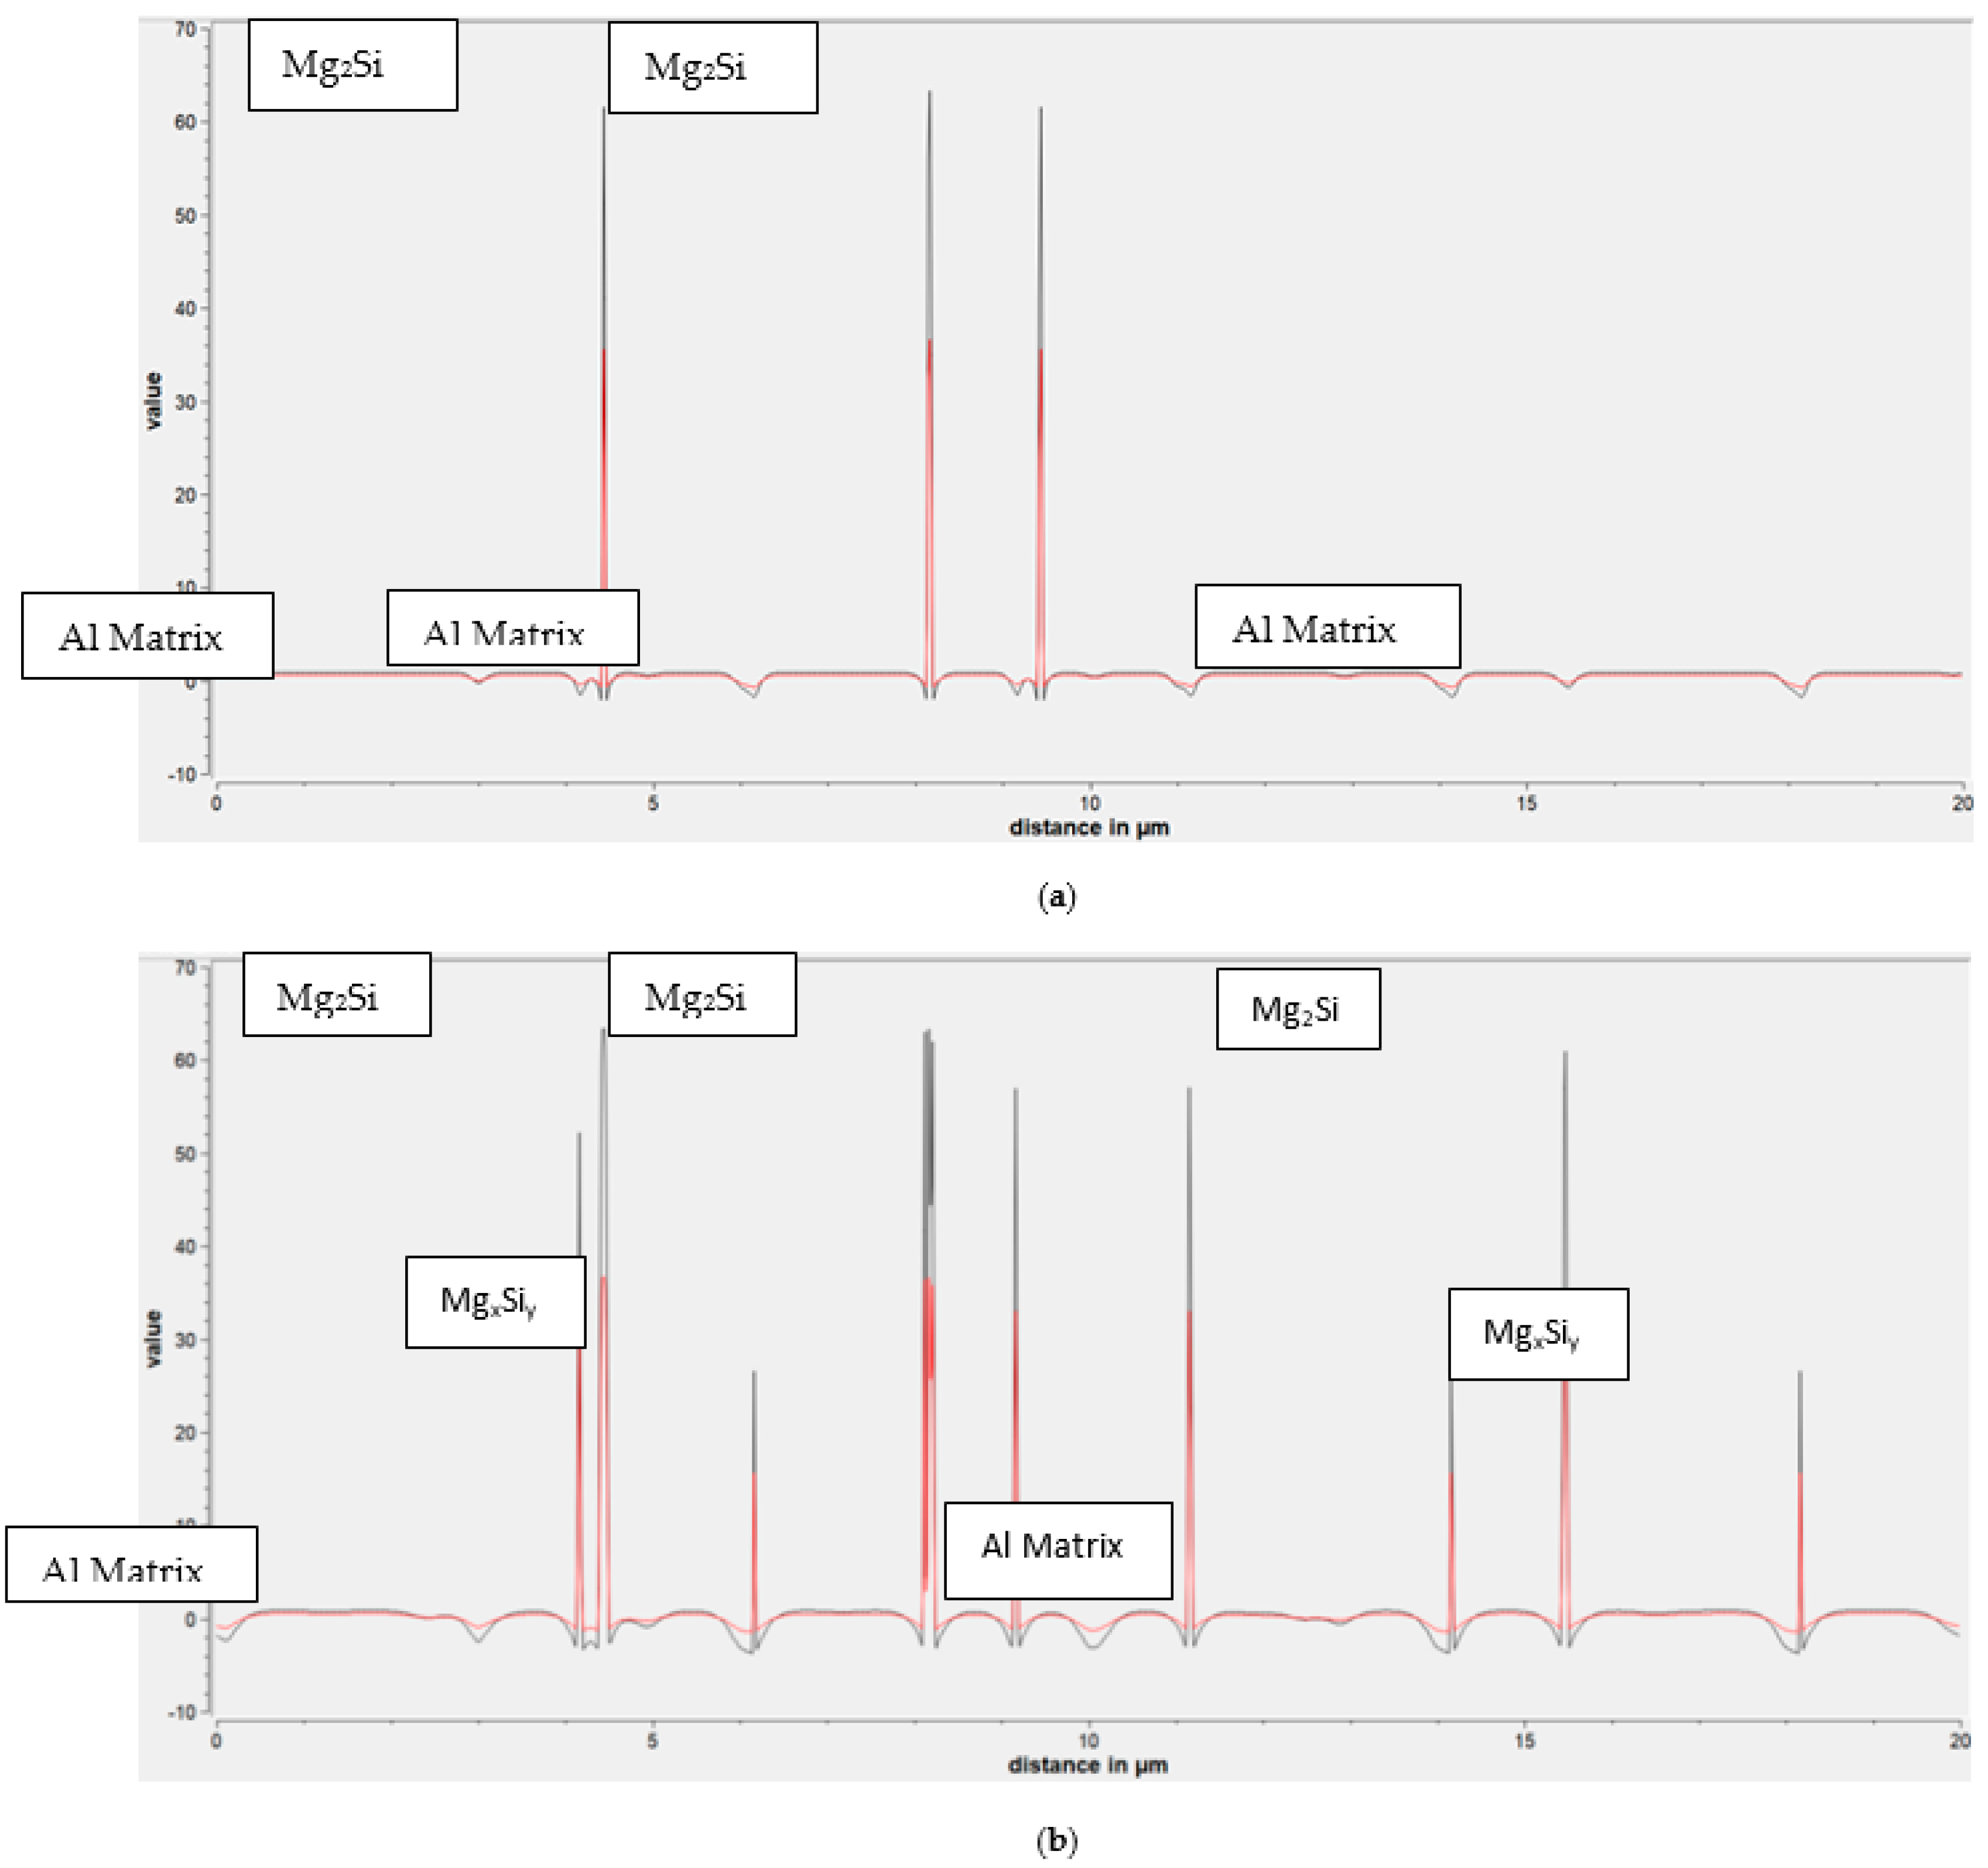
Figure 15 depicts the virtual EDX analysis, provided by the MICRESS® software, where the red curve represents the Si concentration and the black curve represents the Mg concentration, in both matrix phase and precipitates. The virtual EDX analysis has been considered for the horizontal line on the centre of the microstructure. The vertical axis represents the % concentration of Mg and Si, while the horizontal axis represents the position in the microstructure. For the lower ageing temperature, of 180 °C, a sparse dispersion of both Mg and Si curves has been recorded, because of the low volume fraction of precipitates. It is worth mentioning that the peak of Si curve is equal to 37% and the peak of Mg curve is equal to 63%, both attributed to Mg2Si precipitates. For the 200 °C simulations, intense distribution is recorded, due to the increase of precipitate fraction, while some peaks have been noticed, lower than 63% and 37%. These peaks are attributed to precipitate particles, which have not received their final chemical composition of Mg2Si. Figure 16 and Figure 17 depict the estimated values of yield strength and hardness, based on Equations (4)–(9), for the final ageing conditions. For the 180 °C ageing, lower values of yield strength and hardness are recorded, due to the relatively low volume fraction of precipitates. More precisely, for the ternary Al-0.9Mg-0.6Si system, the values of yield strength and hardness are equal to 139 MPa and 62 HV, respectively, while for the ternary Al-1.0Mg-1.1Si, the corresponding values are 176 MPa and 74 HV. The increase of the precipitate fraction results in the enhancement of yield strength and hardness for both ternary systems. At 200 °C, yield strength is 223 (Al-0.9Mg-0.6Si) and 291 (Al-1.0Mg-1.1Si) MPa, while hardness is 89 and 112 HV, respectively.

4. Discussion

The predicted kinetics of recrystallisation, by the phase-filed simulation, satisfactorily approaches the experimental data of Poletti et al. [22] for the recrystallisation of AA6XXX aluminium alloys, with the same level of previous deformation and similar impact of secondary particles. The insignificant impact of secondary particles can be explained by their relatively small volume fraction and the fact that only a small proportion of these particles is nanoscopic, retarding the recrystallisation mechanism, while the larger particles, in the range of some μm, enhance recrystallisation kinetics, through precipitation stimulated nucleation (PSN).
Regarding the ageing simulation, the particularly high number of cells in the microstructure analysis proves the difficulty in accurately illustrating nanoscopic particles as part of the overall microstructure. For the 180 °C ageing simulation, the 8h treatment does not secure the maximum expected value of precipitate fraction. However, there is a severe deviation, in literature, about the time required for the peak ageing conditions in 180 °C. Although the majority of works report an ageing time between 6–10 h [33,38], some reports refer to prolong ageing treatments [11], while ASTM [38] predicted 70 h of treatment for lower ageing temperatures, 170–180 °C. On the other side, the 200 °C simulation was in good agreement with the expected duration of the treatment. The variation of ageing kinetics between the 180 °C and 200 °C simulations can be explained by the increasement of diffusion rates of Mg and Si in 200 °C, which resulted in the increase of growth rate for the precipitates. The maximum values of the precipitate fraction agree, generally, with the ones expected by the literature. For the ternary Al-0.9Mg-0.6Si, which is within the Mg and Si concentration range of AA6061 and AA6063 alloys, the precipitate fraction lies on the range of 0.7 to 1.4% [1,4]. On the other side, the ternary Al-1.0Mg-1.1Si system is attributed to the AA6082 aluminium alloy, where the precipitate fraction can reach higher peaks, even nearby 1.4 to 1.9% [1,39]. The increased diffusion coefficients of 200 °C explain the significant increase of the average precipitate radius, as depicted in Figure 9. The gradual reduction of the overall number of precipitates is explained by the Ostwald ripening mechanism. Precipitates, whose radius is close to interface width, are unstable for the saturated matrix phase, where the elements tend to leave the lattice, so as to create more stable particles.
It is worth noting that the predicted values of precipitate radius appear to have a significant variation than those recorded for the Kampman–Wagner simulations, where the average precipitate radius is about 3 to 10 nm [1,9].
This deviation can be explained by the different approach toward the nucleation-growth-coarsening/dissolution of precipitates, the different values of critical ageing parameters, like the interface energy and the molar volume of the matrix phase and precipitates, the different approach toward the concentration gradient at the matrix phase-precipitates interfaces, and the fact that the applied Phase-Field model inserts atomic and mobility databases through CALPHAD modelling (ThermoCalC@). It is worth mentioning that the final average radius of precipitates in the applied Phase-Field modelling is affected by the competitive relationship between particles, created during different ageing time steps [40,41,42]. The deviation of the average radius, between models, may result from the difference in the estimated values of activation energy for Mg and Si diffusion rates, as Bahrami [1] has shown that the reduction of the considered activation energy results in the increment of mean radius, due to the rise of the diffusion rates. According to literature, the average size of the metastable particles lies between 40–130 nm, depending on the morphology of precipitates and ageing conditions (temperature and time). Therefore, the simulated results are within the expected spectra [43,44].
The predicted values of hardness and yield strength for the 180 °C are far lower than those anticipated for the peak-ageing condition (T6) and agree with the under-ageing condition for the ternary Al-0.9Mg-0.6 and Al-1.0Mg-1.1Si system, while the 200 °C values approach the peak ageing condition. More precisely, the peak-ageing strength is about 214 (AA6063)-250(AA6061) [1,2,4] MPa for the ternary Al-0.9Mg-0.6Si system and 300–310 (AA6082) MPa [37,41,45] for the ternary Al-1.0Mg-1.1Si system. The peak ageing value of hardness is equal to 73–94 HV [2,4,9] for the ternary Al-0.9Mg-0.6Si, and 100–110 HV [37,41] for the ternary Al-1.0Mg-1.1Si system. The root causes of the lower values of hardness and strength in the 180 °C ageing treatment can be attributed to the lower diffusion rates in the specific temperature resulting in lower chemical driving force for the precipitation. It is worth noting that in the yield strength and hardness model, a rather conservative value for the annealing-intrinsic yield strength (16 MPa) has been used so as to primarily emphasize the importance of precipitation procedure for the enhancement of the mechanical properties. The value of the intrinsic strength combined with the absence of alloying elements contribution to the solid solution strengthening, beyond the contribution of Mg and Si, may result in a slight underestimation of the peak ageing yield strength and hardness.
Finally, the estimation for the uniform distribution of precipitates both in the bulk region of matrix phase, the interfaces and the triple junctions agree with the theory of heterogeneous nucleation and it is desired for the final microstructure, as the exclusive precipitate in the interfaces would made them intensively brittle, while the presence of Precipitate-Free-Zones (PFZ) [46] is connected with the lower corrosion resistance of the aged alloy, the rise of the chemical heterogeneity and the intergranular cracking, due to the variation of strength between the interior of the grains, which are enriched in particles, and the depleted interfaces.

5. Conclusions

The simulation of Al-Mg-Si alloys heat treatment through MultiPhase-Field based MICRESS@ software, led to the following conclusions:
  • The 400 °C/5 min annealing simulation accurately predicted the recrystallisation kinetics proving a slight impact of secondary nanoparticles on the deceleration of recrystallisation mechanism and the average radius of recrystallized grains. This deceleration is explained by the lower values of the interface mobility.
  • The ageing simulation predicted the under-ageing condition for the 180 °C-8 h treatment and the peak ageing condition for the 200 °C-8 h ageing simulations.
  • For lower ageing temperatures, the interface mobility has more significant impact on the precipitation mechanism. On the contrary, the rise of temperature results in severe increase of diffusion mechanism, causing the coarsening of precipitate particles, which nucleate and grow both on the interior of Al matrix phase grains and the interfaces and triple junctions.

Author Contributions

We describe contributions to the paper using the CRediT (Contributor Roles Taxonomy). Conceptualization: S.P.; methodology: S.P., A.B., and M.B.; software: A.B., and M.B.; validation: A.B. and M.B.; formal analysis: A.B. and M.B.; investigation: A.B. and M.B.; resources: A.B. and M.B.; data curation: A.B., M.B.; writing—original draft preparation: A.B.; writing—review and editing: A.B., M.B., and S.P.; visualization: A.B., M.B.; supervision: M.B. and S.P.; project administration: S.P. All authors have read and agreed to the published version of the manuscript.

Funding

This research did not receive any specific grant from funding agencies in the public, commercial, or non-for-profit sectors.

Institutional Review Board Statement

Not Applicable.

Informed Consent Statement

Not Applicable.

Data Availability Statement

Data available on request due to restrictions, as the research is ongoing.

Acknowledgments

The work described in this article was supported by the Hellenic Research Centre for Metals S.A (ELKEME S.A). The authors would like to acknowledge E. Gavalas for his assistance and scientific advice during the designing of the project.

Conflicts of Interest

The authors declare no conflict of interest.

References

  1. Bahrami, A. Modeling of Precipitation Sequence and Ageing Kinetics in Al-Mg-Si Alloys. Ph.D. Thesis, Delft University of Technology, Delft, Poland, 2010. [Google Scholar]
  2. Mukhopadhyay, P. Alloy Designation, Processing, and Use of AA6XXX Series Aluminium Alloys. ISRN Metall. 2012. [Google Scholar] [CrossRef] [Green Version]
  3. Engler, O.; Hirsch, J. Texture control by thermomechanical processing of AA6xxx Al–Mg–Si sheet alloys for automotive applications—A review. Mater. Sci. Eng. A 2002, 336, 249–262. [Google Scholar] [CrossRef]
  4. Nisaratanaporn, E. Microstructural Development and Pressure Requirements in 6063 Aluminium Alloy Tube Extrusion. Ph.D. Thesis, Imperial College, London, UK, 1995. [Google Scholar]
  5. Esmaeili, S.; LIoyd, D.J.; Poole, W.J. Modeling of precipitation hardening for the naturally aged Al-Mg-Si-Cu alloy AA6111. Acta Mater. 2003, 51, 3467–3481. [Google Scholar] [CrossRef]
  6. Lan, Y.; Pinna, C. Modelling the static recrystallisation texture of FCC metals using a phase field method. Mater. Sci. Forum 2012, 715, 739–744. [Google Scholar] [CrossRef]
  7. Jou, H.-J.; Lusk, M.T. Comparison of Johnson-Mehl-Avrami-Kologoromov kinetics with a phase-field model for microstructural evolution driven by substructure energy. Phys. Rev. B 1997, 55, 8114–8121. [Google Scholar] [CrossRef]
  8. Weinkamer, R.; Fratzl, P.; Gupta, H.S.; Penrose, O.; Lebowitz, J.L. Using Kinetic Monte Carlo simulations to study phase separation in Alloys. Phase Transit. 2004, 77, 433–456. [Google Scholar] [CrossRef]
  9. Myhr, O.R.; Grong, Ø.; Andersen, S.J. Modelling of the age hardening behaviour of Al–Mg–Si alloys. Acta Mater. 2001, 49, 65–75. [Google Scholar] [CrossRef]
  10. Mao, F.; Bollmann, C.; Brüggemann, T.; Liang, Z.; Jiang, H.; Mohles, V. Modelling of the Age-Hardening Behavior in AA6xxx within a Through-Process Modelling Framework. Mater. Sci. Forum 2017, 877, 640–646. [Google Scholar] [CrossRef]
  11. Povoden-Karadeniz, E.; Lang, P.; Warczok, P.; Falahati, A.; Jun, W.; Kozeschnik, E. Calphad modeling of metastable phases in the Al–Mg–Si system. Calphad 2013, 43, 94–104. [Google Scholar] [CrossRef]
  12. Raabe, D. Computational Materials Science: The Simulation of Materials Microstructures and Properties; Wiley-VCH: New York, NY, USA, 1998. [Google Scholar]
  13. Moelans, N.; Blanpain, B.; Wollants, P. An introduction to phase-field modeling of microstructure evolution. Calphad 2007, 32, 268–294. [Google Scholar] [CrossRef]
  14. Bhadeshia, H.; Qin, R.S. Phase field method. Mater. Sci. Technol. 2010, 26, 803–811. [Google Scholar]
  15. Lewis, D.; Warren, J.; Boettinger, W.; Pusztai, T.; Granasy, L. Phase-field models for eutectic solidification. Jom 2004, 56, 34–39. [Google Scholar] [CrossRef]
  16. Nestler, B.; Choudhury, A. Phase-field modeling of multi-component systems. Curr. Opin. Solid State Mater. Sci. 2011, 15, 93–105. [Google Scholar] [CrossRef]
  17. Mueller, J.J.; Matlock, D.K.; Speer, J.; De Moor, E.; Moor, D. Accelerated Ferrite-to-Austenite Transformation During Intercritical Annealing of Medium-Manganese Steels Due to Cold-Rolling. Metals 2019, 9, 926. [Google Scholar] [CrossRef] [Green Version]
  18. Ta, N.; Zhang, L.; Du, Y. Design of the Precipitation Process for Ni-Al Alloys with Optimal Mechanical Properties: A Phase-Field Study. Metall. Mater. Trans. A 2014, 45, 1787–1802. [Google Scholar] [CrossRef]
  19. Xu, Q.; Zhang, Y. Precipitation and Growth Simulation of γ′ Phase in Single Crystal Superalloy DD6 with Multiphase-Field Method and Explicit Nucleation Algorithm. Metals 2020, 10, 1346. [Google Scholar] [CrossRef]
  20. Ji, Y.; Ghaffari, B.; Li, M.; Chen, L.-Q. Phase-field modeling of θ′ precipitation kinetics in 319 aluminum alloys. Comput. Mater. Sci. 2018, 151, 84–94. [Google Scholar] [CrossRef]
  21. Steinbach, I.; Pezzolla, F.; Nestler, B.; Seeßelberg, M.; Prieler, R.; Schmitz, G.J.; Rezende, J.L. A phase field concept for multiphase systems. Phys. D Nonlinear Phenom. 1996, 94, 135–147. [Google Scholar] [CrossRef]
  22. Poletti, M.C.; Bureau, R.; Loidolt, P.; Simon, P.; Mitsche, S.; Spuller, M. Microstructure Evolution in a 6082 Aluminium Alloy during Thermomechanical Treatment. Material 2018, 11, 1319. [Google Scholar] [CrossRef] [Green Version]
  23. Pedersen, K.O.; Lademo, O.-G.; Berstad, T.; Furu, T.; Hopperstad, O. Influence of texture and grain structure on strain localisation and formability for AlMgSi alloys. J. Mater. Process. Technol. 2008, 200, 77–93. [Google Scholar] [CrossRef]
  24. Georgakou, A.-G. Phase-Field Simulation of Recrystallization and Grain Growth: Description of MICRESS Software and Application in AI-Mg-Sc-Zr Alloy. Bachelor’s Thesis, University of Volos, Volos, Greece, 2013. [Google Scholar]
  25. Ratchev, P.; Jessner, P. Role of the Mn-Dispersoids and Mg2Si Particles in the Recrystallization of Automotive 6xxx Alloys. Mater. Sci. Forum 2014, 794, 1227–1232. [Google Scholar] [CrossRef]
  26. Farè, S.; Lecis, N.; Vedani, M. Aging Behaviour of Al-Mg-Si Alloys Subjected to Severe Plastic Deformation by ECAP and Cold Asymmetric Rolling. J. Met. 2011, 2011, 1–8. [Google Scholar] [CrossRef] [Green Version]
  27. Adamczyk-Cieślak, B.; Mizera, J. Ultra-Fine Grain Structures of Model Al-Mg-Si Alloys Produced by Hydrostatic Extrusion. In Proceedings of the International Conference on Advances in Materials and Processing Technologies, Paris, France, 24–27 October 2010. [Google Scholar]
  28. Kai, X.; Chen, C.; Sun, X.; Wang, C.; Zhao, Y. Hot deformation behavior and optimization of processing parameters of a typical high-strength Al–Mg–Si alloy. Mater. Des. 2016, 90, 1151–1158. [Google Scholar] [CrossRef]
  29. Werinos, M.; Antrekowitsch, H.; Kozeschnik, E.; Ebner, T.; Moszner, F.; Löffler, J.; Uggowitzer, P.; Pogatscher, S. Ultrafast artificial aging of Al–Mg–Si alloys. Scr. Mater. 2016, 112, 148–151. [Google Scholar] [CrossRef]
  30. Yang, M.; Wei, H.; Zhang, J.; Zhao, Y.; Jin, T.; Liu, L.; Young, S. Phase-field study on effects of antiphase domain and elastic energy on evolution of γ′ precipitates in nickel-based superalloys. Comput. Mater. Sci. 2017, 129, 211–219. [Google Scholar] [CrossRef]
  31. Fallah, V.; Korinek, A.; Raeisinia, B.; Gallerneault, M.; Esmaeili, S. Early-Stage Precipitation Phenomena and Composi-tion-dependent Hardening in Al-Mg-Si-(Cu) Alloys. Mater. Sci. Forum 2014, 794–796, 933–938. [Google Scholar] [CrossRef]
  32. Qiao, J.; Chen, J.; Che, H. Crashworthiness assessment of square aluminum extrusions considering the damage evolution. Thin-Walled Struct. 2006, 44, 692–700. [Google Scholar] [CrossRef]
  33. Yang, M.; Chen, H.; Orekhov, A.; Lu, Q.; Lan, X.; Li, K.; Zhang, S.; Song, M.; Kong, Y.; Schryvers, D.; et al. Quantified contri-bution of β″ and β′ precipitates to the strengthening of an aged Al–Mg–Si alloy. Mater. Sci. Eng. A 2020, 774, 138776. [Google Scholar] [CrossRef]
  34. Nandy, S.; Ray, K.K.; Das, D. Process model to predict yield strength of AA6063 alloy. Mater. Sci. Eng. A 2015, 644, 413–424. [Google Scholar] [CrossRef]
  35. Sarafoglou, P.I.; Serafeim, A.; Fanikos, I.A.; Aristeidakis, J.S.; Haidemenopoulos, G.N. Modeling of Microsegregation and Homogenization of 6xxx Al-Alloys Including Precipitation and Strengthening During Homogenization Cooling. Material 2019, 12, 1421. [Google Scholar] [CrossRef] [Green Version]
  36. Kuijpers, N.C.; Vermolen, F.J.; Vuik, C.; Van der Zwang, S. A Model of the β-AlFeSi to α-Al(FeMn)Si transformation in Al-Mg-Si Alloys. Mater. Trans. 2003, 44, 1448–1456. [Google Scholar] [CrossRef] [Green Version]
  37. Liang, Y. An Investigation on the Optimum Aging Condition for HFQ-processed AA6082 Aluminium Alloy. Master’s Thesis, University of Birmingham, Birmingham, UK, 2016. [Google Scholar]
  38. Edwards, G.A.; Stiller, K.; Dunlop, G.L.; Couper, M.J. The precipitation sequence in Al-Mg-Si alloys. Acta Mater. 1998, 46, 3893–3904. [Google Scholar] [CrossRef]
  39. Herrnring, J.; Kashaev, N.; Klusemann, B. Precipitation Kinetics of AA6082: An Experimental and Numerical Investigation. Mater. Sci. Forum 2018, 941, 1411–1417. [Google Scholar] [CrossRef]
  40. Wagner, R.; Kampman, R. Materials Science and Technology-A Comprehensive Treatment; Wiley-VCH: Weinheim, Germany, 1991; p. 5. [Google Scholar]
  41. Du, Q.; Tang, K.; Marioara, C.D.; Andersen, S.J.; Holmedal, B.; Holmestad, R. Modeling over-ageing in Al-Mg-Si alloys by a multi-phase Calphad-coupled Kampmann-Wagner Numerical model. Acta Mater. 2017, 122, 178–186. [Google Scholar] [CrossRef] [Green Version]
  42. Holmedal, B.; Osmundsen, E.; Du, Q. Precipitation of Non-Spherical Particles in Aluminum Alloys Part I: Generalization of the Kampmann–Wagner Numerical Model. Met. Mater. Trans. A 2016, 47, 581–588. [Google Scholar] [CrossRef] [Green Version]
  43. Parson, N.C.; Yiu, H.L. The effect of heat treatment on the microstructure and properties of 6000 series alloy extrusion ingots. Miner. Met. Mater. Soc. 1989, 40, 18. [Google Scholar]
  44. Camero, S.; Puchi, E.S.; Gonzalez, G. Effect of 0.1% vanadium on precipitation behavior and mechanical properties of Al-6063 commercial alloy. J. Mater. Sci. 2006, 41, 7361–7373. [Google Scholar] [CrossRef]
  45. Polmer, I. Light Alloys: From Traditional Alloys to Nanocrystals, 4th ed.; Elsevier: Amsterdam, The Netherlands, 2005. [Google Scholar]
  46. Eastering, K.; Porter, D. Phase Transformations in Metals; Chapman & Hall: Hong Kong, China, 1992. [Google Scholar]
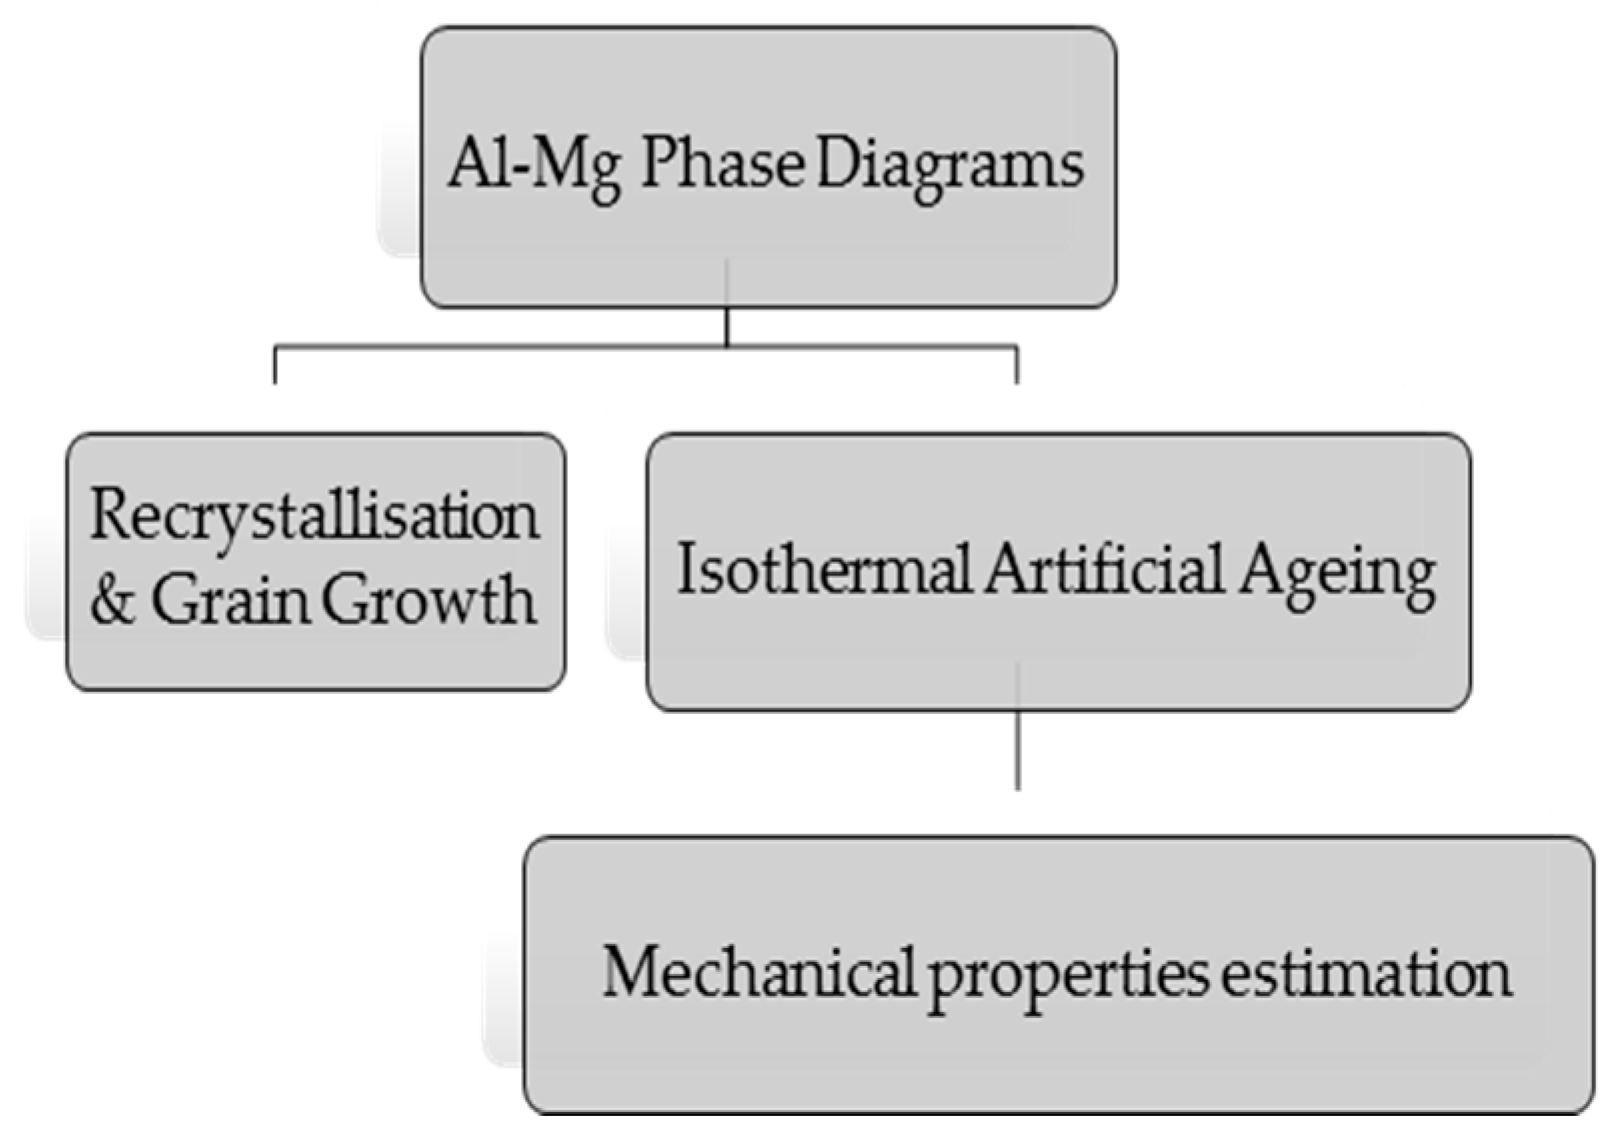
Figure 1. Simulation procedure analysis.
Metals 11 00241 g001
Figure 2. Equilibrium pseudo-binary Al-Mg phase diagrams, with constant Si concentration equal to 0.6 wt.% for (a) and 1.1 wt.% for (b).
Metals 11 00241 g002aMetals 11 00241 g002b
Figure 3. Evolution of recrystallisation fraction. The JMAK estimation and experimental data are taken from the work of Poletti et al. [22].
Metals 11 00241 g003
Figure 4. Evolution of the recrystallized grains average radius.
Metals 11 00241 g004
Figure 5. Evolution of the number of grains during the simulation.
Metals 11 00241 g005
Figure 6. Evolution of interface mobility during the simulation.
Metals 11 00241 g006
Figure 7. Mesh analysis of 220 °C-4 h ageing treatment for Al-0.9M-0.6Si ternary system.
Metals 11 00241 g007
Figure 8. Temporal evolution of the precipitate fraction.
Metals 11 00241 g008
Figure 9. Temporal variation of the precipitate radius.
Metals 11 00241 g009
Figure 10. Temporal evolution of the precipitate’s density.
Metals 11 00241 g010
Figure 11. Temporal evolution of Mg and Si content in the matrix phase.
Metals 11 00241 g011
Figure 12. Evolution of available Si content in the matrix phase, based on Equation (10).
Metals 11 00241 g012
Figure 13. Spatial distribution of precipitates. The left column depicts the ternary system. Al-0.9Mg-0.6Si and the right column the Al-1.0Mg-1.1Si. Cases (a,b) are for the 180 °C-8 h simulation, while cases (c,d) for the 200 °C-8 h simulation. In the colour scale, number 1 depicts the matrix phase, number 2 depicts precipitates, while number 1 is attributed to the interfaces.
Metals 11 00241 g013
Figure 14. Temporal evolution of interface mobility.
Metals 11 00241 g014
Figure 15. Virtual EDX analysis for the ternary Al-0.9Mg-0.6Si system for: 180 (a) and 200 °C (b). The horizontal axis depicts the position in the central line of the microstructure, while the vertical axis depicts the corresponding wt.% composition in Mg (black curve) and Si (red curve). The white boxes represent the corresponding phase for each couple of Mg-Si concentrations.
Metals 11 00241 g015
Figure 16. Yield strength estimation. Experimental data (AA6061-AA6063-AA6082) from [1,4,37].
Metals 11 00241 g016
Figure 17. Hardness estimation. Experimental data (AA6061-AA6063-AA6082) from [4,9,37].
Metals 11 00241 g017
Table 1. Selected compositions of AA6XXX aluminium alloys [1,2,4].
ElementMgSiFeMnAl
1st case (wt.%)0.90.60.350.198.05 (bal.)
2nd case (wt.%)1.01.10.350.197.45 (bal.)
Table 2. Principal parameters of annealing simulation.
ParameterValue
Annealing Conditions400 °C/5 min [22]
Interface Energy0.32 J/m2 [22]
Interface Mobility3.8 × 10−5 cm4/Js [24]
Shear Modulus Equation(84.8–4.06 × 10⁻² × T)/(2 × (1 + v)) [22]
Poisson Ration (v)0.33 [22]
Burger Vector0.286 nm [22]
Dislocation Density (pi)0.5 × 10¹⁴ 1/m2 [22]
Energy Threshold4.42 × 10−2 MPa
Pinning Force0.18 1/μm [25]
Miller Indices (hkl) and (uvw)001 and 100 respectively
Number of Cells (x × z)500 × 500
Cell Dimension0.5 μm
Maximum Rotation Angle15°
Prefactor of Interfacial Energy for Low-angle Grain Boundaries0.2
Prefactor of Interfacial Mobility for Low-angle Grain Boundaries0.1
Table 3. Principal parameters of mesh analysis.
ParameterValue
Ageing Conditions220 °C-4 h [29]
Number of Cells (x × z)500/800/1100/1400/1700/2000
Cell Dimension (nm)40/25/18.2/14.3/11.8/10
Composition wt.%Al-0.9Mg-0.6Si
Table 4. Principal parameters of ageing simulation.
ParameterValue
Microstructure dimension20 × 20 μm2
Interface energy (Al phase/Al phase-Mg2Si)0.26 J/m2 [1]/0.18 J/m2 [33]
Interface mobility (Al phase/Al phase-Mg2Si)3.2 × 10⁻¹³ m4/Js/2 × 10−13 m4/Js
Matrix Phase molar volume10.1 × 10−6 m3/mol
Mg2Si Phase molar volume12.9 × 10−6 m3/mol
Table 5. Input parameters for yield strength and hardness calculation.
ParameterValue
kSi66.3 MPa/wt%3 [1]
kMg29.0 MPa/wt%3 [1]
Δσgb16 MPa [1]
Taylor Factor M3.1 [1]
rc5 nm [9]
GAl26.5 GPa [33]
GMg2Si37.4 GPa [33]
Γ = (GAlb2)/21.1025 × 10−14 GPa × m2 [33]
Table 6. Diffusion coefficients of Mg and Si in the matrix phase.
SimulationMg Diffusion Coefficient (cm2/s)Si Diffusion Coefficient (cm2/s)
180 °C (Al-0.9Mg-0.6Si)2.40 × 10−153.77 × 10⁻¹⁵
180 °C (Al-1.0Mg-1.1Si)2.35 × 10−153.66 × 10⁻¹⁵
200 °C (Al-0.9Mg-0.6Si)9.08 × 10−151.42 × 10⁻¹⁴
200 °C (Al-1.0Mg-1.1Si)9.14 × 10−151.37 × 10⁻¹⁴
Publisher’s Note: MDPI stays neutral with regard to jurisdictional claims in published maps and institutional affiliations.