Abstract
In this paper an exhaustive scientific work is performed, by means of metallographic and scanning electron microscope (SEM) techniques, of the microstructural defects exhibited by pearlitic steels and their evolution with the manufacturing process by cold drawing, analyzing the consequences of such defects on the isotropic/anisotropic fracture behavior of the different steels. Thus, the objective is the establishment of a relation between the microstructural damage and the fracture behavior of the different steels. To this end, samples were taken from all the intermediate stages of the real cold drawing process, from the initial hot rolled bar (not cold drawn at all) to the heavily drawn final commercial product (prestressing steel wire). Results show the very relevant role of non-metallic inclusions in the fracture behavior of cold drawn pearlitic steels.
1. Introduction
High-strength cold-drawn eutectoid steel wires are important components in structural engineering [1,2,3,4,5,6]. As a consequence of the manufacture process by cold drawing, these materials show an anisotropic behavior with regard to plasticity (yielding), fracture and hydrogen embrittlement [7,8,9,10,11,12,13,14,15,16,17,18] with the result of mixed-mode fracture propagation and strength anisotropy.
The microstructural evolution with cold drawing has been extensively studied in the past [19,20,21,22,23,24,25,26,27], showing progressive microstructural orientation (alignment in a direction quasi-parallel to the wire axis or cold drawing direction) and increase of packing closeness associated with a decrease of interlamellar spacing and an orientation of the plates in the cold drawing direction [22,23,24,25].
A materials-science relationship between microstructure and strength is usually established through the Hall-Petch equation [28,29,30,31] to correlate the pearlite interlamellar spacing and the material strength. However, in oriented pearlitic microstructure (as a consequence of manufacturing by cold drawing) the Hall–Petch equation does not perform very well [32], so that an Embury–Fisher equation has been proposed [33] to describe the role of microstructure in material performance.
The role of inclusions in steel performance has received considerable attention in the scientific community, from studies about metallographic techniques [34] to research about models of void growth around inclusions [35,36], models about the spatial distribution of MnS inclusions and the voids provoked by them [37], or determining the volume fraction of inclusions in steel [38], as well as research on the role of inclusions in fatigue behavior in air [39,40] and hydrogen environment [41,42].
Recent references about inclusions in steel deal with modeling inclusion formation [43], effect of sulfur content [44], the effect of different non-metallic inclusions on the machinability of steels [45], quality control of steel wires [46], micromechanical modeling of fatigue crack nucleation around non-metallic inclusions [47], MnS inclusions formation in resulfurised steel [48], influence of inclusions on the mechanical properties [49] or their effect on deformation and fracture [50].
This paper focuses on the role of inclusions (analyzed by metallographic techniques) in the mechanical performance (evaluated by means of standard tension tests) of cold drawn pearlitic steel with different degree of cold drawing and distinct chemical composition. The aim of the paper is to find a possible relationship (in the sense of materials science and engineering) between the microstructural micro-damage in the pearlitic steel (created by the presence of inclusions) and the fracture behavior of cold drawn pearlitic steels during tensile testing.
2. Materials
The samples used in the mechanical tests were eutectoid steel wires with different level of cold drawing (i.e., distinct degrees of accumulated plastic strain), from the initial hot rolled bar (not cold drawn at all) to the final commercial product (prestressing steel wire; heavily cold drawn), all of them corresponding to real manufacturing chains, as shown in Figure 1 and Figure 2 that include different views of the process.
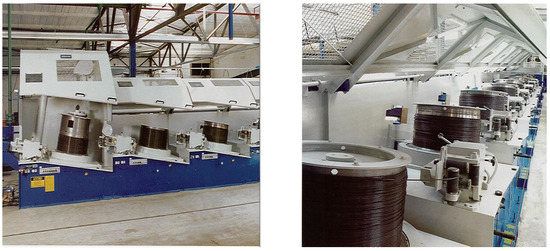
Figure 1.
Manufacture of prestressing steel wires by progressive cold drawing of a previously hot-rolled pearlitic steel bar: two views of a real manufacturing chain by progressive (multi-step) cold drawing.

Figure 2.
Schematic presentation of the cold drawing process with multiple passes through the dies.
Table 1 shows the chemical composition (wt.%) of the different steels (valid for any drawing degree). The materials used were cold drawn pearlitic steels corresponding to five real manufacturing processes. The five types (or families) of steels were used, with the names A, B, C, D and E, each of them with a specific chemical composition and manu-facturing route (straining path). Steel of the type A undergoes six drawing steps (as shown in Figure 2 passing through six dies), whereas the others (B, C, D, E) have undergone seven drawing steps. A letter followed by a number will be used throughout this paper to indicate the steel family (the letter) and the degree of cold drawing or number of drawing steps undergone by each steel wire in particular.

Table 1.
Chemical composition (wt.%) for the five families of the steels (the balance is Fe).
Table 2 summarizes each one of the five cold drawing procedures (straining paths or yielding histories) in terms of the wire diameter at the end of each drawing step. Table 3 offers the cumulative plastic strain εPcum as the variable representing the drawing degree, and it’s defined as follows [4]:
where ϕ0 is the hot rolled bar diameter and ϕi is the diameter of a wire undergoing i dra-wing steps.

Table 2.
Diameter of the wires at the end of each drawing step for the five families.

Table 3.
Cumulative plastic strain of the progressively drawn steels for the five families [4].
The mechanical response of the cold drawn pearlitic steel wires is associated with a progressive increase with cold drawing of the yield strength (σY) and of the ultimate tensile strength (σR), as shown in Figure 3 and Figure 4.
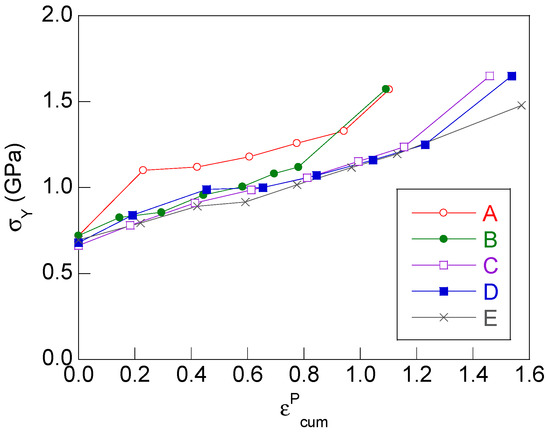
Figure 3.
Evolution with cold drawing of the yield strength σY.
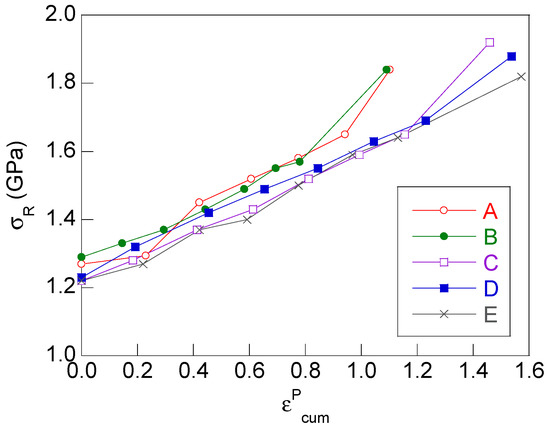
Figure 4.
Evolution with cold drawing of the ultimate tensile strength σR.
Figure 5 plots the stress–strain curves for the progressively cold-drawn pearlitic steels from A0 (hot rolled steel, not cold drawn at all, 0 drawing steps) to the commercial prestressing steel wire A6 (heavily cold drawn pearlitic steel that has undergone 6 drawing steps). It is seen that both the yield strength σY and the ultimate tensile strength (UTS σR) increase with the drawing degree [1,2,3,4,5,6].
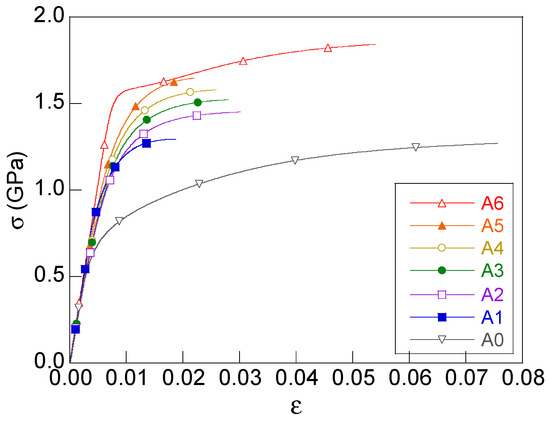
Figure 5.
Stress–strain curves of the progressively drawn pearlitic steels A0 to A6 (steel family A: from 0 to 6 cold-drawing steps).
3. Metallographic Analysis
3.1. Sample Preparation
In order to proceed with the metallographic analysis of the different steels, representative samples were extracted from the wires by means of transverse cuts to prepare small cylinders of 10 mm height and the exact diameter of each steel wire in particular. After this, the cylinders underwent a cut in longitudinal direction (axial cut), so that the micrographs of the present paper will always be oriented with their vertical side following the cold drawing direction (wire axis).
The samples were mounted in resin for grinding and polishing up to mirror quality. Finally, they were chemically attacked to reveal the microstructure of the materials (progressively cold drawn pearlitic steel wires) and to observe it by scanning electron microscopy (SEM) using a JEOL JSM-5610 LV (Jeol Ltd., Tokyo, Japan). Etching was produced by using a solution of 4% Nital in chemical ethanol for five seconds.
3.2. Metallographic Observation
The chemical attack (etching) on the polished samples of pearlitic microstructure produces different chemical reactions in the ferrite (softer) phase and in the cementite (harder) phase forming the pearlite. Whereas the former is chemically attacked by the Nital, the latter remains unaffected by it, so that it is possible to distinguish both phases of the pearlitic microstructure of the steels by means a scanning electron microscope (SEM) analysis: cementite lamellae exhibit a clear appearance whereas ferrite lamellae show a darker aspect. The inclusions were observed by using energy-dispersive X-ray spectroscopy (EDX, Oxford Instruments, mod. 6587, High Wycombe, England) assembled to the SEM.
Generally speaking (details will be analyzed in the discussion section of the present paper), second-phase particles (inclusions) appear in all the studied pearlitic steels (five families or groups), exhibiting different peculiarities depending on the particular chemical composition of each family, cf. Table 1. Different types of inclusion were found, namely: (i) manganese sulfur (MnS) inclusions with dark (non-brilliant) appearance and irregular shape; (ii) silica (SiO2) and aluminum oxides (Al2O3) with clear brilliant appearance and more regular shape. Two of these types of inclusions (MnS and Al2O3) are showed in Figure 6.
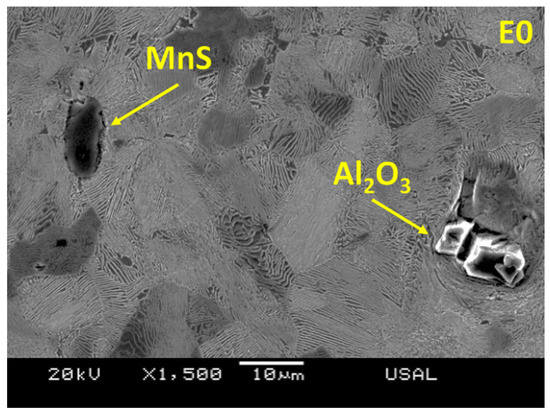
Figure 6.
Second-phase particles in a hot rolled pearlitic steel.
Apart from the inclusions discussed above (those appearing more frequently), other types of inclusions were found (although more scarcely) used mainly to create new phases during the steel manufacturing. They were the following: (i) titanium oxides (probably in the form Ti2O3), (ii) manganese silicates (possibly of the type 2MnO.SiO2, MnSiO3), alumina silicates (SiO2/AlO3), (iii) titanium nitride (TiN) and (iv) vanadium nitride (VN). The main chemical elements appearing in an inclusion can be observed in the EDX spectrum given in Figure 7.
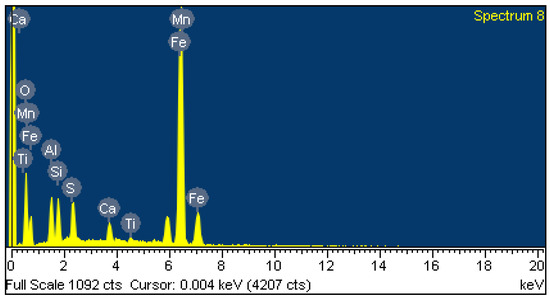
Figure 7.
EDX spectrum of an inclusion containing several chemical elements.
The presence (in small amounts) of varying chemical elements (Ti, N and Ca), as well as other elements that did not appear in the metallographic analysis is not surprising. Titanium (Ti) is usually added to the steels during manufacturing, thereby producing Ti2O3 in form of small inclusions to enhance the formation of intergranular ferrite during the austenite-perlite transformation [51].
Nitrogen (N) is added to the steels to promote the formation of new phases from the austenite, thereby creating tiny particles of TiN. With regard to calcium (Ca), it is frequently added to the steel in certain amount (as SiCa powder) to diminish the level of sulfur (S) and, therefore, to diminish the volume fraction of sulfur and alumina inclusions in the steel [52].
4. Evolution of Inclusions with Cold Drawing
In the five families of steel (A, B, C, D and E) there is a common general trend in the matter of evolution with cold drawing of the inclusions. To analyze this, the existing inclusions in cold drawn pearlitic steels can be classified in two groups: (i) sulphides (MnS) able to undergo certain plastic strain and thus become deformed in the direction of cold drawing; (ii) inclusions consisting of oxides and silicates (of Al, Si, Fe,…), comparatively harder and more brittle, so that they can be fractured as the drawing degree (level of cumulative plastic strain) increases when the wire passes through the consecutive dies.
Figure 8, Figure 9, Figure 10, Figure 11 and Figure 12 show several longitudinal metallographic sections of some wires studied in this work. The wire axis, or cold drawing direction, is represented by the vertical side of the micrographs in such figures. Figure 8 shows longitudinal metallographic sections of two hot rolled steels (E0 and A0) with zero cold drawing degree (i.e., that are not cold drawn at all). It is observed how the inclusions are perfectly adhered to the pearlitic metallic matrix surrounding them, although one was fractured during manufacturing by hot rolling.

Figure 8.
Inclusions in the longitudinal section of hot rolled pearlitic steels E0 and A0 (zero degree of cold drawing) showing oxides (a) and sulfurs (b).
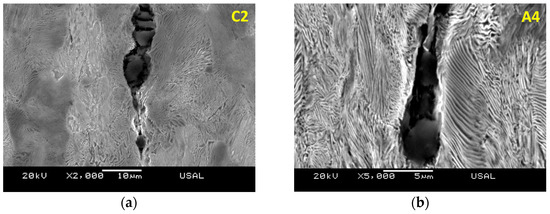
Figure 9.
Inclusions in slightly drawn pearlitic steels C2 (with two drawing steps) and A4 (with four drawing steps). Principally MnS (a); complex oxide, mainly Al2O3 (b).
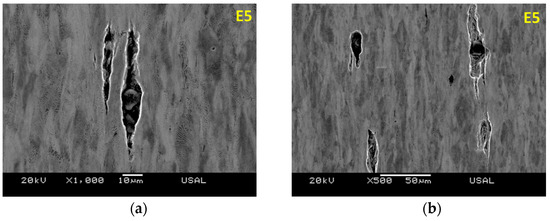
Figure 10.
Inclusions in moderately drawn steel E5 (five drawing steps) at 1000× (a) and 500× (b).
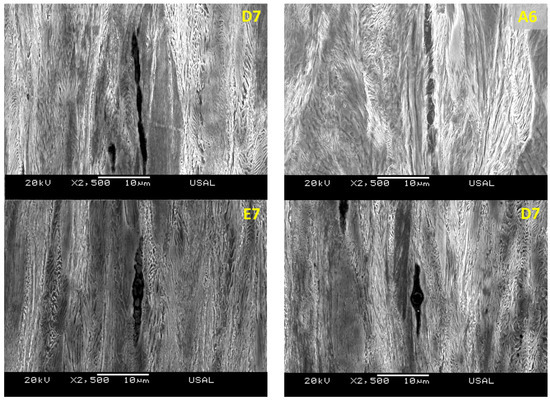
Figure 11.
Axial micro-cracks generated by the presence of inclusions in heavily drawn pearlitic steels (commercial prestressing steel wires) (2500×).

Figure 12.
Axial micro-cracks generated in a heavily cold drawn pearlitic steel (commercial prestressing steel wire) created during the manufacturing process by cold drawing.
During manufacturing of commercial prestressing steel wires by progressive (multi-step) cold drawing, a strain hardening mechanism is activated in the pearlitic steels. During this process, the inclusions (second-phase particles) also evolve.
Figure 9 shows the microstructure of slightly cold drawn pearlitic steels C2 and A4 undergoing two and four cold drawing steps. It is observed how the inclusions present in the steels become fractured after passing through two and four dies (due to the transverse peripherical compression), thereby producing cracks at the interface between the inclusion and the matrix as a consequence of the plastic deformation undergone by the pearlitic matrix itself.
With regard to the differences between the five different families of the pearlitic steels under analysis, the steels of the group E are those containing greater and more numerous inclusions inside it. This provokes a higher density of microstructural defects (micro-defects) generated by the combined effect of heavy cold drawing and presence of many inclusions in the steel.
Figure 10 offers micrographs (axial or longitudinal cuts) of the microstructure of steel E5 (family E; five cold drawing steps) with two magnification levels of 1000× and 500×, where the frequent appearance of micro-defects (micro-cracks) generated by the presence of the inclusions can be observed. Such defects are potential initiators of macroscopic fracture of the cold drawn pearlitic steels, with loss of structural integrity.
In the matter of the most heavily cold drawn steel (commercial prestressing steel wire), obtained after passing of the initially hot rolled materials through the entire route of strain hardening (with the maximum number of cold drawing steps), micrographs of Figure 11 show evidence of micro-cracks aligned in the drawing direction (wire axis or longitudinal direction) since they are more slender than in the previous pearlitic steels (with a lower cold drawing degree). In Figure 11 the microstructure of steel families A, D and E is represented, observing that the inclusions are very fractured (they exhibit a lot of micro-damage) in their surrounding as a consequence of the high level of plastic strain undergone by the most heavily cold drawn pearlitic steels.
Figure 12 includes two parallel micro-cracks generated in the vicinity of inclusions appearing in a commercial prestressing steel wire E7 after heavy cold drawing. The inclusions exhibit evidence of previous fracturing during the manufacture process, and the micro-cracks appear in the close vicinity of the existing inclusions.
5. Role of Inclusions in the Fracture Behavior
From the results obtained in the metallographic analysis of the longitudinal sections of cold drawn pearlitic steels, a key question arises about the influence of inclusions on material (macro-) fracture behavior. To elucidate the relevant and fundamental question of whether (or not) the inclusions play a relevant role in fracture behavior of the steels, standard tension tests were performed on the different steel wires with a posterior (postmortem) fractographic analysis to elucidate the microscopic fracture modes.
In the case of hot rolled (not cold drawn at all) or slightly drawn pearlitic steels (corresponding to the first stages of the manufacturing chain with few passes through the dies) the fracture surface is contained in a plane perpendicular to the wire axis or cold drawing direction and exhibits a low-roughness appearance (Figure 13; left), i.e., it corresponds to an isotropic fracture behavior.
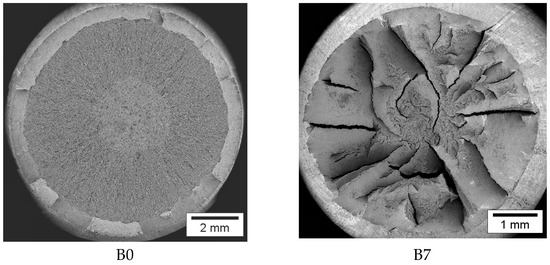
Figure 13.
Fracture surfaces in a hot rolled bar (left) and a cold drawn wire (right).
On the other hand, in the case of heavily drawn pearlitic steels (associated with the last stages of the manufacturing chain with many passes through the dies) the fracture surface is not contained in a plane perpendicular to the wire axis or cold drawing direction and exhibits a high-roughness and irregular appearance (Figure 13; right), i.e., it corresponds to an anisotropic fracture behavior with frequent local deflections representing embryos of anisotropic fracture.
To understand such a disparity regarding fracture surface appearance, some microstructural features must be taken into account: (i) firstly, the oriented pearlitic microstructure after cold drawing in the matter of colonies and lamellae [22,23,24,25], (ii) secondly, the presence in the drawn steel of many zones with pre-damage (after heavy drawing) and even with micro-cracks aligned in the drawing direction and created in the vicinity of inclusions by debonding between the inclusion and the metallic matrix (as a consequence of the stress concentration created by the inclusion itself), as shown in Figure 14 in which many local regions with micro-cracks (aligned and oriented along the direction of cold drawing represented by the wire axis) may be observed.
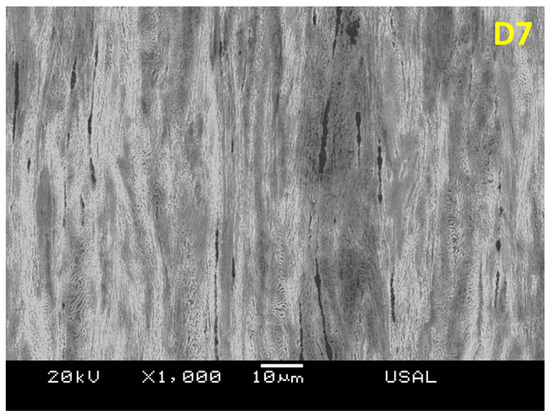
Figure 14.
Multiple micro-cracks aligned in longitudinal direction (axial or cold-drawing direction, i.e., vertical side of the micrograph) in a cold drawn pearlitic steel.
During the standard tension tests performed on the wires, two main stages can be distinguished:
- (i)
- One first long phase (before plastic instability) during which material points are subjected to a uniform uniaxial stress state. This main stage lasts up to the maximum load point. During this phase the micro-cracks do not promote fracture since the main axial stress (in the direction of the wire) is parallel to the micro-cracks themselves.
- (ii)
- One second shorter phase (after plastic instability) during which material points are subjected to a triaxial stress state. This second stage starts from the maximum load point. During this phase the micro-cracks do promote fracture since triaxial stress state has a hoop component that is perpendicular to the micro-cracks themselves.
An approximate classical solution for the triaxial stress state in a cylinder (bar or wire) after necking is due to Davidenkov and Spiridonova [53] as follows:
where σY is the yield strength of the material, σz is the axial stress along the wire axis, σr is the radial stress (equal to the hoop stress σθ, due to the very small elastic strains in the neck compared with the plastic deformations, and due to the constant volume hypothesis which involves εz = −2εr), R is the curvature radius of the necking surface (similar to a blunt notch), a is the distance from the notch tip to the wire axis and r is the radial distance between the wire axis and the considered point (see Figure 15).
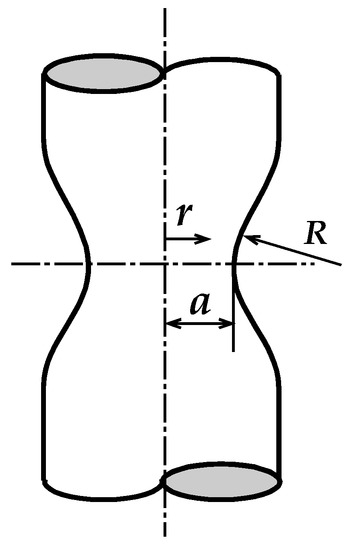
Figure 15.
Scheme of the wire’s necking during a tensile test.
The curvature radius of the necking surface R was measure by means of a profile projector (NIKON V-12B, Tokyo, Japan). The average values obtained were 26.25 and 3.16 mm for the hot rolled steel E0 and the prestressing steel E7, respectively. With these va-lues, and taking into account the Davidenkov and Spiridonova equations (2), it’s possible to obtain the stress distribution (σz, σθ and σr; being σθ = σr) along the wires net section in the previous instants to final fracture occurs. Such stress distribution is showed in Figure 16 for the case of the steels E0 and E7. The stress distribution is equal in both steels and for all considered variables, being maximum in the center (longitudinal wire axis, r = 0) and minimum in the periphery of the wires (deepest point in necking external surface, where r = a). The values are greater for the case of prestressing steel wires.

Figure 16.
Stress distribution of σz (left) and σθ (right) along the transversal necking surface in steel E0 and E7.
Once the distribution of stresses along the minimum neck section is known, and considering that the shear stresses are null by symmetry, it is possible to obtain the stress triaxiality distribution along the radius r of the neck section. The stress triaxiality t (3) is the ratio between the hydrostatic stress σh (4) and the equivalent von Mises stress σeq (5).
Figure 17 (left) shows that the values of hydrostatic and equivalent stresses are higher for the case of prestressing steel (E7) in relation to the initial hot rolled bar (E0). The σh distribution shows a continuous decrement from the longitudinal wire axis (r = 0) till it reaches the external surface (r = a); that being said, the decrement is more pronounced in the prestressing steel E7. The equivalent von Mises stress σeq is constant along the radial coordinate for both steels.

Figure 17.
Distribution of hydrostatic stress (left), equivalent stress (left) and stress triaxiality (right) for the hot rolled steel E0 and the prestressing steel E7 along the necking section.
Figure 17 (right) shows the triaxiality factor distribution along the radial coordinate of the wire necking. The prestressing steel shows a higher level of triaxiality with respect to the hot rolled steel. In both steels the triaxiality factor is maximum in the longitudinal wire axis (r = 0) and minimum in the external surface of the neck.
Heavily cold drawn steels (Figure 18) exhibit locally anisotropic fracture behavior due to the presence of multiple micro-cracks oriented and aligned along the drawing direction (created by debonding between the inclusions and the pearlitic matrix) and the triaxial stress state (with radial and hoop components) generated after necking. Both factors are relevant to create an anisotropic fracture in heavily cold drawn pearlitic steels in which there is a coexistence of:
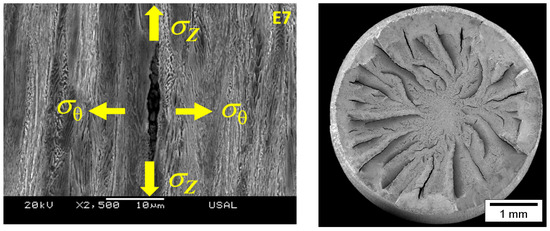
Figure 18.
Anisotropic fracture behavior in a cold drawn pearlitic steel (E7).
- (i)
- (ii)
- (iii)
- Many micro-cracks created from the inclusions, aligned and oriented along the drawing axis (Figure 14). The hoop stress σθ during plastic instability (necking) before final fracture induces locally anisotropic fracture with crack deflections and appearance of crests and valleys.
Hot rolled (not cold drawn at all) and slightly drawn pearlitic steels (Figure 19) exhibit an isotropic fracture behavior due to the absence of the afore-said micro-cracks. In this case the stress state is defined by:

Figure 19.
Isotropic fracture behavior in a hot rolled pearlitic steel (E0).
- (i)
- (ii)
- (iii)
- Scarcity (or practical absence) of pre-damage and micro-cracks. Therefore, the triaxial stress state generated during necking is unable to produce local deflections and thus locally anisotropic fracture.
6. Conclusions
The anisotropic fracture behavior of cold drawn pearlitic steel wires subjected to standard tension tests can be explained on the basis of the triaxial stress state generated during necking, together with the presence of many aligned and oriented micro-cracks generated during the cold drawing process.
Such micro-cracks appear in the vicinity of second-phase particles (inclusions) in the course of manufacturing of prestressing steel wires by progressive cold drawing after debonding between the inclusion and the pearlitic matrix due to the differences with regard to plastic behavior between the matrix and the inclusion itself.
Author Contributions
J.T. conceived and designed the research; F.-J.A. and B.G. performed the microscopy analysis, J.T., F.-J.A. and B.G. analyzed the data and wrote the paper. All authors have read and agreed to the published version of the manuscript.
Funding
This research was funded by the following Spanish Institutions: Ministry for Science and Technology (MICYT; Grant MAT2002-01831), Ministry for Education and Science (MEC; Grant BIA2005-08965), Ministry for Science and Innovation (MICINN; Grant BIA2008-06810), Ministry for Economy and Competitiveness (MINECO; Grant BIA2011-27870) and Junta de Castilla y León (JCyL; Grants SA067A05, SA111A07, SA039A08 and SA132G18).
Institutional Review Board Statement
Not applicable.
Informed Consent Statement
Not applicable.
Data Availability Statement
Not applicable.
Conflicts of Interest
The authors declare no conflict of interest. The funders had no role in the design of the study; in the collection, analyses, or interpretation of data; in the writing of the manuscript, and in the decision to publish the results.
References
- Gil-Sevillano, J. Cleavage-limited maximum strength of work-hardened B.C.C. polycrystals. Acta Metall. 1986, 34, 1473–1485. [Google Scholar]
- Toribio, J. On the intrinsic character of the stress-strain curve of a prestressing steel. J. Testing Eval. 1992, 20, 357–362. [Google Scholar]
- Toribio, J. Cold drawn eutectoid pearlitic steel wires as high performance materials in structural engineering. Struct. Integr. Health Monit. 2006, 2, 239–247. [Google Scholar]
- Toribio, J.; Ayaso, F.J.; González, B.; Matos, J.C.; Vergara, D.; Lorenzo, M. Tensile fracture behavior of progressively-drawn pearlitic steels. Metals 2016, 6, 114. [Google Scholar] [CrossRef]
- Borchers, C.H.; Kirchheim, R. Cold-drawn pearlitic steel wires. Prog. Mater. Sci. 2016, 82, 405–444. [Google Scholar] [CrossRef]
- Toribio, J. Structural integrity of progressively cold-drawn pearlitic steels: From Raffaello Sanzio to Vincent van Gogh. Proced. Struct. Integr. 2017, 3, 3–10. [Google Scholar] [CrossRef]
- Toribio, J.; González, B.; Matos, J.C.; Kharin, V. Evaluation by sharp indentation of anisotropic plastic behaviour in progressively drawn pearlitic steel. ISIJ Int. 2011, 51, 843–848. [Google Scholar] [CrossRef][Green Version]
- Toribio, J.; Ovejero, E.; Toledano, M. Microstructural bases of anisotropic fracture behaviour of heavily drawn steel. Int. J. Fract. 1997, 87, L83–L88. [Google Scholar]
- Toribio, J.; Ayaso, F.J. Fracture performance of progressively drawn pearlitic steel under triaxial stress states. Mater. Sci. 2001, 37, 707–717. [Google Scholar] [CrossRef]
- Toribio, J.; Ayaso, F.J. Investigation of the type of cleavage related to anisotropic fracture in heavily drawn steels. J. Mater. Sci. Lett. 2002, 21, 1509–1512. [Google Scholar] [CrossRef]
- Toribio, J.; Ayaso, F.J. Micromechanics of fracture in notched samples of heavily drawn steel. Int. J. Fract. 2002, 115, L29–L34. [Google Scholar] [CrossRef]
- Toribio, J.; Ayaso, F.J. Anisotropic fracture behavior of cold drawn steel: A materials science approach. Mater. Sci. Eng. 2003, 343, 265–272. [Google Scholar] [CrossRef]
- Toribio, J.; Ayaso, F.J. Image analysis of exfoliation fracture in cold drawn steel. Mater. Sci. Eng. 2004, 387, 438–441. [Google Scholar] [CrossRef]
- Toribio, J.; González, B.; Matos, J.C. Cleavage stress required to produce fracture path deflection in cold-drawn prestressing steel wires. Int. J. Fract. 2007, 144, 189–196. [Google Scholar] [CrossRef]
- Toribio, J.; González, B.; Matos, J.C. Strength anisotropy and mixed mode fracture in heavily drawn pearlitic steel. Fatigue Fract. Eng. Mater. Struct. 2013, 36, 1178–1186. [Google Scholar] [CrossRef]
- Tanaka, M.; Saito, H.; Yasumaru, M.; Higashida, K. Nature of delamination cracks in pearlitic steels. Scr. Mater. 2016, 112, 32–36. [Google Scholar] [CrossRef]
- He, Y.; Xiang, S.; Shi, W.; Liu, J.; Ji, X.; Yu, W. Effect of microstructure evolution on anisotropic fracture behaviors of cold drawing pearlitic steels. Mater. Sci. Eng. 2017, 683, 153–163. [Google Scholar] [CrossRef]
- Toribio, J. Anisotropy of hydrogen embrittlement in cold drawn pearlitic steel: A tribute to Mantegna. Proced. Struct. Integr. 2020, 28, 2438–2443. [Google Scholar] [CrossRef]
- Embury, J.D.; Fisher, R.M. The structure and properties of drawn pearlite. Acta Metall. 1966, 14, 147–159. [Google Scholar] [CrossRef]
- Langford, G. Deformation of pearlite. Metall. Trans. 1977, 8, 861–875. [Google Scholar] [CrossRef]
- Ridley, N. A review of the data on the interlamellar spacing of pearlite. Metall. Trans. 1984, 15, 1019–1036. [Google Scholar] [CrossRef]
- Toribio, J.; Ovejero, E. Microstructure evolution in a pearlitic steel subjected to progressive plastic deformation. Mater. Sci. Eng. 1997, 234, 579–582. [Google Scholar] [CrossRef]
- Toribio, J.; Ovejero, E. Microstructure orientation in a pearlitic steel subjected to progressive plastic deformation. J. Mater. Sci. Lett. 1998, 17, 1037–1040. [Google Scholar] [CrossRef]
- Toribio, J.; Ovejero, E. Effect of cumulative cold drawing on the pearlite interlamellar spacing in eutectoid steel. Scr. Mater. 1998, 39, 323–328. [Google Scholar] [CrossRef]
- Toribio, J.; Ovejero, E. Effect of cold drawing on microstructure and corrosion performance of high-strength steel. Mech. Time Depend. Mater. 1998, 1, 307–319. [Google Scholar] [CrossRef]
- Languillaume, J.; Kapelski, G.; Baudelet, B. Cementite dissolution in heavily cold drawn pearlitic steel wires. Acta Mater. 1997, 45, 1201–1212. [Google Scholar] [CrossRef]
- Zelin, M. Microstructure evolution in pearlitic steels during wire drawing. Acta Mater. 2002, 50, 4431–4447. [Google Scholar] [CrossRef]
- Hall, E.O. The deformation and ageing of mild steel: III Discussion of results. Proc. Phys. Soc. 1951, 64, 747–753. [Google Scholar] [CrossRef]
- Petch, N.J. The cleavage strength of polycrystals. J. Iron Steel Inst. 1953, 174, 25–30. [Google Scholar]
- Choi, H.C.; Park, K.T. The effect of carbon content on the Hall-Petch parameter in the cold drawn hypereutectoid steels. Scr. Mater. 1996, 34, 857–862. [Google Scholar] [CrossRef]
- Nam, W.J.; Bae, C.M.; Lee, C.S. Effect of carbon content on the Hall-Petch parameter in cold drawn pearlitic steel wires. J. Mater. Sci. 2002, 37, 2243–2249. [Google Scholar] [CrossRef]
- Toribio, J. Relationship between microstructure and strength in eutectoid steels. Mater. Sci. Eng. 2004, 387, 227–230. [Google Scholar] [CrossRef]
- Toribio, J.; González, B.; Matos, J.C. Microstructure and mechanical properties in progressively drawn pearlitic steel. Mater. Trans. 2014, 55, 93–98. [Google Scholar] [CrossRef]
- Kang, S.K.; Gow, K.W. An improved metallographic technique for the study of nonmetallic inclusions in steel. Metallography 1978, 11, 219–222. [Google Scholar] [CrossRef]
- Roberts, W.; Lehtinen, B. An in situ SEM study of void development around inclusions in steel during plastic deformation. Acta Metall. 1975, 24, 745–758. [Google Scholar] [CrossRef]
- Goodwin, S.J.; Noble, F.N.; Eyre, B.L. Inclusion nucleated ductile fracture in stainless steel. Acta Metall. 1989, 37, 1389–1398. [Google Scholar] [CrossRef]
- Everett, R.K.; Geltmacher, A.B. Spatial distribution of MnS inclusions in HY-100 steel. Scr. Mater. 1999, 40, 567–571. [Google Scholar] [CrossRef]
- Raghupathy, V.P.; Srinivasan, V. Determination of volume fraction of sulfide inclusions in steels. Metallography 1981, 14, 87–97. [Google Scholar] [CrossRef]
- Eid, N.M.A.; Thomason, P.F. The nucleation of fatigue cracks in a low-alloy steel under high-cycle fatigue conditions and uniaxial loading. Acta Metall. 1979, 27, 1239–1249. [Google Scholar] [CrossRef]
- Fowler, G.J. The influence of non-metallic inclusions on the threshold behavior in fatigue. Mater. Sci. Eng. 1979, 39, 121–126. [Google Scholar] [CrossRef]
- Chapetti, M.D.; Tagawa, T.; Miyata, T. Ultra-long cycle fatigue of high-strength carbon steels. Part I: Review and analysis of the mechanism of failure. Mater. Sci. Eng. 2003, 356, 227–235. [Google Scholar] [CrossRef]
- Chapetti, M.D.; Tagawa, T.; Miyata, T. Ultra-long cycle fatigue of high-strength carbon steels. Part II: Estimation of fatigue limit for failure from internal inclusions. Mater. Sci. Eng. 2003, 356, 236–244. [Google Scholar] [CrossRef]
- You, D.; Michelic, S.K.; Presoly, P.; Liu, J.; Bernhard, C.H. Modeling inclusion formation during solidification of steel: A review. Metals 2017, 7, 460. [Google Scholar] [CrossRef]
- Guo, J.; Yang, W.; Shi, X.; Zheng, Z.; Liu, S.; Duan, S.; Wu, J.; Guo, H. Effect of sulfur content on the properties and MnS morphologies of DH36 structural steel. Metals 2018, 8, 945. [Google Scholar] [CrossRef]
- Ånmark, N.; Karasev, A.; Jönsson, P.G. The effect of different non-metallic inclusions on the machinability of steels. Materials 2015, 8, 751–783. [Google Scholar] [CrossRef]
- Yan, W.; Chen, W.; Li, J. Quality control of high carbon steel for steel wires. Materials 2019, 12, 846. [Google Scholar] [CrossRef]
- Schäfer, B.J.; Sonnweber-Ribic, P.; Hassan, H.; Hartmaier, A. Micromechanical modeling of fatigue crack nucleation around non-metallic inclusions in martensitic high-strength steels. Metals 2019, 9, 1258. [Google Scholar] [CrossRef]
- Liu, H.; Hu, D.; Fu, J. Analysis of MnS inclusions formation in resulphurised steel via modeling and experiments. Materials 2019, 12, 2028. [Google Scholar] [CrossRef] [PubMed]
- Qiu, G.; Zhan, D.; Li, C.; Yang, Y.; Qi, M.; Jiang, Z.; Zhang, H. Influence of inclusions on the mechanical properties of RAFM steels via Y and Ti addition. Metals 2019, 9, 851. [Google Scholar] [CrossRef]
- Yang, W.; Peng, K.; Zhang, L.; Ren, Q. Deformation and fracture of non-metallic inclusions in steel at different temperatures. J. Mater. Res. Technol. 2020, 9, 15016–15022. [Google Scholar] [CrossRef]
- Shim, J.H.; Oh, Y.J.; Suh, J.Y.; Cho, Y.W.; Shim, J.D.; Byum, J.S.; Lee, D.N. Ferrite nucleation potency of non-metallic inclusions in medium carbon steels. Acta Mater. 2001, 49, 2115–2122. [Google Scholar] [CrossRef]
- Wilson, A.D. The influence of thickness and rolling ratio on the inclusion behavior in plate steels. Metallography 1979, 12, 233–255. [Google Scholar] [CrossRef]
- Kachanov, L.M. Fundamentals of the Theory of Plasticity; Dover Publications: Mineola, NY, USA, 2004; pp. 311–314. [Google Scholar]
Publisher’s Note: MDPI stays neutral with regard to jurisdictional claims in published maps and institutional affiliations. |
© 2021 by the authors. Licensee MDPI, Basel, Switzerland. This article is an open access article distributed under the terms and conditions of the Creative Commons Attribution (CC BY) license (https://creativecommons.org/licenses/by/4.0/).