Article

Influence of Quenching and Partitioning Parameters on Phase Transformations and Mechanical Properties of Medium Manganese Steel for Press-Hardening Application

by
Charline Blankart
*,
Sebastian Wesselmecking
and
Ulrich Krupp
Steel Institute, RWTH Aachen University, 52072 Aachen, Germany
*
Author to whom correspondence should be addressed.
Metals 2021, 11(11), 1879; https://doi.org/10.3390/met11111879
Submission received: 4 November 2021 / Revised: 17 November 2021 / Accepted: 19 November 2021 / Published: 22 November 2021
(This article belongs to the Special Issue Alloy and Process Design of Metallic Materials)

Abstract

:
It has been proven that through targeted quenching and partitioning (Q & P), medium manganese steels can exhibit excellent mechanical properties combining very high strength and ductility. In order to apply the potential of these steels in industrial press hardening and to avoid high scrap rates, it is of utmost importance to determine a robust process window for Q & P. Hence, an intensive study of dilatometry experiments was carried out to identify the influence of quenching temperature (TQ) and partitioning time (tp) on phase transformations, phase stabilities, and the mechanical properties of a lean medium manganese steel. For this purpose, additional scanning electron microscopy (SEM), electron backscatter diffraction (EBSD), and energy dispersive X-ray spectroscopy (EDX) examinations as well as tensile testing were performed. Based on the dilatometry data, an adjustment of the Koistinen–Marburger (K-M) equation for medium manganese steel was developed. The results show that a retained austenite content of 12–21% in combination with a low-phase fraction of untempered secondary martensite (max. 20%) leads to excellent mechanical properties with a tensile strength higher than 1500 MPa and a total elongation of 18%, whereas an exceeding secondary martensite phase fraction results in brittle failure. The optimum retained austenite content was adjusted for TQ between 130 °C and 150 °C by means of an adapted partitioning.

1. Introduction

The reduction in CO2 emissions is one of the most important issues in the automotive industry. One effective way of reducing emissions of passenger cars is to lower vehicle weight. The greatest potential for savings can be found in the area of autobody design, where, for example, high-strength steels are now replacing conventional deep drawing sheet material [1,2]. One of the most efficient processes for the production of high-strength crash-relevant components is press hardening, in which forming and hardening are combined in a single process step (direct press hardening) [3]. Currently, manganese-boron steels such as 22MnB5 or 20MnB8 are used for this purpose. In their initial state, these steels have a ferritic-pearlitic (FP) microstructure, which is completely transformed into martensite with tensile strengths of 1500 MPa and higher by austenitizing and press hardening [4]. Alloying elements such as carbon, manganese, chromium, and boron increase the strength attainable by this process and, above all, suppress the diffusion-controlled FP transformation, which allows the critical cooling rate for the formation of martensite to be reduced to a technically feasible value of at least 27 K/s [5]. However, the residual formability (approx. 7%) is greatly reduced by the complete formation of martensite, which is why these components are only suitable to a limited extent for crash-relevant anti-intrusion areas of the car body. For this reason, tailoring methods such as tailored tempering with a partially heatable die [6] or tailored furnace modules for precise local heat treatment [7], as well as the use of third-generation advanced high-strength steels (AHSS) [8,9,10,11], are proceeding in the focus of research and development activities in the area of press hardening [3,12,13,14].
Compared to 22MnB5, medium manganese steels can have a significantly lower critical cooling rate as well as lower transformation temperatures due to an adapted alloying concept. Consequently, this allows a more robust process control and, in addition, a significantly lower austenitization temperature. In comparison to manganese boron steels, the austenitization temperature of medium manganese steels can be lowered by 100–200 °C [15], which is associated with considerably reduced energy consumption [16]. Furthermore, the lower austenitization temperature leads to a comparatively finer microstructure, which positively influences both the strength and the ductility of the material, respectively [17].
In addition, it is possible to set a multiphase microstructure consisting of a combination of hard and ductile phases through targeted temperature control during the press hardening process, which leads to an improved combination of strength and residual formability. One approach is to integrate quenching and partitioning (Q & P) into the press hardening process. After austenitizing, the material is stamped within a temperature-controlled die and initially quenched to a temperature range between the martensite start temperature Ms and the martensite finish temperature Mf to partially produce fresh primary martensite ( α FP). Partitioning subsequently occurs during annealing at temperatures between Ms and AC1. At elevated temperatures, carbon and manganese diffuse from the martensite into the austenite, which leads to tempering of primary martensite and a stabilization of austenite and hence to retained austenite in the final microstructure after quenching to room temperature since Mf dropped below room temperature (Figure 1) [18].
In sensitive dependence on the Q & P parameters, highly complex final microstructures of tempered primary martensite ( α P), fresh secondary martensite ( α S), and retained austenite ( γ r) are formed, whereby the mechanical properties can be precisely adjusted [18,19]. This has been proven, among others, by the investigations of de Cooman et al. [20] and de Moor et al. [21], who performed Q & P treatments on medium manganese steels in a dilatometer and in salt baths, respectively, and achieved tensile strengths of 1500 MPa at total elongation of 15%.
However, in industrial production, variations in the process parameters occur unregularly, which means that the exact control of the optimum heat treatment parameters cannot be guaranteed. In order to minimize possible scrap, the aim of this work was to determine a process window for quenching and partitioning treatment for a lean medium manganese steel that is as robust as possible, as well as to investigate how possible variations in quenching temperature can be compensated by adjusting the partitioning treatment. To achieve this, a precise knowledge of the phase transformation kinetics and phase stability as a function of the process parameters is of great importance. For this purpose, different series of dilatometer experiments were carried out, in which the quenching temperature and the partitioning time were varied, and the respective phase transformations were identified and quantified. Furthermore, the microstructure was characterized in detail and correlated with the mechanical properties from the tensile test.

2. Materials and Methods

For the experiments, an ingot of 80 kg (cross-section 140 × 140 mm²) of a medium manganese steel with a nominal composition of Fe-0.3%C-5%Mn-1.5%Si (wt.%, details in Table 1) was produced by a laboratory vacuum-induction melting process. The ingot was homogenized at 1150 °C for 2 h and subsequently forged to a cross-section of 120 × 120 mm² in a temperature range between 1150 °C and 850 °C. This was followed by a second homogenization for 5 h at 1150 °C and furnace cooling. The forged ingot was then hot-rolled to a thickness of 3 mm, annealed at 650 °C for 2 h and cold-rolled to a final thickness of 1.5 mm.
For a detailed understanding of the material´s phase transformation behavior, ThermoCalc simulations with the TCFE9 database were performed. Dilatometer experiments were carried out using a Bähr Dil 805 A/D dilatometer (TA instruments, Hüllhorst, Germany) in combination with specimens of a size of 7 × 4 × 1.5 mm³ cut from the cold-rolled sheet material. The Ac1 and Ac3 temperatures were determined at a heating rate of 0.05 K/s. The austenitization for the following experiments was then set at Ac3+60 °C for a duration of 300 s to ensure fully austenitic microstructure before cooling. Ms and Mf were determined for the selected austenitization followed by cooling to room temperature using argon.
For the quenching and partitioning experiments, samples were first austenitized and immediately quenched to an intermedium temperature TQ between Ms and Mf. After an isothermal holding time of 10 s at TQ, in order to ensure an even heat distribution within the sample, the samples were heated to a partitioning temperature Tp = 400 °C and held isothermally for 60 s before final quenching to room temperature.
The suitable range for TQ (130/150/170/190/210 °C) was estimated by adapting the lever law to dilatation curves to determine the amount of formed primary martensite after initial quenching (Vm), as well as by adjusting and rearranging the Koistinen–Marbuger (K–M) equation (Equation (1)) [22] (V γ = phase fraction of austenite; α and β = empirical parameters):
V γ = e x p ( 1.10 10 2 ( M s T Q ) )
V m = 1 e x p ( α ( M s T Q ) β )
Within a second experimental series, TQ was set fixed to 150 °C and 170 °C while the partitioning time tP (60/180/300 s) was varied (Figure 2). In the following, the different quenched and partitioned states will be described as “QPTQ_tP”.
To determine the mechanical properties of the material, selected heat treatments were duplicated in salt baths on dog-bone-shaped tensile samples (A30, cut along rolling direction). Subsequent uniaxial tensile tests were performed with ZwickRoell Z100 (ZwickRoell GmbH & Co. KG, Ulm, Germany) at room temperature at a strain rate of 0.0005/s using an optical strain measurement with an accuracy class of 0.5.
In order to analyze and quantify the phase transformation detected in the dilatometer, the microstructure was additionally investigated on 3% HNO3 (Nital) etched samples by means of light optical microscopy (LOM) using Keyence VHX6800 (Keyence Corporation, Osaka, Japan) and scanning electron microscopy (SEM) in combination with energy-dispersive X-ray spectroscopy (EDX) using Zeiss Sigma field emission gun (Carl Zeiss AG, Oberkochen, Germany) with an acceleration voltage of 5–20 kV and a working distance of 10 mm in combination with an Oxford Instruments X-MaxN EDX detector (Oxford Instruments plc, Abingdon, Great Britain) operating with Oxford Instruments AZtec®5.0 software. Prior austenite grain size was determined on picric etched as-quenched samples. For estimation of the retained austenite content of different quenched and partitioned conditions, automated electron back-scatter diffraction (EBSD) measurements with an acceleration voltage of 20 kV, a working distance of 18 mm, and a step size of 60 nm were carried out on electropolished samples using an Oxford Instruments NordlysNano EBSD detector. The electropolishing was performed for 15 s at 17 V in Struers electrolyte A2 (Struers GmbH, Willich, Germany). For determination of primary and secondary martensite fraction, image contrasting method by means of ImageJ 1.47v was applied on light-optical and scanning-electron micrographs. The results were additionally compared with the image quality (IQ) maps of EBSD measurements.

3. Results and Discussion

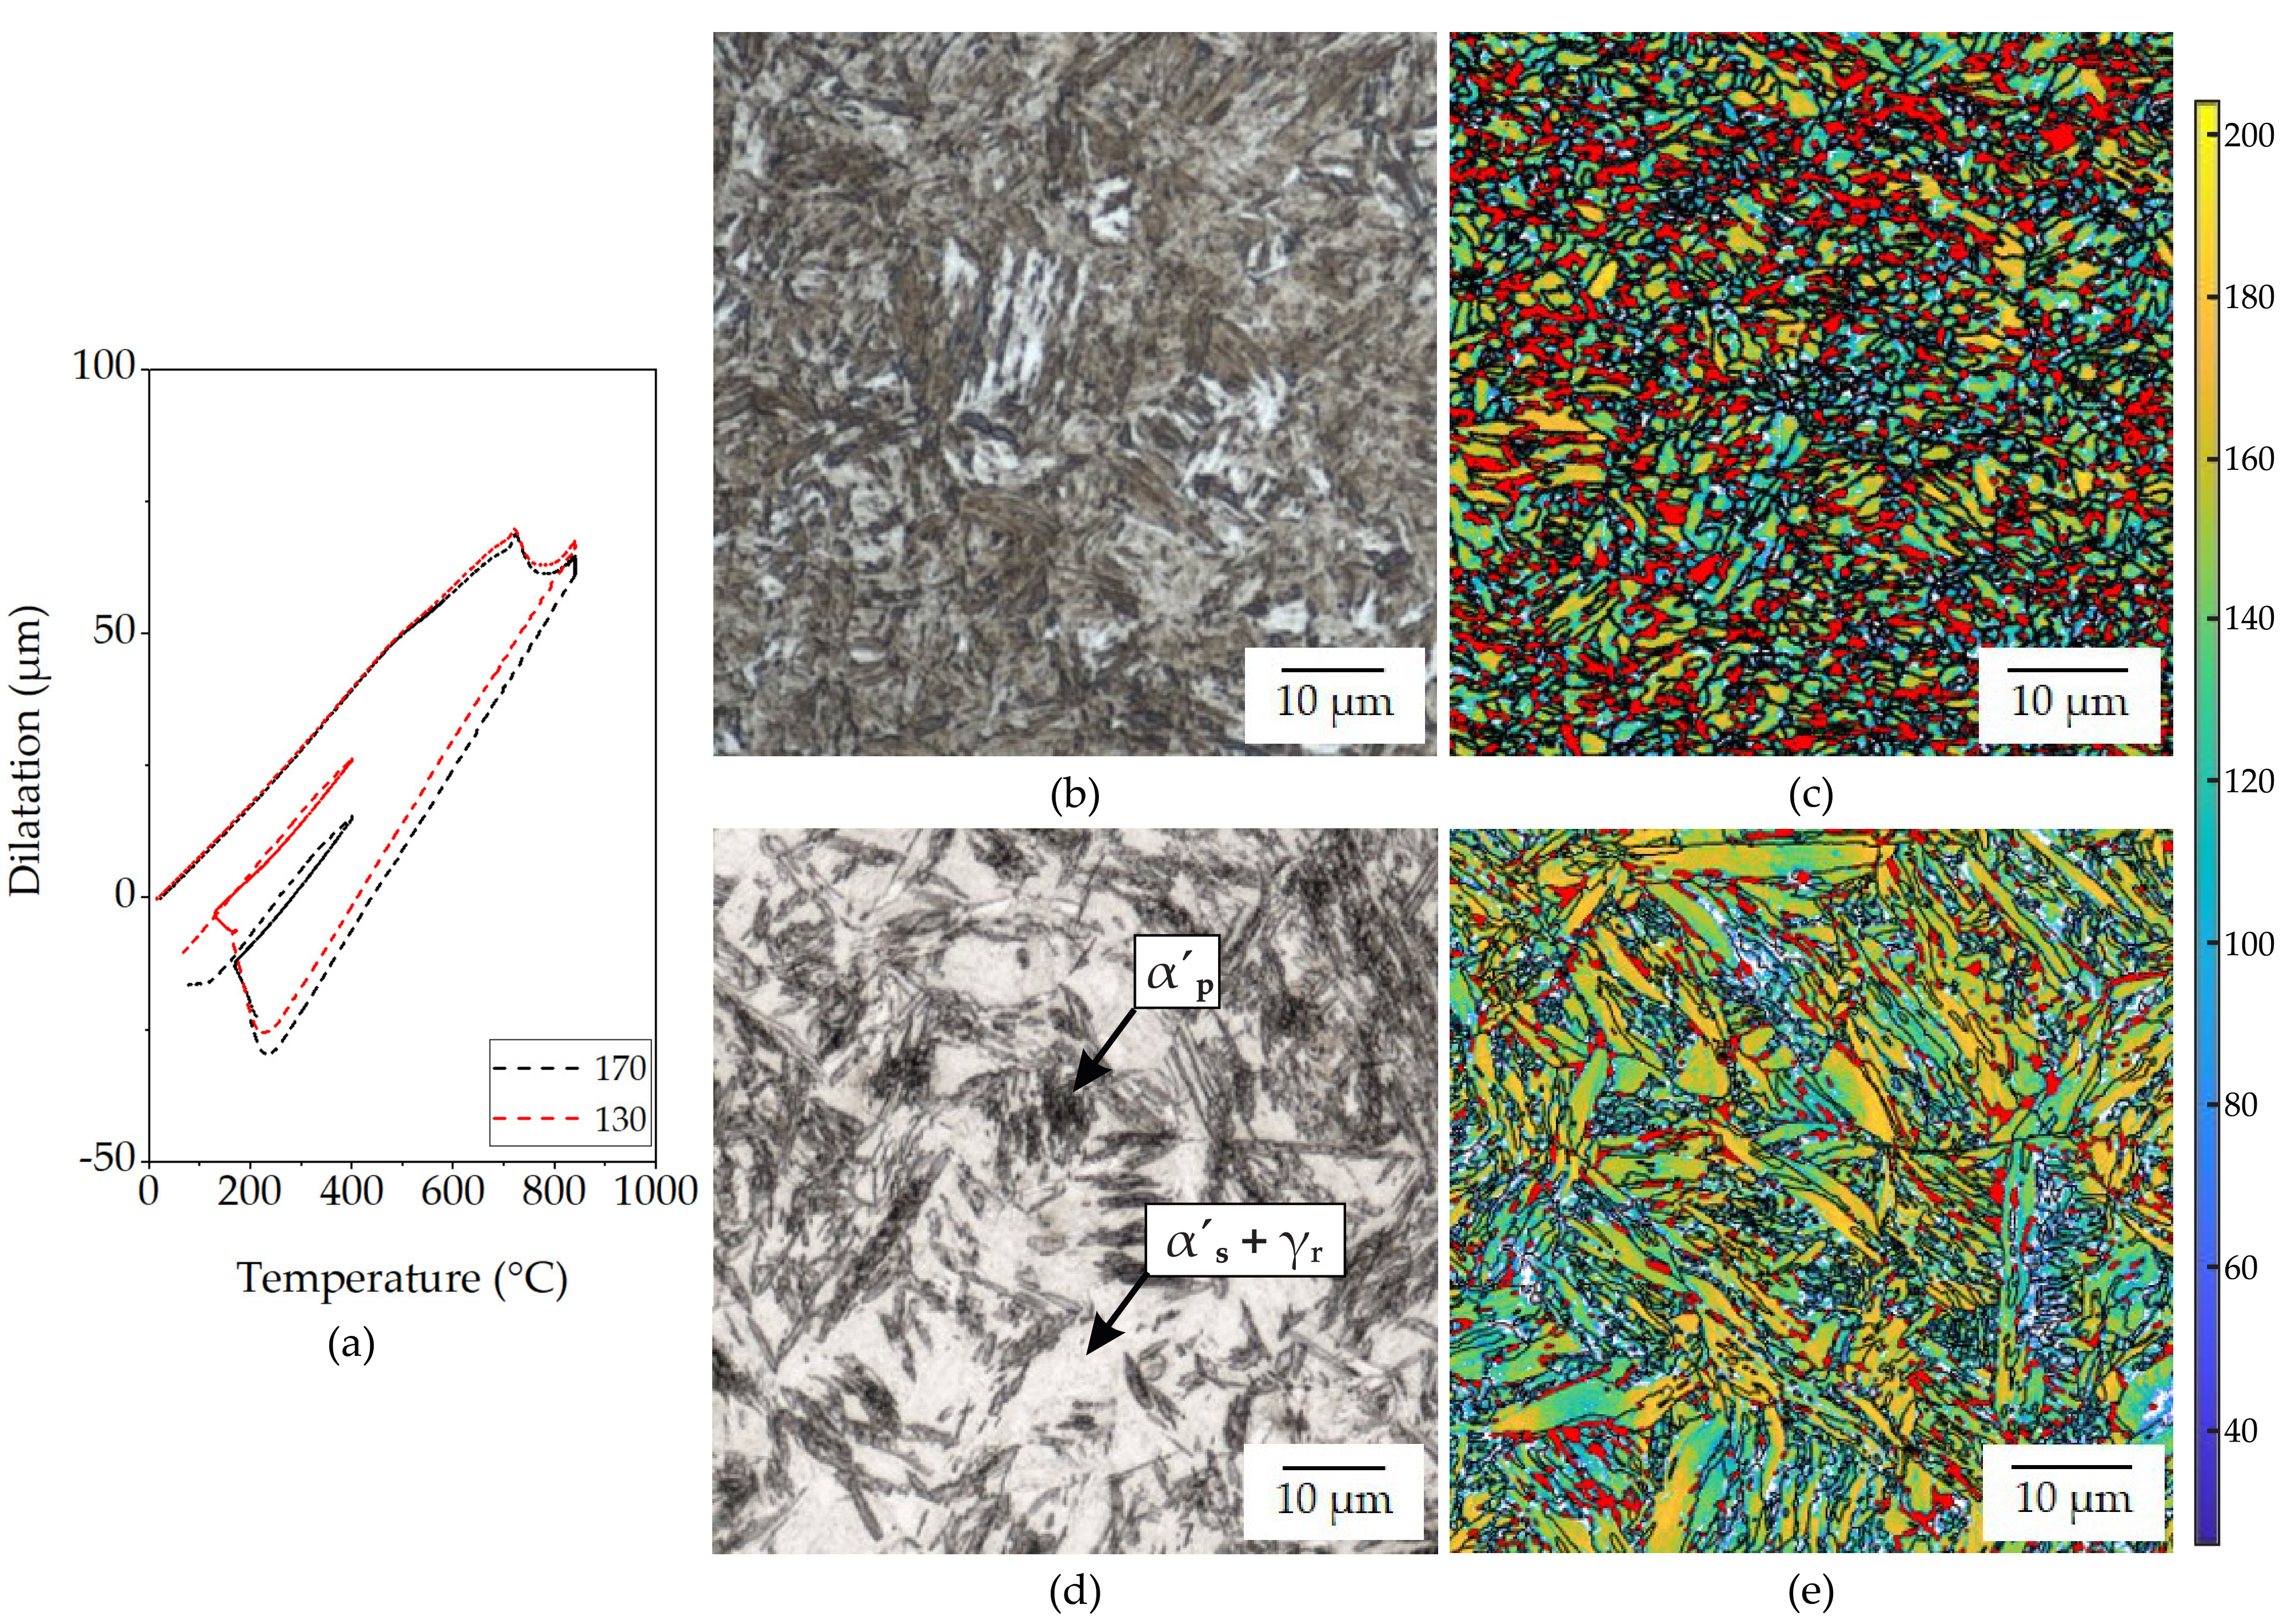
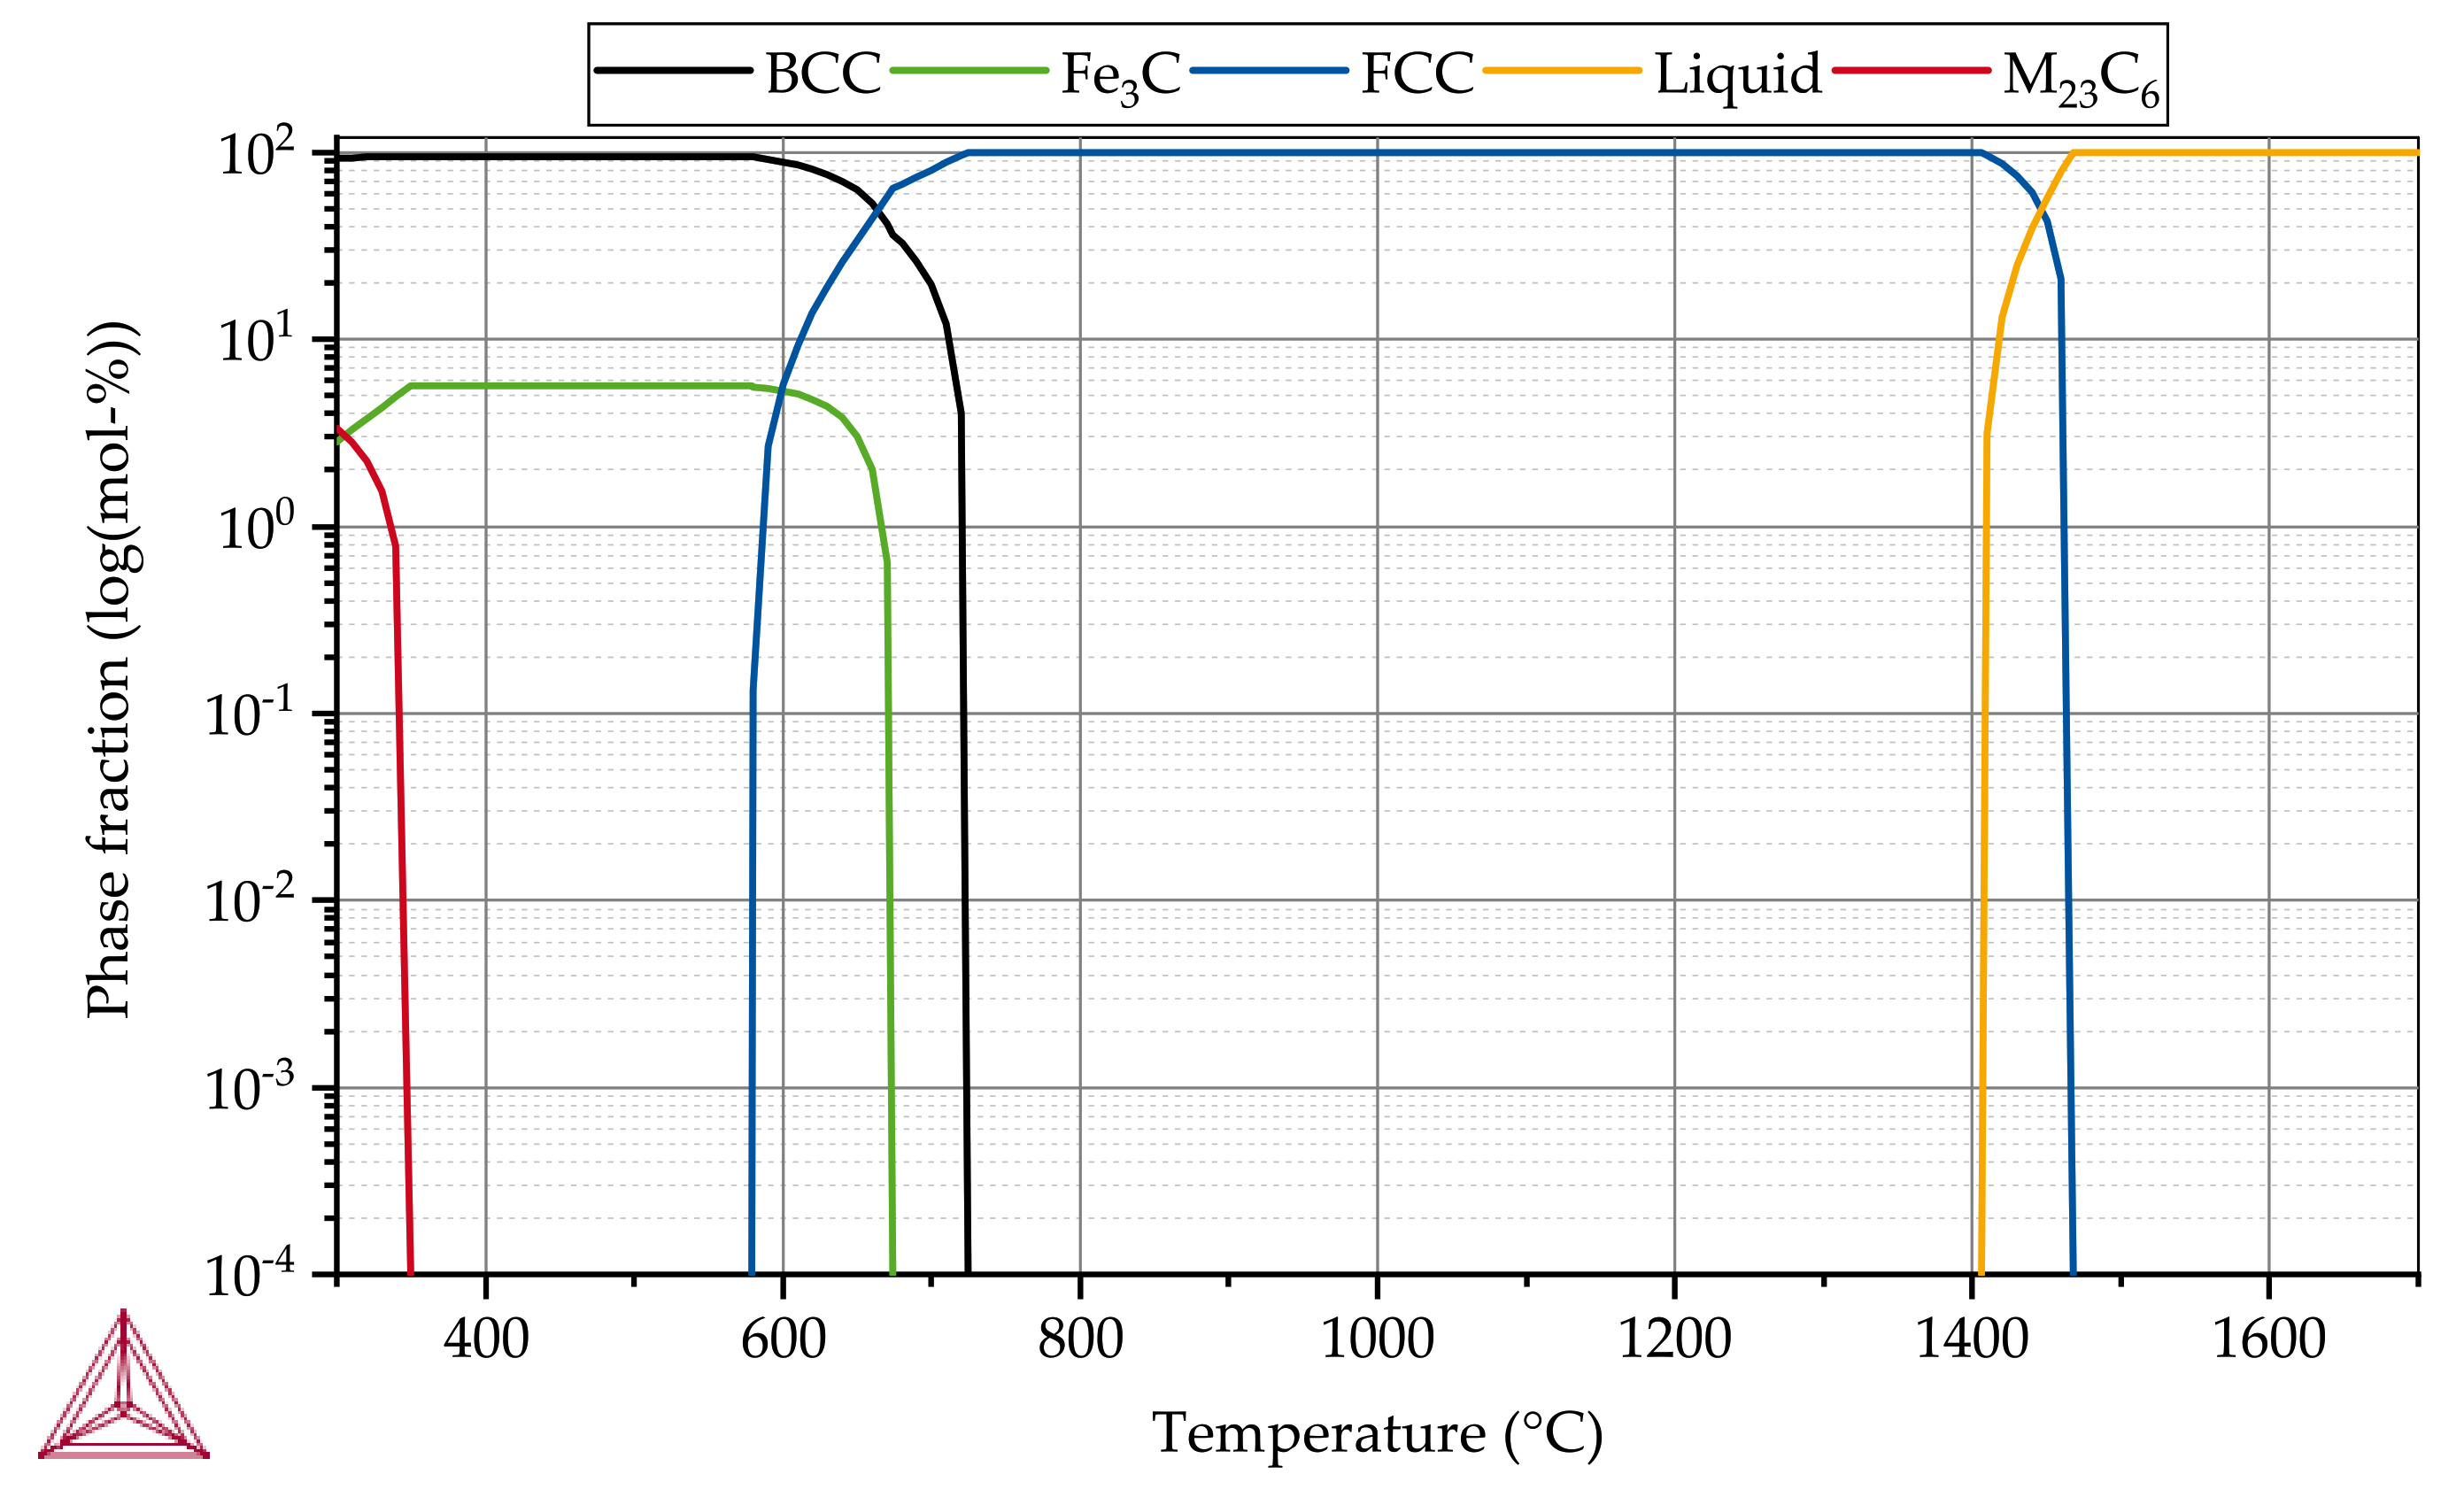
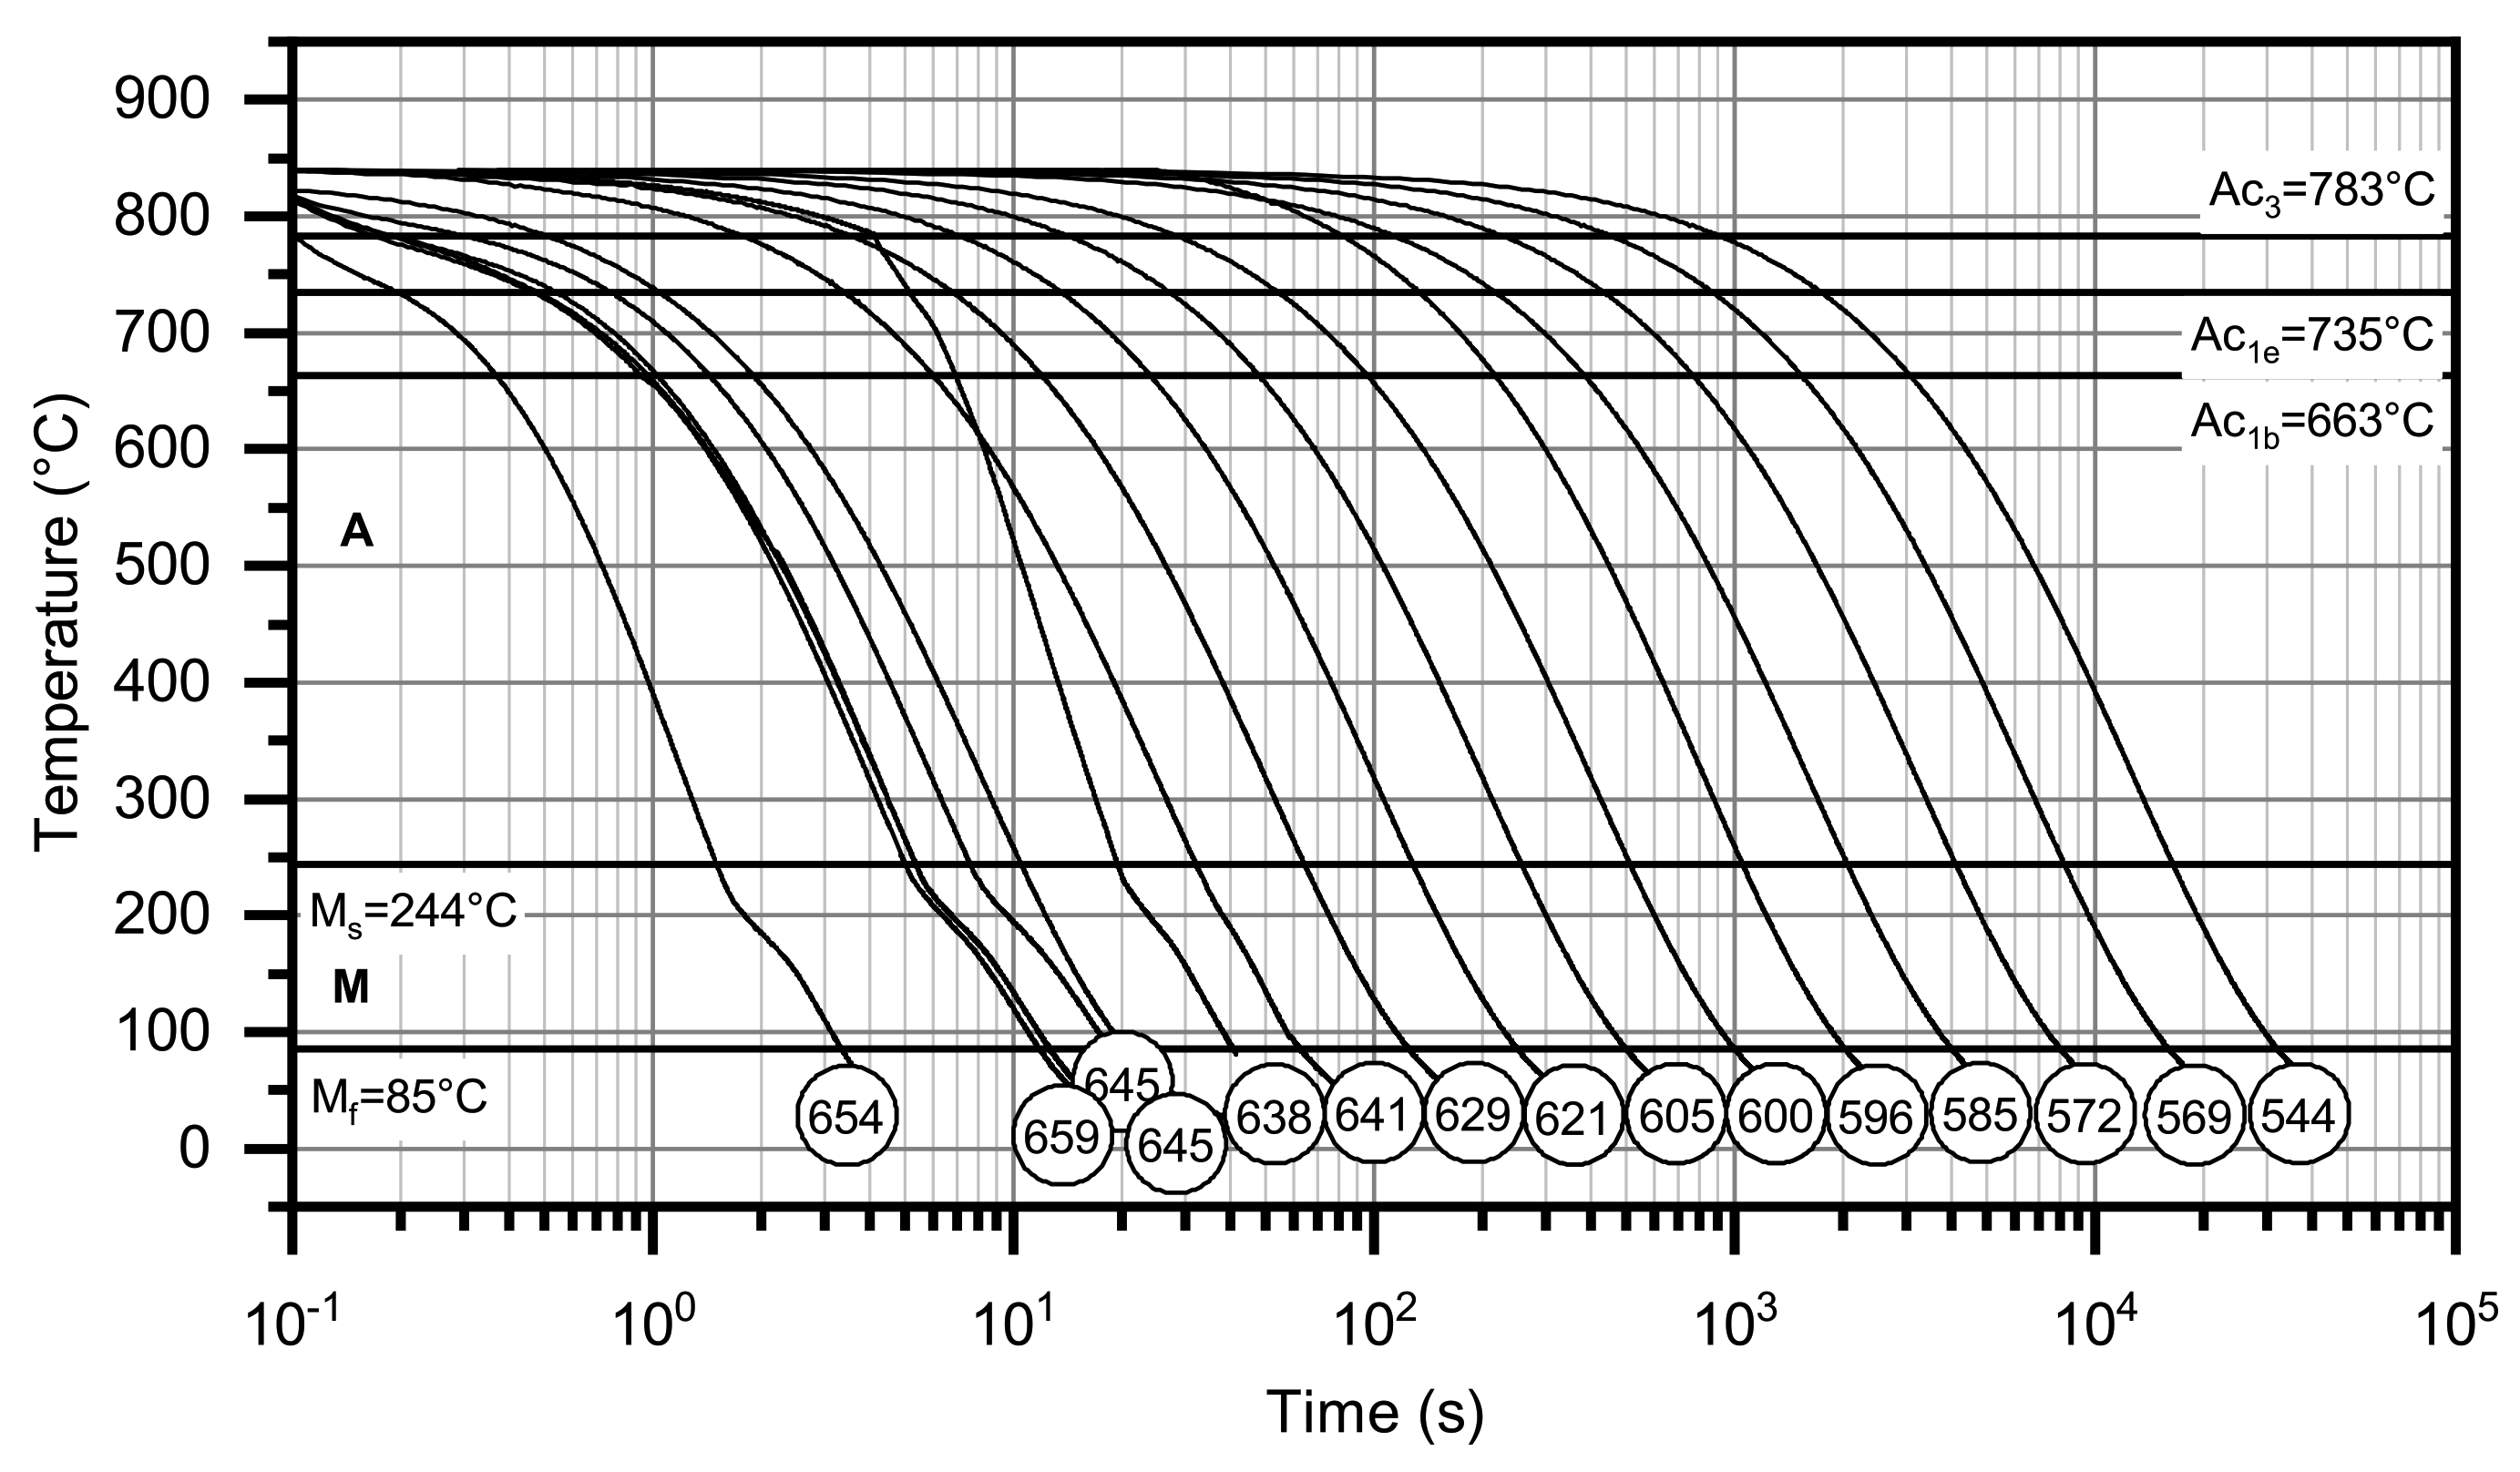
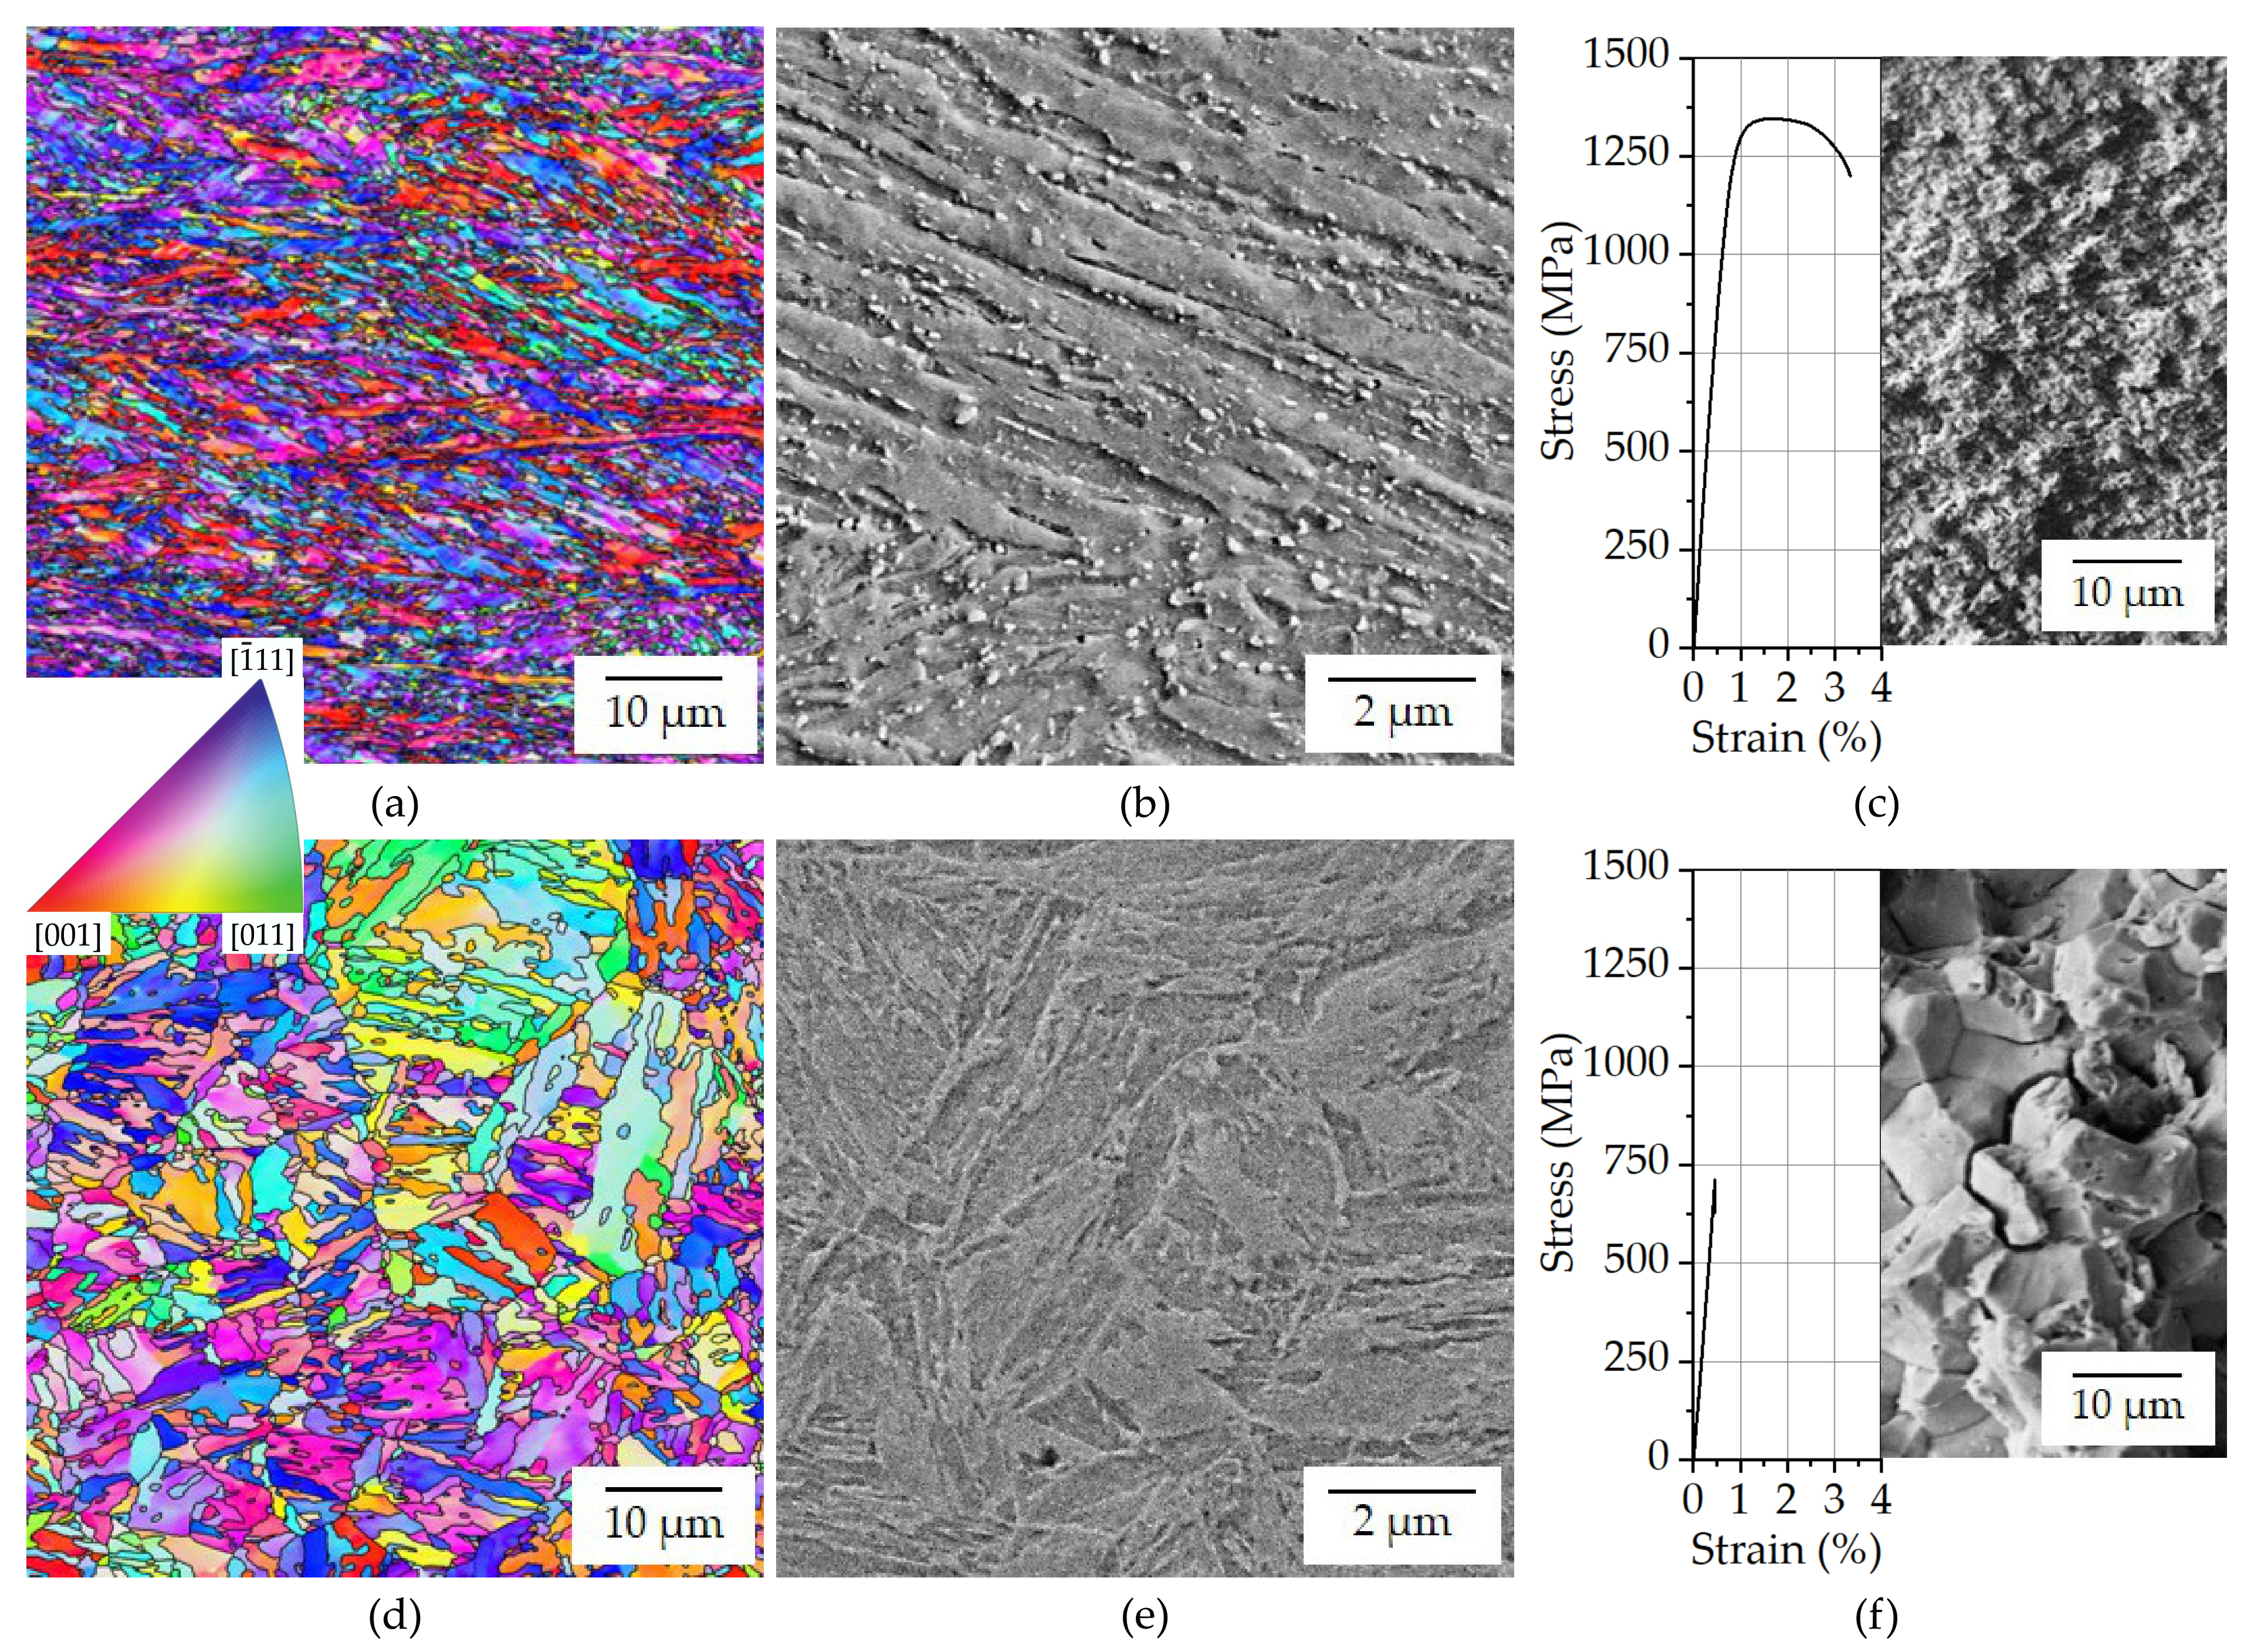
3.1. Phase Transformations and Initial State

Figure 3 represents the prediction of most stable phases by ThermoCalc simulation, whereas Figure 4 shows the experimental determined CCT diagram for Fe-0.3%C-5%Mn-1.5%Si. Next to the start (Ac1b) and finish (Ac3) temperature of austenite formation, carbide solution was also identified during the heating of dilatometric samples. The completion of carbide solution was reached at 735 °C (Ac1e). Additionally, the dilatometer experiments revealed that for the investigated medium manganese steel, the bainitic transformation was suppressed completely, even for slow cooling with t8/5>1 h, due to the alloying concept with 5 wt.% Mn and a relatively high 0.3 wt.% C. The decrease in hardness with slower cooling rates can be explained by self-tempering of martensite below Ms. As suggested by Gramlich et al. [23], the reduction in soluted C in the matrix due to the diffusion of C to lattice defects might be a reason for lower martensite hardness. The same effect was observed by Sackl et al. [24] by atom-probe tomography analysis on 42CrMo4.
The deviation of the expected cooling rates starting at 200 °C (Figure 4) can be explained by the martensitic tranformation being exothermic. For the fastest coolings, the dilatometer control cannot respond quickly enough to the change in heat. It is notable that the start of the deviation does not correspond with Ms. Taking into account Figure 5, it can be seen that the formation rate of the martensitic phase is not linear and it is still low shortly below Ms. The start of the deviation matches with the region of maximum martensitic formation rate.
A comparison of experimental and simulated results displays that the transformation temperatures from the simulation were significantly lower than those from the experimental tests. The reason for this is the dependence of the transformation temperatures on the thermal kinetics, which were not taken into account in the equilibrium simulation. To ensure full austenitization, the homogenization temperature was therefore set to 840 °C for the following heat treatments.
Figure 3. Thermocalc simulation of most stable phases for Fe-0.3%C-5%Mn-1.5%Si.
Metals 11 01879 g003
Figure 4. Experimentally determined CCT-diagram for an austenitization time of 300 s at 840 °C (hardness HV30).
Metals 11 01879 g004
The Ms temperature showed no dependence of the cooling rate in the investigated range and was determined to be 244 °C which was in very good agreement with the empiric equation for Ms as suggested by Andrews [25]:
M s = 539.0 423.0 × C 30.4 × M n 12.1 × C r 17.7 × N i 7.5 × M o + 10.0 × C o 7.5 × S i
The martensitic transformation was completed at 85 °C.
To estimate the martensitic phase fractions in dependence of TQ, the K–M equation (Equation (1)) [22] as well as adaptions of it by Seo et al. [26] and van Bohemen and Sietsma [27] were applied to the here-studied material and compared to the experimental results of dilatometry (Figure 5, Equation (2)). For Ms, an experimentally determined value of 244 °C was applied. The comparison shows that for medium manganese steels, further adaptions of the equation are needed. Hence, an adjusted K–M equation was empirically determined for Fe-0.3%C-5%Mn-1.5%Si based on dilatometric data of martensitic transformed as-quenched samples:
V m = 1 e x p ( 0.00203 ( M s T Q ) 1.54765 )
According to Equation (4), the martensite phase fraction was 99.4%, reaching the dilatometrically determined Mf of 85 °C. For room temperature, a phase fraction of 99.98% was calculated, which was in very good agreement with EBSD measurements of as-quenched samples detecting only 0.02% of the fcc phase.
Figure 5. Experimental and empirical determination of primary martensite’s phase fraction in dependence of TQ.
Metals 11 01879 g005
In the cold-rolled condition, Fe-0.3%C-5%Mn-1.5%Si showed a martensitic microstructure with a pronounced rolling texture (Figure 6a). The combination of thermodynamic simulation, dilatometric tests, and EDX measurement suggests that the bright particles in Figure 6b are carbides. During homogenization at 840 °C for 300 s, the carbides dissolve (Ac1e = 735 °C), and the microstructure is fully austenitic with an average grain size of 9 µm (measured as prior austenite grain size). The subsequent quenching to room temperature suppresses further diffusion processes and leads to a fully martensitic microstructure (Figure 6d) with higher dissolved C-content, as in the cold-rolled state, corresponding to a greater lattice distortion [28].
While the cold-rolled samples have a tensile strength of 1340 MPa and a total elongation of 2.7%, the as-quenched specimens fail early during tensile testing without any plastic deformation (Figure 6c,e). The fracture surface of these as-quenched samples shows an intergranular fracture along the prior austenite grain boundaries, which is what might be related to embrittlement due to segregations. Nasim et al. [29] attribute the occurrence of intergranular fracture in an as-quenched 8 wt.% Mn steel to the enrichment of especially N on prior austenite grain boundaries. Given the low N content in the here-studied laboratory-produced material, embrittlement due to Mn and P segregations during hot rolling, homogenization, and air cooling, as suggested by Han et al. [30], seems to be more probable. Brittle intergranular fracture of fully martensitic steel due to Mn segregations on prior austenite grain boundaries was also stated by Kuzmina et al. [31]. Solute decohesion and changes in the magnetic effects (Mn is more electronegative than Fe), which diminish the metal–metal bond, are mentioned as a possible explanation. To reduce embrittlement, they [31] suggested an intercritical annealing prior to a tempering treatment causing austenite to form at the Mn segregations.
Figure 6. (a) IPF map of the cold-rolled state; (b) SEM image of the cold-rolled state containing small carbides; (c) tensile test results in combination with phase map (blue = bcc) and fracture surface of the cold-rolled state; (d) IPF map of the as-quenched state; (e) SEM image of the martensitic as-quenched state; (f) tensile test results in combination with phase map (blue = bcc) and fracture surface of the as-quenched state.
Metals 11 01879 g006

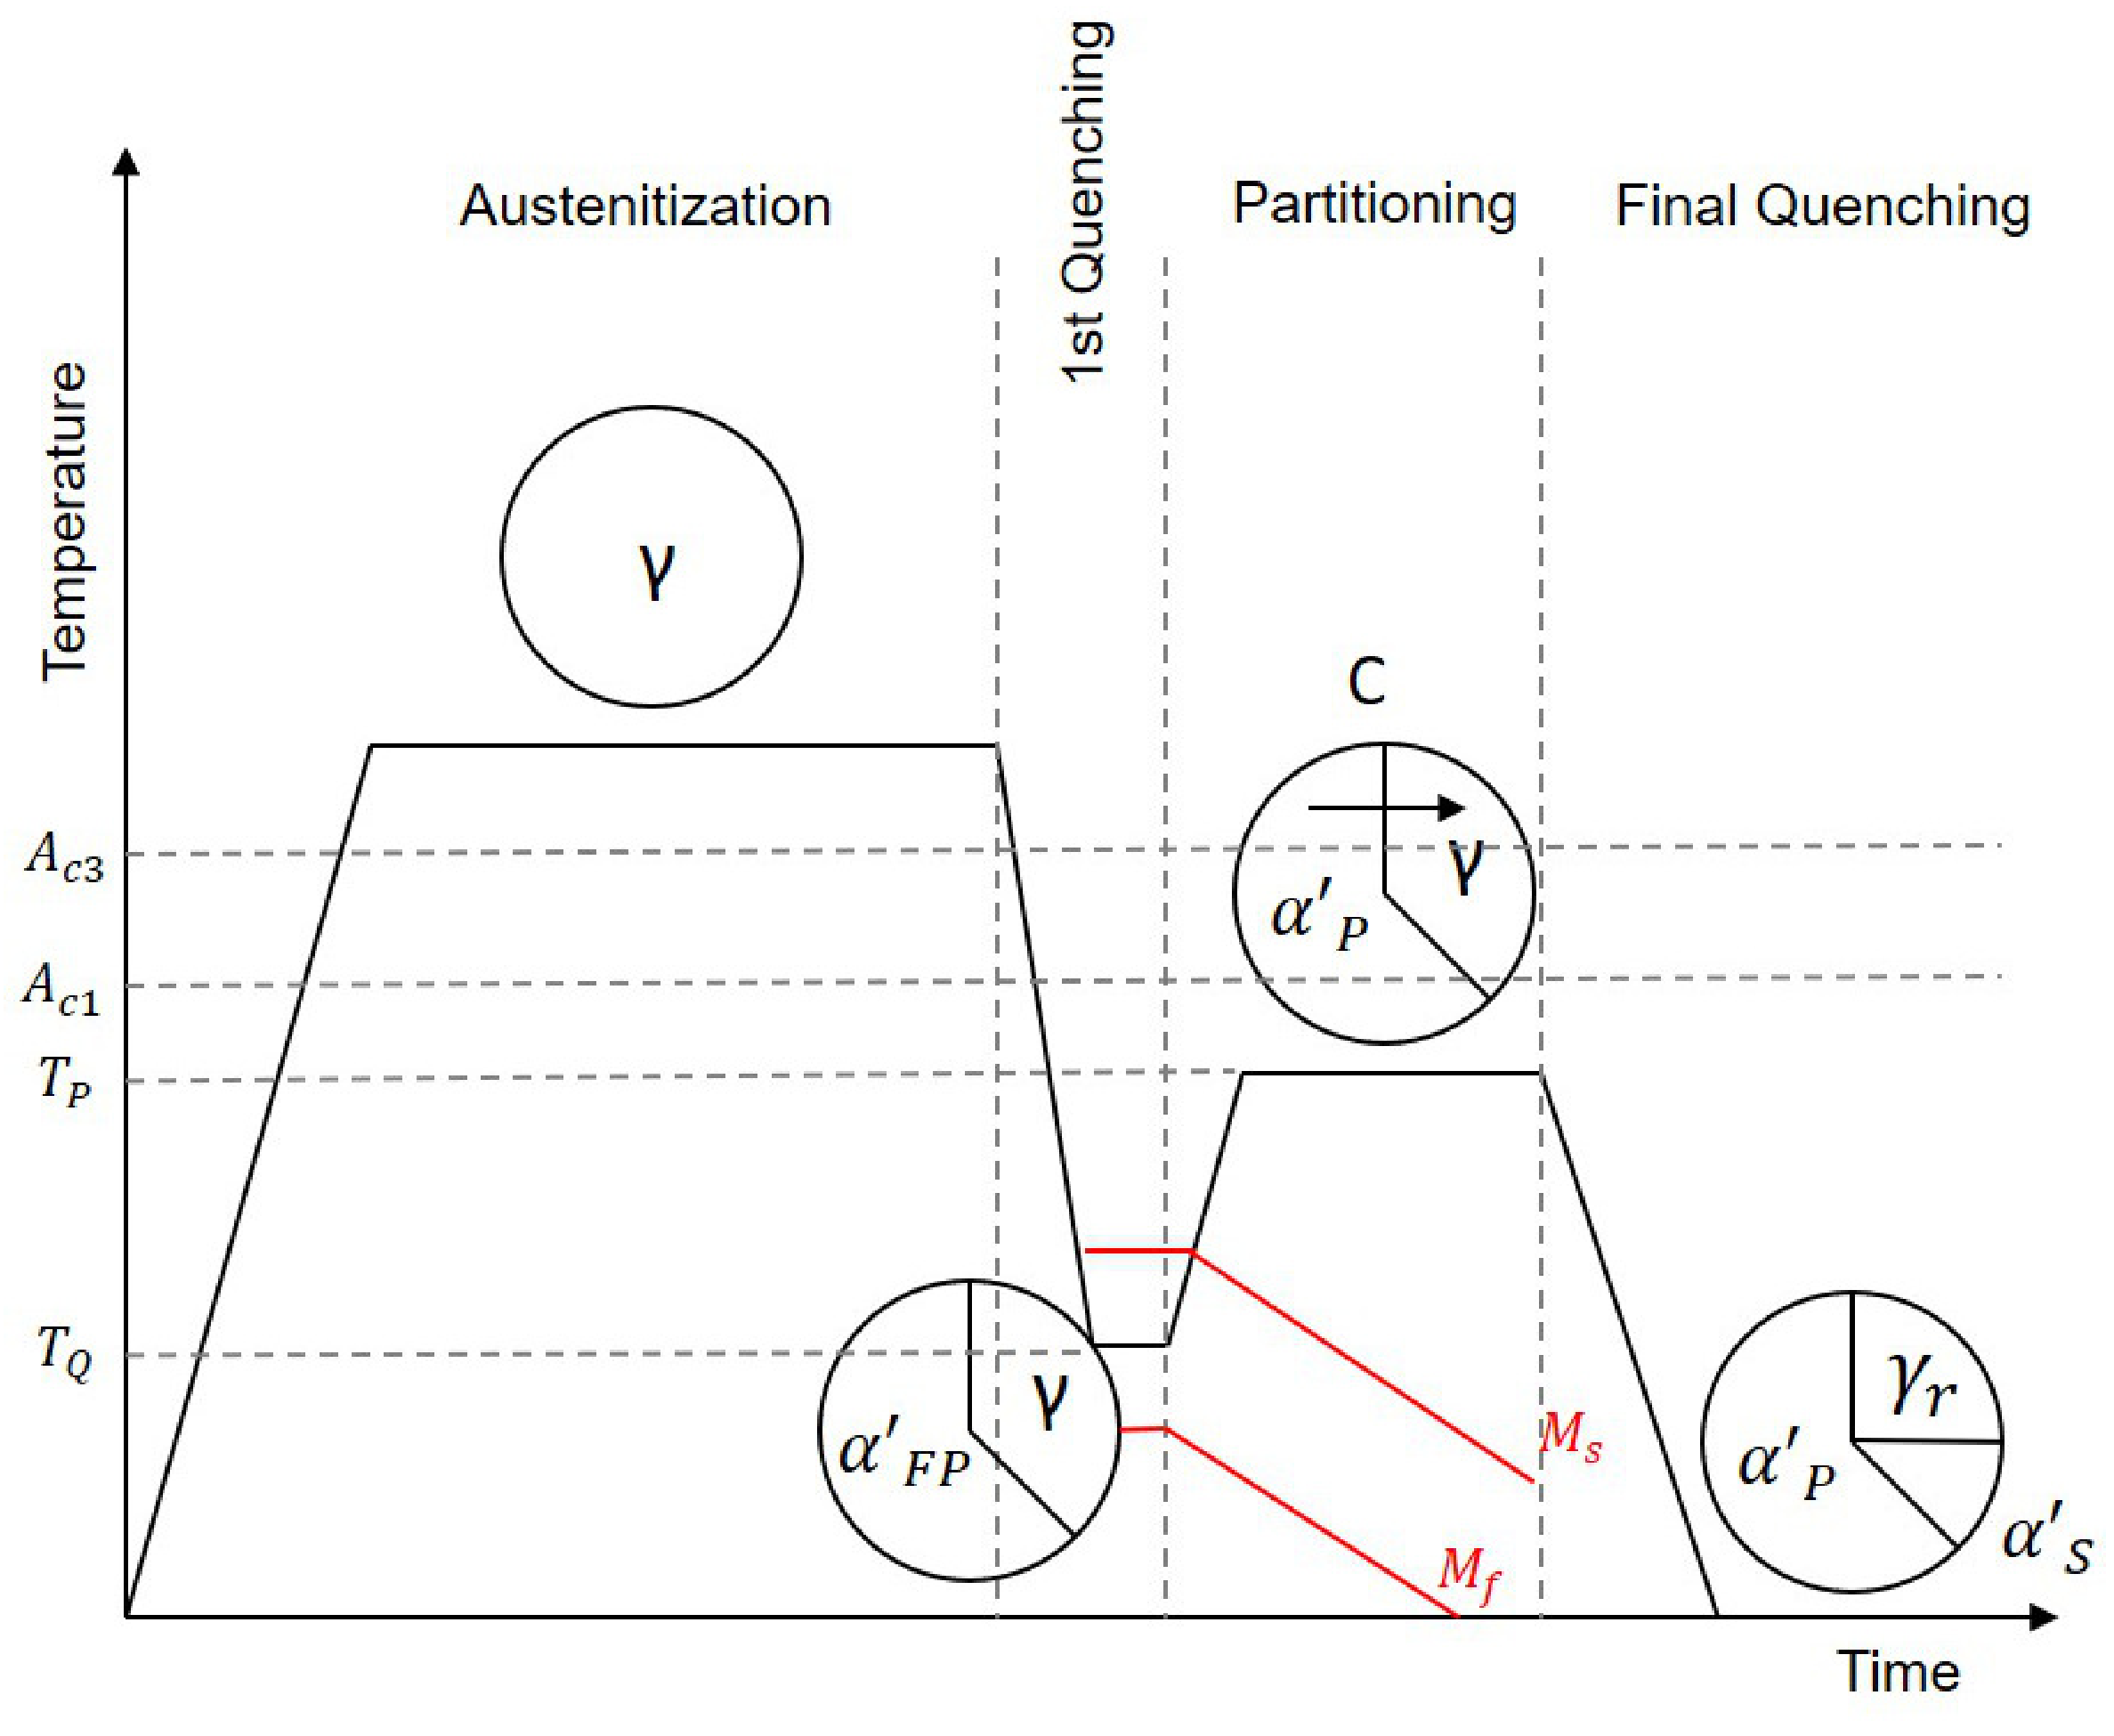
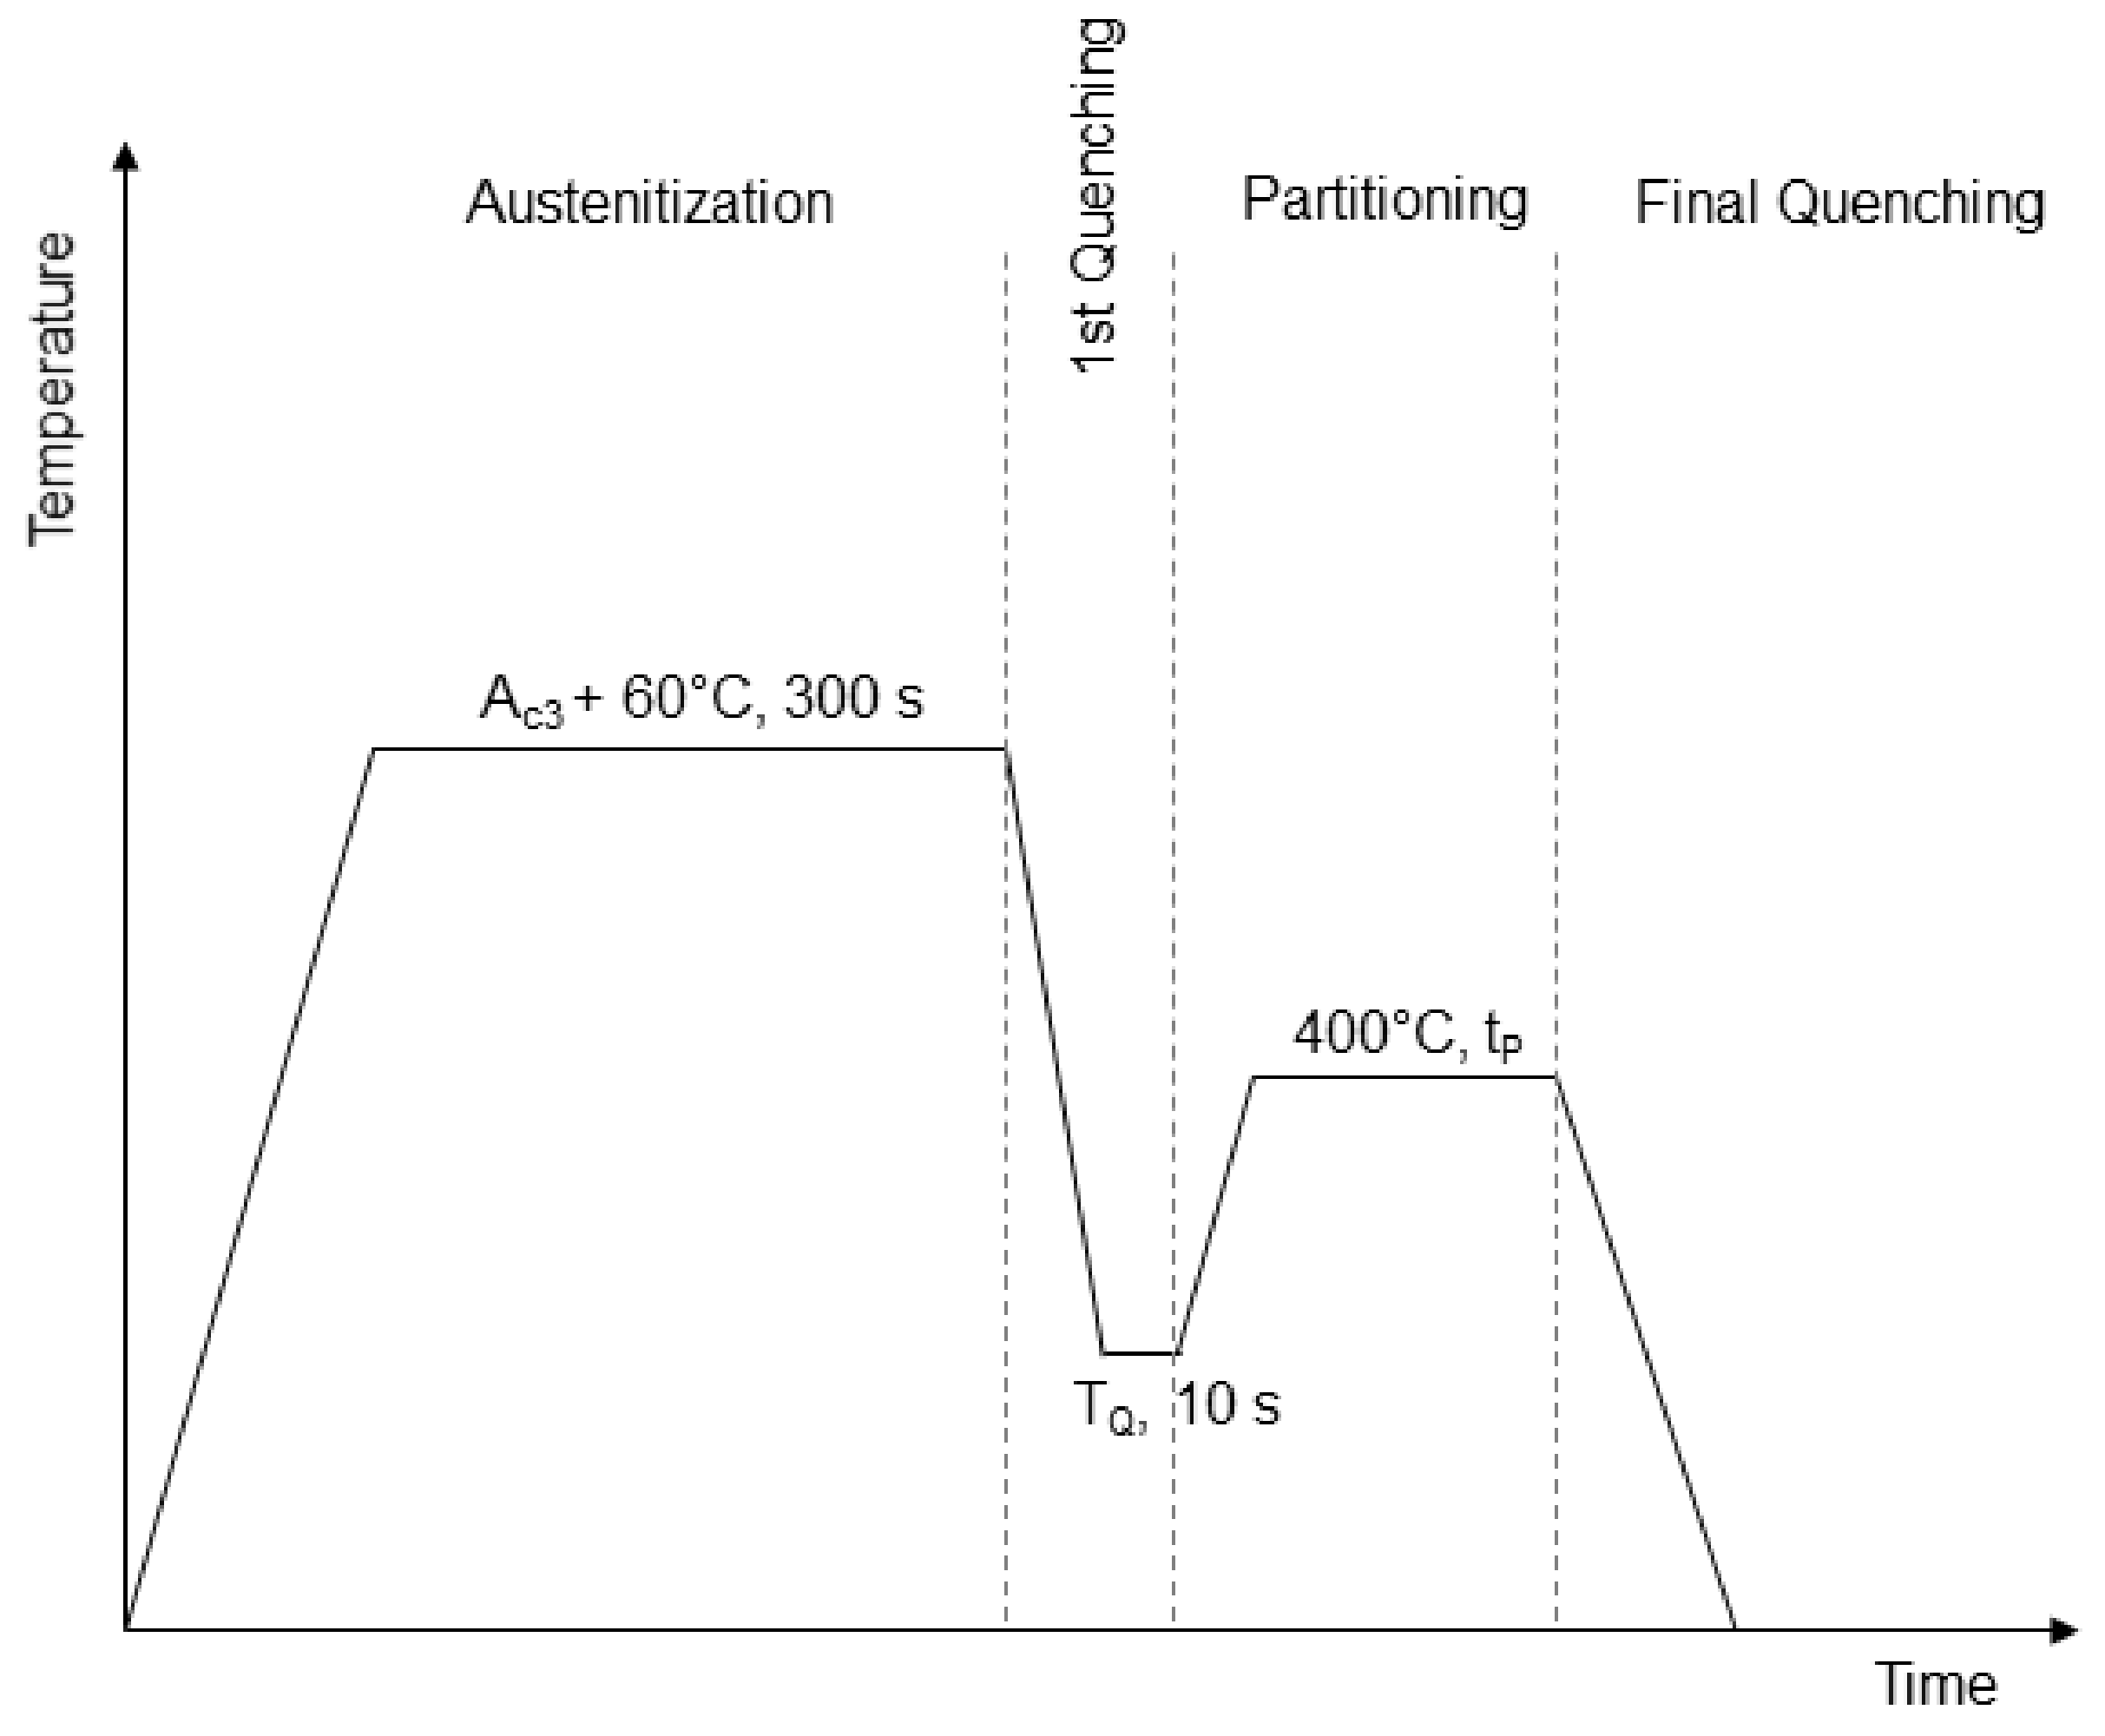
3.2. Quenching & Partitioning

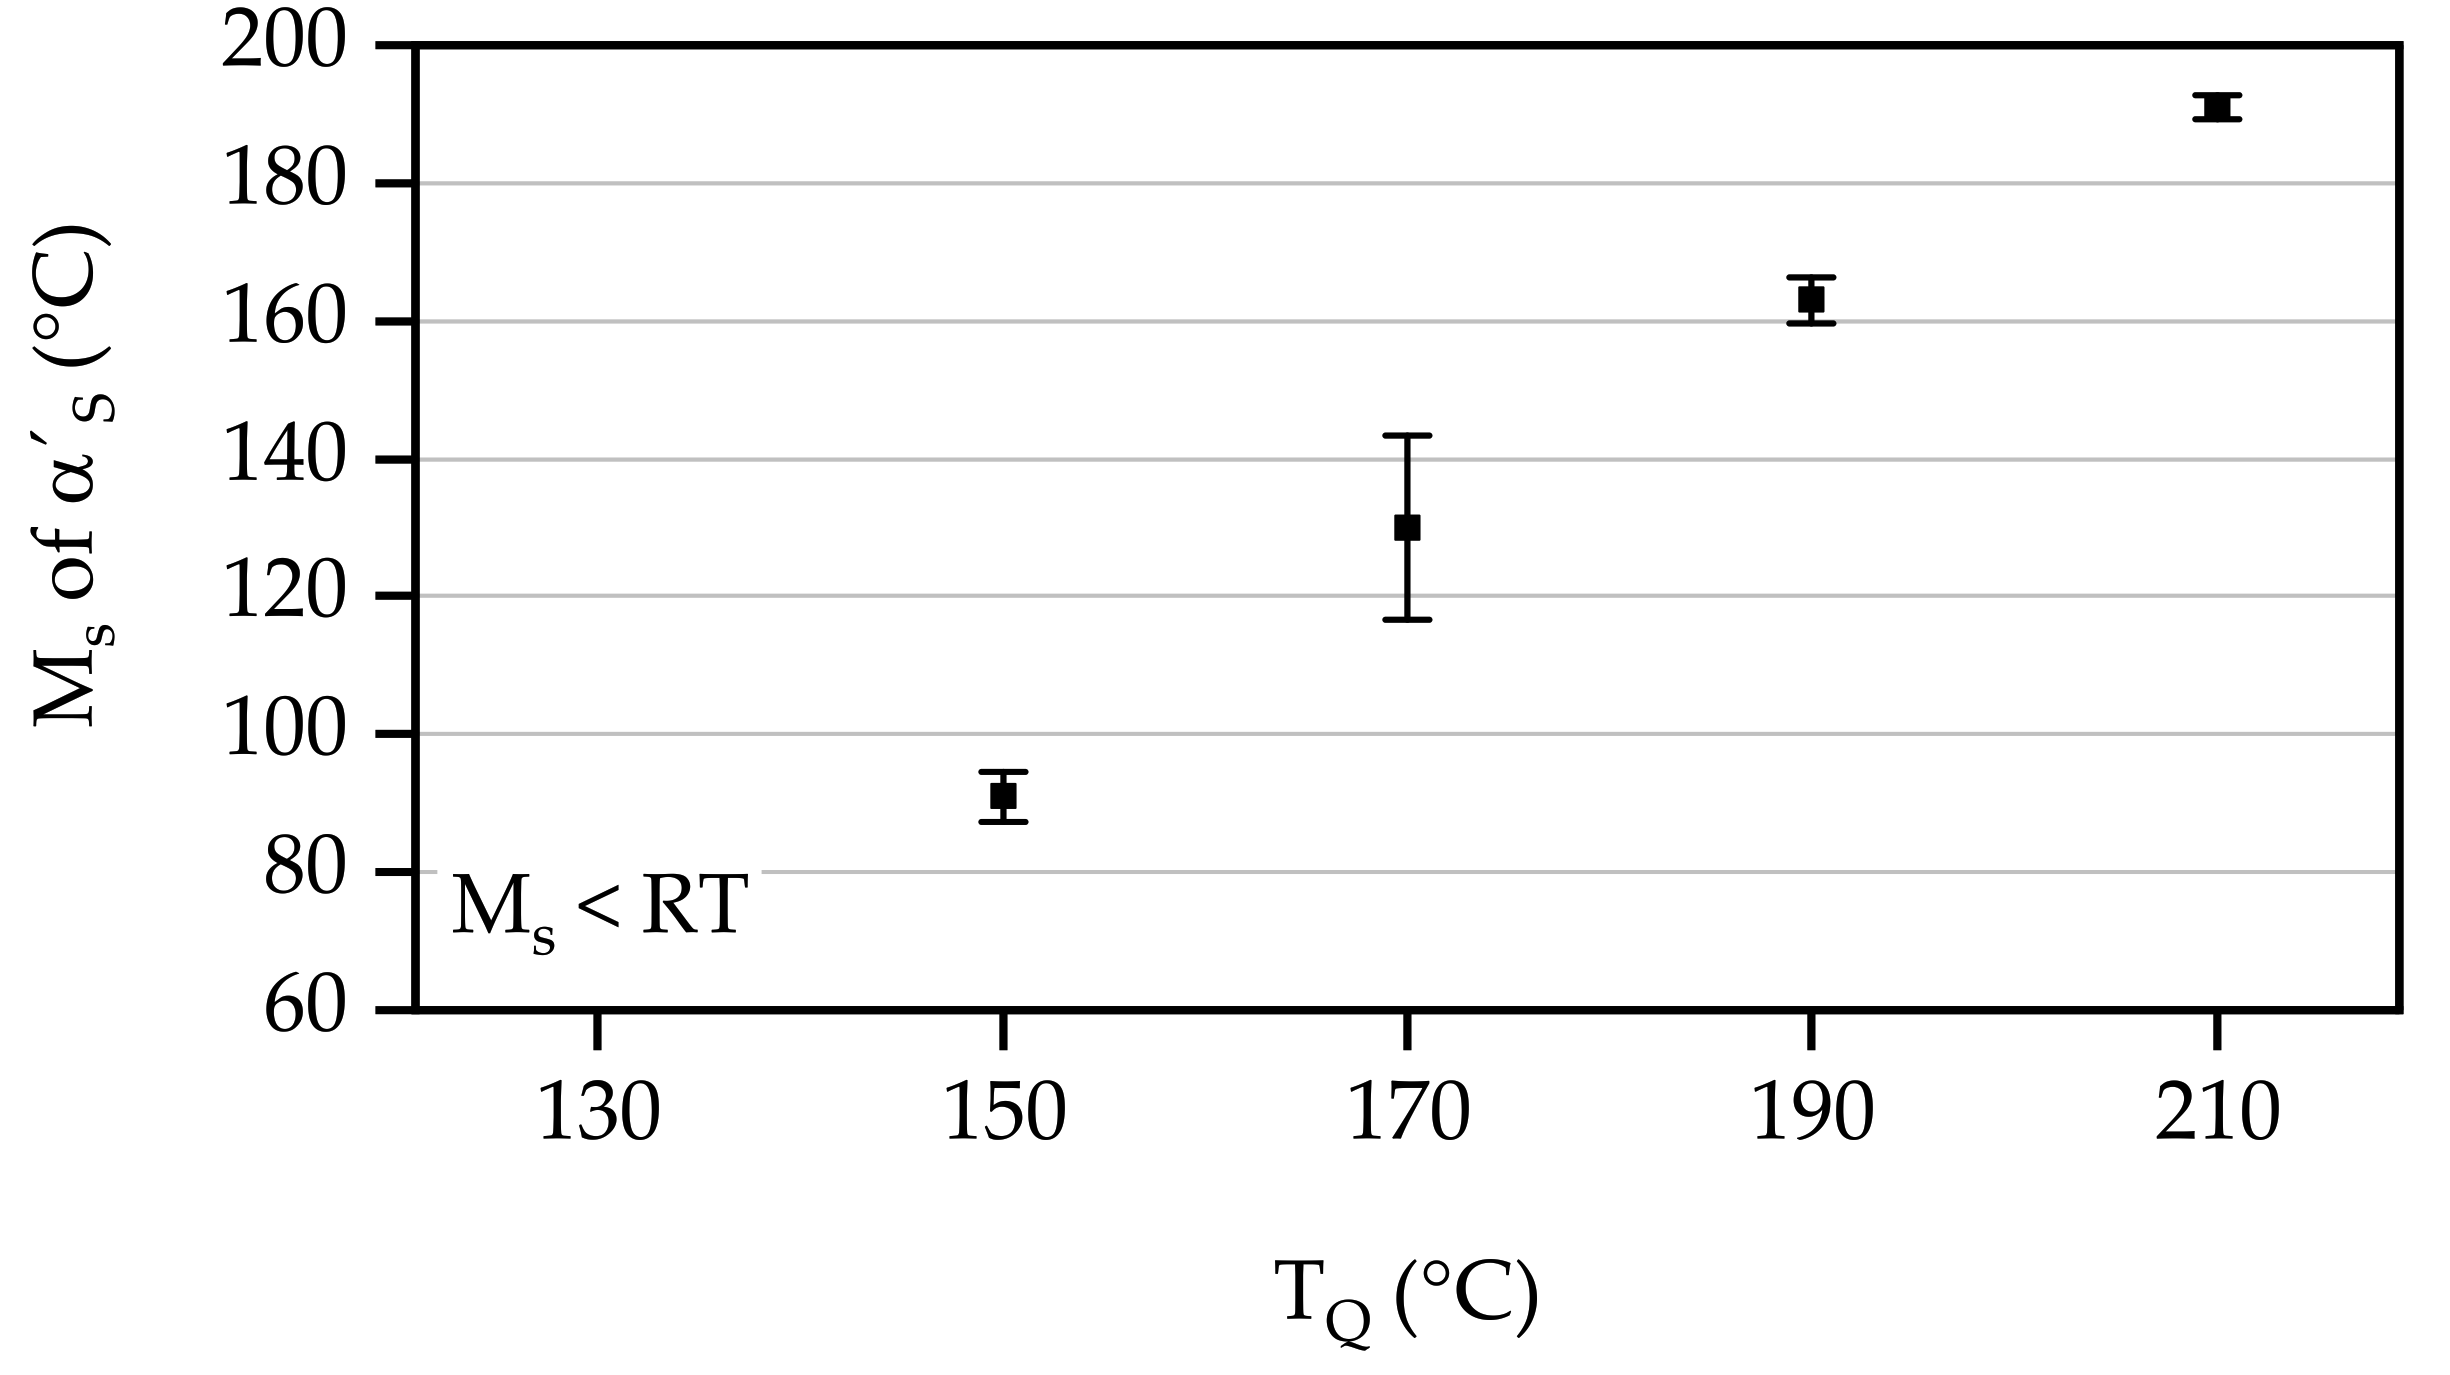
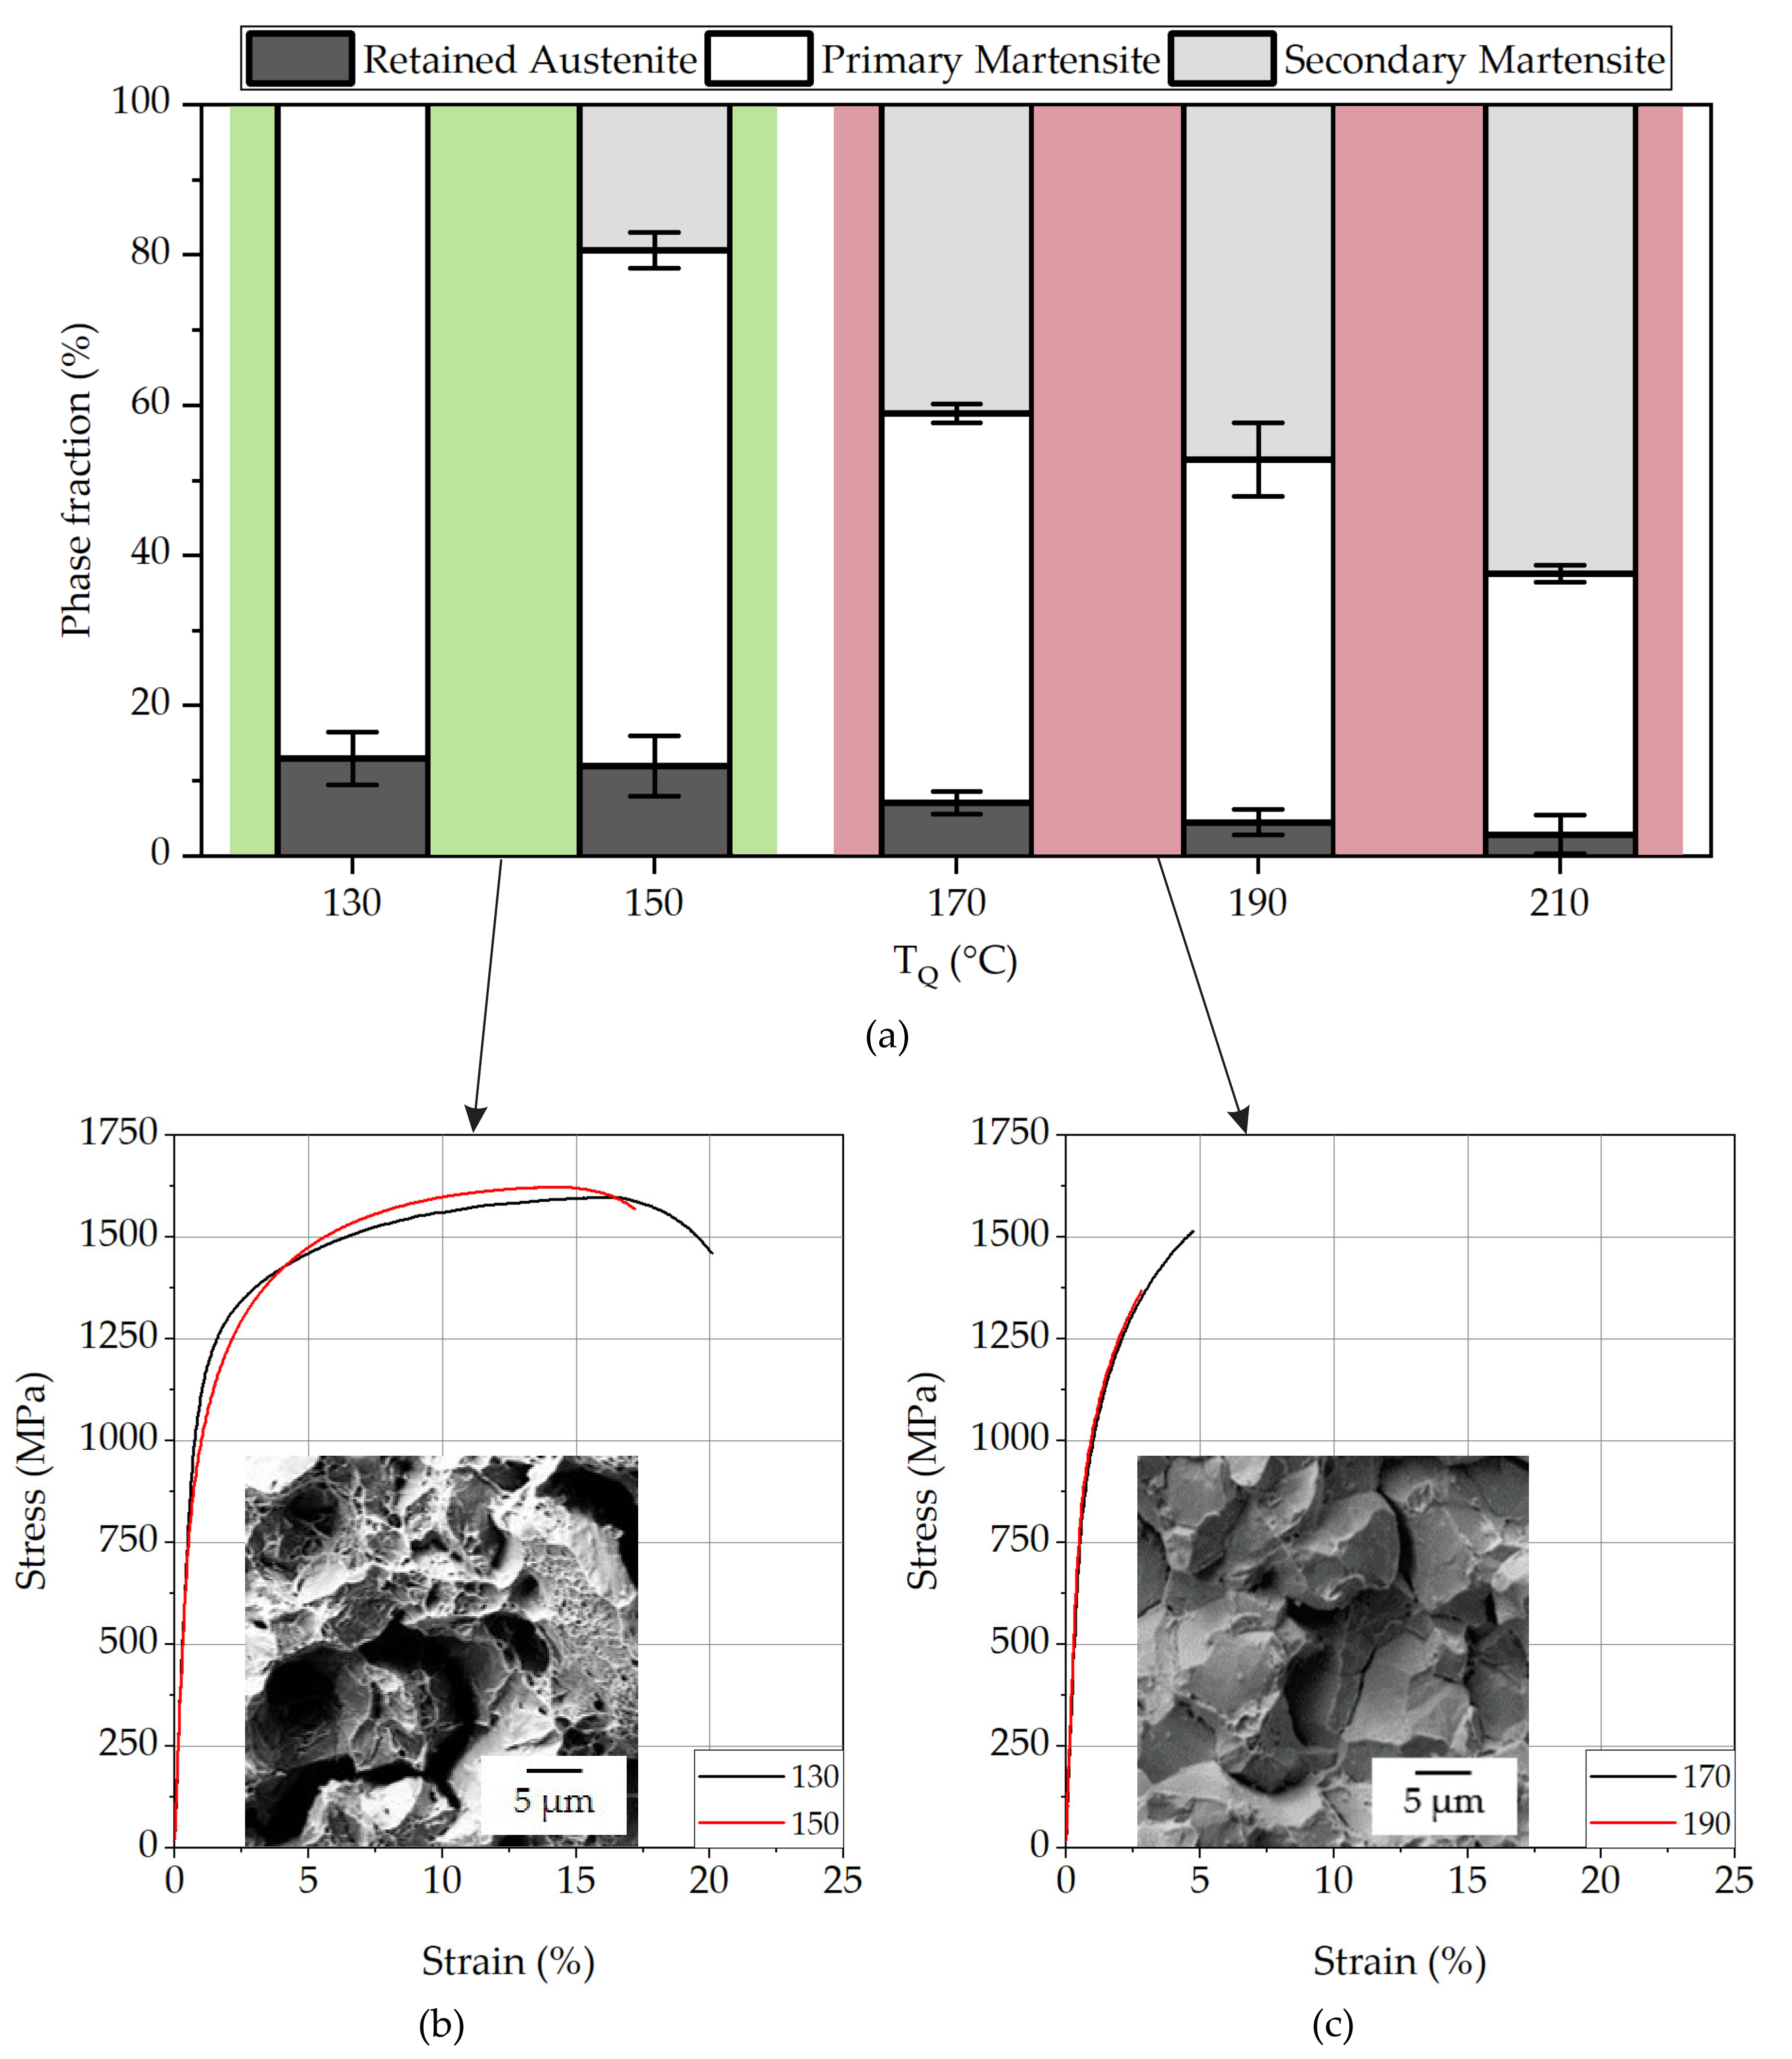
3.2.1. Influence of TQ

The microstructure of the samples quenched to 150–210 °C followed by a partitioning treatment at 400 °C for 60 s consists of primary (tempered) martensite (low C content), secondary martensite (high C content), and retained austenite. The phase fraction of primary martensite increases, and correspondingly the austenite fraction decreases after first quenching with decreasing TQ. The dilatometric investigation on Fe-0.3%C-5%Mn-1.5%Si shows that the amount of primary martensite is hereby, especially between 170–210 °C, very sensitive to TQ due to fast martensite transformation kinetics, which is also illustrated in Figure 5.
During subsequent partitioning treatment at 400 °C, Speer et al. [32] suppose with their constrained carbon equilibrium model that C diffuses from primary martensite into the remaining austenite assuming that no competing reactions like bainite or carbide formation occur [32,33]. Accordingly, the higher C content stabilizes the austenite by lowering the Ms. The occurrence of carbides during partitioning in the here-studied material could be excluded following the microstructure analysis. Additionally, a possible bainite formation during partitioning was ruled out, since no significant change in length over the holding time at 400 °C was detected by means of dilatometry. Hence, the carbon was used entirely for the stabilization of the austenite. Despite this, the chosen partitioning treatment for samples quenched to TQ  150 °C was not sufficient to lower Ms to room temperature; hence, secondary martensite started to form out of the carbon enriched austenite during final quenching. Thus, the retained austenite content for samples quenched to exemplary 170 °C decreased during final quenching from almost 50% to 7%, resulting in 43% fresh secondary martensite.
With its higher carbon content, secondary martensite features a higher resistance to nital etching and is therefore distinguishable from primary martensite by light-optical (Figure 7d) and scanning-electron microscopy, which was also shown by the work of Santofimia et al. [34]. In a different study, Santofimia et al. [35] supposed identifying primary and secondary martensite by analyzing EBSD IQ maps. Secondary martensite with its higher carbon content should result in higher distortion and thus lower IQ than areas of tempered primary martensite. Nevertheless, a quantitative determination of primary and secondary martensite by this mean is not possible. The combined phase and IQ maps for QP130_60 and QP170_60 are presented in Figure 7c,e. Red areas describe the retained austenite (fcc), while the remaining parts of the microstructure consist of martensite with different IQ. Although formation of secondary martensite was not identified in QP130_60 by dilatometry, its IQ map shows a strong variation, which might be caused by grain boundaries or phase interfaces, which also result in poor band contrast. In comparison to QP130_60, the combination of phase and IQ map of QP170_60 shows a coarser microstructure with a lower austenite phase fraction. The microstructure consists of filmlike and blocky austenite, fine martensite laths, and martensite plates larger than 10 µm. Within these plates, a variation in IQ can be detected, which might be due to incomplete partitioning and therefore inhomogeneous distribution of C, assuming the plates are primary martensite, which is in good agreement with [35]. The finer lath martensite features a lower IQ, which might be an indication for secondary martensite.
The lower the austenite content after first quenching, the more primary martensite and thus carbon is available for the diffusion into austenite and its stabilization during partitioning [34,36]. Therefore, quenching to 130 °C led to a complete stabilization of retained austenite during partitioning, and, hence, the final microstructure consisted only of primary tempered martensite and islands of retained austenite with a total phase fraction of 13%.
The analysis of the corresponding dilatation curves supports the observation of the microstructure investigations and is exemplary given in Figure 7a. For samples with TQ = 150–210 °C, the dilatation curves show a deviation from the linear curve during final quenching, which denotes the initiation of a secondary martensite phase transformation and, hence, is an indication of the poor thermal stability of austenite. The dependence of Ms of secondary martensite on TQ is displayed in Figure 8.
Since the observed phase transformation was not completed, the Mf was obviously set below room temperature during partitioning. For samples quenched to 130 °C, no indications for a phase transformation during final cooling can be found, wherefore Ms and Mf have to be below room temperature.
Figure 7. (a) Dilatation curves for QP170_60 and QP130_60; (b) light optical micrograph of QP130_60; (c) combination of EBSD phase map (fcc = red) and IQ map of QP130_60; (d) light optical micrograph of QP170_60 showing primary (dark) and secondary martensite (bright); (e) combination of EBSD phase map (fcc = red) and IQ map of QP170_60.
Metals 11 01879 g007
Figure 8. Ms of secondary martensite in dependence of TQ.
Metals 11 01879 g008
The corresponding final phase fractions determined by metallographic analysis in dependence of TQ are illustrated in Figure 9a. Retained austenite is determined by EBSD measurements, while, for primary martensite, image contrasting was used. Since it is not possible to distinguish between austenite and secondary martensite in the LOM images, the phase fraction of secondary martensite was calculated. The error bars in Figure 9a show, on the one hand, the standard deviation of the measurements of the retained austenite using EBSD (lower error bar) and, on the other hand, the standard deviation of the measurements of the primary martensite fractions using image contrasting (upper error bar). Comparing the results of Figure 9a with the determined phase fraction by dilatometry (Figure 5), it has to be mentioned that the phase fraction of primary martensite is underestimated by contrasting analysis. As can be seen in Figure 7b, primary martensite can also contain brighter areas depending on the orientation of martensite to the analyzed surface, which makes it more difficult to determine the exact phase fractions of primary and secondary martensite by image contrasting. Therfore, in-situ synchrotron X-ray diffraction was identified as a useful method for more detailed analysis of phase fractions, their composition, and transformation kinetics for future work.
Tensile testing revealed an excellent combination of strength and ductility for samples containing up to 13% retained austenite and <20% fresh martensite due to quenching to 130 °C (Rm = 1598 MPa, Ax = 19.1%) and 150 °C (Rm = 1644 MPa, Ax = 16.4%). In comparison, TQ 170 °C with a maximum of 7% retained austenite fraction and more than 40% untempered secondary martensite led to no significant increase in the ductility compared to the as-quenched state (Figure 6 and Figure 9). This observation is in good agreement with the studies of Paravicini Bagliani et al. [37], who found a degradation of the mechanical properties of Q & P-treated medium-carbon steels with increasing secondary martensite content up to 35%. Comparable to the present study, the best combination of strength and ductility was reached with a maximum retained austenite fraction and the lowest fraction of secondary martensite.

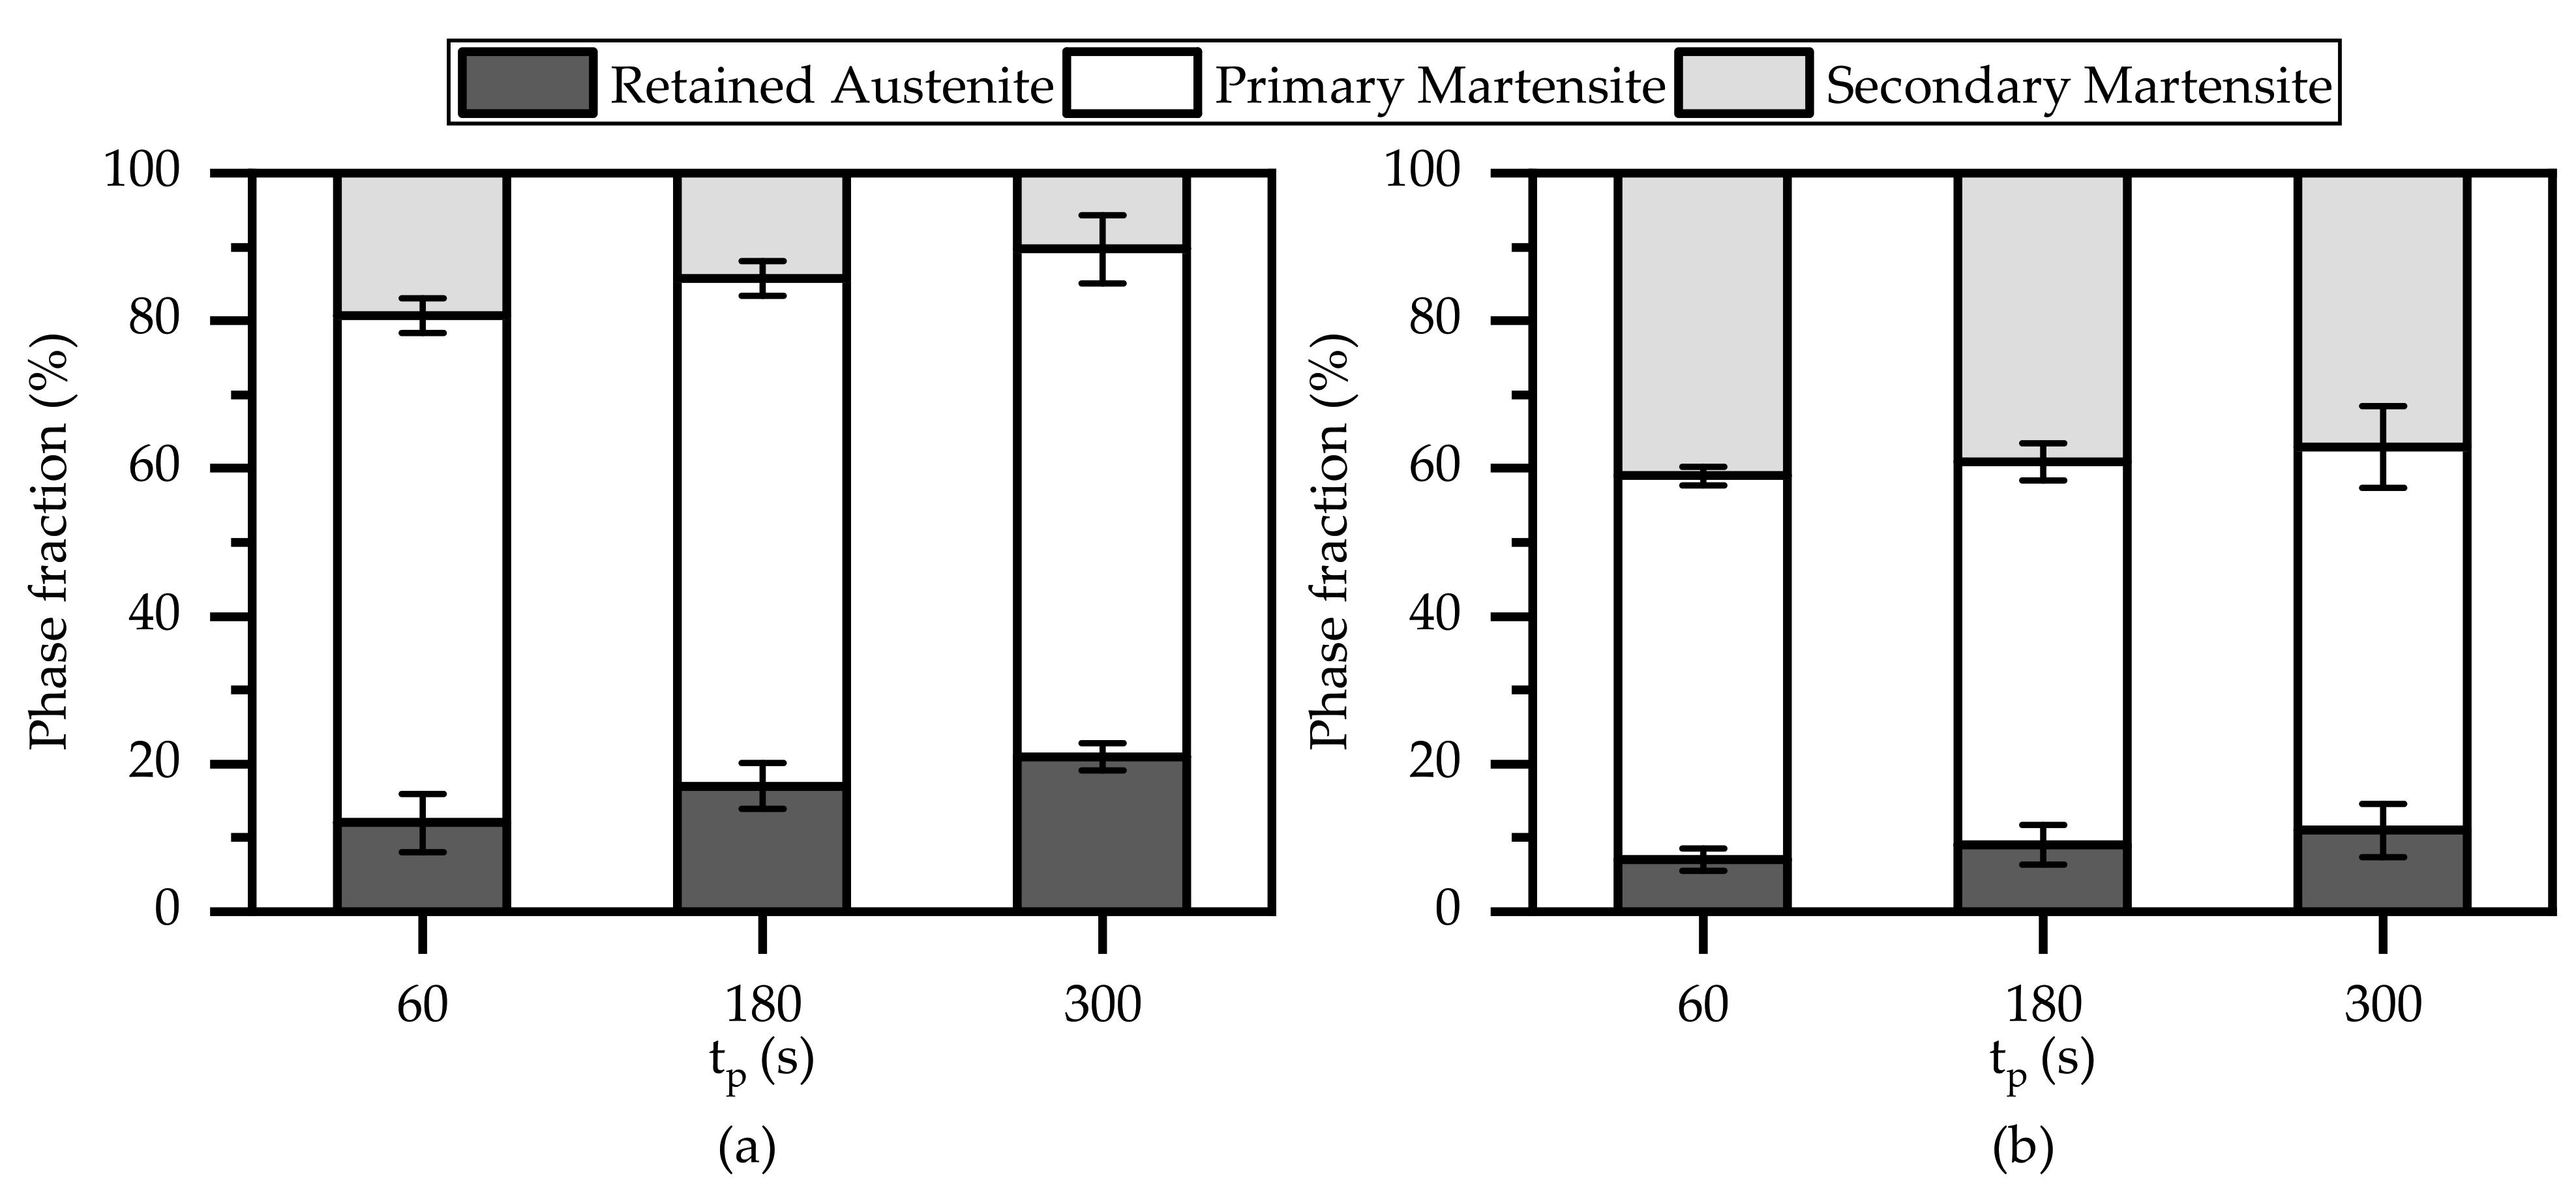
3.2.2. Influence of tP

According to the results above, the limiting values of TQ, 150 and 170 °C, were chosen to investigate the influence of a longer partitioning time on the austenite stability and the mechanical properties. EBSD measurements for TQ = 150 °C showed that increasing the partitioning time from 60 to 180 s led to a final austenite fraction of 17%. A further extension of the partitioning time up to 300 s raised the retained austenite content even to 21% (Figure 10). A comparison of the dilatation curves confirms that an increased partitioning time stabilizes a higher retained austenite content, which was set after the first quenching to 150 °C, and hence less fresh secondary martensite formed. While after a partitioning of 60 s, secondary martensite starts to form during quenching to room temperature at 91 °C, this temperature was set below 60 °C for samples with previous partitioning for 300 s. Even after 300 s of partitioning, microstructure analysis revealed no carbides and no bainite formation.
With respect to the mechanical properties, the increased partitioning time led only to a moderately higher uniform and total elongation at a comparable strength level (Table 2). The only slight influence of partitioning time at 400 °C on the elongation was also stated by Arlazarov et al. [38], who investigated 0.29 wt%C-3 wt%Mn-1.4 wt%Si steel.
In the case of quenching to 170 °C, even prolonged partitioning from 60 s up to 300 s did not stabilize much more austenite. The dilatation curves show that even after 300 s of partitioning, Ms was still about 135 °C; thus, 37.1% hard secondary martensite formed during final quenching. The final austenite content raised slightly from 7 to 11%. Within this test series, no significant differences in the strength and ductility properties can be achieved. Compared to the samples quenched to 150 °C, the samples also showed a relatively high strength level but no plastic deformation (Table 2).
Figure 10. Final phase fractions in dependence of tp for (a) TQ = 150 °C and (b) TQ = 170 °C.
Metals 11 01879 g010

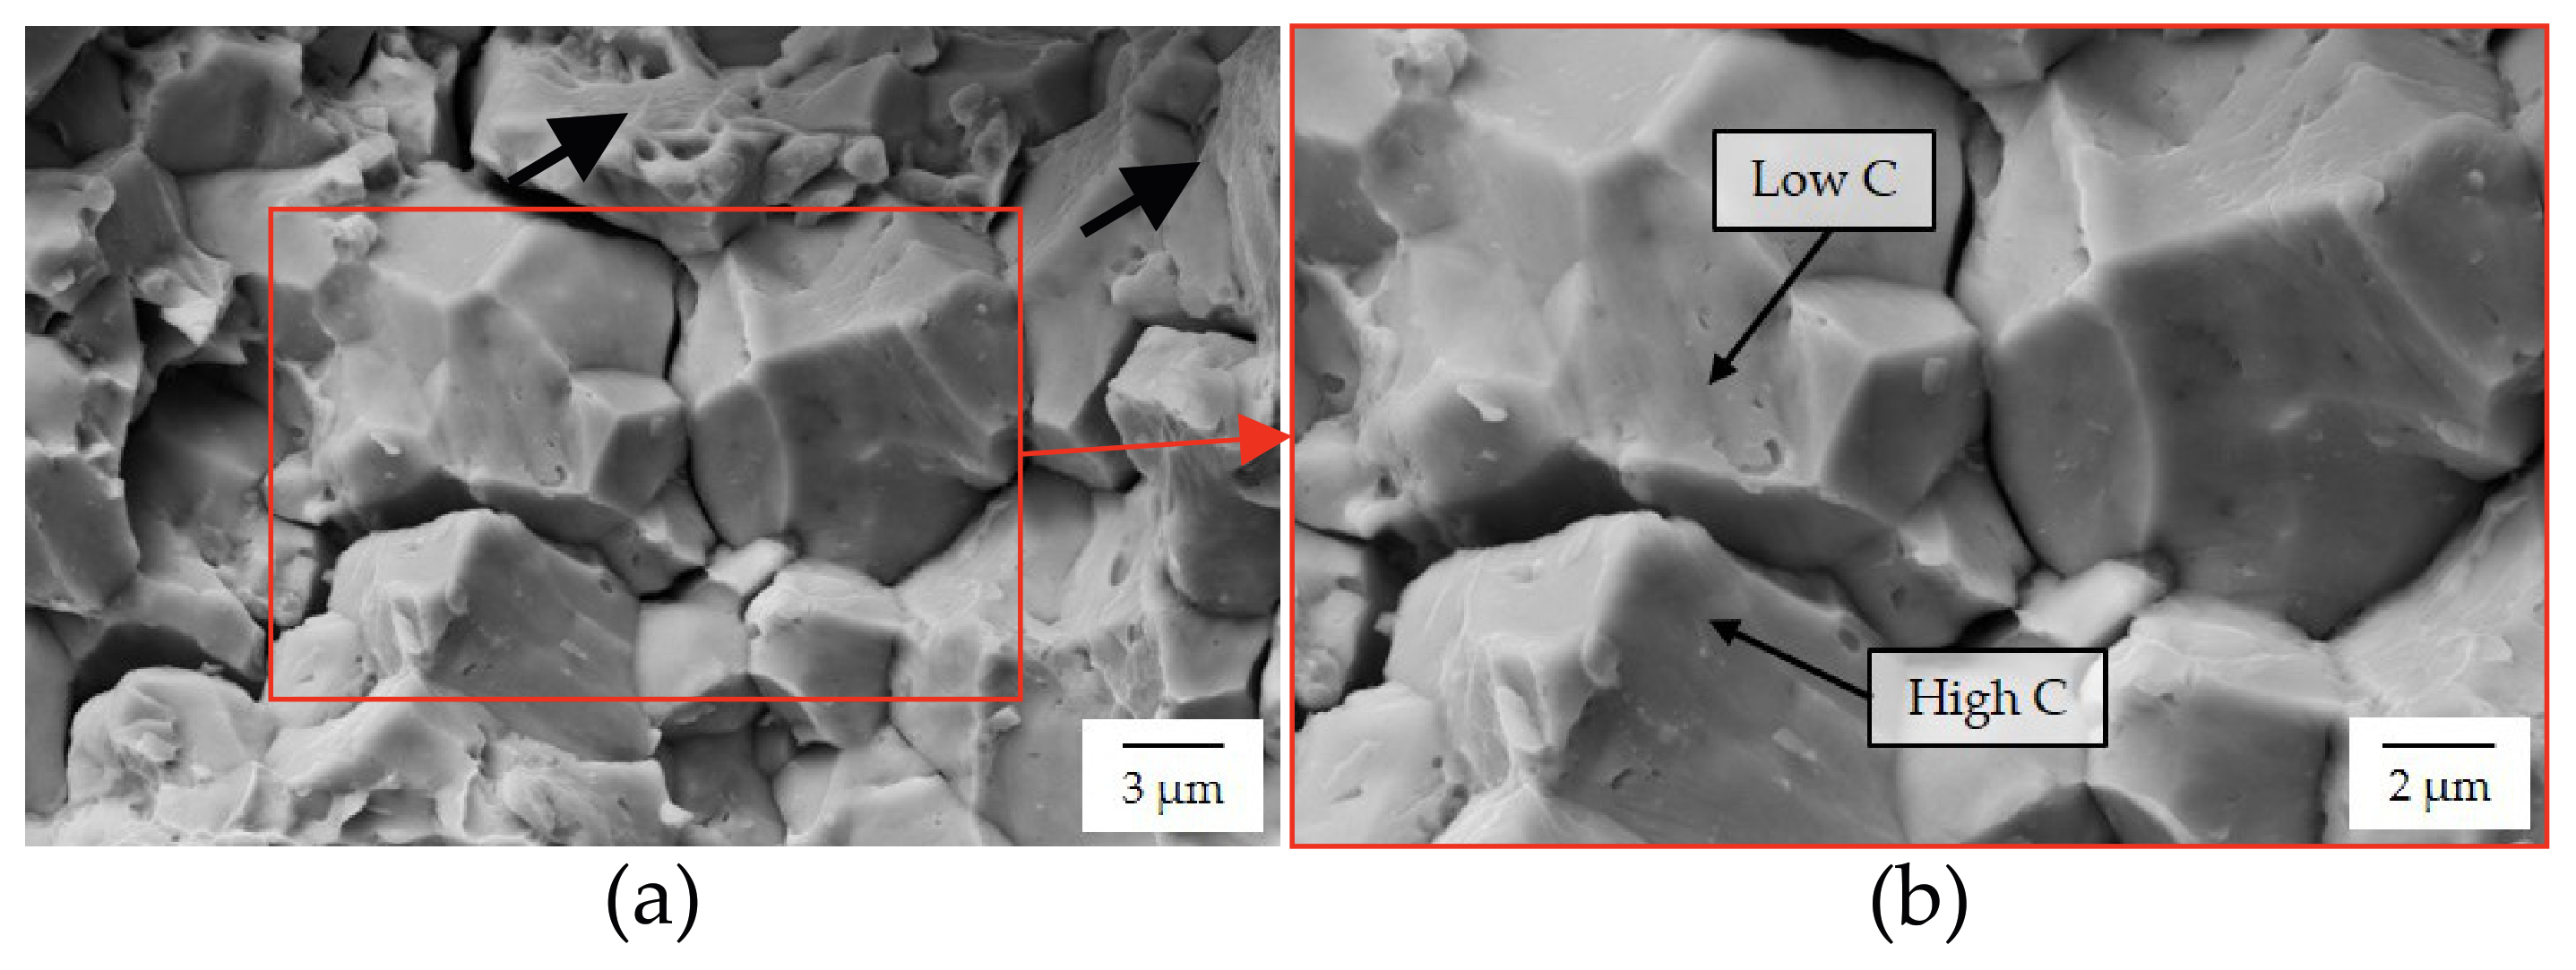
3.2.3. Role of Secondary Martensite on Ductility

Comparing the mechanical properties of QP170_300 to QP130_60 with a similar austenite content in the range of 11–13%, it is worth mentioning that the stable austenite content after final quenching cannot be solely responsible for the good ductility of samples quenched to TQ = 130 °C/150 °C. Another ductility-determining factor is the increasing fraction of secondary martensite, which leads to an increasing probability of crack formation and propagation [39]. While there is no secondary martensite and a total elongation of 19.1% in samples QP130_60, the amount of secondary untempered martensite in samples QP170_300 reaches 37%, and the total elongation decreases to 3.7%.
In Figure 11, the predominantly brittle fracture surface of QP170_300 is shown. Small ductile areas are marked with black arrows (Figure 11a) and can be assigned austenite. Although a quantitative analysis of the C content by EDX measurement is not possible, the qualitative comparison of the C content suggests that the existing cracks perpendicular to the fracture surface might run between primary martensite with relatively low C content and secondary martensite with approximately 2.5 × higher C content (Figure 11b).
In this context, De Knijf et al. [40] detected after Q & P treatment and successive tensile testing deformed areas of primary martensite but no deformation in fresh martensite areas that led to a high stress concentration in its surroundings and hence void formation on primary/secondary martensite interface leading to early fracture of the material, which was also found in the present study (Figure 9a,c). Wang et al. [41] also identified in their studies on Fe-0.3C-2.5Mn-1.5Si-0.8Cr (wt%) micro-cracks, which form due to strain localization in the vicinity of coarse martensite laths and untempered fresh martensite. A homogeneous distribution of austenite islands in the microstructure reduces the localization of the strain and promotes homogeneous plastic deformation even in the martensitic matrix [41]. To minimize secondary martensite fraction and to retain a maximum fraction of austenite, Celada-Casero et al. [42] determined an optimum primary martensite fraction of 77% to ensure complete C partitioning to austenite during partitioning at 400 °C for 50 s, which is in good agreement with the present results shown in Figure 9a,b. Comparing Figure 9, Figure 10, and Table 2, the maximum tolerable secondary martensite amount that still enables good ductility was found to be 20%.
Figure 11. (a) Mainly brittle intergranular fracture surface of QP170_300 tensile test sample containing small ductile areas and cracks; (b) crack running between microstructural areas with relatively low and high C content measured by EDX.
Metals 11 01879 g011

4. Conclusions

An extensive dilatometer study in combination with a microstructure analysis to check the reproducibility of the suggested heat treatments on tensile specimens allowed to define a suitable process window for the Q & P process of Fe-0.3%C-5%Mn-1.5%Si. To predict the phase fraction of primary martensite in dependence of TQ, an adjustment of the K–M equation was suggested for the medium manganese steel.
While the as-quenched condition failed in a brittle way and is therefore less suitable for direct press-hardening application without additional heat treatment, Q & P was used to significantly increase the ductility of the investigated material. However, 12–21% austenite only results in good ductility provided that the formation of secondary martensite is suppressed as far as possible.
High levels of secondary martensite, despite an austenite content of 11%, have a detrimental effect on the mechanical properties and lead to early failure. However, the study identified an amount of up to 20% secondary martensite as uncritical, which extends the optimum TQ from 130 °C to a range of 130–150 °C, providing a wider margin for engineering application.
The influence of the partitioning duration can be considered minor. The good combination of properties can already be achieved after a short partitioning, which is particularly advantageous for throughput in industry. If technical problems result in a longer partitioning time (up to 300 s), the component still exhibits comparable properties and can be used.

Author Contributions

Conceptualization, C.B.; methodology, C.B.; validation, C.B.; formal analysis, C.B.; investigation, C.B.; data curation, C.B.; writing—original draft preparation, C.B.; writing—review and editing, C.B., S.W., and U.K.; visualization, C.B.; supervision, S.W. and U.K.; project administration, S.W.; funding acquisition, U.K. All authors have read and agreed to the published version of the manuscript.

Funding

This research was funded by the Deutsche Forschungsgemeinschaft (DFG, German Research Foundation) under Germany’s Excellence Strategy—EXC-2023 Internet of Production.

Institutional Review Board Statement

Not applicable.

Informed Consent Statement

Not applicable.

Data Availability Statement

The data presented in this study are available on request from the corresponding author.

Acknowledgments

The authors gratefully acknowledge the support of H. Breitbach and M. Schillheim, in mechanical testing and dilatometry experiments. Special thanks are given to R. Emmrich and A. Gramlich for reviewing and for fruitful discussions.

Conflicts of Interest

The authors declare no conflict of interest.

References

  1. Schmitt, J.H.; Iung, T. New developments of advanced high-strength steels for automotive applications. Comptes Rendus Phys. 2018, 19, 641–656. [Google Scholar] [CrossRef]
  2. Bleck, W.; Brühl, F.; Ma, Y.; Sasse, C. Materials and Processes for the Third-generation Advanced High-strength Steels. BHM Berg- Hüttenmännische Monatshefte 2019, 164, 466–474. [Google Scholar] [CrossRef]
  3. Neugebauer, R.; Schieck, F.; Polster, S.; Mosel, A.; Rautenstrauch, A.; Schönherr, J.; Pierschel, N. Press hardening—An innovative and challenging technology. Arch. Civ. Mech. Eng. 2012, 12, 113–118. [Google Scholar] [CrossRef]
  4. Järvinen, H.; Isakov, M.; Nyyssönen, T.; Järvenpää, M.; Peura, P. The effect of initial microstructure on the final properties of press hardened 22MnB5 steels. Mater. Sci. Eng. A 2016, 676, 109–120. [Google Scholar] [CrossRef]
  5. Karbasian, H.; Tekkaya, A.E. A review on hot stamping. J. Mater. Process. Technol. 2010, 210, 2103–2118. [Google Scholar] [CrossRef]
  6. Lenze, F.-J.; Sikora, S. Device and Method for the Forming of Blanks from High and Very High Strength Steels. U.S. Patent US9,068,239 B2, 30 June 2015. [Google Scholar]
  7. Ademaj, A. Method and Device for Producing a Press-Hardened Metal Component. European Patent EP2864506B1, 11 July 2018. [Google Scholar]
  8. Wang, C.; Li, X.; Han, S.; Zhang, L.; Chang, Y.; Cao, W.; Dong, H. Warm Stamping Technology of the Medium Manganese Steel. Steel Res. Int. 2018, 89, 1700360. [Google Scholar] [CrossRef]
  9. Rana, R.; Carson, C.H.; Speer, J. Ductile Ultra High Strength Medium Manganese Steel Produced through Continuous Annealing and Hot Stamping. U.S. Patent Application Publication US2016/0312323 A1, 27 October 2016. [Google Scholar]
  10. Oh, J.-K.; Lee, K.-Y.; Cho, Y.-R.; Choi, E.-Y.; Kim, K.-S. Steel Sheet for Warm Press Forming, Warm Press Formed Parts and Method for Manufacturing Thereof. European Patent Application Publication EP2778247 A1, 17 September 2014. [Google Scholar]
  11. Wang, Z.; Zhang, Y.; Zhu, B.; Wang, Y.; Ding, H.; Cai, M. Hot stamped parts with desirable properties in medium Mn TRIP steels. Procedia Eng. 2017, 207, 699–704. [Google Scholar] [CrossRef]
  12. Wang, Z.; Liu, P.; Xu, Y.; Wang, Y.; Zhang, Y. Hot Stamping of High Strength Steel with Tailored Properties by Two Methods. Procedia Eng. 2014, 81, 1725–1730. [Google Scholar] [CrossRef] [Green Version]
  13. Merklein, M.; Franke, J.M.; Geiger, M.; Schmidt, M. (Eds.) Ein Ansatz zur Herstellung von Pressgehärteten Karosseriekomponenten mit Maßgeschneiderten Mechanischen Eigenschaften: Temperierte Umformwerkzeuge. Prozessfenster, Prozesssimulation und Funktionale Untersuchung; Fertigungstechnik–Erlangen, Meisenbach: Bamberg, Germany, 2012; Volume Bd.226. [Google Scholar]
  14. Merklein, M.; Wieland, M.; Lechner, M.; Bruschi, S.; Ghiotti, A. Hot stamping of boron steel sheets with tailored properties: A review. J. Mater. Process. Technol. 2016, 228, 11–24. [Google Scholar] [CrossRef]
  15. Tong, C.; Rong, Q.; Yardley, V.A.; Li, X.; Luo, J.; Zhu, G.; Shi, Z. New Developments and Future Trends in Low-Temperature Hot Stamping Technologies: A Review. Metals 2020, 1652, 1652. [Google Scholar] [CrossRef]
  16. Meza-García, E.; Rautenstrauch, A.; Bräunig, M.; Kräusel, V.; Landgrebe, D. Energetic evaluation of press hardening processes. Procedia Manuf. 2019, 33, 367–374. [Google Scholar] [CrossRef]
  17. Chang, Y.; Wang, C.Y.; Zhao, K.M.; Dong, H.; Yan, J.W. An introduction to medium-Mn steel: Metallurgy, mechanical properties and warm stamping process. Mater. Des. 2016, 94, 424–432. [Google Scholar] [CrossRef]
  18. Speer, J.; Rana, R.; Matlock, D.; Glover, A.; Thomas, G.; de Moor, E. Processing Variants in Medium-Mn Steels. Metals 2019, 9, 771. [Google Scholar] [CrossRef] [Green Version]
  19. Seo, E.J.; Cho, L.; de Cooman, B.C. Application of Quenching and Partitioning (Q&P) Processing to Press Hardening Steel. Metall. Mater. Trans. A 2014, 45, 4022–4037. [Google Scholar] [CrossRef]
  20. de Cooman, B.C.; Lee, S.J.; Shin, S.; Seo, E.J.; Speer, J.G. Combined Intercritical Annealing and Q&P Processing of Medium Mn Steel. Metall. Mater. Trans. A 2017, 48, 39–45. [Google Scholar] [CrossRef]
  21. de Moor, E.; Speer, J.G.; Matlock, D.K.; Kwak, J.H.; Lee, S.B. Effect of Carbon and Manganese on the Quenching and Partitioning Response of CMnSi Steels. ISIJ Int. 2011, 51, 137–144. [Google Scholar] [CrossRef] [Green Version]
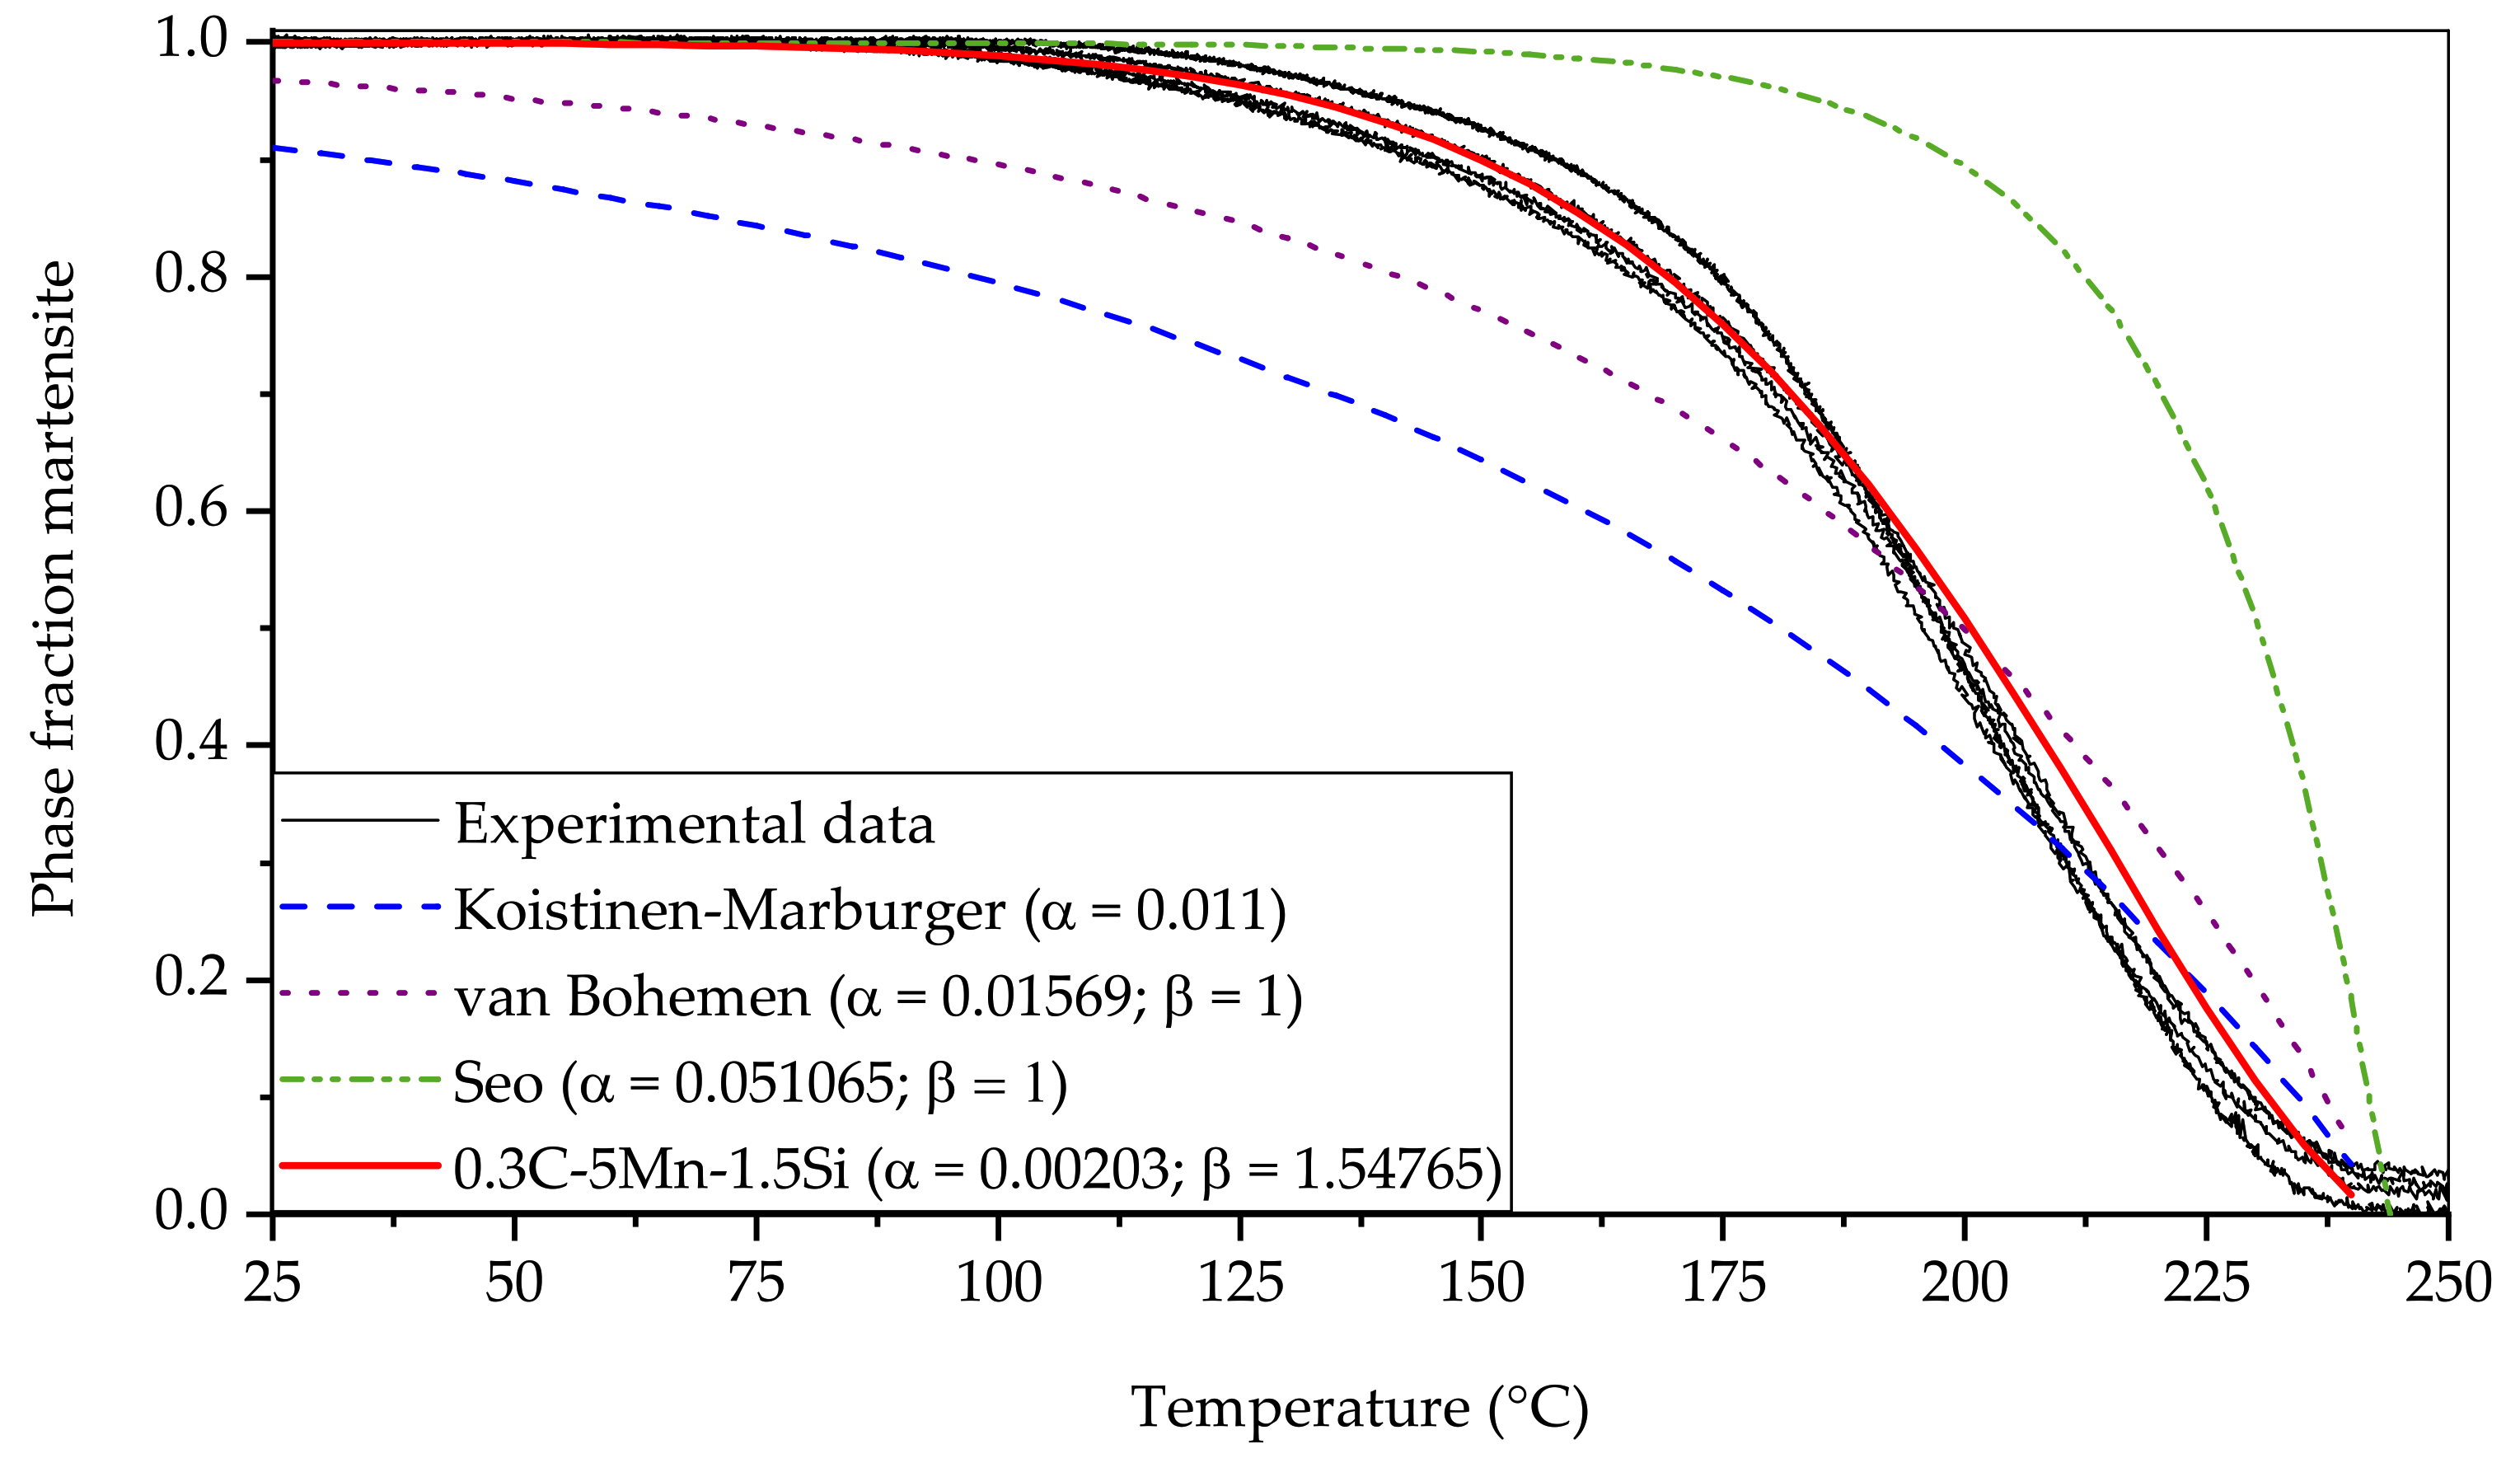
  22. Koistinen, D.P.; Marburger, R.E. A general equation prescribing the extent of the austenite-martensite transformation in pure iron-carbon alloys and plain carbon steels. Acta Metall. 1959, 7, 59–60. [Google Scholar] [CrossRef]
  23. Gramlich, A.; van der Linde, C.; Ackermann, M.; Bleck, W. Effect of aluminum, molybdenum and boron on the phase transformation in 4 wt.-% manganese steels. Results Mater. 2020, 8, 100–147. [Google Scholar]
  24. Sackl, S.; Clemens, H.; Primig, S. Investigation of the Self Tempering Effect of Martensite by Means of Atom Probe Tomography. Pract. Metallogr. 2015, 52, 374–383. [Google Scholar] [CrossRef]
  25. Andrews, K.W. Empirical formulae for calculation of some transformation temperatures. J. Iron Steel Inst. 1965, 203, 721–727. [Google Scholar]
  26. Seo, E.J.; Cho, L.; de Cooman, B.C. Modified Methodology for the Quench Temperature Selection in Quenching and Partitioning (Q&P) Processing of Steels. Metall. Mater. Trans. A 2016, 47, 3797–3802. [Google Scholar] [CrossRef]
  27. van Bohemen, S.; Sietsma, J. Martensite Formation in Partially and Fully Austenitic Plain Carbon Steels. Metall. Mater. Trans. A 2009, 40, 1059–1068. [Google Scholar] [CrossRef] [Green Version]
  28. Xiao, L.; Fan, Z.; Jinxu, Z.; Mingxing, Z.; Mokuang, Z.; Zhenqi, G. Lattice-parameter variation with carbon content of martensite. I. X-ray-diffraction experimental study. Phys. Rev. B Condens. Matter 1995, 52, 9970–9978. [Google Scholar] [CrossRef]
  29. Nasim, M.; Edwards, B.C.; Wilson, E.A. A study of grain boundary embrittlement in an Fe–8%Mn alloy. Mater. Sci. Eng. A 2000, 281, 56–67. [Google Scholar] [CrossRef]
  30. Han, J.; Da Silva, A.K.; Ponge, D.; Raabe, D.; Lee, S.M.; Lee, Y.K.; Lee, S.I.; Hwang, B. The effects of prior austenite grain boundaries and microstructural morphology on the impact toughness of intercritically annealed medium Mn steel. Acta Mater. 2017, 122, 199–206. [Google Scholar] [CrossRef]
  31. Kuzmina, M.; Ponge, D.; Raabe, D. Grain boundary segregation engineering and austenite reversion turn embrittlement into toughness: Example of a 9 wt.% medium Mn steel. Acta Mater. 2015, 86, 182–192. [Google Scholar] [CrossRef]
  32. Speer, J.; Matlock, D.K.; de Cooman, B.C.; Schroth, J.G. Carbon partitioning into austenite after martensite transformation. Acta Mater. 2003, 51, 2611–2622. [Google Scholar] [CrossRef]
  33. Toji, Y.; Matsuda, H.; Herbig, M.; Choi, P.P.; Raabe, D. Atomic-scale analysis of carbon partitioning between martensite and austenite by atom probe tomography and correlative transmission electron microscopy. Acta Mater. 2014, 65, 215–228. [Google Scholar] [CrossRef]
  34. Santofimia, M.J.; Zhao, L.; Petrov, R.; Kwakernaak, C.; Sloof, W.G.; Sietsma, J. Microstructural development during the quenching and partitioning process in a newly designed low-carbon steel. Acta Mater. 2011, 59, 6059–6068. [Google Scholar] [CrossRef]
  35. Santofimia, M.J.; Petrov, R.H.; Zhao, L.; Sietsma, J. Microstructural analysis of martensite constituents in quenching and partitioning steels. Mater. Charact. 2014, 92, 91–95. [Google Scholar] [CrossRef]
  36. Qi, X.; Du, L.; Hu, J.; Misra, R.D.K. Effect of austenite stability on toughness, ductility, and work-hardening of medium-Mn steel. Mater. Sci. Technol. 2019, 35, 2134–2142. [Google Scholar] [CrossRef]
  37. Paravicini Bagliani, E.; Santofimia, M.J.; Zhao, L.; Sietsma, J.; Anelli, E. Microstructure, tensile and toughness properties after quenching and partitioning treatments of a medium-carbon steel. Mater. Sci. Eng. A 2013, 559, 486–495. [Google Scholar] [CrossRef]
  38. Arlazarov, A.; Bouaziz, O.; Masse, J.P.; Kegel, F. Characterization and modeling of mechanical behavior of quenching and partitioning steels. Mater. Sci. Eng. A 2015, 620, 293–300. [Google Scholar] [CrossRef]
  39. HajyAkbary, F.; Sietsma, J.; Petrov, R.H.; Miyamoto, G.; Furuhara, T.; Santofimia, M.J. A quantitative investigation of the effect of Mn segregation on microstructural properties of quenching and partitioning steels. Scr. Mater. 2017, 137, 27–30. [Google Scholar] [CrossRef]
  40. de Knijf, D.; Petrov, R.; Föjer, C.; Kestens, L.A. Effect of fresh martensite on the stability of retained austenite in quenching and partitioning steel. Mater. Sci. Eng. A 2014, 615, 107–115. [Google Scholar] [CrossRef]
  41. Wang, M.M.; Hell, J.C.; Tasan, C.C. Martensite size effects on damage in quenching and partitioning steels. Scr. Mater. 2017, 138, 1–5. [Google Scholar] [CrossRef]
  42. Celada-Casero, C.; Kwakernaak, C.; Sietsma, J.; Santofimia, M.J. The influence of the austenite grain size on the microstructural development during quenching and partitioning processing of a low-carbon steel. Mater. Des. 2019, 178, 107847. [Google Scholar] [CrossRef]
Figure 1. Schematic description of the Q & P process and the microstructural evolution during the heat treatment.
Metals 11 01879 g001
Figure 2. Schematic temperature–time diagram of the quenching and partitioning experiments for first (varying TQ and tP = 60 s) and second experimental series (TQ = 150/170 °C and varying tP).
Metals 11 01879 g002
Figure 9. (a) Resulting final phase fractions in dependence of TQ; (b) resulting stress–strain curves and representative fracture surface for investigated QP130_60 and QP150_60; and (c) resulting stress–strain curves and representative fracture surface for investigated QP170_60 and QP190_60.
Metals 11 01879 g009
Table 1. Chemical composition (in wt.%) of the studied medium manganese steel.
FeCMnSiAlCrPSN
bal.0.304.991.550.0040.040.0050.0030.004
Table 2. Mechanical properties in dependence of tp for TQ = 150 °C and 170 °C.
TQ (°C)tP (s)Rp0.2 (MPa)Rm (MPa)Ag (%)Ax (%)
15060923163413.016.3
180950164815.318.8
300946164015.018.8
1706091215153.83.8
18089215085.05.0
30087814713.73.7
Publisher’s Note: MDPI stays neutral with regard to jurisdictional claims in published maps and institutional affiliations.

