
Characterization of Synthetic Non-Metallic Inclusions Consisting of TiN, Ti2O3, and Oxides of Al2O3 and MgO·Al2O3 Spinel Using Raman Spectroscopy


Abstract
:1. Introduction
2. Materials and Methods
2.1. Raman Spectroscopy
2.2. Calibration Model
3. Results
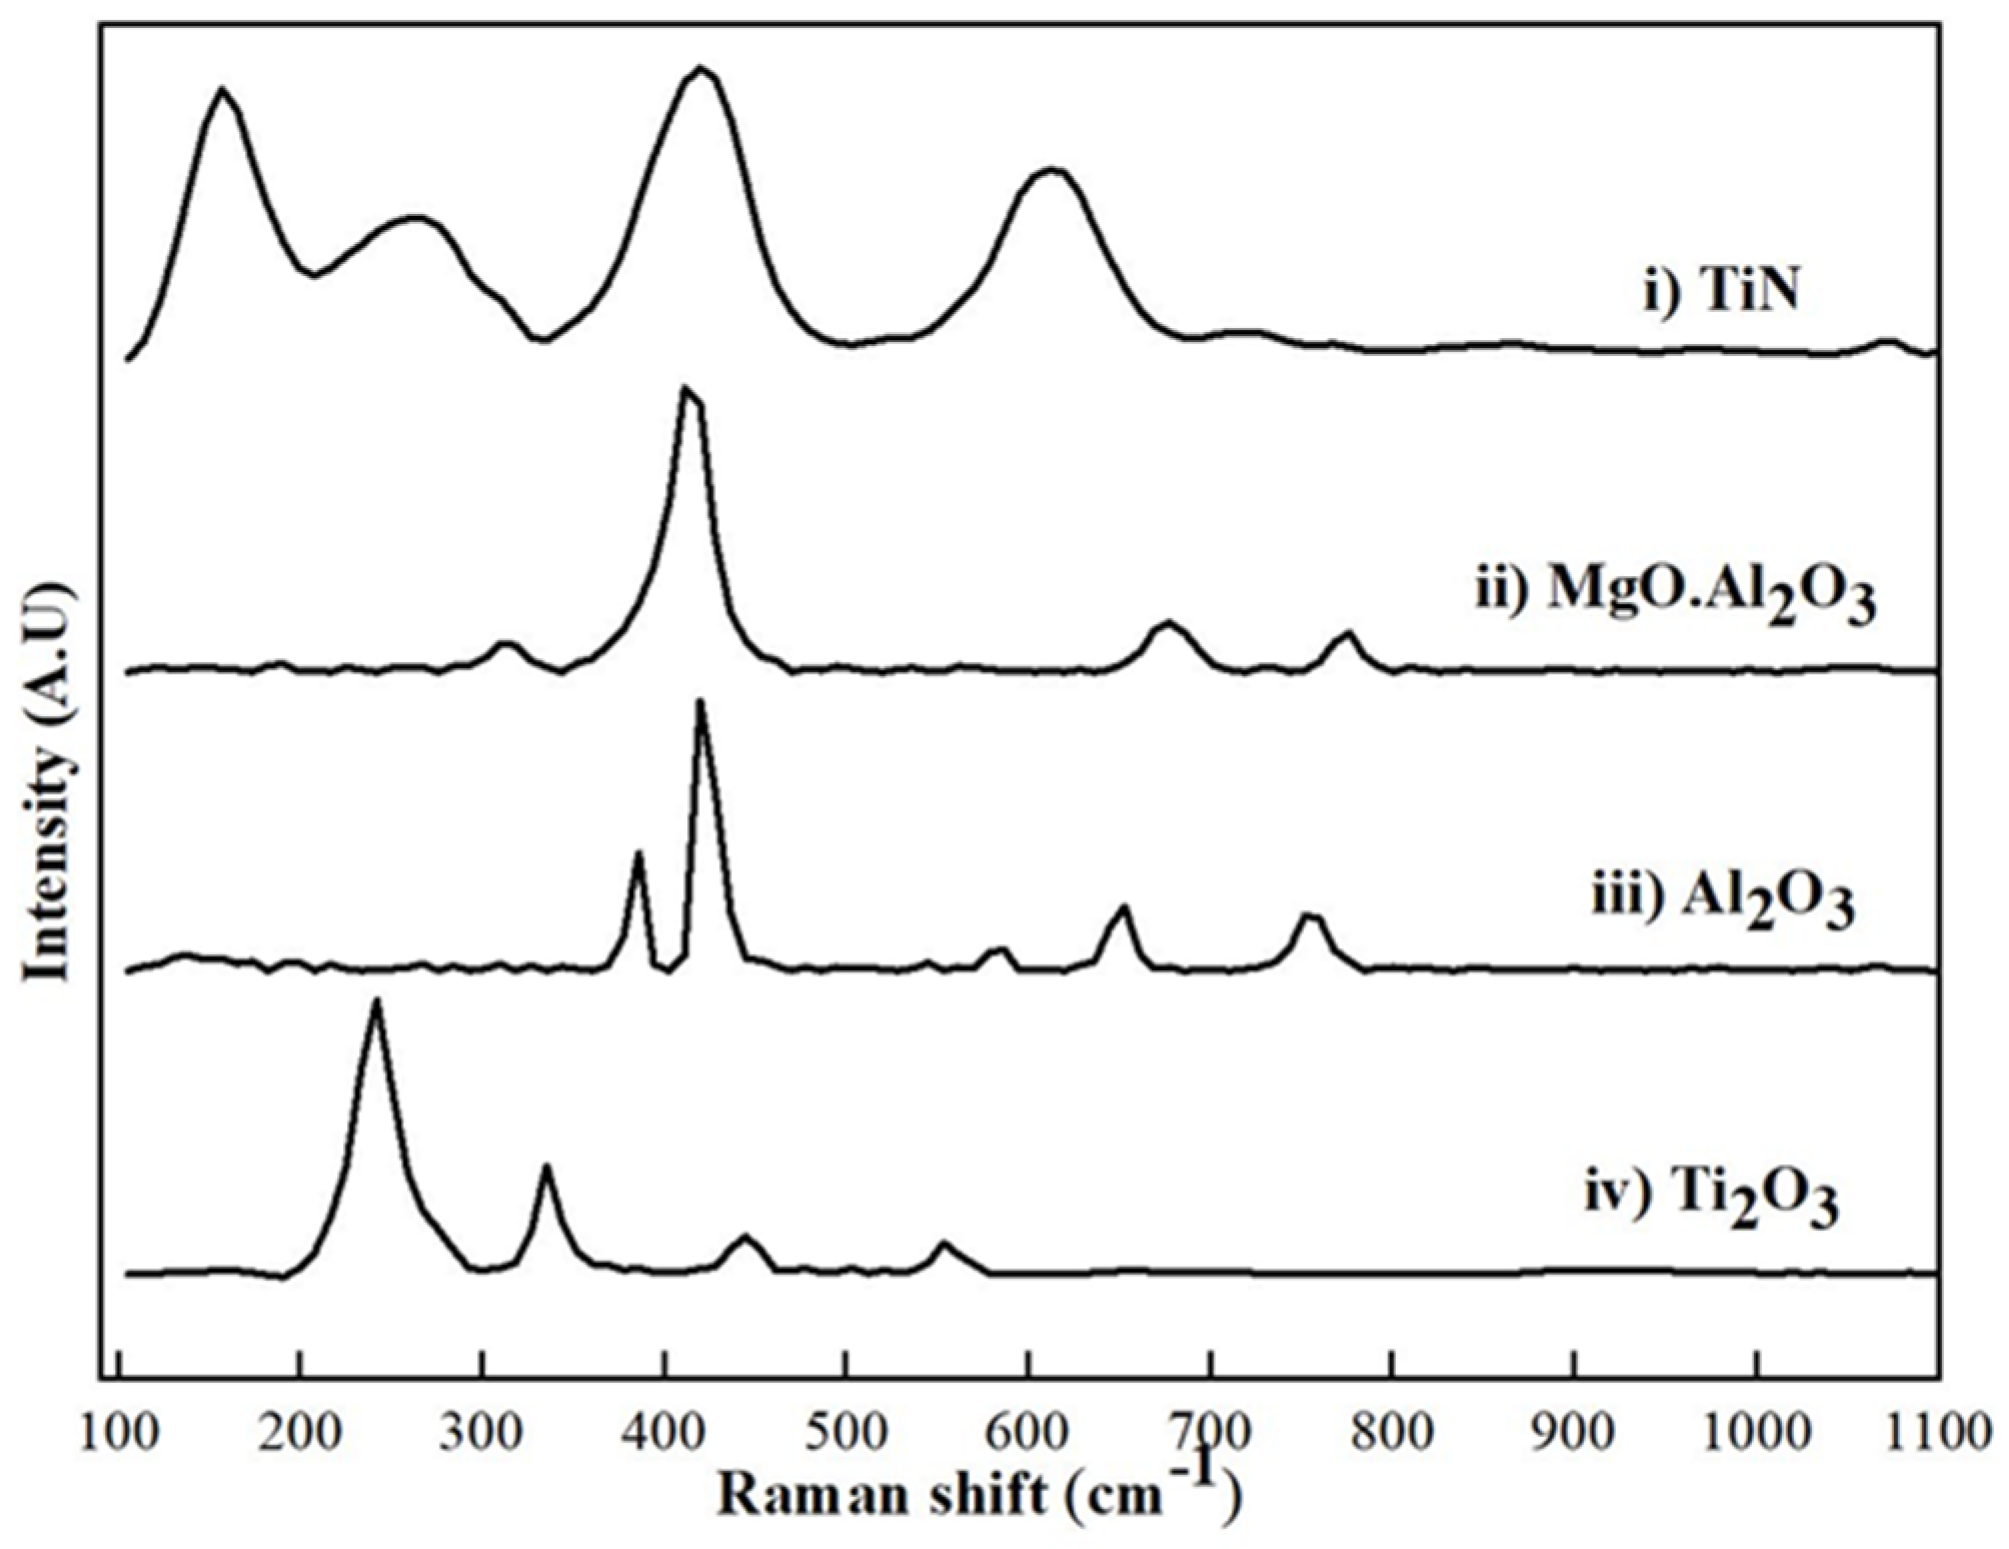
3.1. Raman Spectra Analysis Based on Phase Content
3.2. Qualitative Analysis of Phase Content Based on Raman Spectra
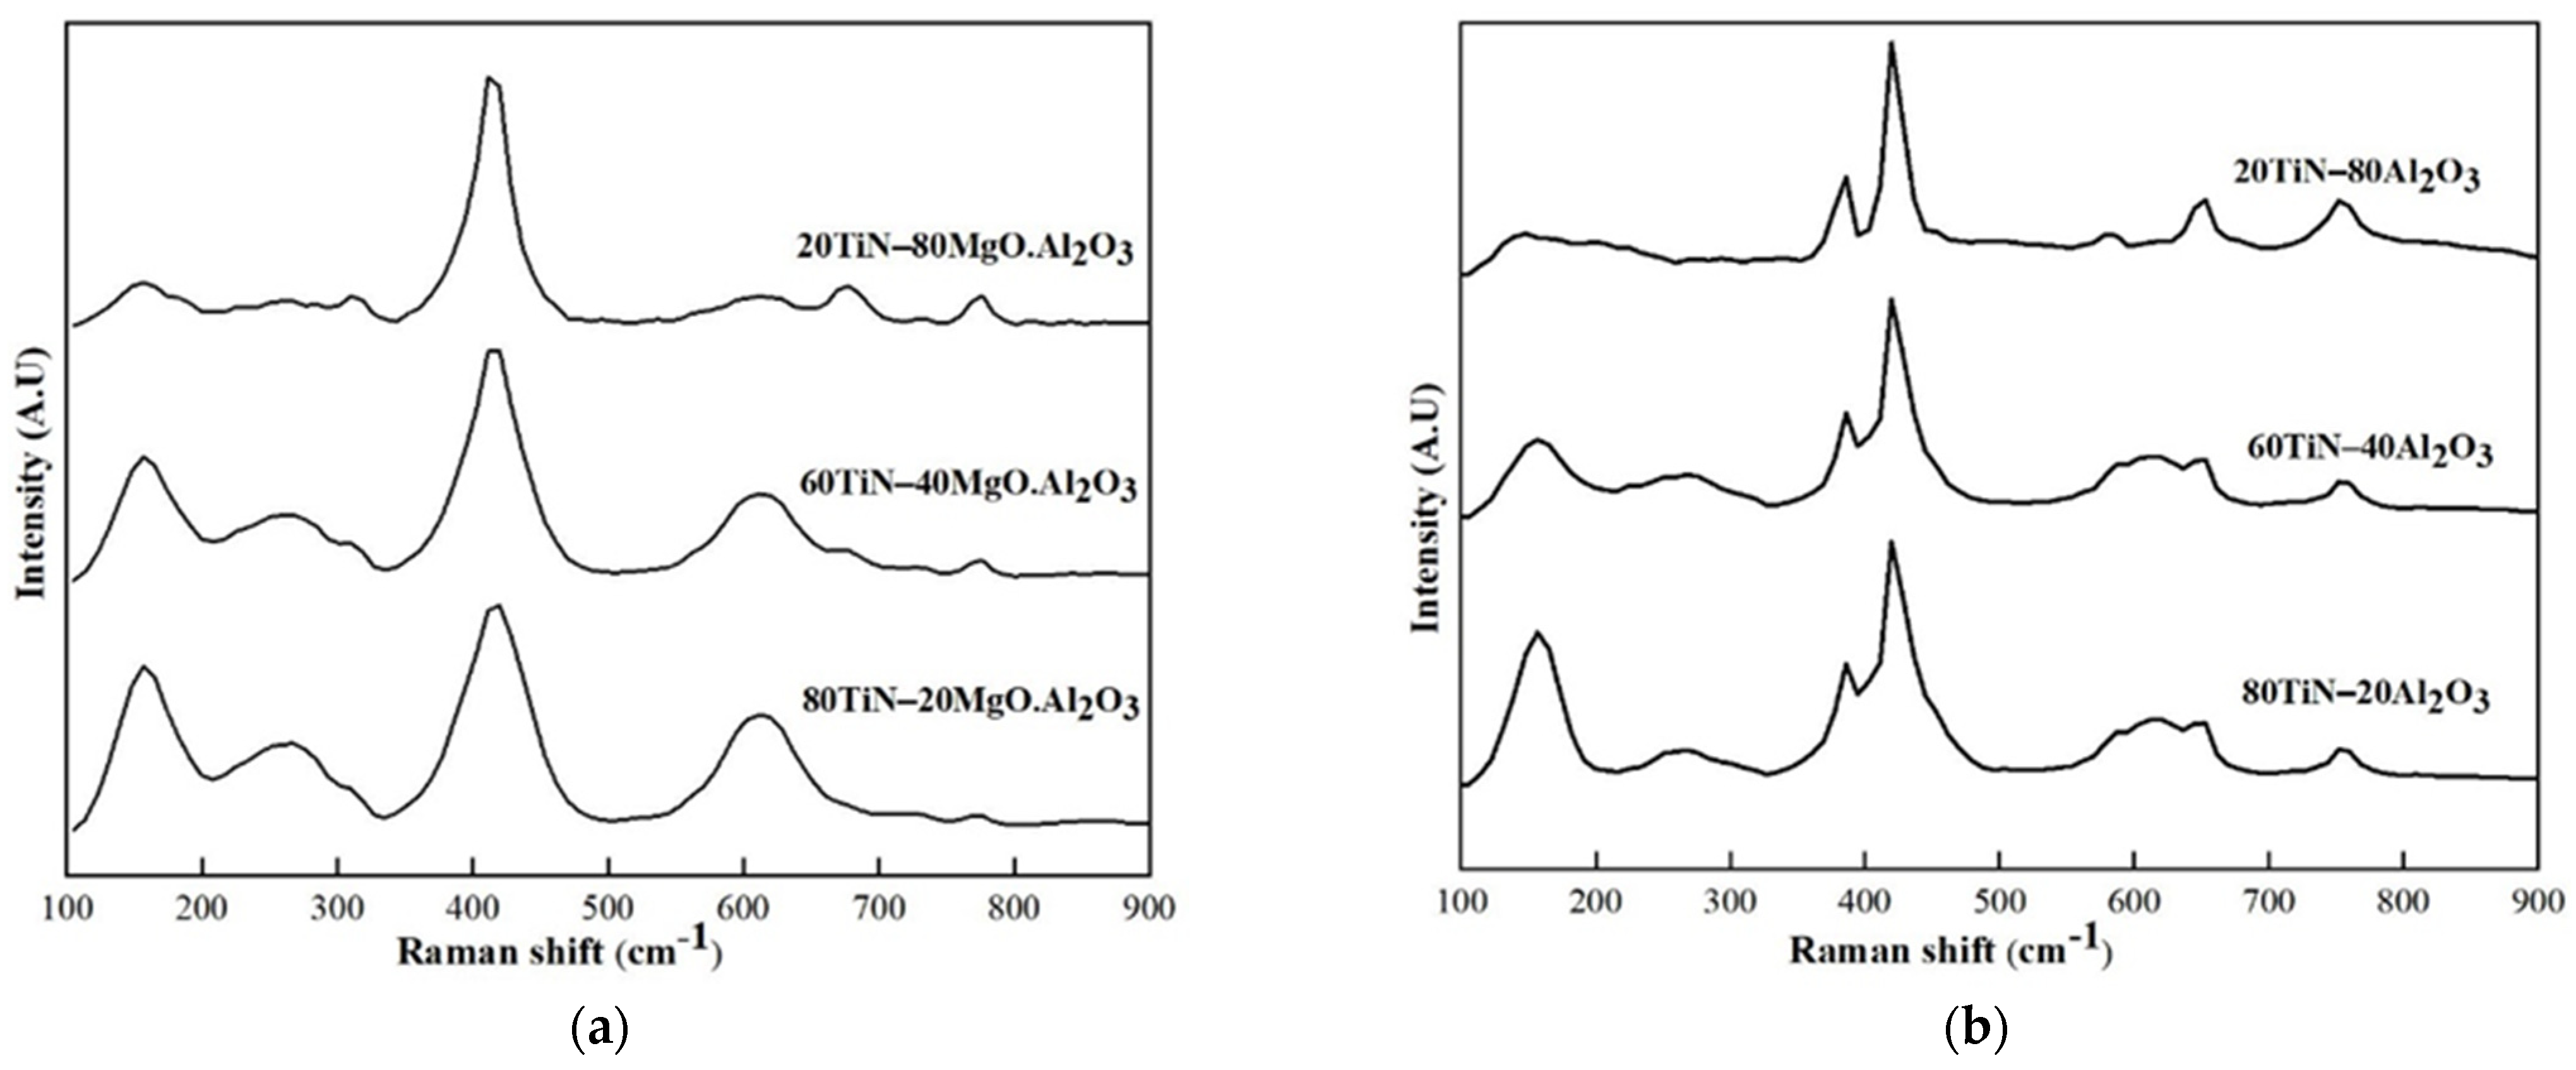
3.2.1. TiN–Al2O3 and TiN– MgO·Al2O3 (MA)
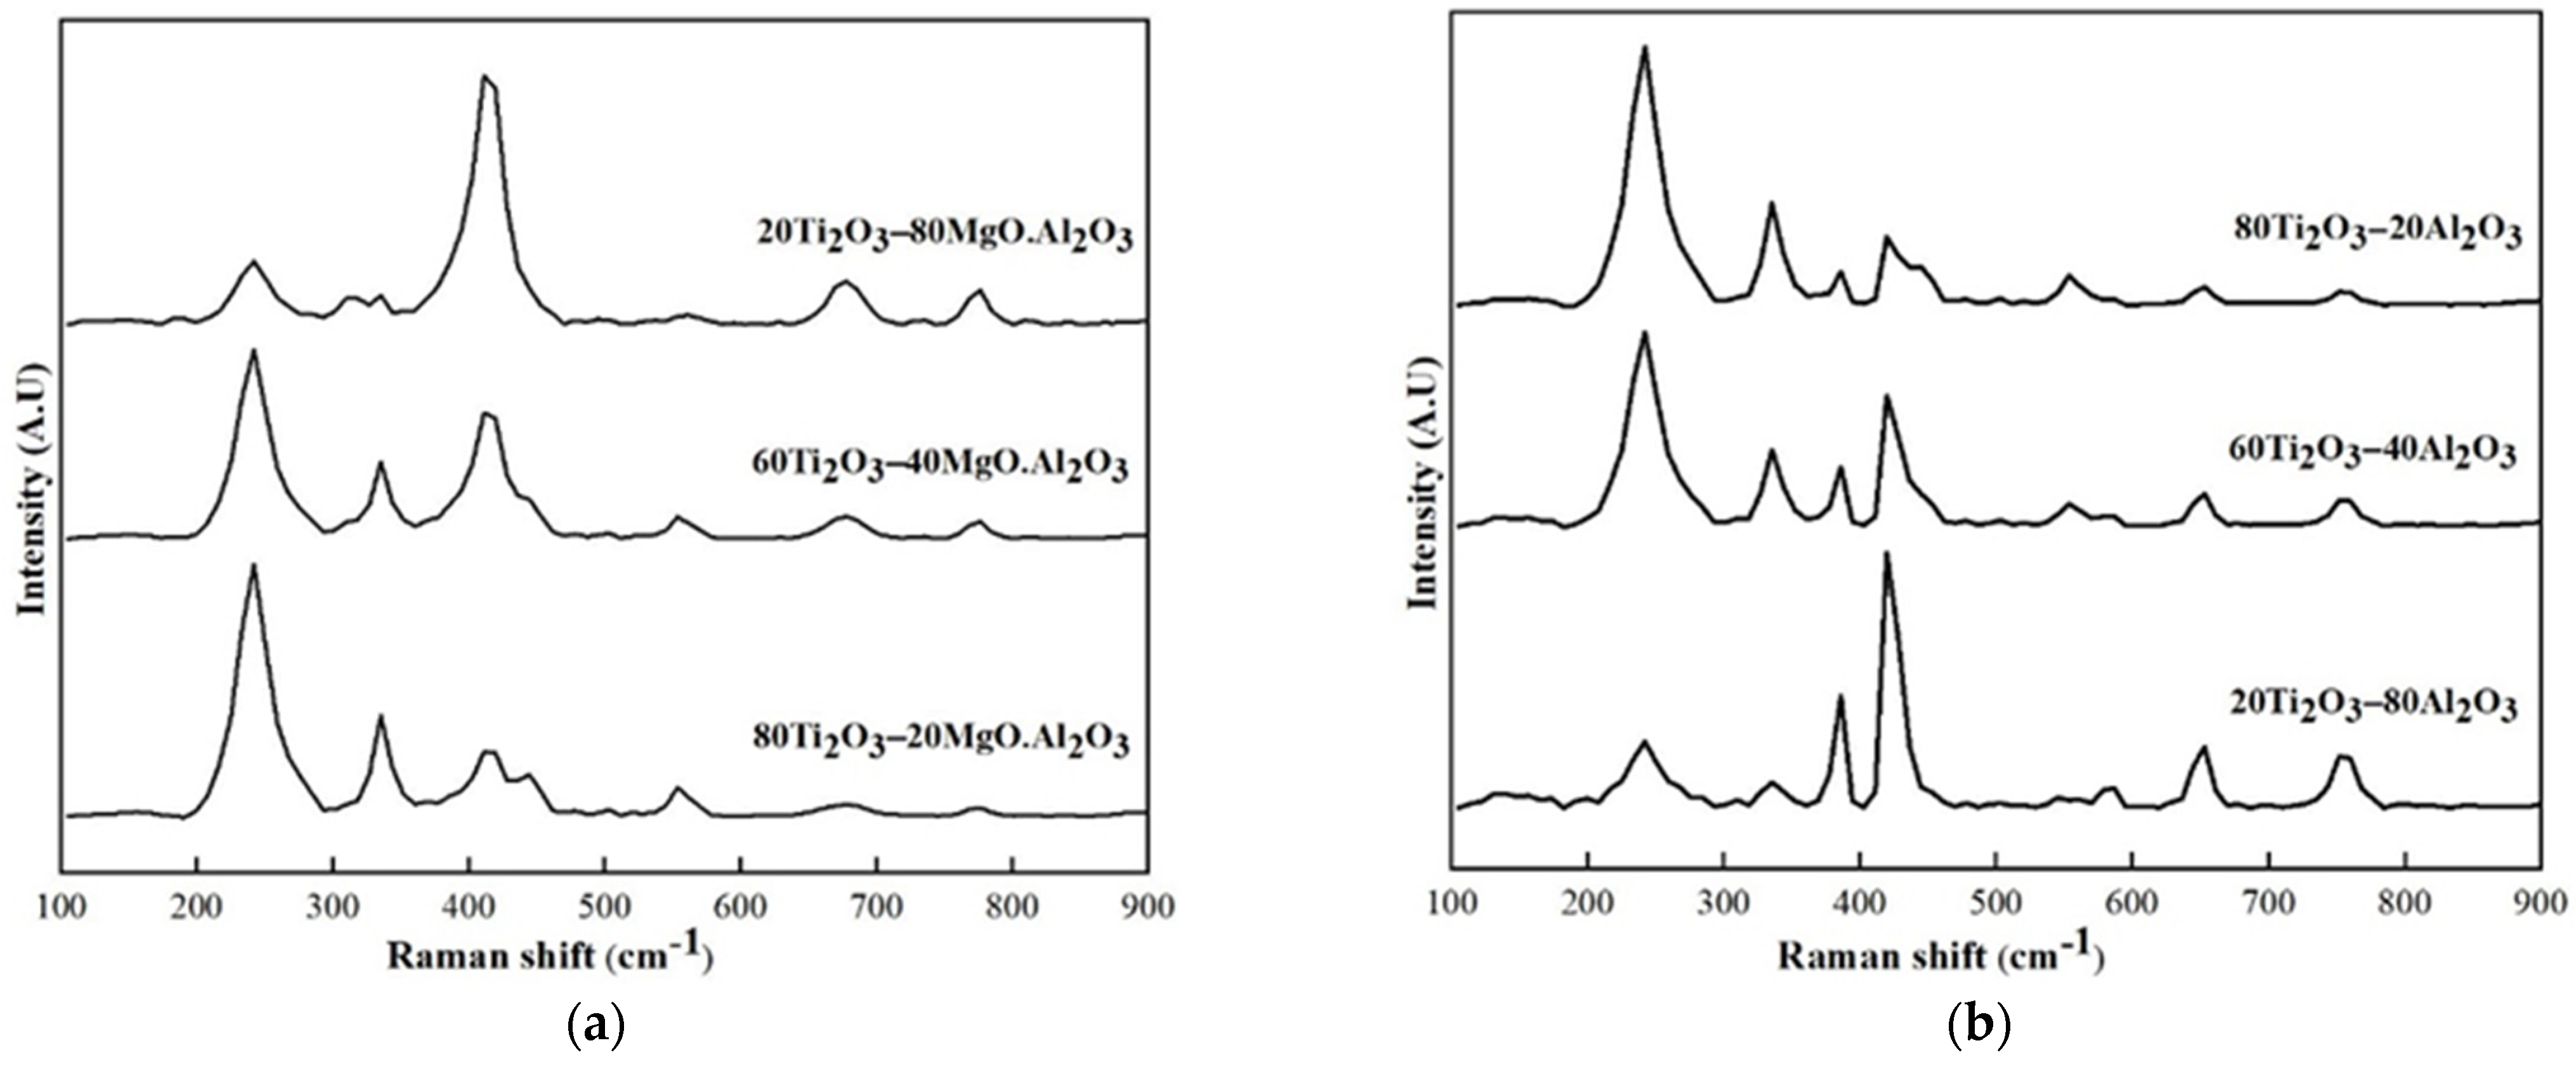
3.2.2. Ti2O3–Al2O3, Ti2O3–MgO·Al2O3 (MA)
3.3. Quantitative Estimation of the Phase Fractions in the Samples
3.4. Further Phase Estimation Assessment
4. Discussion
4.1. Observation of Specific Raman Peaks Relative to the Change in Phase Content
4.2. Further Phase Identification Evaluation
4.3. Potential Limitations in the Measurements and Prospect for Future Application
5. Conclusions
- The most suitable Raman peaks (bands) identified for estimating the phases content present in the samples were:
- For Ti2O3–MA and Ti2O3–Al2O3 samples: at 247 cm−1 for Ti2O3, at 416 and 773 cm−1 for MgO·Al2O3, and 383, 422, and 760 cm−1 for Al2O3.
- For TiN–Al2O3 and TiN–MA samples: Raman peaks at 157 cm−1 for TiN, at 773 cm−1 for MgO·Al2O3, and 383 cm−1 for Al2O3.
- The Raman spectra data pre-processed by using the SNV had improved statistical performance, such as R2, RMSECV, and RMSEP, in the evaluation of the phase contents compared to the analysis made using the raw Raman spectra data.
- This work and previous studies combined present the prospect of using Raman spectroscopy to characterize a complex multiphase system that may contain oxide- and nitride-based inclusions in steel samples.
Author Contributions
Funding
Institutional Review Board Statement
Informed Consent Statement
Data Availability Statement
Acknowledgments
Conflicts of Interest
References
- Khare, S. Approximations in using solubility products for B, N, Ti and Al. Mater. Sci. Technol. 2011, 27, 1863–1868. [Google Scholar] [CrossRef]
- Nagao, N. Strengthening and Toughening of Hot-direct-rolled Steels by Addition of a Small Amount of Titanium. ISIJ Int. 1989, 29, 940–946. [Google Scholar]
- Baker, T.N. Titanium Microalloyed Steels. Ironmak. Steelmak. 2019, 46, 1–55. [Google Scholar] [CrossRef]
- Burja, J.; Koležnik, M.; Župerl, S.; Klančnik, G. Nitrogen and Nitride Non-metallic Inclusions in Steel. Mater. Tehnol. 2019, 53, 919–928. [Google Scholar] [CrossRef]
- Zhu, Y.; Lu, Y.-M.; Huang, C.-W.; Liang, Y.-L. The Effect of TiN Inclusions on the Fracture Mechanism of 20CrMnTi Steel with lath Martensite. Mater. Res. Express 2020, 7, 36509. [Google Scholar] [CrossRef]
- Yan, W.; Shan, Y.Y.; Yang, K. Influence of TiN Inclusions on the Cleavage Fracture Behavior of Low-Carbon Microalloyed Steels. Metall. Mater. Trans. A 2007, 38, 1211–1222. [Google Scholar] [CrossRef]
- Yang, L.; Cheng, G.-G.; Li, S.-J.; Zhao, M.; Feng, G.-P. Characteristics of MgAl2O4-TiN Complex Inclusion Precipitation and Growth during Solidification of GCr15SiMn in ESR Process. ISIJ Int. 2015, 55, 1693–1698. [Google Scholar] [CrossRef] [Green Version]
- Wang, R.; Bao, Y.-P.; Yan, Z.-J.; Li, D.-Z.; Kang, Y. Comparison Between the Surface Defects Caused by Al2O3 and TiN Inclusions in Interstitial-free Steel Auto Sheets. Int. J. Miner. Metall. Mater. 2019, 26, 178–185. [Google Scholar] [CrossRef]
- Zhang, L.; Thomas, B.G. State of the Art in Evaluation and Control of Steel Cleanliness. ISIJ Int. 2003, 43, 271–291. [Google Scholar] [CrossRef] [Green Version]
- Gyakwaa, F.; Aula, M.; Alatarvas, T.; Vuolio, T.; Shu, Q.; Huttula, M.; Fabritius, T. Characterisation of Binary Phase Mixtures of Magnesium-Aluminate Spinel and Calcium-Aluminates Using Time-Gated Raman Spectroscopy. ISIJ Int. 2020, 60, 988–997. [Google Scholar] [CrossRef] [Green Version]
- Li, S.; Hihara, L.H. Identification of Inclusions in Carbon Steels using Micro-Raman Spectroscopy. J. Raman Spectrosc. 2017, 48, 137–142. [Google Scholar] [CrossRef]
- Matsuura, H.; Wang, C.; Wen, G.; Sridhar, S. The Transient Stages of Inclusion Evolution During Al and/or Ti Additions to Molten Iron. ISIJ Int. 2007, 47, 1265. [Google Scholar] [CrossRef] [Green Version]
- Pan, C.; Hu, X.J.; Zheng, J.C.; Lin, P.; Chou, K.C. Effect of Calcium Content on Inclusions during the Ladle Furnace Refining Process of AISI 321 Stainless Steel. Int. J. Miner. Metall Mater. 2020, 27, 1499–1507. [Google Scholar] [CrossRef]
- Michelic, S.K.; Bernhard, C. Experimental Study on the Behavior of TiN and Ti2O3 Inclusions in Contact with CaO-Al2O3-SiO2-MgO Slags. Scanning 2017, 2017, 2326750. [Google Scholar] [CrossRef] [Green Version]
- Qi, J.-H.; Xue, Z.-L.; Wu, J.; Cheng, C.-G.; Gao, Y.-M. Ti-Deoxidized Products and Formation Mechanism of Intragranular Ferrite in High Grade Pipeline Steels. J. Iron Steel Res. Int. 2010, 17, 63–67. [Google Scholar] [CrossRef]
- Barshilia, H.C.; Rajam, K.S. Raman spectroscopy studies on the thermal stability of TiN, CrN, TiAlN coatings and nanolayered TiN/CrN, TiAlN/CrN multilayer coatings. J. Mater. Res. 2004, 19, 3196–3205. [Google Scholar] [CrossRef]
- Bradley, M. Lineshapes in IR and Raman Spectroscopy: A Primer. Spectroscopy 2015, 30, 42–46. [Google Scholar]
- Asadena, P.; Alifornia, C. Quantitative Analysis Using Raman Spectrometry. Appl. Spectrosc. 2003, 57, 20A–42A. [Google Scholar]
- Barnes, R.J.; Dhanoa, M.S.; Lister, S.J. Standard Normal Variate Transformation and De-trending of Near-infrared Diffuse Reflectance Spectra. Appl. Spectrosc. 1989, 43, 772–777. [Google Scholar] [CrossRef]
- Gyakwaa, F.; Aula, M.; Alatarvas, T.; Shu, Q.; Huttula, M.; Fabritius, T. Quantification of Synthetic Nonmetallic Inclusion Multiphase Mixtures from a CaO–Al2O3–MgO–CaS System Using Raman Spectroscopy. Steel Res. Int. 2021, 92, 2000322. [Google Scholar] [CrossRef]
- De Almeida, M.R.; Correa, D.N.; Rocha, W.F.C.; Scafi, F.J.O.; Poppi, R.J. Discrimination Between Authentic and Counterfeit Banknotes using Raman Spectroscopy and PLS-DA with Uncertainty Estimation. Microchem. J. 2013, 109, 170–177. [Google Scholar] [CrossRef]
- Kachrimanis, K.; Braun, D.E.; Griesser, U.J. Quantitative Analysis of Paracetamol Polymorphs in Powder Mixtures by FT-Raman Spectroscopy and PLS Regression. J. Pharm. Biomed. Anal. 2007, 43, 407–412. [Google Scholar] [CrossRef] [PubMed]
- Cheng, P.; Ye, T.; Zeng, H.; Ding, J. Raman Spectra Investigation on the Pressure-induced Phase Transition in Titanium Nitride (TiN). AIP Adv. 2020, 10, 45110. [Google Scholar] [CrossRef]
- Misra, A.; Bist, H.D.; Navati, M.S.; Thareja, R.K.; Narayan, J. Thin Film of Aluminum Oxide Through Pulsed Laser Deposition: A Micro-Raman Study. Mater. Sci. Eng. 2001, 79, 49–54. [Google Scholar] [CrossRef]
- Dash, S.; Sahoo, R.K.; Das, A.; Bajpai, S.; Debasish, D.; Singh, S.K. Synthesis of MgAl2O4 Spinel by Thermal Plasma and its Synergetic Structural Study. J. Alloys Compd. 2017, 726, 1186–1194. [Google Scholar] [CrossRef]
- Chen, Y.; Mao, J. Sol-gel Preparation and Characterization of Black Titanium Oxides Ti2O3 and Ti3O5. J. Mater. Sci. Mater. Electron. 2014, 25, 1284–1288. [Google Scholar] [CrossRef]
- Lipiäinen, T.; Pessi, J.; Movahedi, P.; Koivistoinen, J.; Kurki, L.; Tenhunen, M.; Yliruusi, J.; Juppo, A.M.; Heikkonen, J.; Pahikkala, T.; et al. Time-Gated Raman Spectroscopy for Quantitative Determination of Solid-State Forms of Fluorescent Pharmaceuticals. Anal. Chem. 2018, 90, 4832–4839. [Google Scholar] [CrossRef] [PubMed] [Green Version]
- Ren, Y.; Zhang, L.; Yang, W.; Duan, H. Formation and Thermodynamics of Mg-Al-Ti-O Complex Inclusions in Mg-Al-Ti-Deoxidized Steel. Metall. Mater. Trans. B 2014, 45, 2057–2071. [Google Scholar] [CrossRef]
- Zheng, D.; Li, J.; Shi, C.; Zhang, J.; Geng, R. Evolution of TiN and Oxide Inclusions in Ti-containing Fe-25Ni-15Cr Alloy during Electroslag Remelting. ISIJ Int. 2020, 60, 1577–1585. [Google Scholar] [CrossRef] [Green Version]
- Byun, J.-S.; Shim, J.-H.; Cho, Y.W.; Lee, D.N. Non-metallic inclusion and intragranular nucleation of ferrite in Ti-killed C–Mn steel. Acta Mater. 2003, 51, 1593–1606. [Google Scholar] [CrossRef]
- Imashuku, S.; Wagatsuma, K. Rapid Identification of Calcium Aluminate Inclusions in Steels Using Cathodoluminescence Analysis. Metall. Mater. Trans. B 2018, 49, 2868–2874. [Google Scholar] [CrossRef]
- Kontoyannis, C.G.; Bouropoulos, N.C.; Koutsoukos, P.G. Raman spectroscopy: A tool for the quantitative analysis of mineral components of solid mixtures. The case of calcium oxalate monohydrate and hydroxyapatite. Vib. Spectrosc. 1997, 15, 53–60. [Google Scholar] [CrossRef]


| Initial Phase Composition (wt%) | Phases Calculated Based on XRF Analysis (wt%) | Initial Phase Composition (wt%) | Phases Calculated Based on XRF Analysis (wt%) | ||||
|---|---|---|---|---|---|---|---|
| Ti2O3 | Al2O3 | Ti2O3 | Al2O3 | MgO·Al2O3 | Ti2O3 | MgO·Al2O3 | Ti2O3 |
| 90 | 10 | 90.3 | 9.7 | 10 | 90 | 9.0 | 91.0 |
| 80 | 20 | 81.6 | 18.4 | 20 | 80 | 18.0 | 82.0 |
| 70 | 30 | 74.5 | 25.5 | 30 | 70 | 32.1 | 67.9 |
| 60 | 40 | 58.0 | 42.0 | 40 | 60 | 39.0 | 61.0 |
| 55 | 45 | 52.0 | 48.0 | 45 | 55 | 47.5 | 52.5 |
| 50 | 50 | 48.5 | 51.5 | 50 | 50 | 51.0 | 49.0 |
| 40 | 60 | 35.9 | 64.1 | 60 | 40 | 73.7 | 26.3 |
| 30 | 70 | 28.0 | 72.0 | 70 | 30 | 65.5 | 34.5 |
| 20 | 80 | 21.0 | 79.0 | 80 | 20 | 82.3 | 17.7 |
| 10 | 90 | 7.0 | 93.0 | 90 | 10 | 91.0 | 9.0 |
| Initial Phase Composition (wt%) | Phases Calculated Based on XRF Analysis (wt%) | Initial Phase Composition (wt%) | Phases Calculated Based on XRF Analysis (wt%) | ||||
|---|---|---|---|---|---|---|---|
| TiN | Al2O3 | TiN | Al2O3 | MgO·Al2O3 | TiN | MgO·Al2O3 | TiN |
| 10 | 90 | 9.0 | 91.0 | 10 | 90 | 8.0 | 92.0 |
| 20 | 80 | 16.0 | 84.0 | 20 | 80 | 22.0 | 78.0 |
| 30 | 70 | 28.8 | 71.2 | 30 | 70 | 28.8 | 71.2 |
| 40 | 60 | 36.8 | 63.2 | 40 | 60 | 36.8 | 63.2 |
| 50 | 50 | 46.7 | 53.3 | 45 | 55 | 46.7 | 53.3 |
| 60 | 40 | 53.0 | 47.0 | 50 | 50 | 52.0 | 48.0 |
| 70 | 30 | 56.7 | 43.3 | 60 | 40 | 56.7 | 43.3 |
| 80 | 20 | 75.3 | 24.7 | 70 | 30 | 75.3 | 24.7 |
| 90 | 10 | 83.9 | 16.1 | 80 | 20 | 83.9 | 16.1 |
| 90 | 10 | 91.2 | 8.8 | ||||
| Phase | Measured Peaks [Raman Shift, cm−1] | Reference Peaks [Raman Shift, cm−1] | Reference |
|---|---|---|---|
| TiN | 157 s, 260 m, 620 m | 152 s, 340 m, 410 m, 620 m, | [23] |
| Al2O3 | 422 s, 383 m, 760 m, | 413–420 s, 375–380 m, 758 m, | [24] |
| MgO·Al2O3 | 416 s, 674 m, 773 m | 409–412 s, 666–674 m, 767–772 m | [25] |
| Ti2O3 | 247 s, 335 m, | 247 s, 336 m, 423 w | [26] |
| System | Relative Intensity | R2 | System | Relative Intensity | R2 |
|---|---|---|---|---|---|
| (i) TiN-Al2O3 | 382/157 | 0.99 | (iii) TiN-MgO·Al2O3 | 674/157 | 0.91 |
| 382/260 | 0.74 | 674/260 | 0.97 | ||
| 422/157 | 0.94 | 416/157 | 0.98 | ||
| 422/260 | 0.72 | 422/260 | 0.96 | ||
| 760/157 | 0.98 | 773/157 | 0.98 | ||
| 760/335 | 0.87 | 773/335 | 0.95 | ||
| 382/620 | 0.88 | 674/620 | 0.93 | ||
| 760/620 | 0.95 | 773/620 | 0.97 | ||
| (ii) Ti2O3-Al2O3 | 382/247 | 0.86 | (iv) Ti2O3-MgO·Al2O3 | 416/247 | 0.98 |
| 382/335 | 0.95 | 416/335 | 0.95 | ||
| 422/247 | 0.97 | 674/247 | 0.81 | ||
| 422/335 | 0.93 | 674/335 | 0.89 | ||
| 760/247 | 0.90 | 774/247 | 0.79 | ||
| 760/335 | 0.95 | 774/335 | 0.87 |
| System | Phase | Method | R2CAL | R2CV | R2PRED. | RMSEC, (wt%) | RMSECV, (wt%) | RMSEP, (wt%) |
|---|---|---|---|---|---|---|---|---|
| (i) TiN–Al2O3 | TiN | Raw Data | 0.86 | 0.79 | 0.58 | 11.56 | 15.14 | 15.01 |
| SNV Data | 0.95 | 0.94 | 0.84 | 6.68 | 7.79 | 9.08 | ||
| Al2O3 | Raw Data | 0.86 | 0.79 | 0.58 | 11.56 | 15.14 | 15.11 | |
| SNV Data | 0.96 | 0.95 | 0.94 | 6.11 | 7.71 | 9.07 | ||
| (ii) TiN–MgO·Al2O3 | TiN | Raw Data | 0.61 | 0.48 | 0.61 | 14.63 | 18.10 | 14.63 |
| SNV Data | 0.99 | 0.99 | 0.98 | 2.60 | 3.10 | 3.01 | ||
| MgO·Al2O3 | Raw Data | 0.86 | 0.79 | 0.81 | 11.83 | 13.99 | 14.14 | |
| SNV Data | 0.98 | 0.99 | 0.98 | 2.94 | 2.97 | 3.12 |
| System | Phase | Method | R2CAL | R2CV | R2PRED. | RMSEC, (wt%) | RMSECV, (wt%) | RMSEP, (wt%) |
|---|---|---|---|---|---|---|---|---|
| (i) Ti2O3–Al2O3 | Ti2O3 | Raw Data | 0.98 | 0.98 | 0.98 | 3.26 | 3.57 | 2.98 |
| SNV Data | 0.99 | 0.98 | 0.98 | 3.26 | 3.64 | 2.98 | ||
| Al2O3 | Raw Data | 0.99 | 0.99 | 0.98 | 3.11 | 3.68 | 2.94 | |
| SNV Data | 0.98 | 0.99 | 0.98 | 3.35 | 3.70 | 2.95 | ||
| (ii) Ti2O3–MgO·Al2O3 | Ti2O3 | Raw Data | 0.94 | 0.97 | 0.95 | 5.14 | 6.09 | 5.75 |
| SNV Data | 0.98 | 0.98 | 0.97 | 4.81 | 3.22 | 3.02 | ||
| MgO·Al2O3 | Raw Data | 0.93 | 0.96 | 0.94 | 5.23 | 6.46 | 7.17 | |
| SNV Data | 0.98 | 0.97 | 0.97 | 4.81 | 5.28 | 4.79 |
Publisher’s Note: MDPI stays neutral with regard to jurisdictional claims in published maps and institutional affiliations. |
© 2021 by the authors. Licensee MDPI, Basel, Switzerland. This article is an open access article distributed under the terms and conditions of the Creative Commons Attribution (CC BY) license (https://creativecommons.org/licenses/by/4.0/).
Share and Cite
Gyakwaa, F.; Alatarvas, T.; Shu, Q.; Aula, M.; Fabritius, T. Characterization of Synthetic Non-Metallic Inclusions Consisting of TiN, Ti2O3, and Oxides of Al2O3 and MgO·Al2O3 Spinel Using Raman Spectroscopy. Metals 2021, 11, 1549. https://doi.org/10.3390/met11101549
Gyakwaa F, Alatarvas T, Shu Q, Aula M, Fabritius T. Characterization of Synthetic Non-Metallic Inclusions Consisting of TiN, Ti2O3, and Oxides of Al2O3 and MgO·Al2O3 Spinel Using Raman Spectroscopy. Metals. 2021; 11(10):1549. https://doi.org/10.3390/met11101549
Chicago/Turabian StyleGyakwaa, Francis, Tuomas Alatarvas, Qifeng Shu, Matti Aula, and Timo Fabritius. 2021. "Characterization of Synthetic Non-Metallic Inclusions Consisting of TiN, Ti2O3, and Oxides of Al2O3 and MgO·Al2O3 Spinel Using Raman Spectroscopy" Metals 11, no. 10: 1549. https://doi.org/10.3390/met11101549
APA StyleGyakwaa, F., Alatarvas, T., Shu, Q., Aula, M., & Fabritius, T. (2021). Characterization of Synthetic Non-Metallic Inclusions Consisting of TiN, Ti2O3, and Oxides of Al2O3 and MgO·Al2O3 Spinel Using Raman Spectroscopy. Metals, 11(10), 1549. https://doi.org/10.3390/met11101549