Abstract
The effect of Nb addition on the composition, morphology, quantity, and size of inclusions in Fe-Mn-C-Al steel was studied by SEM, EDS, and thermodynamic analysis. The research shows that the number of inclusions in Fe-Mn-C-Al high manganese steel decreases obviously after adding 0.04% element Nb, and some inclusions in the steel evolve into complex niobium inclusions. When the niobium content increases to 0.08%, the influence of niobium on inclusions in steel becomes more obvious. The precipitation temperature of inclusions in Fe-Mn-C-Al steel was analyzed by thermodynamics. The results show that the nucleation core of the composite inclusions is AlN, and then NbC and MnS precipitate locally on its surface. With the increase of Nb, the amount and volume fraction of NbC inclusions precipitated in steel increase.
1. Introduction
Twinning Induced Plasticity (TWIP) steels are thin sheet products with very high strength and ductility that were originally developed for automotive applications. In common with other fully austenitic structures, TWIP steels show no low temperature ductile-brittle fracture transformation [1,2,3,4,5]. For Fe-Mn-C-Al steel, the chemical composition is mainly composed of 15%~18% Mn, 0.3%~0.8% C, and a certain amount of Al [6,7,8,9,10]. The generation of the TWIP effect is closely related to the stacking fault energy of austenite. At a given deformation temperature, stacking fault energy only depends on chemical composition [7,11]. The key to the TWIP effect is to adjust the content of C, Mn, Al, and other elements to make the stacking fault energy in a proper range. However, the characteristics of high Mn and high Al content in TWIP steel are easy to generate a large number of AlN, MnS, and other inclusions in the smelting process, which has a negative impact on the quality of steel products [12].
Gigacher et al. [13,14] analyzed inclusions in as-cast Fe-(15~25) Mn-3Al-3Si TWIP steel by SEM and EDS, and they found that the main types (number ratio) of inclusions in TWIP steel were MnO-Al2O3-AlN (40%), MnO-Al2O3-MnS (10%), MnO-Al2O3-AlN-MnS (30%), and single-phase AlN (14%). On this basis, Park et al. [15] carried out research on inclusions in Fe-Mn-Al TWIP steel with different Mn and Al contents, and found that a large number of separate Al2O3 inclusions, cluster Al(O)N, and some composite inclusions associated with MnS (Se) and Al were found in the steel. With the increase of Mn content, the proportion of MnS (Se) inclusions in the steel grew; with the increase of melting time, the inclusions were aggregated; the proportion of Al(O)N in the block also increased gradually. Xin et al. [12] carried out the quantitative characterization of inclusions in Fe-16Mn-xAl-0.6C high manganese TWIP steel with different Al content, and calculated the equilibrium precipitation temperature of inclusions in steel by Factsage thermodynamic software. It was found that with the increase of Al content from 0.002% to 2.1%, the evolution phenomenon of the main inclusions in TWIP steel was MnO→Al2O3/MnS→MnS→AlN. However, it was not considered whether the existing thermodynamic parameters were suitable for the thermodynamic analysis of inclusions in high alloy steel.
Niobium is a typical grain boundary precipitation element that has a strong tendency to form carbonitrides rather than oxide or sulfide. The high plastic deformation of the matrix can accelerate the precipitation of Nb (C, N) in the dislocation and inhibit the recrystallization of austenite grains. Nb (C, N) has low solution stability in TWIP steel. It can refine recrystallization during solidification, inhibit grain growth, and improve grain distribution [16]. Kaushik et al. [17] and Mapelli et al. [18] found that the principal inclusion in high Al steel is AlN, and AlN precipitation is much easier than ordinary Al killed steel. Kang et al. [19] studied the hot plasticity of TWIP steel and found that AlN precipitated at the austenite grain boundary, which seriously worsened the as-cast thermoplastic of TWIP steel. Kang et al. [19] studied the as-cast hot plasticity of Fe-C-Mn-N-Al high manganese and high aluminum steel. It was discovered that the formation of AlN and MnS inclusions resulted in poor plasticity of high manganese twinning-induced plasticity steel.
In this study, in addition to the different content of Al, niobium was added to Fe-Mn-C-Al TWIP steels. The inclusions in four kinds of Fe-Mn-C-Al steels with different contents of Al and Nb were analyzed by means of SEM, EDS, and metallographic microscope. The variation of inclusions in twinning-induced plasticity steel after adding niobium was studied. It is found that the addition of niobium obviously reduced AlN and Al2O3 inclusions in TWIP steel. Therefore, it is necessary to study and analyze systematically the type, quantity, and distribution of inclusions in Fe-Mn-C-Al TWIP steels with Nb, which is of great significance to the development of the inclusion control theory of twinning-induced plasticity steel.
2. Experimental Materials and Methods
2.1. Experimental Materials
Four batches of Fe-Mn-C-Al steels A, B, C, and D were made by using a medium frequency induction melting furnace. The specific process was as follows: Pure iron bar (99.90%), electrolytic manganese (99.90%), aluminum (99.994%), and niobium (99.99%) were used as the main raw materials, and 10 kg melted raw materials were prepared according to the proportion. In the iron bar, 99.90% was iron, and the other impurity elements were 0.004% C, 0.013% P, and 0.007% S. In the medium frequency induction heating furnace, the ingot samples were cast after melting, and the melting process was in an open-air environment. The casting method and cooling conditions of the four heats of steel were the same. Steel without aluminum and niobium were added to the sample A steel, and 1.49% aluminum without niobium was added to the sample B steel. To sample C, 1.50% aluminum and 0.04% niobium were added, whereas in sample D, 1.51% aluminum and 0.08% niobium were added. Aluminum and niobium were added to both C and D steels, but the contents of aluminum and niobium were different. The contents of Mn, Al, and Nb in steel were determined by inductively coupled plasma-atomic emission spectrometry (ICP-AES), C and S content was detected by a carbon–sulfur detector, and N and O content was detected by a nitrogen–oxygen determinator. It is worth noting that the deoxidizer used in the process of smelting Fe-Mn-C-Al TWIP steels in the laboratory was aluminum, so the preset A steel without aluminum actually had a certain aluminum content. The main components are shown in Table 1.

Table 1.
Chemical composition of Fe-Mn-Al-C high manganese steel (wt%).
2.2. Sampling and Characterization of Inclusions
After removing the casting head, the TWIP steel ingot was longitudinally dissected along the center in consideration of the symmetry of the cylindrical ingot, and then samples were taken from the longitudinally dissected ingot. The sampling position is shown in Figure 1. Inclusion analysis was carried out on 15 samples at different heights (ingot surface, L/3 position, L/2 position, where “L” stands for ingot height), and the samples were labeled A1~5, B1~5, and C1~5, respectively. In addition, in order to avoid uneven composition distribution in steel due to macro-segregation, chemical composition analysis was carried out and the average value was finally taken as the content of each element in the steel.
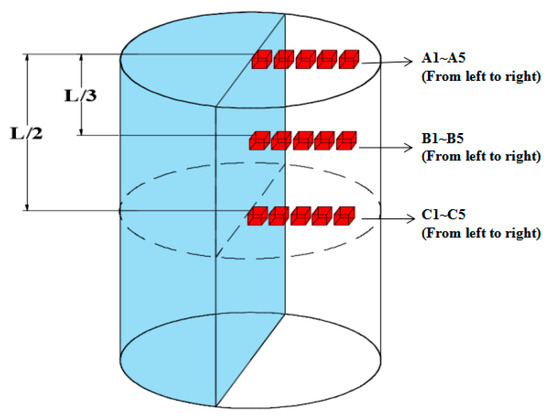
Figure 1.
Sampling diagram.
A total of 60 TWIP steel samples with different Nb and Al contents were obtained by the above sampling scheme. After rough grinding, fine grinding, and polishing, the morphology and size of the inclusions were observed under a Zeiss-Utra55 field emission scanning electron microscope, and the composition of the inclusions was determined by energy dispersive spectrometer (EDS).
3. Experimental Results and Analysis
3.1. Characteristics of Inclusions in High Manganese Twinning Induced Plasticity Steel
3.1.1. The TWIP Steel without Aluminum (the Actual Al Content Was 0.014%) Was Preset
Figure 2 shows the morphology and main components of typical inclusions observed by SEM for steel A. The average size of the inclusions was 2~5 μm and the morphology was elliptical. It should be noted that there were matrix elements in the inclusions from the energy spectrum results, which was due to the small size of the inclusions and the influence of the scanning range on the Oxford energy spectrometer equipped with a scanning electron microscope. However, the content of these elements was relatively small, which did not affect the judgment of the inclusion type.
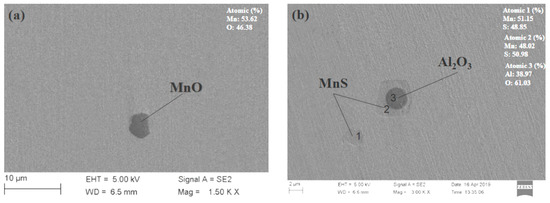
Figure 2.
Morphology of typical inclusions in TWIP steel (steel A) (the preset Al content is 0, and the actual Al content is 0.014%). (a) MnO inclusion; (b) Al2O3-MnS complex inclusion.
As shown in Figure 2a, there were MnO inclusions in the oxidation inclusions of steel A, the shape was elliptical, and the size was about 2 μm. In Figure 2b, the morphology of the MnS inclusions separated out was elliptical, and the size was between 3~5 μm. The Al2O3-MnS (Se) inclusions were mainly composed of small-size Al2O3 inclusions. MnS (Se) inclusions precipitated locally on the surface of the inclusions. The nucleation core of Al2O3 inclusions was round. The MnS (Se) inclusions were irregular polygons on the surface, and the size was about 5~6 μm.
It should be noted that the sulfide in high manganese twinning-induced plasticity steel is mainly MnS (Se), rather than pure MnS. The reason is that a large amount of electrolytic manganese is used as raw material to produce a high manganese twinning-induced plasticity steel ingot, whereas in the industrial production process of electrolytic manganese, SeO2 is generally used as an electrolytic additive, which can improve the current efficiency. Se4+ is reduced to Se at the cathode and adsorbed on the cathode, and it can improve the overvoltage of the hydrogen evolution.
3.1.2. TWIP Steel Containing 1.49% Al
It can be clearly seen in Figure 3 that after adding 1.49% Al to the high manganese twinning-induced plasticity steel, some AlN inclusions with an angular polygon appeared in sample B steel, and their size was about 8 μm. Figure 3a shows SEM images of typical AlN inclusions. Figure 3b,c shows SEM/EDS images of typical AlN-MnS complex non-metallic inclusions. It can be seen from Figure 3b–c that AlN precipitated first, then AlN acted as the nucleation core of the complex non-metallic inclusions: MnS (Se) was wrapped and precipitated on the surface of AlN to form AlN-MnS (Se) complex non-metallic inclusions. In this kind of inclusion, AlN inclusions, which are heterogeneous cores, are smaller in size, generally between 0.6μm and 3 μm. In addition, a few clusters of AlN inclusions were observed under SEM, and the size of AlN inclusions was generally larger than 8 μm. The existence of Al2O3 inclusions was rarely observed in steel B, but it was common to find Al(O)N inclusions.
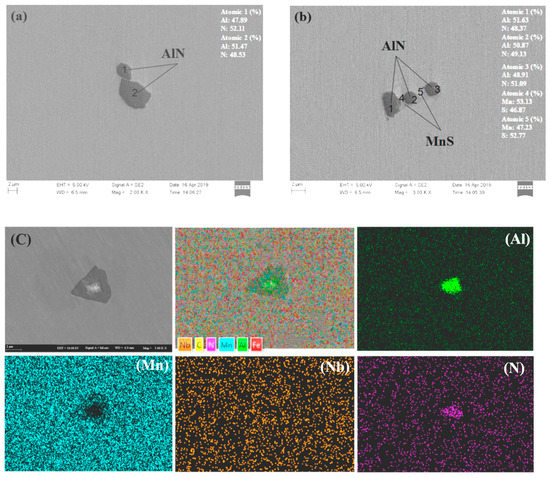
Figure 3.
Morphology of typical inclusions in TWIP steel (steel B) (the mass fraction of Al is 1.49%). (a) AlN inclusion; (b) AlN-MnS complex inclusion; (c) The surface scan of AlN-MnS complex inclusion.
3.1.3. TWIP Steel Containing 1.5% Al and 0.04% Nb
With the addition of niobium in the steel, niobium carbide inclusions appeared in the steel, and the morphology is shown in Figure 4b. Although the content of aluminum in C steel was 1.5%, there were no cluster AlN inclusions. It was found that the AlN inclusions transferred to complex non-metallic inclusions by combining with other inclusions. Figure 4c shows the single-phase AlN inclusions found in steel C.
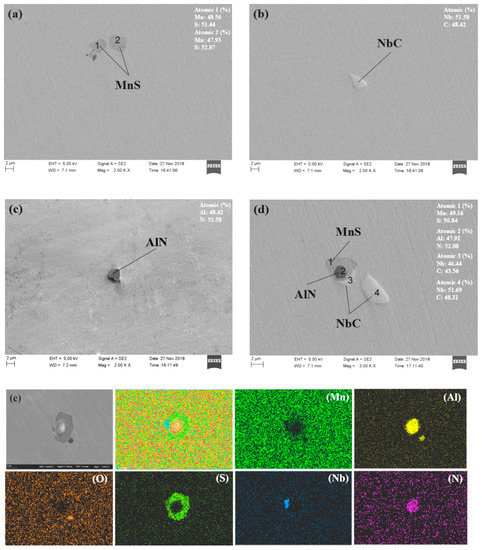
Figure 4.
Morphology of typical inclusions in TWIP steel (steel C) (the mass fraction of Al and Nb is 1.5% and 0.04%, respectively). (a) MnS inclusion; (b) NbC inclusion; (c) AlN inclusion; (d) AlN-MnS-NbC complex inclusion; (e) the surface scan of niobium complex inclusion.
The typical inclusion morphology of Fe-Mn-C-Al steel with a niobium content of 0.04% under the scanning electron microscope is shown in Figure 4. It can be clearly seen in Figure 4a that the size of different types of inclusions was about 2~5 μm. MnS (Se) inclusions generally existed alone, with a size of 2 μm, and their morphology was an irregular polygon. Figure 4b shows the separated NbC inclusions, the size of which was about 3 μm. Figure 4d–e are the SEM/EDS pictures of typical Al(O)N-MnS(Se)-niobide complex non-metallic inclusions in steel C. Among such composite inclusions, AlN was the first to precipitate. Then, as the core of the composite inclusions, MnS (Se) wrapped and precipitated on its surface, and then niobide inclusions locally precipitated on MnS (Se) to form AlN-MnS (Se)-niobide inclusions. No separate Al2O3 inclusions were found under the scanning electron microscope.
3.1.4. TWIP Steel Containing 1.5% Al and 0.08% Nb
In this study, the content of Al and Nb in steel D was 1.5% and 0.08%, respectively, and Nb content was twice that of steel C. A large number of niobium complex inclusions were found in steel D; the main forms of niobium complex inclusions were NbC, MnS (Se)-NbC, and AlN-MnS (Se)-NbC. There were few single NbC inclusions; most of the niobium complex inclusions existed in the form of complex inclusions. The morphology characteristics of the inclusions were basically the same as those in the previous section. The distinguishing element was that the number of inclusions was different, as presented in Figure 3 or Figure 4.
3.2. Types and Evolution Rule of Inclusions in High Manganese Twinning-Induced Plasticity Steel
The type, quantity, size, and distribution of main non-metallic inclusions in Fe-Mn-C-Al high manganese steel with different niobium contents were analyzed by SEM and energy dispersive spectroscopy (EDS). Results were obtained as shown in Figure 5a–e are the specific number of inclusions in steels A, B, C, and D, and f is the proportion of different types of inclusions in the steels). It can be seen from Figure 5 that the main sulfide inclusion in steel was MnS, which accounted for 46.98% of the total inclusions. The main oxide inclusions in steel A were alumina inclusions, accounting for 25.99%. Al inclusions mainly existed in the form of single-phase AlN/Al(O)N, accounting for about 53.02%. The oxide inclusions containing Mn existed in the steel as complex non-metallic inclusions, which account for 14.00%.
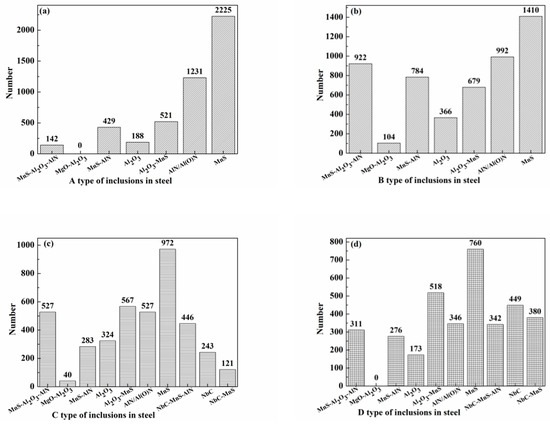
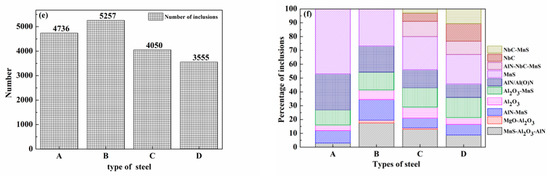
Figure 5.
The proportion of inclusions in TWIP steel with different numbers of inclusions and different heats: (a) is the number of different inclusions in steel A, (b) is the number of different inclusions in steel B, (c) is the number of different inclusions in steel C, (d) is the number of different inclusions in steel D, (e) is the total number of inclusions in different heats, and (f) is the proportion of different inclusions in different heats.
When the Al content in TWIP steel reached 1.49%, AlN/Al(O)N in TWIP steel increased gradually. As shown in Figure 5, the complex non-metallic inclusions containing AlN/Al(O)N were mainly composed of Al2O3-AlN-MnS. The core of the complex non-metallic inclusions was Al2O3, and then AlN and MnS precipitated on its surface. The proportion of such inclusions in steel B was about 17.54%; the proportion of single-phase AlN/Al(O)N, single-phase Al2O3, single-phase MnS, and Al2O3-MnS complex non-metallic inclusions accounted for 18.87%, 6.96%, 26.82%, and 12.92%, respectively. Therefore, in steel B, inclusions composed with Al element were principal single-phase AlN/Al(O)N inclusions.
Compared with steel B, the proportion of Al2O3-AlN-MnS and AlN/Al(O)N inclusions in steel C with 1.5% Al and 0.04% niobium content gradually decreased. Compared with steel B, the proportion of these two kinds of inclusions in steel decreased by 4.53% and 5.86%, respectively. With the addition of niobium in steel C, new inclusions such as NbC, MnS-NbC, AlN-NbC-MnS, and so on appeared gradually in steel C. The proportions of these new inclusions were 6.00%, 2.99%, and 11.01%, respectively. The proportion of single-phase AlN/Al(O)N and AlN-MnS inclusions in the original Al-bearing inclusions gradually decreased to about 13.01% and 6.99% due to the existence of niobium and complex niobium inclusions. The proportion of single-phase Al2O3 was only 8.00%. Although niobium was added to steel C, the proportion of MnS inclusions was still very high, about 24.00%. This phenomenon may be related to the chemical composition of high manganese steel. It can be seen that the proportion of AlN and AlN complex non-metallic inclusions in steel C decreased obviously after adding a niobium element to the steel; AlN inclusions were brittle inclusions, and AlN inclusion was one of the main reasons for cracks in the steel, so the appearance of a large number of AlN inclusions should be avoided as far as possible. After adding niobium to steel C, NbC inclusions appeared locally in the steel. The size of NbC inclusions was generally less than 2 μm; NbC inclusions can refine grains in steel.
When the mass fraction of Nb in TWIP steel increased to 0.08%, the proportion of single-phase NbC, MnS-NbC, and AlN-MnS-NbC in the Nb-containing inclusions increased to 12.63%, 10.69%, and 9.62%, respectively. MnS-NbC composite inclusions were the prime type of niobium inclusions in steel D. The proportion of single-phase Al2O3, AlN-Al2O3-MnS, MgO-Al2O3, AlN-MnS, Al2O3-MnS, AlN/Al(O)N, and MnS inclusions were reduced to 4.87%, 8.75%, 0.00%, 7.76%, 14.57%, 9.73%, and 21.38%, respectively. The increase of niobium inclusions led to a decrease in aluminate in the steel. It can be seen from Figure 5f that Al2O3 and AlN/Al(O)N inclusions in steel D decreased sharply to 4.87% and 9.73%, respectively. At this time, the prime inclusions in steel D were MnS, MnS complex non-metallic inclusions, and NbC inclusions.
In addition, it can be concluded from Figure 5a,b that with the increase of Al content in the steel, the number of Al2O3-MnS complex non-metallic inclusions rose from 142 to 679, and the proportion increased from 3.00% to 12.92%. With the addition of Al in steel, a new type of complex non-metallic inclusion MgO-Al2O3 appeared in steel B, the proportion of which increased from 0.00% to 1.98%. Xin et al. [12] reported that higher dissolved Al in TWIP steel could react with MgO in crucible to form dissolved Mg, which led to the increase of MgO content in Fe-16Mn-0.6C-1.5Al steel. However, in this study, only MgO-Al2O3 complex non-metallic inclusions were found in this steel, and the proportion of Mg inclusions in the steel was relatively low. According to Figure 5e, it can be seen that the number of inclusions in steels C and D was much lower than that in steels A and B under the same condition, which may be related to the addition of the niobium element in steels C and D.
A total of 100 steel samples were taken by scanning electron microscope. The size of the inclusions in Fe-Mn-C-Al TWIP steels was counted by “Image-Pro” inclusion statistical software. The average size of the inclusions in steel of four heats was obtained, as shown in Figure 6.
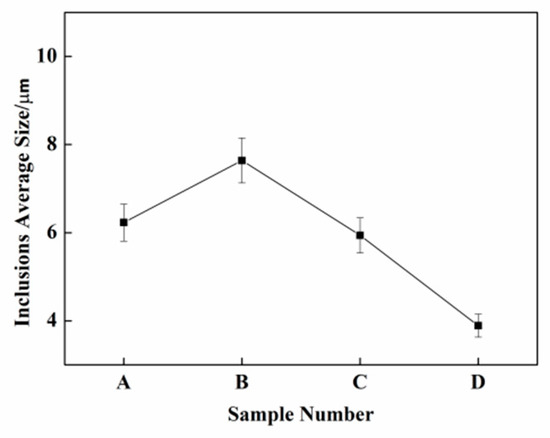
Figure 6.
Average size distribution of inclusions in different TWIP steels.
It can be seen from Figure 6 that the average size of the inclusions in steel A was 6.23 μm. When the aluminum content increased to 1.49%, the average size of the inclusions in steel B was higher than that in steel A. When 0.04% Nb was added to the steel, the average size of the inclusions decreased. With the increase of Nb content to 0.08%, the average size of the inclusions in the steel continued to decrease to 3.89 μm.
4. Analysis and Discussion
It can be seen from the above experimental results that in the process of increasing Al mass fraction from 0 to 1.49%, AlN inclusions first precipitated, then MnS (Se), MnS (Se)-Al2O3, and other complex non-metallic inclusions began to precipitate locally on the surface of AlN inclusions. When the mass fraction of the Al element added in the steel reached 1.5%, it could be seen through SEM that AlN inclusion appeared in clusters, and a large number of AIN were used as heterogeneous nuclei. MnS (Se) was encapsulated on its surface and precipitated to form AlN-MnS (Se) complex non-metallic inclusion. At this time, single-phase AlN and AlN-MnS (Se) complex non-metallic inclusions accounted for up to 34% in steel B. With the addition of metal niobium, single-phase NbC inclusions and other types of niobium complex inclusions began to be precipitated out of the steel. When the niobium content in the steel continued to aggrandize to 0.08%, the number of single-phase NbC inclusions in the steel began to elevate, and other types of inclusions in the steel began to transform into compound niobium inclusions.
4.1. Thermodynamic Calculation of Inclusions in TWIP Steel
The content of Mn in Fe-Mn-C-Al TWIP steel was about 16%, which was much higher than that of ordinary steel. For general low alloy steel, the Gibbs free energy () and interaction coefficient of inclusions in steel are calculated by the Wagner model. This calculation model is not suitable for Fe-Mn-C-Al TWIP steels with high Mn and Al characteristics. It is necessary to use the latest data to calculate the thermodynamic analysis of inclusions in twinning-induced plastic steels. By analyzing the formation mechanism of AlN, MnS, and their complex non-metallic inclusions from the view of thermodynamics, the evolution law of different inclusions in TWIP steel can be further understood. The chemical reaction of AlN formation can be expressed as:
where K is the equilibrium constant for the formation of AlN, and is the activity of AlN, taken as 1. and are the activities of Al and N, respectively. and are the activity coefficients of Al and N, respectively. and are the concentrations of Al and N in molten steel, respectively.
For the formation reaction of AlN, the Gibbs free energy data of Wada [20] are generally used by researchers, as follows:
However, the latest Gibbs free energy of AlN formation reaction obtained by Paek et al. [21] is as follows. The aluminum content of less than 4.5% is applicable, which is more suitable for TWIP steel with high aluminum peculiarity. Therefore, the ultramodern Gibbs free energy data are used in this study.
where is the Gibbs standard free energy of AlN formation in molten iron, K is the reaction equilibrium constant, and T is the reaction temperature.
where and represent the activity coefficients of Al and N in steel, respectively, and the activity coefficients of alloy elements can be calculated by the Wagner model, where and are the primary interaction coefficient and secondary interaction coefficient, respectively. Since the Mn and Al contents of Fe-Mn-C-Al TWIP steels are as high as 16% and 1.5%, the primary and secondary interaction coefficients have enormous influence on the thermodynamic calculation of AlN precipitation. Therefore, it is very important to select the appropriate interaction coefficient for the study of AlN precipitation.
In recent years, some researchers [15,22,23,24] have measured the interaction coefficient of elements in high manganese and high aluminum steel, and obtained the basic data suitable for thermodynamic calculation of inclusions in high Mn and high Al steel, which is very conducive to the thermodynamic study of inclusion precipitation in Fe-Mn-C-Al TWIP steels.
Combined with the above formula, the thermodynamic conditions of AlN precipitation in steel C could be obtained respectively by using the interaction coefficient commonly used in previous literature (as shown in Table 2) and the primary and secondary interaction coefficients (as shown in Table 3), which are most suitable for twinning-induced plasticity of high manganese and high aluminum steel.
Table 2.
Primary and secondary interaction coefficients and (1873K) commonly used in previous literature [25].
Table 3.
Primary and secondary interaction coefficients most suitable for the thermodynamic calculation of TWIP steel.
Thermodynamic conditions of AlN precipitation using the interaction coefficient commonly used in previous literature [20]:
The most suitable thermodynamic conditions for AlN precipitation in high manganese steel with primary and secondary interaction coefficients [21]:
In Formulas (7) and (8), [%Al] and [%N] are the activities of Al and N in liquid steel, respectively; T stands for temperature, and the unit is K.
According to the thermodynamic calculation results, when the N content is 0.0080%, the ordinary thermodynamic data and the latest thermodynamic data suitable for high manganese and high aluminum steel are used for the calculation of steel C, and the equilibrium precipitation temperatures of AlN were 1708.75K and 1733.32K, with a difference of 24.57K. Through thermocalc thermodynamic software (using database TCFE7), the liquidus temperature of steel C was 1692K. Therefore, AlN precipitated in the liquid phase of steel C, whether the general thermodynamic data or the latest thermodynamic calculation data. Moreover, AlN inclusions were more easily formed in twinning-induced plasticity steel of high manganese Fe-Mn-C-Al TWIP steels. In order to reduce the precipitation of AlN in the liquid phase, the content of N in the steel should be reduced as much as possible during the steelmaking process of TWIP steel, especially to avoid the secondary oxidation of molten steel in the production process, so as to avoid excessive AlN inclusions.
Similarly, the equilibrium precipitation temperature of MnS can be calculated from Formula (9) and Table 4:
Table 4.
First order interaction coefficients related to MnS formation.
The reaction equilibrium constant is as follows:
The thermodynamic conditions of MnS precipitation in high manganese Fe-Mn-C-Al system of steel C could be obtained by the following calculation:
It can be seen from the calculation that the equilibrium precipitation temperature of AlN in steel was higher than that of liquidus, which indicates that AlN inclusions can be precipitated earlier in the steelmaking process of Fe-Mn-C-Al TWIP steels. AlN inclusions precipitated in molten steel and grew by collision, which was also the main reason for cluster AlN in twinning-induced plastic steel. It was found that the precipitation temperature of MnS was 1439.41K when the sulfur content was 0.08%, and the equilibrium precipitation temperature of AlN was obviously higher than that of MnS. The results show that AlN was formed first in the liquid phase, and AlN could be used as heterogeneous core to form MnS (Se) inclusions, thus forming AlN-MnS(Se) complex non-metallic inclusions.
4.2. Thermodynamic Analysis of Niobium Complex Inclusions
When niobium was added into Fe-Mn-C-Al TWIP steels, the precipitation process of carbides affected the solidification macrostructure, so the precipitation thermodynamics of carbides must be considered. Some researchers [28,29,30,31,32] obtained the solid solubility product formula of NbC in austenite by different methods. In this paper, the precipitation temperature of NbC was calculated by the phase analysis method and statistical analysis method.
By the statistical analysis method, the solubility product of niobium carbide in austenite could be calculated with the following Formula (13) [33]. The total solution temperature TAS of niobium carbide as the second phase could be calculated with Formula (14) [33]:
where A and B are constants in the Formula of the solid solubility product of the NbC phase in iron substrate. In statistical analysis, A was 2.96 and B was 7510.
When the chemical composition of steel was known, the precipitation temperature of niobium carbide could be calculated with the above formula. Formula (15) is the precipitation temperature of NbC in steel C when calculated by the statistical analysis method, and Formula (16) is the precipitation temperature of NbC in steel D calculated with the statistical analysis method.
Similarly, when the solubility product of carbide in austenite was calculated with the phase analysis method, Formula (17) could be used [28].
The precipitation temperature of niobium carbide in TWIP steel was calculated with Formulas (13) and (17). When the phase analysis method was used, A was 2.80 and B was 8500 in Formula (14). Formula (18) is the precipitation temperature of NbC in C steel when phase analysis method was used, and Formula (19) is the precipitation temperature of NbC in steel D calculated with the phase analysis method.
The precipitation of the second phase particles was related to the equilibrium solid solution amount of the constituent elements in the steel [33]:
where PNb represents the niobium content in the precipitated phase and PC represents the carbon content in the precipitated phase; Nb% represents niobium content added, [Nb]% is the content of niobium dissolved in the iron matrix in an equilibrium state, C% is the added carbon content, and [C]% is the carbon content in the iron substrate. The atomic weights of niobium and carbon are ANb = 92.9064 and AC = 12.011, respectively. The relationship between the amount of second phase particles of Nb and C in the substrate and the amount in the precipitated phase could be obtained by the simultaneous Formulas (14) and (20), and (17) and (20) at any temperature, as shown in Figure 7.
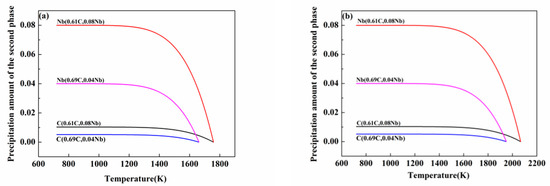
Figure 7.
Temperature dependence of precipitation amount of second phase (NbC) in different niobium contents: (a) is the result of statistical analysis and (b) is the result of phase analysis.
It can be seen in Figure 7 that when the statistical analysis method was adopted, niobium and carbon were completely dissolved in high manganese steel with 0.04% niobium content at 1661.84 K; in high manganese steel with 0.08% niobium content, the complete solution temperature was 1758.13 K. By the phase analysis method, niobium and carbon were completely dissolved in high manganese steel with 0.04% niobium content at a high temperature of 1949.95 K, and the complete solution temperature of high manganese steel with 0.08% niobium content was 2067.33 K. It can be seen from Figure 7 that no matter which calculation method was adopted, when the niobium content in the steel increased, the precipitation amount of niobium carbide also increased at the same temperature. Therefore, the increase of Nb content in high manganese steel could not only increase the precipitation temperature of niobium carbide, but also further enhance the precipitation amount of niobium carbide inclusions at the same temperature. Both of them further strengthened the precipitation process of precipitates in steel.
The volume fraction of NbC precipitated at any temperature in the steel could be calculated with Formula (21) [33] when the second phase particles precipitated in liquid steel reached equilibrium at different temperatures [33].
where dFe and dNbC are the densities of the iron substrate and NbC phase, respectively.
Combined with the amount of NbC in the precipitated phase calculated above, the volume fraction change diagram of NbC at different temperatures in TWIP steel could be obtained, as shown in Figure 8.
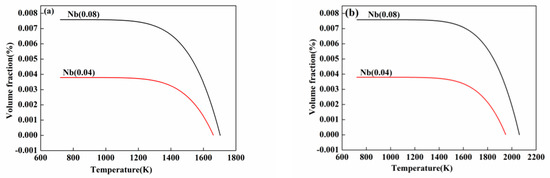
Figure 8.
Volume fraction of TWIP steel with different Nb content at any temperature: (a) is the result of statistical analysis and (b) is the result of phase analysis.
When 0.04% and 0.08% Nb content were added into Fe-Mn-C-Al TWIP steels, through the statistical analysis method, according to the Formulas (13) and (14), it could be concluded that the precipitation temperatures of niobium carbide in steel were 1661.84 K and 1758.13 K, respectively. Through the phase analysis method, according to Formulas (13) and (17), it could be concluded that the precipitation temperatures of niobium carbide in steel were 1949.95 K and 2067.33 K, respectively. From the above experimental results, NbC precipitates in the peripheral region of AlN inclusions and the precipitation temperature of NbC were lower than those of AlN. It seems that the precipitation temperature of niobium carbide calculated by the phase analysis method is not reasonable, and the formula obtained by the statistical analysis method is more reliable. Therefore, from the calculation results, the alloy element Nb can be completely dissolved by heating, and the heating temperature should be higher than 1661.84 K.
It can be seen from Figure 7 and Figure 8 that with the rise of temperature, NbC inclusions in TWIP steel began to precipitate; the volume fraction of NbC inclusions precipitated in the second phase increased continuously. When the temperature reached a certain value, the influence of temperature on NbC tended to be gentle. At the same temperature, with the increase of Nb content, the amount of NbC precipitated in TWIP steel increased, and the volume fraction of NbC precipitated from the second phase.
5. Conclusions
It was found that the dominating inclusions in Fe-Mn-C-Al TWIP steels are MnS, AlN, MnO, and Al(O)N before adding Nb. After adding niobium, single-phase Nb inclusions and MnS-NbC niobium complex inclusions begin to precipitate in the steel. When the niobium content in the steel continues to increase to 0.08%, the number of single-phase NbC inclusions in the steel begins to increase, and other types of inclusions in the steel begin to transform into AlN-MnS-NbC and other composite niobium inclusions.
After adding niobium to the steel, the types of inclusions in the steel did not decrease, but the number of AlN and MnS inclusions in the steel decreased obviously. When the content of niobium was 0.04%, the proportion of Al2O3-AlN-MnS and AlN/Al(O)N inclusions decreased by 4.53% and 5.86% compared with that of steel B without Nb. When the content of niobium was increased to 0.08%, the content of niobium in the steel increased to 32.94%, and the total number of inclusions in steel B decreased by 32.38% compared with that in steel B without Nb.
According to the thermodynamic calculation of the equilibrium precipitation temperature of different inclusions, AlN first precipitates and acts as a heterogeneous nucleation core of inclusions, and then NbC and MnS precipitate locally on its surface. With the increase of Nb content, the amount of NbC inclusions precipitated in the steel rises. As a result, the volume fraction of NbC inclusions precipitated from the second phase increases.
Author Contributions
Conceptualization, C.Z. and C.L.; methodology, W.D.; software, F.L.; validation, C.Z. and F.L.; formal analysis, F.L.; investigation, C.L.; resources, W.D.; data curation, W.D.; writing—original draft preparation, W.D.; writing—review and editing, F.L.; visualization, F.L.; supervision, C.Z.; project administration, C.Z.; funding acquisition, C.Z. All authors have read and agreed to the published version of the manuscript.
Funding
This research was funded by the National Natural Science Foundation of China, grant numbers 51704083 and 51864013, Science and Technology Program of Guizhou Province ([2017]5788, [2018]1026,[2019]1115, [2018]5781 and [2019]2163), Education Department Foundation of Guizhou Province (No.[2017]118), and Research Foundation for Talents of Guizhou University (No. 201628).
Institutional Review Board Statement
Not applicable.
Informed Consent Statement
Informed consent was obtained from all subjects involved in the study.
Data Availability Statement
The data used to support the findings of this study are available from the corresponding authors upon reasonable request.
Conflicts of Interest
The authors declare no conflict of interest.
References
- Scott, C.; Remy, B.; Collet, J.L.; Cael, A.; Bao, C.; Danoix, F.; Malard, B.; Curfs, C. Precipitation strengthening in high manganese austenitic TWIP steels. Int. J. Mater. Res. 2011, 102, 538–549. [Google Scholar] [CrossRef]
- Frommeyer, G.; Bruex, U.; Neumann, P. Supra-Ductile and High-Strength Manganese-TRIP/TWIP Steels for High Energy Absorption Purposes. ISIJ Int. 2003, 43, 438–446. [Google Scholar] [CrossRef]
- Bouaziz, O.; Masse, J.P.; Petitgand, G.; Huang, M.X. A Novel Strong and Ductile TWIP/Martensite Steel Composite. Adv. Eng. Mater. 2016, 18, 56–59. [Google Scholar] [CrossRef]
- De Cooman, B.C.; Estrin, Y.; Kim, S.K. Twinning-induced plasticity (TWIP) steels. Acta Mater. 2018, 142, 283–362. [Google Scholar] [CrossRef]
- Kim, J.G.; Enikeev, N.A.; Seol, J.B.; Abramova, M.M.; Karavaeva, M.V.; Valiev, R.Z.; Park, C.G.; Kim, H.S. Superior Strength and Multiple Strengthening Mechanisms in Nanocrystalline TWIP Steel. Sci. Rep. 2018, 8, 11200. [Google Scholar] [CrossRef] [PubMed]
- Kim, C.; Terner, M.; Lee, J.; Hong, H.-U.; Moon, J.; Park, S.; Jang, J.; Lee, C.; Lee, B.; Lee, Y. Partitioning of C into κ-carbides by Si addition and its effect on the initial deformation mechanism of Fe-Mn-Al-C lightweight steels. J. Alloys Compd. 2019, 775, 554–564. [Google Scholar] [CrossRef]
- Chen, S.; Rana, R.; Haldar, A.; Ray, R.K. Current state of Fe-Mn-Al-C low density steels. Prog. Mater. Sci. 2017, 89, 345–391. [Google Scholar] [CrossRef]
- Liu, H.; Liu, J.; Wu, B.; Shen, Y.; He, Y.; Ding, H.; Su, X. Effect of Mn and Al contents on hot ductility of high alloy Fe-xMn-C-yAl austenite TWIP steels. Mater. Sci. Eng. A 2017, 708, 360–374. [Google Scholar] [CrossRef]
- Kang, S.; Jung, J.-G.; Kang, M.; Woo, W.; Lee, Y.-K. The effects of grain size on yielding, strain hardening, and mechanical twinning in Fe–18Mn–0.6C–1.5Al twinning-induced plasticity steel. Mater. Sci. Eng. A 2016, 652, 212–220. [Google Scholar] [CrossRef]
- Yu, H.-Y.; Lee, S.-M.; Nam, J.-H.; Lee, S.-J.; Fabrègue, D.; Park, M.-H.; Tsuji, L.Z.N.P.Y.T.A.S.N.; Lee, Y.-K. Post-uniform elongation and tensile fracture mechanisms of Fe-18Mn-0.6C-xAl twinning-induced plasticity steels. Acta Mater. 2017, 131, 435–444. [Google Scholar] [CrossRef]
- Hou, R.; Zhu, C.; Li, G.; Zhou, B.; Jia, J. Effect of Niobium on Precipitates and Texture Evolution of Fe-3% Si Grain-oriented Electrical Steel Annealed Hot Band. ISIJ Int. 2017, 57, 2245–2254. [Google Scholar] [CrossRef]
- Xin, X.; Yang, J.; Wang, Y.; Wang, R.; Wang, W.; Zheng, H.; Hu, H. Effects of Al content on non-metallic inclusion evolution in Fe-16Mn-xAl-0.6C high Mn TWIP steel. Ironmak. Steelmak. 2016, 43, 234–242. [Google Scholar] [CrossRef]
- Gigacher, G.; Pierer, R.; Wiener, J.; Bernhard, C. Metallurgical Aspects of Casting High-Manganese Steel Grades. Adv. Eng. Mater. 2006, 8, 1096–1100. [Google Scholar] [CrossRef]
- Gigacher, G.; Krieger, W.; Scheller, P.R.; Thomser, C. Non-Metallic Inclusions in High-Manganese-Alloy Steels. Steel Res. Int. 2005, 76, 644–649. [Google Scholar] [CrossRef]
- Park, K.B.; Park, J.-Y.; Do Kim, Y.; Choi, J.; Kang, H.-S.; Kang, J.-W.; Park, K.; Park, H.-K. Effect of the microstructure refinement by powder metallurgy on the oxidation behavior of Nb-6Mo-20Si-3Cr silicide-based alloy. Mater. Charact. 2020, 170, 110708. [Google Scholar] [CrossRef]
- Takamiya, T.; Furukimi, O. Precipitation Behavior and Inhibition Effect of MnS, MnSe and AlN in 3% Si Steel. Tetsu-to-Hagane 2014, 100, 1413–1420. [Google Scholar] [CrossRef][Green Version]
- Bhattacharya, K.; Conti, S.; Zanzotto, G.; Zimmer, J. Crystal symmetry and the reversibility of martensitic transformations. Nature 2004, 428, 55–59. [Google Scholar] [CrossRef]
- Mapelli, C.; Vedani, M. State of the art in the inclusion control within Ca treated Al-killed steels. Metall. Ital. 2001, 93, 25–30. [Google Scholar]
- Kang, S.E.; Tuling, A.; Banerjee, J.; Gunawardana, W.; Mintz, B. Hot ductility of TWIP steels. Mater. Sci. Technol. 2011, 27, 95–100. [Google Scholar] [CrossRef]
- Wada, H.; Pehlke, R.D. Nitrogen solubility and nitride formation in austenitic Fe-Ti alloys. Metall. Trans. B 1985, 16, 815–822. [Google Scholar] [CrossRef]
- Paek, M.-K.; Jang, J.-M.; Do, K.-H.; Pak, J.-J. Nitrogen solubility in high manganese-aluminum alloyed liquid steels. Met. Mater. Int. 2013, 19, 1077–1081. [Google Scholar] [CrossRef]
- Paek, M.-K.; Jang, J.-M.; Kang, H.-J.; Pak, J.-J. Reassessment of AlN (s) = Al + N Equilibration in Liquid Iron. ISIJ Int. 2013, 53, 535–537. [Google Scholar] [CrossRef]
- Shin, J.H.; Lee, J.; Min, D.J.; Park, J.H. Solubility of Nitrogen in High Manganese Steel (HMnS) Melts: Interaction Parameter between Mn and N. Met. Mater. Trans. A 2011, 42, 1081–1085. [Google Scholar] [CrossRef]
- Kim, D.-H.; Jung, M.-S.; Nam, H.; Paek, M.-K.; Pak, J.-J. Thermodynamic Relation between Silicon and Aluminum in Liquid Iron. Met. Mater. Trans. A 2012, 43, 1106–1112. [Google Scholar] [CrossRef]
- Chen, J. Data Book of Steelmaking; Metallurgical Industry Press: Beijing, China, 2010; pp. 758–761. [Google Scholar]
- Jang, J.-M.; Seo, S.-H.; Jiang, M.; Paek, M.-K.; Wang, X.; Pak, J.-J. Nitrogen solubility in liquid Fe–C alloys. ISIJ Int. 2014, 54, 32–36. [Google Scholar] [CrossRef]
- Jang, J.-M.; Seo, S.-H.; Kim, Y.-D.; An, H.-J.; Pak, J.-J. Effect of Carbon on Nitrogen Solubility and AlN Formation in High Al Alloyed Liquid Steels. ISIJ Int. 2014, 54, 1578–1583. [Google Scholar] [CrossRef]
- Narita, K. Physical chemistry of the groups IVa (Ti, Zr), Va (V, Nb, Ta) and the rare earth elements in steel. Trans. Iron Steel Inst. Jpn. 1975, 15, 145–152. [Google Scholar] [CrossRef]
- Andrade, H.; Akben, M.; Jonas, J. Effect of molybdenum, niobium, and vanadium on static recovery and recrystallization and on solute strengthening in microalloyed steels. Metall. Trans. A 1983, 14, 1967–1977. [Google Scholar] [CrossRef]
- Balasubramanian, K.; Kirkaldy, J. Thermodynamics of Fe-Ti-C and Fe-Nb-C Austenites and Nonstoichiometric Titanium and Niobium Carbides. Adv. Phase Transit. 1988, 51, 37–51. [Google Scholar] [CrossRef]
- Mori, T.; Tokizane, M.; Yamaguchi, K.; Sunami, E.; Nakazima, Y. Thermodynamic Properties of Niobium Carbides and Nitrides in Steels. Tetsu-to-Hagane 1968, 54, 763–776. [Google Scholar] [CrossRef]
- Palmiere, E.; Garcia, C.; De Ardo, A. Compositional and microstructural changes which attend reheating and grain coarsening in steels containing niobium. Metall. Mater. Trans. A 1994, 25, 277–286. [Google Scholar] [CrossRef]
- Yong, Q. Precipitates in Iron and Steel; Metallurgical Industry Press: Beijing, China, 2006; Volume 15, pp. 141–171. [Google Scholar]


Publisher’s Note: MDPI stays neutral with regard to jurisdictional claims in published maps and institutional affiliations. |
© 2021 by the authors. Licensee MDPI, Basel, Switzerland. This article is an open access article distributed under the terms and conditions of the Creative Commons Attribution (CC BY) license (http://creativecommons.org/licenses/by/4.0/).