Article

Removal of Copper, Nickel, and Iron from Lead–Tin Composite by Segregation of Intermetallic Silicon Phases

1
BSB Recycling GmbH, IME Institute for Process Metallurgy and Metal Recycling, Emser Straße 11, 56338 Braubach, Germany
2
IME Institute for Process Metallurgy and Metal Recycling, RWTH Aachen University, Intzestr. 3, 52056 Aachen, Germany
*
Author to whom correspondence should be addressed.
This author is the Principal Investigator.
Metals 2021, 11(1), 81; https://doi.org/10.3390/met11010081
Submission received: 27 November 2020 / Revised: 22 December 2020 / Accepted: 24 December 2020 / Published: 2 January 2021
(This article belongs to the Special Issue 10th Anniversary of Metals: Metallurgy and Metal Technology)

Abstract

:
In the reduction stage of the secondary copper production process, copper, nickel, lead, and tin are collected in a “black copper”, while zinc is volatilized and precipitated as ZnO in the flue dust. The slag coming from this reduction stage is low in valuable metals and is disposed. In the conversion stage, lead and tin are oxidized and incorporated in the slag phase; in accordance with the oxygen potential, this “converter slag” also contains higher contents of copper and nickel. This slag is then reduced in two stages. From the first stage, a copper–nickel metal is returned to the converter stage, and in the second stage, a crude PbSn composite with copper contents of around 10% and nickel contents of around 2.5%, as well as a further usable slag, is obtained from the “secondary” slag. Iron is used as a reducing agent, so that the metal obtained can contain iron of up to over 10%, depending on the reduction duration. The motivation of this investigation is to provide a method for the subsequent refining of the raw PbSn composite, with the aim of obtain a saleable PbSn composite as well as returning the copper and nickel contents quantitatively to the main copper route or to sell them as an alloy. Therefore, the present work aims to investigate the refining of the raw PbSn composite by the separation of the copper, nickel, and iron via the segregation of intermetallic phases. For that, a series of experiments were performed on the formation and subsequent segregation of intermetallic phases, by introduction of an additional element to the system. The results indicated sharper separation of PbSn composite and copper, nickel, and iron due to the higher thermodynamic stability of these phases (selectivity).

1. Introduction

During the reduction stage conducted in the secondary copper production process, the metals copper, nickel, lead, and tin are collected in the black copper. Zinc, on the other hand, is volatilized and later precipitates as ZnO in the flue dust. The slag formed during this reduction stage is disposed, as it contains low amounts of valuable metals [1].
Later on, the lead and tin are oxidized and incorporated in the slag phase during the conversion stage. In accordance with the oxygen potential, this formed slag phase also contains higher amounts of copper and nickel. Being a valuable source of material, the formed slag is then reduced via two stages. From the first stage, a copper–nickel metal is returned to the converter. In the second reduction stage, a crude PbSn composite (containing 10% Cu and ∼2.5% Ni) and a further usage slag are obtained. Moreover, as iron is used as reducing agent, up to 10% iron can be present in the obtained metal. The obtained raw PbSn composite is then refined with the aim of obtained a saleable material as well as to return the copper and nickel back into the process chain or sell it as an alloy [1].
Previous investigations in the field of metal separation has shown that minority components can be removed from lead–tin–copper melts by adding metals. The added metal is supposed to form intermetallic phases with the minority components, which are insoluble in the base metal and can be separated by segregation [1,2,3,4,5,6].
A metalloid that has a great affinity to the metals of the iron group (e.g., Fe, Ni, and Co) is silicon. It forms intermetallic phases with these metals, which should be separable by segregation if the base melt does not form any compounds with the silicon [7]. Here, the low density of silicon (2.33 g/cm 3 ), and thus of the intermetallic phase formed with silicon, is helpful.
In the processing of the second-stage converter slag, so-called “Glanzmetall”, which consists of lead (10%), antimony (25%), tin (30%), and copper (35%), the copper content could be reduced by 95 to 98% of the initial content by performing a one- or two-step addition of silicon, followed by phase separation via segregation. By increasing the number of treatment steps, more than 99% of the copper could be separated. Already in the first treatment step, 95% of the copper could be converted into a silicide phase containing low amounts of lead, tin, and antimony [2,8].
To remove cobalt and nickel from lead–tin-based alloys by using a “solution metal”, the effectiveness of silicon as a purification reagent was tested. Lead–tin alloys containing iron, nickel, and cobalt with different Pb/Sn ratios were treated with silicon at 1250 C. In addition to iron, nickel and cobalt were also converted into an iron–silicon phase, which separated from the remaining lead–tin phase. The distribution coefficients, determined by the equation L X = % X ( F e S i ) / % X ( S n P b ) , show that the increasing tin content of the melt has a decreasing effect on the distribution coefficients (see Table 1) [9].
This investigation also dealt with the influence of different silicon amounts added to a lead–tin–nickel melt (see Table 2). Through the reaction at 1250 C, a Ni–Si phase and a lead or lead–tin phase were formed. It is clear that the distribution coefficient for nickel increases strongly with increasing silicon addition. The investigation also shows the significant decrease of the distribution coefficient with increasing tin content of the melt.
For the thermodynamic consideration of the formation of intermetallic phases of copper, nickel and iron with silicon and of copper and nickel with tin, most of the data available are only related to their respective binary systems. For these systems, the melt is considered to be homogeneous and values for the free partial enthalpy, free enthalpy, and enthalpy are determined [10,11,12]. The values allow the calculation of the activity for silicon and tin in the respective melt, the estimation of the possibility of certain reactions taking place and the estimation of the resulting heat effects. The negative free enthalpy values show a clear tendency towards the formation of compounds for nickel, iron, and copper with silicon, and a much weaker tendency for copper with tin.
The free enthalpy values suggest the sequence nickel, iron, and copper when removed from PbSn composite by the formation of intermetallic phases with silicon. Only then does the formation/separation of a Cu–Sn phase occur. The negative enthalpy values for Ni–Si and Fe–Si clearly indicate an exothermic reaction process, which—although weaker—still occurs with Cu–Si.

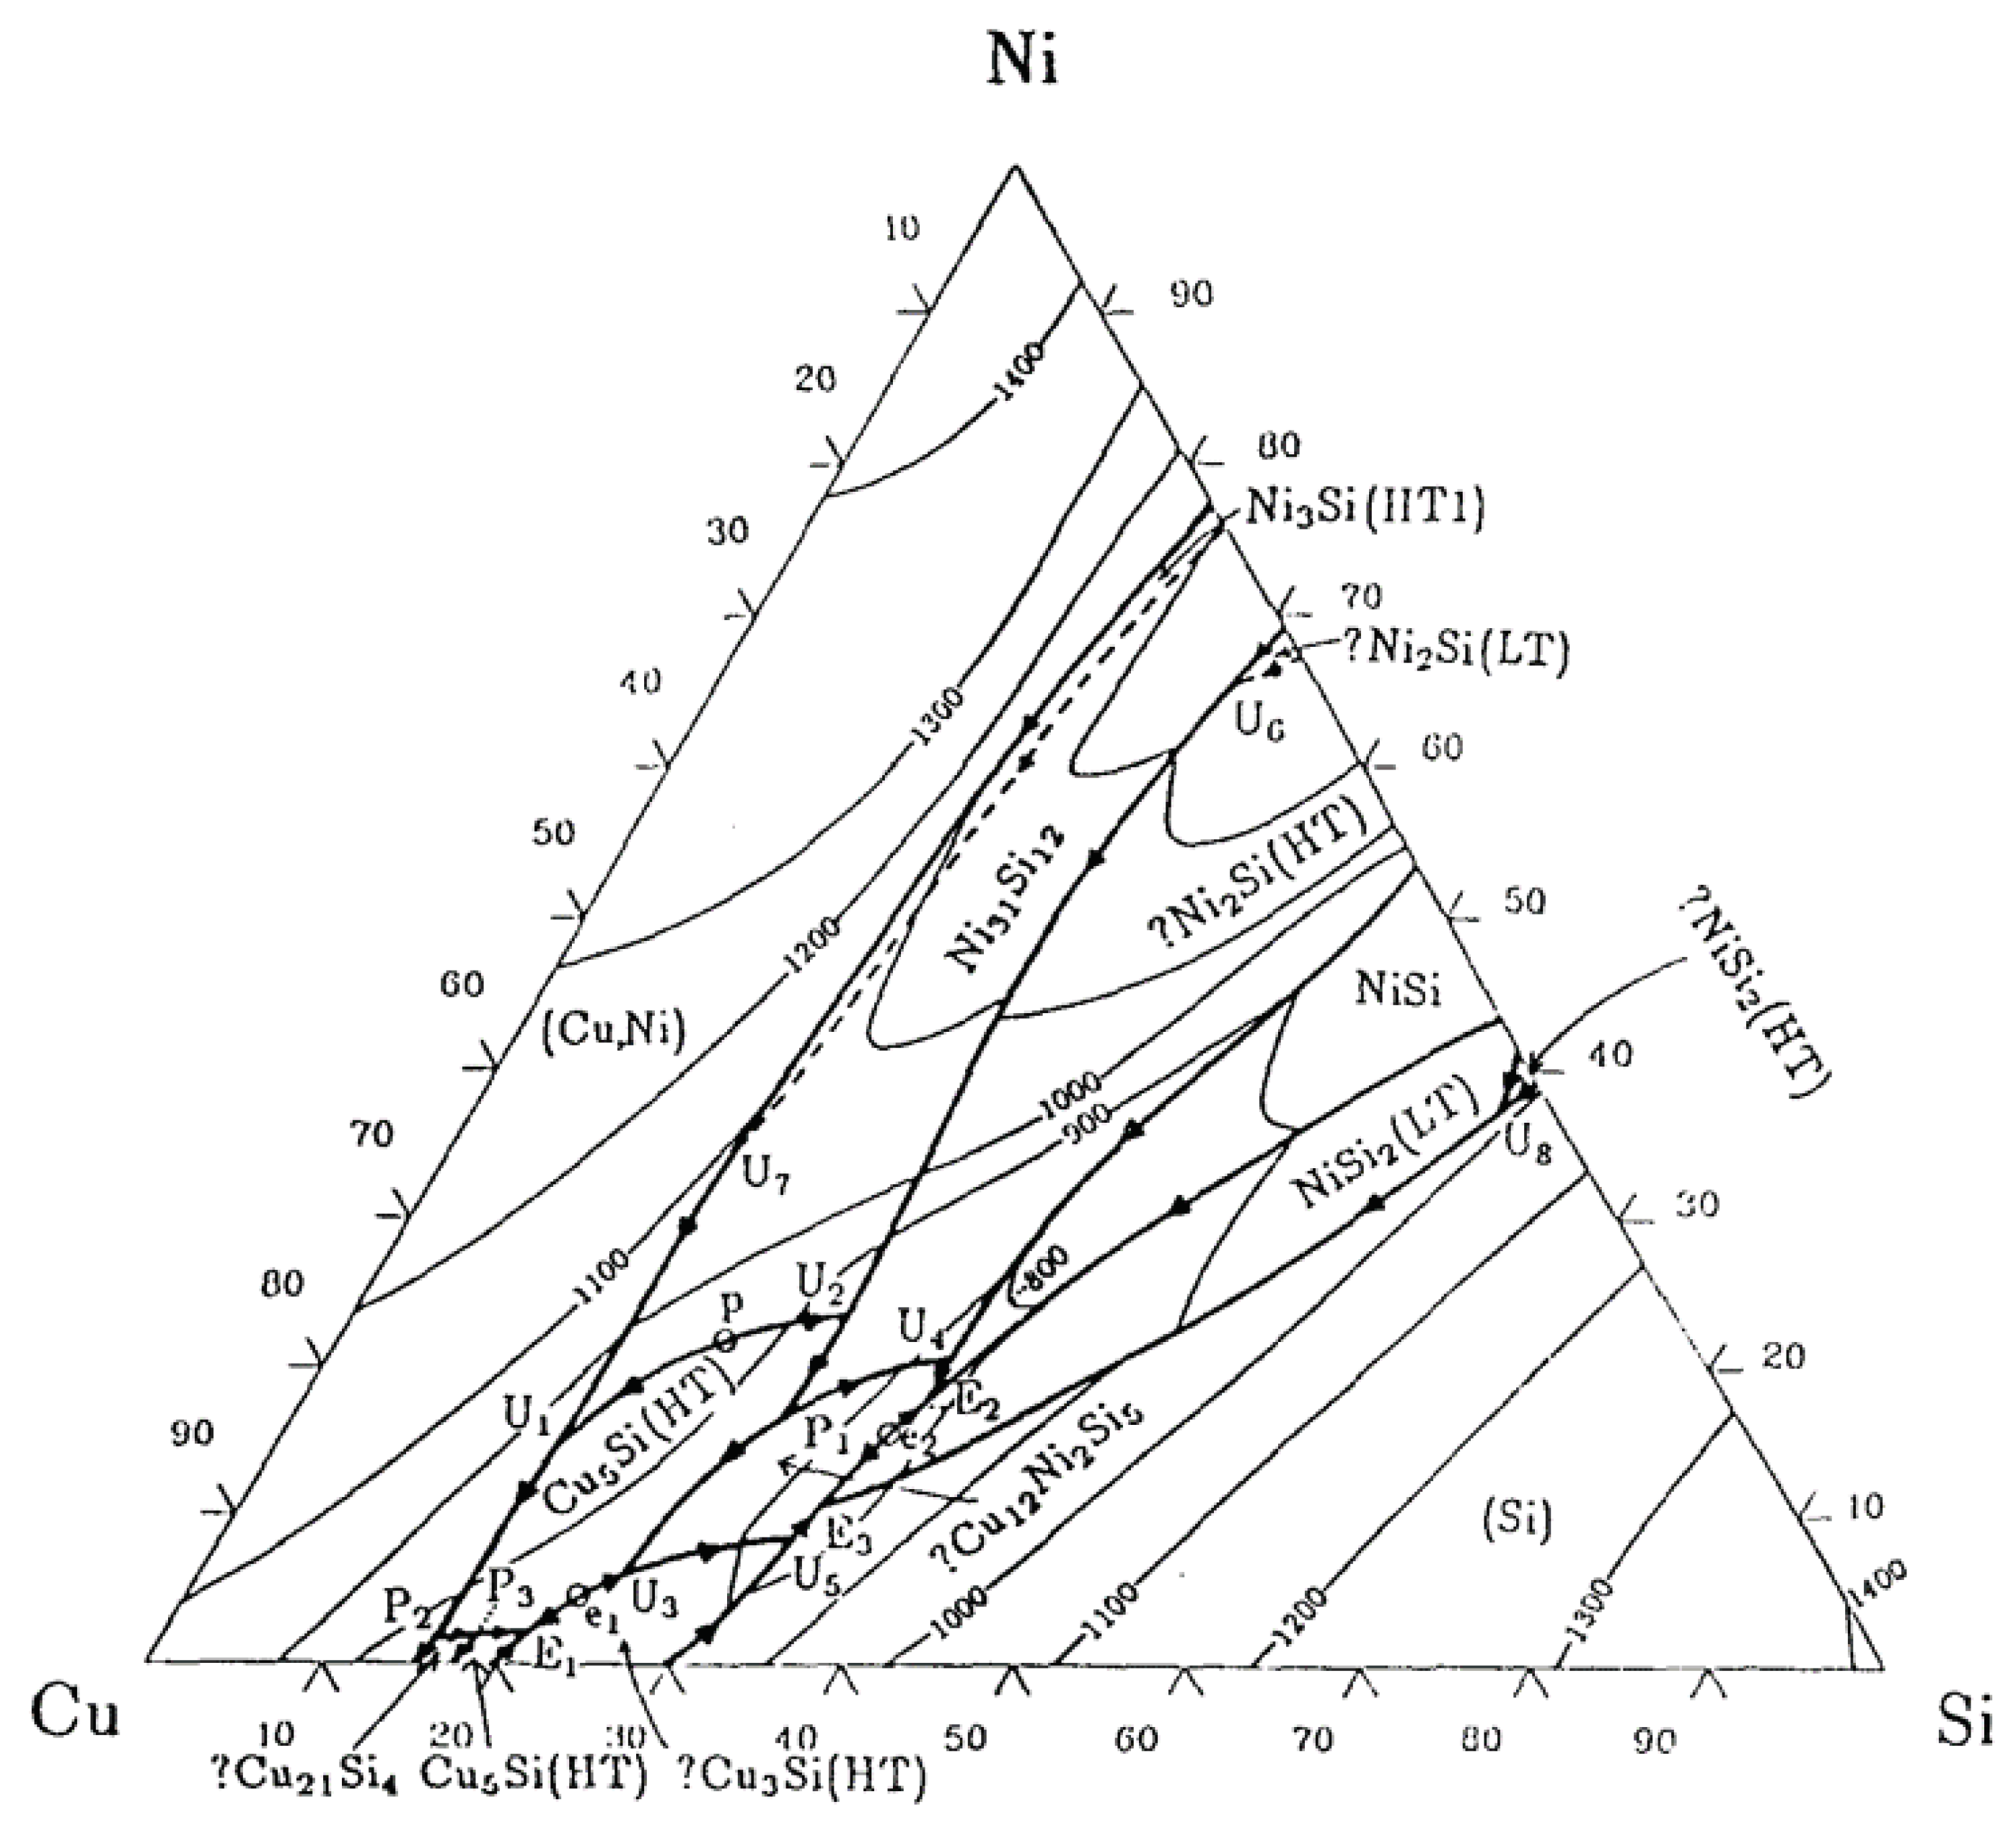
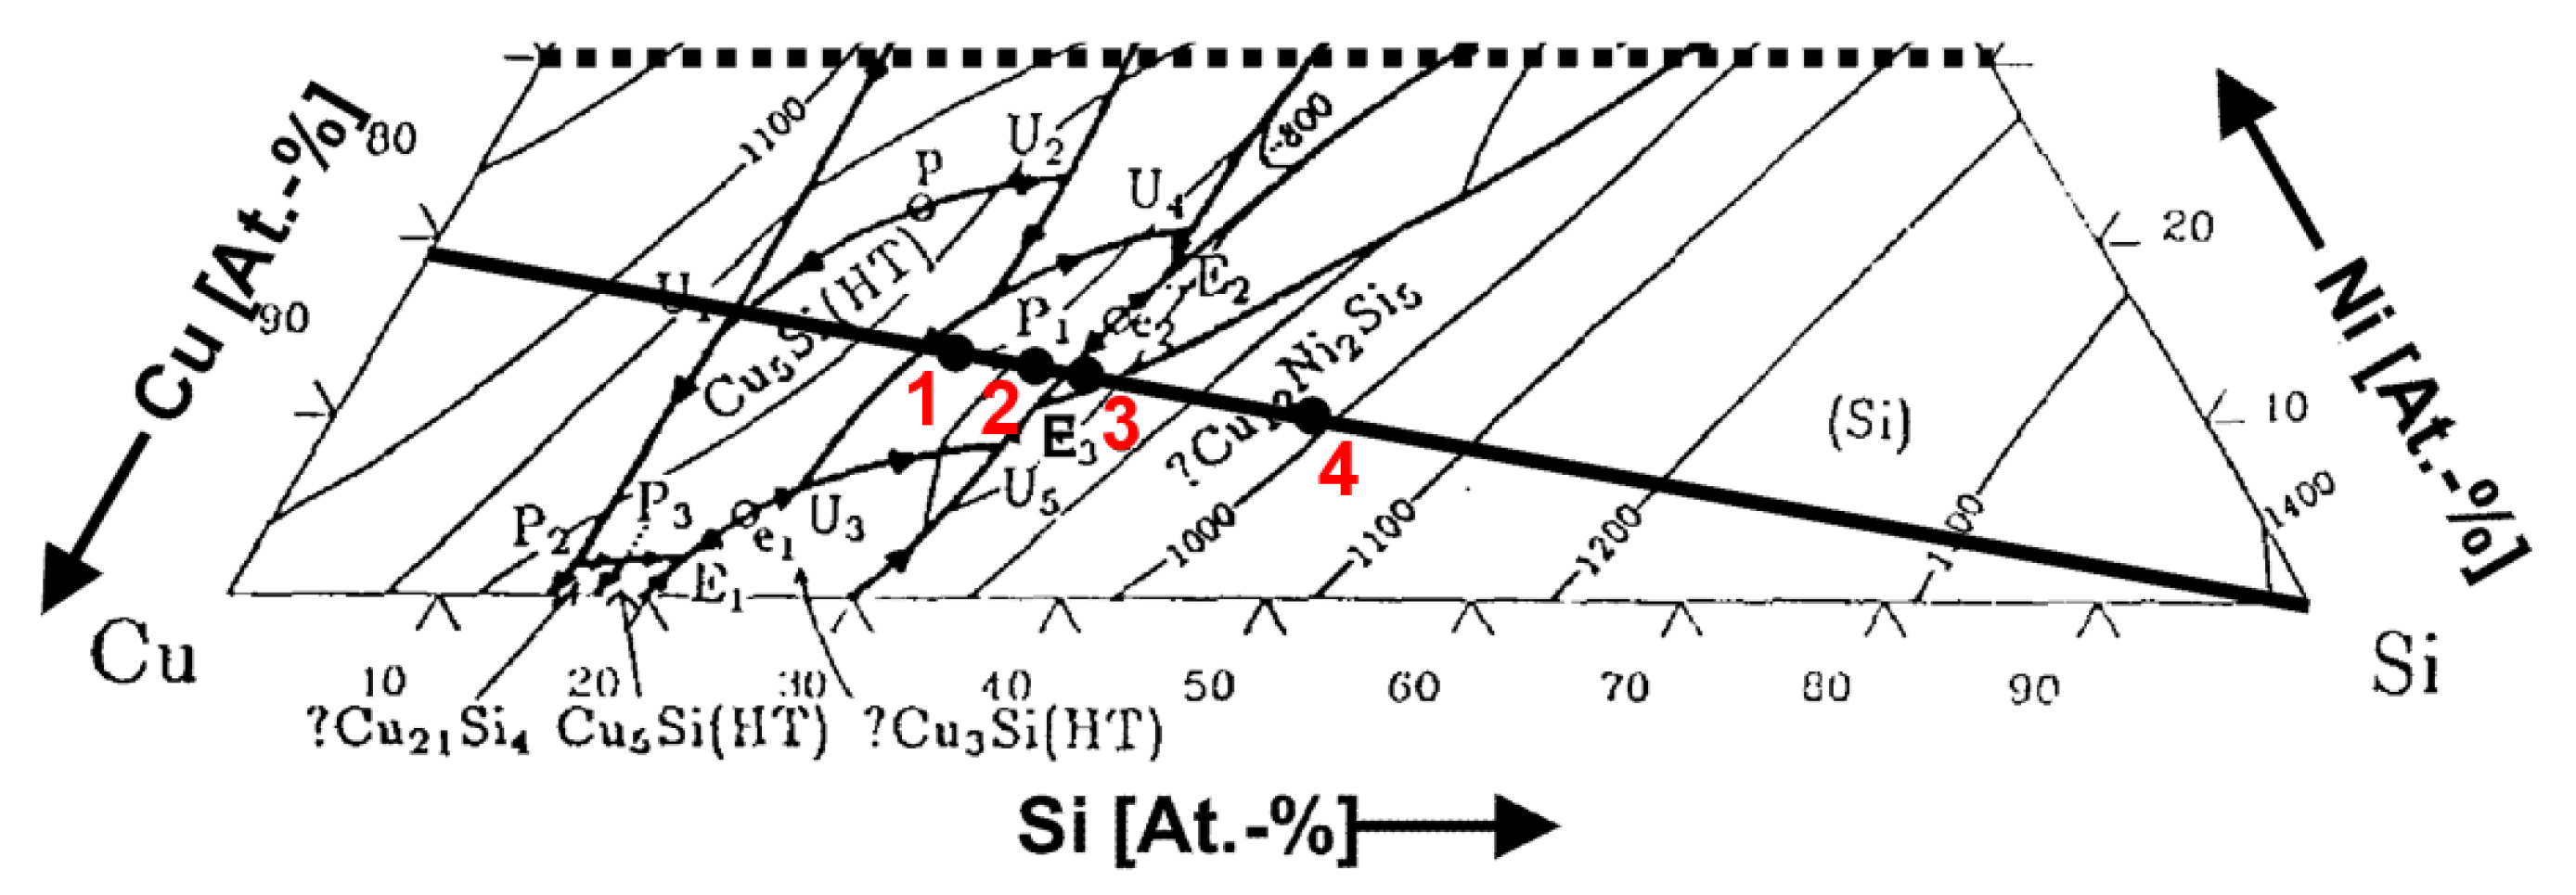
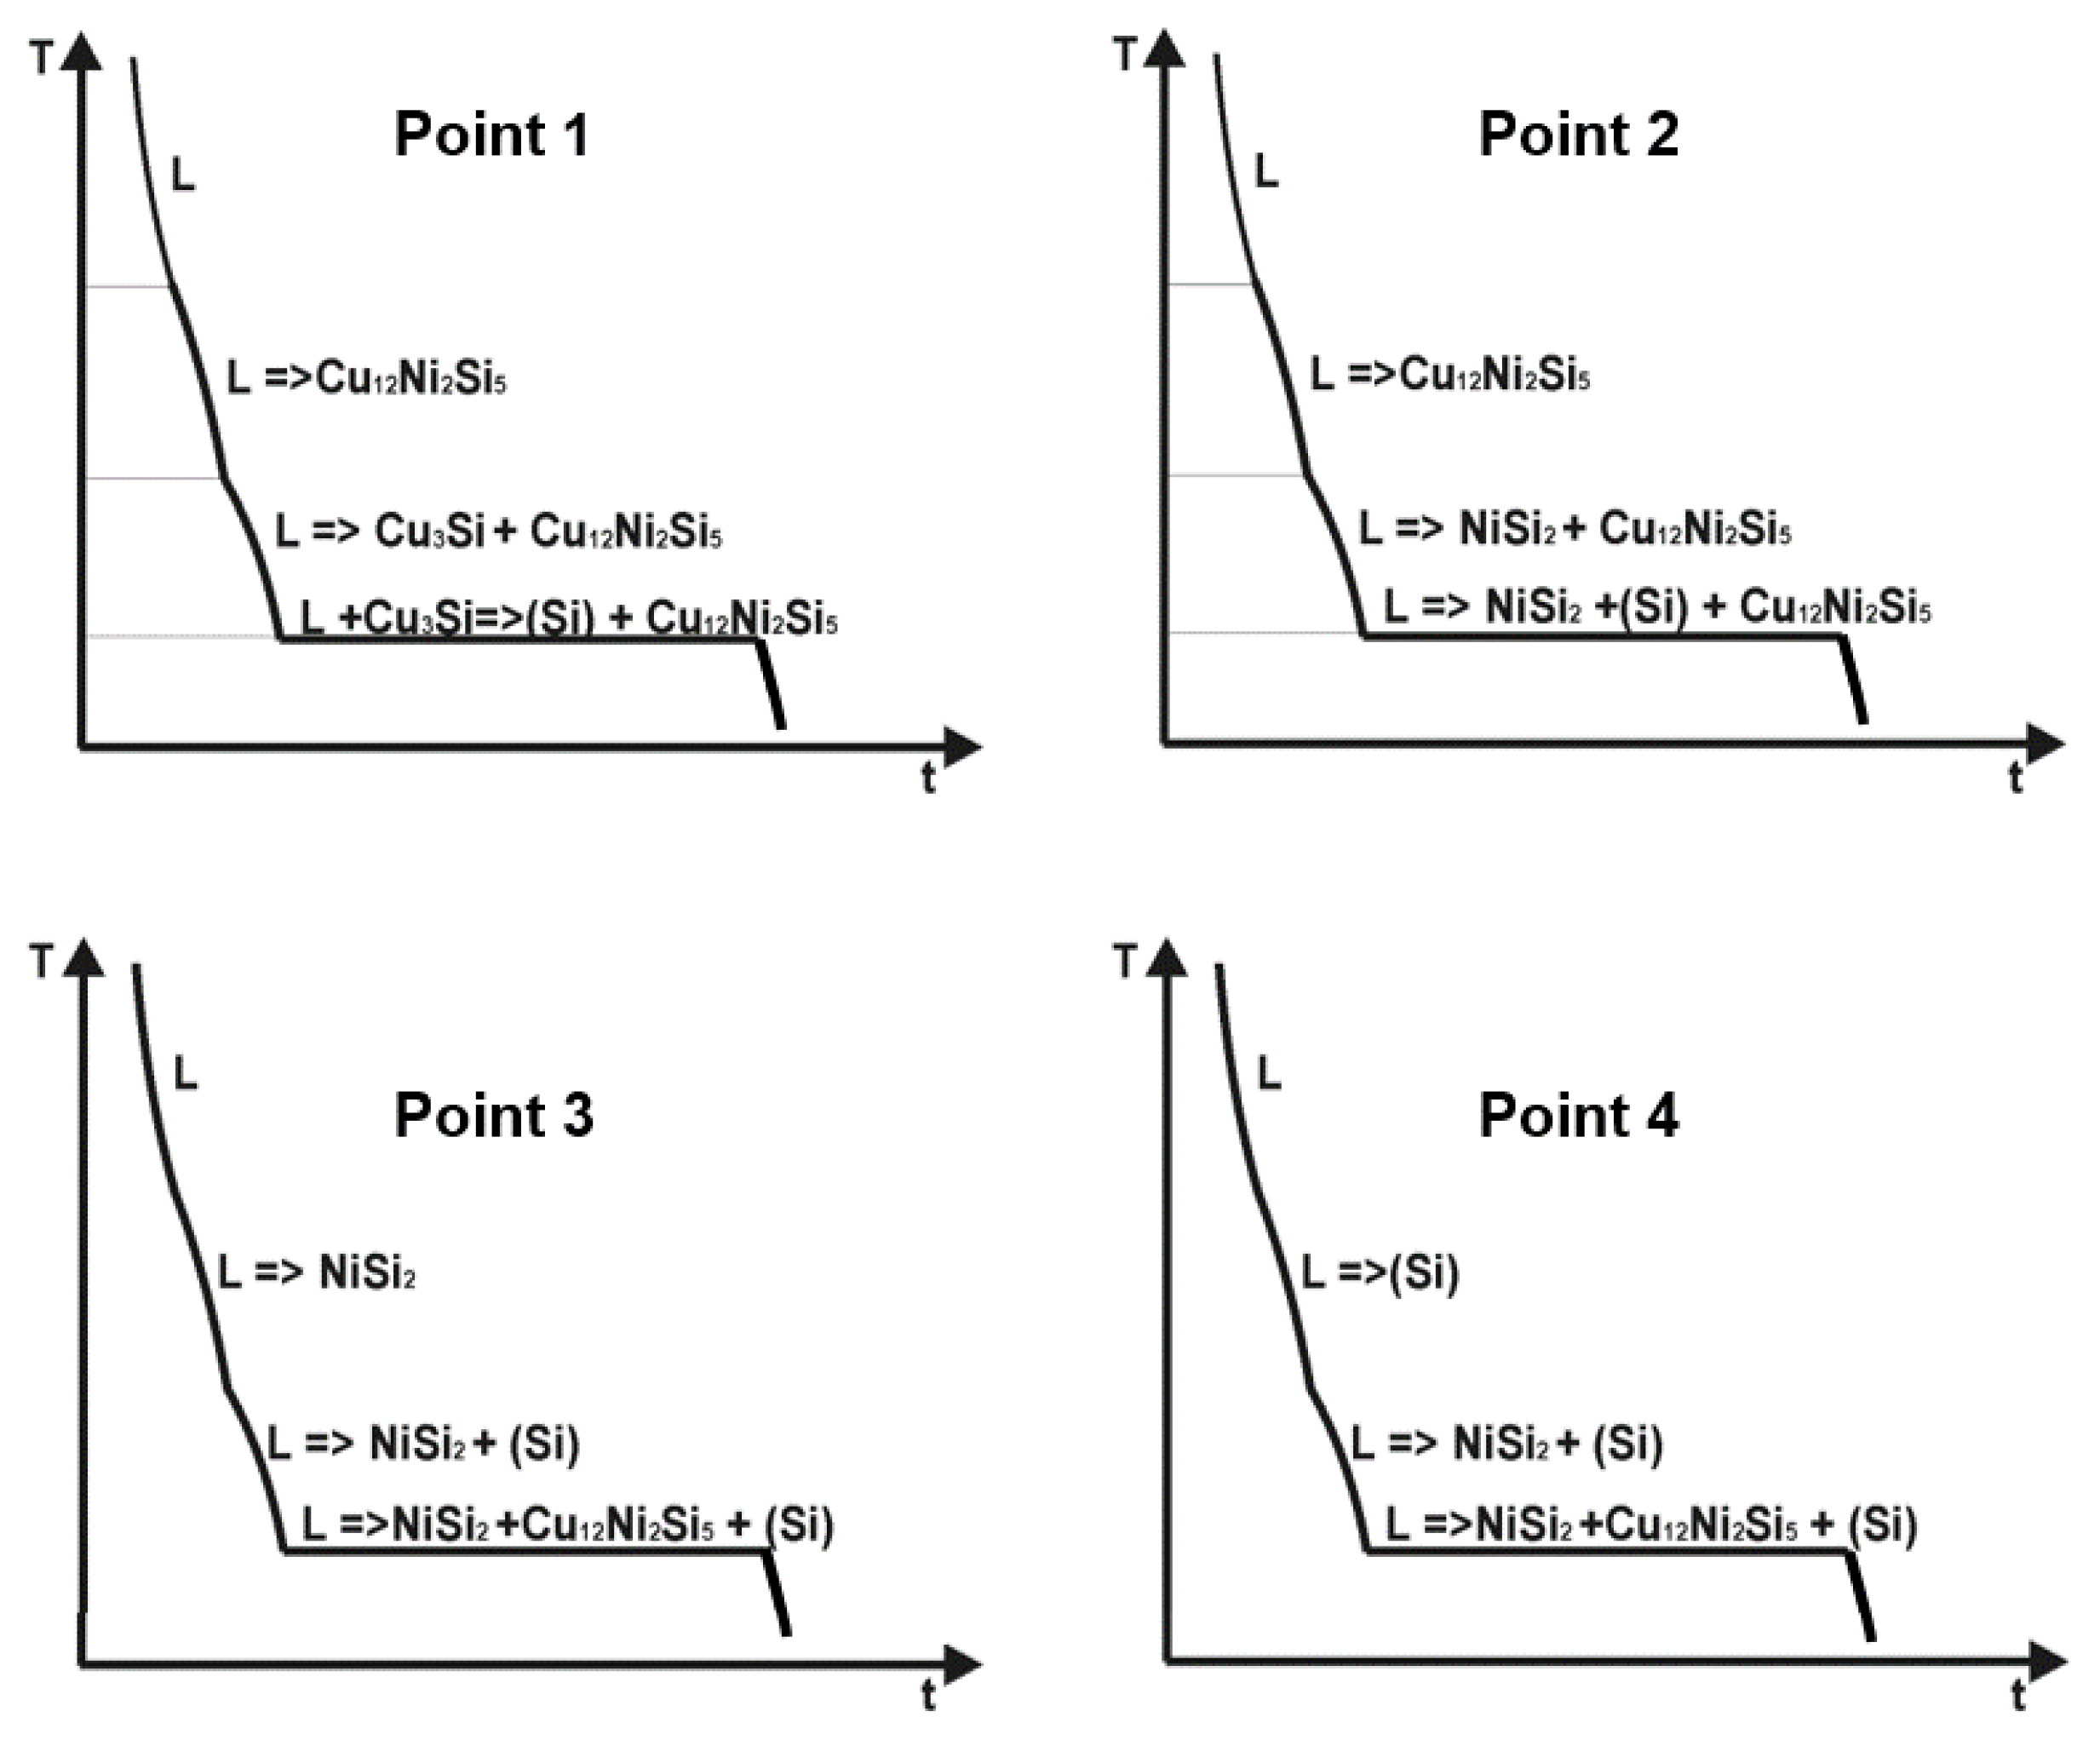
The Copper-Nickel-Silicon Three-Component System

A review of the published information on the three-component system copper–nickel–silicon [13] shows that ternary intermetallic phases were not found in all cases. From the few available data, it can be concluded that the nickel silicides have a solubility for copper and the copper silicides for nickel. The sections Cu-Ni 2 Si, Cu-Ni 3 Si, Cu-NiSi, Cu 3 Si-Ni 3 Si, Cu 3 Si-NiSi are not quasibinary, as at least one true intermetallic phase (Cu 12 Ni 2 Si 5 ) is formed. The resulting liquidus projection results is shown in Figure 1 [13,14].
As in the present work a fixed copper–nickel ratio (82.1/17.9) is used in the PbSn composite, the following explanations are limited to the line from the given copper—nickel ratio to the silicon corner (Figure 2). Within the scope of this investigation, silicon ratios between 17.5 wt.% and 40 wt.% based on the copper and nickel quantities have been selected.
If one calculates the composition in atomic percent for the minimum and maximum silicon content, the results can be drawn as the points 1 and 4 in the ternary state diagram from Figure 2.
At points 1 and 2, a primary crystallization of Cu 12 Ni 2 Si 5 is expected, while at points 3 and 4, a primary crystallization of NiSi 2 and Si occurs, respectively. In the following, the expected cooling curves for the maximum and minimum silicon turnover are shown in a highly simplified form (Figure 3, points 1 and 4). Points 2 and 3 show compositions for which a significant change in the cooling curve and thus in the microstructure is to be expected. The resulting phases are Si, Cu 12 Ni 2 Si 5 , NiSi 2 , and Cu 3 Si.

2. Materials and Methods
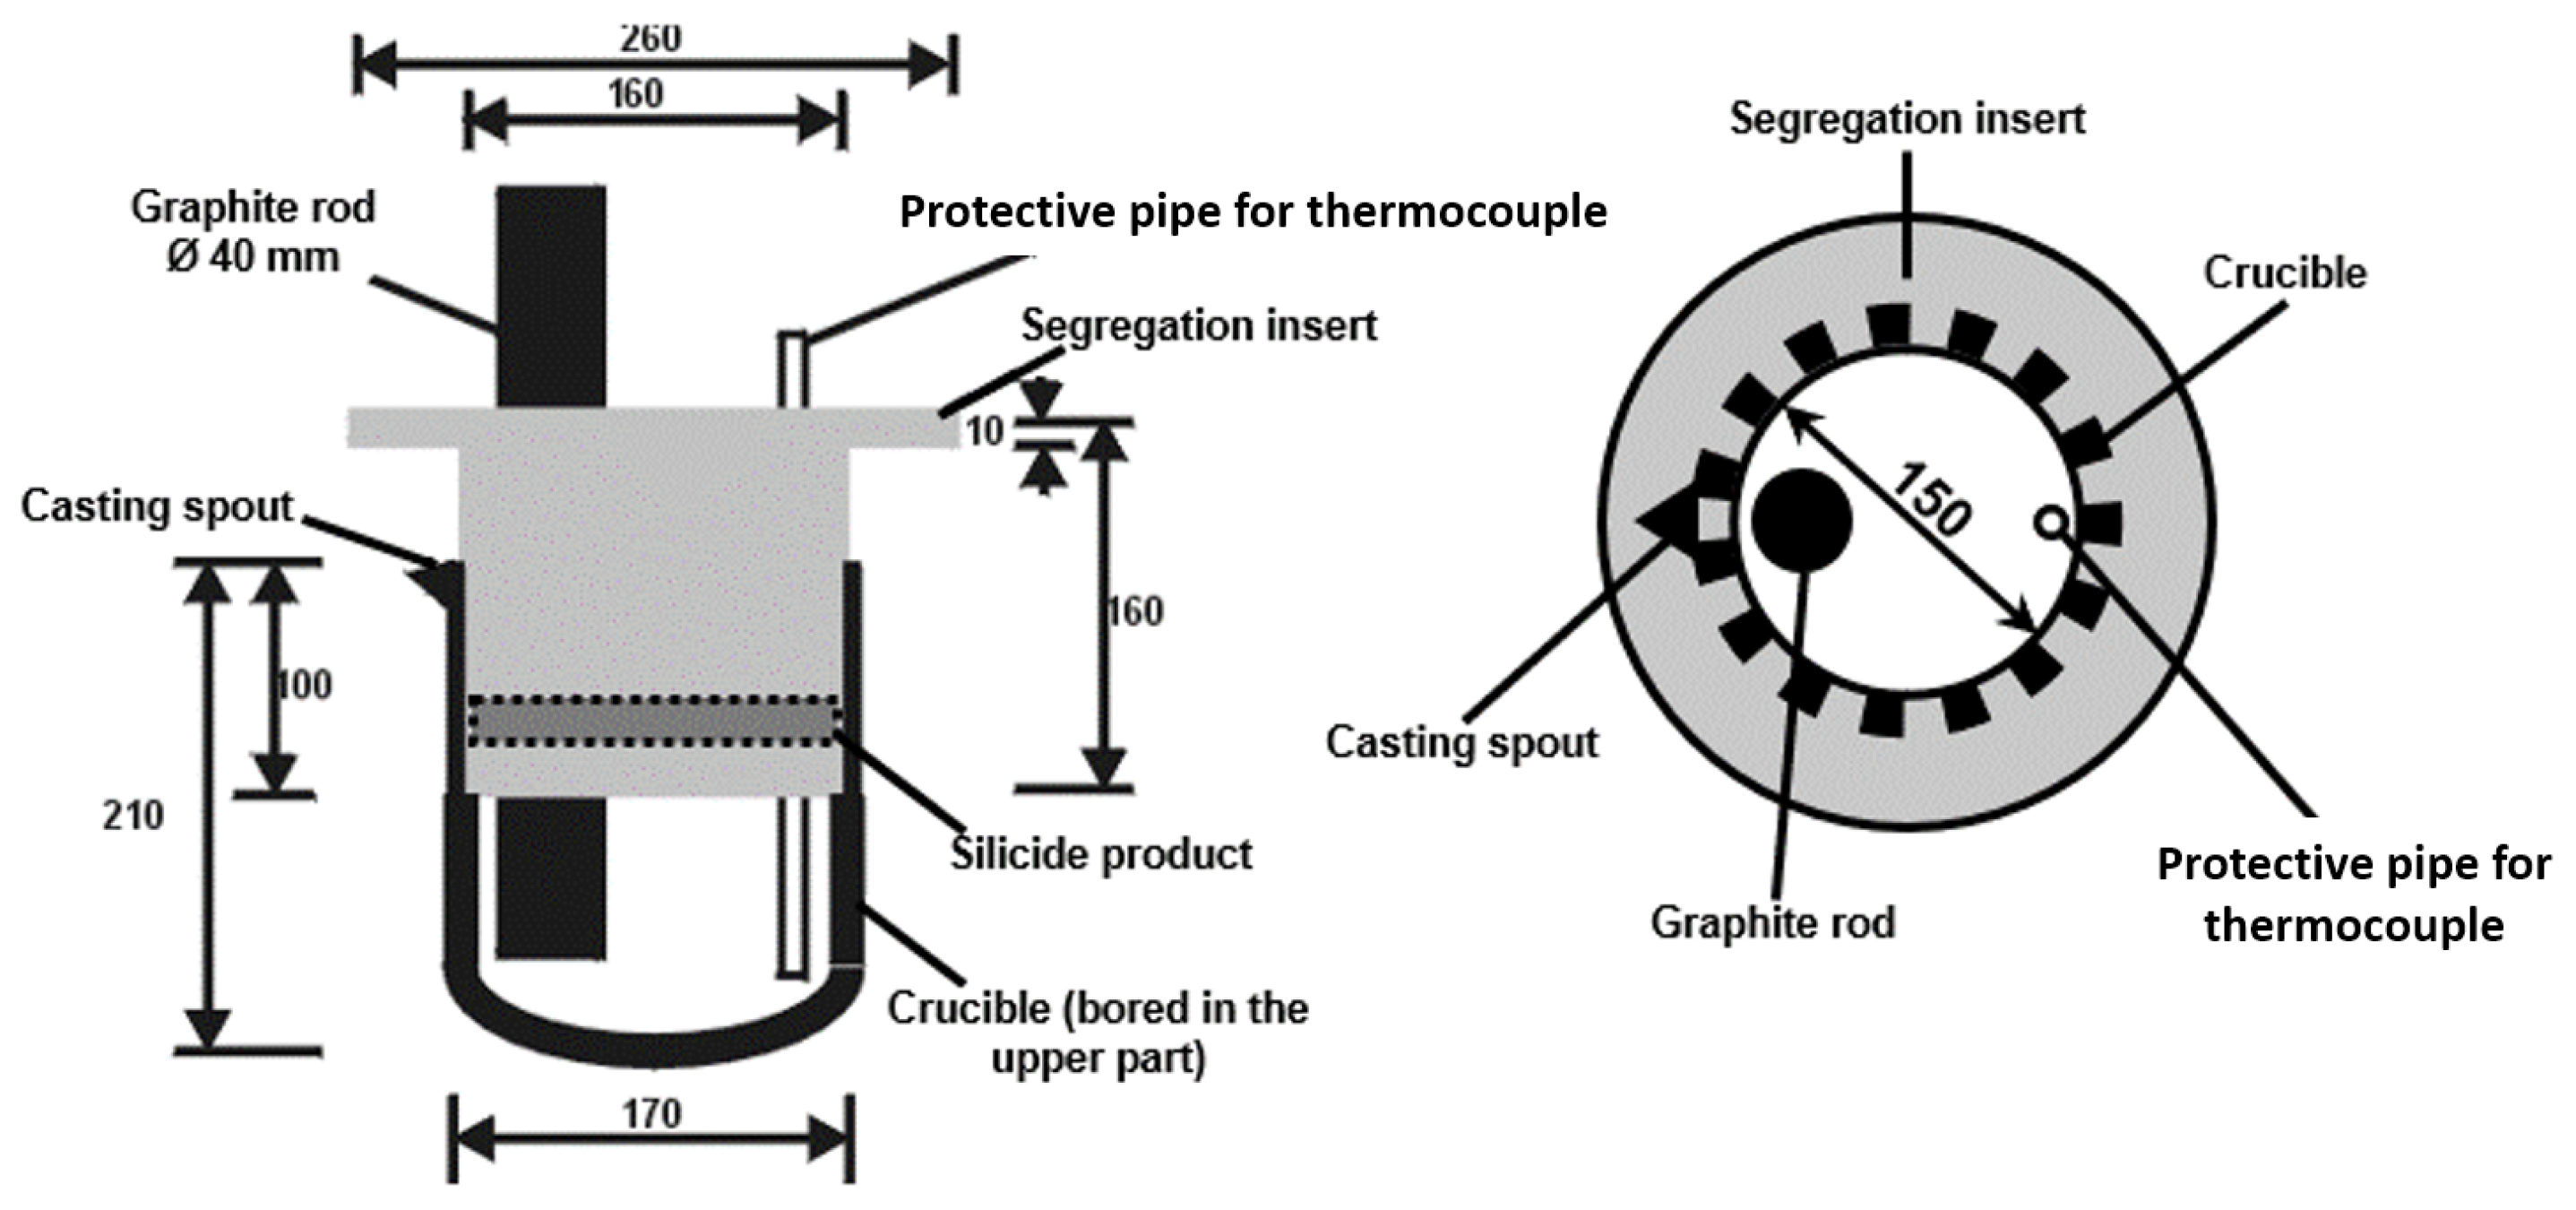
2.1. Pilot Plant

The first experimental step consists of the melting and the silicon treatment, followed by a second step for the separation of the phases by segregation. Both processes were conducted under normal air atmosphere.
A cold wall vacuum induction furnace was used for the melting process and for the subsequent silicon treatment. As the silicon has a significantly lower density than the prepared PbSn composite melt, it could not be properly introduced into the melt even by inductive stirring. Therefore, the silicon was introduced by mechanically mixing it into the melt.
For the segregation process, an insulated resistance-heated muffle furnace (Nabertherm chamber furnace) was used to set a reproducible and sufficiently slow cooling rate. After the silicon had been added and dissolved, the melt was poured into a second preheated clay–graphite crucible with a graphite insert (electrode quality graphite, max impurity of 200 ppm ash content), due to the volume expansion of silicon (for pure silicon about 8% volume increase) or of silicon-containing alloys occurring during solidification. The graphite insert was arranged in such a way that the solidifying silicides floating on the melt were retained and could be removed with the help of a graphite rod (Figure 4). The remaining PbSn composite melt could then be poured off without any problems.

2.2. Experimental Plan and Methodology

With regard to the silicon input, attention was paid to ensure that an intermetallic phase could form. The temperature for the end of the segregation should be as high as possible to allow further processing of the metal without or with minimum additional heating. The Table 3 shows the experimental plan.
The tests were conducted with 8 kg batches, each with a lead/tin ratio of 69/31, a copper content of 11 wt.%, and a nickel content of 2.5 wt.%. The silicon or FeSi batch was based on the desired formation of the intermetallic phases. The silicon carriers used (1 to 5 mm in size) were preheated to 1100 to 1200 C in an air atmosphere before feeding in order to minimize the temperature shock during the addition.
If one assumes that copper and nickel are completely removed, then, according to the above-mentioned ternary system, NiSi 2 , Cu 12 Ni 2 Si 5 (with the exception of 17.5 wt.% Si addition) are formed by the addition of the investigated silicon additives. In theory, the silicide product formed has a composition of 67.5 weight percent copper, 15.3 weight percent nickel, and 17.2 weight percent silicon. During this investigation, trials were carried out both with a shortage of silicon (silicon addition 17.5% and 20%) and with significant silicon surpluses (25% to 40%).

2.3. Experimental Procedure

Single-Stage Process Control
After silicon was added, a spontaneous temperature increase to well over 1300 C was recorded after a short time without changes in the power input.
After the silicon particles had dissolved in the melt under stirring (both inductive and mechanical), the formed dross was removed and the melt was poured for segregation into a crucible equipped with the graphite insert, preheated to 1200 C in a muffle furnace. After the metal was poured, a graphite rod ( ϕ 3 cm) was immersed in the melt.
After segregation, the graphite rod was pulled out of the melt. The melt level dropped due to the missing volume displacement and an improved separation of PbSn composite and silicide product was achieved. The silicides solidified in a temperature range between 850 and 750 C. The melt was then further cooled depending on the experimental design. An increase in volume was noticeable in the resulting silicide products. Once the specified temperature for the segregation end had been reached, the graphite insert with the silicide product inside was removed and the melt was then poured into an ingot mold.
Two-Stage Process Control
The silicon addition in the first stage was chosen so that silicon was only offered for the formation of a NiSi 2 phase. After the segregation of the resulting silicide product, the PbSn composite was again superheated to 1300 C. The amount of silicon added in the second stage was then calculated from the difference to the total amount of silicon required.
The first segregation stage was stopped at 900 C because the solidification interval of Ni-Si 2 is already between 980 and 990 C. In the second stage, segregation was continued to 650 C, as the phases formed should be completely eliminated.

3. Results and Discussions

To determine the silicon turnover X S i , the quotient of added silicon and the analyzed copper and nickel contents in the PbSn composite is calculated according to Equation (1). All chemical analyses were conducted by ICP-OES, model Spectro ICP-OES Spectro Ciros Vision.
X S i = m S i / F e S i a d d i t i o n S i m M Z C u + m M Z N i
For the evaluation of the results, the proportion of silicon that is actually available for the segregation of copper and nickel is referred to in the following as “available” silicon. The “available” silicon is calculated from the added silicon (silicon addition) minus all product materials not included in the segregation process, such as dross or residues remaining in the crucible.
The percentage of “available” silicon is calculated by the quotient of the silicon available (analytically detectable) in the PbSn composite at the start of segregation and the copper and nickel contents analytically detectable at the start of segregation. As a rule, this value is lower than the value for the silicon conversion due to losses caused by dross formation.
The calculation of the “available” silicon for the tests with FeSi addition is calculated analogously, taking into account the silicon bound to iron. For this purpose, the assumption is made that all the iron remains intermetallically bound as FeSi and passes through the process quasi inert without reaction. This means that a part of the silicon becomes “ineffective” in addition to the above-mentioned losses.

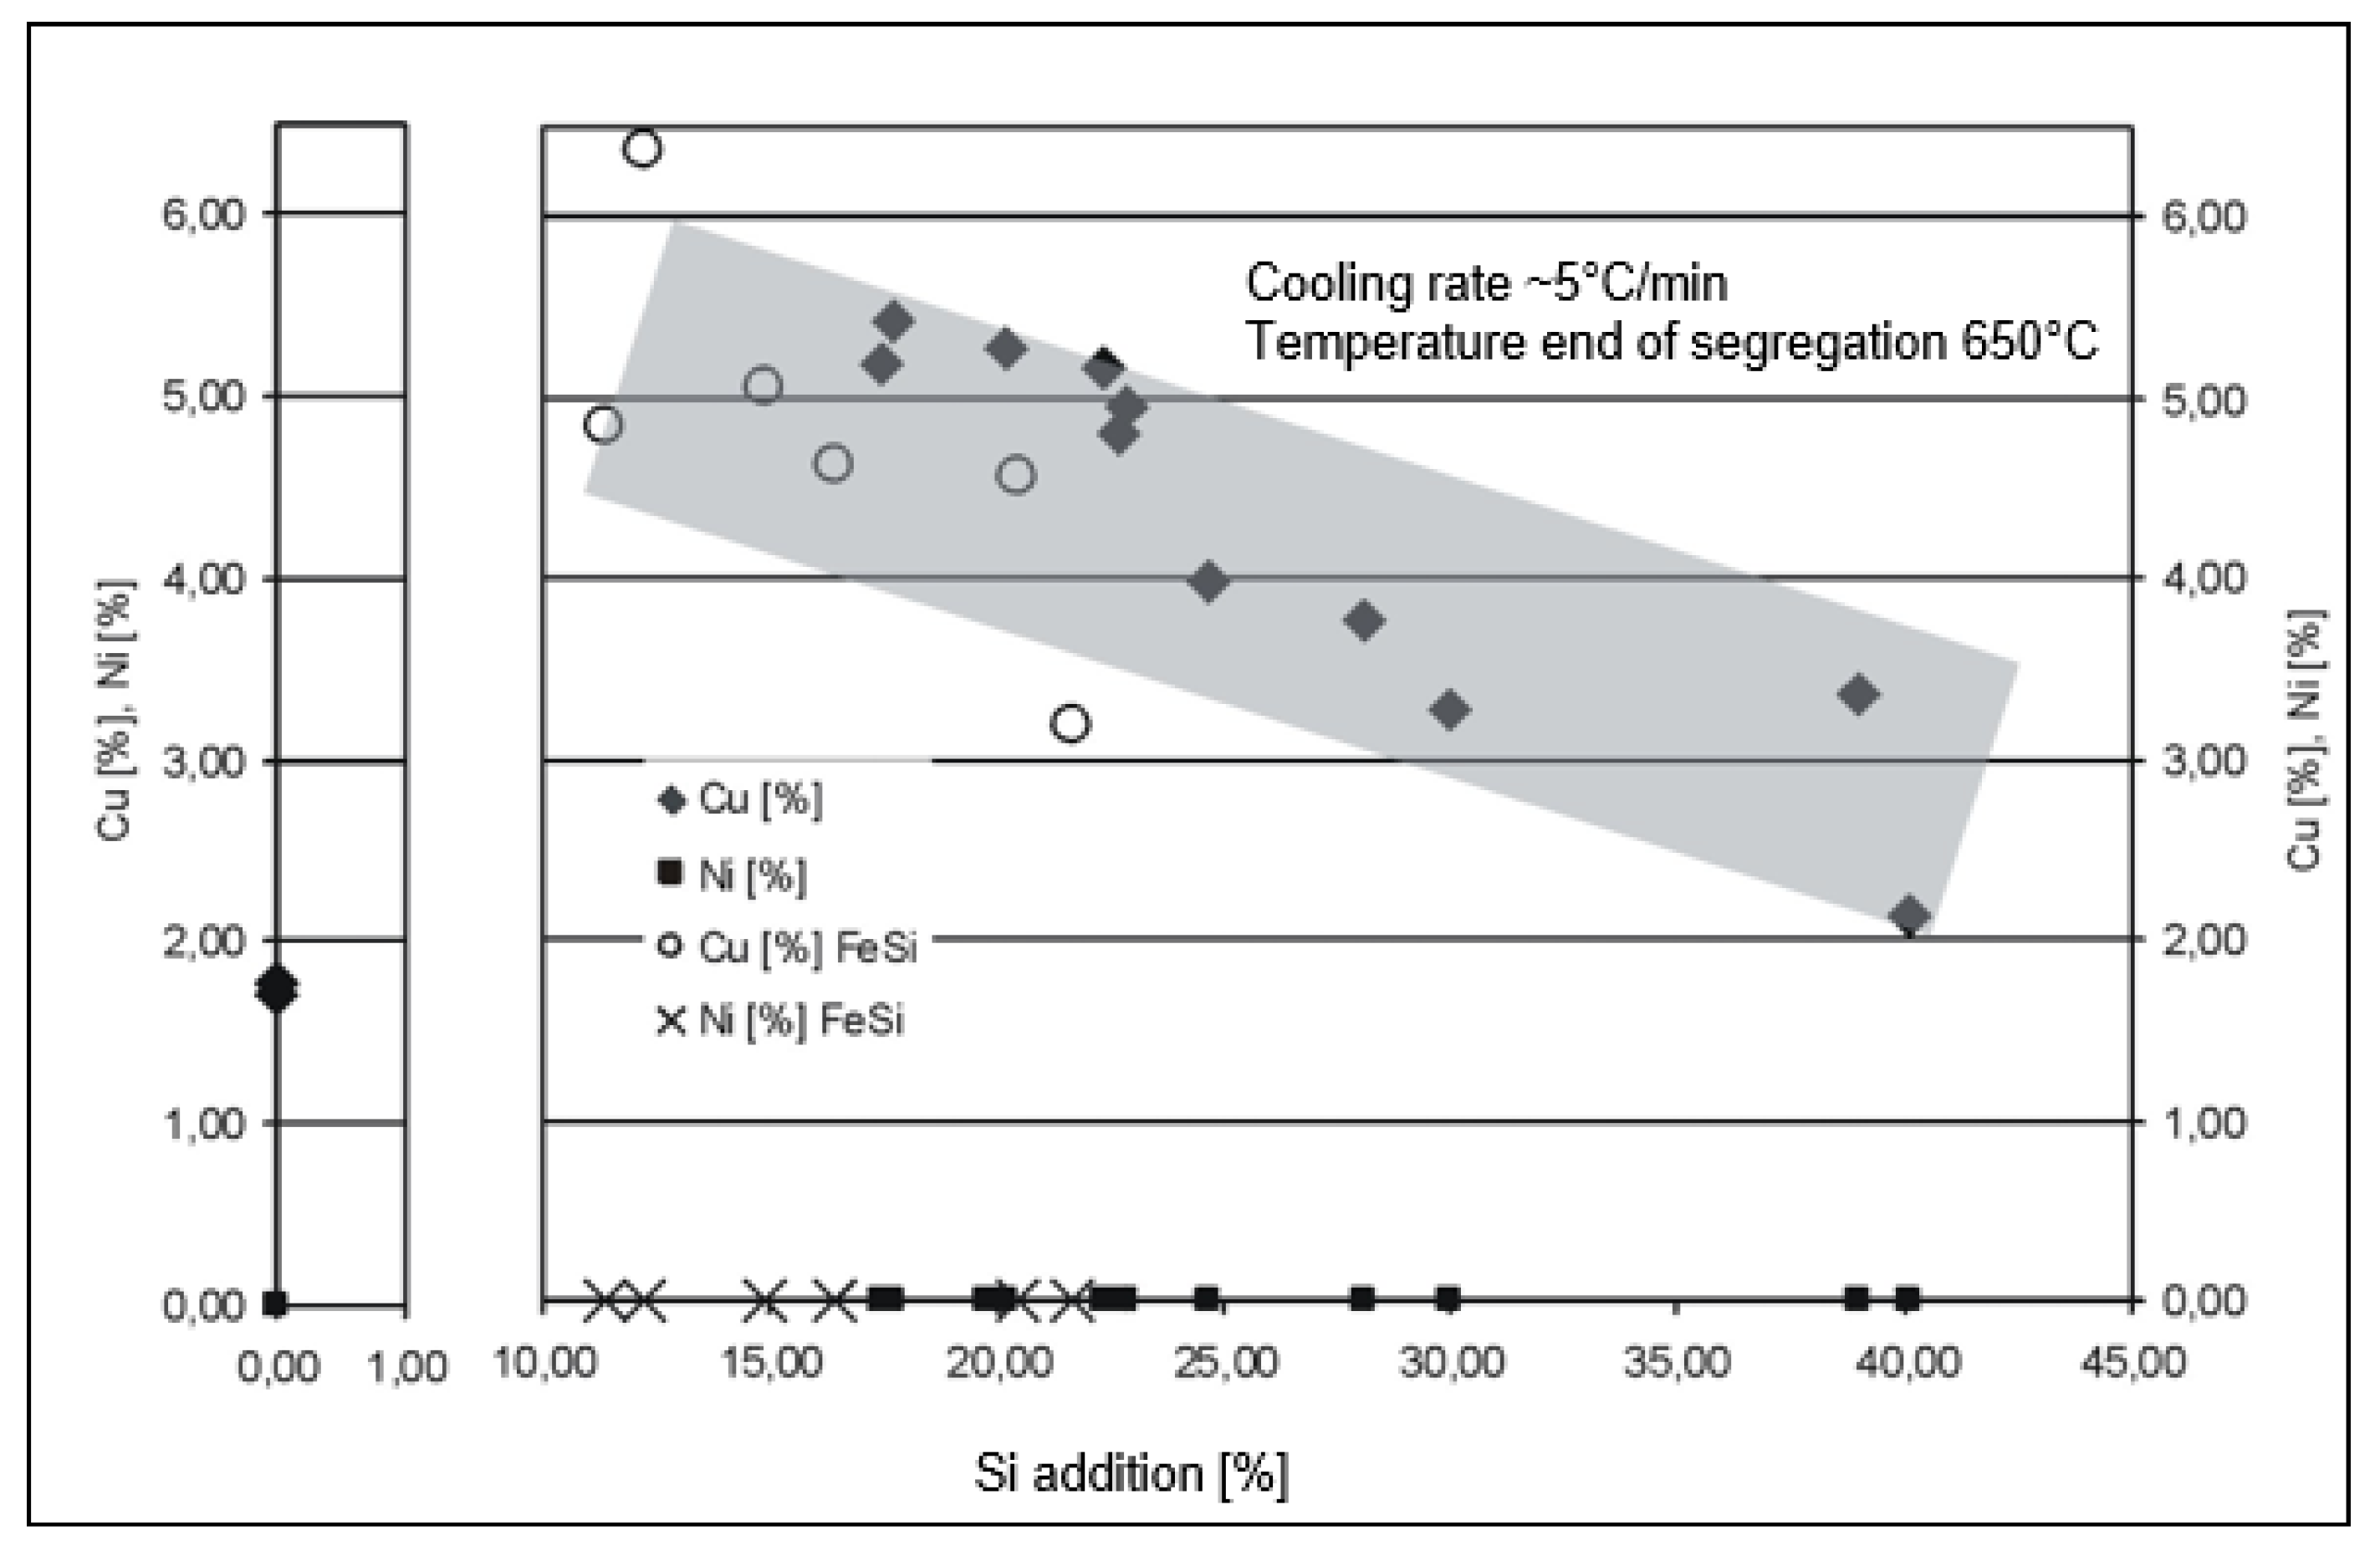
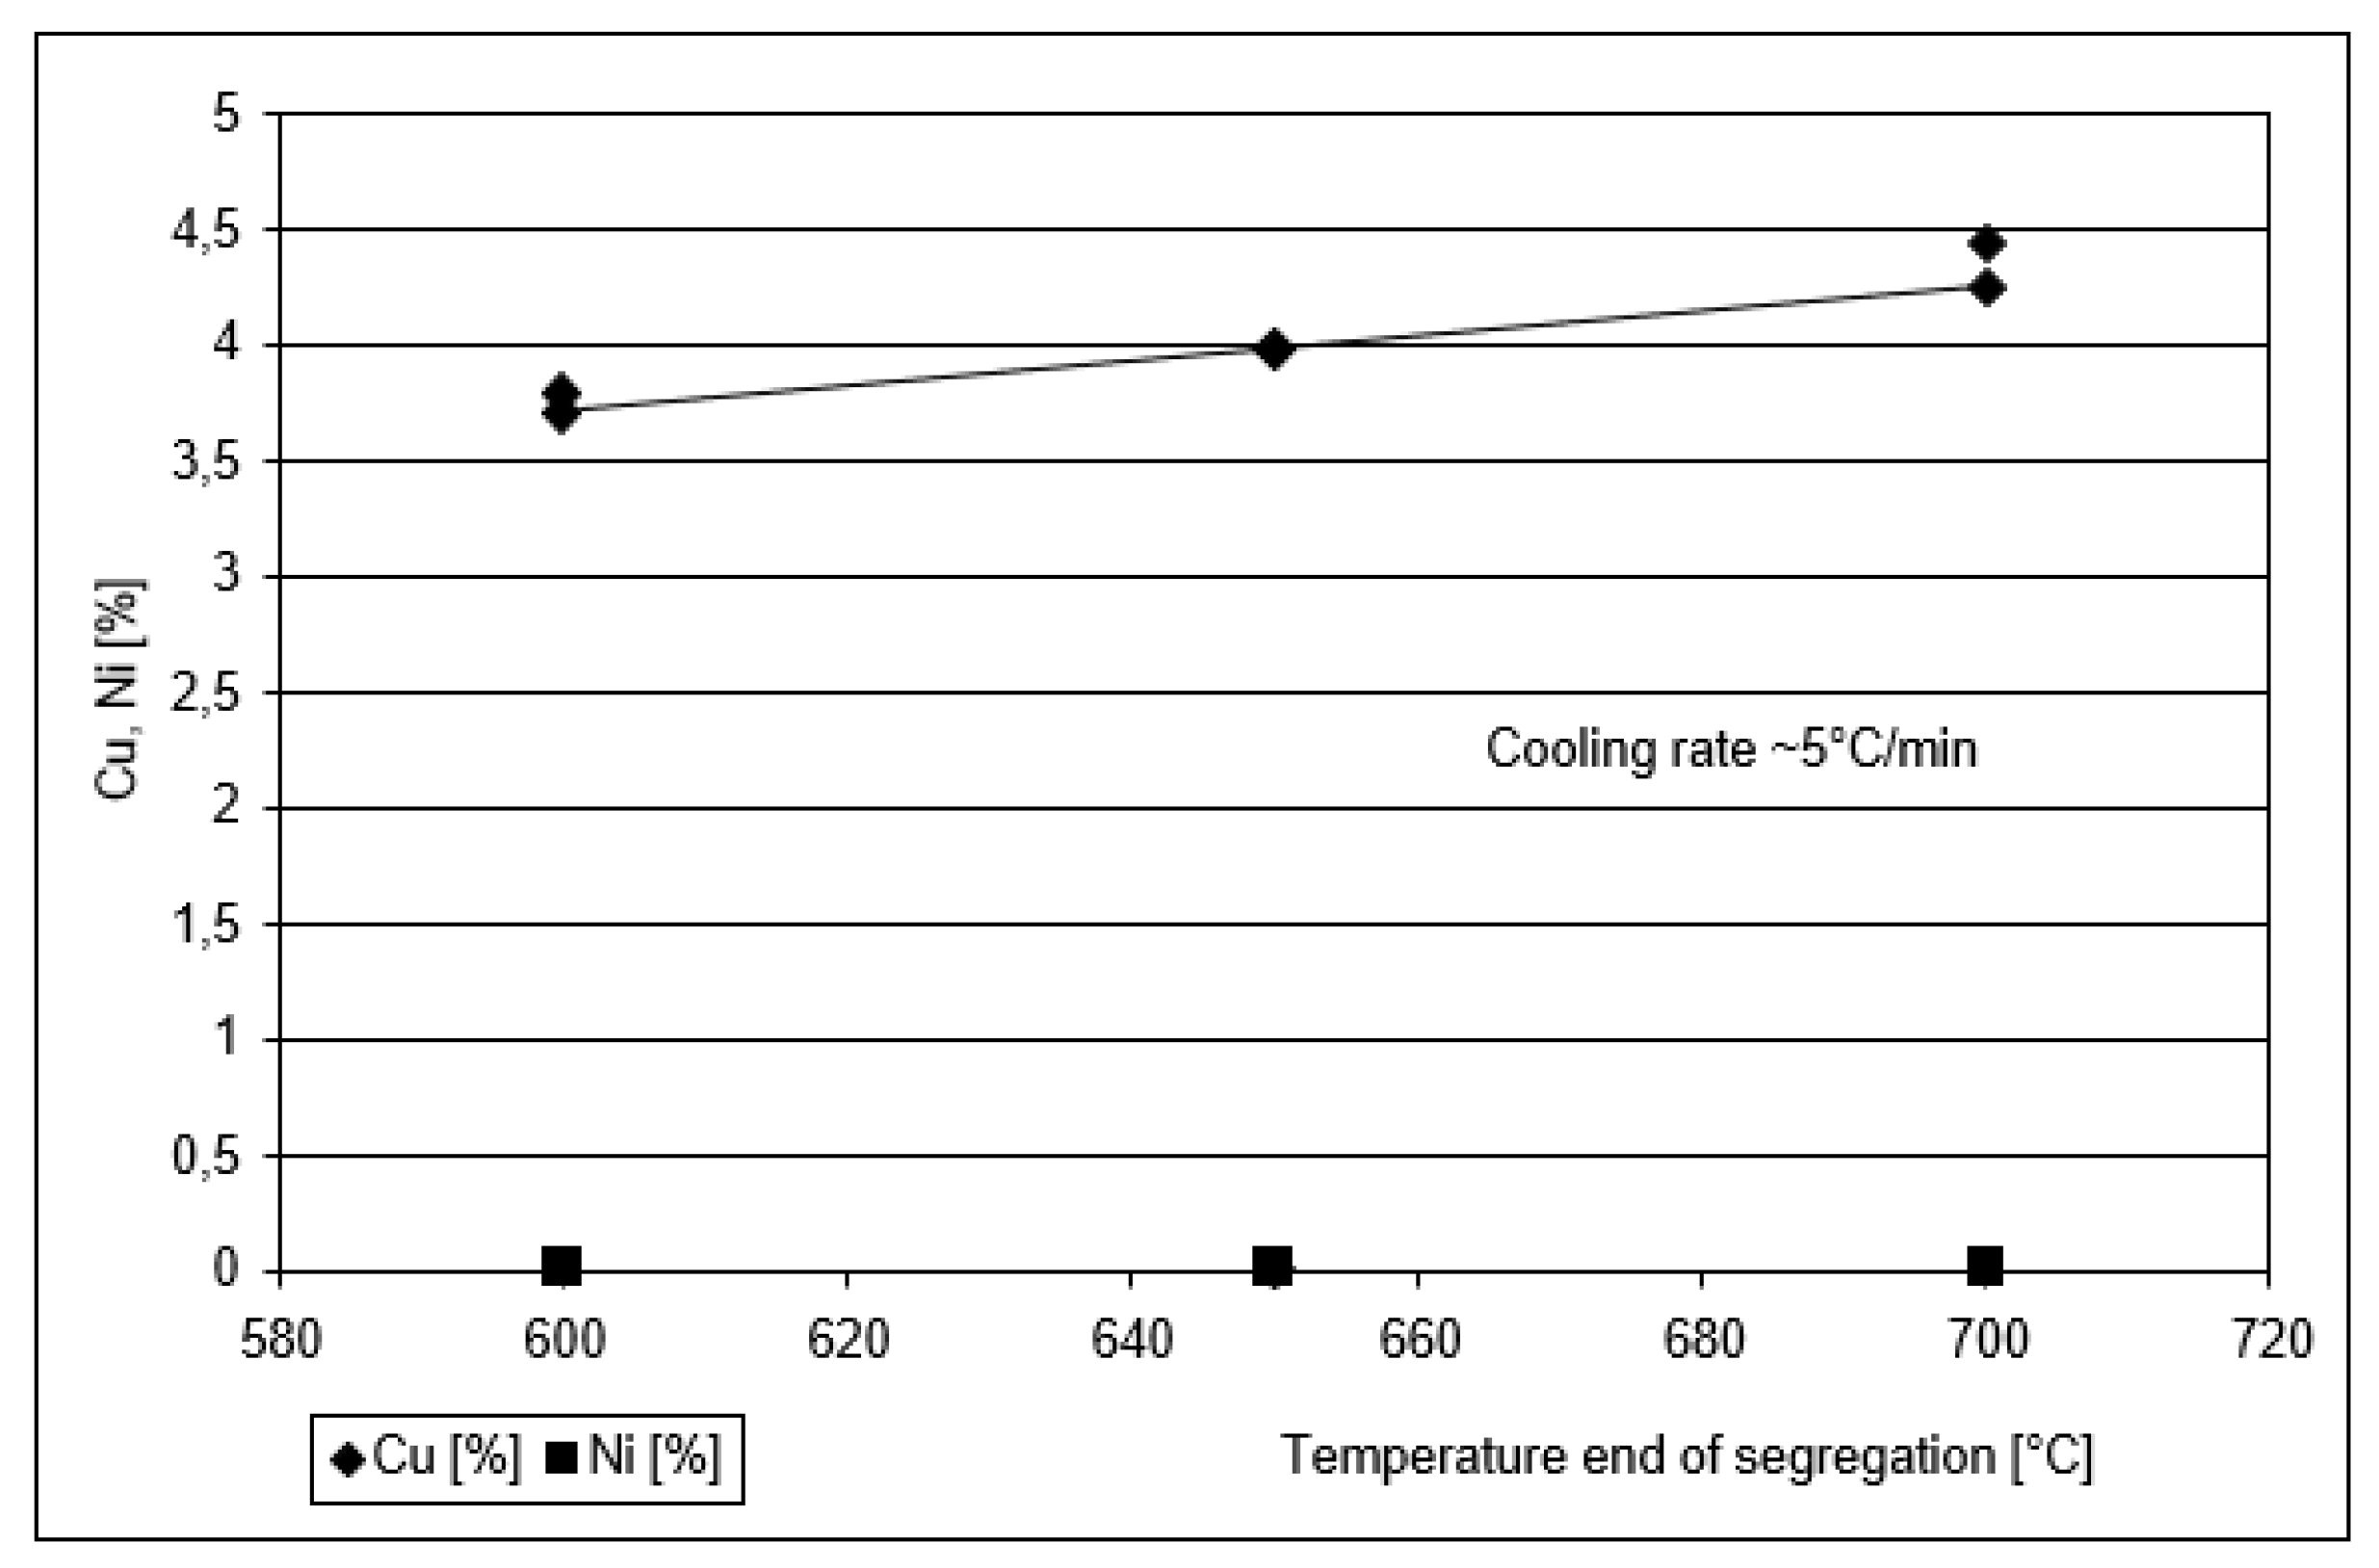
3.1. Final Copper and Nickel Contents in PbSn-Composite

Figure 5 shows that nickel is always almost completely removed, whereby the residual contents are independent of the silicon addition or the “available” silicon. For the final copper contents achieved, on the other hand, there is a decreasing tendency with increasing “available” silicon quantities.
The lowest final copper contents were achieved by eliminating copper and nickel without prior addition of silicon. However, unacceptably high losses of lead and tin were recorded in this process (see Figure 11). The addition of FeSi provides results comparable to those of technical silicon. The cooling rate of the melt has no significant or reproducible influence on the final copper and nickel contents.
The final copper content in the PbSn composite decreases slightly as casting temperatures falls (Figure 6), as further copper-containing phase fractions are separated from the PbSn composite melt in the temperature range from 700 to 600 C.

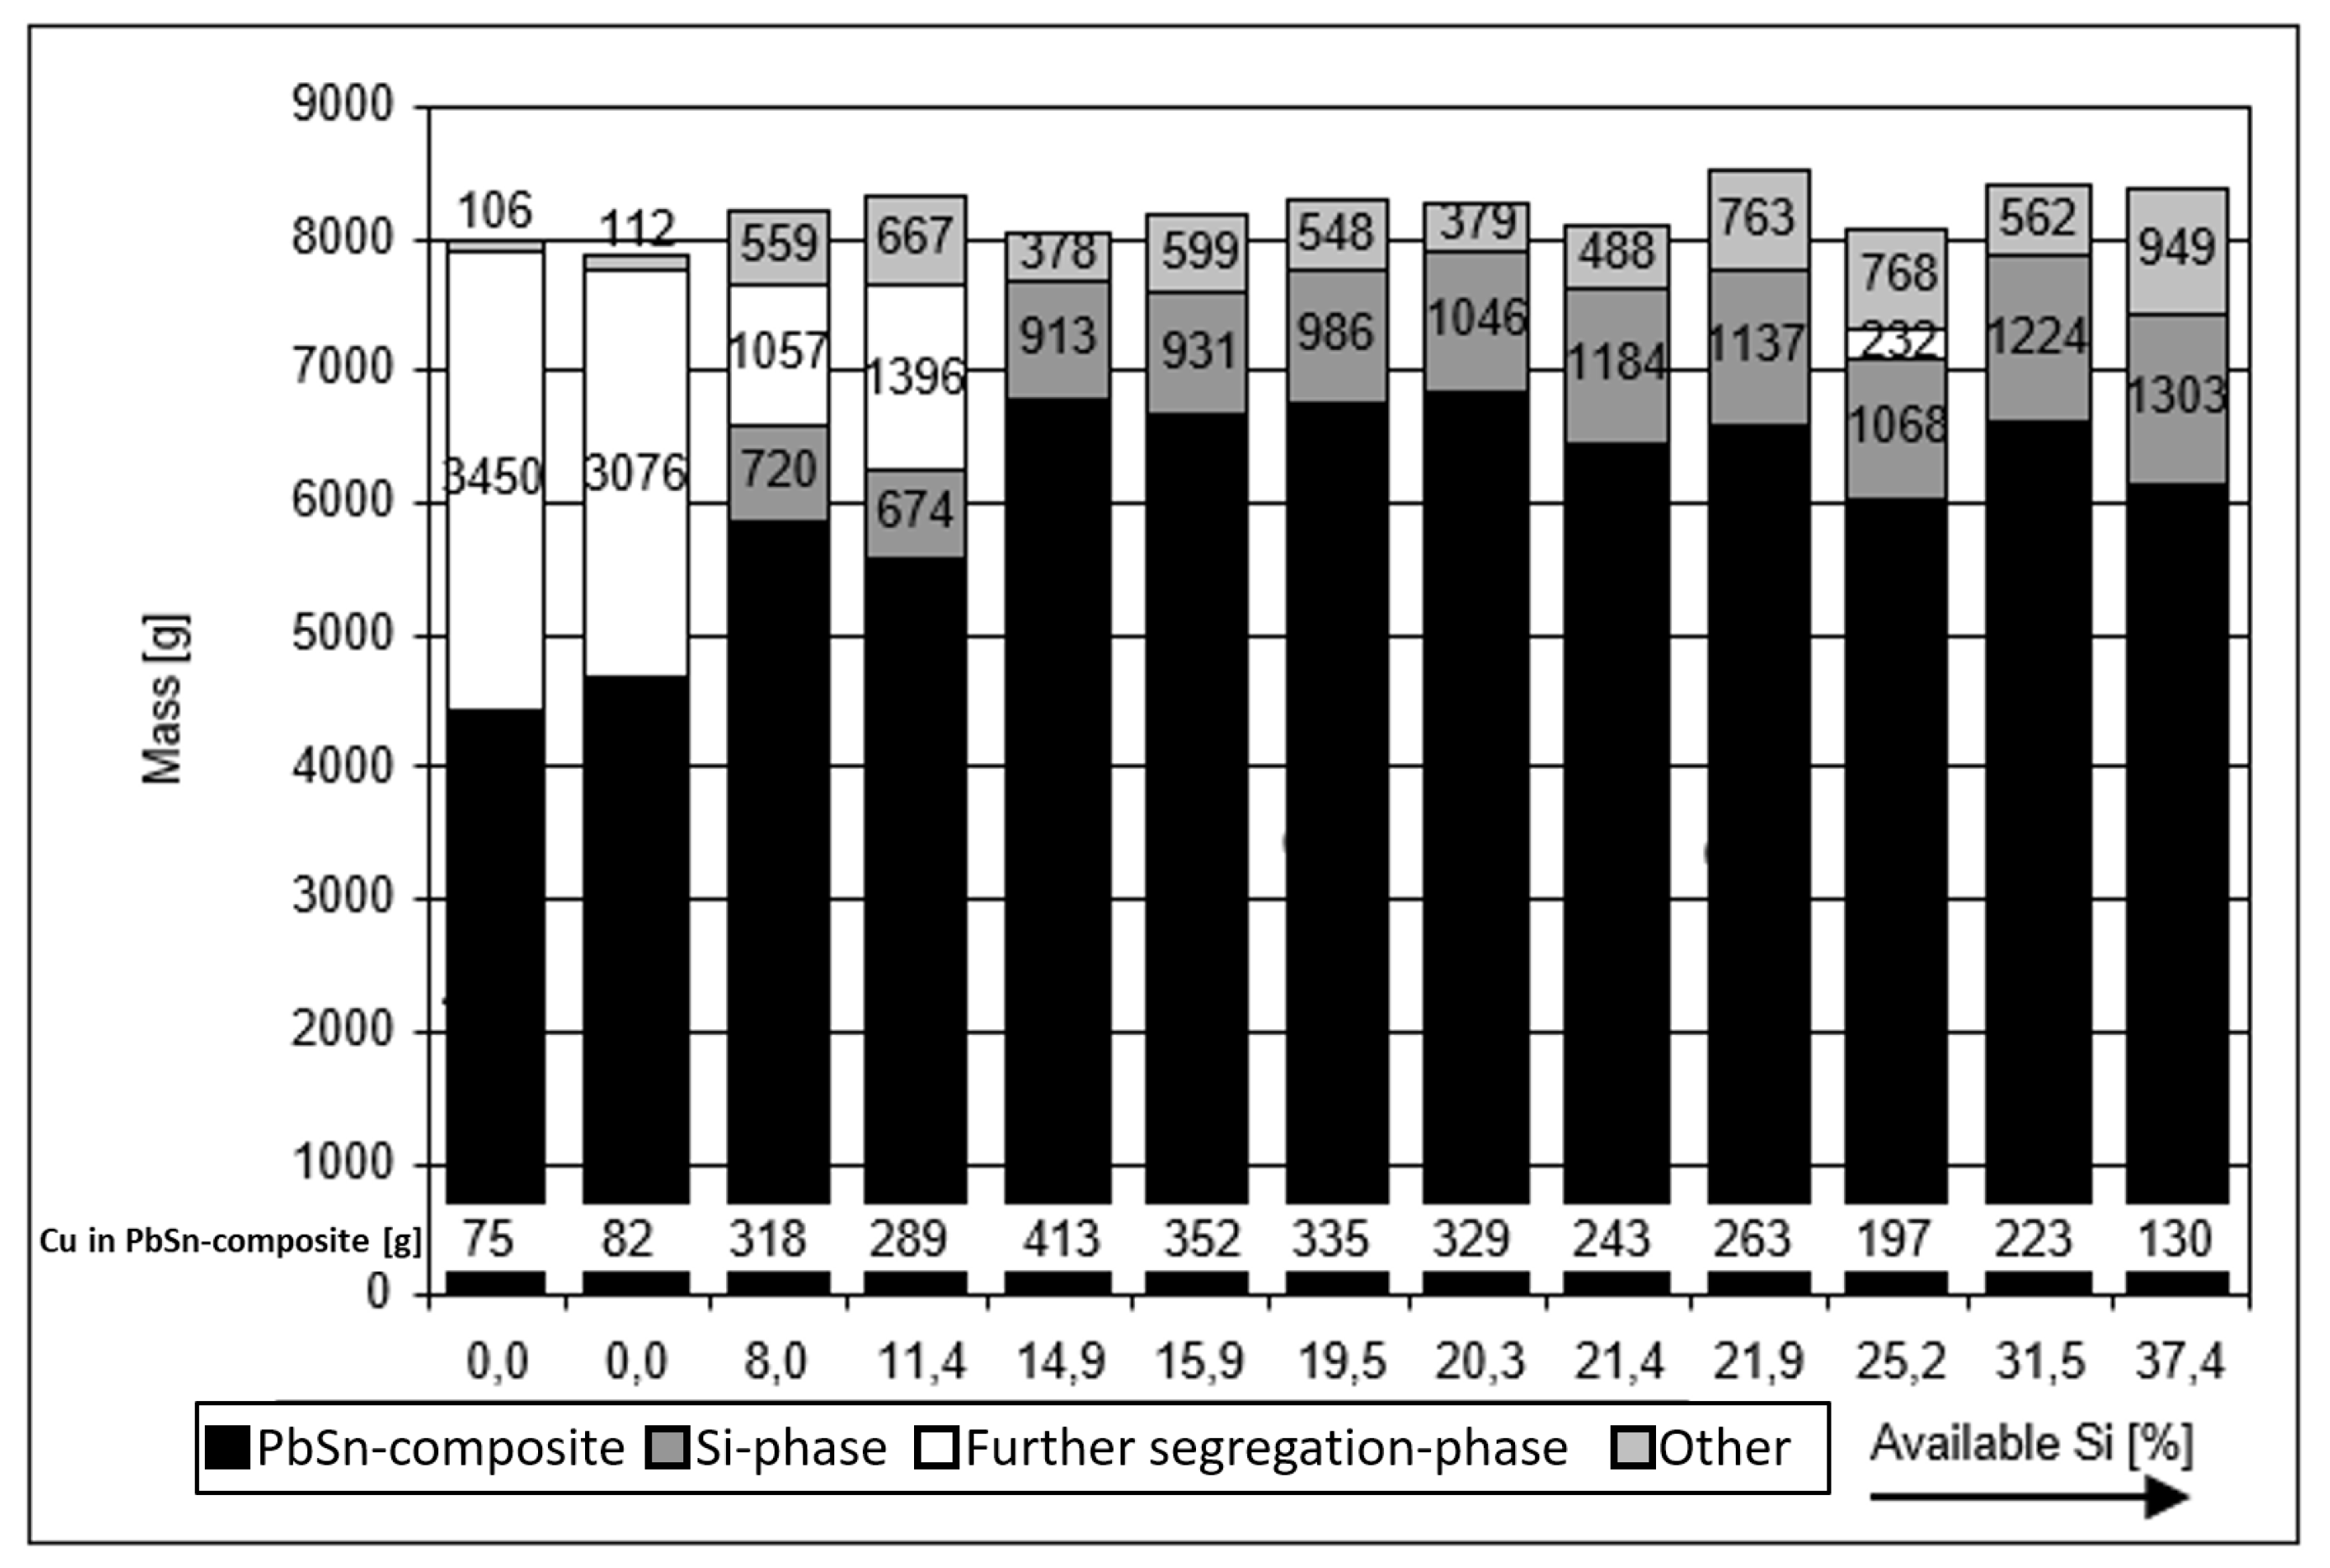
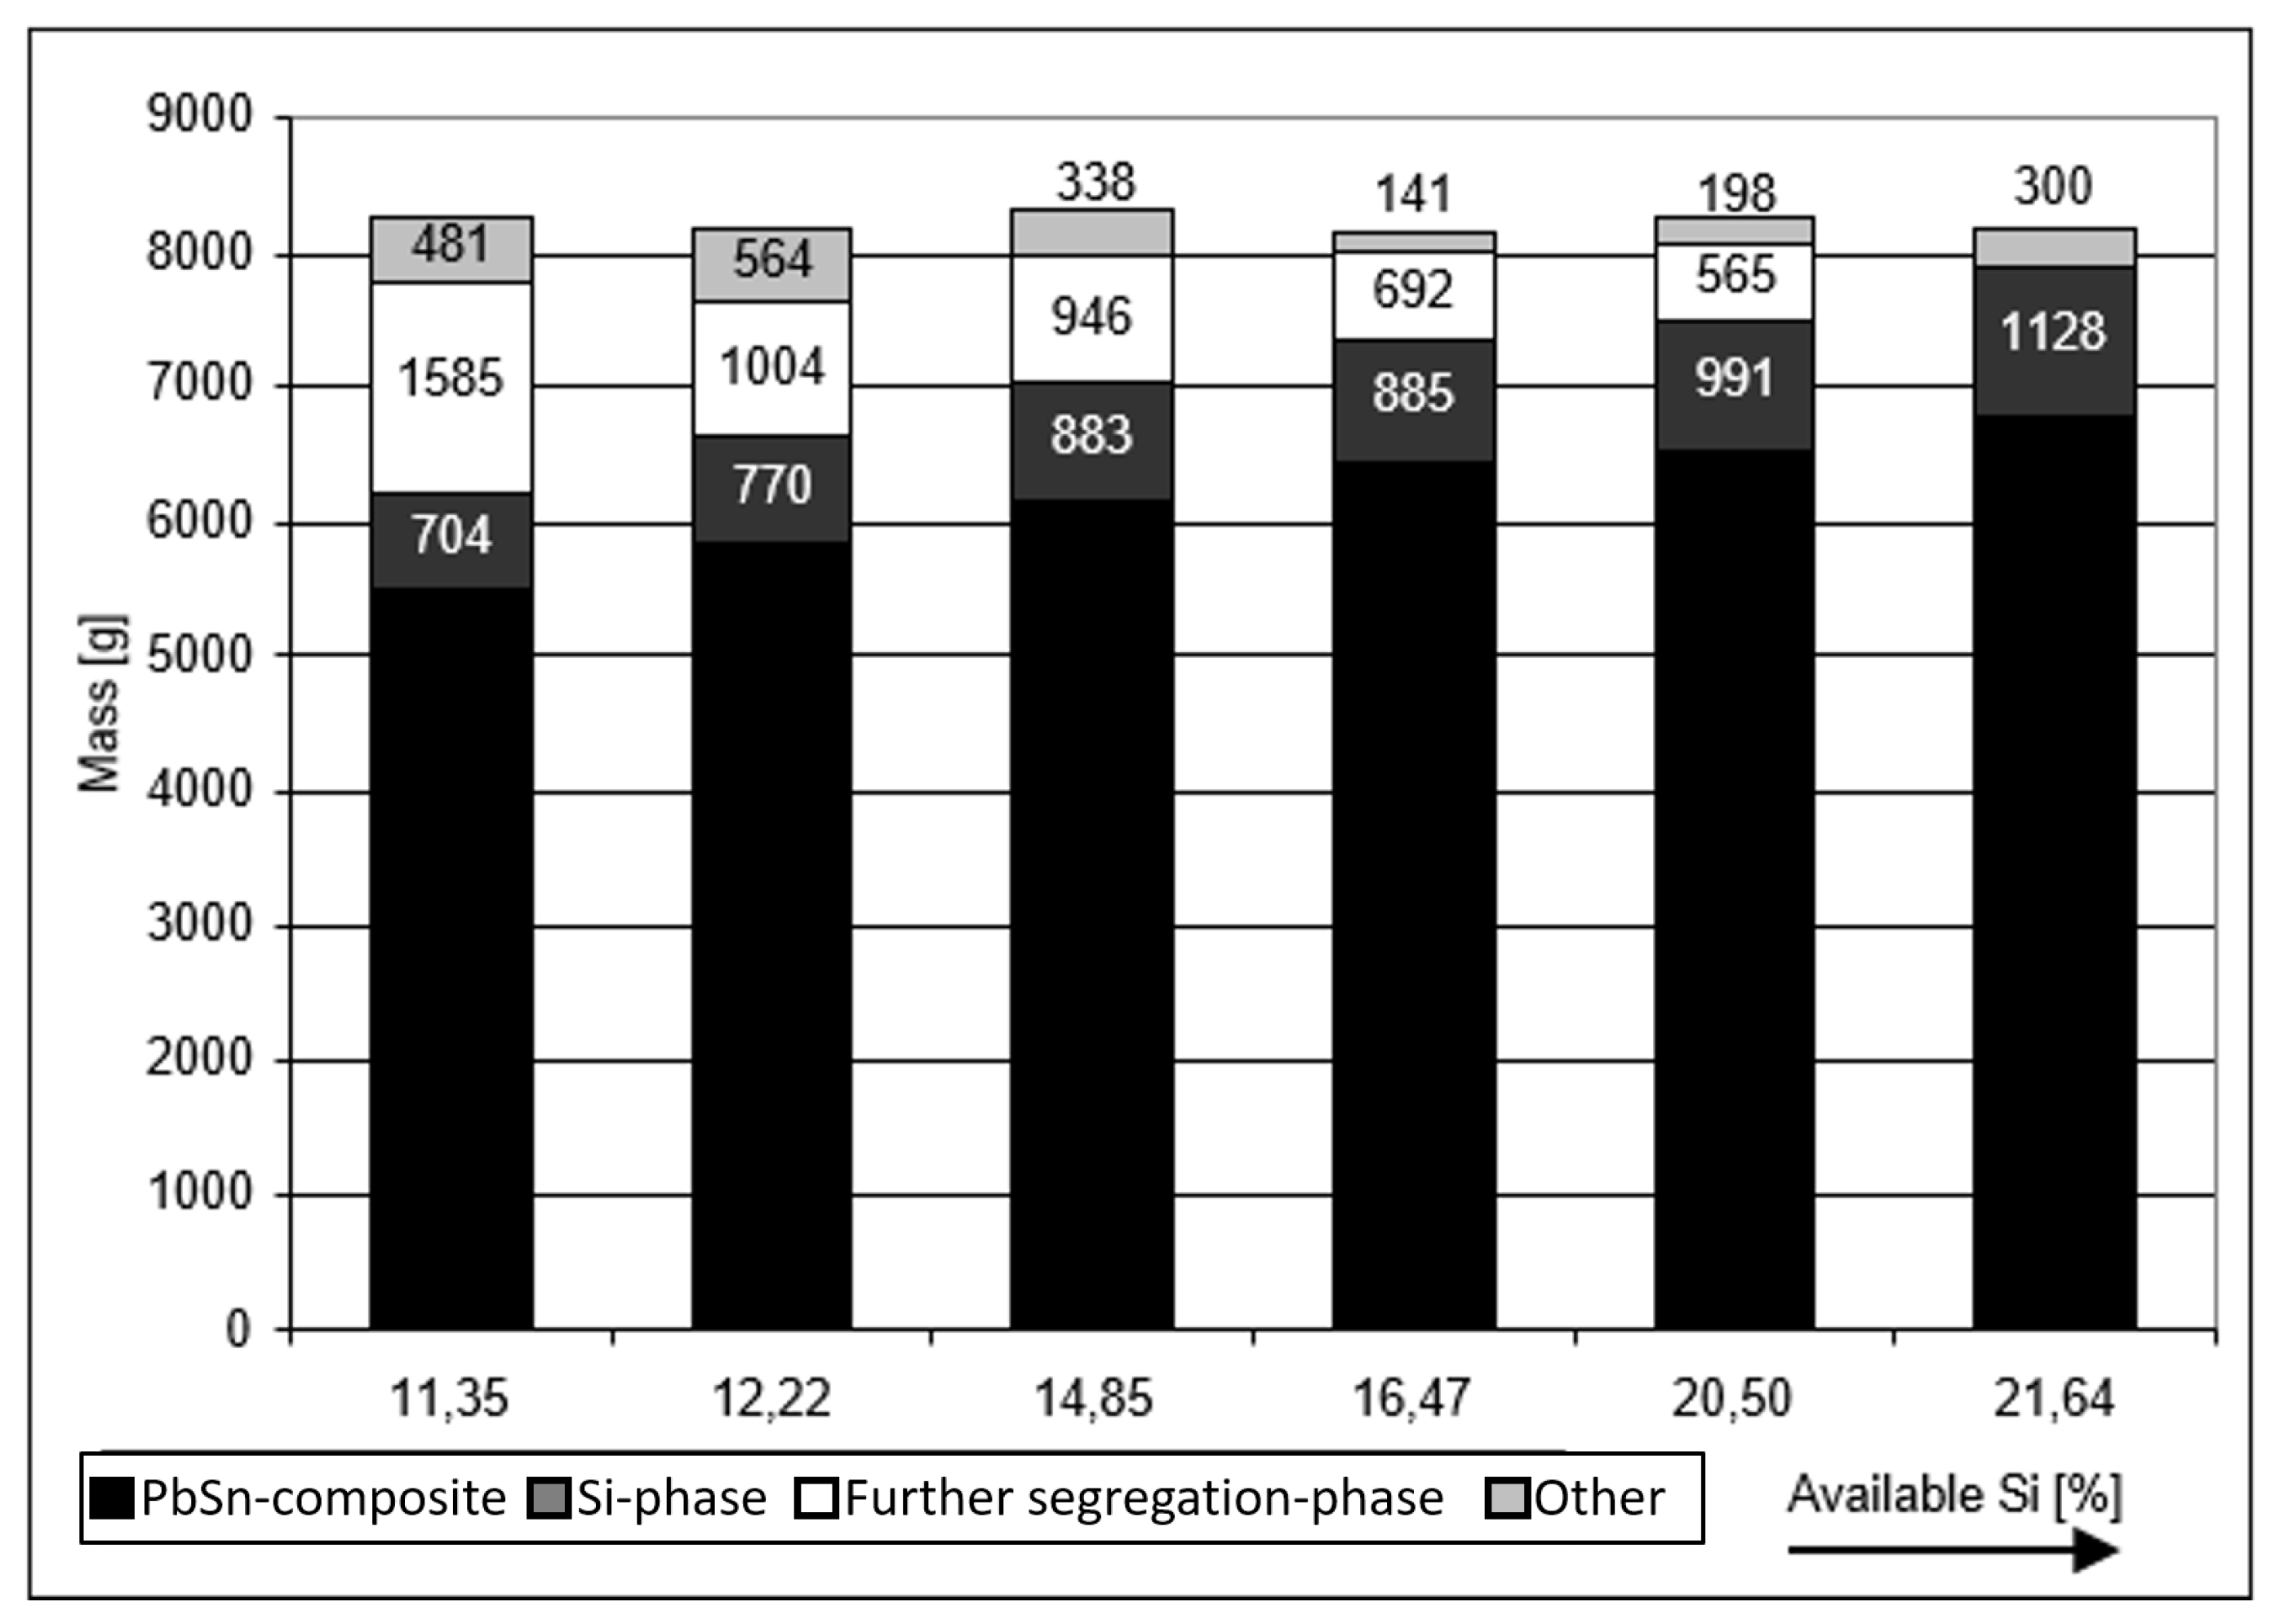
3.2. Quantity of Segregation and Silicide Product

Figure 7 shows that three, sometimes even four products, were produced, but that significant quantities of copper always remained in the PbSn composite.
In the tests without precipitation reagent, the amount of the PbSn composite product is significantly lower than in the tests with silicon addition, because the segregation product fills the complete melt volume as a porous “cake” with a high PbSn composite content. The other proportions are dross, sample material, or metallic residues, which will not be considered in detail in the further evaluation.
The casting temperature has no significant influence on the phase distribution. At 700 C, the phases are almost completely separated from each other and can be recovered separately. There is also no dependence of the quantity distribution on the cooling rate.
Even in the tests with FeSi addition, a clear dependence of the mass distribution on the “available” silicon is apparent. The proportion of the poured PbSn composite and the silicide product increases. At the same time, the proportion of the undesirable “further” segregation product is decreasing (Figure 8).

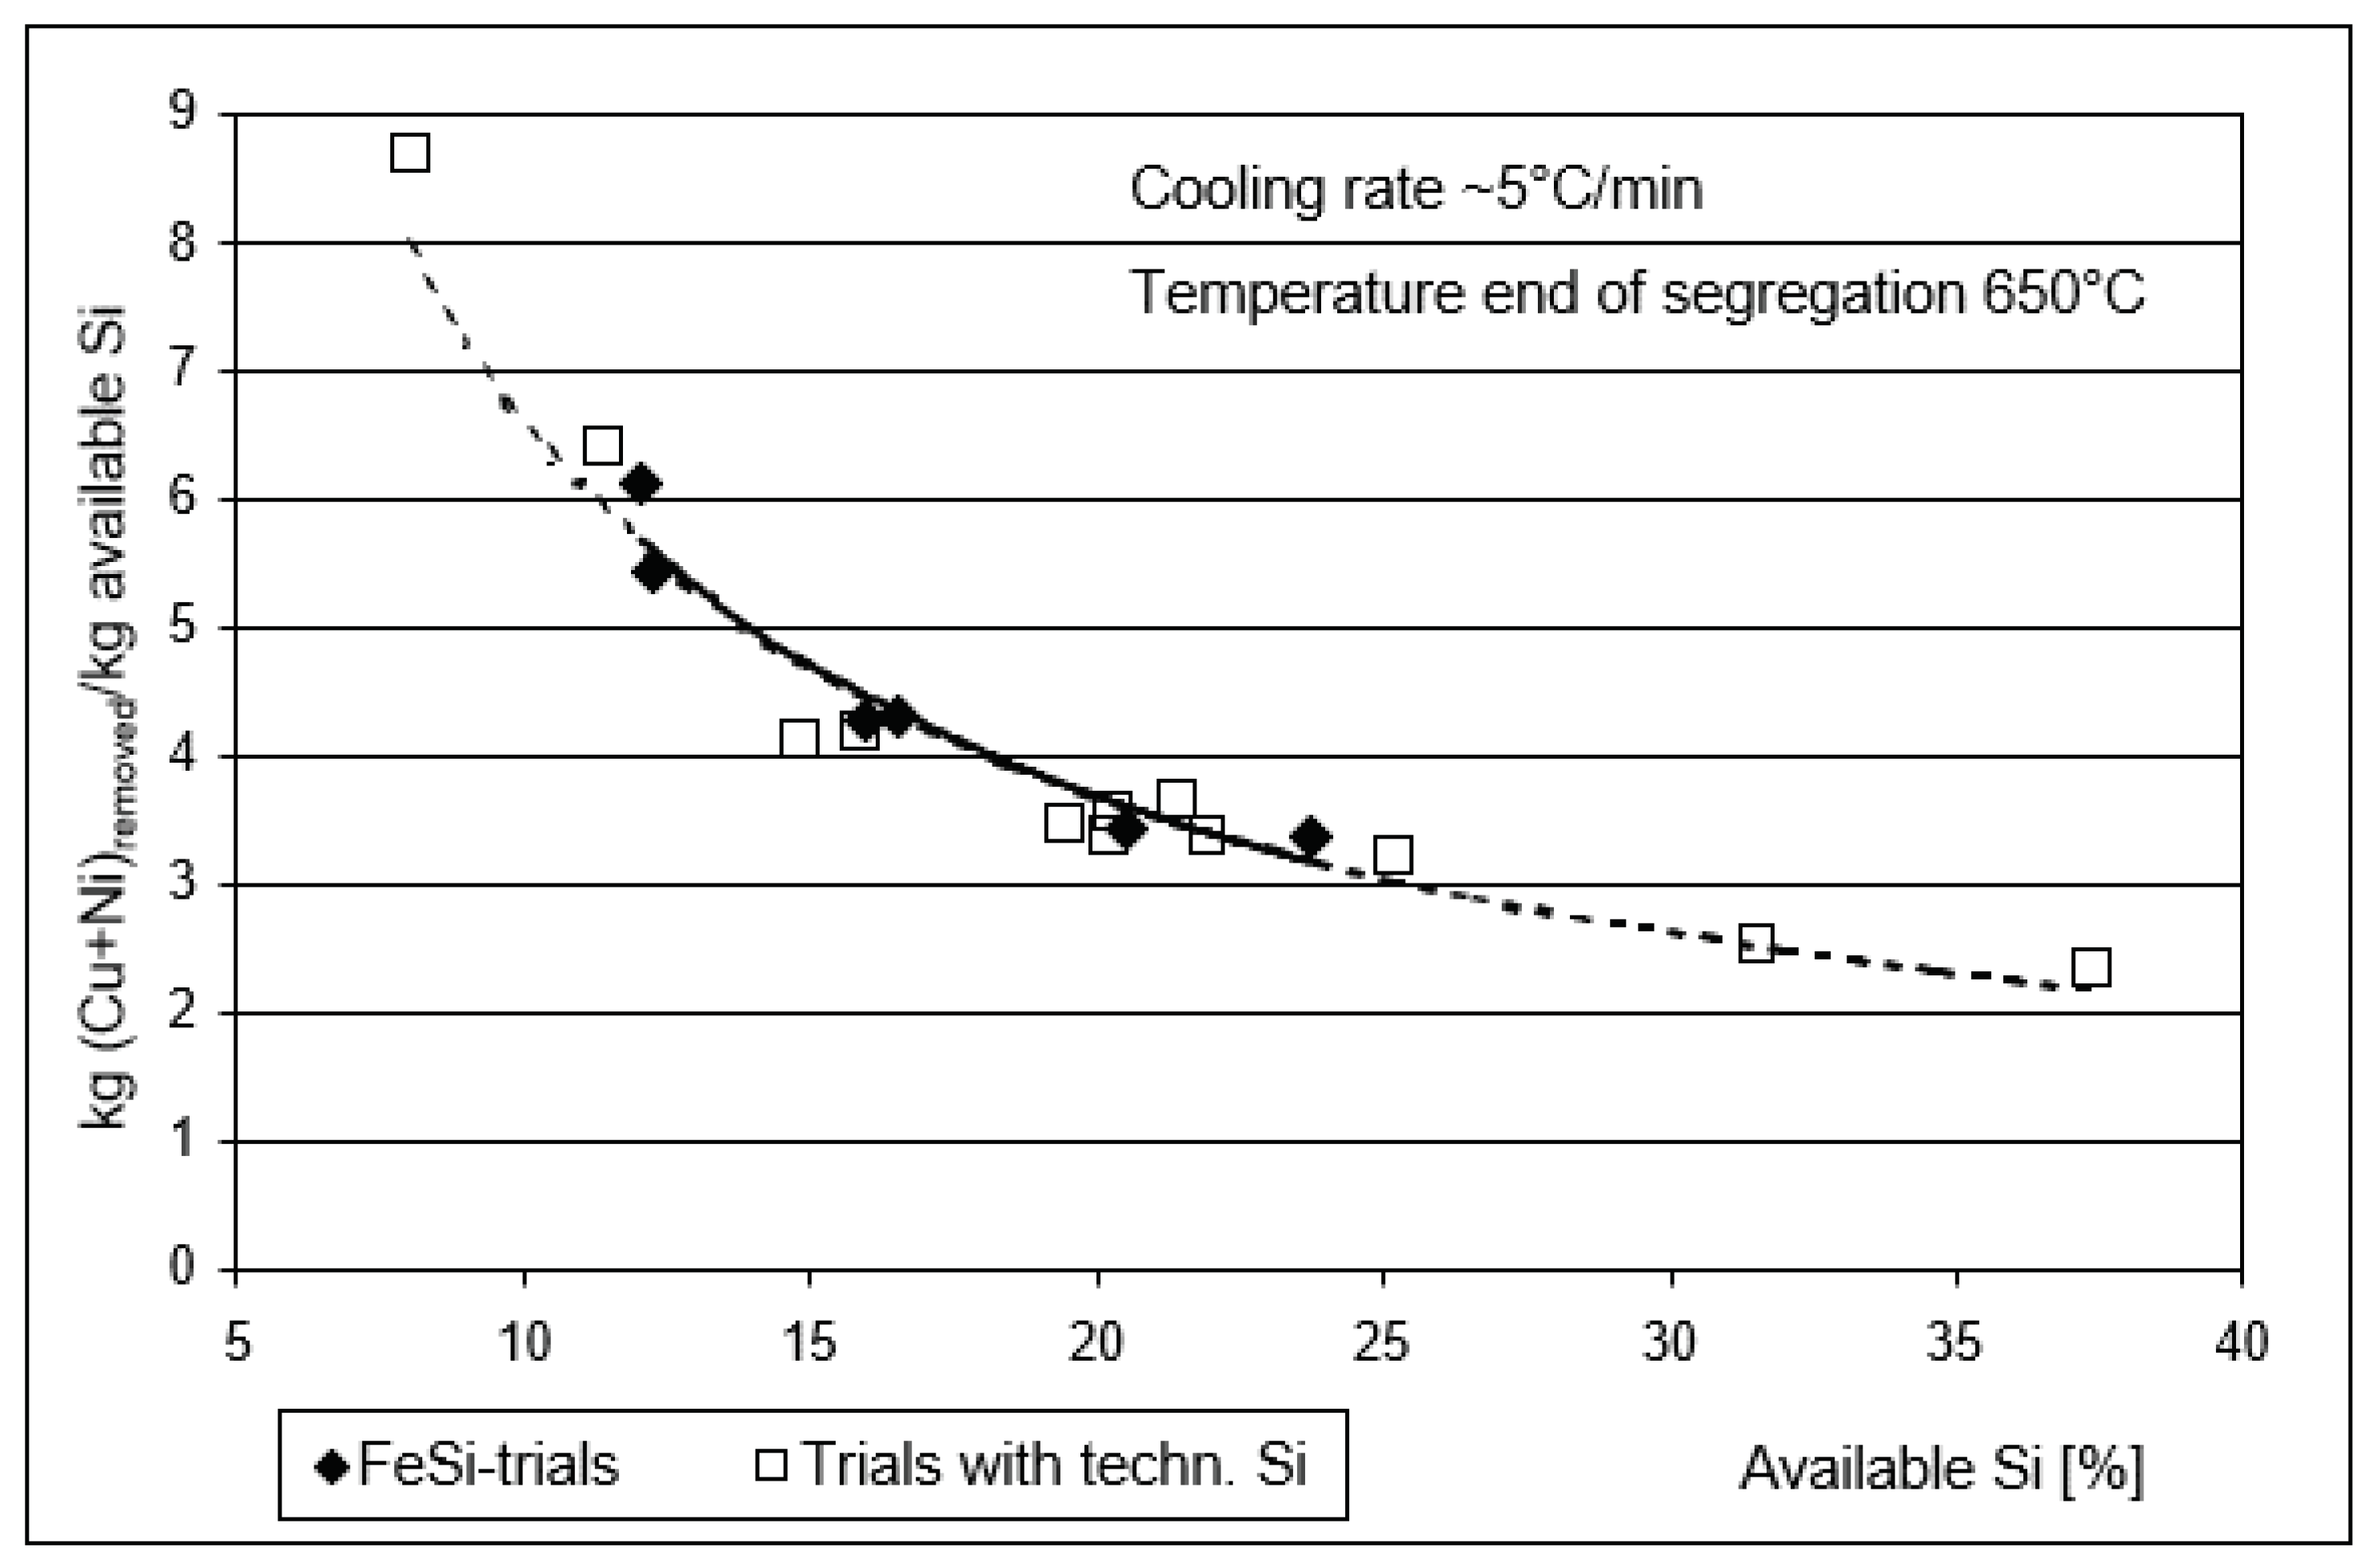
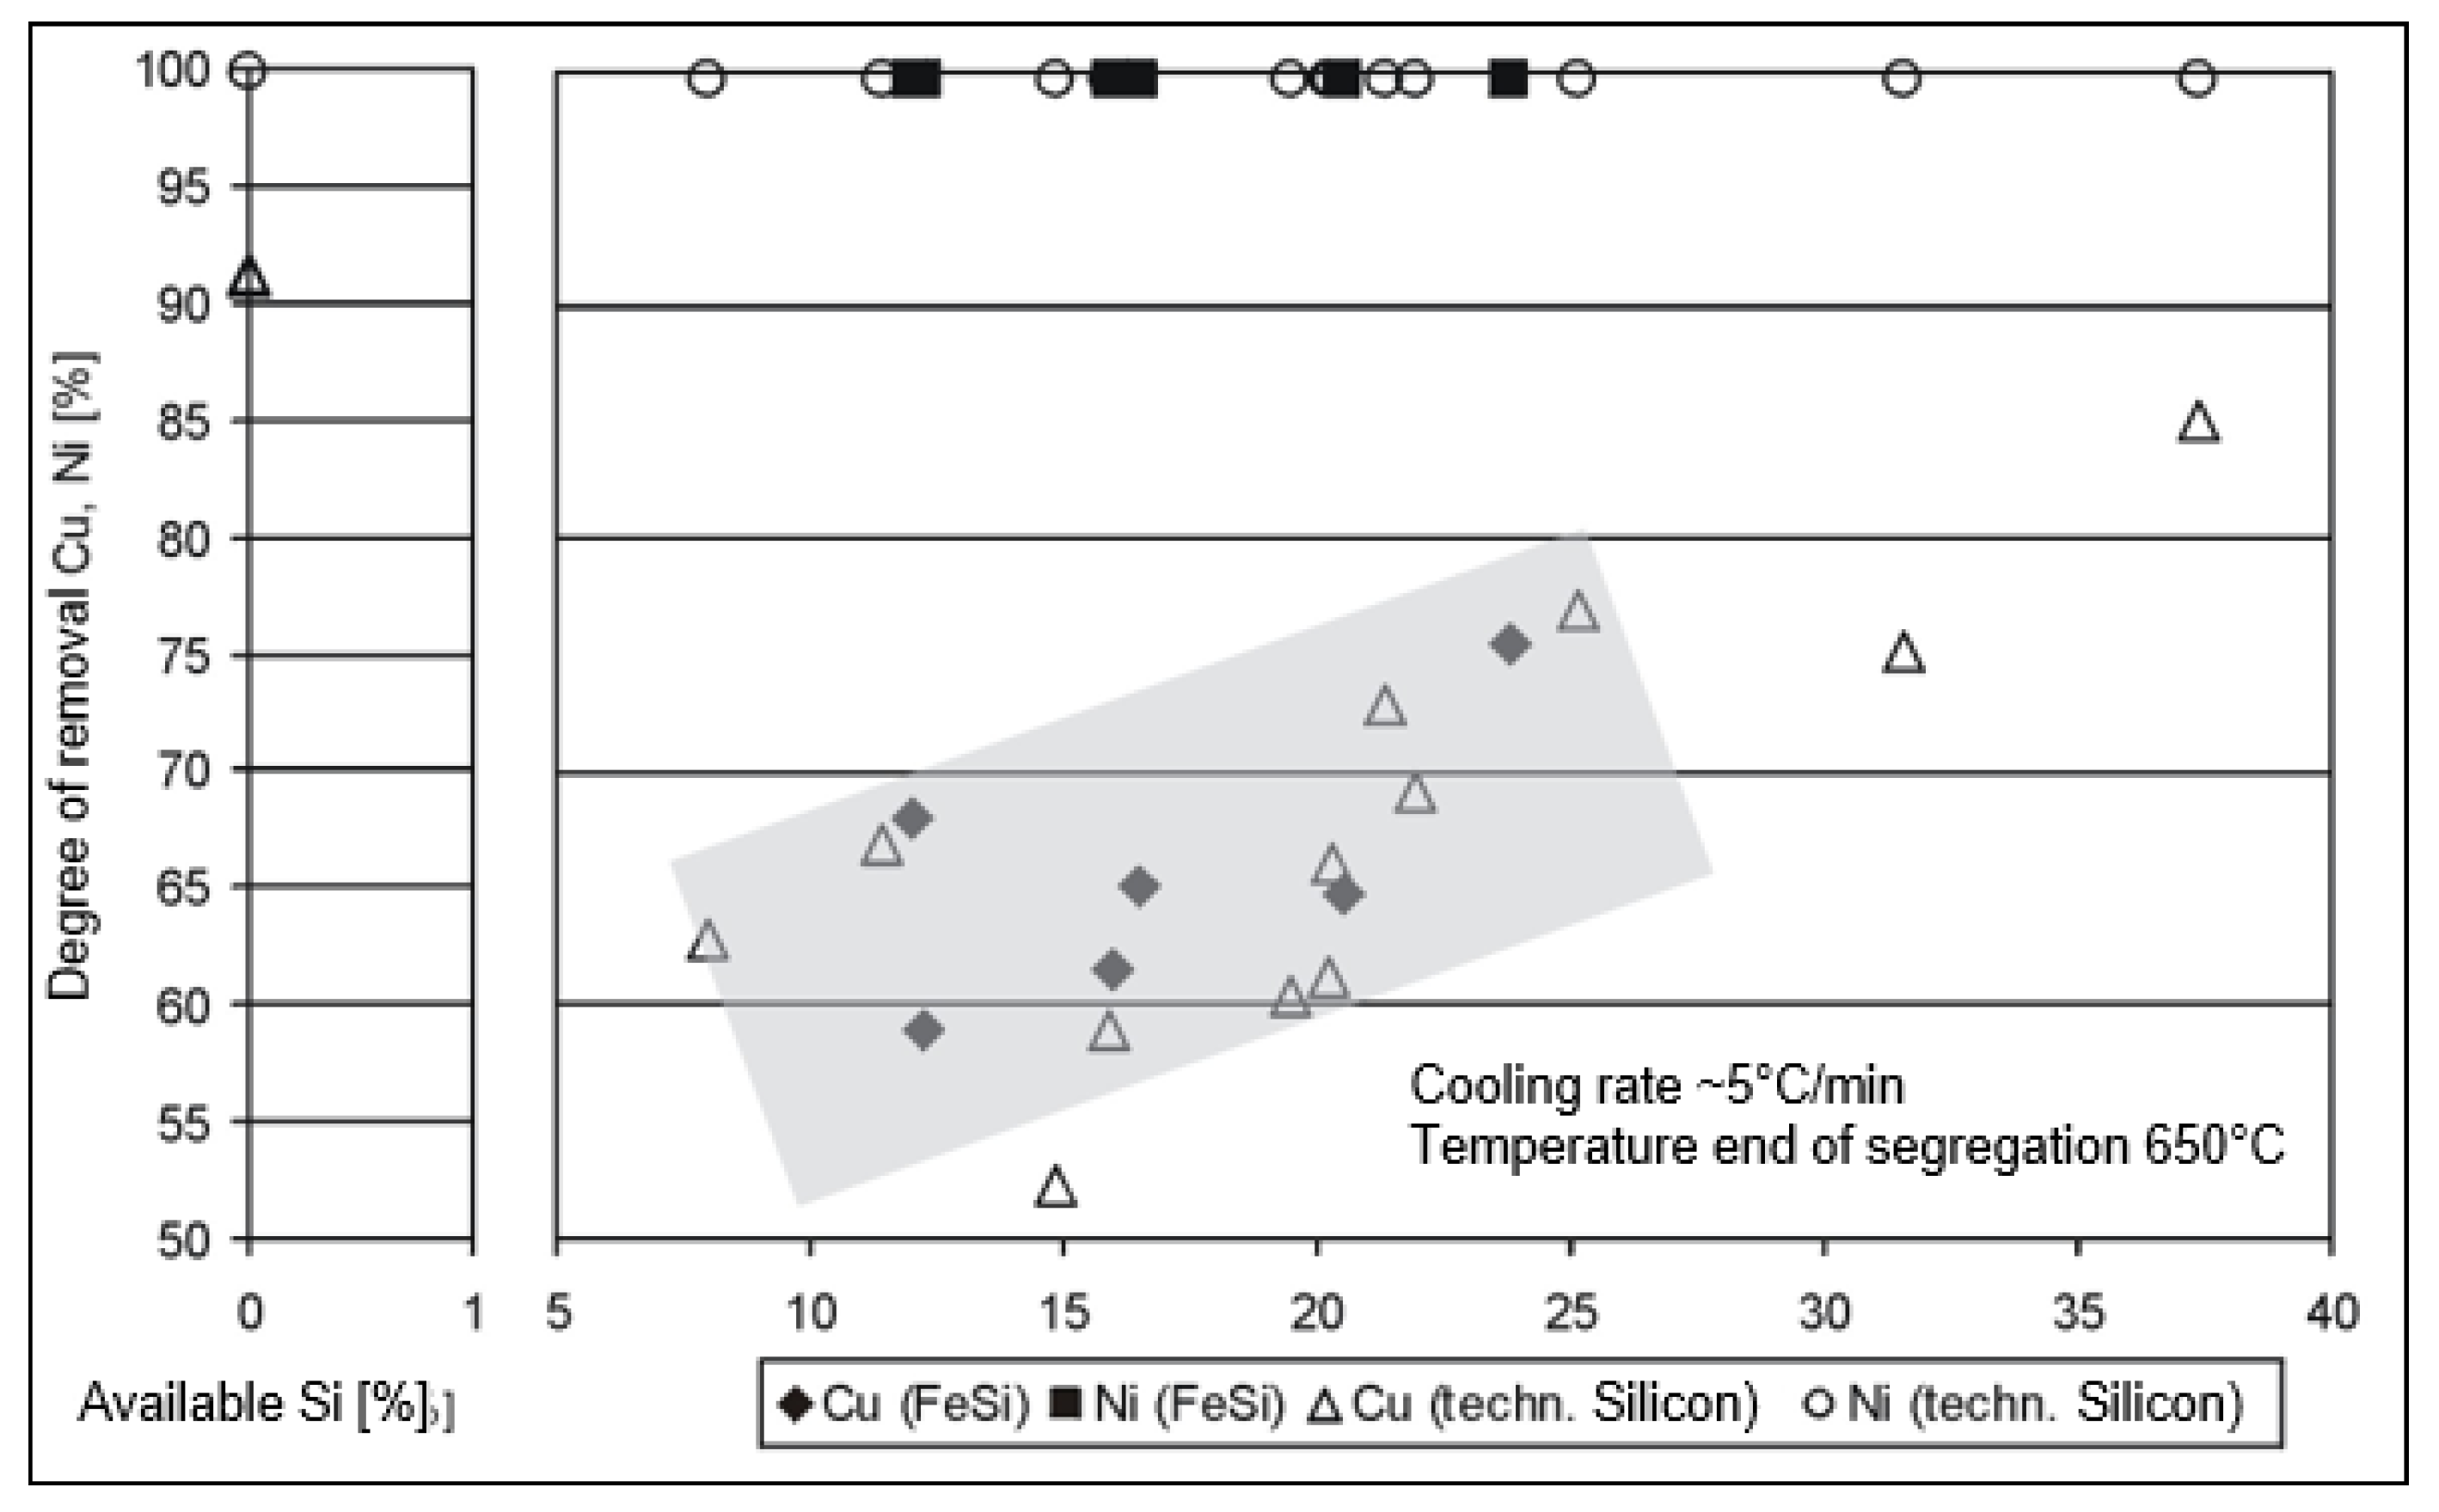
3.3. Degree of Copper and Nickel Separation

The following approach (Equation (2)) is used to determine the degree of removal for copper and nickel. The composition and quantity of raw PbSn composite (RMZ) and refined PbSn composite (MZ) are only subject to a minor error. If the yield of the removed copper and nickel contents is calculated via the silicide or segregation product analyses, large inaccuracies result due to the inhomogeneous segregation product structure (only conceivable via complete homogenization/sampling).
η R e m o v a l C u , N i = m C u , N i R M Z m C u , N i M Z m C u , N i R M Z · 100 %
Figure 9 shows that by increasing the silicon or FeSi rate, the degree of removal can be increased from about 55% copper to up to 85% copper. More than 90% copper can be removed by silicon-free segregation, but as mentioned above, with massive lead–tin losses (Figure 11). Nickel is completely removed in all cases.
Figure 10 illustrates that the values of Si effectiveness (calculated by Equation (3)), i.e., the copper and nickel contents removed from the PbSn composite per kg of “available” silicon, decrease significantly with increasing silicon addition or “available” silicon.
η S i = k g ( C u + N i ) r e m o v e d k g S i a v a i l a b l e
This leads to the conclusion that with a higher silicon supply, there is either the formation of phases with low copper and/or nickel contents, or that the higher silicon contents or silicon remains “unused” in the segregation product. On the other hand, this disadvantage is offset by lower final copper contents in the PbSn composite.
The consideration of the degree of copper and nickel removal for the other test parameters (cooling rate and casting temperature) showed no dependencies.

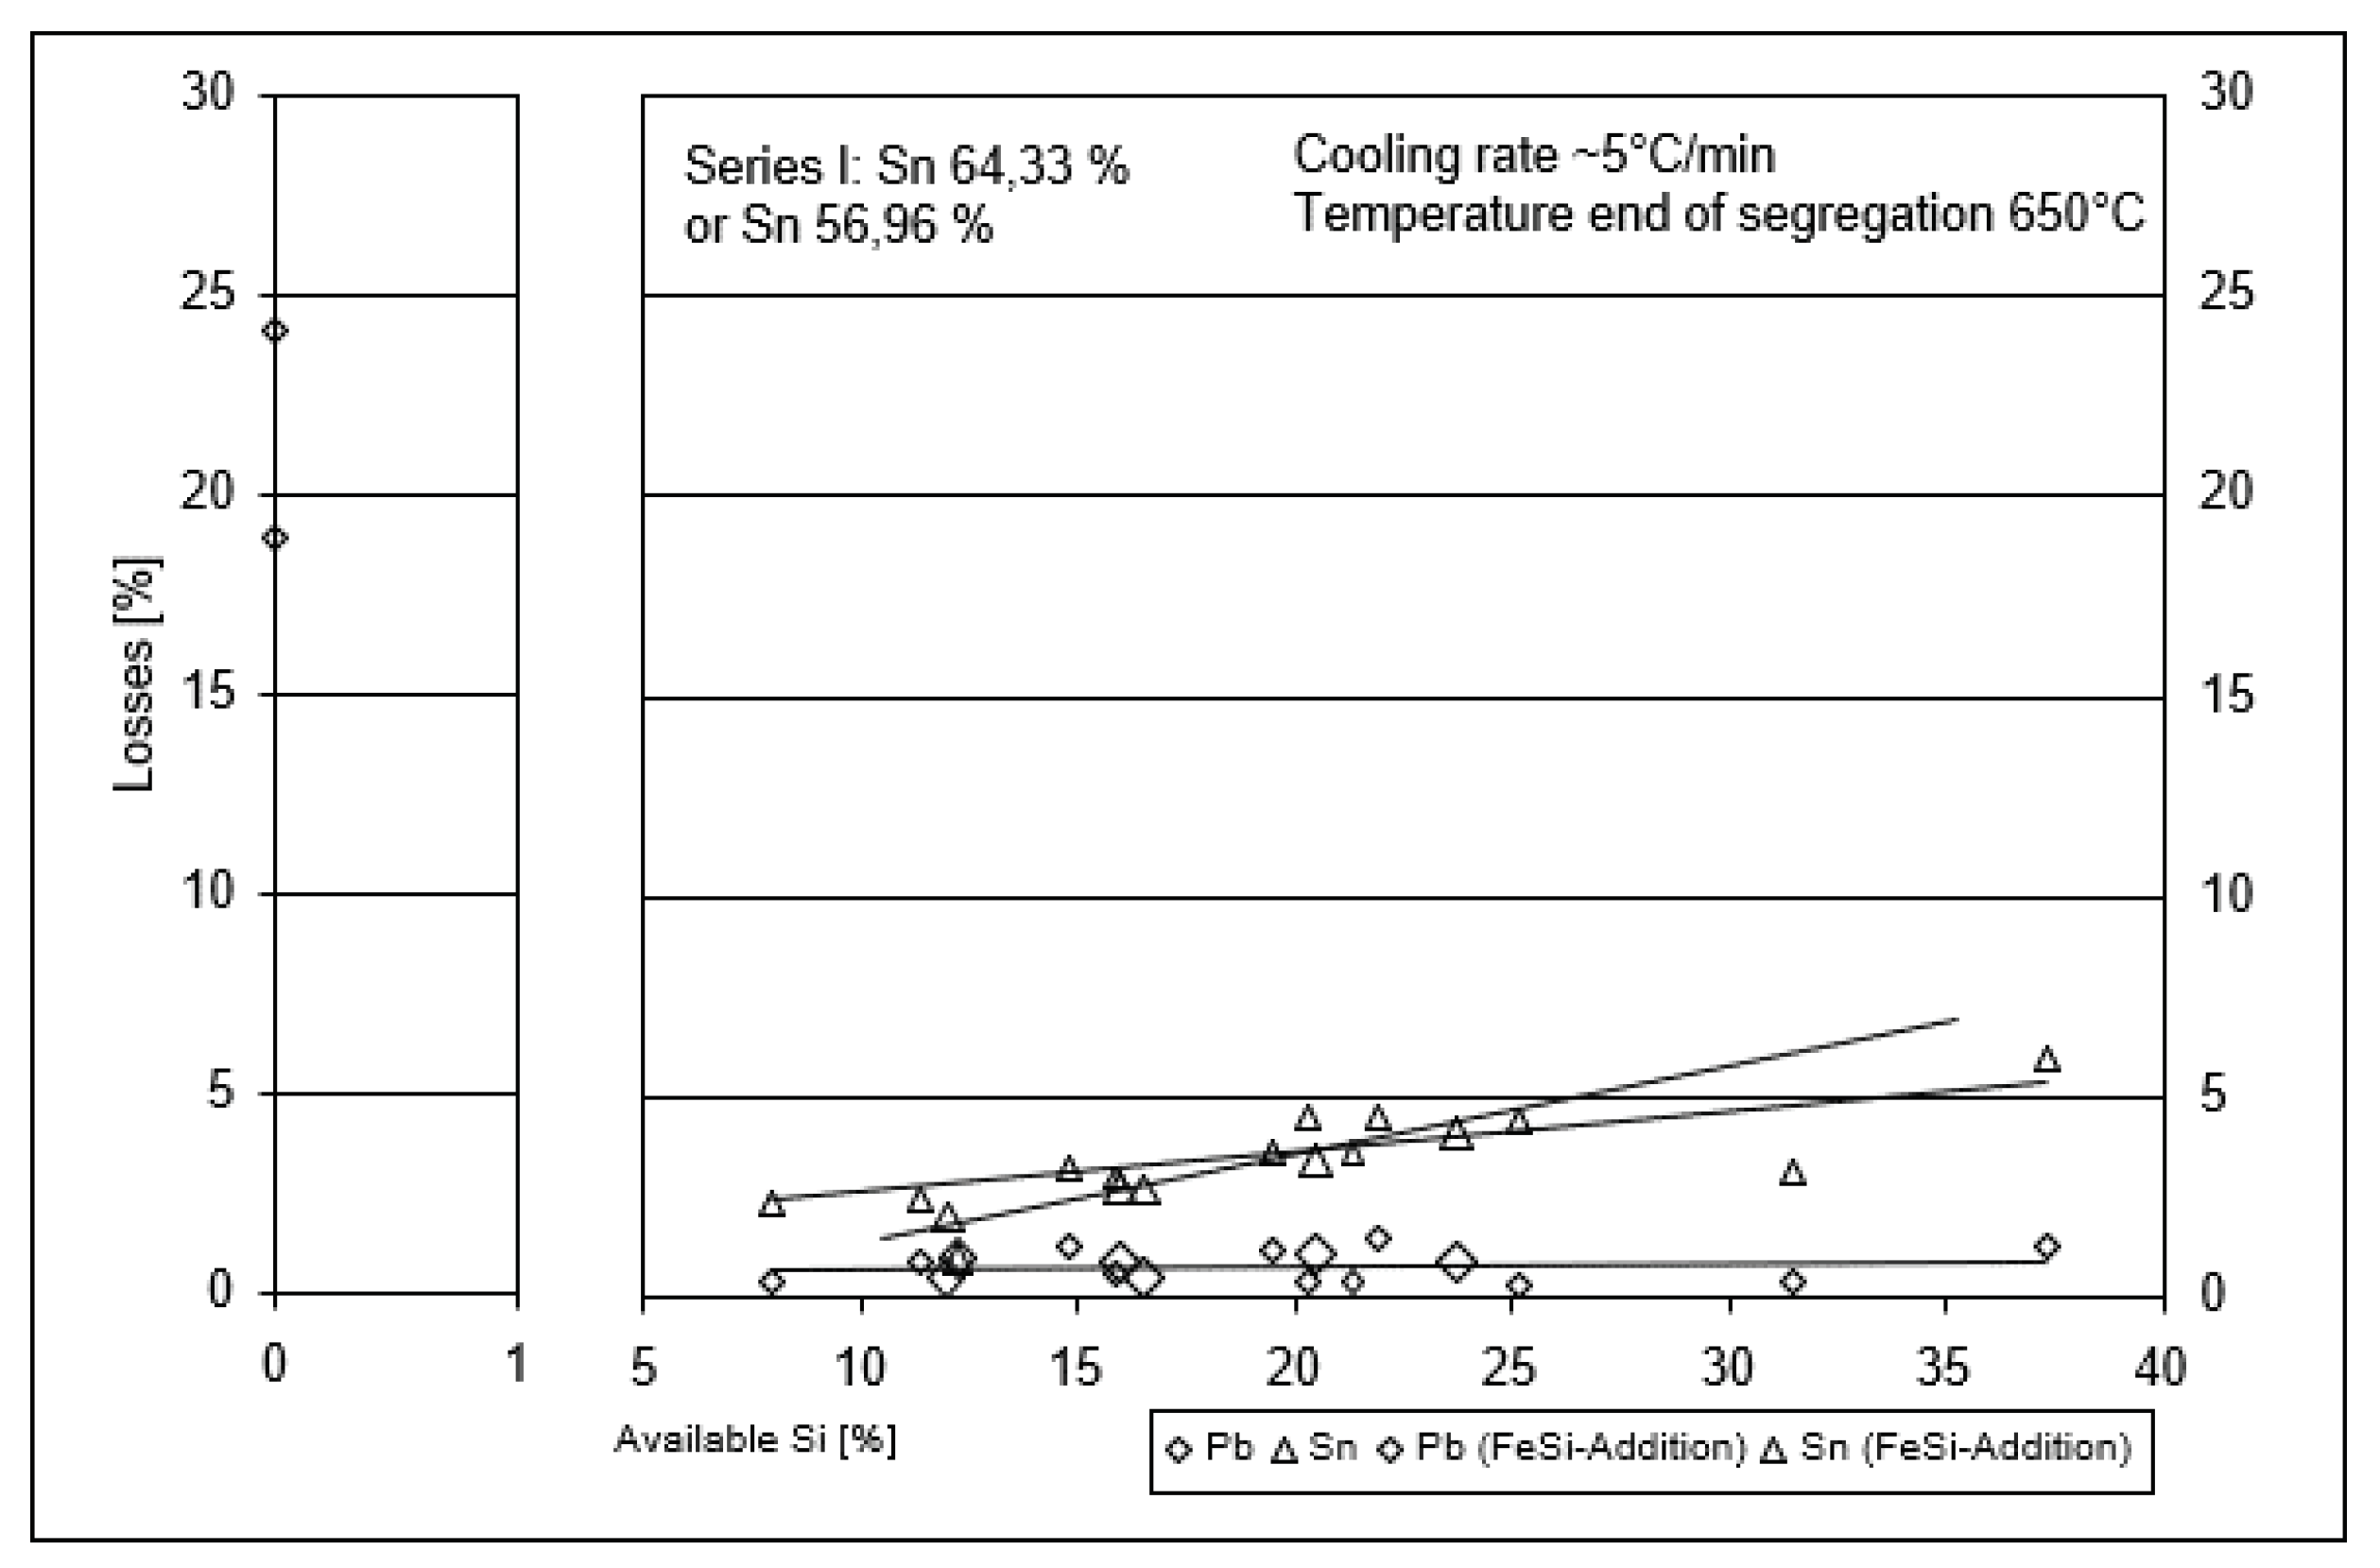
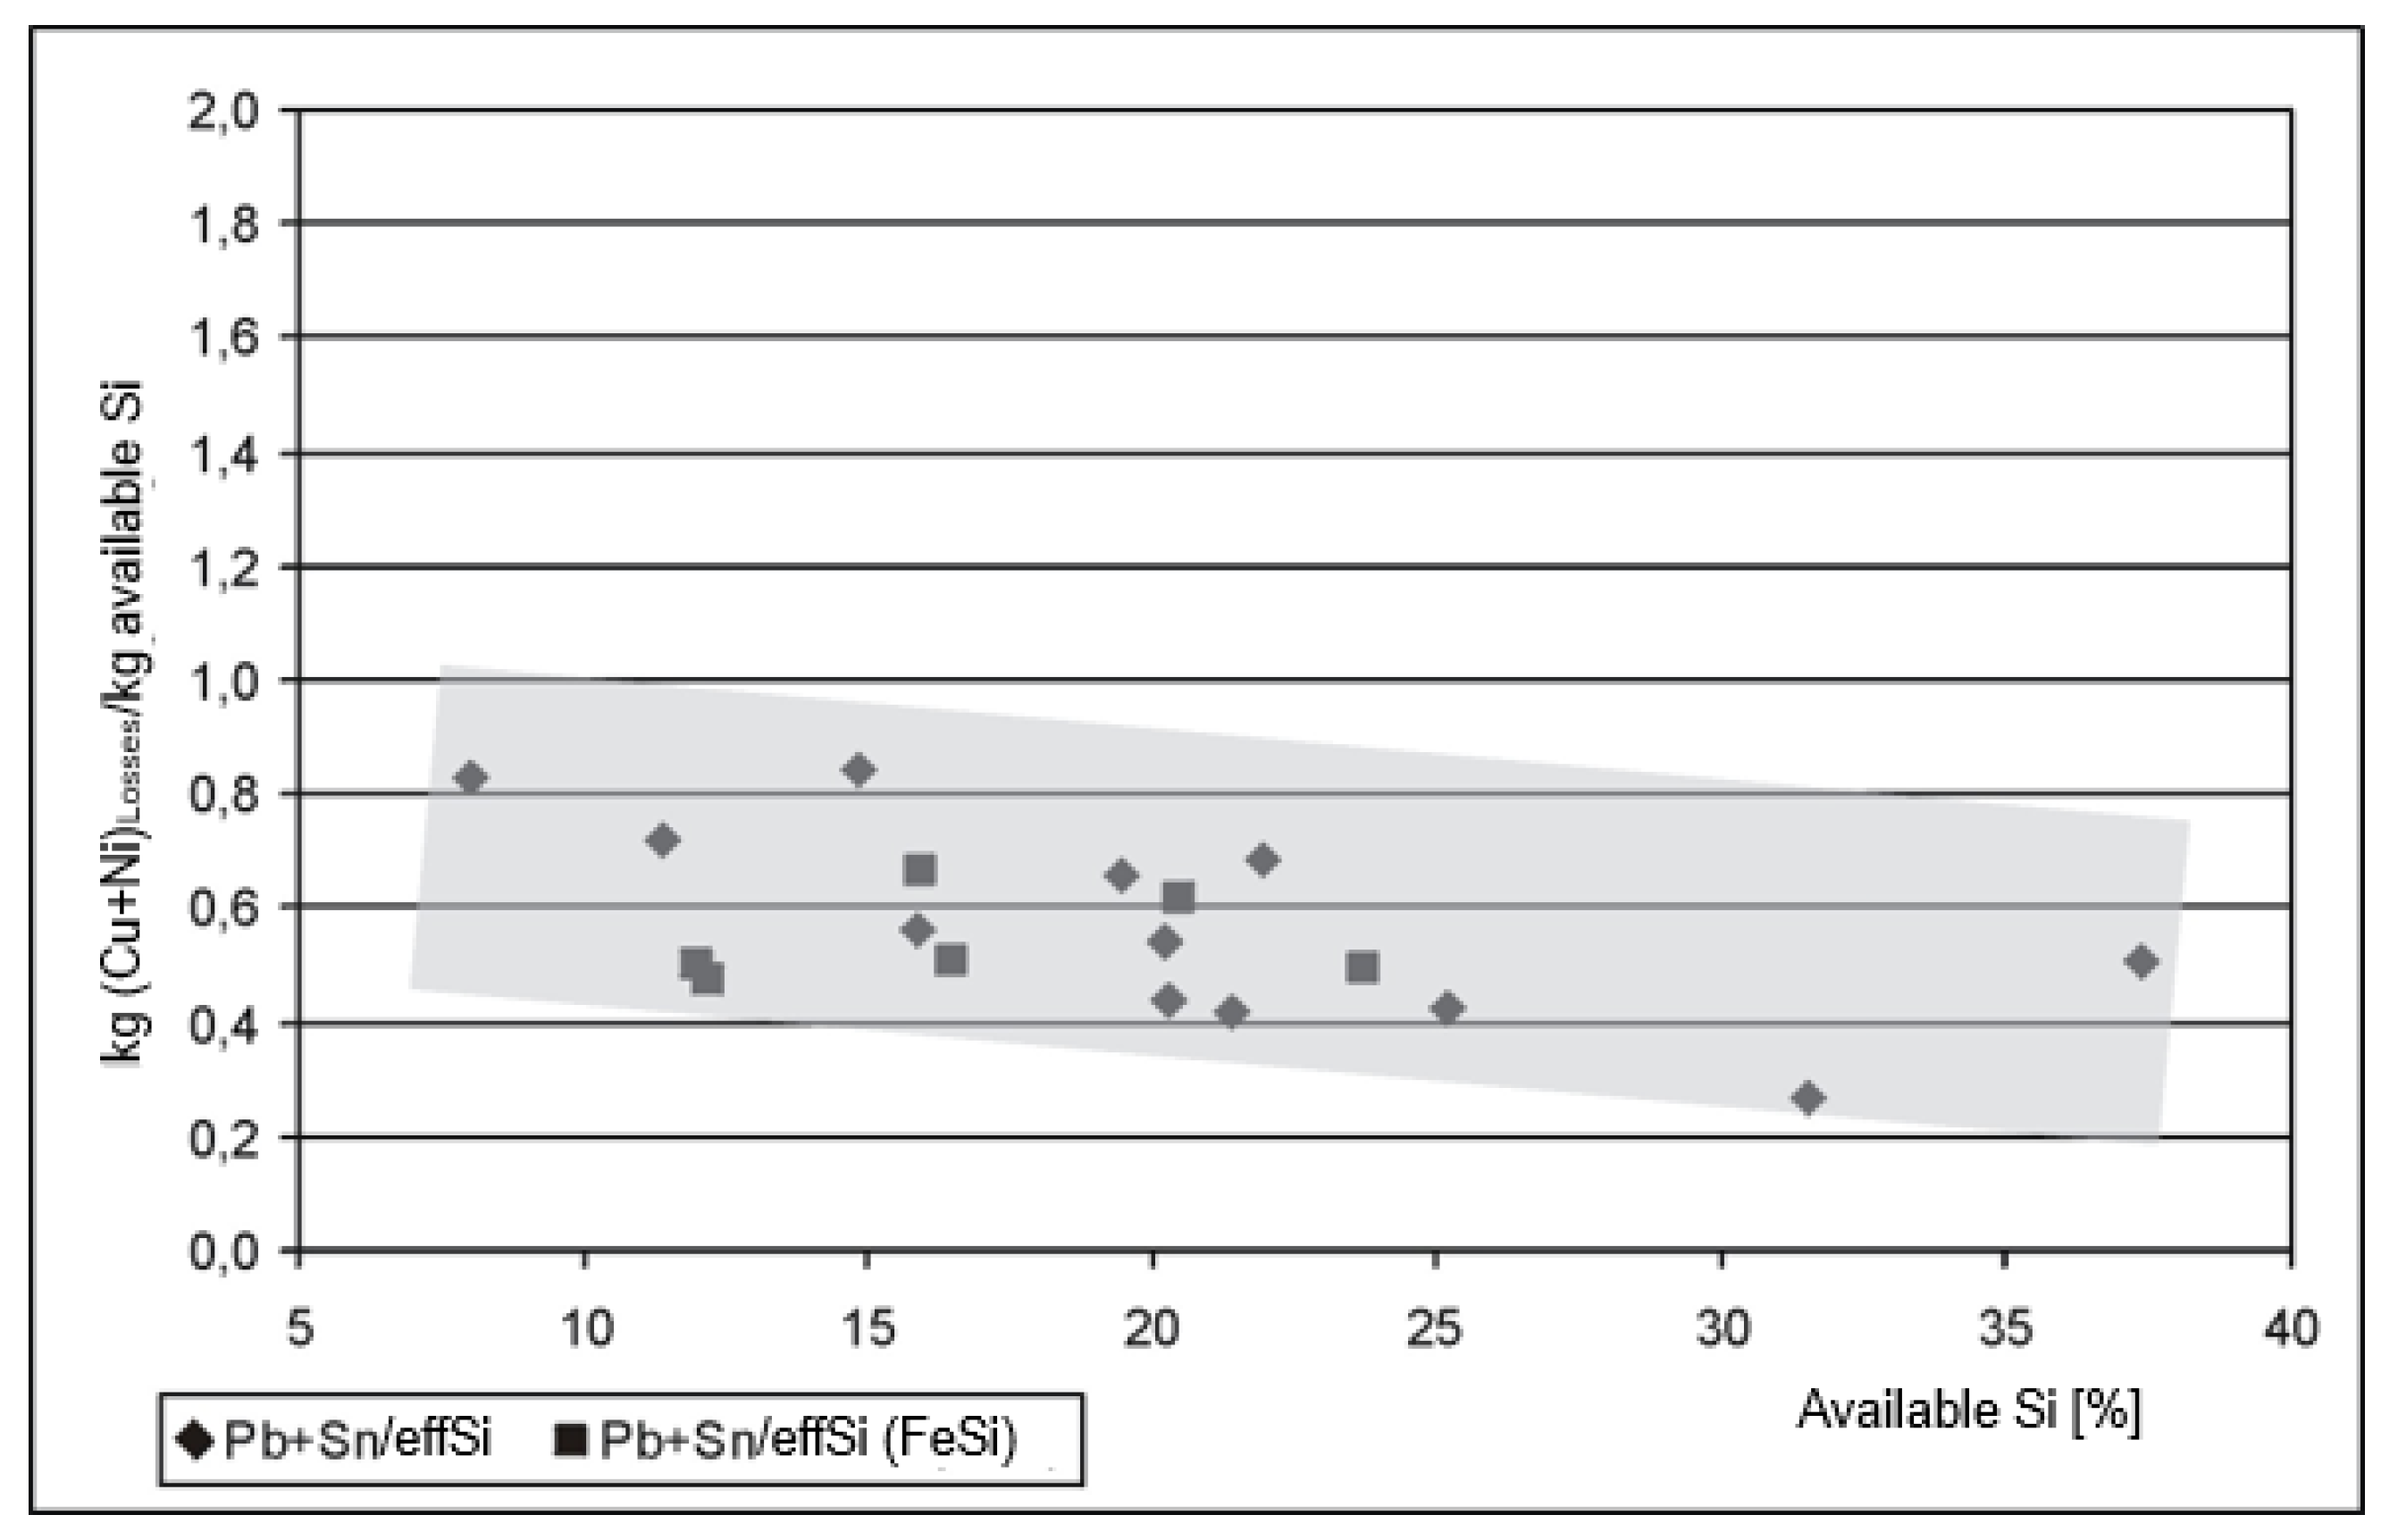
3.4. Lead and Tin Losses in the Segregation Products

Figure 11 shows the losses of lead and tin in the segregation or silicide product in relation to the flow. Lead losses are constantly below 1.5%, while tin losses increase from about 2 to 5% with increasing silicon addition. At over 20%, lead losses are significantly higher by a factor of 10 to 15, and tin losses of over 50% are significantly higher when segregating without silicon addition, and do not allow this method for an economical refining of the raw PbSn composite.
The specific lead and tin losses in the silicide product per kg of “available” silicon show a decreasing tendency for the tests with technical silicon, whereas no tendency is visible for the tests with FeSi addition in the investigated range (Figure 12).

3.5. Experiments with Two-Stage Process Control

The temperature of 900 C selected for casting the first PbSn composite melt allowed only a silicide product with high nickel content to be segregated in the first stage. As expected, the copper contents in the silicide product are significantly lower than in the single-stage tests. In the first stage, only about 46% of the nickel and 4.5% of the copper are converted into a silicide product, although silicon addition was designed for 100% nickel removal as NiSi 2 . The yield of silicon in the silicide product is about 23%, as a large part (of the comparatively small amount) of silicon is oxidized. Lead and tin losses are extremely low at 0.34% and 0.63%, respectively. This first stage still has potential for optimization.
The second stage resulted in a PbSn composite quality comparable to that of single-stage process control. The remaining nickel was completely removed and the final copper content was 3.85%. The result was a copper-rich (67% Cu) silicide product with a nickel content of about 12% and a silicon content of about 14%. Thus, it allows partial pre-separation of nickel from the overall process without major copper losses. However, the two-stage process requires the PbSn composite to be overheated twice to 1300 C with a corresponding duration for the silicon solution.

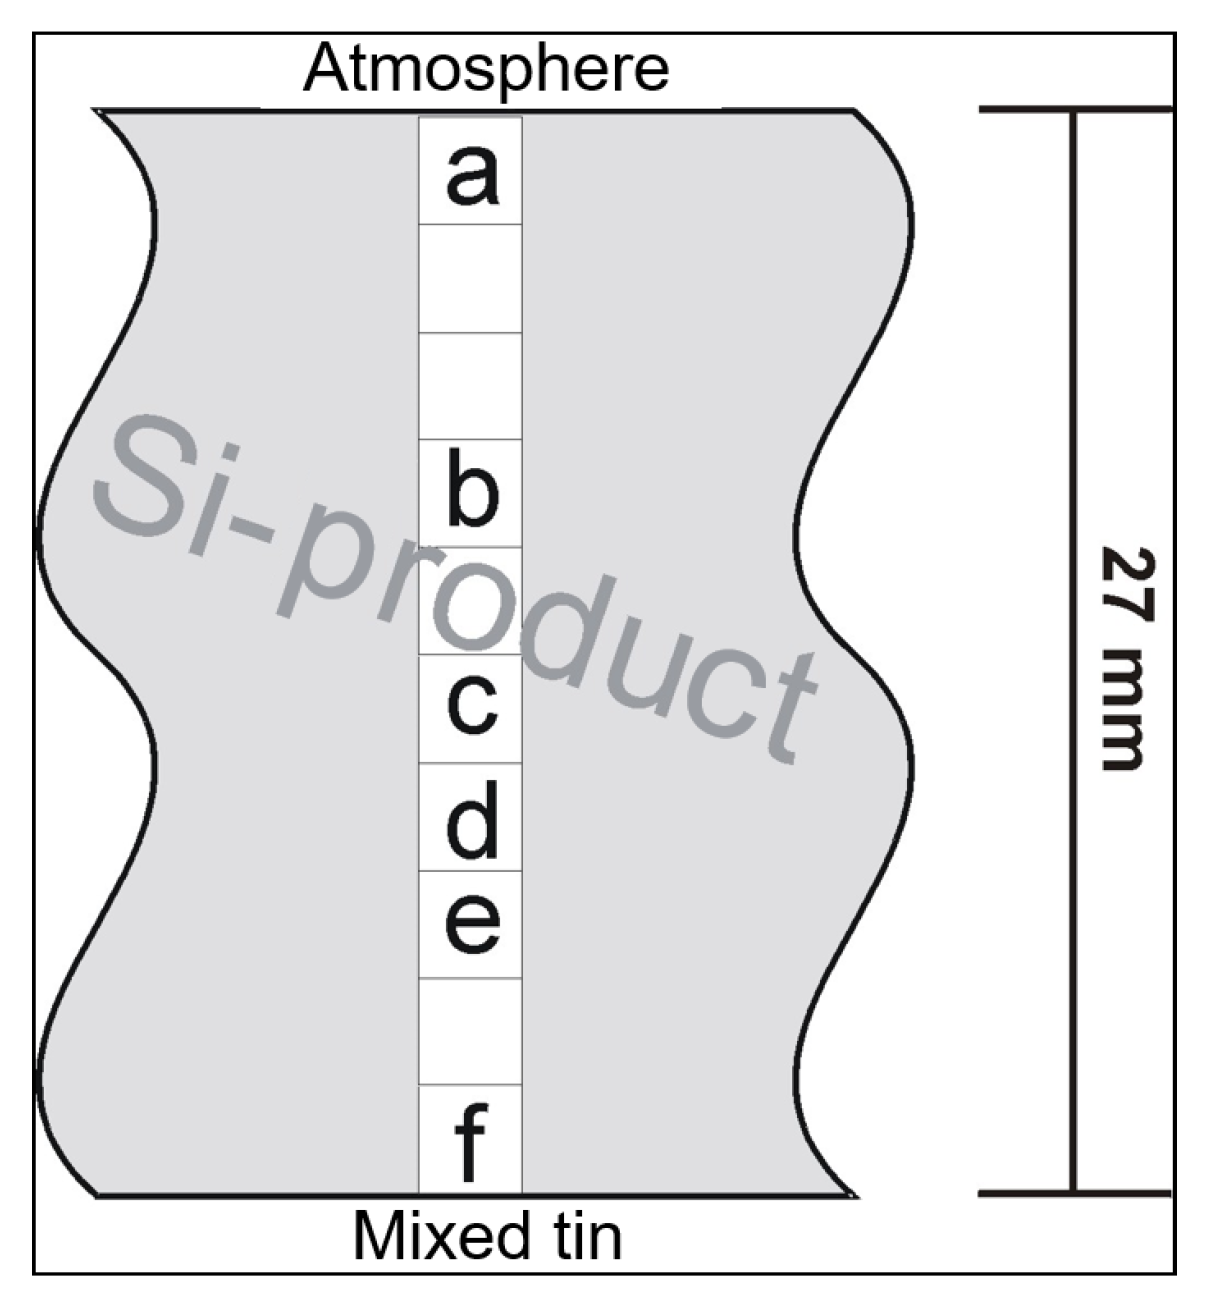
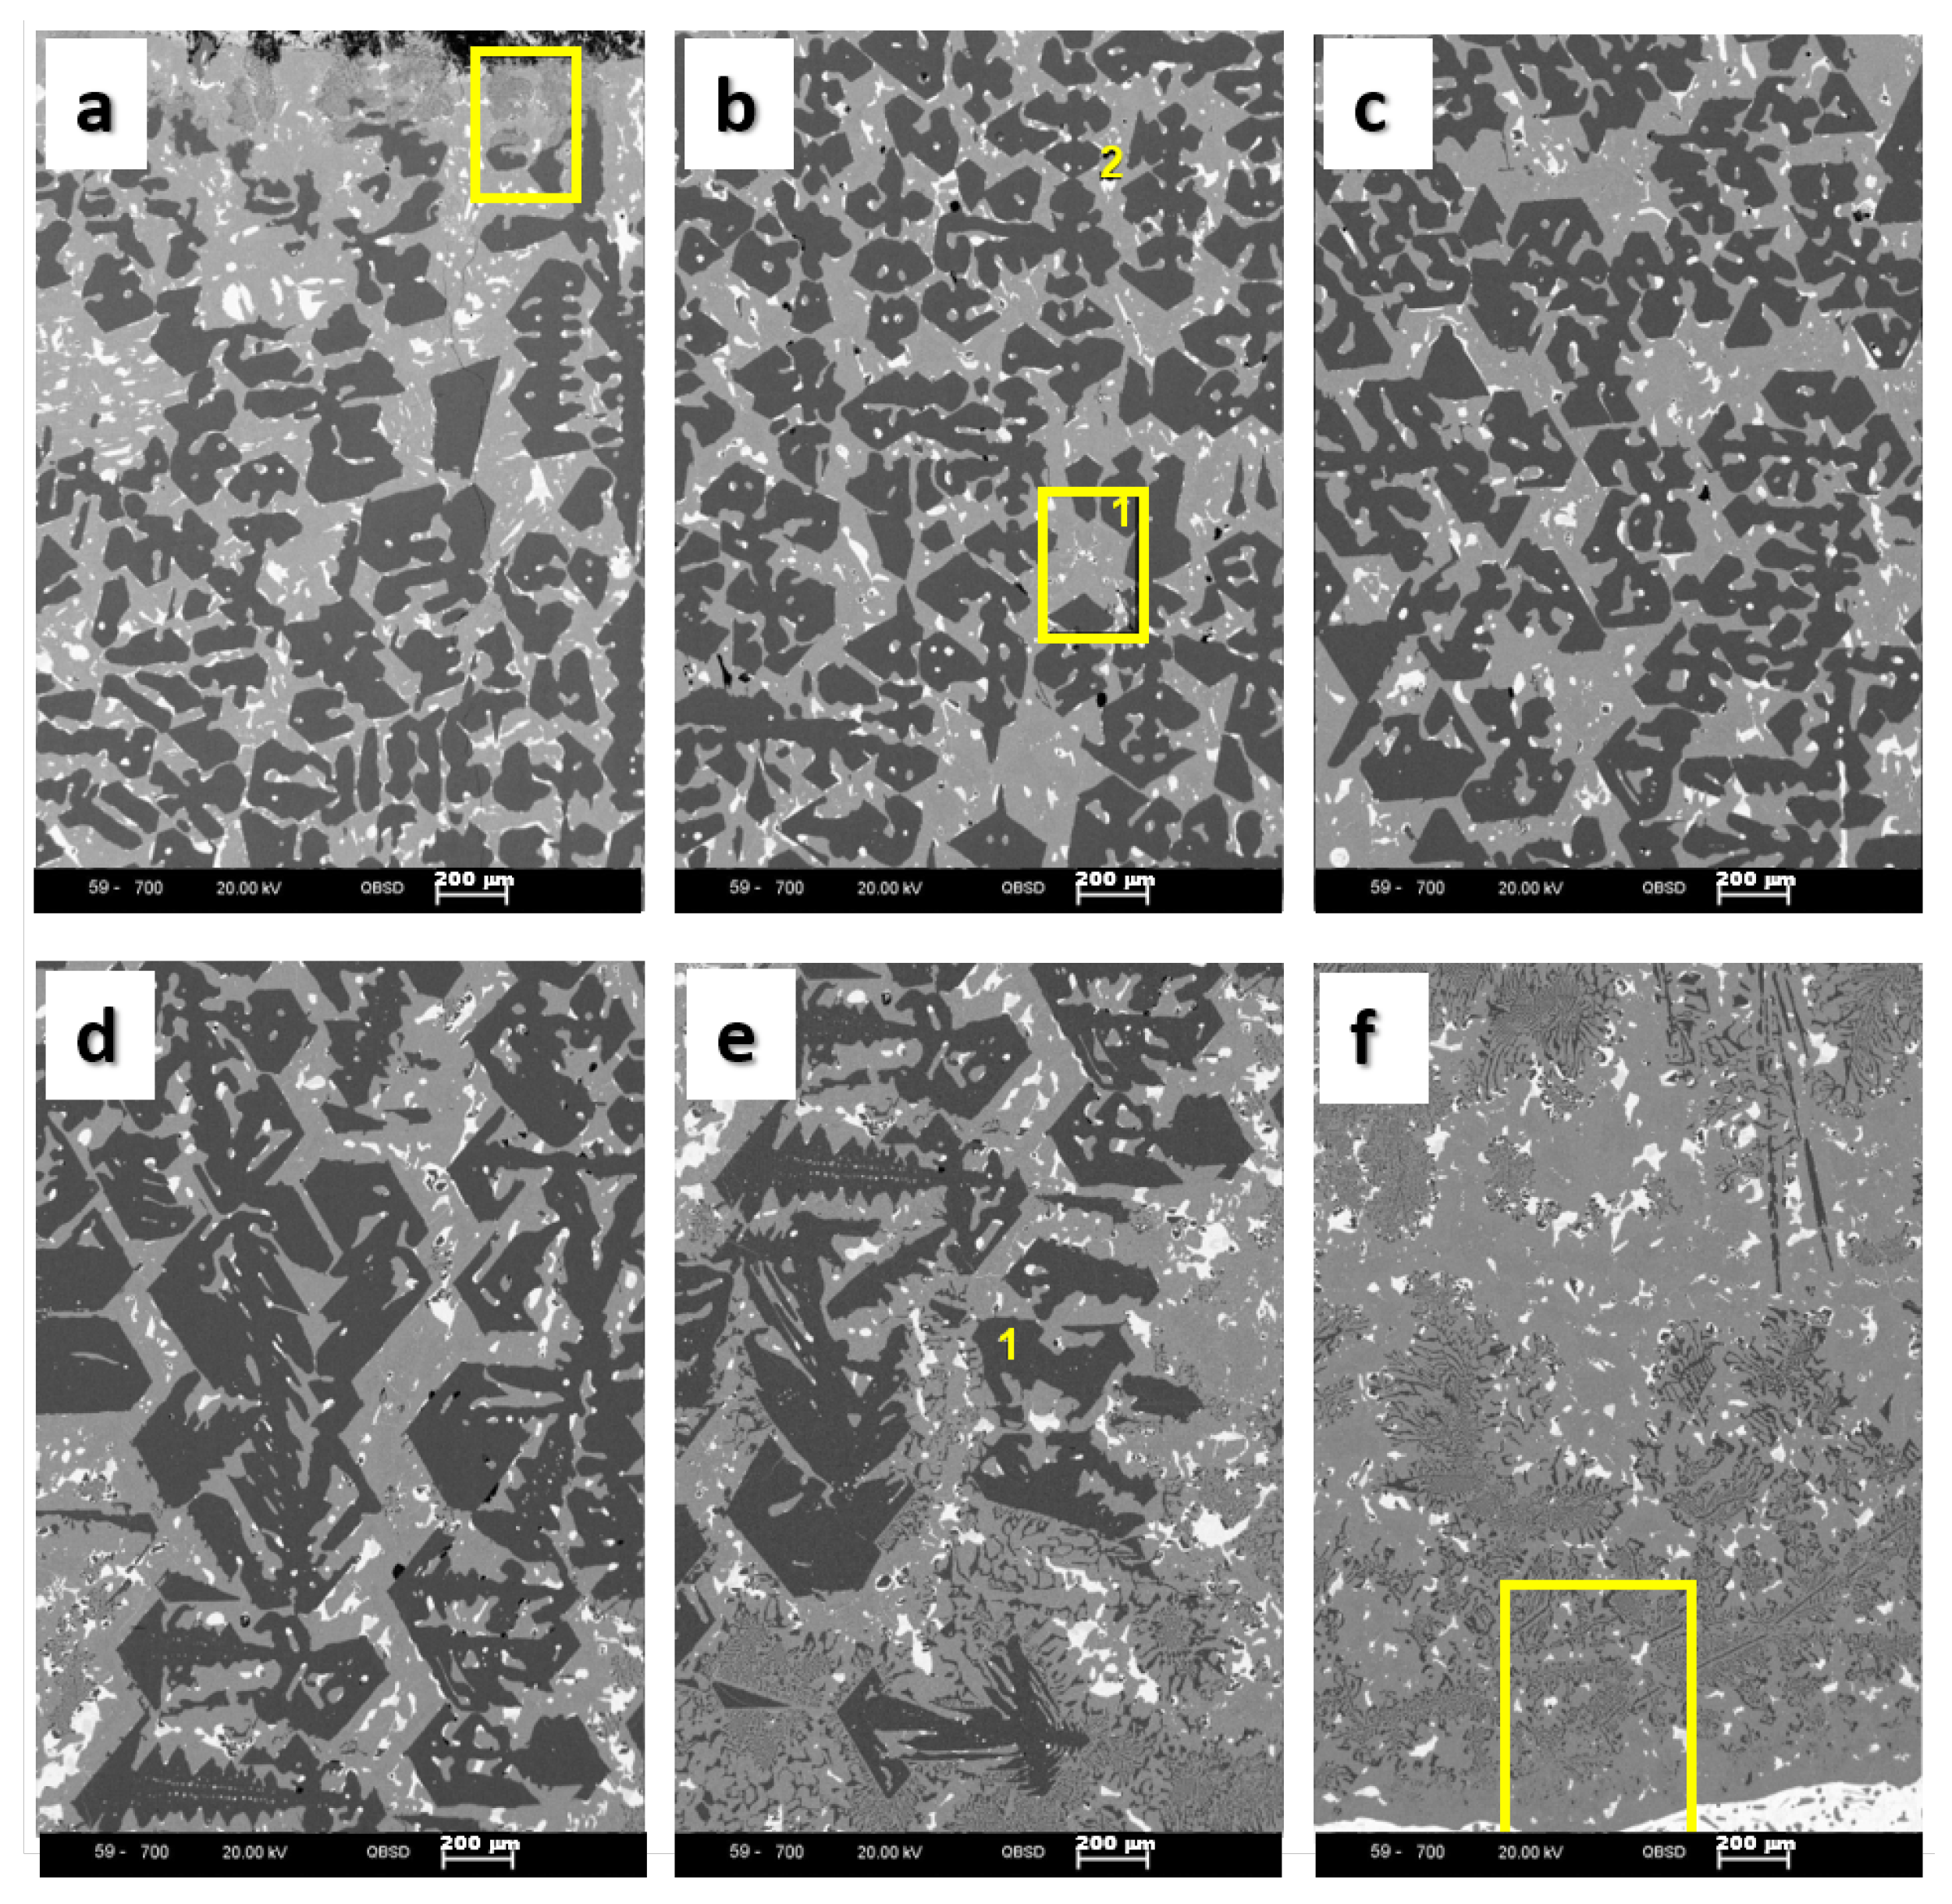
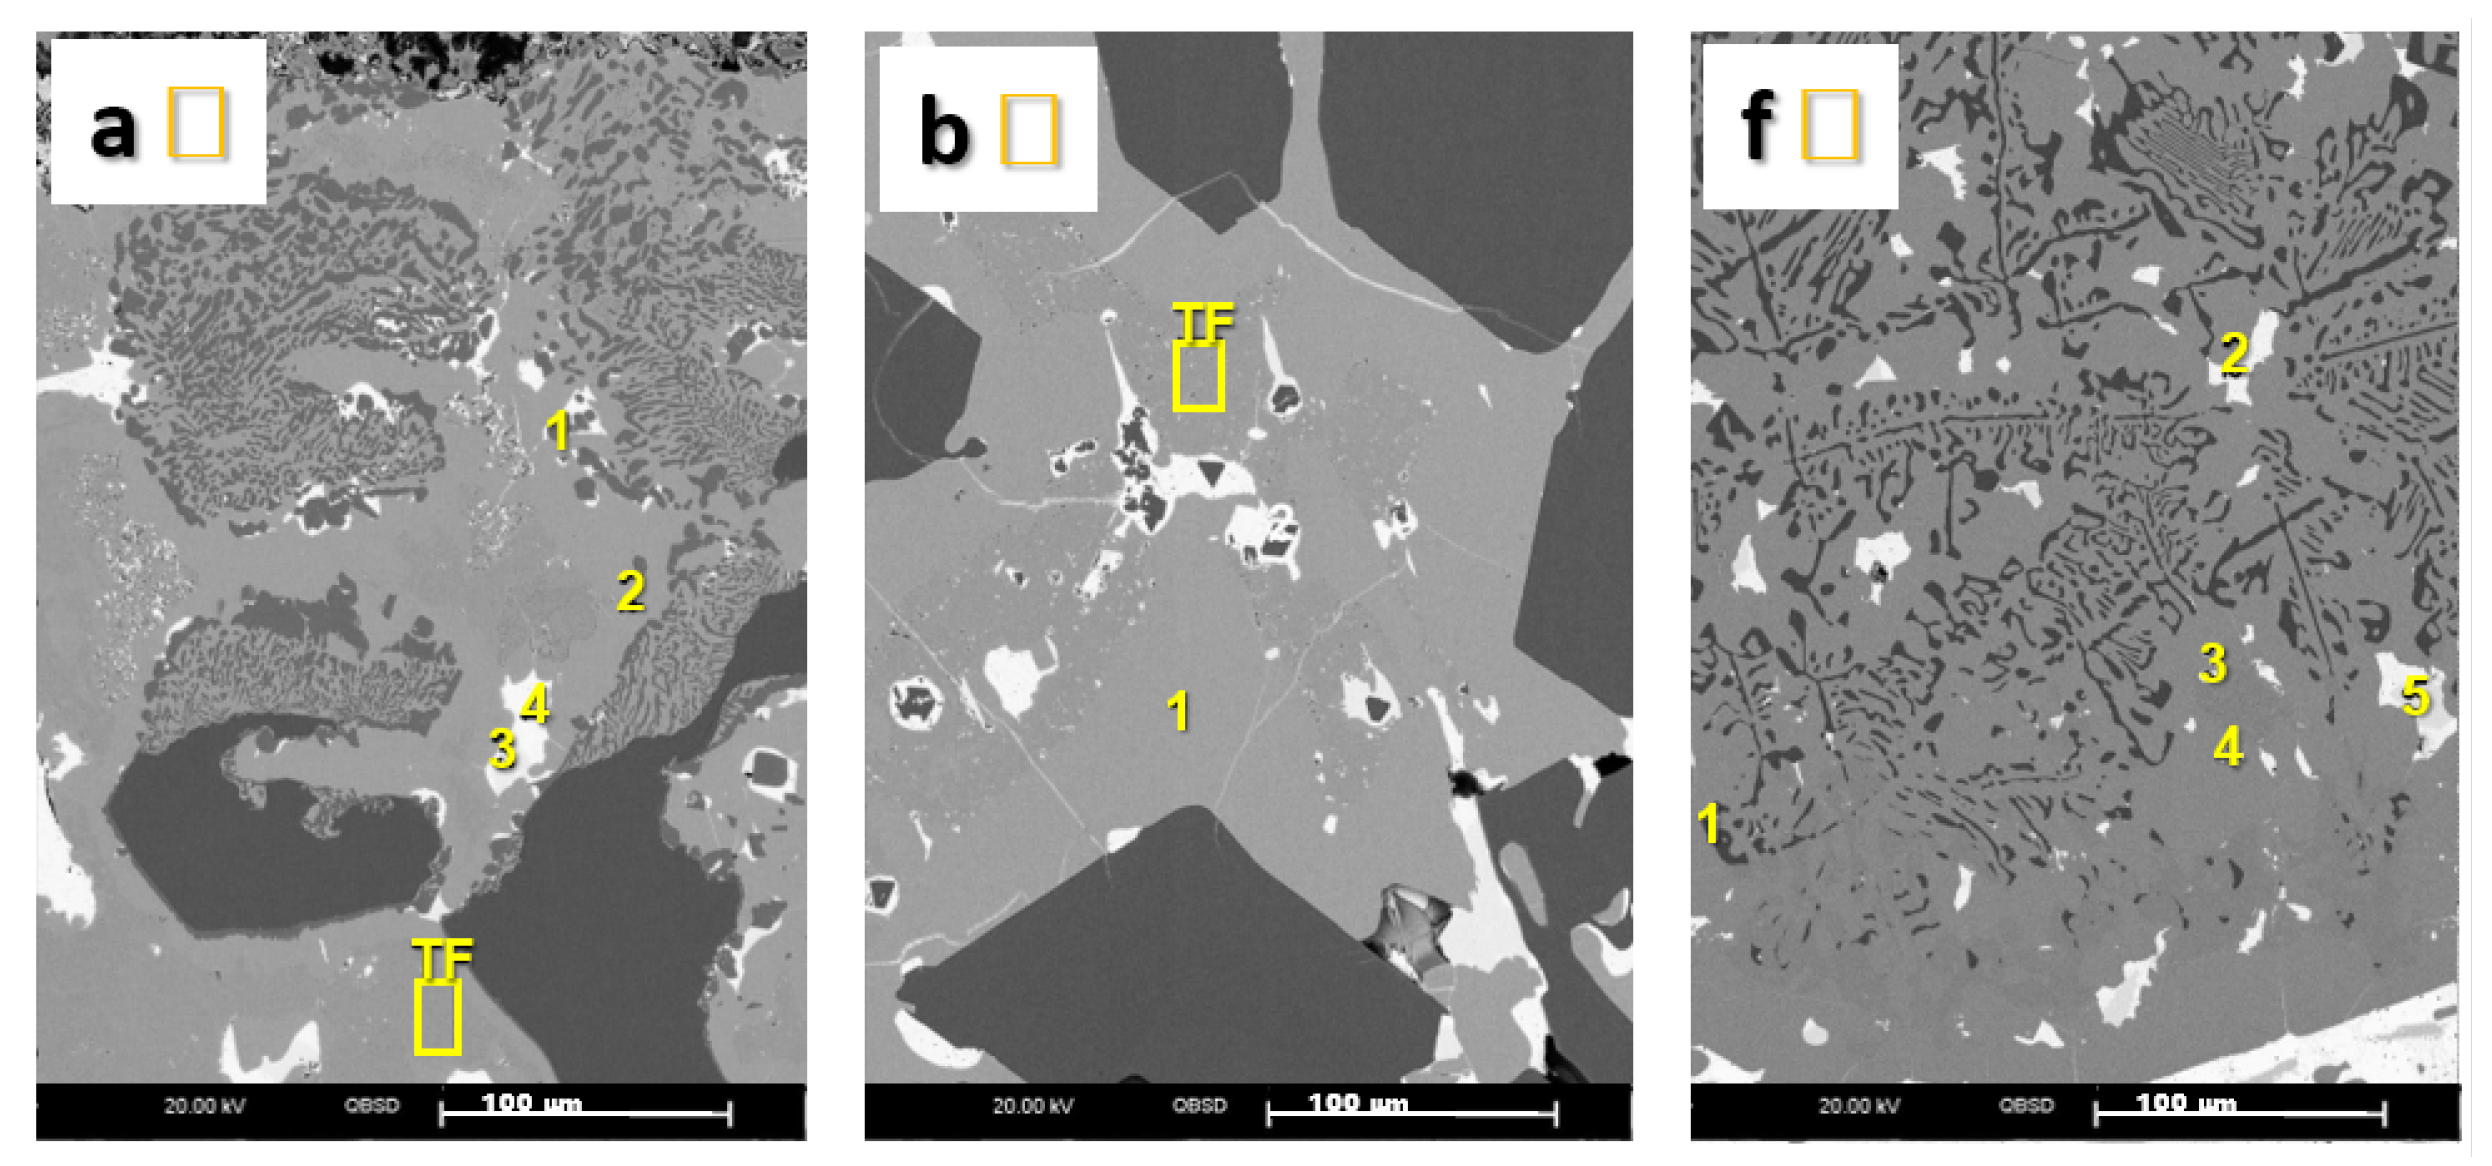
3.6. Metallographic Examination on the Phase Formation in the Silicide Product

A sample of the silicide product from one of the trials was cut out over its entire height, polished, and then examined by scanning electron microscopy (GeminiSEM 500, from company Carl Zeiss AG, Oberkochen - Germany). Table 4 shows the average composition of the silicide product, which was determined in advance by wet chemical analysis.
In the SEM, several samples from the upper edge (phase boundary silicide product–atmosphere) to the lower edge (phase boundary silicide product–PbSn composite) were scanned and the occurring phases were examined for their composition. The following drawing (Figure 13) shows the locations where the samples were taken from the silicide product and the position of the selected images.
Figure 14 shows the SEM images of each analyzed section. Further analysis were made in the regions within the marked square for the sections a, b, and f. These are illustrated in Figure 15.
Figure 14 and Figure 15 of the silicide product show that predominantly coarse, primarily solidified crystals are visible. These are surrounded by a residual phase which subsequently solidified. In addition, other phases (white areas), which are also enclosed by residual melt, can be seen in isolated cases. Those are partially attached to the primarily solidified crystals. The regions of the silicide product at the phase boundaries to the atmosphere and the PbSn composite are characterized by areas of fine crystalline dendrites in the matrix.
In the following Table 5 and Table 6, the micro-analyses are listed in groups according to their chemical composition and solidification morphology. The area percentages were calculated based on the density and length dimensions of each group.
Looking at the stoichiometric compositions (Table 6), the solidification mechanism and the different compounds can be interpreted. In this case, Group 1 (as the analytical mean) is most likely to represent NiSi 2 or NiSi in which copper is incorporated. Group 2 would result in Cu 3 Si with low nickel contents. Group 3 would therefore represent approximately Cu 12 Ni 2 Si 5 . The other groups play only a minor role in terms of quantity, but are indispensable for the interpretation of the processes.
The SEM investigations on a silicide product (silicon addition 30%), including the knowledge from the ternary state diagram copper–nickel–silicon, reveal the following solidification mechanisms.
  • Primarily solidification of NiSi 2 or NiSi (dark large crystals) occurs. Within NiSi 2 copper is obviously integrated.
S N i S i 2 N i S i
  • After nickel depletion, solidification of Cu 3 Si or Cu 12 Ni 2 Si 5 (light gray phase between the dark large crystals) occurs.
S C u 3 S i C u 12 N i 2 S i 5
  • The light gray phase is not homogeneous and shows white precipitates. These consist of tin or CuSn. It is to be assumed that they will react accordingly via secondary reactions:
3 C u 3 S n + 2 S i 3 C u S n + C u 3 S i
3 C u S n + S i C u 3 S i + 3 S n
  • Only in the contact area of PbSn composite–silicides small amounts of lead are detected in addition to tin and copper. These are PbSn composite adhesions.

4. Conclusions

The removal of copper and nickel from PbSn composite is achieved by simple segregation without the addition of a precipitating reagent up to 650 C, whereby nickel is removed completely and copper down to 1.7%. However, the lead and tin losses in the resulting segregation product are very high, as, in this case, higher-melting copper–tin, nickel–tin, or copper–nickel–tin phases are formed, as it can be expected from the phase diagrams of the binary systems. Lower final copper contents can be achieved by continuing the segregation to temperatures below 650 C, as copper–tin phases continue to crystallize. Phase separation is poor with this type of classical segregation due to the low density difference of the phases formed.
If silicon is added to the melt as a precipitating reagent, comparable final copper and nickel contents can be achieved as in the experiments without a precipitating reagent. Here too, nickel is completely removed in all experiments. For this form of segregation of intermetallic phases, comparable results are obtained with technical silicon or with FeSi75 (see Table 7). Iron did not show any influence on the refining effect of the silicon. It can therefore be assumed that the proportion of iron bound to silicon passes through the process quasi-“inert”. This assumption is supported by iron contents below the detection limit in the cast PbSn composite. By using the silicon or ferro-silicon, very good separation could be achieved compared to the experiments without precipitation reagent due to the large difference in density of the phases forming.
Important for a sufficient copper removal is the amount of silicon actually “available” during segregation, which cannot be equal to the added amount during the tests due to oxidation. In the range between 8 and 20%, “available” silicon (based on the initial copper and nickel content), nickel, and iron can be completely removed and final copper contents of about 5% can be achieved, with higher additions even below 4%. Only 60–70% of copper can be removed from the PbSn composite, as it is strongly bound to tin. With a higher silicon supply, higher quality nickel–silicon compounds are formed, so that a smaller proportion of the silicon additive is available for copper removal. An increase in silicon addition above 30% is hardly economically viable, as with the larger volume, increasing lead and tin losses in the silicide product can be expected. The effectiveness of the silicon (kg [Cu + Ni] r e m o v e d /kg Si a v a i l a b l e ) also decreases with increasing silicon turnover.
Neither the cooling rate nor the temperature of the segregating end has any influence on the refining effect. It can be concluded from this that complete phase separation between the PbSn composite and the silicide product has already taken place at 700 C. Likewise, phase separation is not hindered during the tests at the maximum investigated cooling rate. Temporarily holding the temperature at about 800 C did not improve the phase separation. The development of a segregation crucible insert for the separation of the silicide product forming and the PbSn composite has proved to be effective.
Metallographic investigations of the silicide product have shown that nickel–silicon phases precipitate first. Only then are copper–silicon or copper–nickel–silicon phases formed. Cu–Sn phases are formed in secondary reactions.
It could be shown that the removal of copper, nickel, and iron is possible by segregation of intermetallic phases in a technically interesting, simple process. The obtained PbSn composite can be processed in a post-refining process to a saleable alloy. The silicide product can be returned to the copper recovery route.

Author Contributions

B.F. is the principal investigator. S.J. conceived and designed the experiments. S.J. analyzed the data. D.C.C., S.J., and B.F. wrote and edited the manuscript. All authors have read and agreed to the published version of the manuscript.

Funding

This research received no external funding.

Institutional Review Board Statement

Not applicable.

Informed Consent Statement

Not applicable.

Data Availability Statement

Data sharing not applicable.

Acknowledgments

The authors thank Ole Krüger for his assistance in editing this manuscript.

Conflicts of Interest

The authors declare no conflict of interest.

References

  1. Schlesinger, M.E.; King, M.J.; Sole, K.C.; Davenport, W.G. Chapter 19—Chemical Metallurgy of Copper Recycling. In Extractive Metallurgy of Copper, 5th ed.; Schlesinger, M.E., King, M.J., Sole, K.C., Davenport, W.G., Eds.; Elsevier: Oxford, UK, 2011; pp. 389–396. [Google Scholar] [CrossRef]
  2. Th. Goldschmidt AG. Verfahren zur Ausscheidung Einzelner Metalle aus Metallgemischen. Patent Nr. 423245, 1 March 1921. [Google Scholar]
  3. Arnold, A.; Toubartz, F.; Friedrich, B. Cu-Pb-Fe-S-Balances in Cu during Lead Refining; European Metallurgical Conference (EMC); GDMB Gesellschaft für Bergbau, Metallurgie, Rohstoff- und Umwelttechnik: Friedrichshafen, Germany, 2001. [Google Scholar] [CrossRef]
  4. Chattopadhyay, S.; Srikanth, S. The Cu-Pb-Sn (copper-lead-tin) system. J. Phase Equilibria 1994, 15, 553–557. [Google Scholar] [CrossRef]
  5. Marcotte, V.C.; Schroder, K. Cu-Pb-Sn Ternary System: Low Cu Additions to Pb-Sn- Binary System. MRS Online Proceedings Library Archive, Volume 19: Symposium E—Alloy Phase Diagrams; Cambridge University Press: Cambridge, UK, 1982; p. 403. [Google Scholar]
  6. Lavoie, C.; Cabral, C.; D’Heurle, F.M.; Jordan-Sweet, J.L.; Harper, J.M. Effects of alloying elements on cobalt silicide formation. J. Electron. Mater. 2002, 31, 597–609. [Google Scholar] [CrossRef]
  7. Ottaviani, G. Metallic Silicides; World Scientific Publishing Co.: Geneva, Switzerland, 1999; pp. 138–152. [Google Scholar]
  8. Kroll, W. Fortschritte auf dem Gebiet der Metalltrennung. Metall Erz 1938, 35, 252–254, 282–286. [Google Scholar]
  9. Yazawa, A.; Itagaki, K.; Matsuda, K.; Kanazawa, K.; Hayashi, M.; Katada, K. Method for Separation Cobalt, Nickel and the Like from Alloys. U.S. Patent No. 4657585A, 14 April 1987. [Google Scholar]
  10. Itagaki, K.; Kanazawa, K.; Hayashi, M.; Matsuda, K.; Yazawa, A. Fundamental study on the recovery of cobalt and nickel from iron-based molten alloys by using metal solvents. In Recycle and Secondary Recovery of Metals; Taylor, H.Y., Sohn, N.J., Eds.; TMS AIME: Warrendale, PA, USA, 1985. [Google Scholar]
  11. Kubaschewski, O.; Evans, E.L.; Alcock, C. Metallurgical Thermochemistry, 5th ed.; Pergamon Press Ltd.: Oxford, UK; London, UK, 1979. [Google Scholar]
  12. Kubaschewski, O.; Alcock, C.; Spencer, P. Materials Thermochemistry, 6th ed.; Pergamon Press Ltd.: Oxford, UK; New York, NY, USA; Seoul, Korea; Tokyo, Japan, 1993. [Google Scholar]
  13. Villars, P.; Prince, A.; Okamoto, H. Handbook of Ternary Alloy Phase Diagrams, Volume 8; ASM International; The Materials Information Society: Geauga County, OH, USA, 1995; pp. 9806–9818. [Google Scholar]
  14. Kumar, K.C.H.; Kussmaul, A.; Lukas, H.L.; Effenberg, G. Cu-Ni-Si (Copper-Nickel-Silicon): Datasheet from Landolt-Börnstein—Group IV Physical Chemistry; Volume 11C2: “Non-Ferrous Metal Systems. Part 2”; Springer: Berlin/Heidelberg, Germany, 2007. [Google Scholar] [CrossRef]
Figure 1. Liquidus projection in the Cu–Ni–Si three-substance system [13].
Metals 11 00081 g001
Figure 2. Section of the ternary system Cu–Ni–Si with the working line (points 1 to 4 of the composition for the cooling curves).
Metals 11 00081 g002
Figure 3. Qualitative cooling curves of points 1 to 4 from the ternary system Cu–Ni–Si.
Metals 11 00081 g003
Figure 4. Segregation insert for the separation of silicide product and PbSn composite melt.
Metals 11 00081 g004
Figure 5. Final copper and nickel contents in PbSn composite as a function of the “available” silicon.
Metals 11 00081 g005
Figure 6. Final copper and nickel contents in PbSn composite as a function of casting temperature.
Metals 11 00081 g006
Figure 7. Quantity distribution for the products depending on the “available” silicon (cooling rate ∼5 C/min, temperature segregation 650 C).
Metals 11 00081 g007
Figure 8. Quantity distribution of the products of the experiments with FeSi addition as a function of the “available” silicon (cooling rate ∼5 C/min, temperature segregation 650 C).
Metals 11 00081 g008
Figure 9. Percentage of copper and nickel separation in relation to the entry as a function of the “available” silicon.
Metals 11 00081 g009
Figure 10. Cu and Ni mass removed from the PbSn composite per kg of “available” Si as a function of the “available” Si.
Metals 11 00081 g010
Figure 11. Lead and tin losses in the silicide product depending on the “available” silicon (cooling rate 5 C/min, temperature segregation 650 C).
Metals 11 00081 g011
Figure 12. Specific lead and tin losses in the silicide product per kg of “available” silicon as a function of “available” silicon.
Metals 11 00081 g012
Figure 13. Drawing of the point where the sample was taken from the silicide product to conduct the SEM analysis shown in Figure 14.
Metals 11 00081 g013
Figure 14. SEM images of the silicide product (subfigure (a) is from the phase boundary between silicide product and atmosphere, and subfigure (f) is from the phase boundary between silicide product and PbSn composite. Subfigures from (be) refers to the silicide product. The rectangles indicates the location of the partial sections seen in Figure 15.
Metals 11 00081 g014
Figure 15. Enlarged sections of Figure 14a,b,f. TF = partial area, as seen in Table 5.
Metals 11 00081 g015
Table 1. Results of the investigations of Yazawa and others [9,10].
Removal of Cobalt and Nickel from a Lead-Tin Melt by Adding Silicon at 1250 C
Pb-Sn Ratio of
the Initial Melt
Separated Fe-Si PhaseDistribution Coefficient
Si Phase/Pb Phase
Pb [%]Sn [%]Fe [%]Si [%]Co [%]Ni [%]L Co L Ni L Fe
752571.418.14.55.061670803330
505072.117.44.964.5343024770
257572.717.45.602.369515630
Table 2. Results of the investigations according to Yazawa et al. [9,10].
Effect of Silicon Addition When Removing Nickel from a Lead or Lead-Tin Melt at 1250 C
Pb-Sn-PhaseNi-Si-PhaseDistribution Coefficient
Ni [%]Si [%]L Ni
100% Pb87.112.963
69.830.22700
50.050.0100,000
50% Pb–50% Sn87.013.012
69.730.3400
49.450.61180
Table 3. Experimental plan.
SeriesSi-Content [%]Temperature End of Segregation [ C]Cooling Rate
I0650∼5 C/min
II17.5–40650∼5 C/min
III25600, 650, 750∼5 C/min
IV25650∼5 C/min
∼5 C/min with ∼30 min holding at 800 C
∼10 C/min
V25 (9/16)650∼5 C/min
25 (9/16)900/650∼5 C/min
VI17.5–37.5 FeSi650∼5 C/min
Table 4. Result of the wet chemical analysis of the silicide product.
ElementPbSnCuNiSi
[%]1.218.8051.1021.0019.10
Table 5. Results of the phases composition within a silicide phase.
GroupPicture/Nr.[wt.%]Area Percentage [%]
PbSnCuNiSi
1f □/1--9.3350.8939.78∼45.8
e /1--7.1552.0840.76
b /1--6.5952.6640.76
b □/2--8.6450.3041.06
Average--7.9351.4840.59
2f □/4-1.5086.022.649.85∼49.5
b □/1--88.201.6210.18
a □/2-2.1785.552.659.63
a □/TF--84.025.8510.13
Average-0.9285.953.199.95
3f □/3--73.0914.5212.38
b □/TF-1.1673.4613.6911.69
Average-0.5873.2814.1112.04
4b /2-98.821.18--∼4.4
a □/4-98.491.51--
Average-98.661.35--
5f □/5-61.2537.880.87-<0.1
a □/3-61.2738.73--
Average-61.2638.310.44-
6a □/1---70.6229.38<0.1
7f □/23.4894.152.37--<0.1
Table 6. Stoichiometric composition of the phases (according to the average values).
GroupPbSnCuNiSiKnown Phase
1--1712NiSi 2
2--2517Cu 3 Si
3--512Cu 12 Ni 2 Si 5
4-391--Sn
5-11--SnCu (h-Phase)
6---11NiSi
71472--Sn
Table 7. Average composition of crude PbSn composite, silicide product, and PbSn composite.
Pb [%]Sn [%]Cu [%]Ni [%]Fe [%]Si [%]
Raw PbSn composite63–6834–36∼11∼2.5<0.01<0.01
PbSn composite62–6630–333.5–6<0.01<0.01<0.01
Silicide product<26–750–6020–25<715–18
Publisher’s Note: MDPI stays neutral with regard to jurisdictional claims in published maps and institutional affiliations.

