Article

Effect of Dynamic Recrystallization on the Transformed Ferrite Microstructures in HSLA Steel

1
Key Laboratory of Superlight Materials and Surface Technology of Ministry of Education, College of Material Science and Chemical Engineering, Harbin Engineering University, Harbin 150001, China
2
Research and Development Division, Thailand Institute of Nuclear Technology, Nakorn Nayok 26120, Thailand
*
Authors to whom correspondence should be addressed.
Metals 2020, 10(6), 817; https://doi.org/10.3390/met10060817
Submission received: 6 May 2020 / Revised: 15 June 2020 / Accepted: 16 June 2020 / Published: 18 June 2020

Abstract

:
The flow stress behavior of high-strength low-alloy (HSLA) steel at different true strains was studied using a hot compression test. The effect of dynamic recrystallization (DRX) on the transformed ferrite microstructures was investigated with electron backscatter diffraction (EBSD). The EBSD analysis indicated that the fraction of high-angle grain boundaries (HAGBs) and DRX increased with increasing true strain. The low-angle grain boundaries (LAGBs) were gradually transformed into HAGBs with increasing DRX degree. When the true strain was increased to 0.916, the fraction of HAGBs increased to 85% and the fraction of DRX increased to 80.3%. The relatively high fraction of HAGBs was related to the complete DRX. The dislocations and substructures in the tested steel at different true strains were characterized by transmission electron microscopy (TEM). TEM observation shows that the nucleation of the dynamically recrystallized grains occurred by the bulging of the original grain boundaries. The DRX nucleation mechanism of the HSLA steel is the strain-induced grain boundary migration mechanism.

1. Introduction

High-strength low-alloy (HSLA) steel is broadly applied in construction, ship building and automobile manufacturing due to its weldability, corrosion resistance and specific strength [1,2,3,4]. HSLA steels through the hot-working process are reasonably obtained with excellent mechanical properties. In these processes, the dynamic recrystallization (DRX) is an important method for controlling the evolution of the microstructure and softening mechanism. DRX plays an important role in improving the hot workability and grain refinement of steels. In addition, DRX is an effective method for improving the mechanical properties of steels [5,6,7,8]. Hence, it is essential to investigate the DRX characteristics of HSLA steels during hot deformation.
The isothermal hot compression process of HSLA steel has been studied to understand its dynamic recrystallization behavior under different conditions [9,10]. Normally, recrystallized grains size increases with an increase in temperature of the isothermal hot compression, and strain rate decreases [11,12]. However, the average size of recrystallized grains increases slightly. Some scholars have investigated the DRX characteristics of HSLA steels. Eghbali [13] investigated the effect of strain rate on the continuous DRX behavior of a low-carbon microalloyed steel. It was found that the effect of continuous DRX on grain refinement increased with an increase in strain rate. Shaban et al. [14] studied the effect of deformation parameters on the DRX behavior of austenite in a Nb-Ti microalloyed steel. They reported that DRX occurred more readily with increasing temperature and decreasing strain rate. Shen et al. [15] researched the effect of deformation conditions on the microstructure evolution of ferrite during intercritical deformation in low-carbon microalloyed steels, and the study showed that continuous DRX was induced by a small strain of 0.25 when the temperature was 750 °C and the strain rate was 0.1 s−1. Fu et al. [16] reported that the relationship between stress to strain, strain rate and temperature by dynamic compression tests, and concluded that the hardening and softening are related to the transformation in microstructures. The dynamic recrystallization temperature at 600 °C was found to be the one important influencing factor of those conditions. However, there has been a lack of data on hot deformability and phase transform during hot deformation processing at high temperatures by also determining the various true strains in the hot-compression test. Hence, it is necessary to further study the microstructure evolution mechanism of HSLA steels under different conditions using the electron backscatter diffraction (EBSD) technique and transmission electron microscopy (TEM).
In this paper, isothermal compression tests with different true strains were performed on an MMS-200 thermal simulator. The objective was to investigate the effect of DRX on the transformed ferrite microstructures in HSLA steels. The evolution mechanisms of the microstructures at different true strains were characterized by the EBSD and TEM. Finally, the DRX nucleation mechanism in the HSLA steel was determined by TEM analysis.

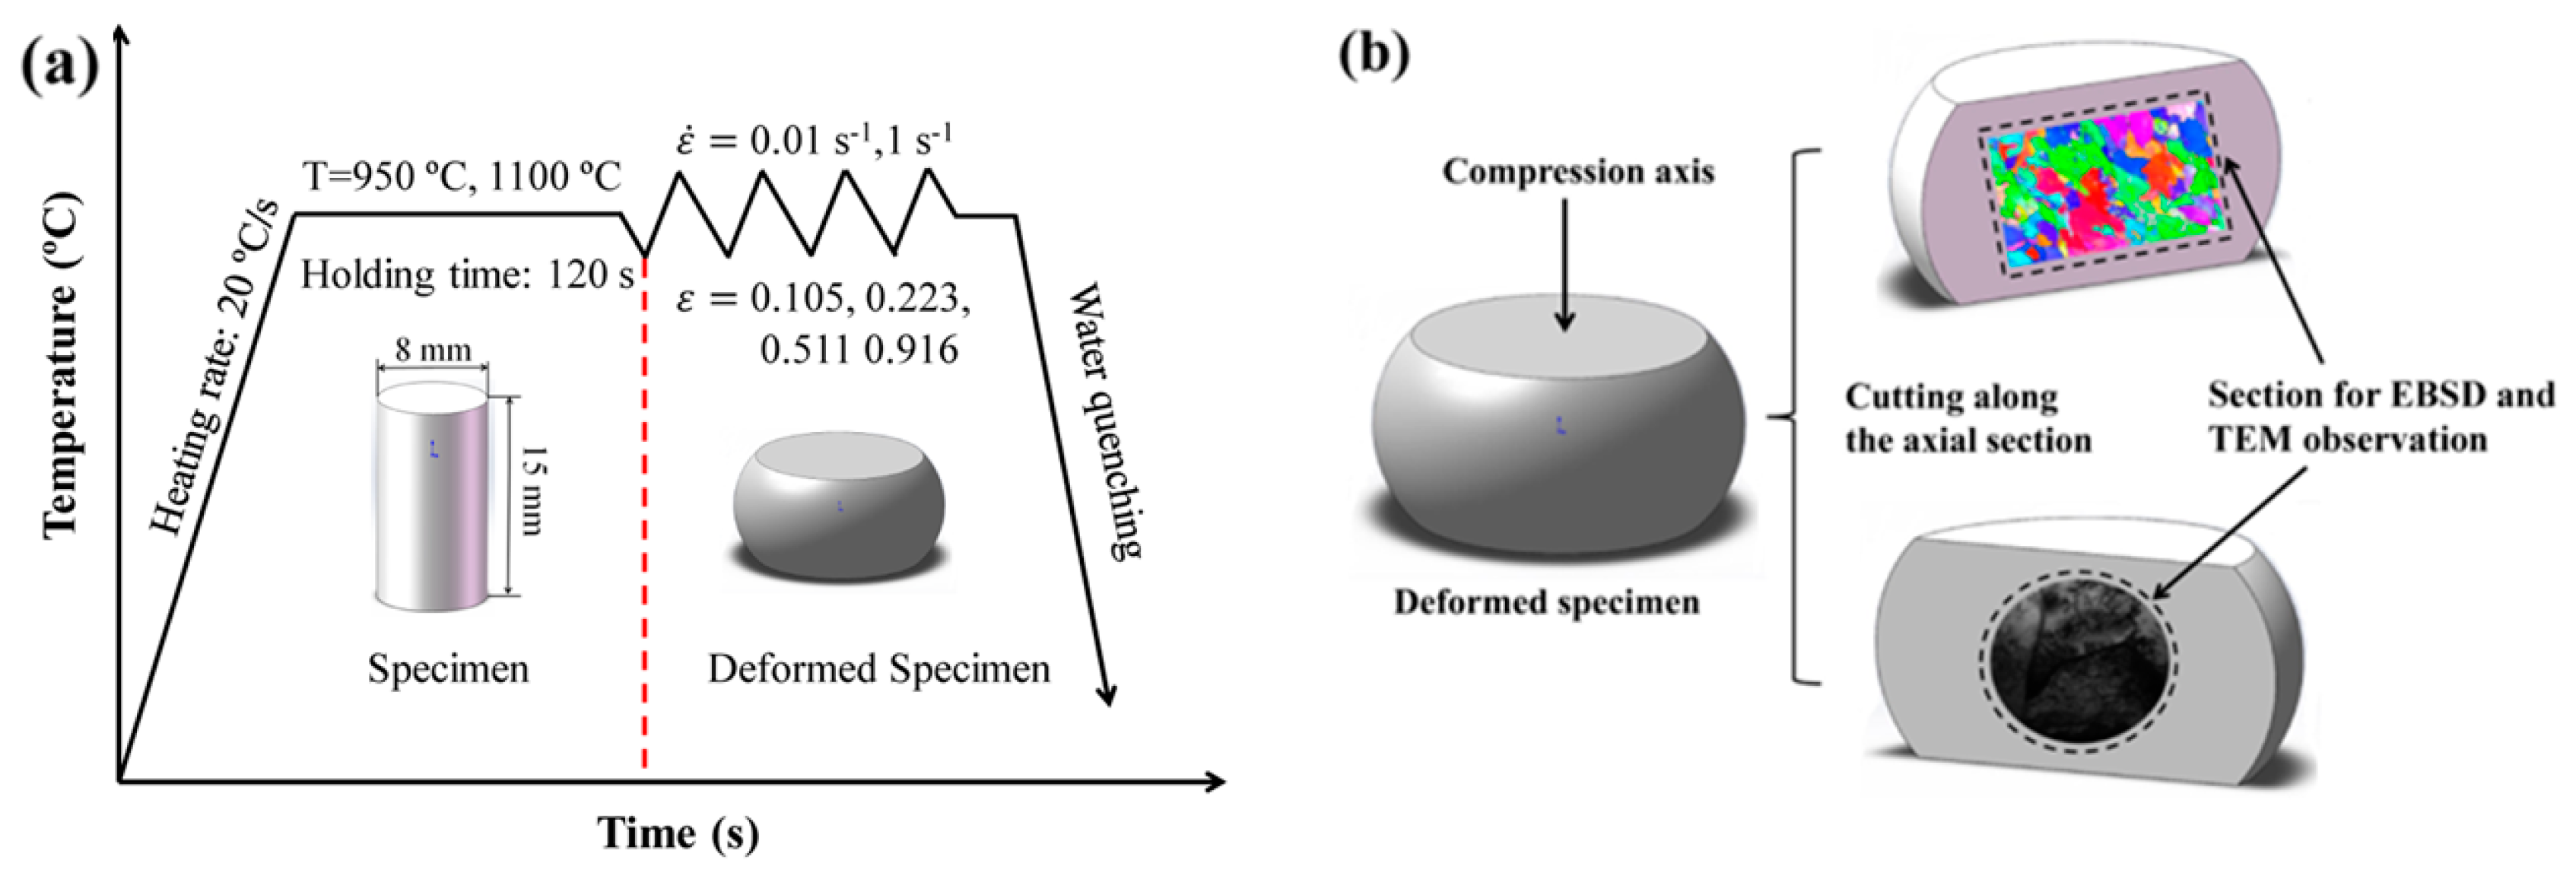
2. Materials and Methods

HSLA steel ingot is obtained by melting in a vacuum induction furnace. The ingot is 200 mm × 100 mm × 100 mm in size and 15.5 kg in weight. The chemical composition of the tested steel is listed in Table 1. The critical transformation temperatures of HSLA steel were measured by using a thermal dilatometer (402C Expedis Supreme, Netzsch Corporation, Bavaria, Germany). The cylindrical specimen with the size of Φ 8 × 15 mm was machined from the center area of the ingot for the hot compression test. Hot compression tests were conducted on a MMS-200 thermal-mechanical simulator (Northeastern University, Shenyang, China). The deformation temperature was 950 °C and 1100 °C, and the strain rate was 0.01 s−1 and 1 s−1, respectively. All specimens were put under argon atmosphere during hot compression tests. Both ends of the specimen were covered with tantalum foils to reduce friction between the specimen and anvils. The experimental process is shown in Figure 1a. The specimens were heated to the deformation temperature at 20 °C/s and held for 120 s, and then compressed to the true strain of 0.105, 0.223, 0.511 and 0.916 at the set deformation temperature and strain rate, respectively. All specimens were water-cooled to room temperature immediately after deformation to retain a high-temperature microstructure. The deformation specimens were cut along the axial section for microstructure observation, and the observed area of the specimens is illustrated in Figure 1b.
To study the effect of the true strain on the DRX behavior of the investigated steel, the microstructures of the deformed specimens were observed and analyzed using optical microscopy (Olympus PME-3, Olympus Corporation, Tokyo, Japan), EBSD (Hitachi S-3400, Hitachi Limited, Tokyo, Japan) and TEM (JEM-1200EX, JEOL, Tokyo, Japan). The cut surface to be used for optical microscopy observation was ground, polished and etched in a solution of 4 mL nitric acid and 96 mL ethanol. Dynamic recrystallization evolution was studied by EBSD technology. The EBSD experiment was conducted on a Hitachi S-3400 scanning electron microscope. The HKL Channel 5 software (Version 4.3, Oxford Instruments, Oxfordshire, UK) was used to analyze the EBSD data. In order to prepare the EBSD specimens, the deformed specimens were mechanically polished and then subjected to vibration polishing for 3 h. Dislocations and grain boundaries were characterized by using a TEM operating at 200 kV. The specimens for TEM were prepared using an ion-beam thinning method after mechanically grinding to 40 um.

3. Results and Discussion

3.1. Critical Transition Temperatures of HSLA Steel

The critical transition temperatures of the tested steel determined by a thermal dilatometer are shown in Figure 2. Ac1 is the starting temperature for the transformation from ferrite to austenite. Ac3 is the temperature at which austenite phase transformation is completed. Ac1 and Ac3 were determined to be 806.1 °C and 870.4 °C, respectively, by the tangent method. Therefore, when the temperature was higher than 870.4 °C, the microstructure of the tested steel was single-phase austenite.

3.2. Hot Deformation Behavior

Figure 3 shows the true stress-true–strain curves of the tested steel at different strains. It should be noted that the specimen containing metallurgical defects will cause a reduction in flow stress or a sharp fluctuation in the true stress–strain curves during the hot compression process. Therefore, in order to avoid metallurgical defects that make the experiment unrepeatable, all specimens were cut from the center of the steel ingot. This is because the microstructure in the center of an ingot is more uniform and there are fewer metallurgical defects. As shown in Figure 3, the curves with the same temperature and strain rate overlapped each other, indicating that the hot deformation process of the tested steel had a high repeatability. In addition, Figure 3 indicates that the deformation conditions had a great influence on the flow stress of the steel. When the tested steel was deformed at 950 °C and 1 s−1, Figure 3a shows that the flow stress increased slowly with a corresponding increase in the true strain until the steady stress was reached, and the peak stress did not appear during the whole deformation process. However, when the tested steel was deformed at a lower strain rate (950 °C/0.01 s−1) or a higher temperature (1100 °C/0.01 s−1), as shown in Figure 3b,c, the curves show that the true stress gradually increased to the peak stress with the increase in strain, and then began decreasing slowly. The lower strain rate provides more time for DRX grain nucleation and dislocation annihilation [17,18,19,20]. In addition, the higher deformation temperature can promote grain boundary migration and dislocation movement [21,22,23,24]. The DRX can be carried out more fully at a higher deformation temperature and a lower strain rate [25]. Therefore, the dynamic softening effect is enhanced, and the flow stress is reduced. The yield strength (σ0) of the test steel at different deformation temperatures and strain rates can be obtained from the true stress–strain curves. Since the yield point in the true stress–strain curves is not obvious, the flow stress corresponding to 0.02 strain is defined as the yield stress value [26,27]. As shown in Figure 3, the yield stress values at different deformation conditions are 62.9 MPa (950 °C/1 s−1), 52.8 MPa (950 °C/0.01 s−1) and 35.1 MPa (1100 °C/0.01 s−1), respectively. The deformation parameters clearly have a great influence on the yield strength of HSLA steel. The yield stress values decrease with increasing deformation temperature and decreasing strain rate. The decrease in the yield strength is related to the DRX behavior. The DRX can be carried out more fully at a high deformation temperature and a low strain rate. Therefore, the dynamic softening effect is enhanced, and the yield strength is reduced [28,29].

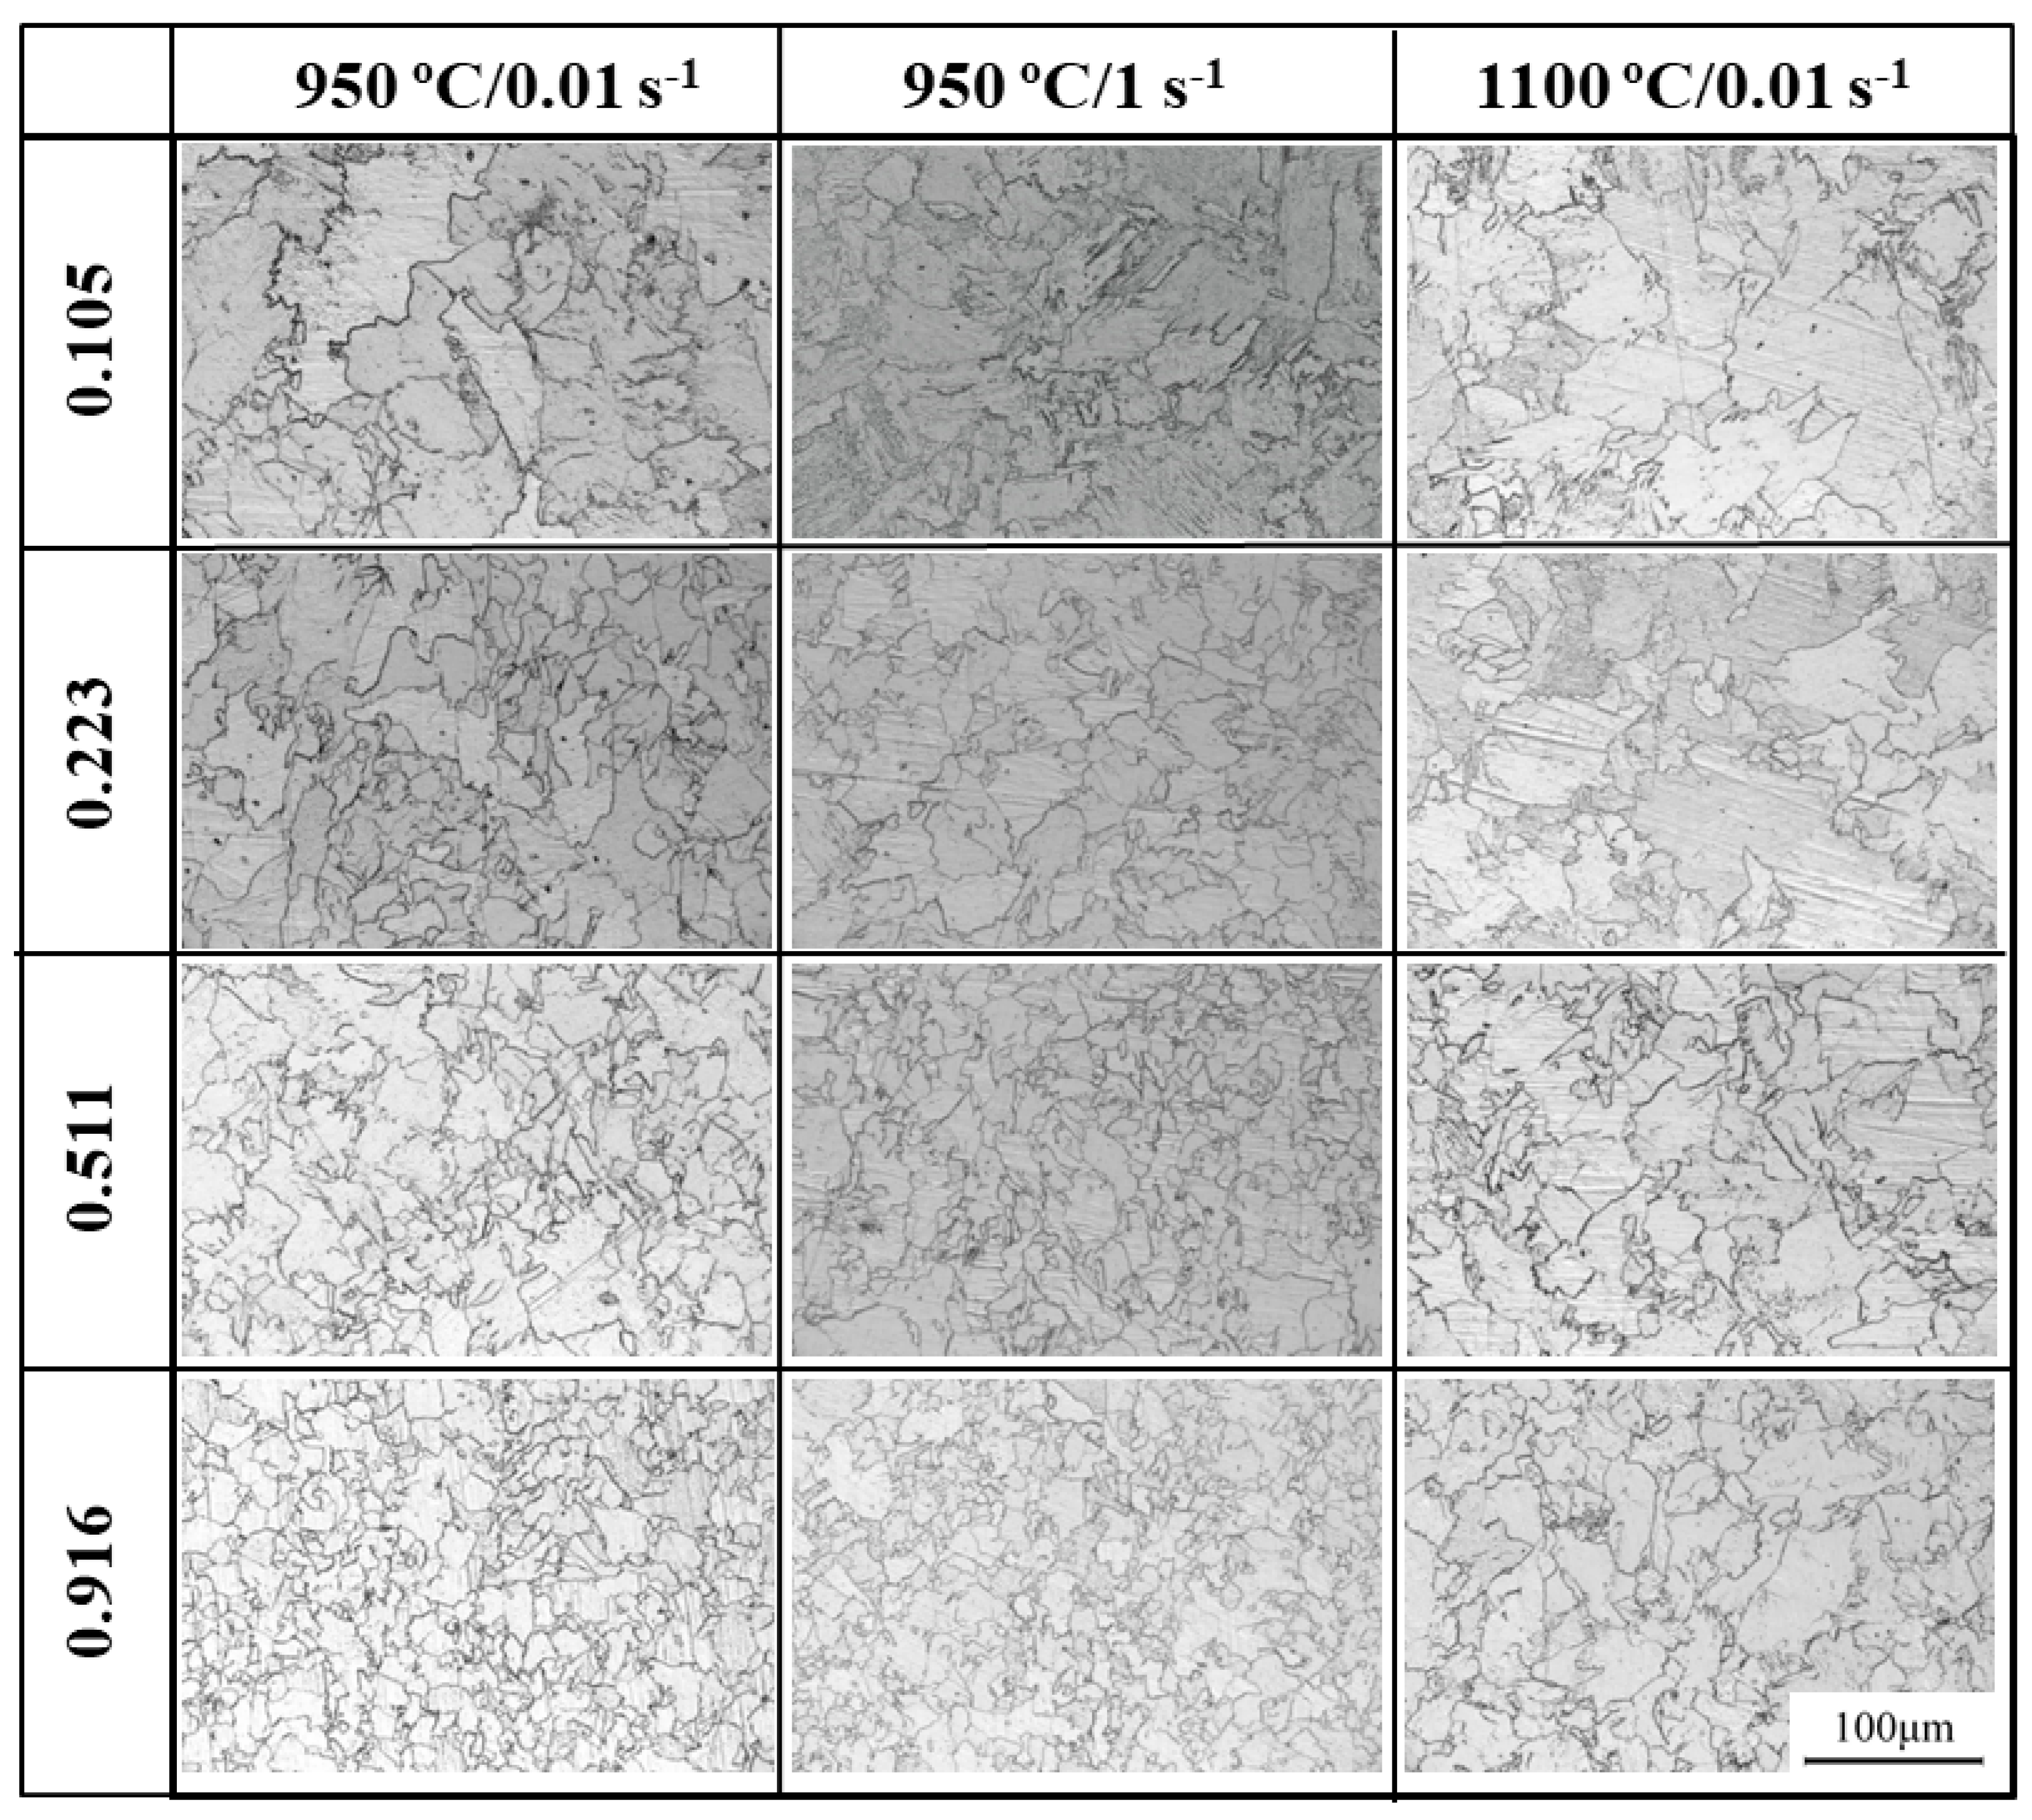
3.3. Microstructures of the Deformed Specimens

Figure 4 shows the typical microstructures of the deformed specimens at different deformation parameters. It can be seen that the grain size of the deformed specimen decreased with increasing strain at a given temperature and strain rate, which indicates that DRX occurred for these deformation parameters. However, the original and dynamic recrystallized grains were difficult to distinguish by optical microscopy. Therefore, it was necessary to investigate the DRX characteristics of the HSLA steel under different true strains by EBSD.

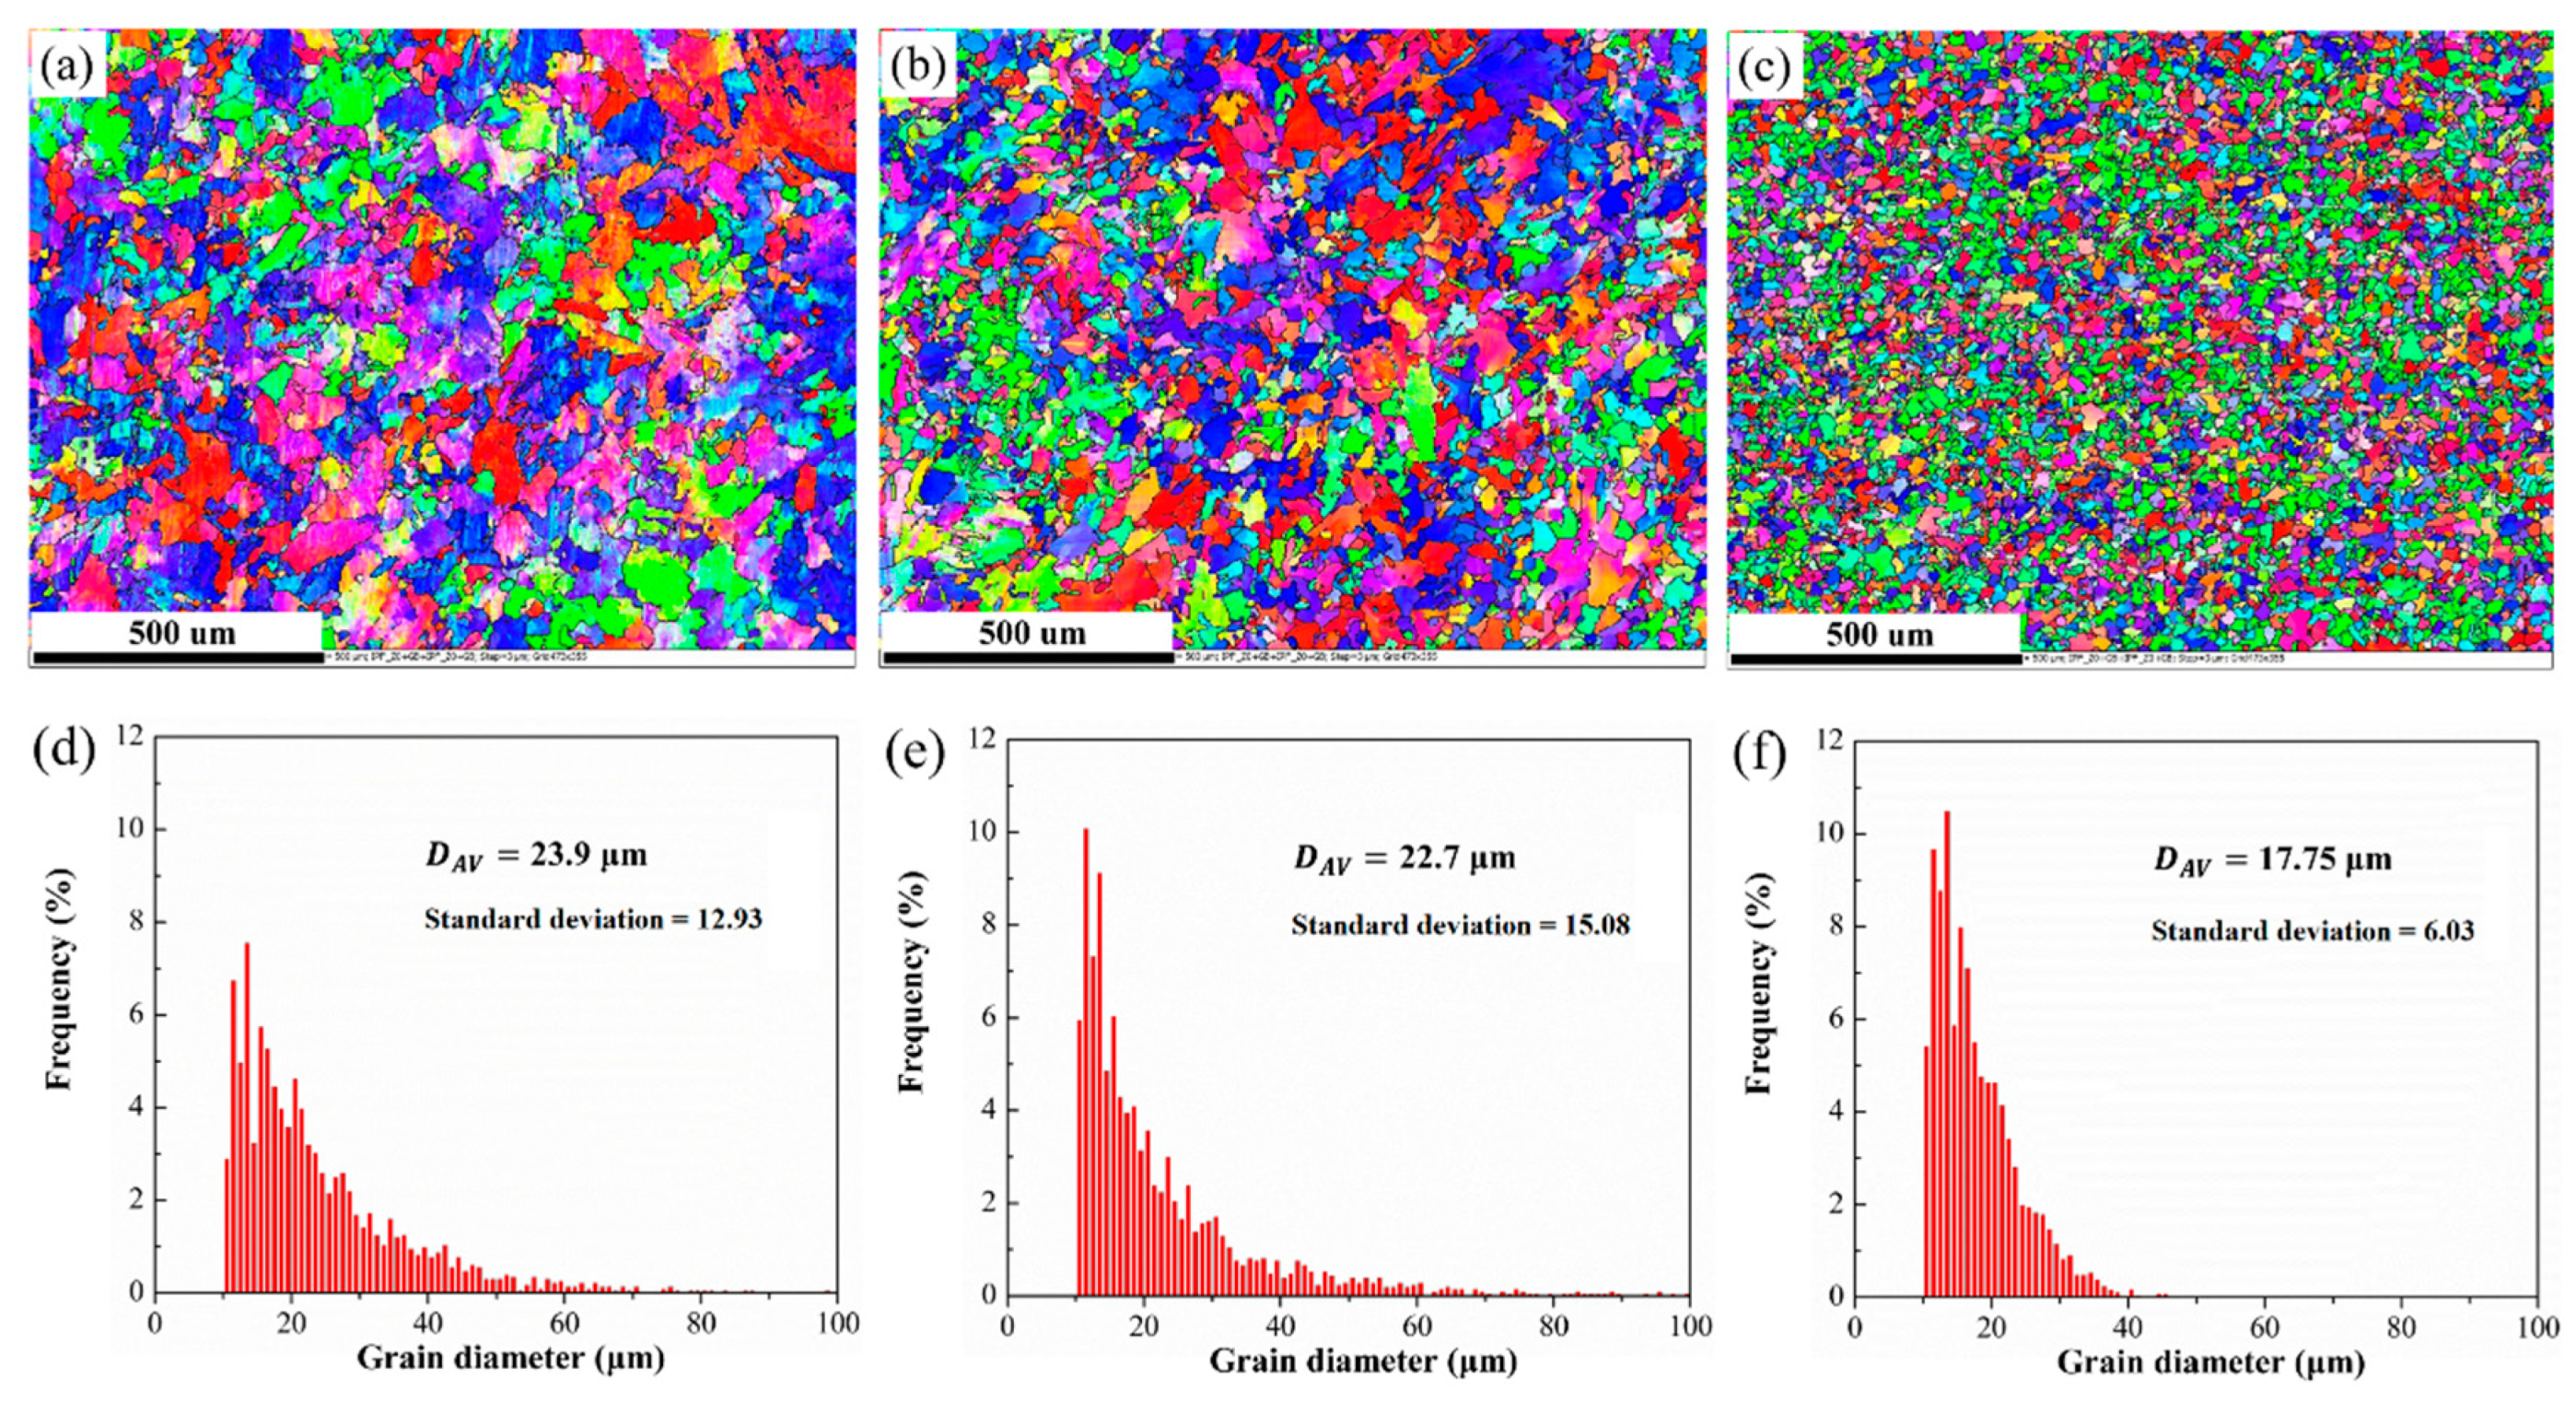
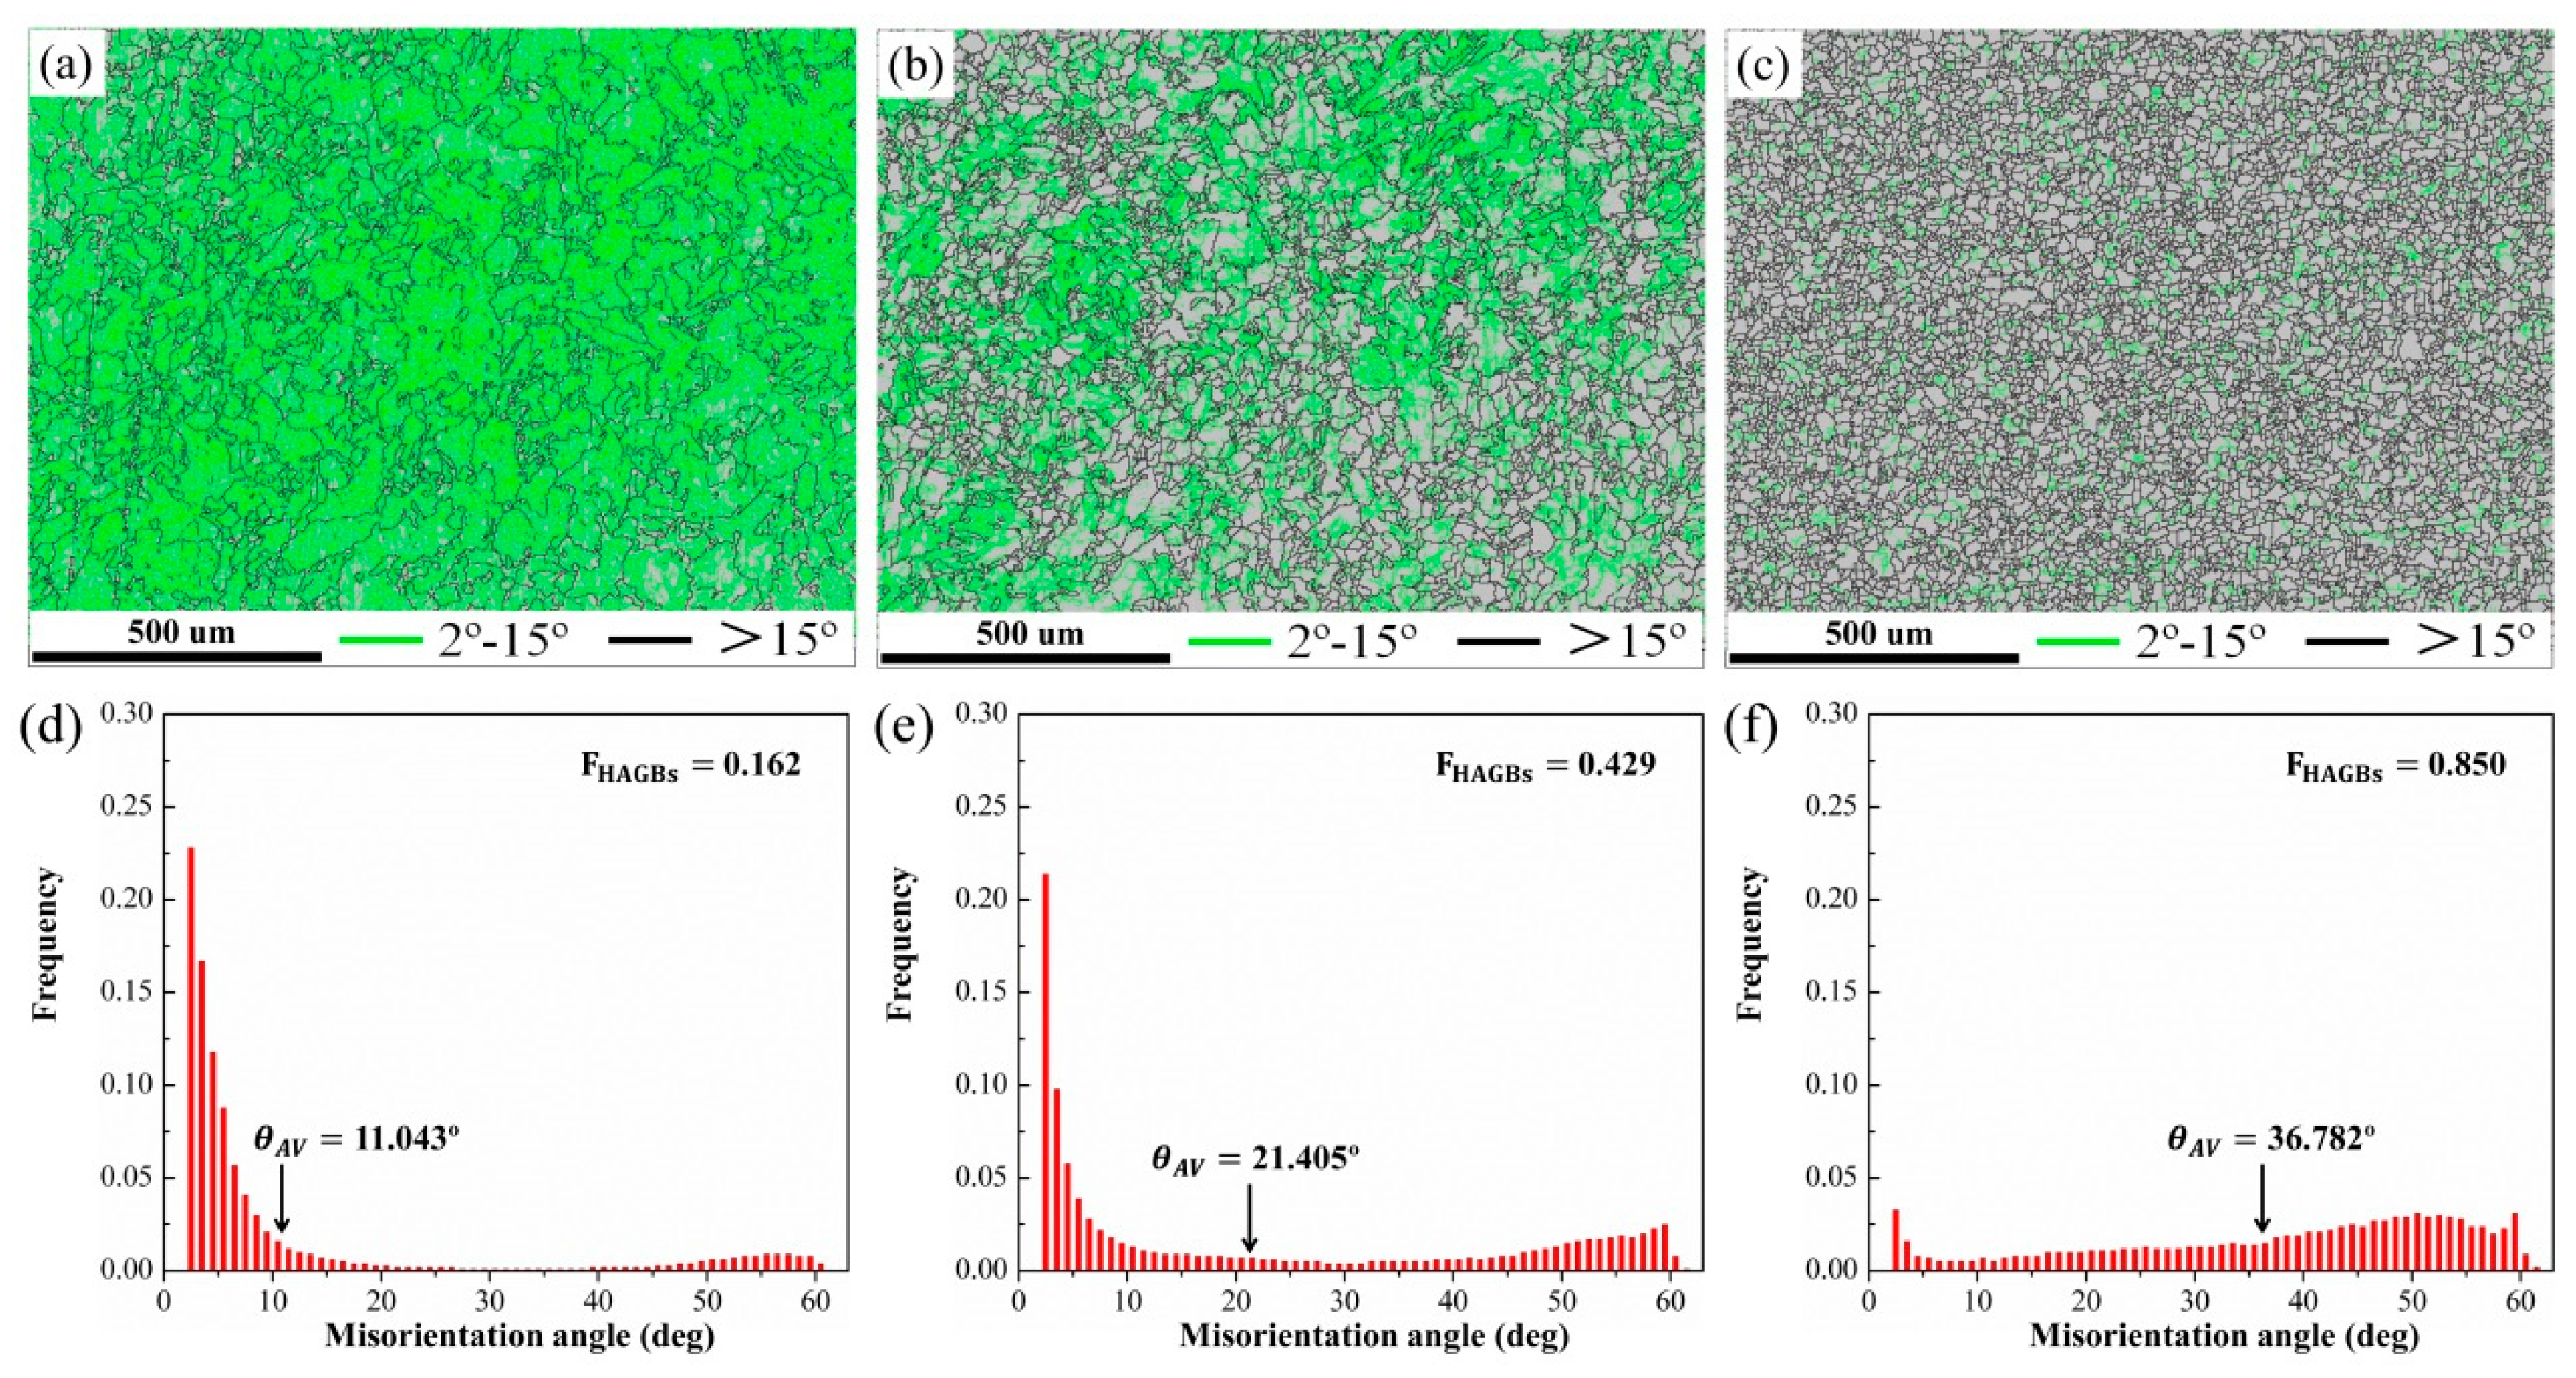
3.4. EBSD Analysis at Different True Strains

Figure 5 presents the true stress-true–strain curves at 950 °C and 0.01 s−1 at different true strains. According to the Reference [30], the critical strain value for DRX under this deformation parameter set was determined to be 0.13. As illustrated in Figure 5, when the true strain of the specimen was less than 0.13, the microstructure evolution mechanism of the deformed specimen was work hardening. When the true strain of the specimen exceeded 0.13, the main mechanism of microstructure evolution was dynamic recrystallization.
To further study the effect of the true strain on the DRX characteristics of the tested steel during isothermal compression, EBSD analyses were carried out on the deformed specimens with different true strains (0.105, 0.223 and 0.916). Inverse pole figure maps and grain size distributions for the specimens deformed at 950 °C and 0.01 s−1 with different true strains are illustrated in Figure 6. Figure 6a–c shows that the microstructures of the deformed specimens were significantly refined with increasing true strain. As shown in Figure 6d–f, when the true strain of the specimen increased from 0.105 to 0.916, the average grain size decreased from 23.90 µm to 17.75 µm, respectively. When the specimen was deformed to a true strain of 0.105, the critical value for DRX was not reached. Therefore, the microstructure of the deformed specimen still contained coarse grains. As the specimen was compressed to a true strain of 0.223, the critical strain for DRX was reached, and a small amount of fine DRX grains appeared at the original grain boundaries. However, the DRX effect was weak due to the low deformation of the specimen. Therefore, the change in the grain size was not substantial. When the true strain was further increased to 0.916, the original coarse grains were replaced by fine dynamically recrystallized grains. Thus, DRX played an important role in the grain refinement during the microstructure evolution.
DRX distribution maps and statistical maps of the specimens deformed at 950 °C and 0.01 s−1 with different true strains are illustrated in Figure 7. According to the reference [31,32,33,34], the dynamically recrystallized microstructure, substructure and deformed microstructure were characterized using the grain orientation spread (GOS) approach. As illustrated in Figure 7a–c, the dynamically recrystallized microstructure, substructure and deformed microstructure are marked as blue, yellow and red, respectively. Figure 7a–c shows that the fraction of dynamic recrystallization increases significantly with the increase in true strain. As shown in Figure 7d–f, when the true strain of the specimen increased from 0.105 to 0.916, the fraction of DRX increased from 2.4% to 80.3%, respectively. When the specimen was deformed to a true strain of 0.105, the main mechanism for the microstructure evolution was work hardening. As shown in the red area in Figure 7a, nearly all of the grains in the specimen were deformed. The fractions of the recrystallized microstructure, substructure and deformed microstructure were 2.4%, 4.4% and 93.2%, respectively. As the specimen was compressed to a true strain of 0.223, the critical strain for DRX was reached. As incomplete DRX occurred, the fraction of the deformed structure decreased, and the fraction of the recrystallized structure and substructure increased. When the true strain was further increased to 0.916, complete DRX occurred in the deformed specimen. As shown in the blue area in Figure 7e, the microstructure of the deformed specimen was replaced by fine dynamically recrystallized grains. The fractions of the recrystallized microstructure, substructure and deformed microstructure were 80.3%, 11.5% and 8.2%, respectively.
Figure 8 shows the grain boundary maps and misorientation angle distribution of the specimens deformed at 950 °C and 0.01 s−1 with different true strains. As illustrated in Figure 8a–c, the grain boundaries with a boundary misorientation angle between 2° and 15° were defined as low-angle grain boundaries (LAGBs) and marked with a green line. The grain boundaries with a boundary misorientation angle higher than 15° were defined as high-angle grain boundaries (HAGBs) and marked with a black line. Figure 8a–c indicates that the LAGBs were gradually transformed into HAGBs with increasing true strain. As illustrated in Figure 8d–f, when the true strain increased from 0.105 to 0.916, the corresponding fraction of HAGBs increased from 16.2% to 85%, respectively. When the true strain was 0.105, a large number of dislocations were generated due to work hardening, and the moving dislocations were entangled with each other to form a large number of subgrain boundaries. As the specimen was compressed to a true strain of 0.223, the critical strain for DRX was reached. The dislocations and substructures were gradually consumed with the nucleation and growth of the dynamically recrystallize grains. Therefore, some of the LAGBs were transformed into HAGBs. When the true strain reached 0.916, the DRX was complete, and the fraction of HAGBs was increased to 85%. The HAGBs efficiently arrested the propagation of the cleavage microcracks and improved the toughness of the material [35,36,37,38]. In addition, when the true strain increased from 0.105 to 0.916, the corresponding average sub-boundary misorientation (θAV) increased from 13.8° to 18.8°, respectively. In general, the increase in θAV was related to the nucleation of the dynamically recrystallized grains [39,40]. With an increase in true strain, the LAGBs continuously absorbed dislocations and gradually transformed into HAGBs, which is consistent with an increase in the orientation angle fraction in the range 40–60°. The large true strain was favorable for the nucleation and growth of the dynamically recrystallized grains. Therefore, θAV increased with a decreasing true strain.

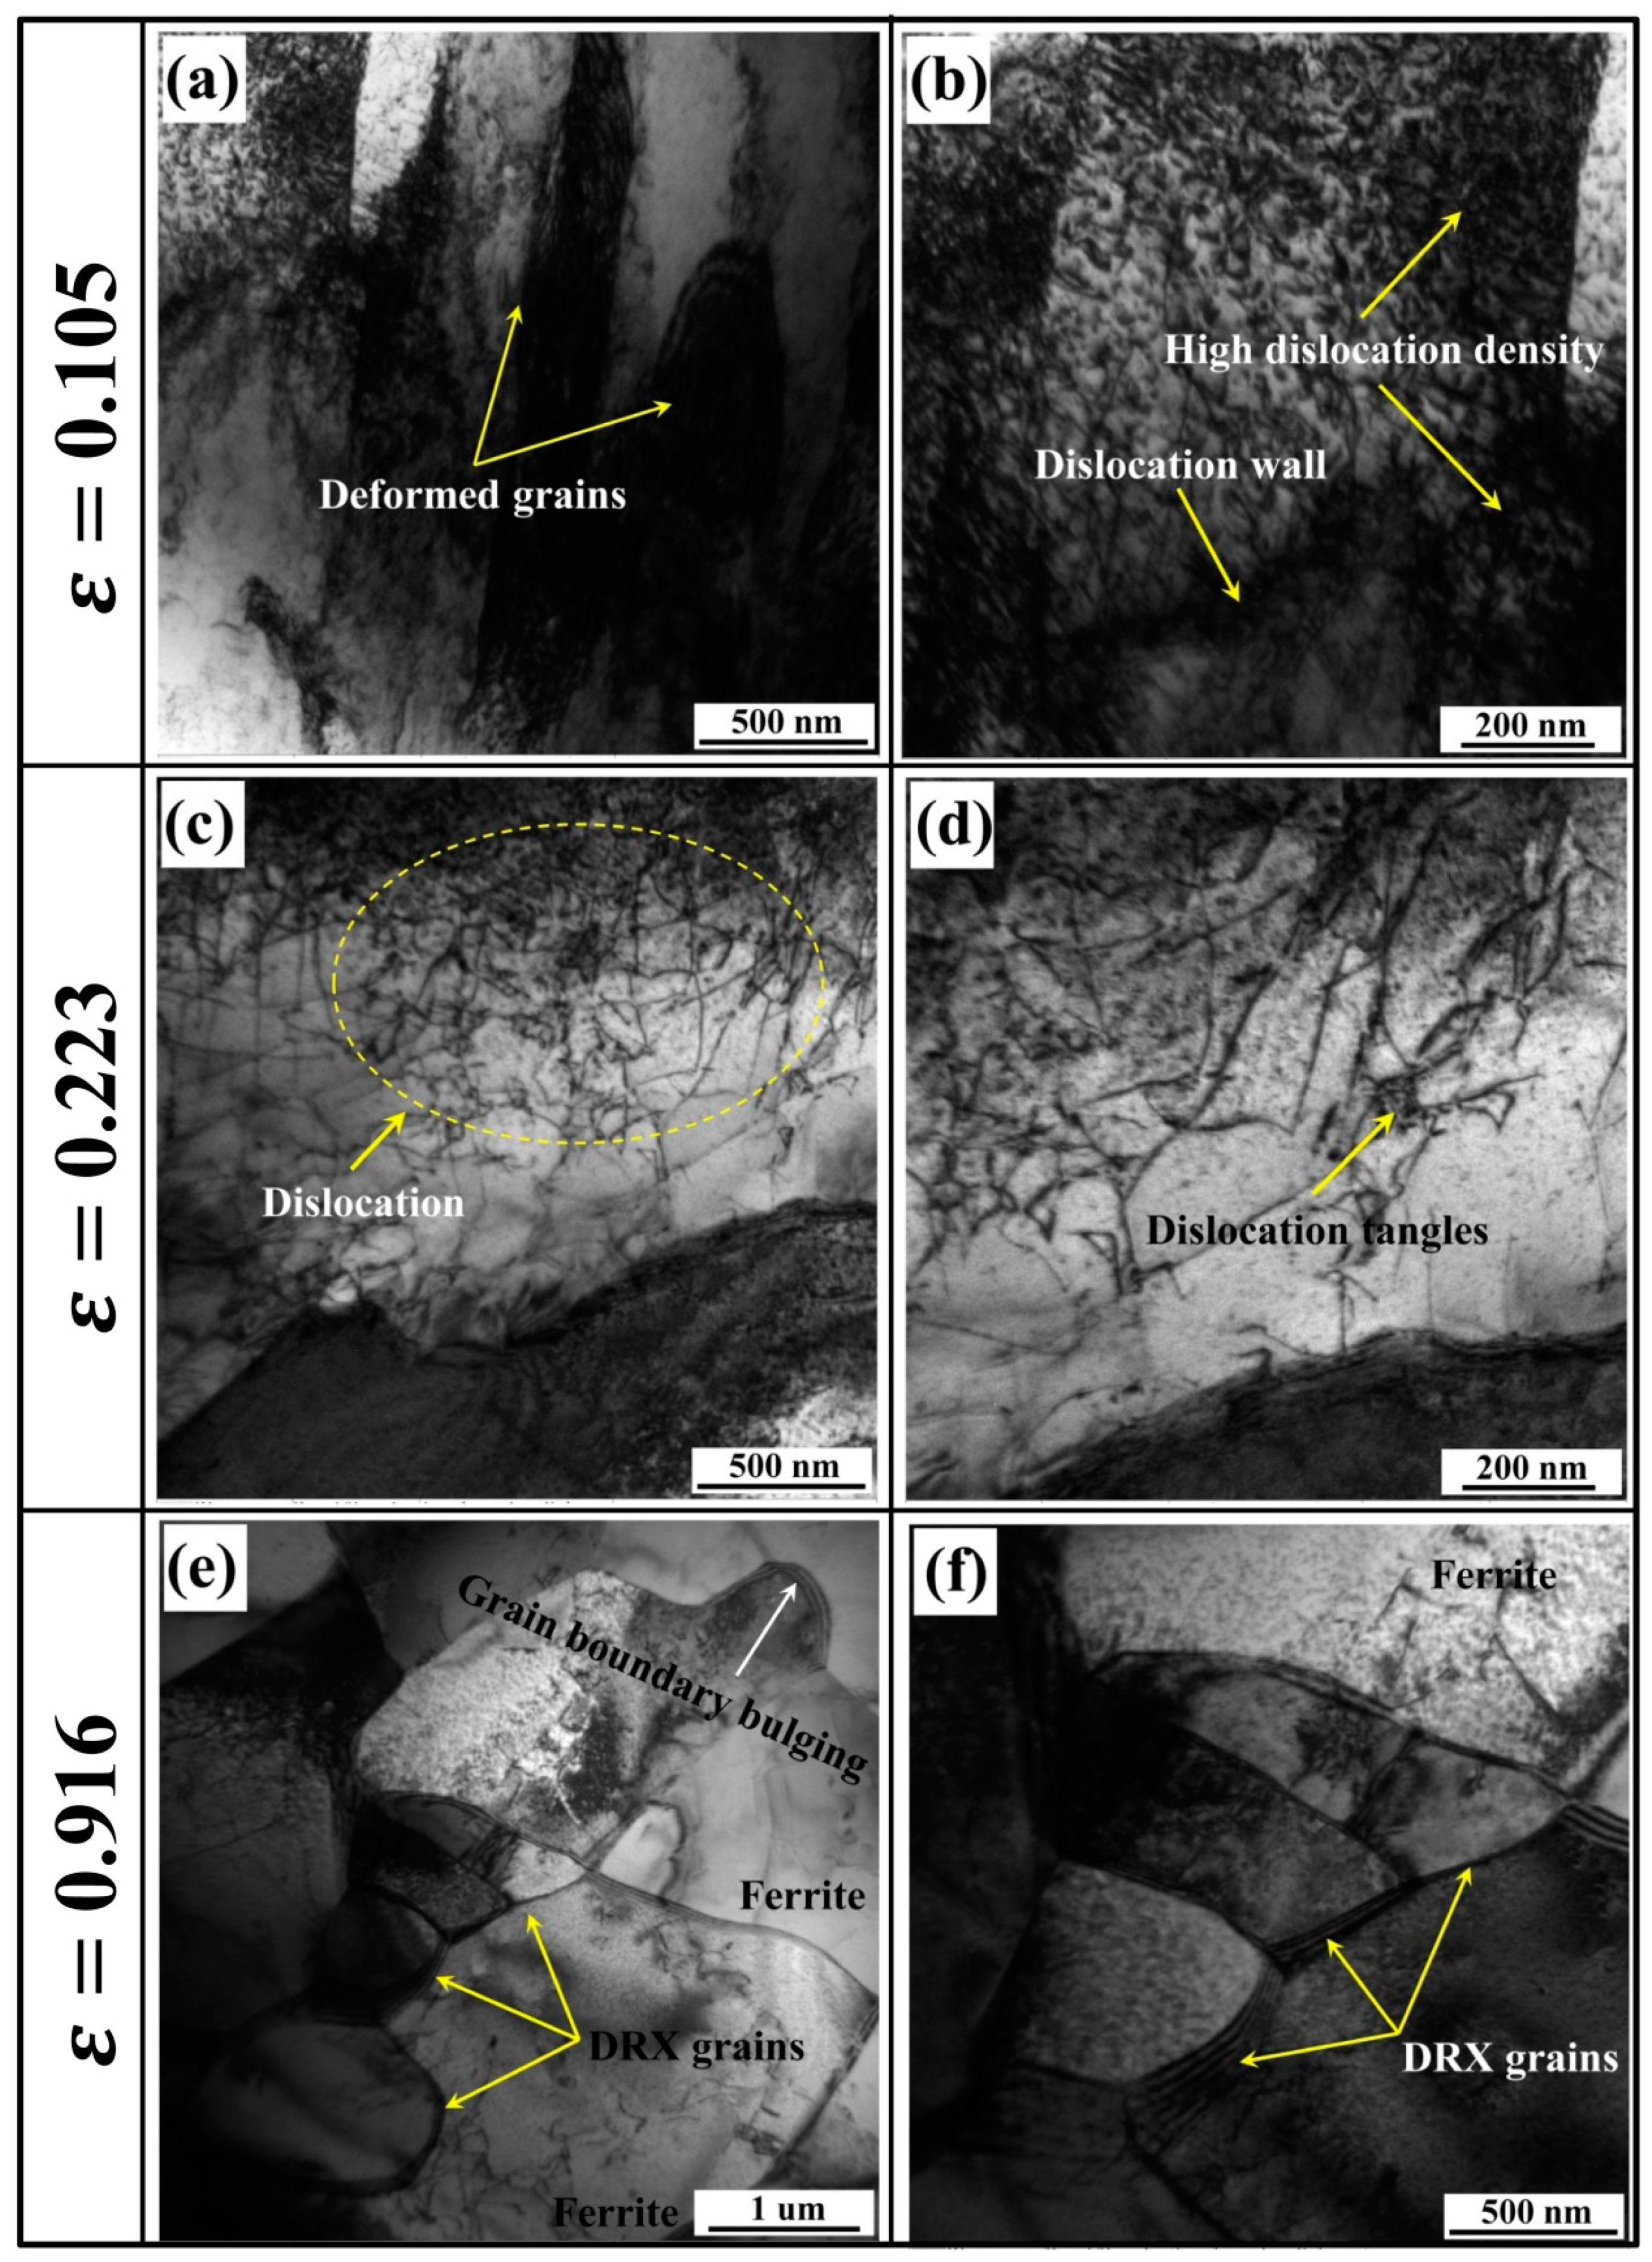
3.5. TEM Analysis at Different True Strains

Figure 9 presents the dislocations and substructure of the specimens deformed at 950 °C and 0.01 s−1 with different true strains. When the specimen was deformed to a true strain of 0.105, the main mechanism of microstructure evolution was work hardening. As illustrated in Figure 9a,b, deformed grains (Figure 9a) and high dislocation density regions (Figure 9b) can be observed in the microstructure. The increase in the dislocation density was the essential reason for the enhancement of the work hardening effect [41]. Therefore, the true stress increased rapidly as the true strain increased during the initial deformation. In addition, during the initial phases of hot compression (ε < 0.105), dislocations produced by work hardening progressively accumulate in the dislocation cell structures, and then rearrange into subgrain boundaries via dynamic recovery. This is consistent with an increase in the fraction of LAGBs in Figure 8d [42]. When the true strain increased to 0.223, the critical strain for DRX was reached, and the mechanism for the microstructure evolution changed from work hardening to dynamic softening. As shown in Figure 9c,d, the dislocation density was significantly reduced due to dynamic softening effects, such as dynamic recovery and DRX. When the true strain increased to 0.916, the DRX process was completed. As shown in Figure 9e,f, fine dynamically recrystallized grains can be observed in the microstructure, indicating that the original grains were replaced by the dynamically recrystallized grains. The dislocation and substructure were consumed gradually as the nucleation and growth of DRX nuclei increased. Therefore, the fraction of LAGBs significantly decreased (Figure 8f) [43,44]. In addition, bulging grain boundaries are observed, indicating that the nucleation of the dynamically recrystallized grains occurred by the bulging of the original grain boundaries [45]. The dislocation-free zone is formed behind the bulged grain boundaries and further becomes nuclei. Finally, the nuclei are transformed into the new DRX grains with HAGBs [46]. Therefore, the bulged grain boundaries were the core for the nucleation of dynamically recrystallized grains. This DRX nucleation mechanism is called the strain-induced grain boundary migration (SIBM) [47].

4. Conclusions

  • Ac1 and Ac3 of the tested steel were determined to be 806.1 °C and 870.4 °C, respectively. When the temperature was higher than 870.4 °C, the microstructure of the tested steel was single-phase austenite. The grain size of the deformed specimen decreased with increasing strain at a given temperature and strain rate.
  • When the true strain of the specimen increased from 0.105 to 0.916, the average grain size decreased from 23.90 µm to 17.75 µm, the fraction of DRX increased from 2.4% to 80.3%, the fraction of HAGBs increased from 16.2% to 85%, and the average sub-boundary misorientation increased from 13.8 to 18.8°.
  • The critical strain value for DRX at 950 °C and 0.01 s−1 was determined to be 0.13 by the true stress–strain curve. TEM observation shows that the nucleation of the dynamically recrystallized grains occurred by the bulging of the original grain boundaries. The DRX nucleation mechanism of the HSLA steel is the SIBM mechanism.

Author Contributions

Conceptualization, W.K. and H.Z.; data curation, M.T.; funding acquisition, H.Z.; methodology, N.L. and C.Z.; writing—original draft, N.L. and H.Z.; writing—review and editing, W.K. and R.H. All authors have read and agreed to the published version of the manuscript.

Funding

This paper was supported by the Key Laboratory Fund General Projects grant number (6142905180203).

Acknowledgments

We would also like to acknowledge the professional manuscript services of American Journal Experts.

Conflicts of Interest

The authors declare no conflict of interest.

References

  1. Chen, X.Z.; Huang, Y.M. Hot deformation behavior of HSLA steel Q690 and phase transformation during compression. J. Alloys Compd. 2015, 619, 564–571. [Google Scholar] [CrossRef]
  2. Ledermueller, C.; Pratiwi, H.I.; Webster, R.F.; Eizadjou, M.; Ringer, S.P.; Primig, S. Microalloying effects of Mo versus Cr in HSLA steels with ultrafine-grained ferrite microstructures. Mater. Des. 2020, 185, 108278. [Google Scholar] [CrossRef]
  3. Ouchi, C. Development of steel plates by intensive use of TMCP and direct quenching processes. ISIJ Int. 2001, 41, 542–553. [Google Scholar] [CrossRef] [Green Version]
  4. Vervynckt, S.; Verbeken, K.; Lopez, B.; Jonas, J.J. Modern HSLA steels and role of non-recrystallisation temperature. Int. Mater. Rev. 2012, 57, 187–207. [Google Scholar] [CrossRef]
  5. Ebrahimi, G.; Keshmiri, H.; Maldad, A.; Momeni, A. Dynamic recrystallization behavior of 13% Cr martensitic stainless steel under hot working condition. J. Mater. Sci. Technol. 2012, 28, 467–473. [Google Scholar] [CrossRef] [Green Version]
  6. Jonas, J.J. Dynamic recrystallization-scientific curiosity or industrial tool? Mater. Sci. Eng. A 1994, 184, 155–165. [Google Scholar] [CrossRef]
  7. Lin, Y.-C.; Chen, M.-S.; Zhang, J. Modeling of flow stress of 42CrMo steel under hot compression. Mater. Sci. Eng. A 2009, 499, 88–92. [Google Scholar] [CrossRef]
  8. Mirzadeh, H.; Cabrera, J.M.; Prado, J.M.; Najafizadeh, A. Hot deformation behavior of a medium carbon microalloyed steel. Mater. Sci. Eng. A 2011, 528, 3876–3882. [Google Scholar] [CrossRef]
  9. Facusseh, C.; Salinas, A.; Flores, A.; Altamirano, G. Study of Static Recrystallization Kinetics and the Evolution of Austenite Grain Size by Dynamic Recrystallization Refinement of an Eutectoid Steel. Metals 2019, 9, 1289. [Google Scholar] [CrossRef] [Green Version]
  10. Wu, C.; Han, S. Hot Deformation Behavior and Dynamic Recrystallization Characteristics in a Low-Alloy High-Strength Ni-Cr-Mo-V Steel. Acta Metall. Sin. 2018, 31, 963–974. [Google Scholar] [CrossRef] [Green Version]
  11. Wu, C.; Yang, H.; Li, H.W. Modeling of discontinuous dynamic recrystallization of a near-alpha titanium alloy IMI834 during isothermal hot compression by combining a cellular automaton model with a crystal plasticity finite element method. Comp. Mater. Sci. 2013, 79, 944–959. [Google Scholar]
  12. Jia, Z.; Gao, Z.X.; Ji, J.J.; Liu, D.X.; Guo, T.B.; Ding, Y.T. Study of the Dynamic Recrystallization Process of the Inconel625 Alloy at a High Strain Rate. Materials 2019, 12, 510. [Google Scholar] [CrossRef] [Green Version]
  13. Eghbali, B. Effect of strain rate on the microstructural development through continuous dynamic recrystallization in a microalloyed steel. Mater. Sci. Eng. A 2010, 527, 3402–3406. [Google Scholar] [CrossRef]
  14. Shaban, M.; Eghbali, B. Characterization of Austenite Dynamic Recrystallization under Different Z Parameters in a Microalloyed Steel. J. Mater. Sci. Technol. 2011, 27, 359–363. [Google Scholar] [CrossRef]
  15. Shen, X.-J.; Li, D.-Z.; Chen, J.; Tang, S.; Wang, G.-D. Microstructure evolution of ferrite during intercritical deformation in low carbon microalloyed steels. Mater. Sci. Technol. 2020, 36, 150–159. [Google Scholar] [CrossRef]
  16. Fu, H.G.; Wang, X.B.; Xie, L.J.; Hu, X.; Umer, U.; Rehman, A.U.; Abidi, M.H.; Ragab, A.E. Dynamic Behaviors and Microstructure Evolution of Iron-Nickel Based Ultra-High Strength Steel by SHPB Testing. Metals 2020, 10, 62. [Google Scholar] [CrossRef] [Green Version]
  17. Ren, F.C.; Chen, F.; Chen, J.; Tang, X.Y. Hot deformation behavior and processing maps of AISI 420 martensitic stainless steel. J. Manuf. Process. 2018, 31, 640–649. [Google Scholar] [CrossRef]
  18. Dai, X.; Yang, B. Study on hot deformation behavior and processing maps of SA508-IV steel for novel nuclear reactor pressure vessels. Vacuum 2018, 155, 637–644. [Google Scholar] [CrossRef]
  19. Liu, Z.L.; Liu, C.M.; Ding, J.H.; Zhang, H.Q. Characterization and Modelling of High Temperature Flow Behaviour of V Modified 2.25Cr-1Mo Heat Resistant Steel Plate. J. Wuhan Univ. Technol.-Mater. Sci. Ed. 2020, 35, 192–199. [Google Scholar] [CrossRef]
  20. Luo, L.; Liu, Z.; Bai, S.; Zhao, J.; Zeng, D.; Wang, J.; Cao, J.; Hu, Y. Hot Deformation Behavior Considering Strain Effects and Recrystallization Mechanism of an Al-Zn-Mg-Cu Alloy. Materials 2020, 13, 1743. [Google Scholar] [CrossRef]
  21. Han, Y.; Wu, H.; Zhang, W.; Zou, D.N.; Liu, G.W.; Qiao, G.J. Constitutive equation and dynamic recrystallization behavior of as-cast 254SMO super-austenitic stainless steel. Mater. Des. 2015, 69, 230–240. [Google Scholar] [CrossRef]
  22. Chen, D.D.; Lin, Y.C.; Zhou, Y.; Chen, M.S.; Wen, D.X. Dislocation substructures evolution and an adaptive-network- based fuzzy inference system model for constitutive behavior of a Ni-based superalloy during hot deformation. J. Alloys Compd. 2017, 708, 938–946. [Google Scholar] [CrossRef]
  23. Imbert, C.A.C.; McQueen, H.J. Dynamic recrystallization of A2 and M2 tool steels. Mater. Sci. Eng. A 2001, 313, 104–116. [Google Scholar] [CrossRef]
  24. Li, B.; Pan, Q.; Yin, Z. Characterization of hot deformation behavior of as-homogenized Al-Cu-Li-Sc-Zr alloy using processing maps. Mater. Sci. Eng. A 2014, 614, 199–206. [Google Scholar] [CrossRef]
  25. Xu, W.C.; Jin, X.Z.; Shan, D.B.; Chai, B.X. Study on the effect of solution treatment on hot deformation behavior and workability of Mg-7Gd-5Y-0.6Zn-0.8Zr magnesium alloy. J. Alloys Compd. 2017, 720, 309–323. [Google Scholar] [CrossRef]
  26. Li, M.Y.; Duan, Y.C.; Yao, D.; Guan, Y.P.; Yang, L. Constitutive Model and Flow Behavior of B1500HS High-Strength Steel During the Hot Deformation Process. Metals 2020, 10, 64. [Google Scholar] [CrossRef] [Green Version]
  27. Jonas, J.J.; Quelennec, X.; Jiang, L.; Martin, E. The Avrami kinetics of dynamic recrystallization. Acta Mater. 2009, 57, 2748–2756. [Google Scholar] [CrossRef]
  28. Chen, X.-M.; Lin, Y.C.; Chen, M.-S.; Li, H.-B.; Wen, D.-X.; Zhang, J.-L.; He, M. Microstructural evolution of a nickel-based superalloy during hot deformation. Mater. Des. 2015, 77, 41–49. [Google Scholar] [CrossRef]
  29. Zhou, M.; Lin, Y.C.; Deng, J.; Jiang, Y.Q. Hot tensile deformation behaviors and constitutive model of an Al-Zn-Mg-Cu alloy. Mater. Des. 2014, 59, 141–150. [Google Scholar] [CrossRef]
  30. Poliak, E.; Jonas, J. A one-parameter approach to determining the critical conditions for the initiation of dynamic recrystallization. Acta Mater. 1996, 44, 127–136. [Google Scholar] [CrossRef]
  31. Chaudhuri, A.; Behera, A.N.; Sarkar, A.; Kapoor, R.; Ray, R.K.; Suwas, S. Hot deformation behaviour of Mo-TZM and understanding the restoration processes involved. Acta Mater. 2019, 164, 153–164. [Google Scholar] [CrossRef]
  32. Sarkar, A.; Chandanshive, S.A.; Thota, M.K.; Kapoor, R. High temperature deformation behavior of Zr-1Nb alloy. J. Alloys Compd. 2017, 703, 56–66. [Google Scholar] [CrossRef]
  33. Sarkar, A.; Marchattiwar, A.; Chakravartty, J.K.; Kashyap, B.P. Kinetics of dynamic recrystallization in Ti-modified 15Cr-15Ni-2Mo austenitic stainless steel. J. Nucl. Mater. 2013, 432, 9–15. [Google Scholar] [CrossRef]
  34. Lee, J.-W.; Son, H.-W.; Hyun, S.-K. Hot deformation behavior of AA6005 modified with CaO-added Mg at high strains. J. Alloys Compd. 2019, 774, 1081–1091. [Google Scholar] [CrossRef]
  35. Cui, H.B.; Xie, G.M.; Luo, Z.A.; Ma, J.; Wang, G.D.; Misra, R.D.K. The microstructural evolution and impact toughness of nugget zone in friction stir welded X100 pipeline steel. J. Alloys Compd. 2016, 681, 426–433. [Google Scholar] [CrossRef]
  36. Hu, J.; Du, L.X.; Wang, J.J.; Gao, C.R. Effect of welding heat input on microstructures and toughness in simulated CGHAZ of V-N high strength steel. Mater. Sci. Eng. A 2013, 577, 161–168. [Google Scholar] [CrossRef]
  37. Kitahara, H.; Ueji, R.; Tsuji, N.; Minamino, Y. Crystallographic features of lath martensite in low-carbon steel. Acta Mater. 2006, 54, 1279–1288. [Google Scholar] [CrossRef]
  38. Lambert-Perlade, A.; Gourgues, A.F.; Pineau, A. Austenite to bainite phase transformation in the heat-affected zone of a high strength low alloy steel. Acta Mater. 2004, 52, 2337–2348. [Google Scholar] [CrossRef]
  39. Li, X.Y.; Xi, W.J.; Yan, H.G.; Chen, J.H.; Su, B.; Song, M.; Li, Z.Z.; Li, Y.L. Dynamic recrystallization behaviors of high Mg alloyed Al-Mg alloy during high strain rate rolling deformation. Mater. Sci. Eng. A 2019, 753, 59–69. [Google Scholar] [CrossRef]
  40. Sakai, T.; Belyakov, A.; Miura, H. Ultrafine grain formation in ferritic stainless steel during severe plastic deformation. Metall. Mater. Trans. A 2008, 39A, 2206–2214. [Google Scholar] [CrossRef]
  41. Qian, P.P.; Tang, Z.H.; Wang, L.; Siyasiya, C.W. Hot Deformation Characteristics and 3-D Processing Map of a High-Titanium Nb-Micro-alloyed Steel. Materials 2020, 13, 1501. [Google Scholar] [CrossRef] [Green Version]
  42. Liu, D.; Ding, H.; Hu, X.; Han, D.; Cai, M. Dynamic recrystallization and precipitation behaviors during hot deformation of a kappa-carbide-bearing multiphase Fe-11Mn-10Al-0.9C lightweight steel. Mater. Sci. Eng. A 2020, 772, 138682. [Google Scholar] [CrossRef]
  43. Lin, Y.C.; Wu, X.-Y.; Chen, X.-M.; Chen, J.; Wen, D.-X.; Zhang, J.-L.; Li, L.-T. EBSD study of a hot deformed nickel-based superalloy. J. Alloys Compd. 2015, 640, 101–113. [Google Scholar] [CrossRef]
  44. Wang, X.X.; Zhan, M.; Gao, P.F.; Ma, P.Y.; Yang, K.; Lei, Y.D.; Li, Z.X. Deformation mode dependent mechanism and kinetics of dynamic recrystallization in hot working of titanium alloy. Mater. Sci. Eng. A 2020, 772, 138804. [Google Scholar] [CrossRef]
  45. Wan, Z.P.; Sun, Y.; Hu, L.X.; Yu, H. Experimental study and numerical simulation of dynamic recrystallization behavior of TiAl-based alloy. Mater. Des. 2017, 122, 11–20. [Google Scholar] [CrossRef]
  46. Wu, Y.; Kou, H.; Wu, Z.; Tang, B.; Li, J. Dynamic recrystallization and texture evolution of Ti-22Al-25Nb alloy during plane-strain compression. J. Alloys Compd. 2018, 749, 844–852. [Google Scholar] [CrossRef]
  47. Huang, K.; Loge, R.E. A review of dynamic recrystallization phenomena in metallic materials. Mater. Des. 2016, 111, 548–574. [Google Scholar] [CrossRef]
Figure 1. (a) The experimental process of the isothermal compression test; (b) the area of microstructure observation.
Metals 10 00817 g001
Figure 2. Thermal dilatometric curve of the HSLA steel.
Metals 10 00817 g002
Figure 3. True stress–strain curves of the investigated steel at different deformation parameters: (a) T = 950 °C, strain rate = 1 s−1, (b) T = 950 °C, strain rate = 0.01 s−1, (c) T = 1100 °C, strain rate = 0.01 s−1.
Metals 10 00817 g003
Figure 4. Metallography of the investigated steel under different deformation parameters.
Metals 10 00817 g004
Figure 5. The true stress-true–strain curves at 950 °C and 0.01 s−1 at different true strains.
Metals 10 00817 g005
Figure 6. Inverse pole figure maps (ac) and grain size distribution maps (df) of the deformed specimen at various true strains: (a,d) ε = 0.105; (b,e) ε = 0.223; (c,f) ε = 0.916.
Metals 10 00817 g006
Figure 7. Dynamic recrystallization distribution maps (ac) and statistics maps (df) of the deformed specimen at various true strains: (a,d) ε = 0.105; (b,e) ε = 0.223; (c,f) ε = 0.916.
Metals 10 00817 g007
Figure 8. Grain boundary maps (ac) and misorientation distribution maps (df) of the deformed specimen at various true strains: (a,d) ε = 0.105; (b,e) ε = 0.223; (c,f) ε = 0.916.
Metals 10 00817 g008
Figure 9. Dislocation and substructure of the specimens deformed at 950 °C and 0.01 s−1 with different true strains: (a,b) ε = 0.105, (c,d) ε = 0.223, (e,f) ε = 0.916.
Metals 10 00817 g009
Table 1. Chemical composition of high-strength low-alloy (HSLA) steels (wt.%, Fe balance).
CSiMnCuCrMoNiNbAlTiV
0.0130.150.930.370.200.110.530.0380.0140.0090.011

