Selection of Dedicated As-Cast Microstructures in Zn-Al-Cu Alloys for Bearing Applications Supported by Phase-Field Simulations


Abstract
1. Introduction
2. Materials and Methods
2.1. Sample Preparation and Testing Methods
2.2. Phase-Field Model
2.3. Hardness Computation Model
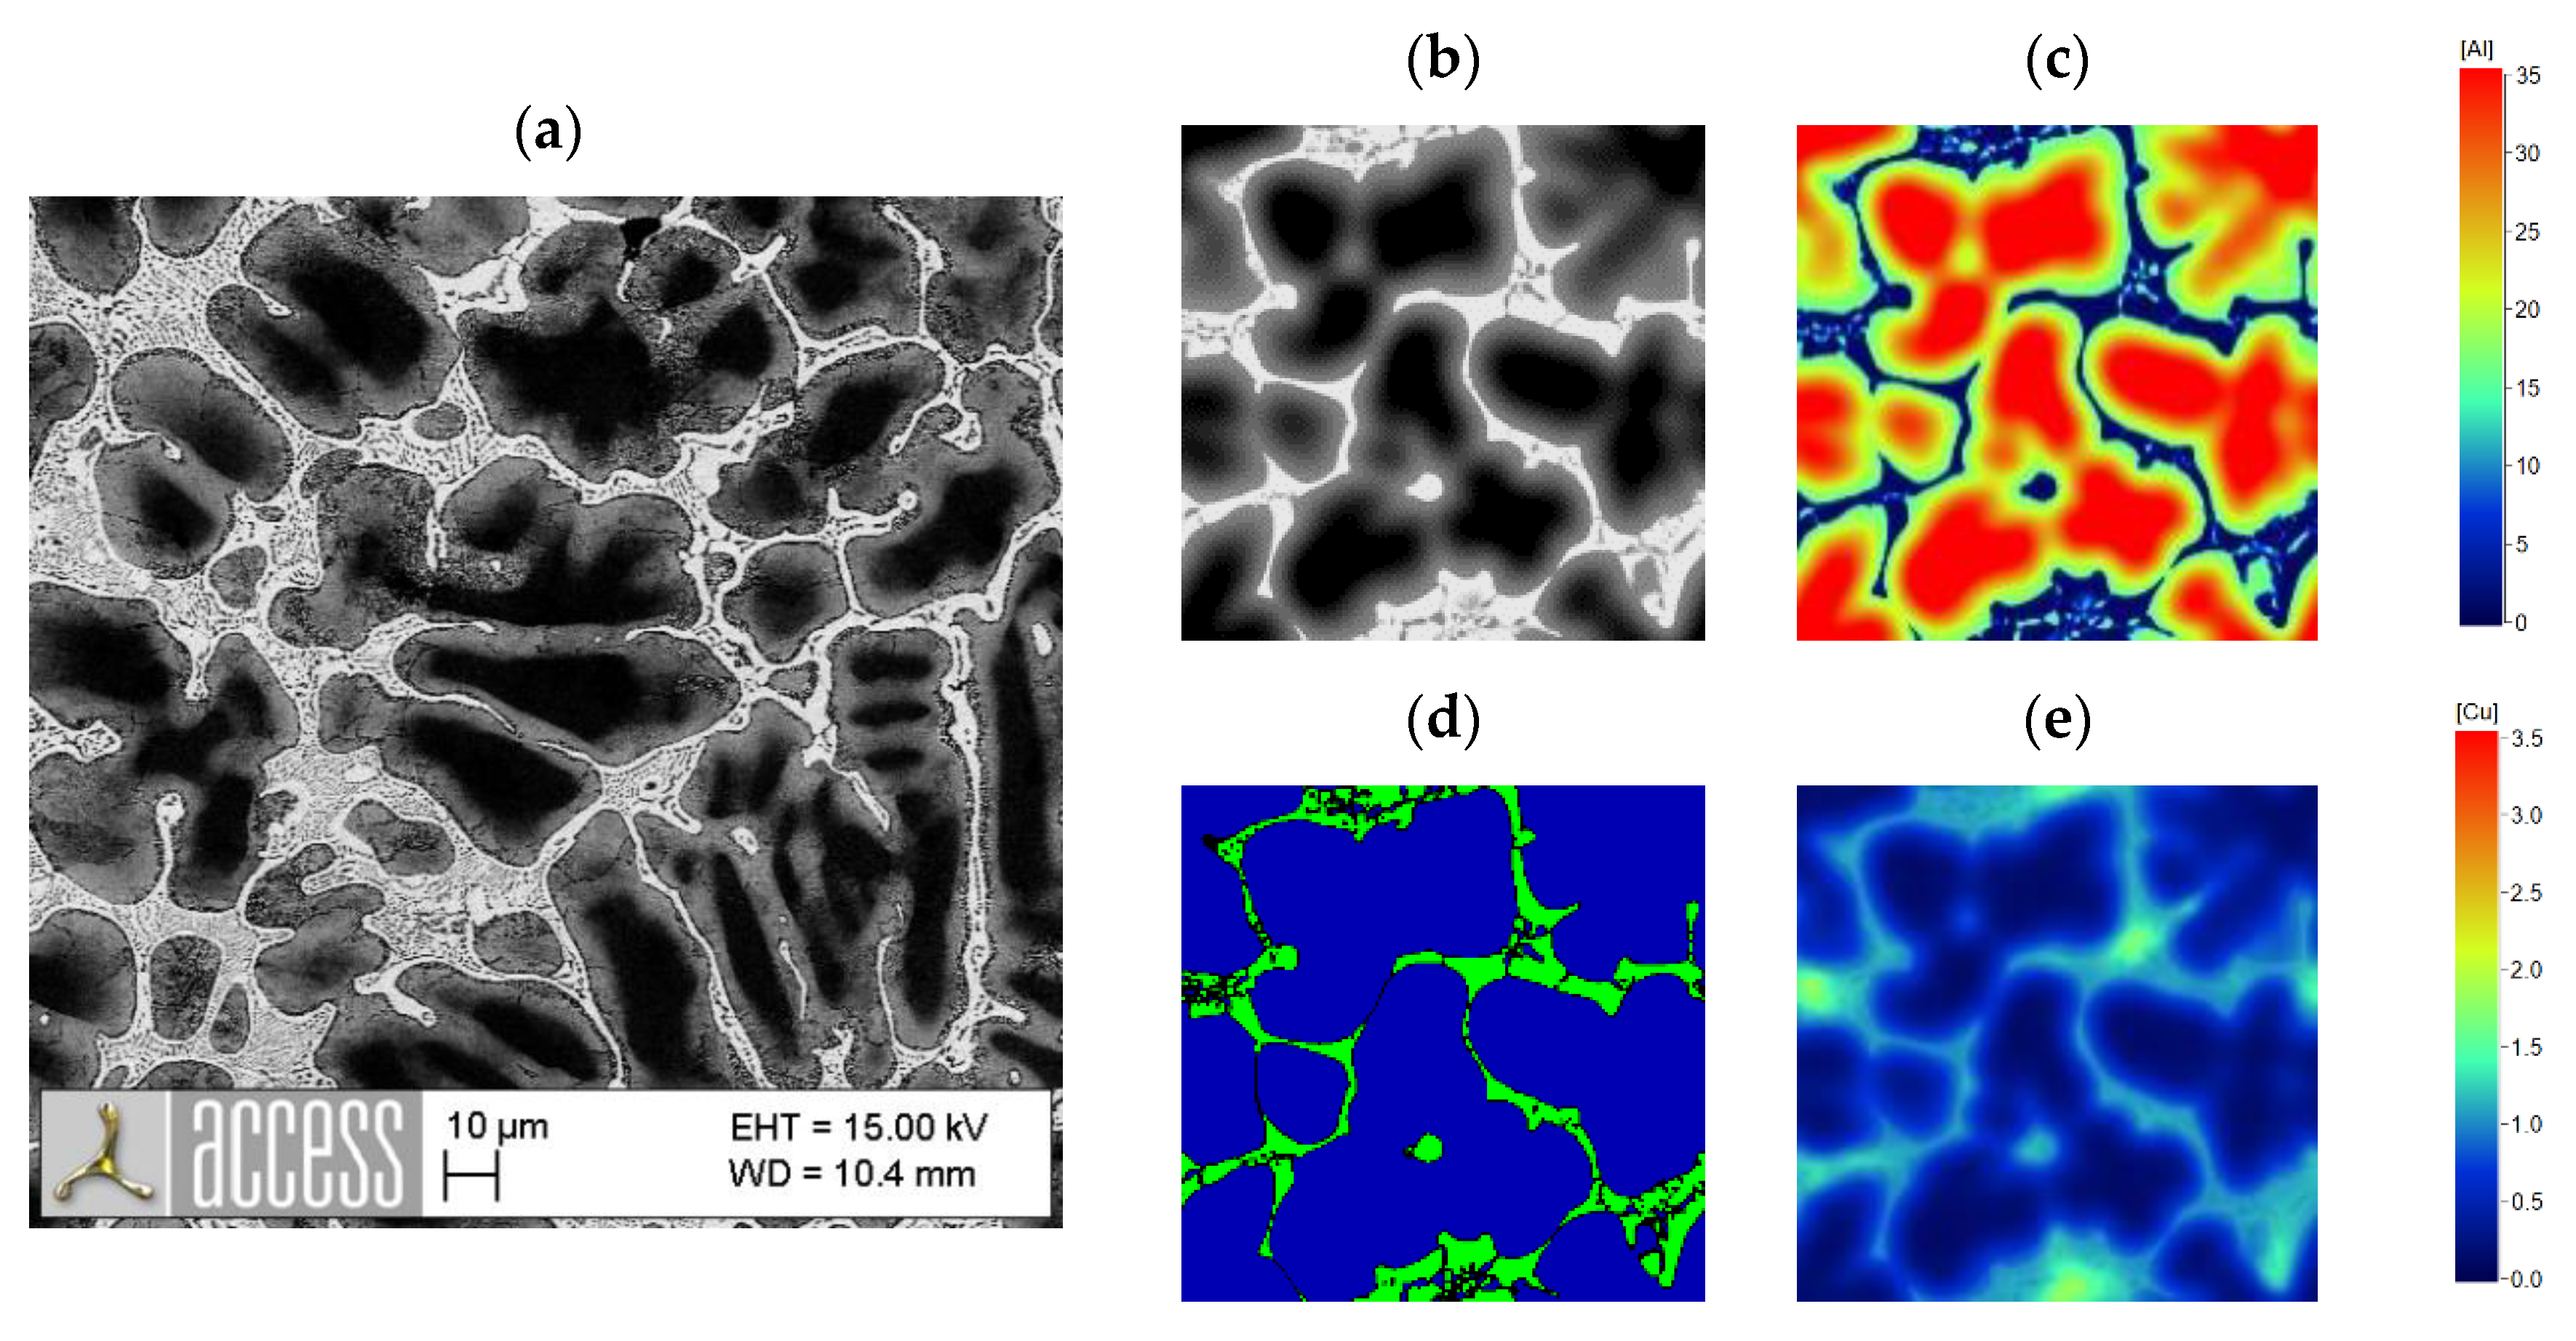
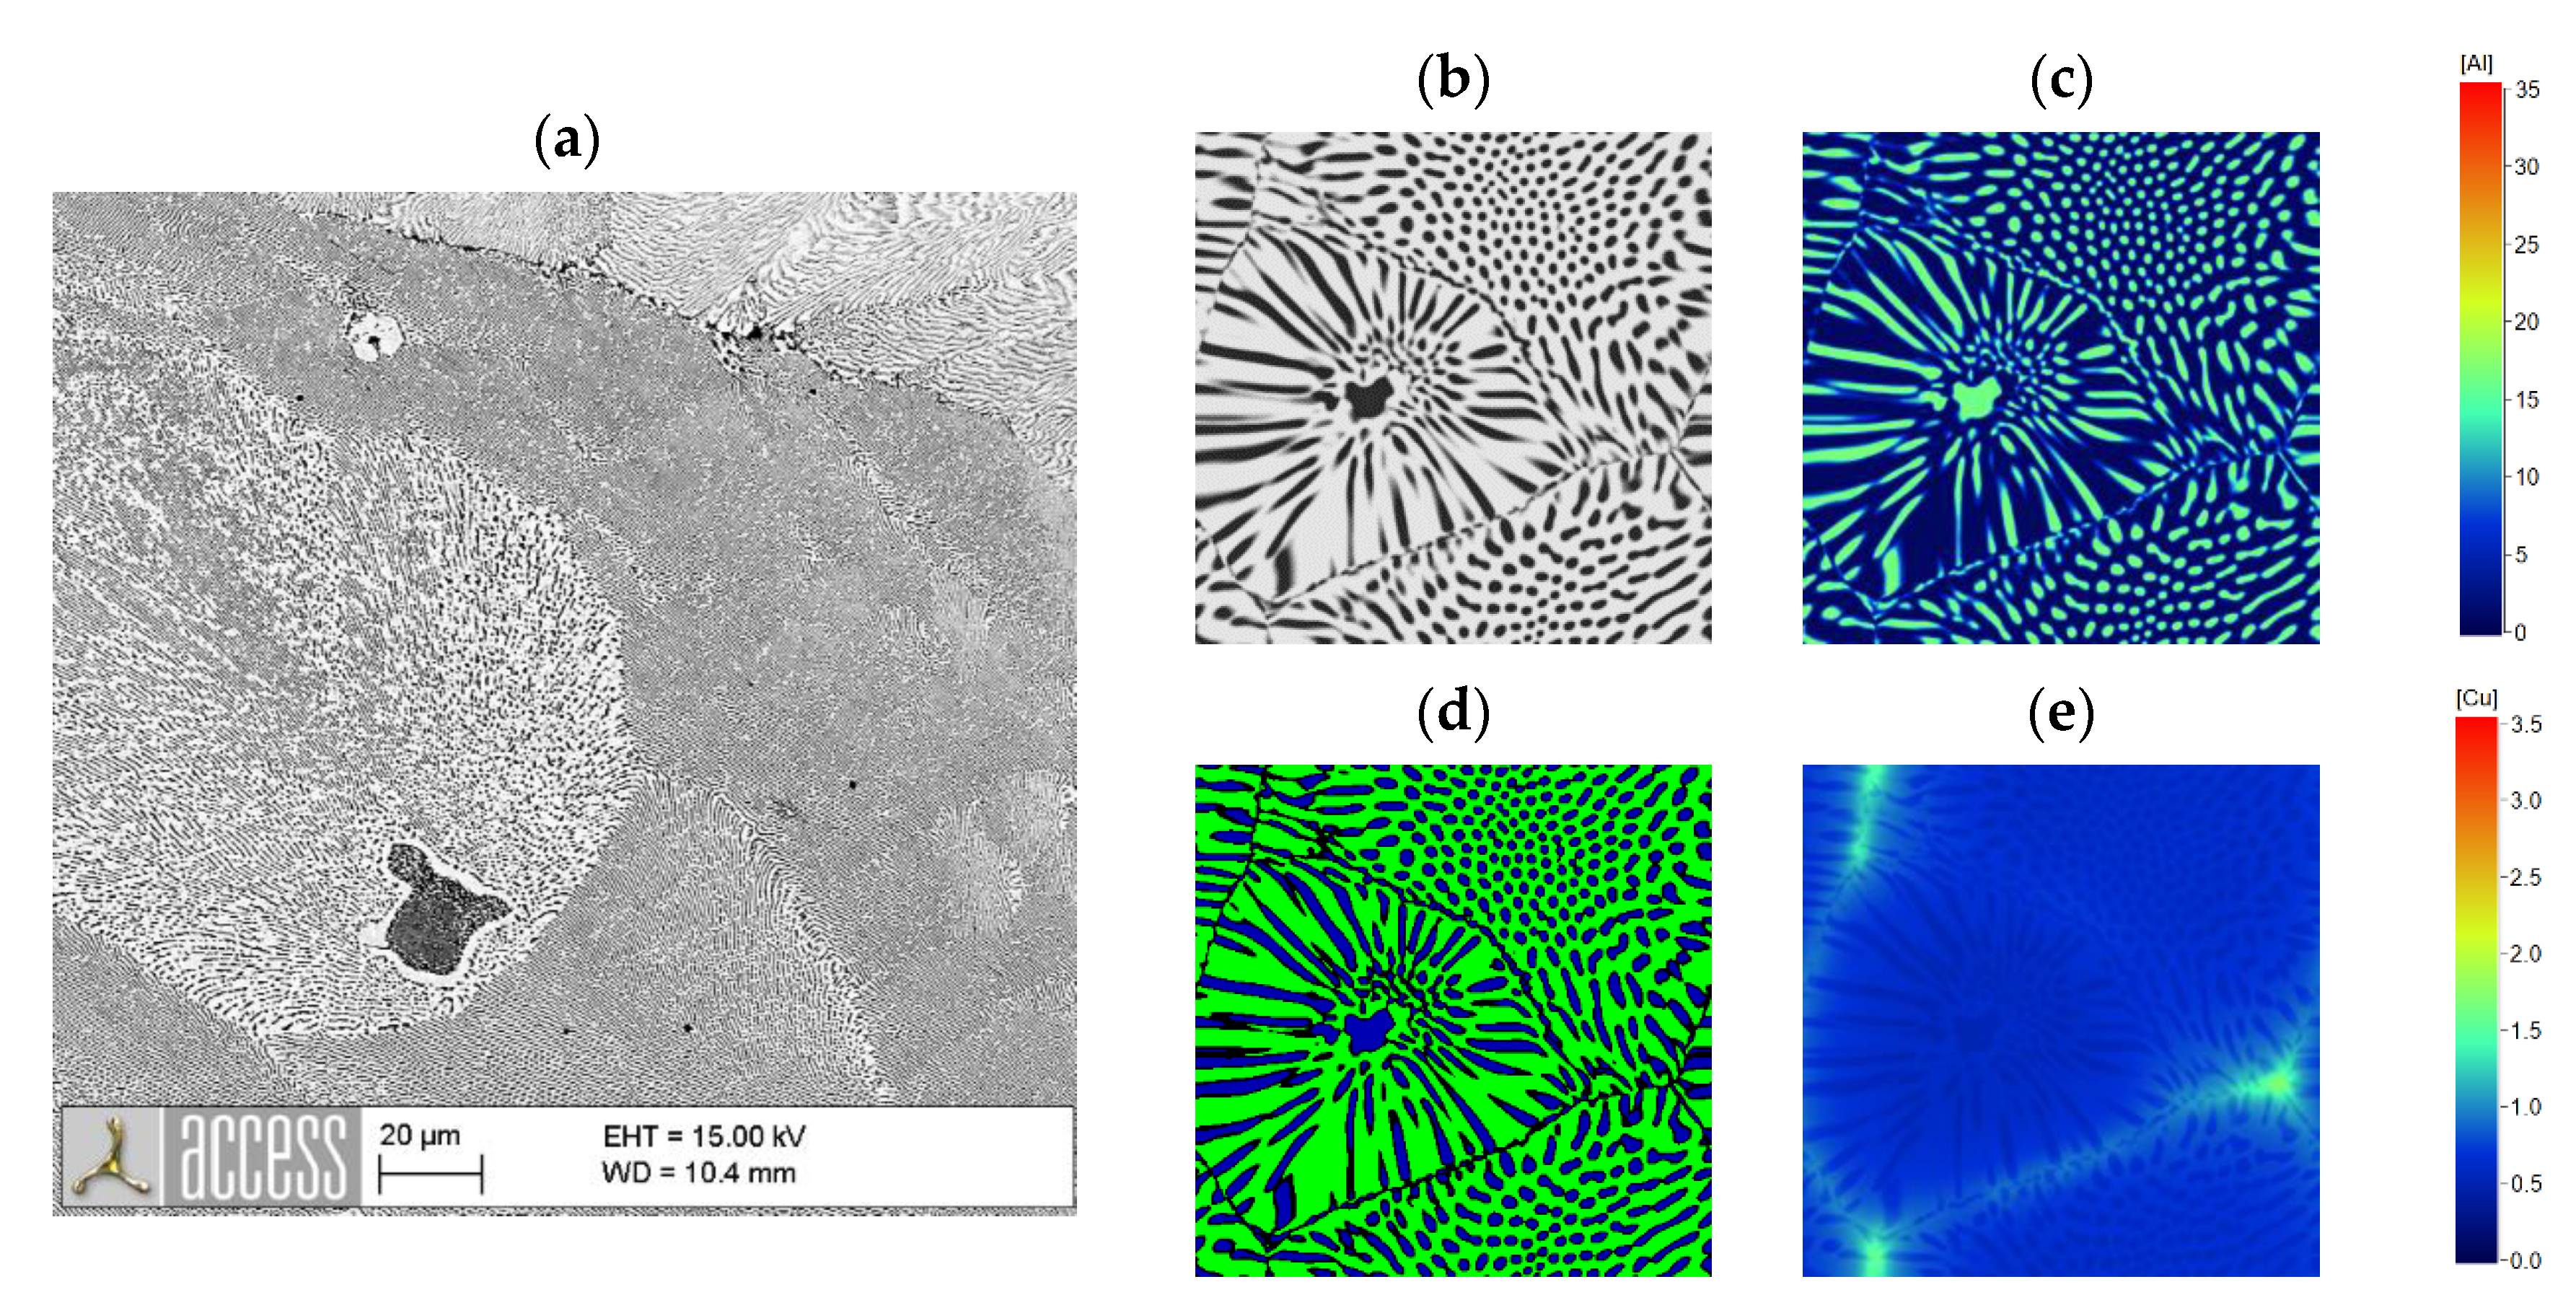
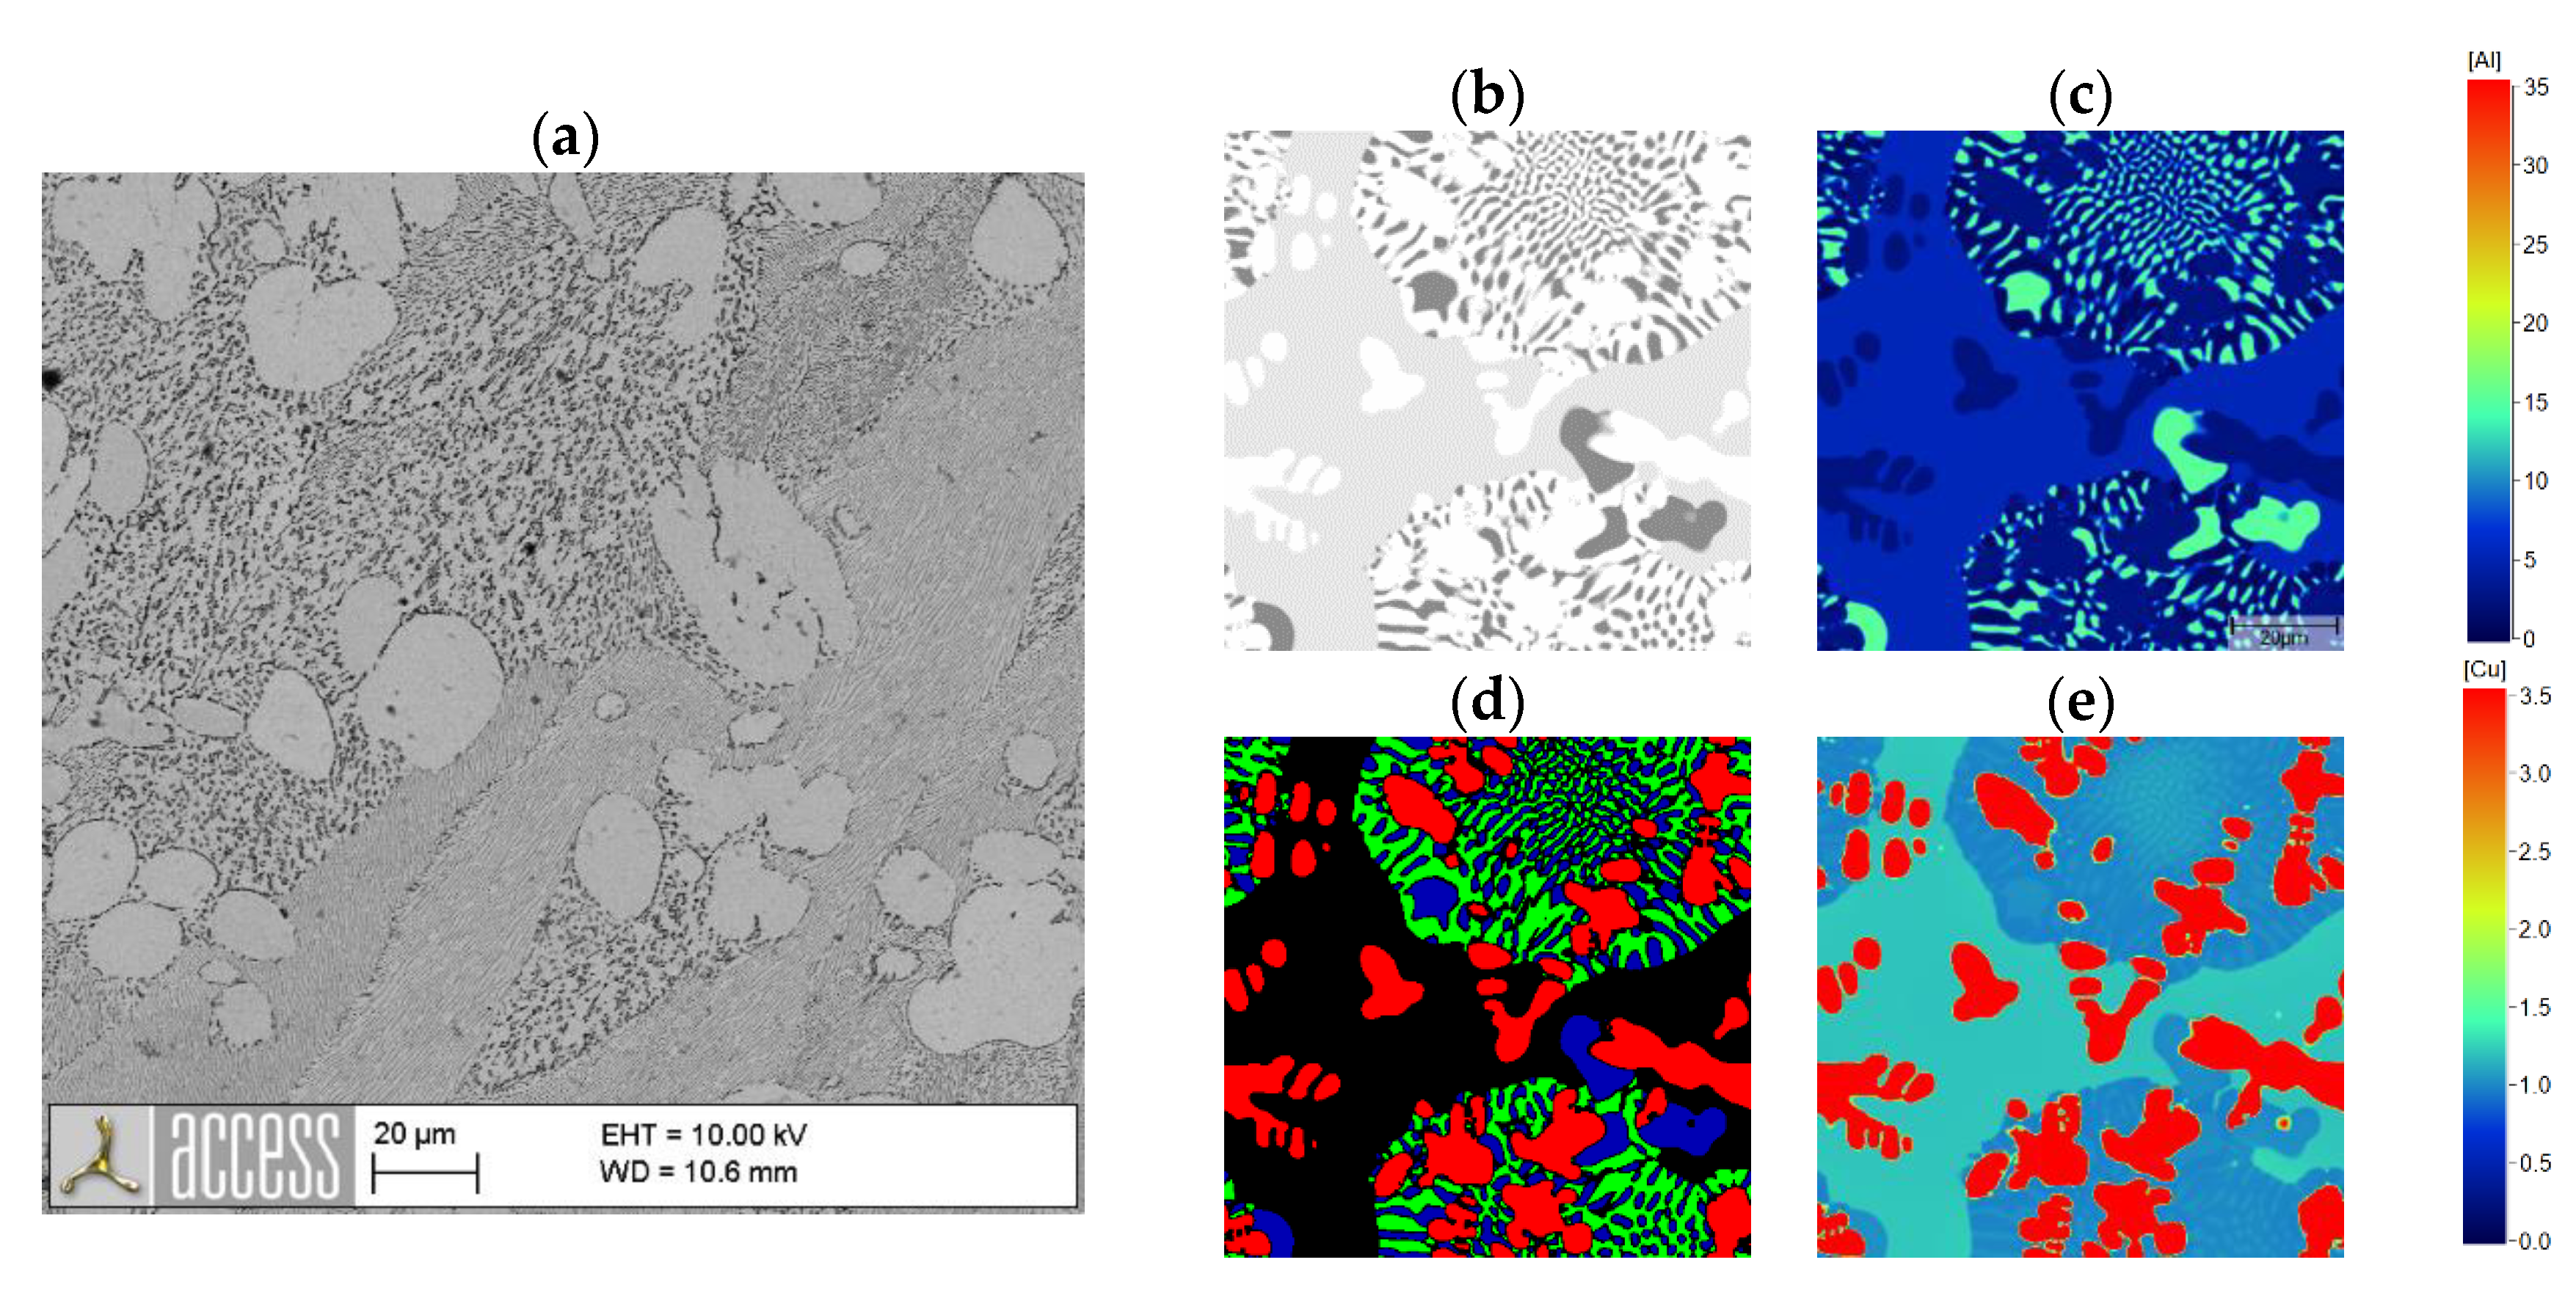
3. Results and Discussions
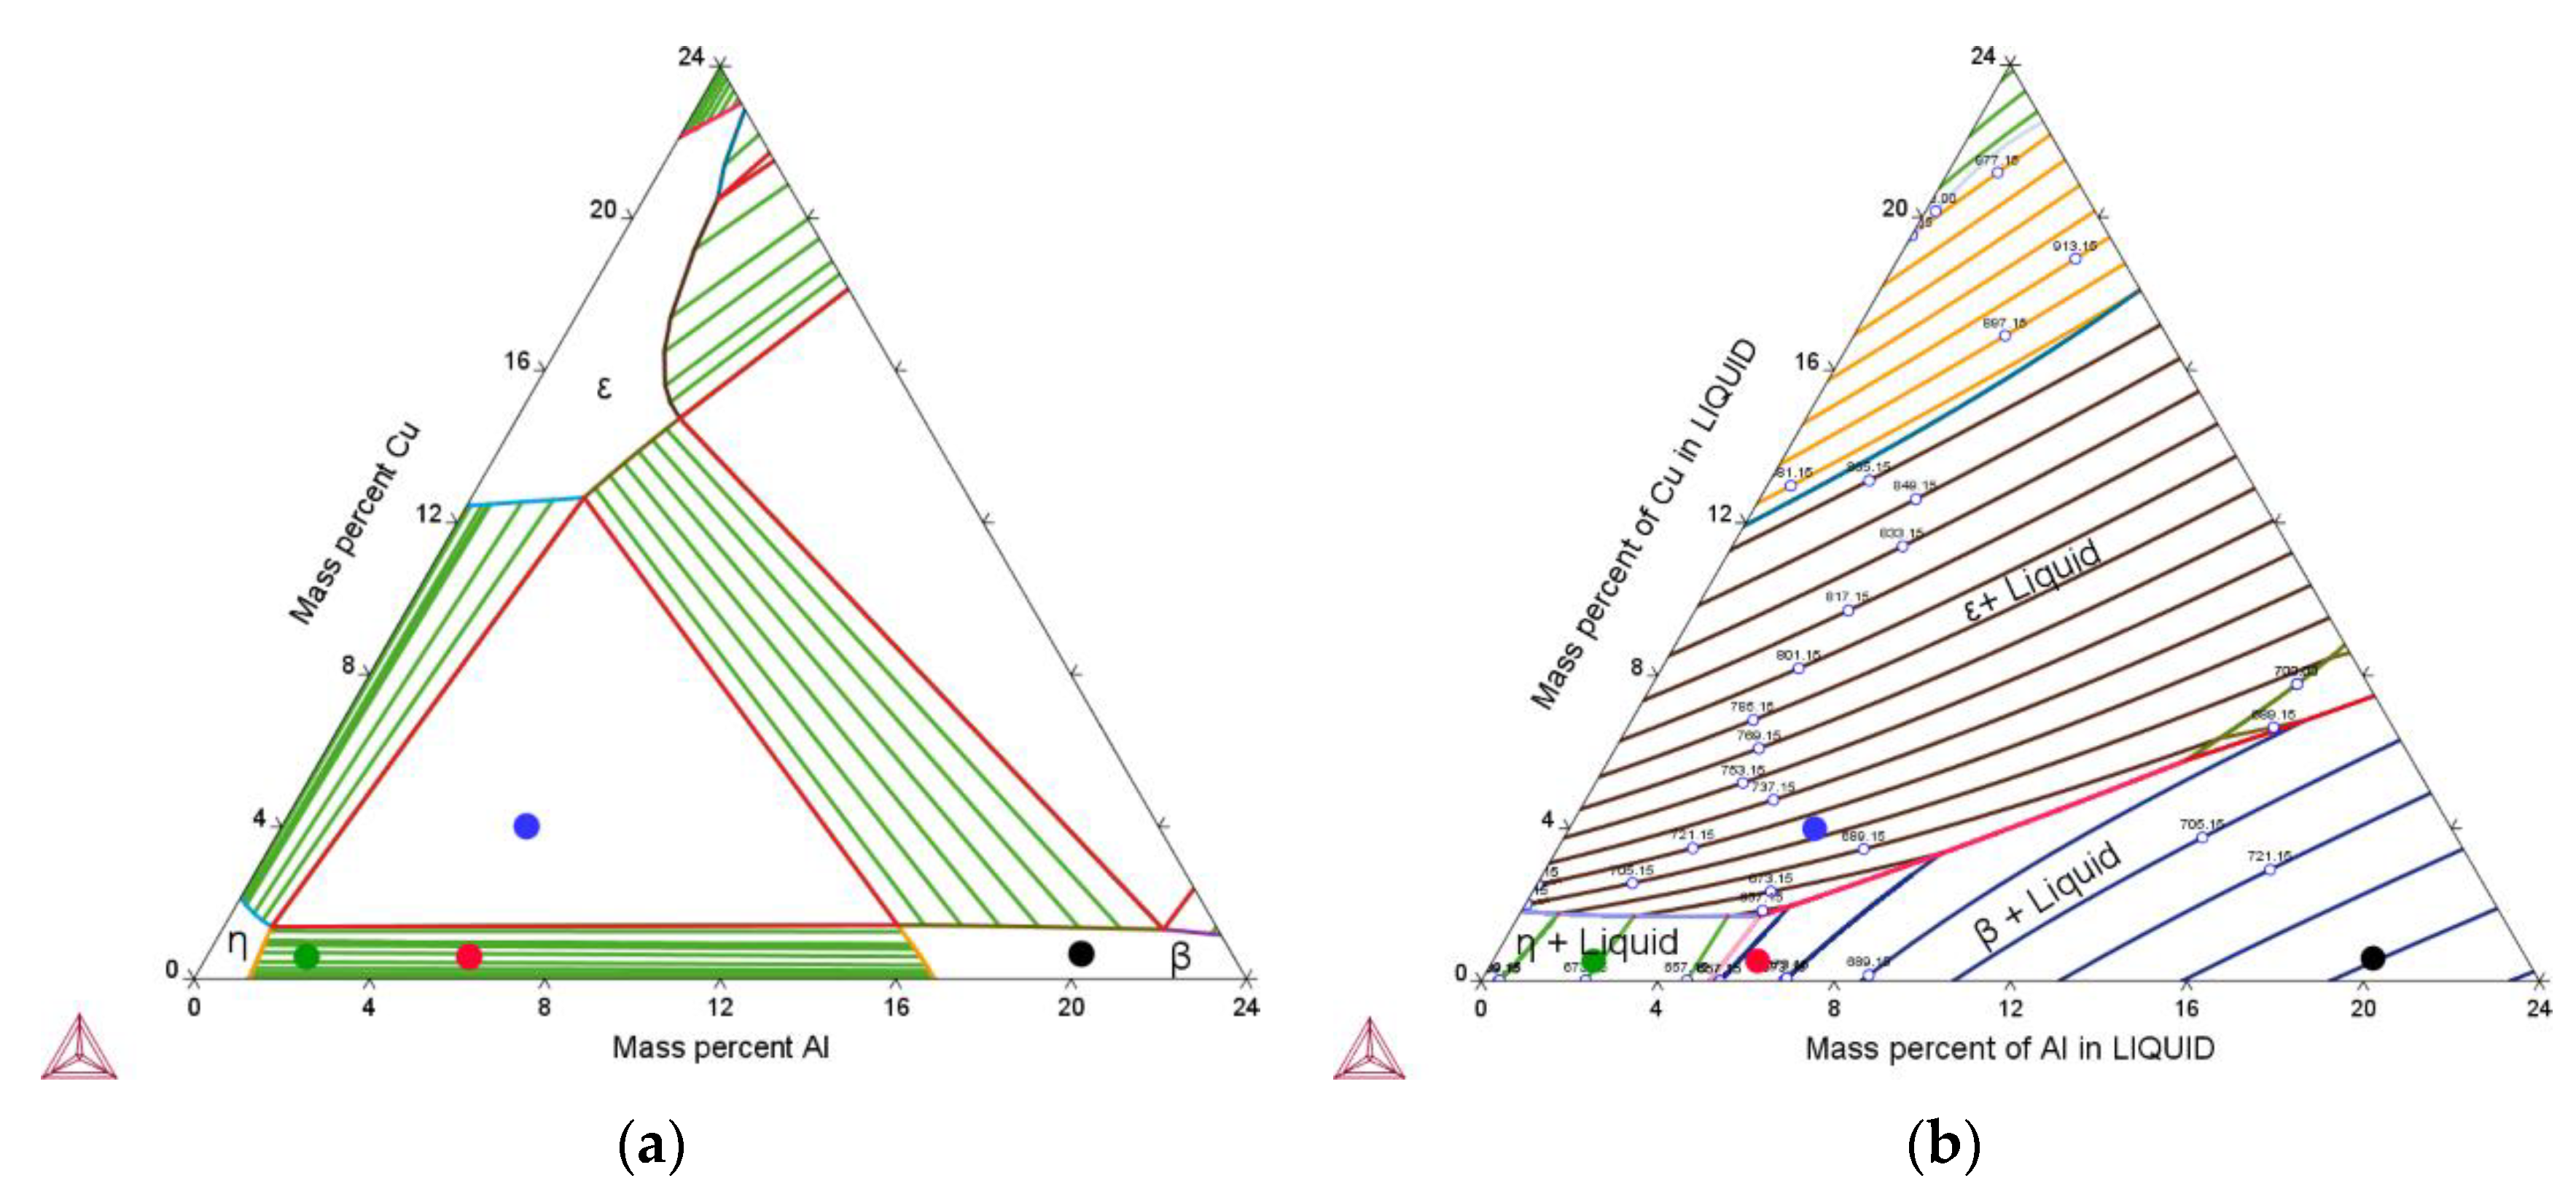
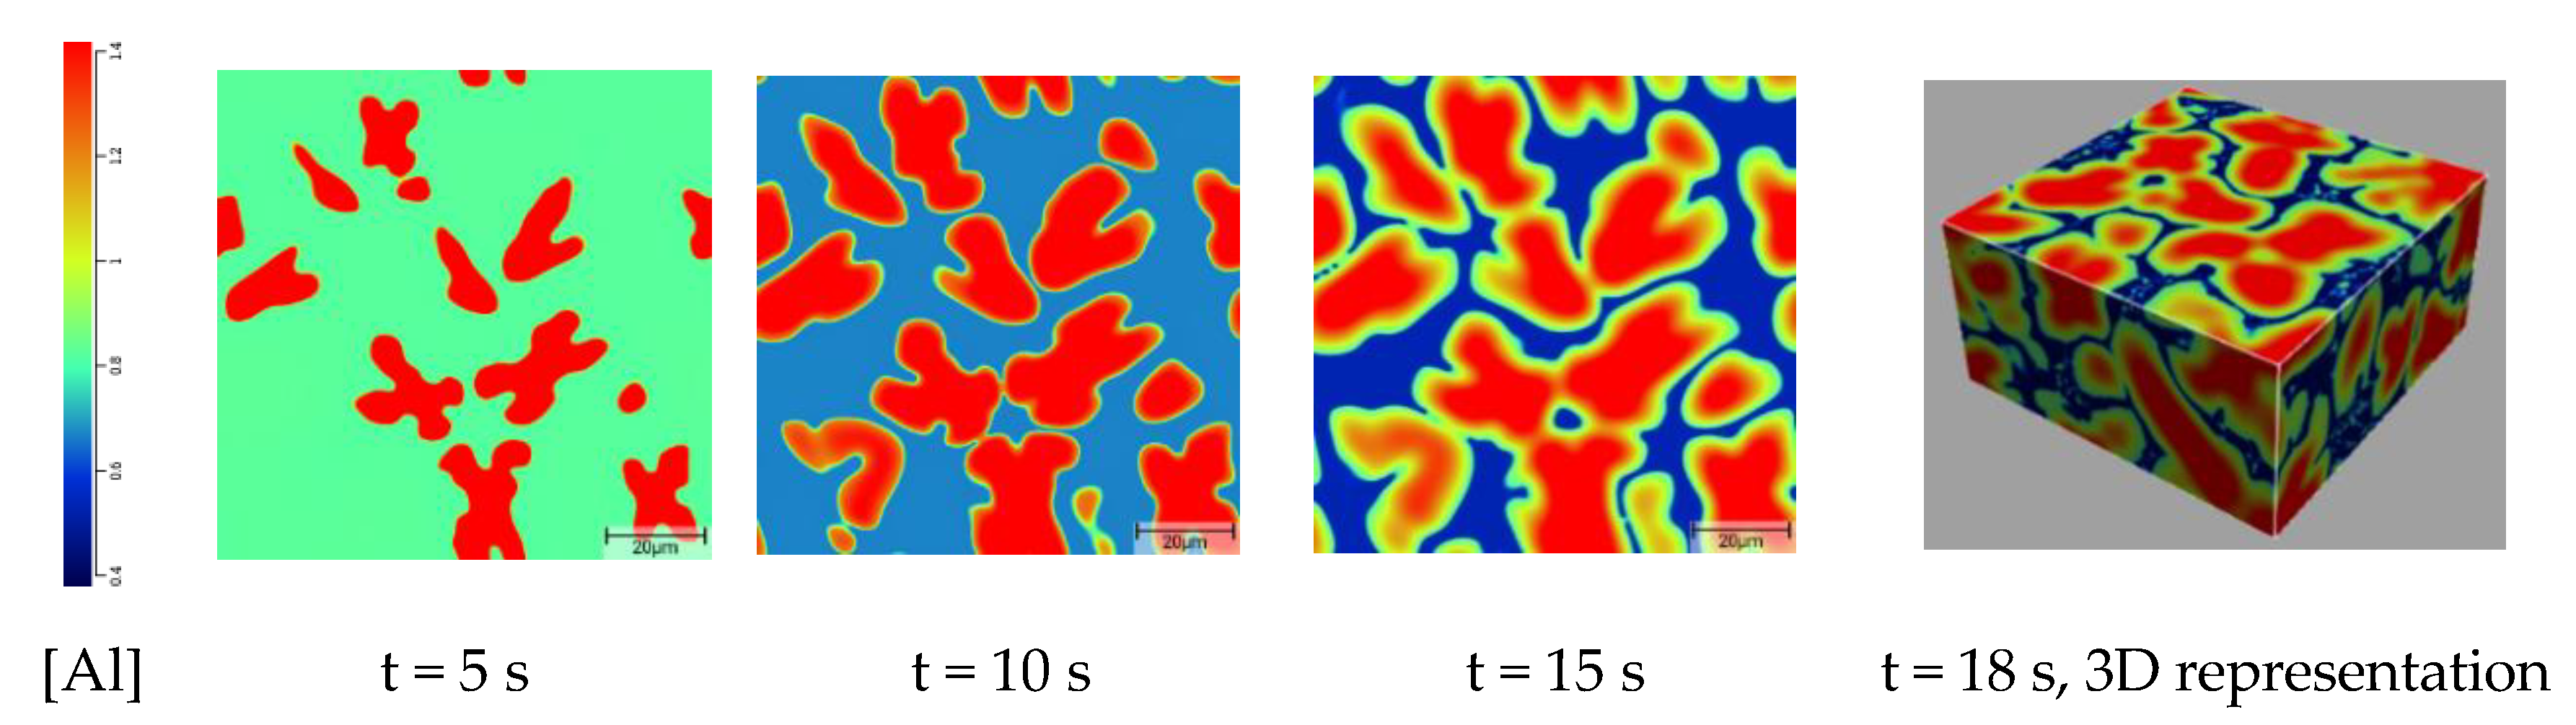
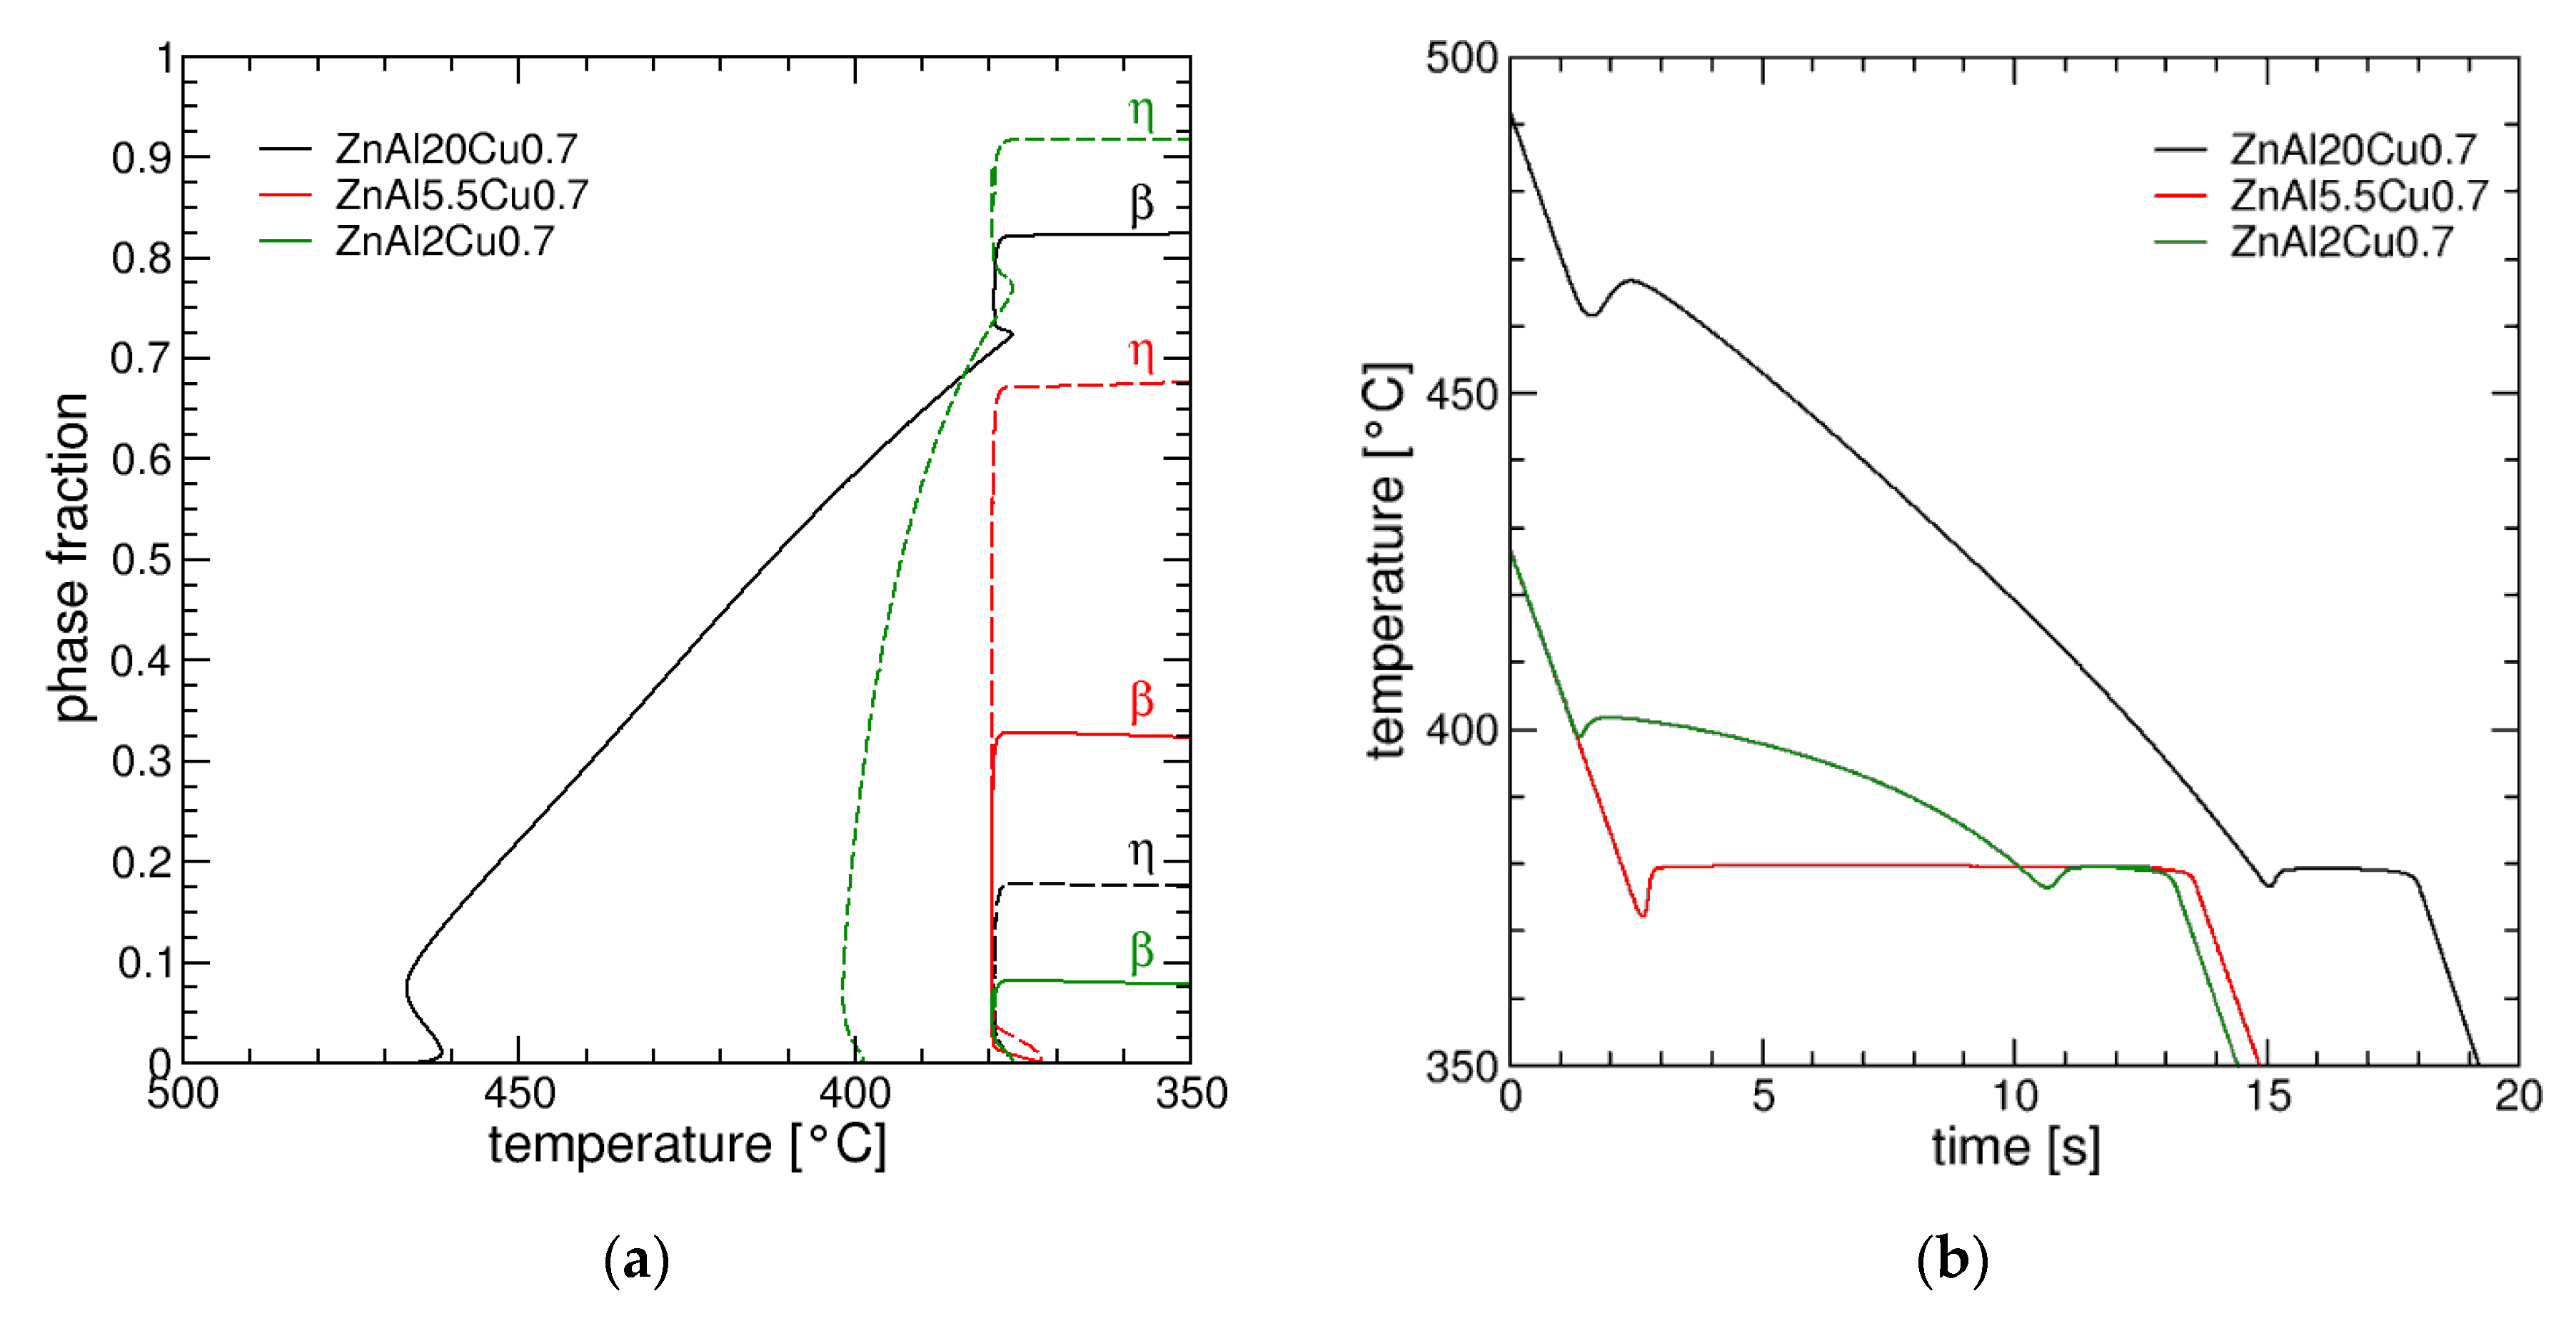
3.1. Simulated Solidification Path
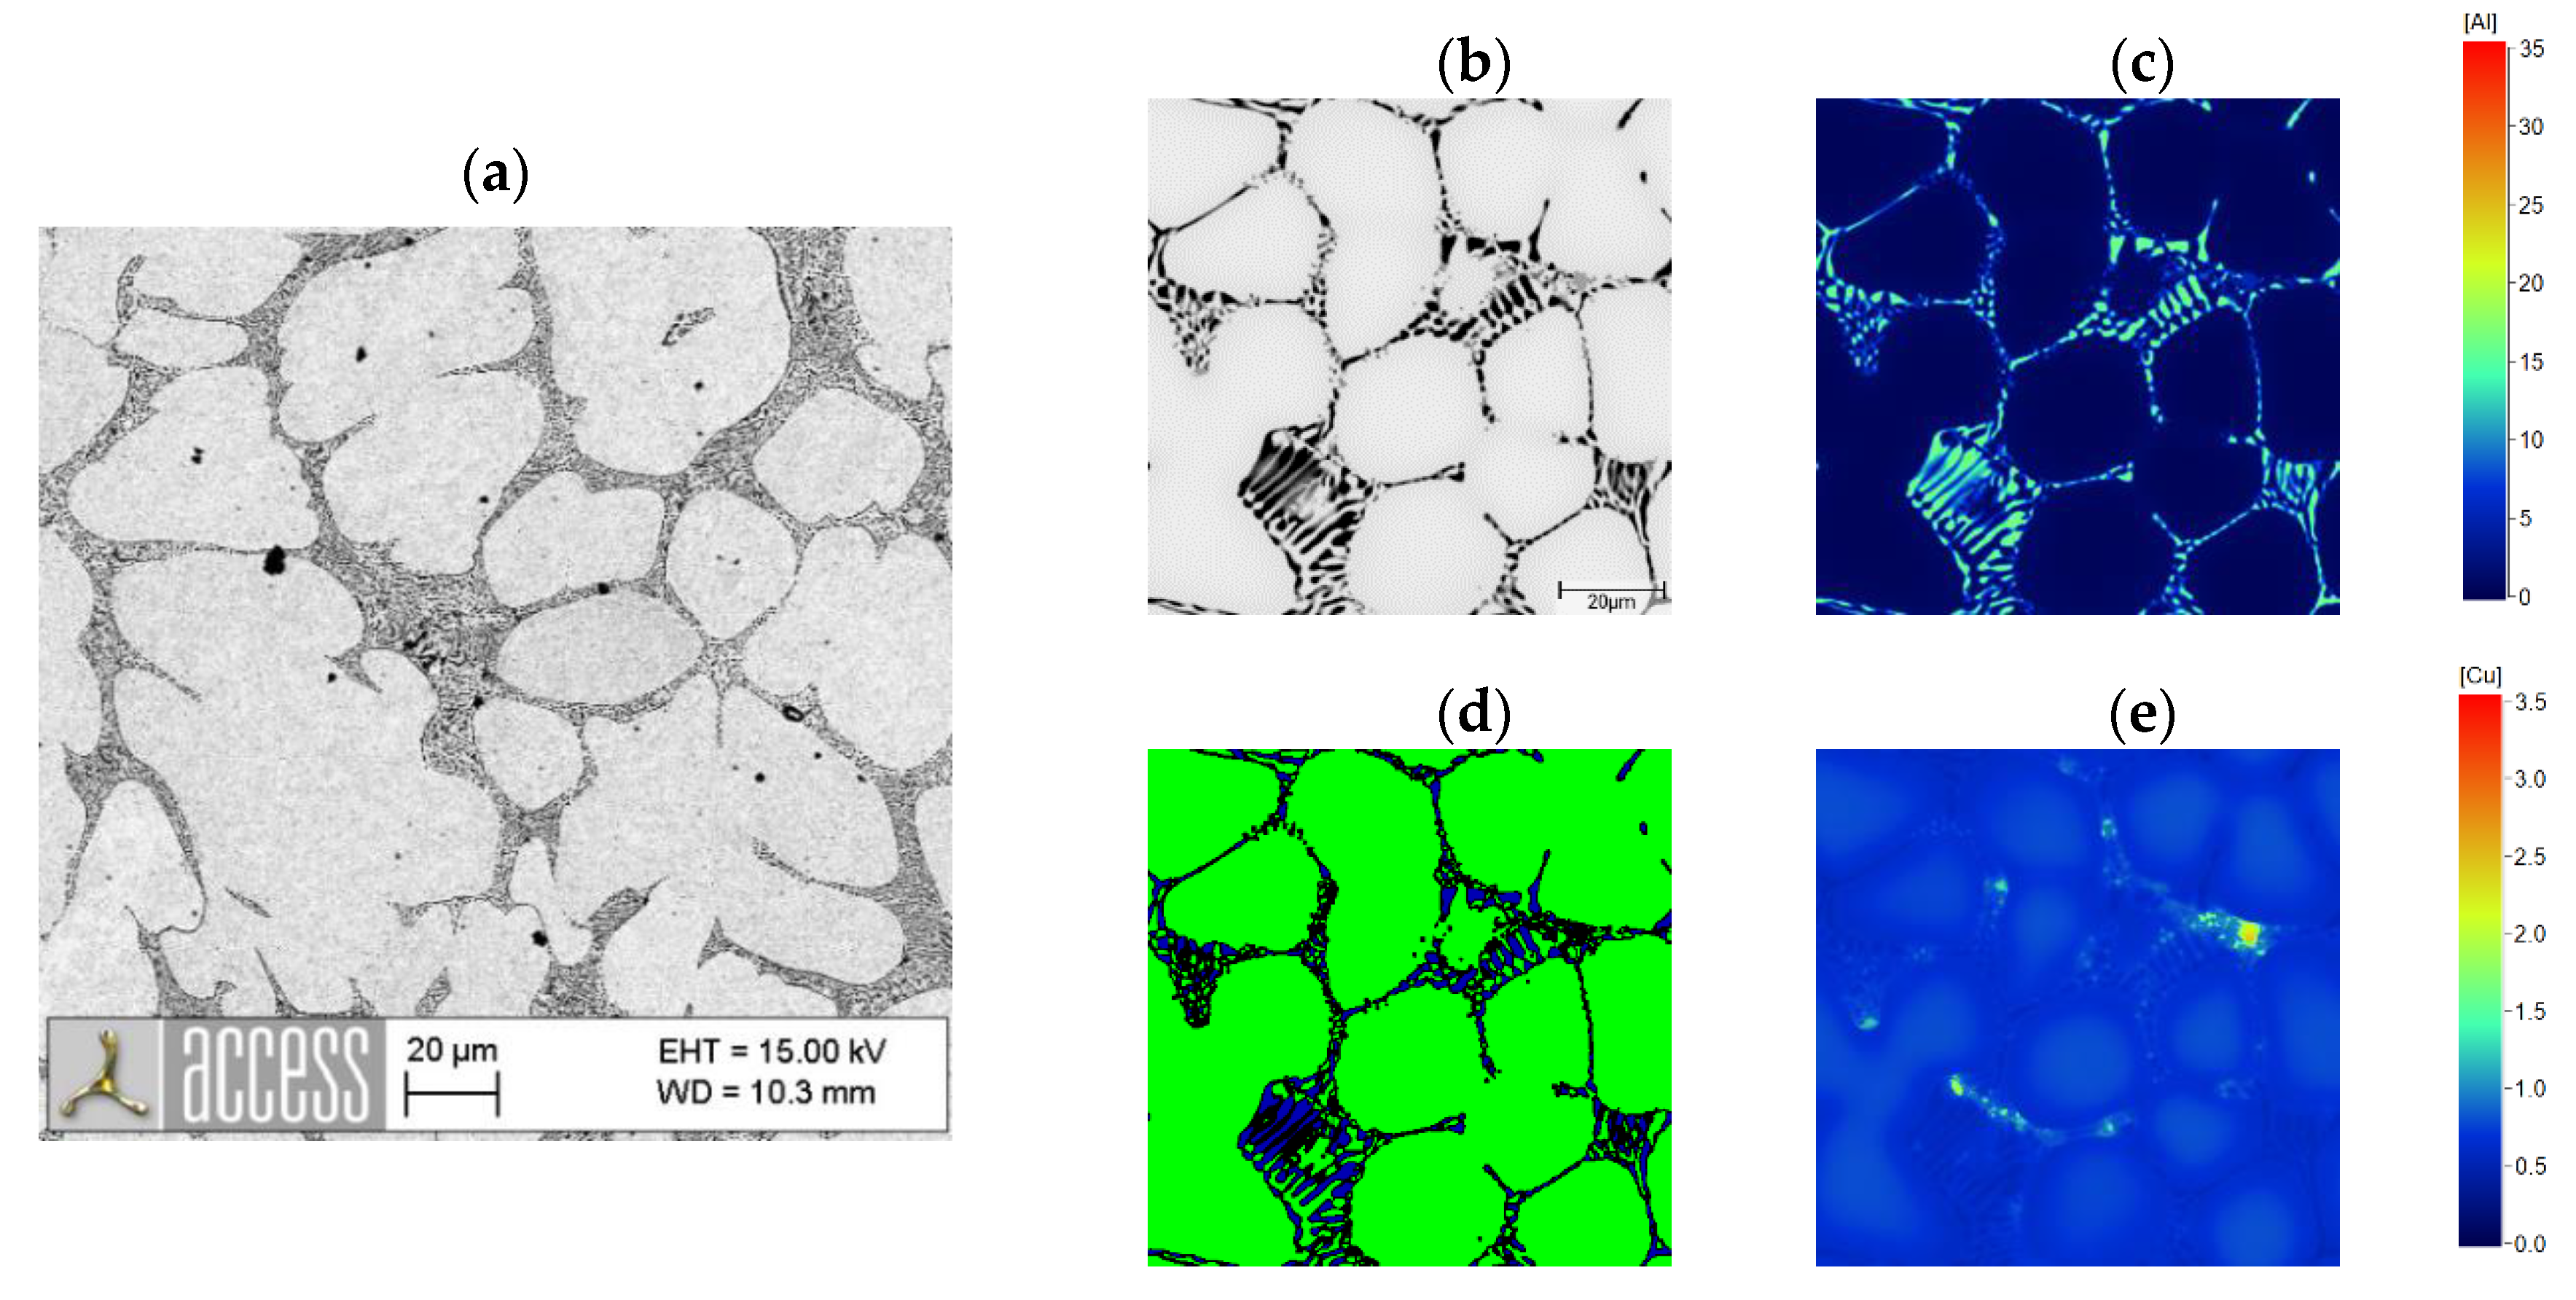
3.2. Correlation between Alloy Composition and Microstructure
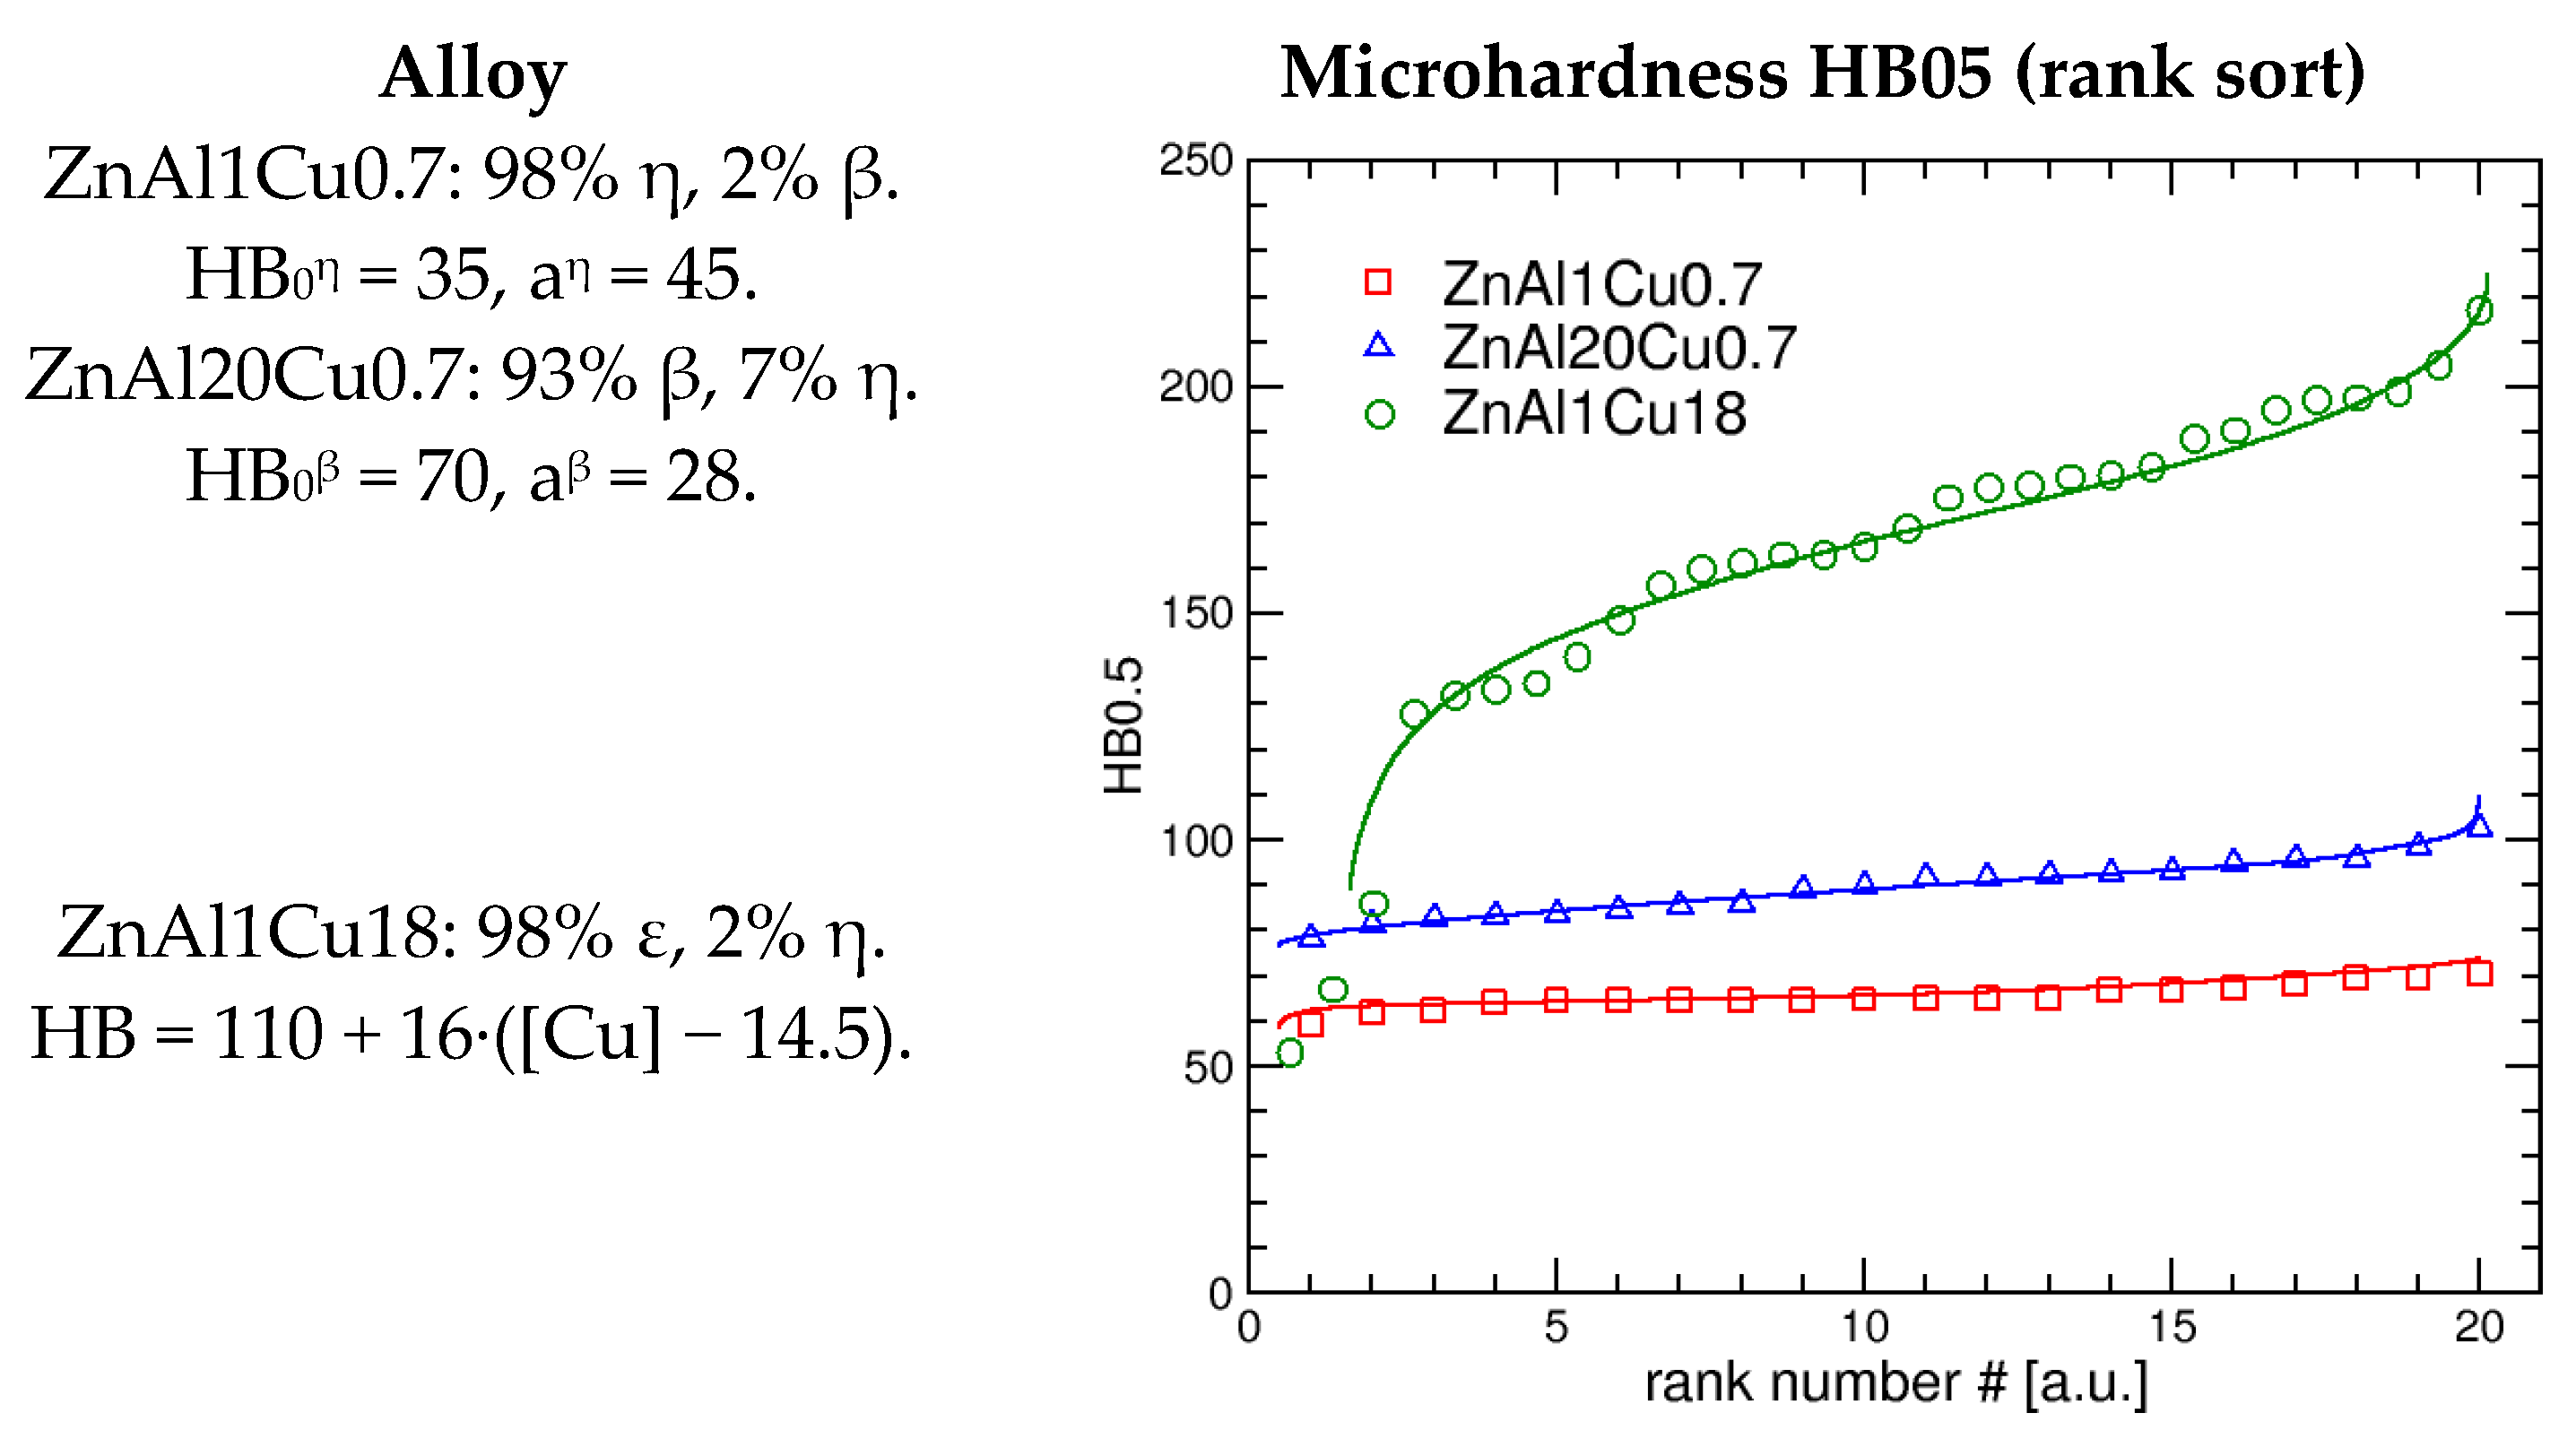
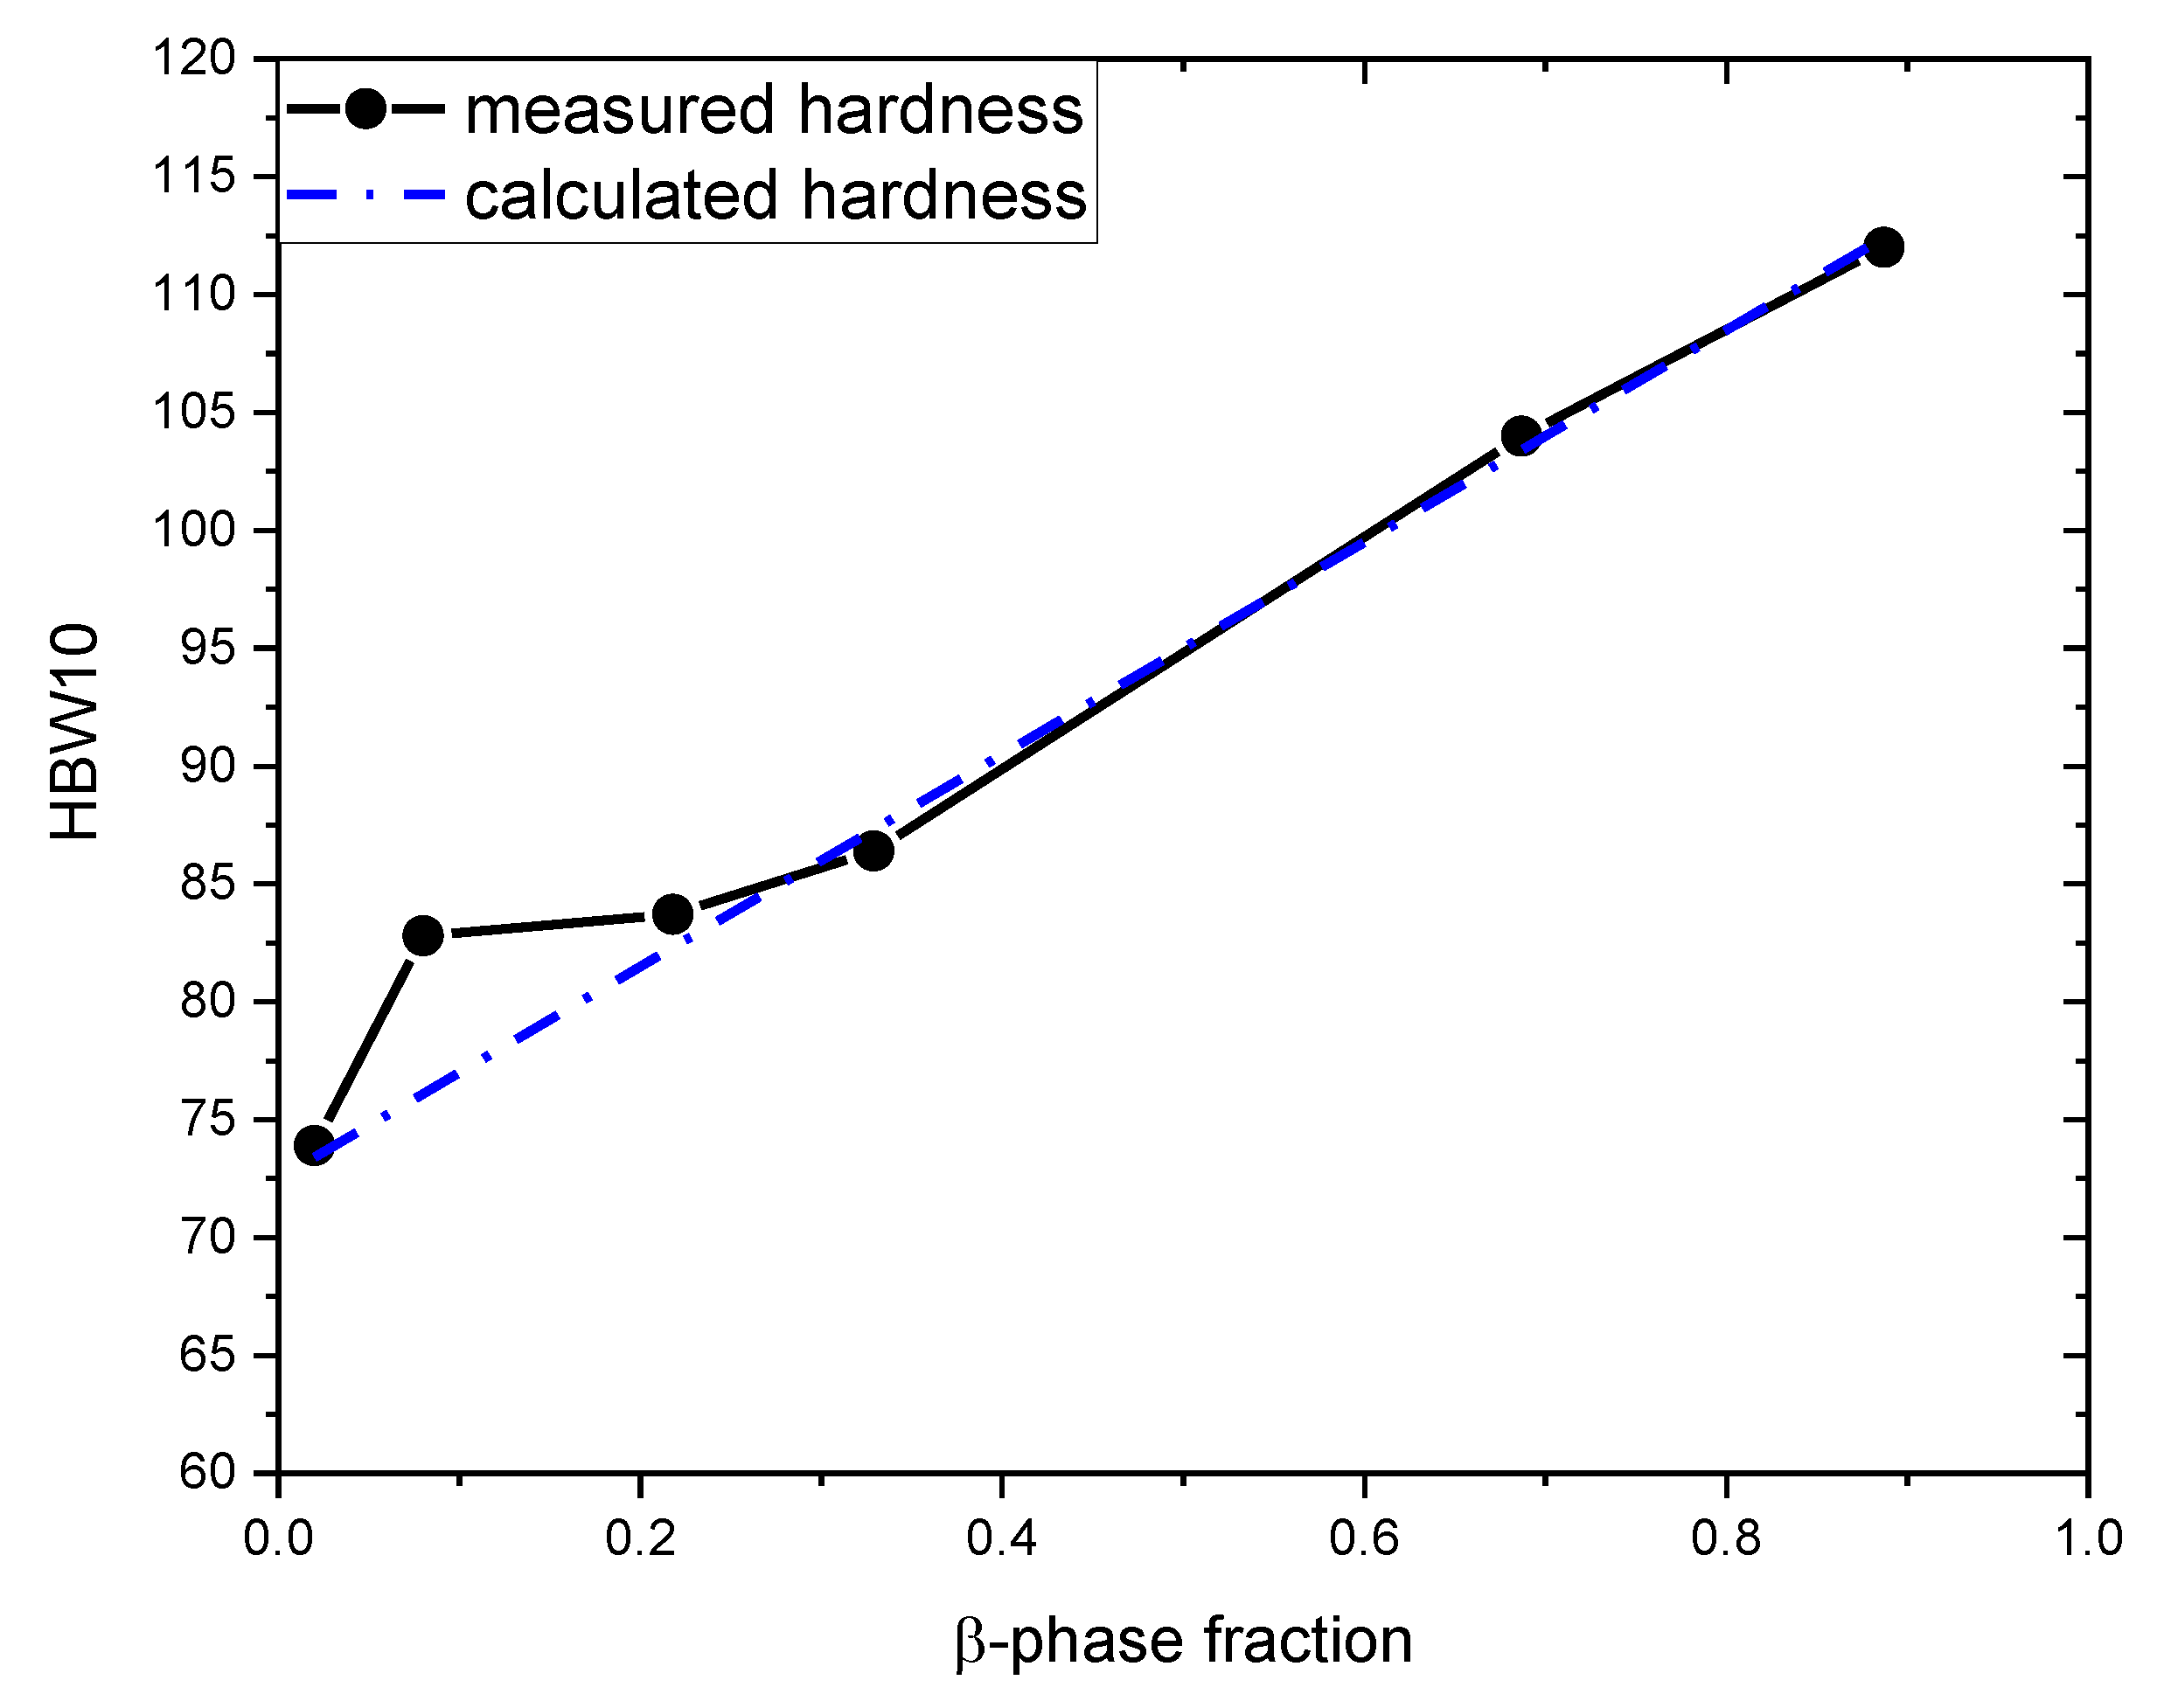
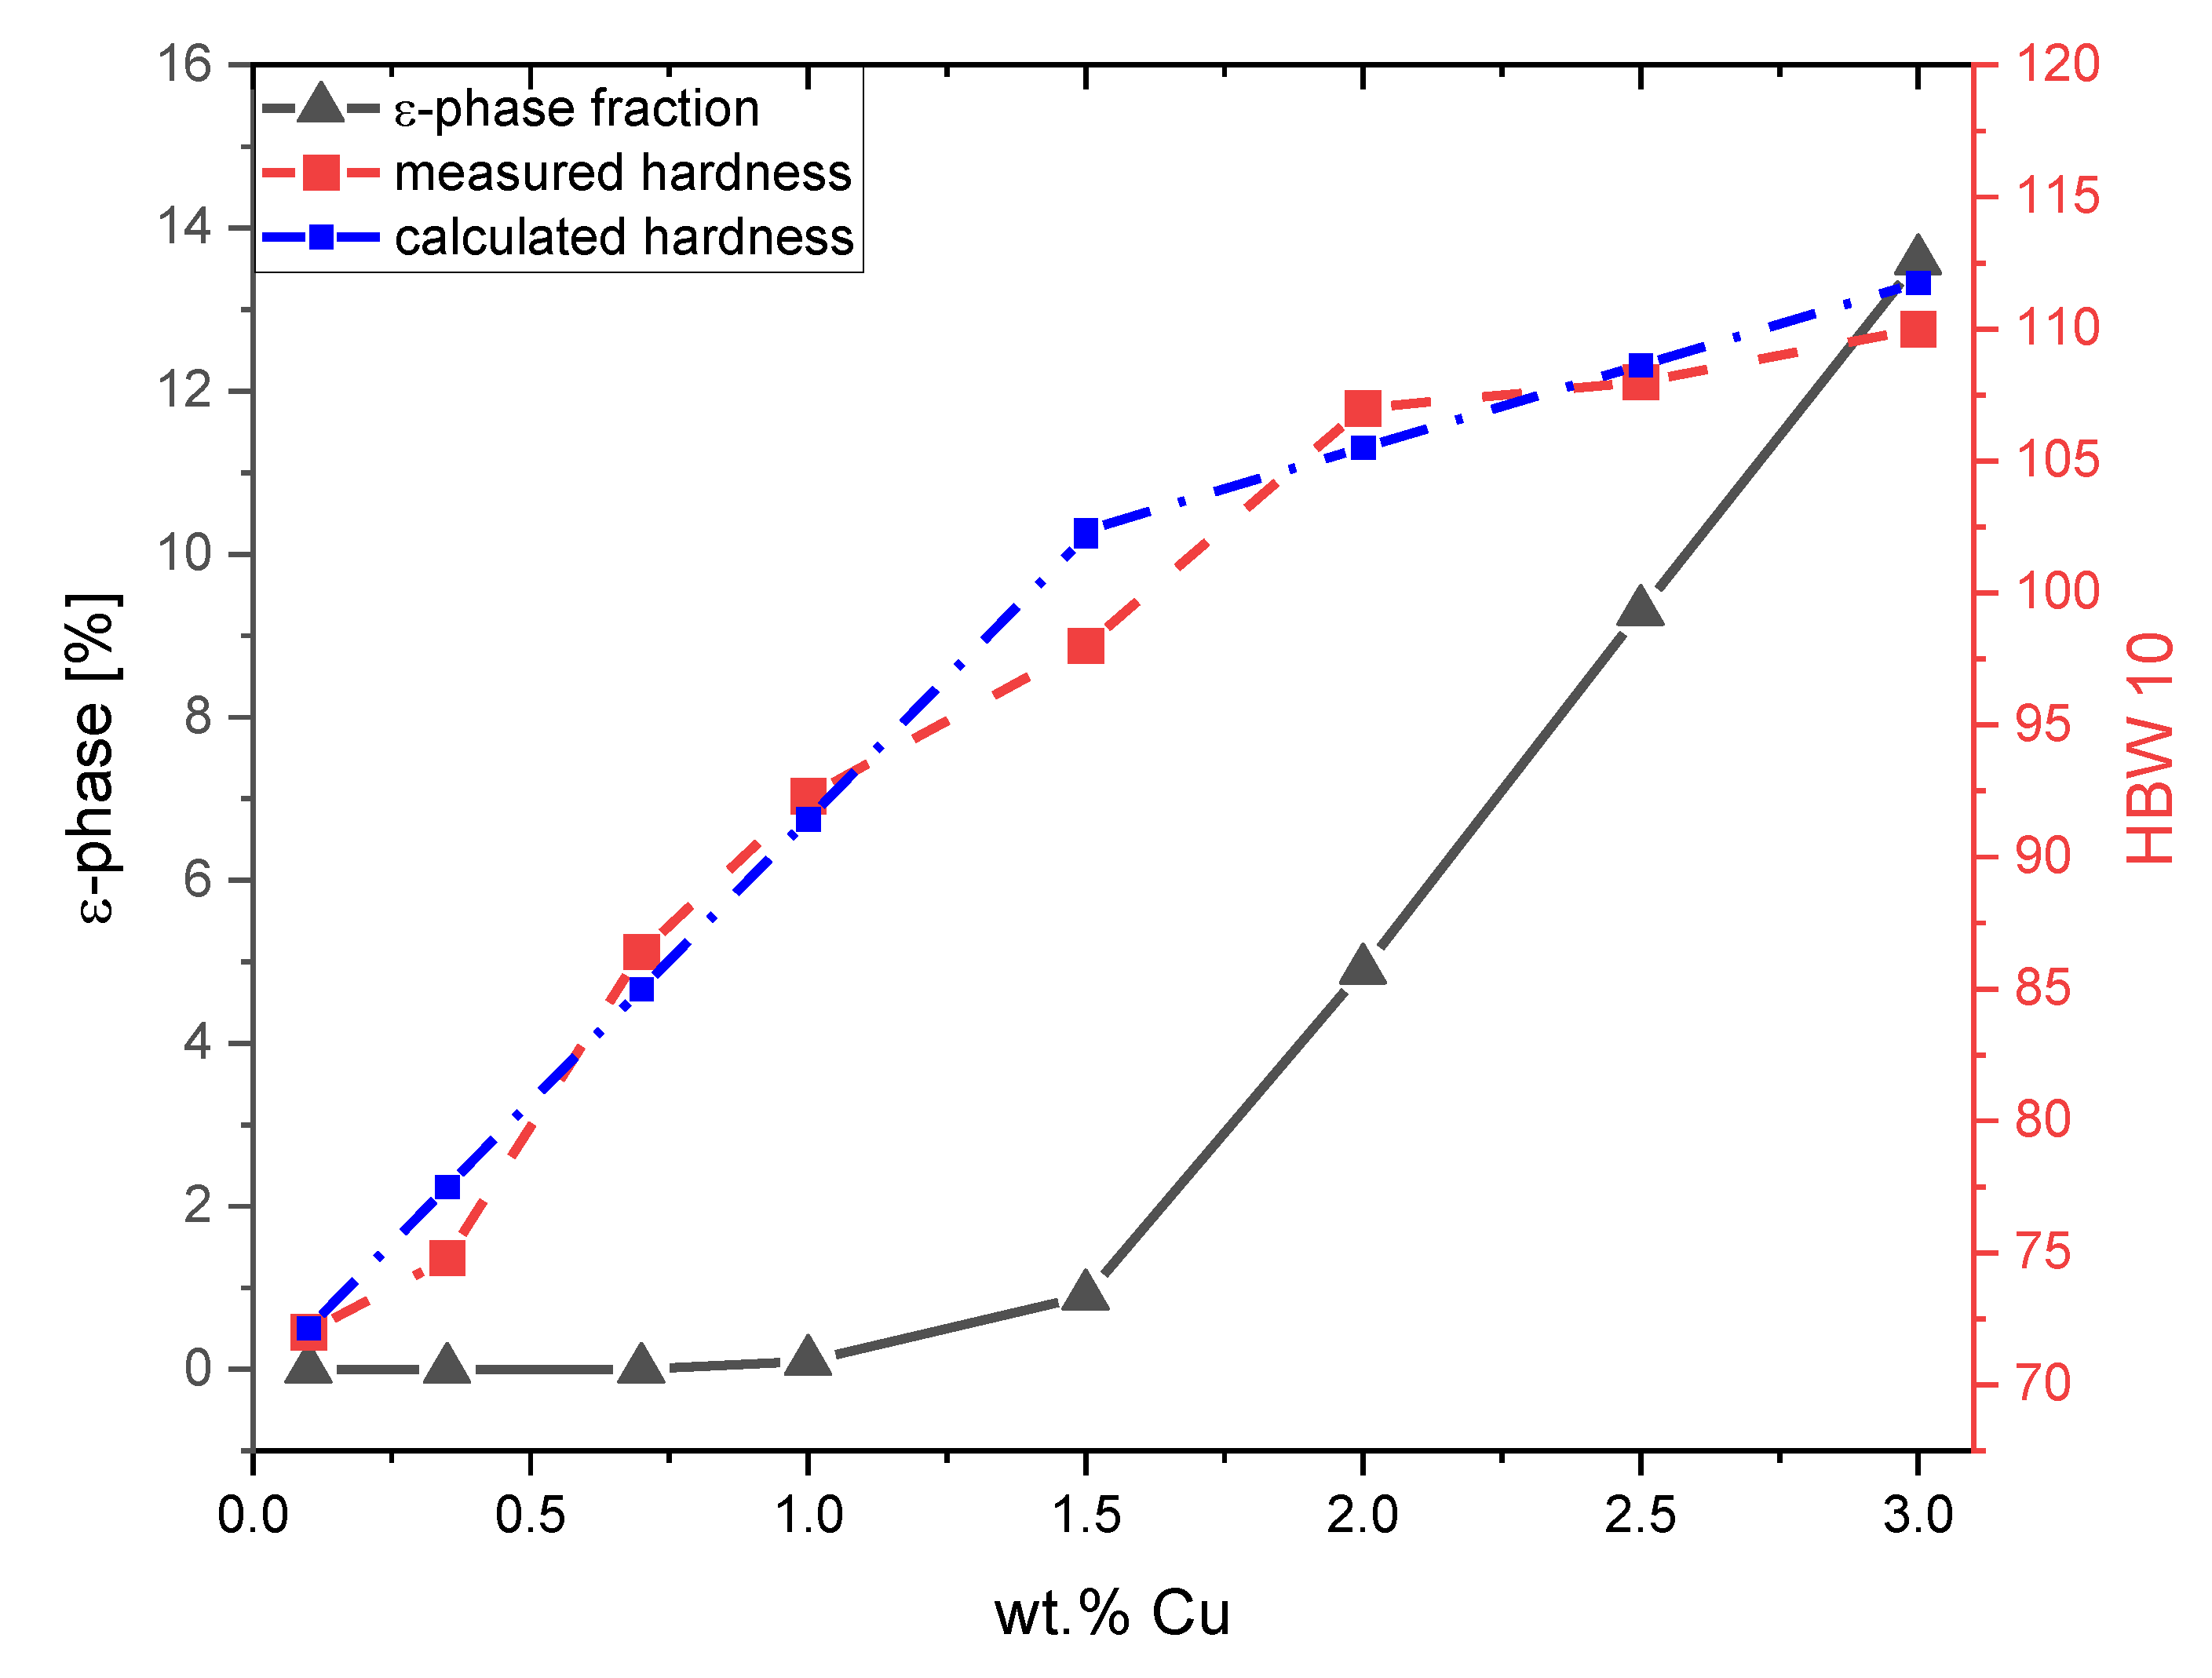
3.3. Hardness Measurement Results
4. Summary
Author Contributions
Funding
Conflicts of Interest
References
- Czichos, H.; Habig, K. Tribologie Handbuch.Tribometrie, Tribomaterialien, Tribotechnik; Springer Fachmedien: Wießbaden, Germany, 2015. [Google Scholar]
- Savaskan, T.; Murphy, S. Sliding wear of cast zinc-based alloy bearings under static and dynamic loading conditions. Wear 2002, 252, 693–703. [Google Scholar] [CrossRef]
- Li, H.; Liu, Y. Effect of zirconium on the microstructure and mechanical properties of Zn–4%Al hypoeutectic alloy. J. Alloy. Compd. 2014, 592, 127–134. [Google Scholar] [CrossRef]
- Zhang, L.; Chen, M. Structure and properties of an as-cast zinc-based alloy with high strength and wear resistance. J. Mater. Sci. Lett. 1998, 17, 1903–1905. [Google Scholar] [CrossRef]
- Savaskan, T.; Hekimoglu, A. Microstructure and mechanical properties of Zn–15Al-based ternary and quaternary alloys. Mater. Sci. Eng. A 2014, 603, 52–57. [Google Scholar] [CrossRef]
- Choudhury, P.; Das, S. Effect of Ni on the wear behavior of a zinc-aluminum alloy. J. Mater. Sci. 2002, 37, 2103–2107. [Google Scholar] [CrossRef]
- Dorantes-Rosales, H.; Victor, M. Microstructure characterization of phase transformations in a Zn–22 wt%Al–2 wt%Cu alloy by XRD, SEM, TEM and FIM. J. Alloy. Compd. 2000, 313, 154–160. [Google Scholar] [CrossRef]
- Mojaver, R.; Shahverdi, H. Relationship between cooling rate, microstructure features and wear behavior in end-chill cast Zn–27%Al alloys containing more than 2% Cu. Wear 2011, 271, 2899–2908. [Google Scholar] [CrossRef]
- Jareno, E.; Castro, M. The effects of Cu and cooling rate on the fraction and distribution of epsilon phase in Zn–4Al–(3–5.6)Cu alloys. J. Alloy. Compd. 2010, 490, 524–530. [Google Scholar] [CrossRef]
- Savaskan, T.; Pürcek, G. Effect of copper content on the mechanical and tribological properties of ZnAl27-based alloys. Tribol. Lett. 2003, 15, 257–263. [Google Scholar] [CrossRef]
- Liang, S.; Schmid-Fetzer, R. Thermodynamic assessment of the Al-Cu-Zn system, part III: Al-Cu-Zn ternary system. CALPHAD 2016, 52, 21–37. [Google Scholar] [CrossRef]
- Zhu, Y. Phase transformations of eutectoid Zn-Al alloys. J. Mater. Sci. 2001, 36, 3973–3980. [Google Scholar] [CrossRef]
- Zhu, Y.; Lee, W. Tensile deformation-induced phase transformation in cast Zn–Al-based alloy (ZnAl7Cu3). Mater. Res. Bull. 2003, 38, 1851–1858. [Google Scholar] [CrossRef]
- Krupinski, M.B.K. Influence of cooling rate on crystallisation kinetics on microstructure of cast zinc alloys. J. Therm. Anal. Calorim. 2014, 118, 1361–1367. [Google Scholar] [CrossRef]
- Petzow, G. Metallographisches Ätzen 5. Auflage; Borntraeger Verlag: Berlin, Germany, 1976. [Google Scholar]
- ACCESS. Available online: www.micress.de (accessed on 29 May 2020).
- Böttger, B.; Eiken, J. Phase-field simulation of microstructure formation in technical castings—A self-consistent homoenthalpic approach to the micro–macro problem. J. Comput. Phys. 2009, 228, 6784–6795. [Google Scholar] [CrossRef]
- Böttger, B.; Apel, M.; Budnitzki, J.; Eiken, G.; Laschet, G.; Zhou, G. Calphad Coupled Phase-field Model with Mechano-Chemical Contributions and its Application to Rafting of γ’ in CMSX-4. Comput. Mater. Sci. 2020, 184, 109909. [Google Scholar] [CrossRef]
- Böttger, B.; Eiken, J. Phase field simulation of equiaxed solidification in technical alloys. Acta Mater. 2006, 54, 2697–2704. [Google Scholar] [CrossRef]
- Böttger, B.; Eiken, J.; Apel, M. Multi-Ternary Extrapolation Scheme for Efficient Coupling of Thermodynamic Data to a Multi-Phase-Field Model. Comput. Mater. Sci. 2015, 108, 283–292. [Google Scholar] [CrossRef]
- Carré, A.; Böttger, B.; Apel, M. Implementation of an antitrapping current for a multicomponent multiphase-field ansatz. J. Cryst. Growth 2013, 380, 5–13. [Google Scholar] [CrossRef]
- Eiken, J. Numerical solution of the phase-field equation with minimized discretization error. In Numerical Solution of the Phase-Field Equation with Minimized Discretization Error; IOP Publishing Ltd.: Bristol, UK, 2012. [Google Scholar]
- Savaskan, T.; Hekimoglu, A. Relationships between mechanical and tribological properties of Zn-15Al alloys. Int. J. Mater. Res. 2016, 107, 646–652. [Google Scholar] [CrossRef]


| Diffusion Coefficients | Interfacial Energy | ||
|---|---|---|---|
| Al in melt | 2 × 10⁻⁶ cm2/s | solid phases/melt | 2.5 × 10⁻⁵ J/cm2 |
| Cu in melt | 2 × 10⁻⁶ cm2/s | solid/solid interfaces | 2.5 × 10⁻⁵ J/cm2 |
| Al in all solid phases | 3.1 × 10⁻⁹ cm2/s | interfacial anisotropies | |
| Cu in all solid phases | 3.1 × 10⁻⁹ cm2/s | β-Al (Zn-rich) | cubic |
| - | - | η-Zn and ε-Zn4Cu | hexagonal |
| Interface mobility for solid/melt interfaces | ∞ according to the thin interface limit [21] | ||
| Alloy | β Phase (Simulation) [%] | β Phase (Equilibrium) [%] |
|---|---|---|
| ZnAlCu0.7 | 2.0 | 0 |
| ZnAl2Cu0.7 | 8.0 | 6.6 |
| ZnAl4Cu0.7 | 21.8 | 21.8 |
| ZnAl5.5Cu0.7 | 32.9 | 32.8 |
| ZnAl11Cu0.7 | 69.7 | 69.6 |
| ZnAl20Cu0.7 | 88.7 | 100 |
Publisher’s Note: MDPI stays neutral with regard to jurisdictional claims in published maps and institutional affiliations. |
© 2020 by the authors. Licensee MDPI, Basel, Switzerland. This article is an open access article distributed under the terms and conditions of the Creative Commons Attribution (CC BY) license (http://creativecommons.org/licenses/by/4.0/).
Share and Cite
Gimmler, S.; Apel, M.; Bührig-Polaczek, A. Selection of Dedicated As-Cast Microstructures in Zn-Al-Cu Alloys for Bearing Applications Supported by Phase-Field Simulations. Metals 2020, 10, 1659. https://doi.org/10.3390/met10121659
Gimmler S, Apel M, Bührig-Polaczek A. Selection of Dedicated As-Cast Microstructures in Zn-Al-Cu Alloys for Bearing Applications Supported by Phase-Field Simulations. Metals. 2020; 10(12):1659. https://doi.org/10.3390/met10121659
Chicago/Turabian StyleGimmler, Steffen, Markus Apel, and Andreas Bührig-Polaczek. 2020. "Selection of Dedicated As-Cast Microstructures in Zn-Al-Cu Alloys for Bearing Applications Supported by Phase-Field Simulations" Metals 10, no. 12: 1659. https://doi.org/10.3390/met10121659
APA StyleGimmler, S., Apel, M., & Bührig-Polaczek, A. (2020). Selection of Dedicated As-Cast Microstructures in Zn-Al-Cu Alloys for Bearing Applications Supported by Phase-Field Simulations. Metals, 10(12), 1659. https://doi.org/10.3390/met10121659