Article

Atomic-Scale Mechanism Investigation of Mass Transfer in Laser Fabrication Process of Ti-Al Alloy via Molecular Dynamics Simulation

State Key Laboratory for Advanced Metals and Materials, University of Science and Technology Beijing, Beijing 100083, China
*
Author to whom correspondence should be addressed.
Metals 2020, 10(12), 1660; https://doi.org/10.3390/met10121660
Submission received: 21 October 2020 / Revised: 28 November 2020 / Accepted: 9 December 2020 / Published: 10 December 2020

Abstract

:
This article deals with a Ti-Al alloy system. Molecular dynamics simulation was used to simulate and explore the mass transfer behavior during the laser fabrication process at atomic scale. The research goal is to investigate the mass transfer mechanism at atomic scale and the movement of solute atoms during the laser fabrication process. The mean square displacement (MSD), radial distribution function (RDF), atomic number density, and atomic displacement vector were calculated to characterize it. The results show that the TiAl alloy is completely melted when heated up to 2400 K, and increasing the temperature past 2400 K has little effect on mass transfer. As the heating time increases, the diffusion coefficient gradually decreases, the diffusion weakens, and the mass transfer process gradually stabilizes. In Ti-Al binary alloys, the diffusion coefficients of different solute atoms are related to the atomic fraction. During the melting process, the alloy particle system has a greater diffusion coefficient than the elemental particle system.

1. Introduction

Laser fabrication has developed rapidly in recent years. This method uses the high energy of a laser to melt metal powders and wires in order to carry out material preparation and shaping. Laser fabrication has been widely used in the preparation of various surface coatings, small precision parts, and large complex components. In recent years, this technology has begun to be used in the research and development of the high-throughput preparation of alloy materials. High-throughput technology refers to the completion of the design, preparation, and characterization of a large number of samples in a short time and is used to accelerate the research and development of materials [1]. Therefore, laser fabrication for high-throughput preparation requires the process to be carried out over a short time and at a high speed. This means that the mass transfer behavior in the molten pool of laser fabrication is highly important. Improper control can cause incomplete melting, excessive melting, and element burnout, resulting in uneven composition distribution, deviation from design requirements, and even alloying failure [2,3]. Therefore, it is necessary to develop a comprehensive understanding of the mass transfer behavior in the molten pool and of the effects of different process parameters in the high-throughput preparation process of laser fabrication in order to better control the mass transfer process and obtain samples with excellent performance [4,5,6]. However, due to the fast heating, high solidification speed, short alloying time, and small molten pool size, the actual mass transfer process in the molten pool in the laser fabrication process is difficult to observe by experimental methods. The lack of an understanding of the mass transfer in the molten pool has necessitated the use of the traditional trial-and-error method for the optimization of processing conditions, making it difficult to meet the requirements of high-throughput preparation. To complete the high-throughput preparation of a large number of samples in a short time, a large amount of data must be analyzed and calculated in order to improve the efficiency and success rate and provide guidance regarding the process parameters of the high-throughput preparation process. Therefore, the use of computer-aided simulations is an effective approach for studying this process.
Several computational studies of the mass transfer of alloy elements in the molten pool have been carried out. For example, Gan et al. [7,8] simulated the transfer of alloy elements in the molten pool and its influence on the convection of liquid metal as well as the thermal behavior and mass transfer process in laser additive manufacturing multilayer cladding using finite element method simulations. It was found that the mass transport and flow pattern can influence the final properties and microstructure to a large extent. He et al. [9] used the finite element method to simulate the interaction between the powder and the laser during the coaxial powder feeding process, as well as the redistribution of the solute, and obtained the concentration distribution map of the alloying elements. Dong et al. [10] investigated the effect of shear flow on solute redistribution in the molten pool of Ni-Cr alloy and indicated that shear flow altered solute distribution in the vicinity of columnar grains; they also found the solute concentration pattern in the interior of columnar grains in molten pool through finite element analysis. While many studies have focused on the mass transfer behavior in the laser fabrication process, most of these have been carried out at the mesoscopic or macro level, usually at the millimeter length scale, and have been hampered by the limitations of the finite element method [11,12,13,14,15]. By contrast, molecular dynamics (MD) simulations can simulate the behavior of materials at the atomic scale, and the calculation method has greater physical meaning and is more accurate than the finite element method, providing a more microscopic understanding of the dynamic processes under study [16,17,18,19,20,21,22,23,24,25,26]. In the MD studies of laser melting, Tan et al. [27] established an Fe-Al double-layer powder model using LAMMPS (Large-scale Atomic Molecular Massively Parallel Simulator) and simulated the movement of the solute atoms during the selective laser melting (SLM) process. They also extended the modeling to multiple layers in order to observe the fusion between the layers. Liu and co-workers [28] simulated the atomic-scale structural changes of the Cu50Zr50 metallic glass in the selective laser melting (SLM) process by molecular dynamics simulations and elucidated the glass formation mechanism and the evolution of the local atomic structure in the molten pool and the heat-affected zone (HAZ). Jakse et al. [29] used molecular dynamics to study the diffusion characteristics of aluminum-rich liquid alloys and found a clear correlation between the local structural order and diffusion properties of liquid metal alloys, revealing the effect of atomic local state and structure on diffusion. It can be seen that the atomistic simulations performed to date have been mostly related to the conventional laser melting process and diffusivity and rarely involve the atomic level mass transfer simulation of the laser fabrication process.
In this work, molecular dynamics (MD) simulation is used to investigate the mass transfer mechanism at atomic scale and the movement of solute atoms during the laser fabrication process. Molecular dynamics simulation has many advantages over macro-scale modeling in terms of calculation principle and accuracy. Most of the macro-scale modeling methods are based on continuum theory and they are applicable only in homogeneous systems; they are not accurate enough when the systems contain defects and heterogeneous structures. Moreover, macro-scale modeling is not able to investigate the atomic-scale phenomenon. However, atomistic modeling, such as molecular dynamics simulation, can explore the interaction and mechanisms at the level of electrons/molecules/atoms and it can provide more insights into the mechanisms of small-scale dynamic processes, like laser fabrication, where we can obtain the movement pattern and trajectory of atoms [27,28]. Therefore, more accurate results and dynamic interaction of atoms can be obtained in laser fabrication by using atomistic modeling which are hard for macro-scale modeling to achieve. In this work, a titanium–aluminum binary alloy is chosen as the object of research due to its wide application in industry and the availability of suitable embedded atom method (EAM) potential. The simulation system includes a cubic alloy supercell and a spherical powder system. By controlling the atomic ratio, the movement and diffusivity of the solute atoms in the melting and solidification process are obtained, and the simulation results are analyzed based on different properties such as the mean square displacement (MSD), diffusion coefficient, radial distribution function (RDF), atomic number density, and atomic displacement vector. Moreover, the effects of different process parameters on the mass transfer behavior are explored to accelerate the efficiency of material preparation and development and provide a theoretical basis for the high-throughput laser fabrication of high-performance complex alloys.

2. Simulation Method

2.1. Ti-Al Cubic Simulation System

In this work, LAMMPS (30 Nov 2018, Sandia National Laboratories, Albuquerque, NM, USA) was used to perform molecular dynamics simulations to investigate the mass transfer behavior of the Ti-Al binary alloy system using a 20 Å × 20 Å × 20 Å cubic system, as illustrated in Figure 1, where the Ti and Al atoms are represented by the red and blue spheres. Periodic boundary conditions were used in the x, y, and z directions and the Nose-Hoover thermostat (Sandia National Laboratories, Albuquerque, NM, USA) was adopted as the temperature and pressure control algorithm with a time step of 1 fs. The embedded atom method (EAM) potential of Zope et al. [30] was used to represent the interatomic interactions. First, in the number-volume-energy (NVE) ensemble, the system was relaxed at 300 K to minimize the energy and obtain a stable initial structure. Then, the temperature was increased and the number-volume-temperature (NVT) ensemble was used in the heating process. After the temperature was raised to the target temperature, the system was maintained at this temperature and the simulations were performed for a sufficient time to calculate the diffusion coefficient. Then, the system was cooled to room temperature and different time periods were selected to measure the radial distribution function and atomic number density.

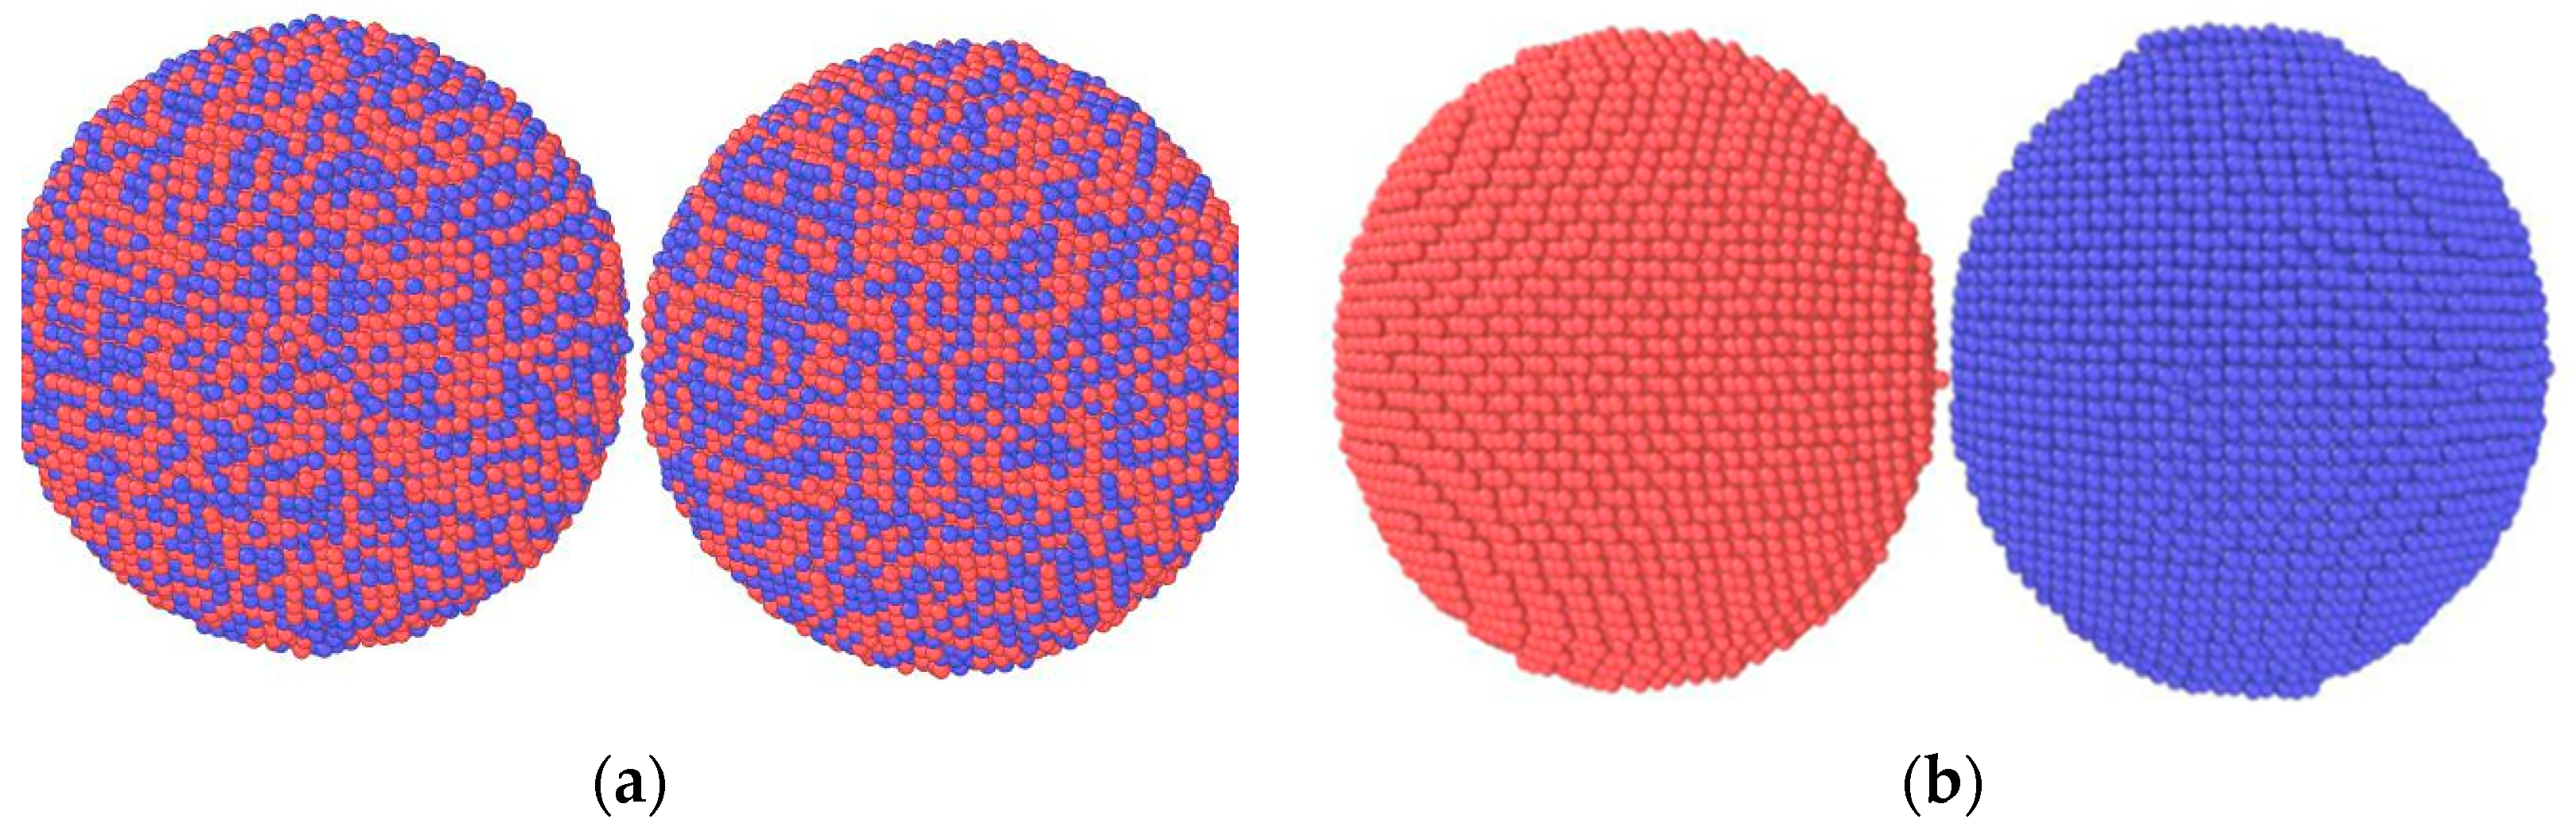
2.2. Ti-Al Spherical Particle System

To simulate the mass transfer behavior of the spherical particle system in the laser fabrication process, a spherical particle system, illustrated in Figure 2, was established, with Ti and Al atoms represented by red and blue spheres, respectively. Fixed boundary conditions were used in the x direction, and periodic boundary conditions were used in the y and z directions, and the time step was set to 1 fs. The simulation object consisted of two spherical systems with a radius of 10 Å and with their surfaces separated by 0.3 Å, the size of the simulation box was 100 Å × 60 Å × 60 Å. First, relaxation in the NVE ensemble was performed at 300 K to minimize the energy and obtain a stable initial structure. Then, the system was heated in the NVT ensemble and, after reaching the target temperature, the system was maintained at this temperature for a sufficient time to calculate the diffusion coefficient. Then, the system was cooled to room temperature, and different time periods were selected to measure the radial distribution function and atomic number density. At the same time, the atom displacement vector diagram was obtained to characterize the direction and magnitude of the movements of different atoms.

3. Results and Discussion

3.1. Effect of the Heating Temperature on the Mass Transfer Behavior

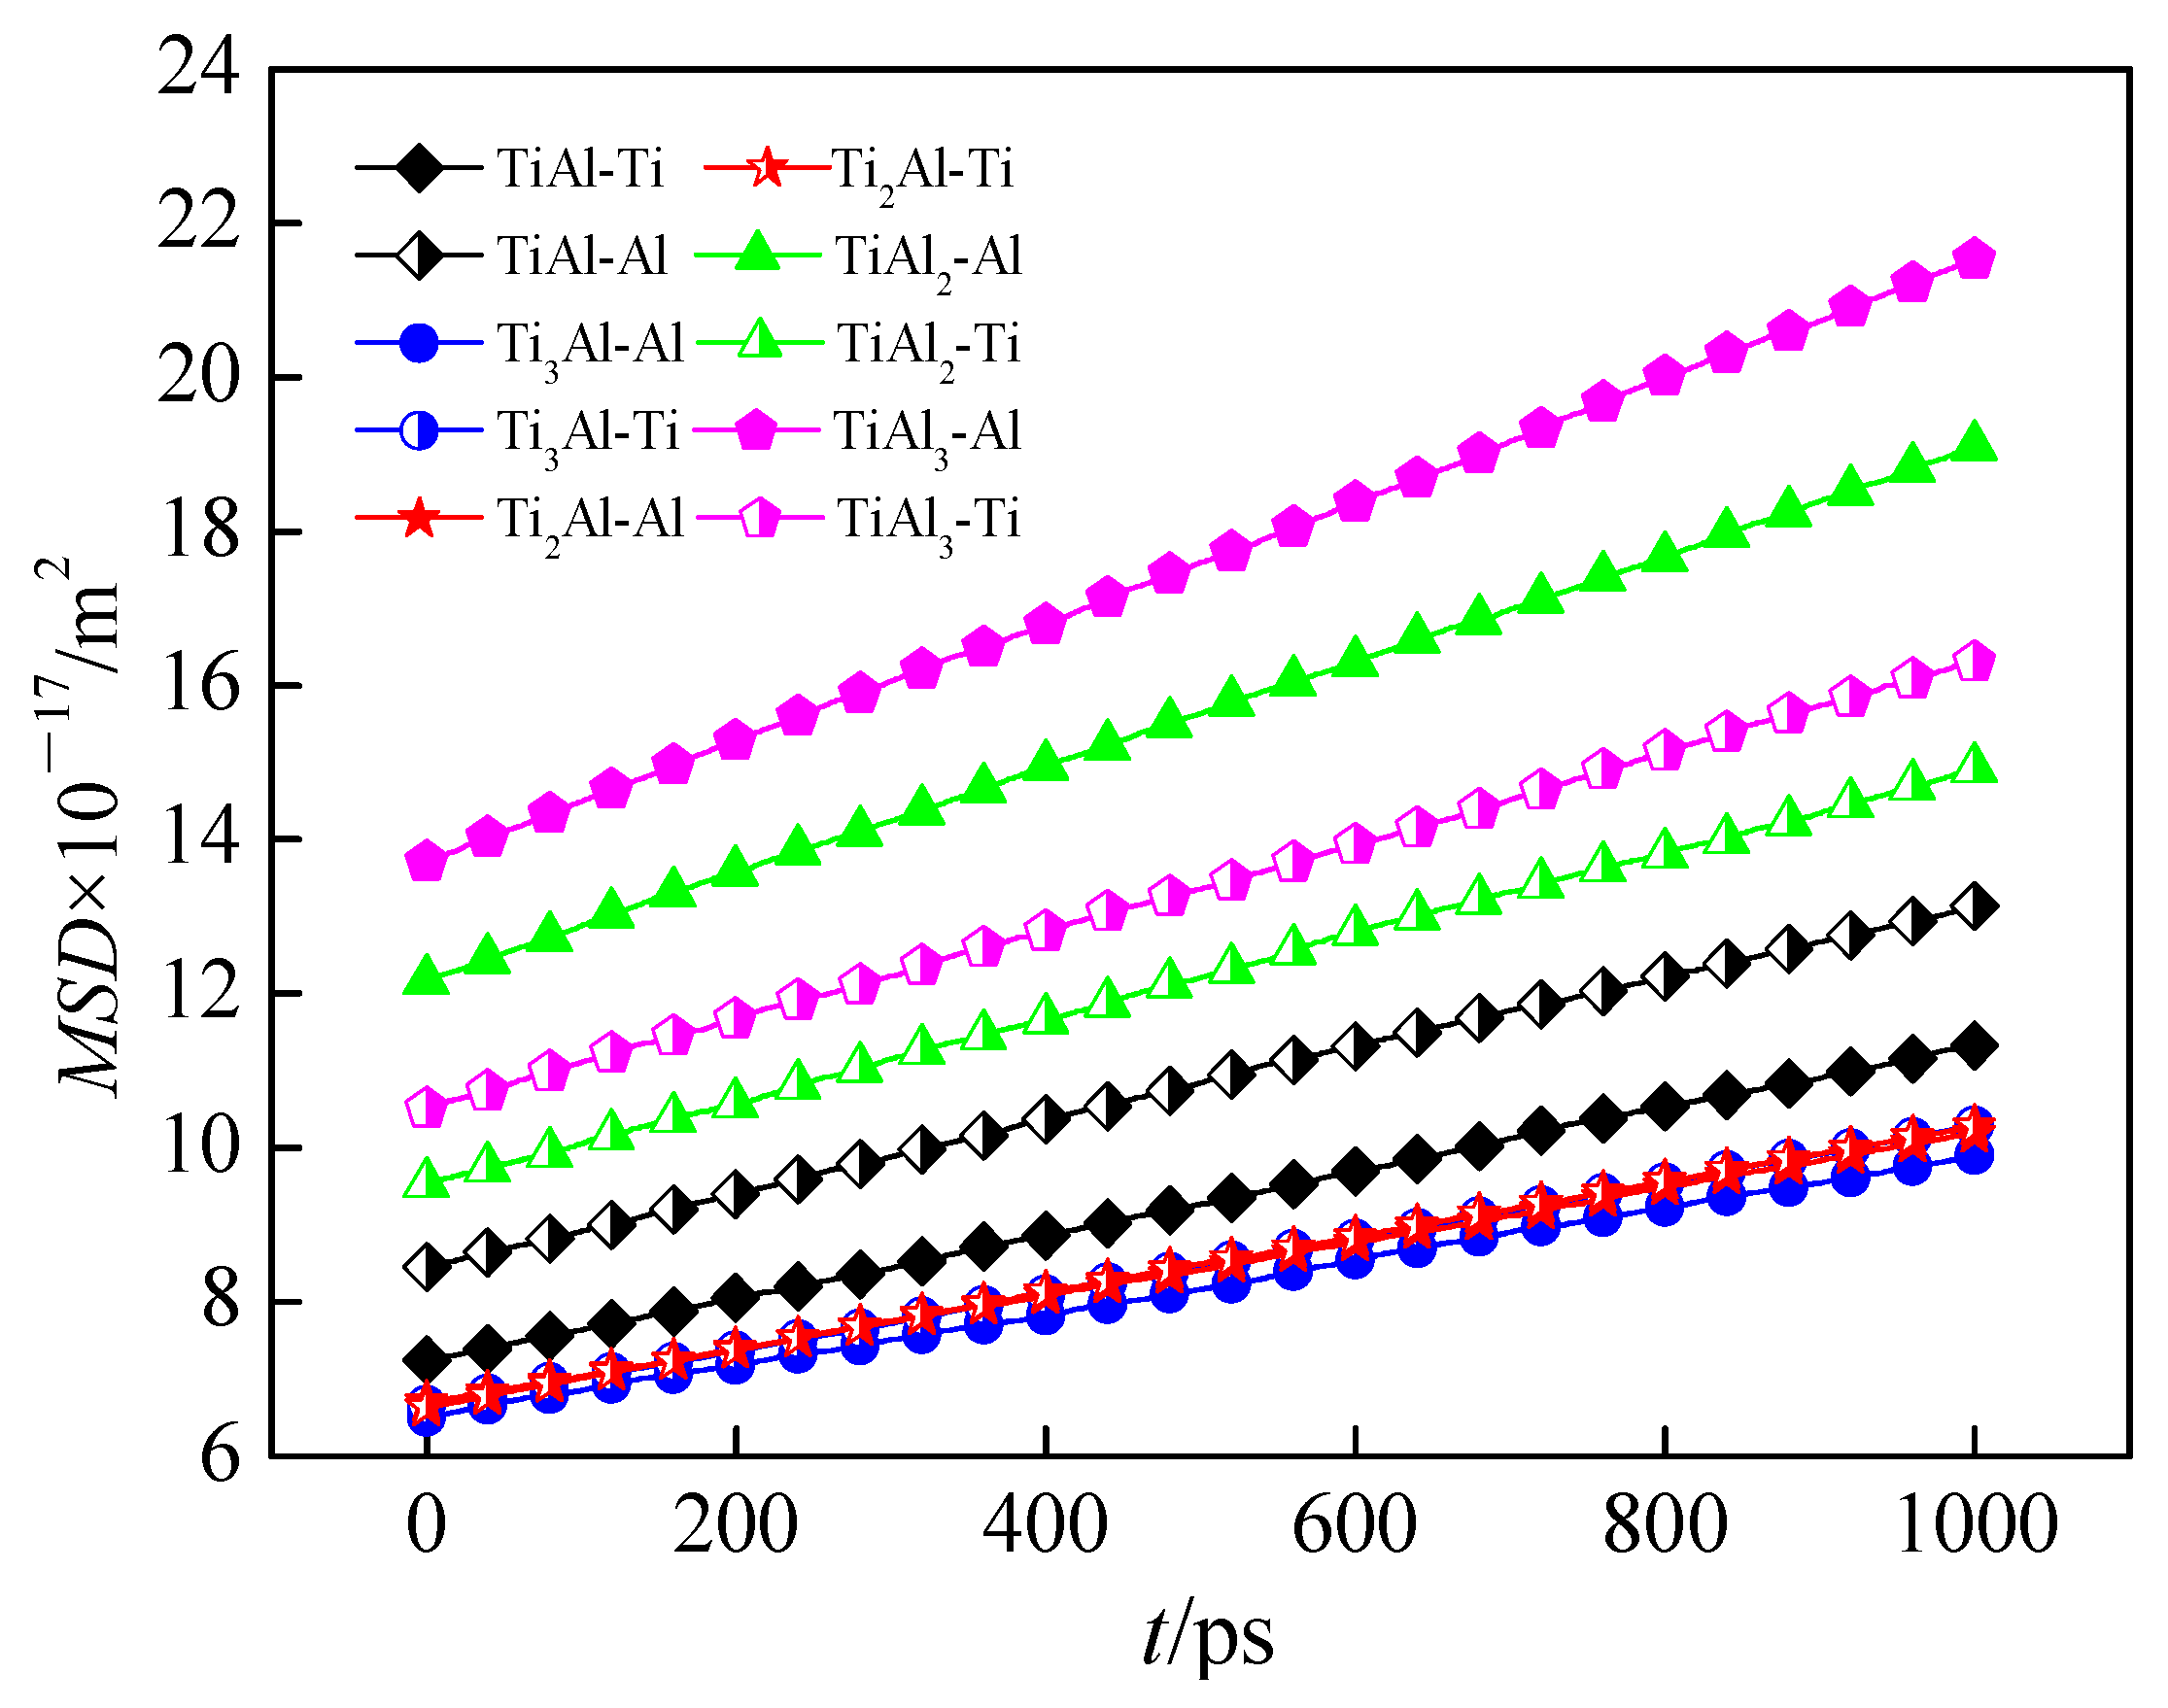
3.1.1. Diffusion Coefficient

The diffusion coefficient of a substance indicates its diffusion capacity and is a physical property of a substance. While the diffusion coefficient is not directly calculated by LAMMPS, it can be obtained by calculating the square of the average distance of all of the particles from their initial point at a certain point in time [31], which is known as the mean square displacement (MSD). Here, the Einstein method was used to calculate the self-diffusion coefficient of the alloy system. After the MSD is obtained, the Einstein formula is used to calculate the self-diffusion coefficient of the particles. From the slope of the MSD fitted under three-dimensional conditions, the diffusion coefficient of the system can be obtained.
The mean square displacement (MSD) and diffusion coefficient (D, m2/s) are given by:
M S D ( t ) = r 2 ( t ) = 1 N < t = 1 N [ r i ( t ) r i ( 0 ) ] 2 >
D = lim t 1 6 N t < t = 1 N [ r i ( t ) r i ( 0 ) ] 2 >
where D is the diffusion coefficient of the system, N is the total number of particles, t is the time, ri(t) and ri(0) are the positions of the particles at t and t0, respectively, and the square of the atomic displacement specifies the change in MSD with time. Substituting Equation (1) into Equation (2), we obtain the following:
D = lim t 1 6 t r 2 ( t )
It is observed from Equation (3) that the diffusion coefficient is linearly related to the mean square displacement and therefore can be calculated from the slope of the plot of MSD versus t [26].
The diffusion coefficient (D) and temperature (T) are related by:
D = D 0 e x p ( Q R T )
where R is the gas constant, and D0 and Q are the diffusion constant and activation energy, both of which are related to the properties of the material.
The MSD of the solute atoms in Ti-Al alloy is calculated according to Equation (1) by using the LAMMPS package, where all the numerical values are obtained and computed. After obtaining the MSD over time steps, we can determine the MSD curves over time at different temperatures, as shown in Figure 3. The slope is proportional to the diffusion coefficient, and the diffusion coefficient can be obtained by fitting the slope of the plot in Figure 3 and then dividing by 6, according to Equation (2). The obtained diffusion coefficients are listed in Table 1.
It is observed from Figure 3 that MSD increases significantly with increasing temperature, indicating that the temperature affects the mean square displacement. A higher temperature leads to a greater MSD value and its slope with time, indicating the more violent movement of the atoms in the equilibrium position at higher temperature so that the atoms have sufficient driving force to diffuse to the equilibrium position. As the temperature decreases, the slope of the MSD curve decreases from 6.12 × 10⁻⁵ m2/s at 2800 K to 9.34 × 10⁻⁶ m2/s at 2300 K, indicating that the driving force for atomic motion becomes smaller, leading to a decrease in the extent of diffusion. The reason for the significantly smaller MSD at 2300 K is that the TiAl alloy system is not completely melted at 2300 K and rather is found as a solid–liquid mixed phase that hinders the diffusion process. Moreover, as the temperature decreases, it approaches the solidification temperature, and the atomic arrangement increasingly tends to become long-range-ordered, increasing the resistance to atomic movement and making it difficult.
Table 1 shows the obtained results for the variation of the diffusion coefficient and diffusion activation energy with temperature. An examination of the data presented in Table 1 shows that the diffusion coefficient increases with higher temperature. At 2300 K, because the system cannot be completely melted, the existence of the solid phase hinders the progress of diffusion, resulting in its diffusion coefficient being significantly lower than that at the other temperatures. When the system is completely melted, as the temperature increases, the increase in diffusion coefficient slows down. The observed relationship between temperature and diffusion coefficient and activation energy is explained by Equation (4). According to Equation (4), the diffusion coefficient is inversely proportional to the diffusion activation energy. It can be seen from Table 1 that as the temperature increases from 2300 to 2800 K, the diffusion coefficient increases accordingly, and the diffusion activation energy decreases correspondingly, which can be calculated by Equation (4) with R and D0 as constants. The smaller the diffusion activation energy is, the smaller the energy barrier which needs to be overcome during the mass transfer process. Additionally, the decrease in diffusion activation energy further explains the increase in the extent of diffusion as the temperature increases during mass transfer.

3.1.2. Radial Distribution Function

The radial distribution function g(r) can be expressed as [19]:
g ( r ) = V n i ( r , r + Δ r ) 4 π r 2 Δ r N
where V is the volume, ni(r,r + Δr) is the number of atoms in the spherical shell between the distances r and r + Δr, and N is the total number of atoms. The physical meaning of g(r) is the probability that another atom can be found at a distance r in the system. In this work, the radial distribution functions of the TiAl alloy at different heating temperatures at different points in time are calculated and are used to analyze the microstructure of the alloy system.
The figures and relationship of g(r) over r in Ti-Al alloy are calculated according to Equation (5) by using the LAMMPS package, where all the numerical values are obtained and computed. The dynamic change in r and g(r) at different temperatures and time steps can be obtained by LAMMPS and output as an rdf file, through which the rdf curves can be plotted, as shown in Figure 4.
The radial distribution function curves of the Ti-Al alloy under different temperature conditions are shown in Figure 4a–c. Figure 4a shows the radial distribution function curve of the Ti-Al alloy at room temperature (300 K). It is observed that the g(r) curve of the alloy system at 300 K has the characteristics of a typical solid-state material, with a sharp peak at the cut-off radius. The g(r) curves for the system heated to different temperatures are shown in Figure 4b. It is observed that when the system is heated to 2400 K, the alloy has completely melted, and a further increase in the temperature has no significant effect on the internal structure. At 2300 K, the system shows obvious characteristics of incomplete melting, with a sharper first peak and clear sharp secondary peaks. The g(r) curves of the system after heating to different temperatures and cooled to room temperature at the same cooling rate are shown in Figure 4c. It is observed that the curves of the system after heating above 2400 K and cooling to room temperature have the same characteristics, proving that the alloy has completely melted and spreads evenly at temperatures above 2400 K. Since the cooling rate is higher than the critical cooling rate, the secondary peak of the radial distribution function curve shows obvious splitting, indicating that an amorphous structure is formed. In the system heated to 2300 K, the curve after cooling has obvious unmelted characteristics and is highly similar to the curve in the initial state.

3.1.3. Atomic Number Density

The atomic number density is defined as the number of atoms per unit volume. The alloy system cells obtained after cooling are divided into adjacent cube units with the side length of twice the cut-off distance. As shown in Figure 5, the cut-off distance is taken as the r value of the first peak of the g(r) curve at 300 K [32]. The calculated atomic number density ρx in each cube unit can qualitatively represent the atomic stacking density in the unit to a certain extent and characterizes the distribution of the solute atoms in the system after cooling. To facilitate comparison and analysis, the calculated ρx is normalized to the average atomic number density (ρ0) of the entire system, namely ρx/ρ0. After the atomic number density of each unit is obtained, we randomly select a slice through the structure to examine the atomic number density distribution of a slice of the simulation cell, as shown in Figure 6.
The spatial distribution of alloy systems is highly significant because it can reveal the formation mechanism of materials and the structural origin of their unique physical and chemical properties. Here, we use the spatial distribution of the atomic number density to study the microstructure characteristics of the alloy system. The cubic system is divided into several smaller cubic units with the side length of twice the cut-off distance. Python is used to count the number of atoms in each unit; the number of atoms in each unit is divided by the atom number in the whole system and then multiplied by the number of units. The results obtained are processed and visualized by Python and are shown in a color plot in Figure 6, with blue indicating lower atomic number density and red indicating greater atomic number density. After cooling from different heating temperatures to room temperature, a clearly uneven distribution of atomic number density is observed that presents a pattern of sparse and dense regions. After heating to above 2400 K and cooling, the atomic number density showed a sparse and dense distribution pattern, and after heating and cooling at 2300 K, it showed an obvious regularity, indicating that the system was not completely melted. It is observed that the solute atoms of the alloy have diffused relatively uniformly above 2400 K, and the continued increase in the temperature has little effect on the uniformity of solute diffusion.
It is observed that while the Ti-Al alloy is not completely melted at 2300 K, it is completely melted after heating to 2400 K. A further increase in the temperature has little effect on the mass transfer process. In the actual preparation process, the temperature is adjusted mainly by changing the laser power. Therefore, the laser power should be controlled in an appropriate range. On the one hand, the use of insufficient power will cause the powder to be partially unmelted and will generate pores and hinder the mass transfer process. On the other hand, excessive power will give rise to energy waste and even spheroidization, failure to form, and element burnout. Therefore, in the preparation process of the Ti-Al alloy, too much power or too little power will reduce the high-throughput preparation efficiency and the laser power should be adjusted so that the heating temperature is approximately 2400 K in order to obtain the ideal process parameters and improve the efficiency and the success rate of the high-throughput preparation.

3.2. Effect of Atomic Ratio on Mass Transfer Behavior

The mass transfer behavior of the Ti-Al alloy system is not only affected by external conditions but is also related to the properties of the solute atoms. The atomic fraction of the solute atoms in the alloy system will have a significant effect on the diffusion coefficient of the solute atoms during the mass transfer process. Here, the mean square displacement of the Ti-Al alloys with different atomic ratios at 2500 K is calculated from the molecular dynamics simulations. The mean square displacement represents the average distance between the particles’ locations at a certain moment and their initial locations, and the diffusion coefficient of atoms can be obtained from the slope of the MSD plotted versus the time. Figure 7 shows the MSD plots of the Ti and Al atoms for the Ti-Al alloys with different atomic ratios at 2500 K. It is observed that for the Ti/Al ratio of 1:1, the diffusion coefficient of the Al atoms is greater than that of the Ti atoms, most likely due to the smaller radius and atomic mass and lower activation energy of Al compared to Ti. However, when the Ti/Al ratio increases to 3:1 and 2:1, the diffusion coefficient of Ti is greater than that of Al. By contrast, in TiAl2 and TiAl3 alloys where the Ti content is lower than the Al content, the diffusion coefficient of Ti is once again less than that of Al. It can be inferred from this trend that in the Ti-Al binary alloys, the diffusion coefficient of a given element is not only controlled by its atomic radius and other properties but is also related to the composition of the system, with the diffusion coefficient increasing with the increasing content of the element in the alloy.

3.3. Effect of Heating Time on Mass Transfer Behavior

In this work, the diffusion coefficients of the alloy particle and elemental particle systems are calculated at the same heating temperature with different heating times. The diffusion coefficients of the two systems at 2500 K with heating times of 100, 1000 and 2000 ps were calculated and are presented in Table 2. Here, DA is the diffusion coefficient of the alloy powder, and DE is the diffusion coefficient of the elemental powder. The heating time here refers to the time for which powder particles are heated by the laser in the molten pool. The time here is shorter than the actual heating time, but since the particle size is also smaller than the normal size, the time needed for melting is shorter correspondingly, so the shorter heating time here is reasonable. An examination of the data in Table 2 shows that as the heating time increases, the diffusion coefficient gradually decreases, the diffusion weakens, and the mass transfer process gradually stabilizes. Therefore, the increase in the heating time will not promote the mass transfer process but will weaken it in the later stage of heating. With increased heating time, the diffusion coefficient of the alloy particle system finally becomes higher than that of the elemental particle system, but the difference is small. The heating time here is shorter than the actual heating time due to the limit of time scale in molecular dynamics simulation, but the trend we obtain is correct and can provide valid prediction and useful guidance for the preparation process.
In the laser fabrication process, the heating time is mainly controlled by adjusting the laser heating time. If the laser heating time is too short, the powder will not be completely melted, there will be gaps between the powder particles, and the solute will diffuse unevenly. If the laser heating time is too long, it will not promote the mass transfer but will weaken it in the later stage of heating and even affect the surrounding solidified area, resulting in remelting, spheroidization, and even failure to form. Therefore, in the preparation process of Ti-Al alloy, the laser heating time being too long or too short will affect the high-throughput preparation efficiency. The laser heating time should be adjusted to match the laser power in an appropriate range to obtain the ideal process parameters, thereby improving the efficiency and success rate of high-throughput preparation.

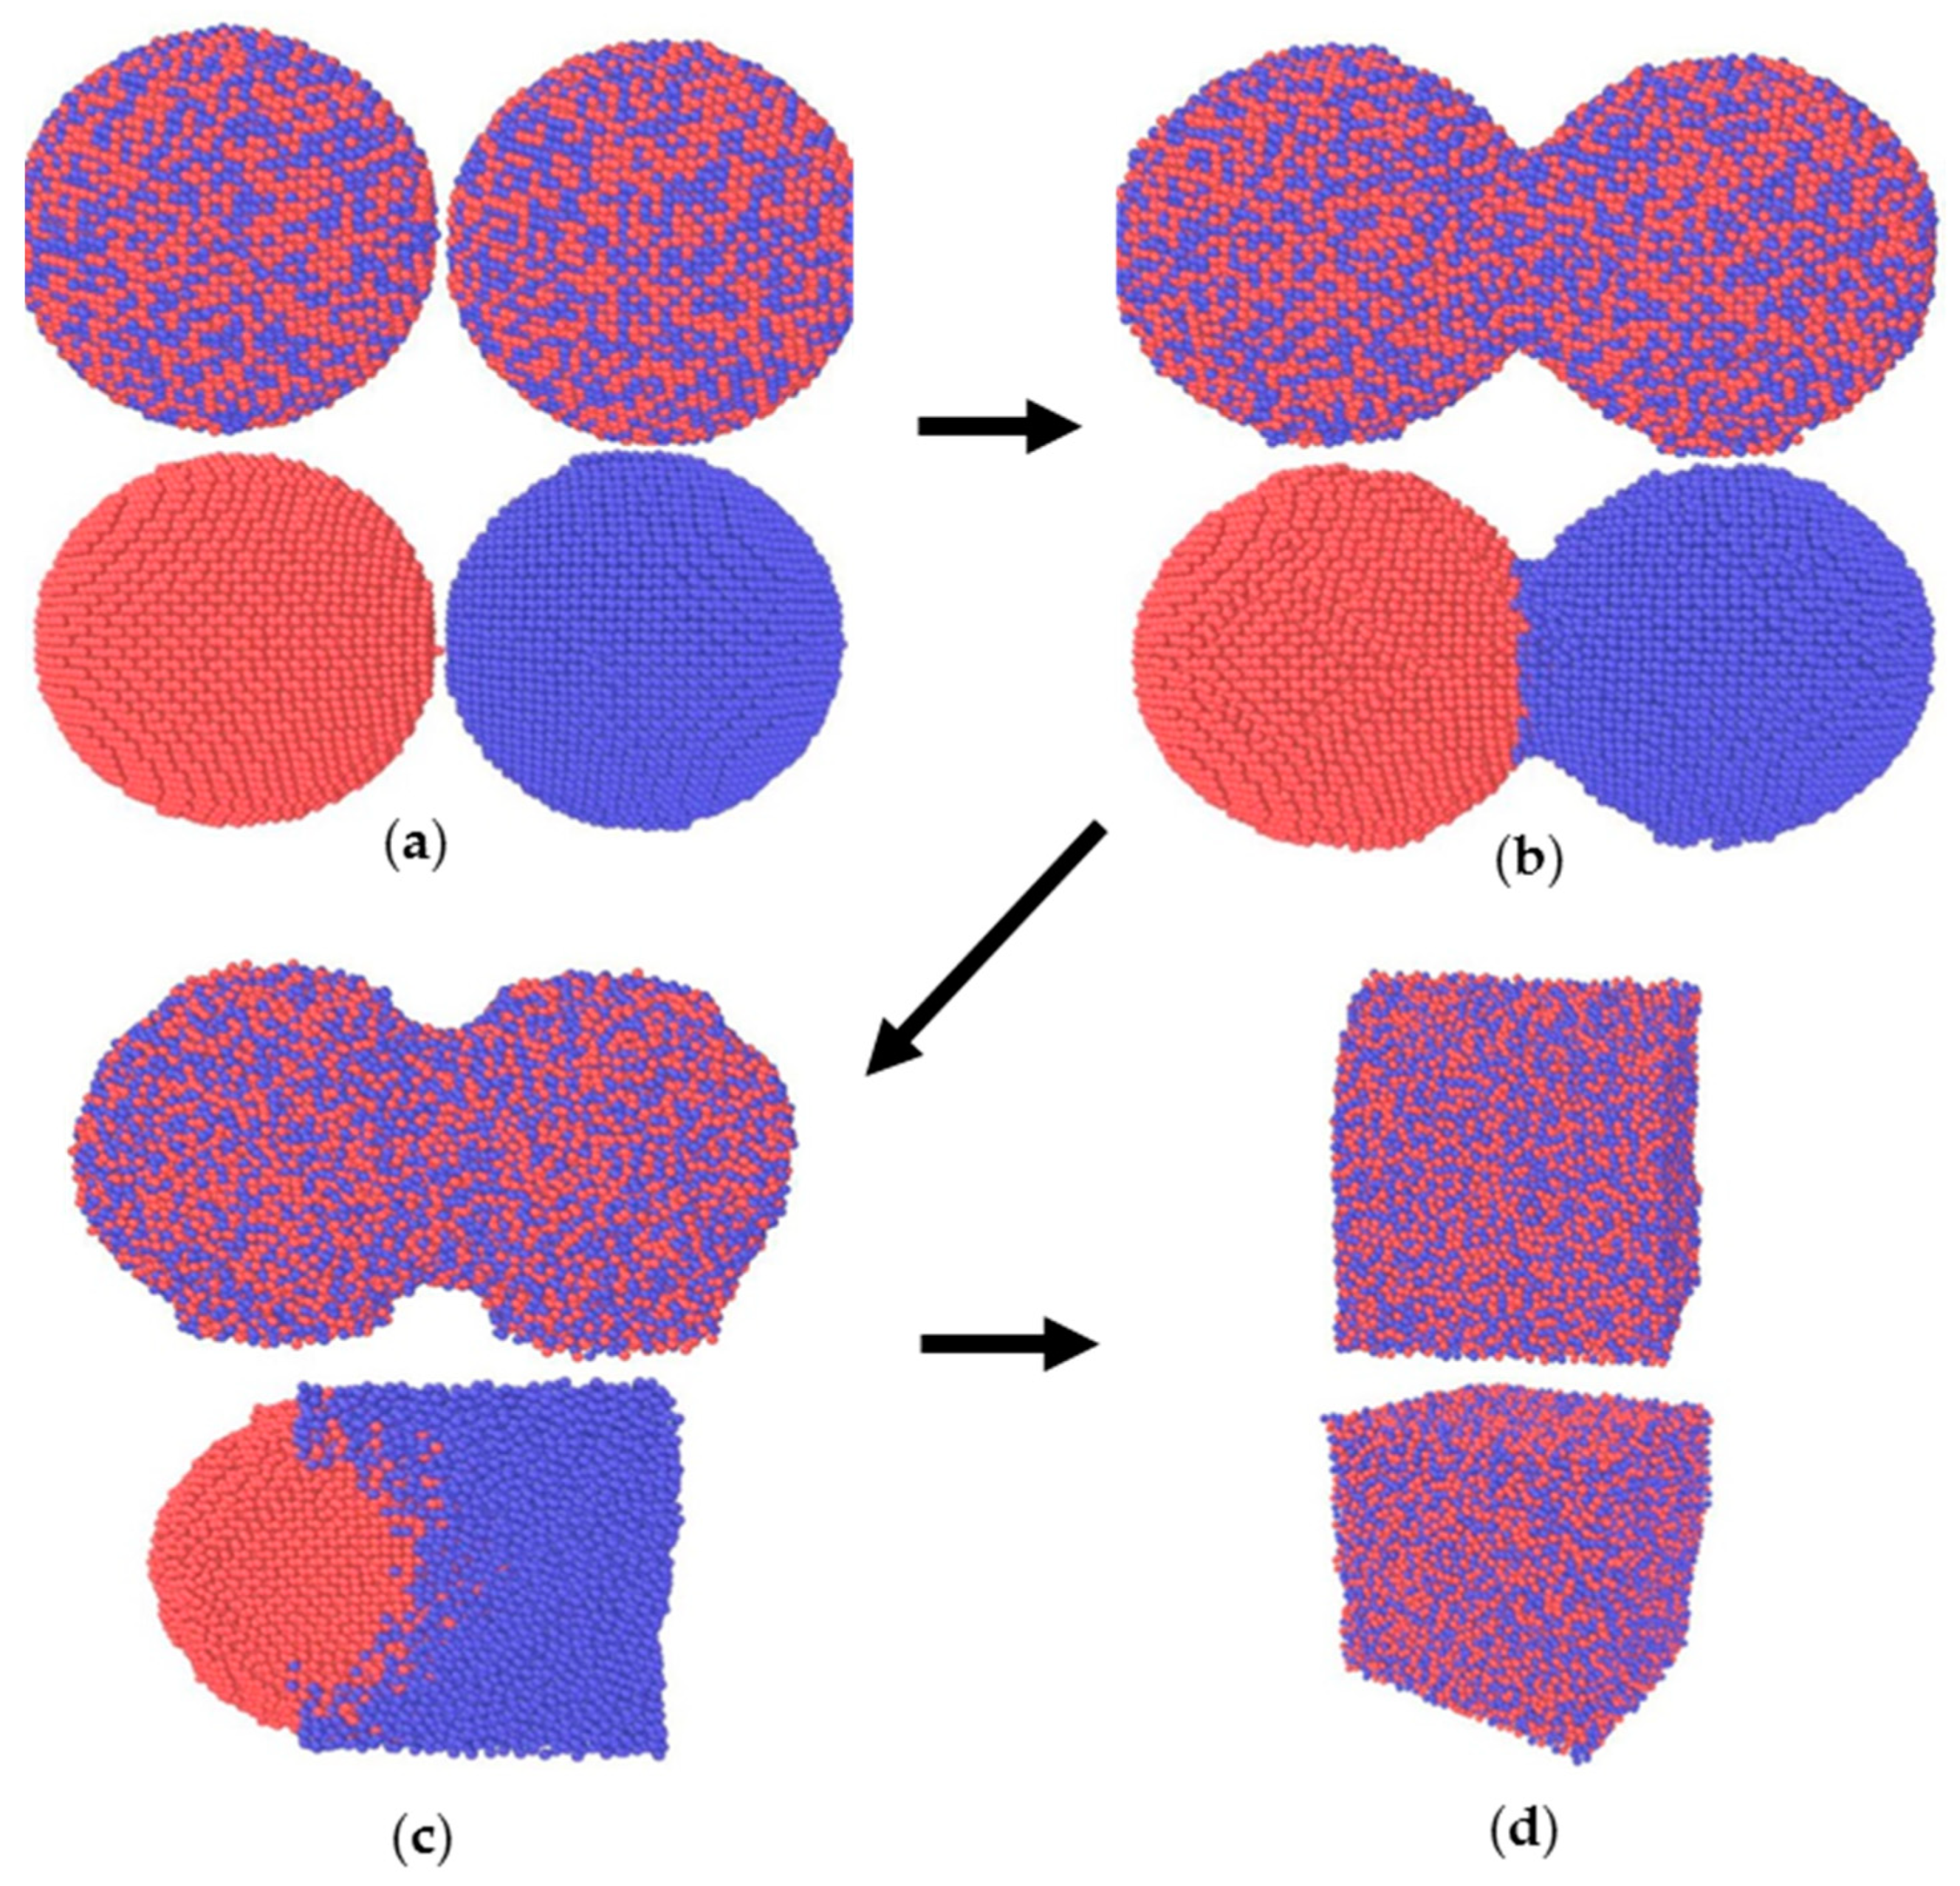
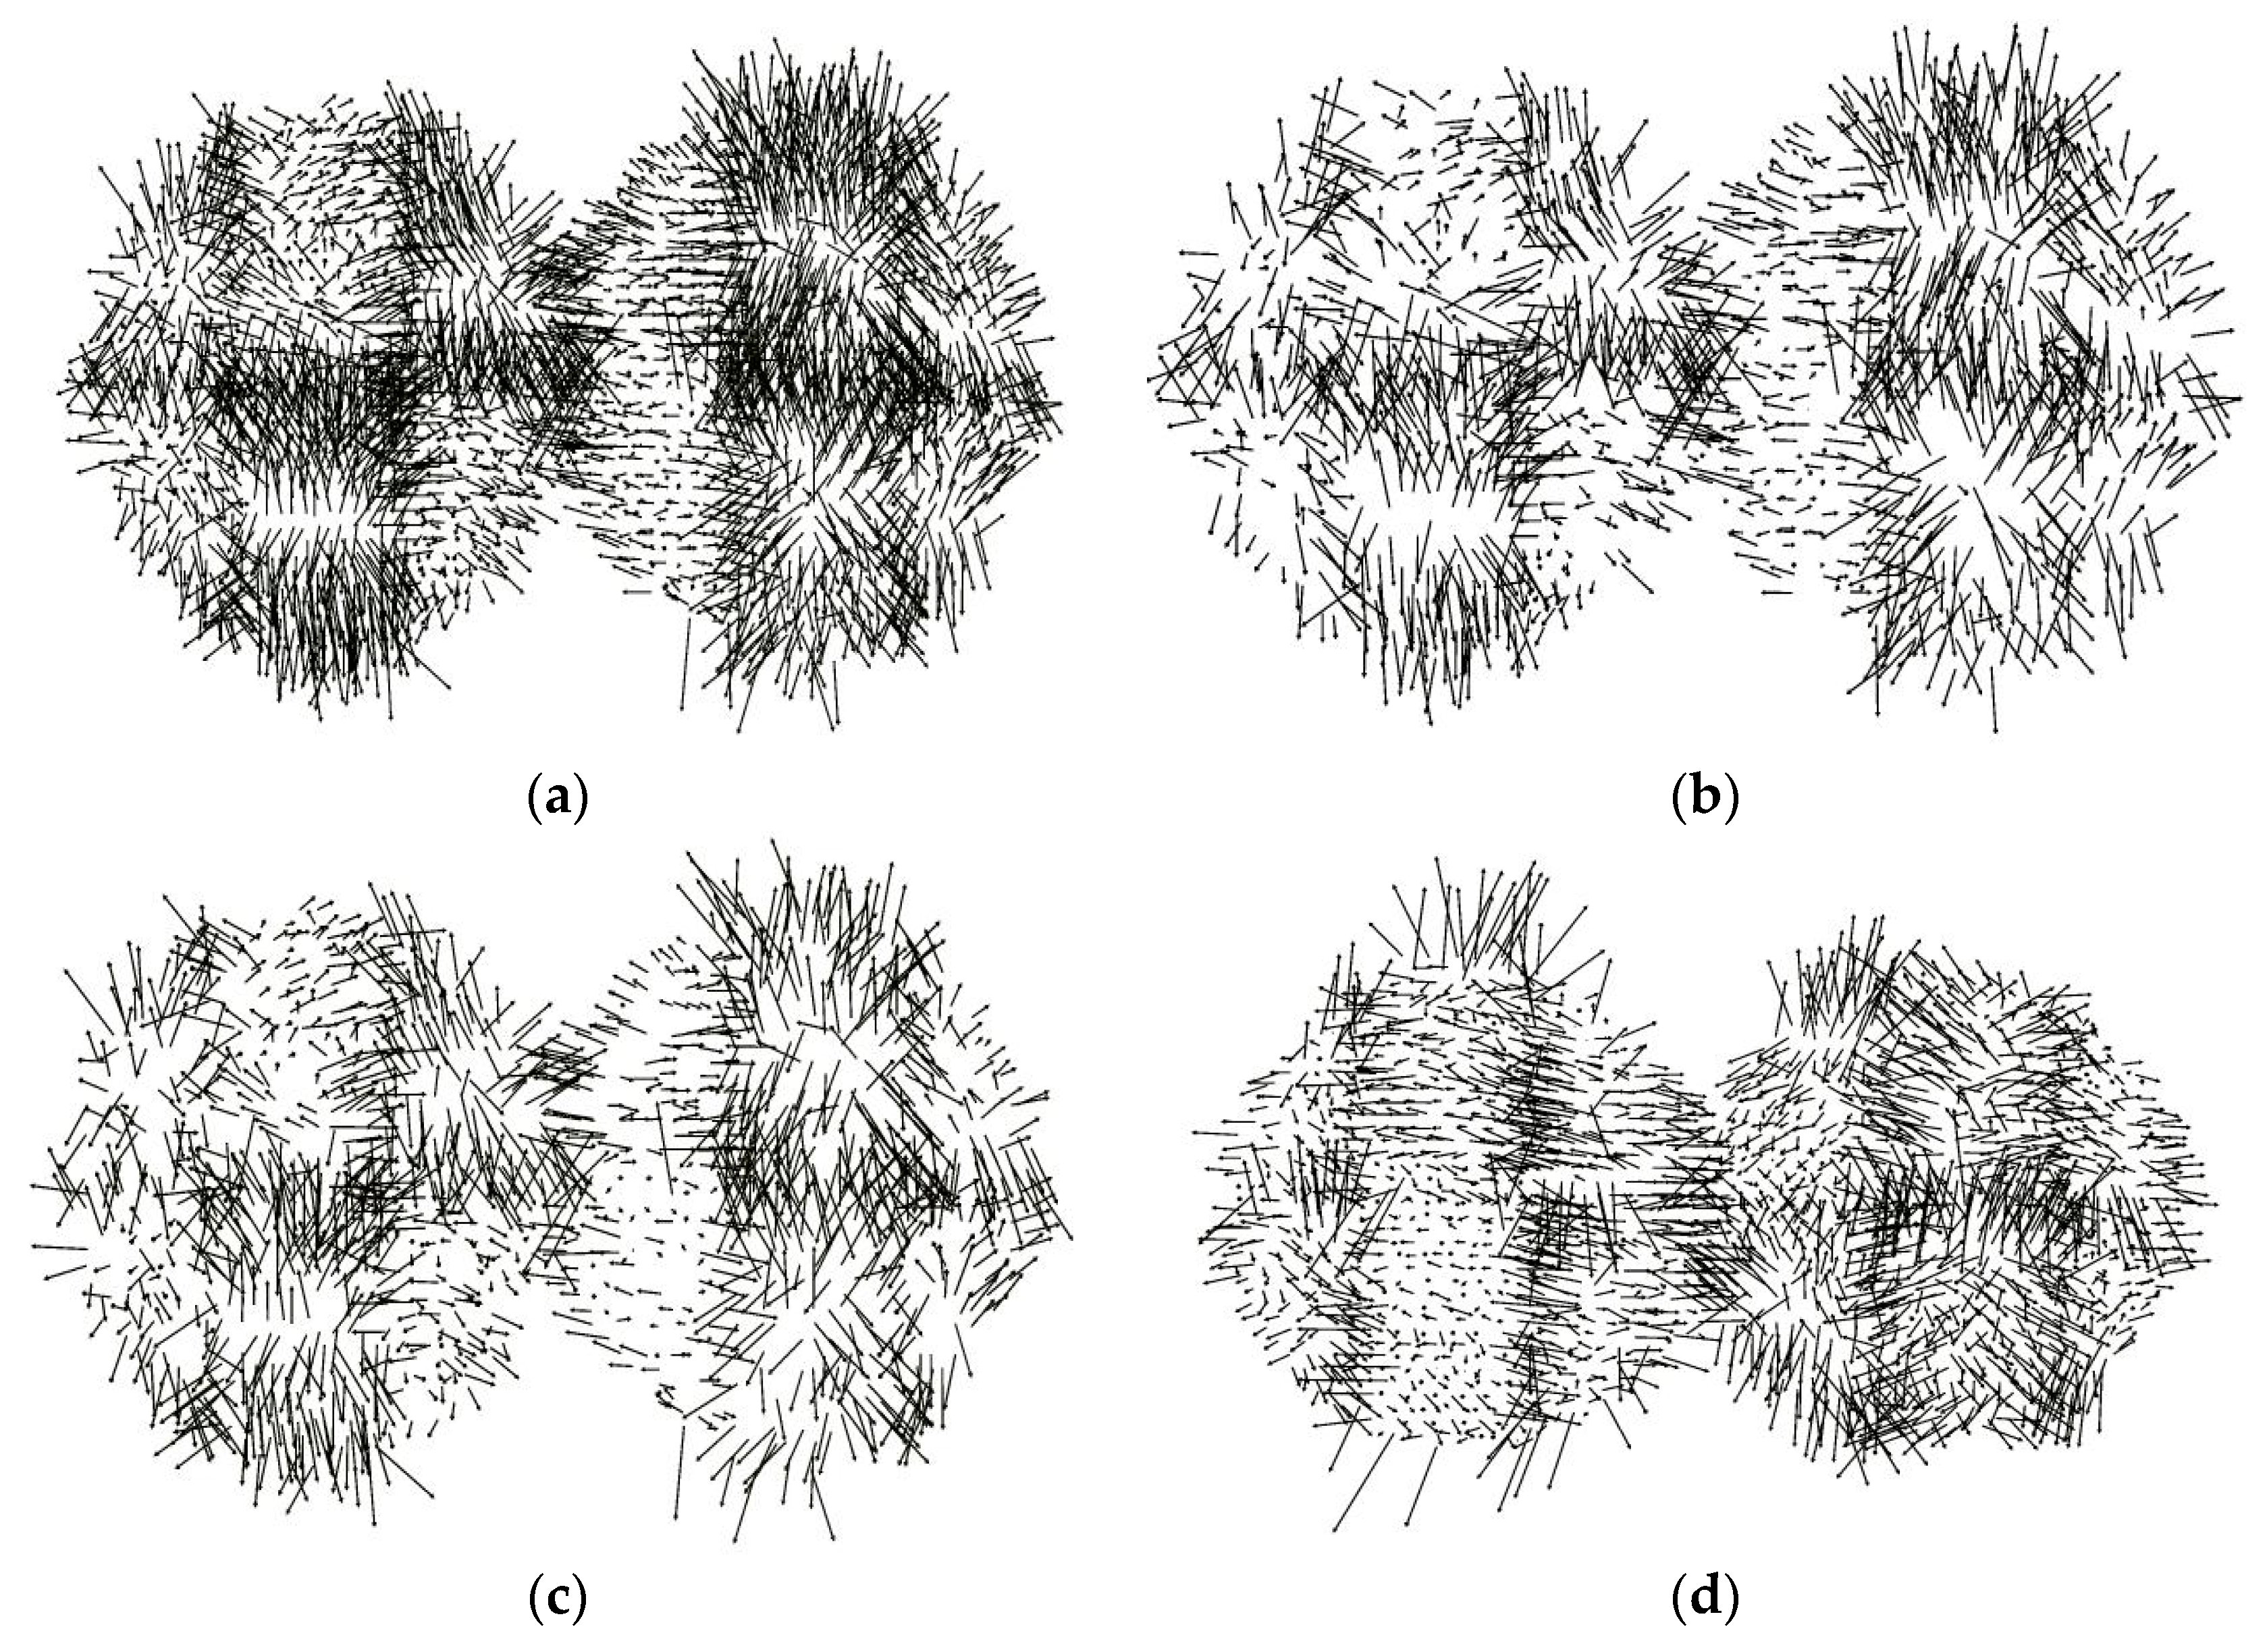
3.4. Atomic Scale Mass Transfer Behavior of Ti-Al Spherical Particle System

In the laser fabrication preparation process, after the particle is heated and melted by the laser, the transport of solute atoms has a significant impact on the uniformity and subsequent performance of the material. Here, we simulated the diffusion process of the mixed alloy powder and unmixed elemental powder during the heating process.
The obtained radial distribution function and atomic number density of the spherical particle system are similar to the aforementioned cubic system. The rdf function curves show no difference from those for the cubic systems, and atomic number density has the same pattern as the cubic system, only different in shape and contour. The rdf and atomic number density are correlated with the heating temperature and the internal structure of the material itself so they are the same as Figure 4 and Figure 6 in essence because they share the same process parameters and interatomic potential, and therefore, they are not given here. Figure 8a–d show the melting and mass transfer processes of the two different kinds of powders. During the melting process, the two powder particles move closer to each other and gradually merge until they diffuse into a uniform system.
Figure 8a shows the initial state of the two types of powder particles. In the initial stage of heating, the two systems diffuse in a similar manner, and the two particles move closer to each other, as shown in Figure 8b. As the heating continues, the two systems show different diffusion modes. As shown in Figure 8c, in the alloy particle system, since the titanium and aluminum solute atoms were mixed prior to the melting, the two particles melt simultaneously during the melting process. By contrast, in the elemental particle system, because the titanium and aluminum powder particles are separated from each other, the melting process will show different diffusion modes due to the different melting points of the two elemental metals. The Al atomic particles with low melting point are melted first and surround the Ti particles with the higher melting point, and then, as the temperature rises, the Ti particles gradually melt and diffuse in the direction of the Al atomic particles until a uniform distribution is obtained through the diffusion. The diffusivity of Al atoms is significantly greater than that of Ti atoms.
We calculated the MSD of the alloy particle system and the elemental particle system when the Ti-Al alloy is heated to the same temperature, as shown in Figure 9a,b. It is observed from Figure 9a that the slope of the MSD curve of the alloy powder system is larger, indicating its larger diffusion coefficient. This proves that during the melting process, the diffusivity and the mobility of the solute atoms in the alloy powder system are greater than those of the elemental systems. Therefore, mixing the sample uniformly in advance is more conducive to the diffusion of the solute atoms for metal powders.
We also calculated the MSD of the solute atoms of different elements in the alloy particle and elemental particle, as shown in Figure 9b. It is observed that the MSD values were in the order of Dalloy-Al > Dalloy-Ti > Delementary-Al > Delementary-Ti. During the melting process, under the same temperature and process parameters, the diffusion of the solute atoms in the alloy particle is greater than that in the elemental particle. Therefore, it can be inferred that the alloying process in the elemental mixed powder will reduce the diffusion and mobility of the solute atoms to a certain extent. The degree of diffusion of the solute atoms in the alloy powder is high due to the uniform mixing of the solutes in advance; during the mass transfer process, the atom diffusion barriers are reduced, and the activation energy required for diffusion is lower, so that the diffusion coefficient increases. The degree of diffusion of the Al atoms is greater than that of Ti atoms, which may be due to the fact that the atomic radius and atomic weight of Al are smaller than Ti and therefore the activation energy required for Al transport is smaller. At the same time, the melting point of Al is relatively low, and when heated to the same temperature, the diffusion time for Al atoms is longer, so that the extent of diffusion is greater. Additionally, for both alloy and elemental powder, especially alloy powder, there is a change in the slope of MSD at 200 ps which indicates different diffusion coefficients. For spherical particle, they need more time to diffuse and integrate with each other after being heated to the temperature required compared with cubic systems since the particles are separated at first, so the atoms need to move across a greater distance before 200 ps until the powders are well mixed, as shown in Figure 8a–c, and the slope of MSD will decrease after the spherical powders have merged into a uniform system after 200 ps, as shown in Figure 8d. The change in the slope for the elemental powder at 200 ps is not as obvious as that for the alloy particle, because the elemental particle needs to alloy, and the alloying process of the two different kinds of particles may diminish the degree of diffusion in the early stages before 200 ps, so the change in the diffusion coefficient of the elemental particle before 200 ps is not as significant as the alloy particle.
In addition, the atomic displacement vector diagrams of the alloy particle and the elemental particle system were obtained. As shown in Figure 10, the direction of the arrow indicates the direction of the atom movement, and its length indicates the distance of the atom movement. In the initial stage of heating, Ti and Al atoms had similar degrees of diffusion in the alloy powder at the same temperature, as shown in Figure 10b,c. For the elemental particle, in the initial stage of heating, the diffusion of Al atoms with a lower melting point is clearly greater than that of Ti atoms with a higher melting point. When the temperature rises above the melting point of Ti, the diffusion degrees of the two elements tend to be close. It is observed that after alloying, the difference in the degree of diffusion of the two types of atoms is reduced. The surrounding atoms of the spherical particles diffuse outward, and the internal atoms show a trend of reverse convection diffusion.

4. Conclusions

(1) After the Ti-Al alloy is heated to 2400 K, the alloy is completely melted. With further increase in heating temperature, the rise in the diffusion coefficient slows down, the rdf curves show no change, and atomic number density demonstrates the same pattern as before. Therefore, increasing the temperature past 2400 K has little effect on the mass transfer process of Ti-Al alloy. In the actual preparation process, the temperature is adjusted mainly by changing the laser power. Therefore, the laser power should be controlled within an appropriate range. Our simulations reveal these effects at the atomic level and show that laser irradiation should be applied until the melting temperature of the alloy is reached. Adjusting the laser power to obtain the heating temperature of approximately 2400 K for TiAl alloy provides the ideal process parameters and improves the efficiency and success rate of high-throughput preparation.
(2) During the preparation process, the mass transfer behavior is affected by the heating time and the atomic fraction. As the heating time increases, the diffusion coefficient gradually decreases, the diffusion weakens, and the mass transfer process gradually stabilizes. Therefore, the increase in the heating time will not promote the mass transfer but will weaken it in the later stage of heating. Moreover, the diffusion coefficient of a certain element is not only related to its atomic radius and other properties but also affected by the composition of the system. The diffusion coefficient of the element will increase with the increasing content of the element in the alloy.
(3) During the melting of the spherical alloy particle, the two particles move closer to each other and gradually fuse until they diffuse into a uniform system. During the melting process of the spherical elemental particle, the Al atomic particles with low melting point are first melted to cover the Ti atomic particles with the higher melting point, and then as the temperature rises, the Ti particles gradually melt and diffuse toward the Al atomic particles until a uniform elemental distribution is obtained. In the entire process, the diffusivity of Al atoms is significantly greater than that of Ti atoms and the diffusivity of the solute atoms in the alloy powder is greater than that in the elemental powder. Therefore, a uniform mixing of the elements in advance of the laser melting is more conducive to the diffusion of solute atoms for metal powders, and the alloying process may reduce the diffusion and mobility of the solute atoms to a certain extent.

Author Contributions

Conceptualization, X.Z.; methodology, Z.C.; software, Z.C.; formal analysis, Z.C.; investigation, Z.C.; resources, X.Z.; data curation, Z.C.; writing—original draft preparation, Z.C.; writing—review and editing, Z.C. and Q.M. and X.Z.; visualization, Z.C. and Q.M.; supervision, X.Z.; project administration, X.Z.; funding acquisition, X.Z. All authors have read and agreed to the published version of the manuscript.

Funding

This research was funded by National Key Research and Development Program of China (No.2018YFB0703400) and National Natural Science Foundation of China (No.51271034).

Acknowledgments

This research is supported by National Key Research and Development Program of China (No.2018YFB0703400) and National Natural Science Foundation of China (No.51271034).

Conflicts of Interest

The authors declare no conflict of interest.

References

  1. Mao, S.S. High throughput growth and characterization of thin film materials. J. Cryst. Growth 2013, 379, 123–134. [Google Scholar] [CrossRef]
  2. Chakraborty, N. The effects of turbulence on molten pool transport during melting and solidification processes in continuous conduction mode laser welding of copper–nickel dissimilar couple. Appl. Therm. Eng. 2009, 29, 3618–3630. [Google Scholar] [CrossRef] [Green Version]
  3. Gan, Z.T.; Yu, G.; He, X.L. Numerical simulation of thermal behavior and multicomponent mass transfer in direct laser deposition of Co-base alloy on steel. Int. J. Heat Mass Transf. 2017, 104, 28–42. [Google Scholar] [CrossRef] [Green Version]
  4. Protopapas, P. Theory of transport in liquid metals. I. Calculation of self-diffusion coefficients. J. Chem. Phys. 1973, 59, 15–40. [Google Scholar] [CrossRef]
  5. Lu, Y.; Cheng, H.; Chen, M. A molecular dynamics examination of the relationship between self-diffusion and viscosity in liquid metals. J. Chem. Phys. 2012, 136, 80–91. [Google Scholar] [CrossRef]
  6. Yuan, P.; Gu, D. Molten pool behaviour and its physical mechanism during selective laser melting of TiC/AlSi10Mg nanocomposites: Simulation and experiments. J. Phys. D Appl. Phys. 2015, 48, 303–312. [Google Scholar] [CrossRef]
  7. Gan, Z.T.; Yu, G.; He, X.L. Surface-active element transport and its effect on liquid metal flow in laser-assisted additive manufacturing. Lett. Heat Mass Transf. 2017, 86, 206–220. [Google Scholar] [CrossRef] [Green Version]
  8. Gan, Z.T.; Liu, H.; Li, S. Modeling of thermal behavior and mass transport in multi-layer laser additive manufacturing of Ni-based alloy on cast iron. Int. J. Heat Mass Transf. 2017, 111, 709–730. [Google Scholar] [CrossRef] [Green Version]
  9. He, X.L.; Song, L.; Yu, G. Solute transport and composition profile during direct metal deposition with coaxial powder injection. Appl. Surf. Sci. 2011, 101, 260–278. [Google Scholar] [CrossRef] [Green Version]
  10. Dong, Z.B.; Wang, S.J.; Ma, R. Solute Redistribution with Shear Flow in Molten Pool of Ni-Cr Alloy. J. Mater. Sci. Technol. 2011, 27, 183–188. [Google Scholar] [CrossRef]
  11. Khosravian, N.; Samani, M.K.; Loh, G.C. Molecular dynamic simulation of diamond/silicon interfacial thermal conductance. J. Appl. Phys. 2013, 113, 24–42. [Google Scholar] [CrossRef]
  12. Zhou, X.W.; Jones, R.E.; Duda, J.C. Molecular dynamics studies of material property effects on thermal boundary conductance. J. Phys. Chem. 2013, 15, 11078–11087. [Google Scholar] [CrossRef] [PubMed]
  13. Duda, J.C.; English, T.S.; Piekos, E.S. Implications of cross-species interactions on the temperature dependence of Kapitza conductance. Phys. Rev. B 2011, 84, 4193–4198. [Google Scholar] [CrossRef] [Green Version]
  14. Shi, W.; Shuai, L.; Qing, W. Effect of Molten Pool Boundaries on the Mechanical Properties of Selective Laser Melting Parts. J. Mater. Process. Technol. 2014, 214, 2660–2667. [Google Scholar]
  15. Loh, L.E.; Chua, C.K.; Yeong, W.Y.; Song, J.; Mapar, M.; Sing, S.-L.; Liu, Z.-H.; Zhang, D.-Q. Numerical investigation and an effective modelling on the Selective Laser Melting (SLM) process with aluminium alloy 6061. Int. J. Heat Mass Transf. 2015, 80, 288–300. [Google Scholar] [CrossRef]
  16. Wang, H.P.; Yang, S.J.; Hu, L. Molecular dynamics prediction and experimental evidence for density of normal and metastable liquid zirconium. Chem. Phys. Lett. 2016, 653, 112–124. [Google Scholar] [CrossRef]
  17. Zhang, J.; Wang, X.; Zhu, Y. Molecular dynamics simulation of the melting behavior of copper nanorod. Comput. Mater. Sci. 2018, 143, 248–262. [Google Scholar] [CrossRef]
  18. Essajai, R.; Hassanain, N. Molecular dynamics study of melting properties of gold nanorods. J. Mol. Liq. 2018, 261, 402–413. [Google Scholar] [CrossRef]
  19. Joshi, A.; James, S. Molecular dynamics simulation study of cold spray process. J. Manuf. Process. 2018, 33, 136–145. [Google Scholar] [CrossRef]
  20. Foroughi, A.; Tavakoli, R.; Aashuri, H. Molecular dynamics study of structural formation in Cu50–Zr50 bulk metallic glass. J. Non-Cryst. Solids. 2016, 432, 334–359. [Google Scholar] [CrossRef]
  21. Zhao, J.; Liu, C.T.; Inoue, A. Structural properties and energy analysis of ZrxCu92−xAl8 ternary metallic glasses. Comput. Mater. Sci. 2017, 139, 260–272. [Google Scholar] [CrossRef]
  22. Qi, L.; Zhang, H.F.; Hu, Z.Q. Molecular dynamic simulation studies of glass formation and atomic-level structures in Pd-Ni alloy. Phys. Lett. A 2004, 327, 506–520. [Google Scholar] [CrossRef]
  23. Li, F.; Liu, X.J.; Lu, Z.P. Atomic structural evolution during glass formation of a Cu–Zr binary metallic glass. Comput. Mater. Sci. 2014, 85, 147–162. [Google Scholar] [CrossRef]
  24. Panwisawas, C.; Qiu, C.L.; Sovani, Y. On the role of thermal fluid dynamics into the evolution of porosity during selective laser melting. Scr. Mater. 2015, 105, 14–22. [Google Scholar] [CrossRef]
  25. Malek, K.; Coppens, M.O. Molecular simulations of solute transport in xylose isomerase crystals. J. Phys. Chem. B 2008, 112, 1549–1562. [Google Scholar] [CrossRef] [PubMed]
  26. Wang, J.; Agrawal, A.; Flores, K. Are Hints about Glass Forming Ability Hidden in the Liquid Structure? Acta Mater. 2019, 62, 99–115. [Google Scholar] [CrossRef]
  27. Sorkin, A.; Tan, J.L.; Wong, C.H. Multi-material modelling for selective laser melting. Procedia Eng. 2017, 216, 51–60. [Google Scholar] [CrossRef]
  28. Zhang, Y.; Liu, H.J.; Li, M. Atomic-scale structural evolution in selective laser melting of Cu50Zr50 metallic glass. Comput. Mater. Sci. 2018, 150, 62–73. [Google Scholar] [CrossRef]
  29. Jakse, N.; Pasturel, A. Transport properties and Stokes-Einstein relation in Al-rich liquid alloys. J. Chem. Phys. 2016, 144, 39–52. [Google Scholar] [CrossRef]
  30. Zope, R.R.; Mishin, Y. Interatomic potentials for atomistic simulations of the Ti-Al system. Phys. Rev. B 2003, 68, 366–391. [Google Scholar] [CrossRef] [Green Version]
  31. Meyer, A.; Petry, W.; Koza, M. Fast diffusion in ZrTiCuNiBe melts. Appl. Phys. Lett. 2003, 83, 3894–3906. [Google Scholar] [CrossRef]
  32. Liu, L.Q. Study on the Mechanical Behavior of Cu-Zr Metallic Glasses via Molecular Dynamics Simulations. Master’s Thesis, University of Science and Technology Beijing, Beijing, China, 2015. [Google Scholar]
Figure 1. The Ti-Al alloy system.
Metals 10 01660 g001
Figure 2. Spherical particle model (red refers to Ti, blue refers to Al): (a) alloy particle system, (b) elemental particle system.
Metals 10 01660 g002
Figure 3. MSD curves at different temperatures.
Metals 10 01660 g003
Figure 4. Radial distribution function curves of the Ti-Al alloy under different temperature conditions: (a) radial distribution function curve of Ti-Al alloy at 300 K, (b) radial distribution function curves of Ti-Al alloy at different heating temperatures, (c) radial distribution function curves of Ti-Al alloy after heating to different temperatures and cooling to room temperature.
Metals 10 01660 g004
Figure 5. Schematic diagram of cell division.
Metals 10 01660 g005
Figure 6. Atomic number density distribution after melting and cooling at different heating temperatures: (a) melting at 2800 K and solidification, (b) melting at 2700 K and solidification, (c) melting at 2600 K and solidification, (d) melting at 2500 K and solidification, (e) melting at 2400 K and solidification, (f) melting at 2300 K and solidification.
Metals 10 01660 g006aMetals 10 01660 g006b
Figure 7. MSD of Ti and Al atoms at 2500 K for Ti-Al alloys with different atomic ratios.
Metals 10 01660 g007
Figure 8. Melting and mass transfer of spherical alloy particles and elemental particles: (a) spherical particle model, (b) particles begin to melt, (c) particles move closer to each other, (d) completely melted and cooled to room temperature.
Metals 10 01660 g008
Figure 9. MSD of the alloy powder and elemental powder and their different elements in the Ti-Al alloy: (a) MSD of the alloy powder and elemental mixed powder system, (b) MSD of the elements in the alloy powder and elemental mixed powder.
Metals 10 01660 g009
Figure 10. Vector diagrams of the atomic displacement when different systems start to melt. (a) The alloy particle starts to melt, (b) Ti atoms when the alloy particle starts to melt, (c) Al atoms when the alloy particle starts to melt, (d) the elemental mixed powder particle starts to melt (Ti on the left, Al on the right).
Metals 10 01660 g010
Table 1. Diffusion coefficient and activation energy of Ti-Al alloy at different temperatures.
Temperature (T/K)Diffusion Coefficient (D × 10−6/m2·s−1)Activation Energy (Q × 105/KJ·mol−1)
23001.565.36
24007.194.91
25008.014.73
26008.724.57
27008.924.51
280010.204.41
Table 2. Diffusion coefficients of alloy powder and elemental mixed powder systems for different heating times.
Heating Time (t/ps)Diffusion Coefficient of Alloy Powder (DA/m2·s−1)Diffusion Coefficient of Elemental Powder (DE/m2·s−1)
1009.11 × 10−81.06 × 10⁻⁷
10008.38 × 10−88.27 × 10⁻⁸
20007.74 × 10−87.28 × 10⁻⁸
Publisher’s Note: MDPI stays neutral with regard to jurisdictional claims in published maps and institutional affiliations.

