Abstract
We present the modification of Ti-6Al-4V surfaces with a diode end-pumped Nd:YVO4 laser by varying the distance between laser-produced micro(μ)-channels. We analyzed the influence of laser texturing on the morphology, microstructure, surface and corrosion properties of Ti-6Al-4V. SEM imaging reveals a characteristic μ-channel pattern with different scan line separations, while electron backscatter diffraction (EBSD) indicates that laser texturing with the current parameters influences the microstructure up to 2 µm deep with the most significant influence at the tips, where melting and rapid solidification occur. The Vickers hardness test indicates a surface hardening effect of the laser-textured compared to the as-received Ti-6Al-4V surfaces. The XPS analysis showed that the oxide layer on the laser-textured samples was considerably thicker compared to the as-received sample, at 20 and 7 nm, respectively. We observed that the wettability was strongly correlated with the scan line separation. The results show increased hydrophobicity with increased scan line separation. The corrosion resistance was improved for laser-textured surfaces compared to the as-received surface and increased with the scan line separation.
1. Introduction
In the last three decades, modification of metallic surfaces by various coatings, organic or polymeric, has become a part of an important procedure in enhancing the surface properties such as scratch resistance, oxidation and corrosion [1,2]. The common idea of both basic and applied research is to prolong the lifetime of metallic parts implemented in various industrial components and to reduce the expenses connected with material failure. Corrosion protection of metallic surfaces is one of the most important steps in satisfying the needs of the demanding industrial applications. Protective coatings on metallic substrates are accepted as a well-tested effective physical barrier between the metal and its environment containing aggressive species, such as enhanced chloride ion concentration, O2 or H+. A variety of polymers have been known to serve for metallic surface protection, including epoxy resins, polyesters and polyurethanes [1,2,3]. To further improve the anticorrosion properties of polymer coatings and their mechanical properties, recently, different inorganic nanoparticles have been successfully incorporated into polymer matrices [4,5,6,7,8].
Lately, laser texturing has been addressed as an effective tool that can provide an additional degree of surface manipulation leading to unique surface properties [9,10,11]. Several studies report on laser-structured metallic surfaces that are initially superhydrophilic and turn superhydrophobic with time [12,13,14,15]. Manipulation of metal surface wettability and roughness is, on the other hand, also the key for successful protection against corrosion in aggressive media [16].
Titanium and titanium alloys have attracted considerable interest in various fields due to their high strength to weight ratio, high yield strength and toughness, good corrosion properties and biocompatibility [17]. In this paper, we studied the influence of laser texturing on the microstructure of Ti-6Al-4V substrate and surface and corrosion properties of laser-textured surfaces. We performed EBSD mapping of the cross-section of the laser-textured Ti-6Al-4V surface. The Vickers hardness (HV) test was performed to evaluate the influence of laser texturing on surface hardening. The X-ray photoelectron spectroscopy (XPS) was used to evaluate the surface chemical composition. We analyzed surface wettability and roughness and, finally, we performed the potentiodynamic measurements in a simulated physiological Hank’s solution.
2. Materials and Methods
Materials—Grade 5 Ti alloy, Ti-6Al-4V (6% Aluminium, 4% Vanadium), was used as a substrate (A.F. Trading s.r.l.). Titanium sheets were heated by an electric furnace for 1 h at a temperature of 830 °C (± 10 °C). The hold time was 1.5 h, and then the titanium sheets were air-cooled in the furnace. The alloy sheet with a thickness of 1.5 mm was cut into discs of 25 mm diameter that were cleaned with ethanol in an ultrasonic bath.
Surface laser-texturing—A Rofin Powerline E20 laser marker was used to produce the surface texture. It is equipped with a diode end-pumped Nd:YVO4 laser with 1064 nm wavelength and 20 W of output power. The marker is equipped with a standard F theta lens with a focusing length of 160 mm and a double galvano configuration, while the marking field is 120 × 120 mm. Programing of marking shapes (lines) was performed using Rofin Visual Laser Marking software. Scan line overlapping was set to 0, –50 and –200%, which gave the scan line separation ∆x = 100, 180 and 280 µm. The laser pulse width was 4.0 μs and the line width was set to 0.1 mm. The laser current for the marking of line shapes was 42 A, the marking speed was 30 mm/s and the laser frequency was set to 50 Hz. Before texturing, the surfaces were cleaned with acetone and texturing was performed with laser focus on the surface of the test coupon. Laser texturing was conducted at room temperature and in air atmosphere.
Surface characterization—Scanning electron microscopy (SEM) analysis using field emission SEM JEOL JSM-6500F (JEOL, Tokyo, Japan) was employed to investigate the morphology of the laser-textured surfaces. FIB-SEM ZEISS Crossbeam 550 SEM with an energy-dispersive X-ray spectroscopy (EDS) analyzer and Hikari Super EBSD Camera was used to investigate the microstructure and EDS mapping of the laser-textured Ti-6Al-4V surfaces. Prior to analysis, the cross-sectioned samples, mounted in conductive Bakelite resin, grinded and polished using 1 µm diamond suspension and OPS (40-nm silica oxide colloidal suspension), were prepared.
The surface wettability was evaluated with static water contact angles on laser-textured Ti-6Al-4V surfaces by using a surface energy evaluation system (Advex Instruments s.r.o., Brno, Czech Republic). Water drops of 5 μL were deposited on at least five different spots of the substrates to avoid the influence of roughness and gravity on the shape of the drop. The drop contour was analyzed from the image of the deposited liquid drop on the surface and the contact angle was determined by using Young–Laplace fitting. To minimize the errors due to roughness and heterogeneity, the average values of the contact angles of the drop were measured approximately 20 s after the deposition. All the contact angle measurements were carried out at 22 °C and ambient humidity.
An optical 3D metrology system, model Alicona Infinite Focus (Alicona Imaging GmbH, Graz, Austria), was employed for the surface roughness analysis. The Alicona Infinite Focus IF-MeasureSuite Version 5.1 software was used for the roughness analysis further on. The software offers the possibility to calculate the average surface roughness, Sa, for each sample, based on the general surface roughness equation, Sa:
where Lx and Ly are the acquisition lengths of the surface in the x and y directions and z(x,y) is the height. Five measurements per sample were performed at magnification 20× with a lateral resolution of 0.9 μm and a vertical resolution of 50 nm. The size of the analyzed area was 1.3 × 1.0 mm2. To level the profile, corrections were made to exclude the general geometrical shape and possible measurement-induced misfits.
The Vickers hardness HV20 was measured using an Instron Tukon 2100 B Vickers hardness tester.
XPS analyses were carried out on the TFA XPS spectrometer produced by Physical Electronics Inc (Chanhassen, Minnesota) equipped with an Al monochromatic X-ray source of photon energy of 1486.6 eV and a hemispherical electron energy analyzer. The analyzed area was 0.4 mm in diameter. The high-energy resolution XPS spectra were acquired at a resolution of about 0.6 eV and pass energy of 29 eV. A neutralizer electron gun was used to reduce surface charging. XPS depth profiling was performed by the 3 keV Ar+ ion beam rastering over an area of 3 × 3 mm2 with an etching rate of 1.0 nm/min.
Electrochemical measurements—The potentiodynamic measurements were carried out in a simulated physiological solution (Hank’s). We applied a BioLogic® Modular Research Grade Potentiostat Model SP-300 with EC-Lab® V11.27 software. A three-electrode system was used with the test specimen as the working electrode, a saturated calomel electrode (SCE, 0.242 V vs. SHE) as the reference electrode and a platinum mesh as the counter electrode (CE). The specimens were stabilized for 1 h prior to the measurement at the open-circuit potential (OCP). The measurements started at 250 mV vs. SCE more negative than the OCP. The potential was then increased, using a scan rate of 1 mV/s.
3. Results and Discussion
3.1. Surface Morphology
The as-received Ti-6Al-4V surfaces were textured by a diode end-pumped Nd:YVO4 laser with different scan line separations, ∆x = 100, 180 and 280 μm, which define the surface morphology (Figure 1b–g). The unprocessed Ti-6Al-4V surface is shown as a reference in Figure 1a. As shown in Figure 1, the laser-textured surface is characterized by a well-defined micro (μ)-channel pattern in one direction.
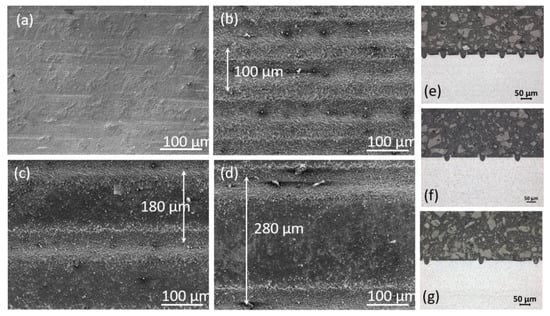
Figure 1.
SEM images (a–d) and light microscopy images (e–g) of (a) the as-received unprocessed Ti-6Al-4V surface and laser-textured Ti-6Al-4V surfaces with different scan line separations: (b,e) 100, (c,f) 180 and (d,g) 280 μm.
As varying the distance between the laser-produced μ-channels defines not only the surface morphology but also the surface roughness, we evaluated the average surface roughness parameter, Sa. Sa was therefore used as the main evaluation measure of the morphology difference between the laser-textured Ti-6Al-4V surfaces. We performed five measurements on each surface over 1.3 × 1.0 mm2. As listed in Table 1, laser texturing increases the average surface roughness Sa, and laser-textured surfaces are approximately two to three times rougher compared to the as-received Ti-6Al-4V surface. Furthermore, Sa of the laser-textured surfaces decreases with increasing scan line separation.

Table 1.
Average surface roughness parameter Sa of as-received and laser-textured Ti-6Al-4V surfaces.
To understand the impact of the laser texturing on the microstructural-crystallographic characteristics, we performed SEM imaging and EBSD mapping of the cross-section of the laser-textured Ti-6Al-4V surfaces with different scan line separations (Δx = 100, 180 and 280 μm). Here, we present the results for the sample with Δx = 100 μm only as the laser channels and the newly forming thin layer at the channel walls is similar for all scan line separations due to the same laser processing parameters. Figure 2 presents the SEM micrograph of Ti-6Al-4V with Δx = 100 μm obtained by the secondary detector. As reported by the manufacturer, the as-received sheets were annealed at the α + β region and slowly cooled down to obtain polycrystalline α grains with some β structures. Additional laser texturing with selected parameters influenced the original microstructure up to 2 μm deep where melting and rapid solidification occurred. On both sides of the channel, a visible ejection of material is observed in the form of a 5 to 15 μm high-branched fan. The direction of the material ejection follows the radial angle of the channel. Figure 3 represents the detail of the edge of the laser channel by the EBSD band contrast image, where microstructure features are based on Kikuchi patterns quality, and overlapping with the phase map image. It is observed that the bulk material is not affected by this type of laser texturing, which is reflected in the characteristic polycrystalline α + β grain structure with grain size up to 4 µm. It is known that at high cooling rates, Ti-6Al-4V alloy is solidified to α’ prime martensite [18]. The band contrast image shows microstructure features based on Kikuchi patterns. Due to the rapid solidification, the microstructure of the laser-textured part consists of very fine needles of α’ prime martensite.
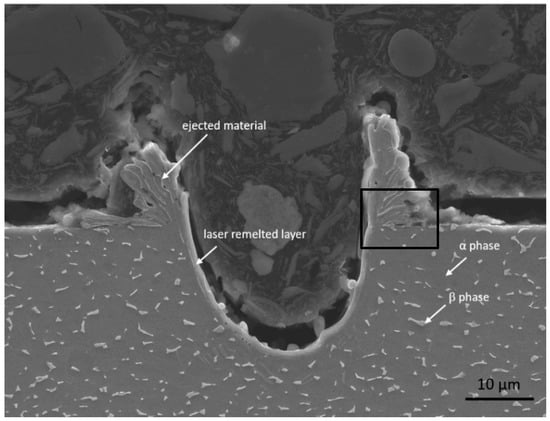
Figure 2.
SEM micrograph of a laser channel obtained by the secondary detector. The black square marks the location of EBSD as shown in Figure 3.
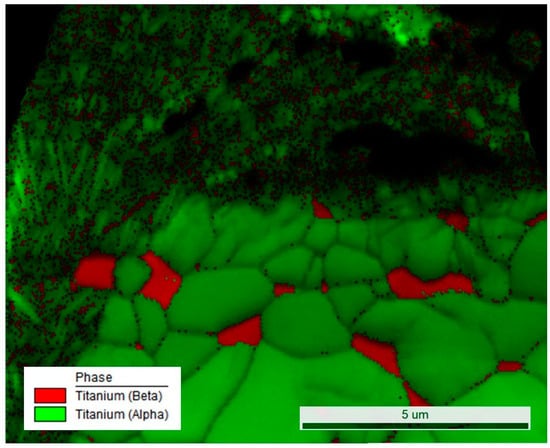
Figure 3.
EBSD band contrast image overlapping with the EBSD phase map.
3.2. Vickers Hardness Test
We compared the Vickers hardness of the as-received Ti-6Al-4V surface and laser-textured surfaces with different scan line separations under 20 kg load. The measured values of HV20 are listed in Table 2. We observed a significant increase in HV20 on laser-textured surfaces compared to the as-received (unprocessed) surface. This indicates surface hardening after laser texturing most probably due to the formation of the α’ prime martensite phase. No cracks were observed near the hardness indentation.
Table 2.
Vickers hardness HV20 of as-received and laser-textured Ti-6Al-4V surfaces.
3.3. XPS Measurements
To understand the influence of the laser texturing of Ti-6Al-4V surfaces, we performed XPS surface chemical analysis of the as-received and laser-textured samples with ∆x = 100 μm. Survey spectra are presented in Figure 4. The detailed elemental composition is summarized in Figure 5. We can observe an increase in the amount of titanium on laser-textured surfaces in comparison with the as-received sample. We also observed a slight increase in the concentration of aluminium and vanadium, which may be ascribed to the contaminants removal after the laser texturing. The relative amount of oxygen increased after laser texturing due to the formation of larger amounts of metal oxides on the surface. On the other hand, the amount of carbon was higher on the as-received sample compared to laser-textured surfaces due to the surface contamination removal after laser texturing. The XPS analysis also showed that the oxide layer on laser-textured samples was considerably thicker compared to the as-received sample. The thickness was assessed from XPS depth profiles and was aproximately 20 nm for laser-textured samples compared to aproximately 7 nm for the as-received sample (Supplementary Data, Figures S1 and S2).
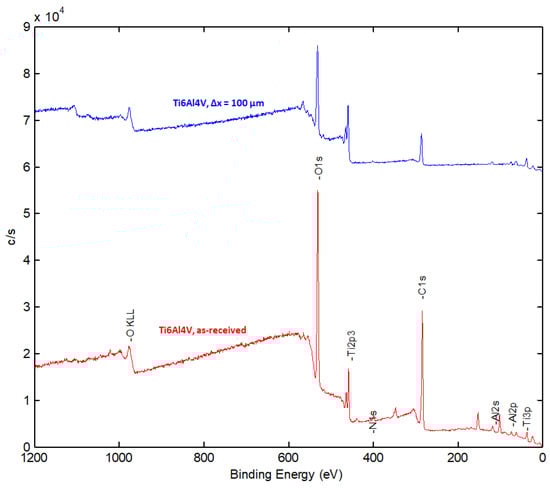
Figure 4.
XPS survey spectra of as-received and laser-textured Ti-6Al-4V (∆x = 100 μm) samples.
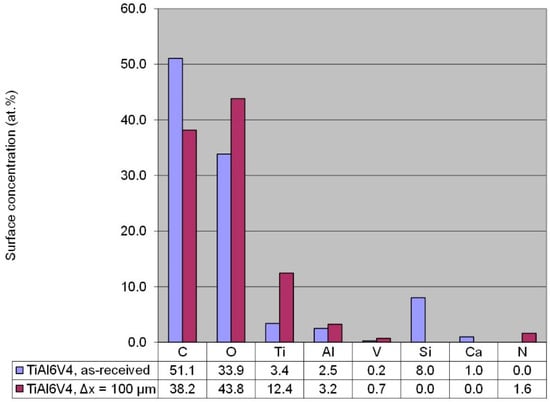
Figure 5.
Surface element composition of as-received and laser-textured Ti-6Al-4V (∆x = 100 μm) samples.
3.4. Surface Wettability
We compared the wettability of the as-received Ti-6Al-4V surface and laser-textured surfaces with different scan line separations. We performed five static water contact angle measurements, θ, with 5 μL droplets of deionized water on different spots all over the sample and used them to determine the average contact angle values.
As listed in Table 3, the as-received (unprocessed) Ti-6Al-4V surface is neutrally wet with a contact angle of ~90o. With laser texturing, on the other hand, we were able to fabricate both hydrophilic and hydrophobic surfaces. The results show that the static water contact angle increases with increasing the scan line separation, from a strongly hydrophilic to moderately hydrophobic surface, which is also correlated with decreased average surface roughness (Table 1). This suggests that the Ti-6Al-4V surface is in the Wenzel wetting regime [19] and allows us to significantly change the surface wettability in comparison to the as-received Ti-6Al-4V surface by modifying surface roughness with laser texturing. Laser texturing therefore serves as a promising tool to manipulate Ti-6Al-4V surfaces with desirable properties.
Table 3.
Wettability of as-received and laser-textured Ti-6Al-4V surfaces.
3.5. Electrochemical Measurements
We evaluated the potentiodynamic behaviour of as-received and laser-textured Ti-6Al-4V surfaces in Hank’s solution (Figure 6). A significant increase in the corrosion potential (Ecorr) can be observed for laser-textured surfaces with values from −250 to −320 mV (SCE) compared to the as-received Ti-6Al-4V surface with a value of −650 mV (SCE). We calculated the corrosion current density (icorr) and the corrosion rate (vcorr) according to ASTM G102–89 (2015) [20]. We also observed a decrease in icorr and vcorr for laser-textured surfaces compared to the as-received Ti-6Al-4V surface, and the values are summarized in Table 4. The improved corrosion resistance can be directly correlated with the wetting properties presented in Table 3. The observed decrease in icorr and vcorr with increasing scan line separation is ascribed to the increased surface hydrophobicity. Furthermore, the improved corrosion resistance is also attributed to the grain refinement of laser-textured surfaces which was confirmed by the EBSD band contrast image (Figure 3). The grain refinement improves the passive film formation due to the increased grain boundary density and homogenization [21]. Other authors also reported on the corrosion improvement after the laser texturing of Ti-based alloys [21,22,23]. Tian et al. [24] reported that after the laser texturing of Ti alloy, a layer of martensite is formed on the surface with an additional Ti oxide layer on the top, which results in increased corrosion resistance. Here, we also observed the α’ prime martensite phase in the form of very fine needles due to the rapid solidification (Figure 3). In addition, XPS results confirmed the formation of a thicker Ti oxide layer leading to increased corrosion resistance.
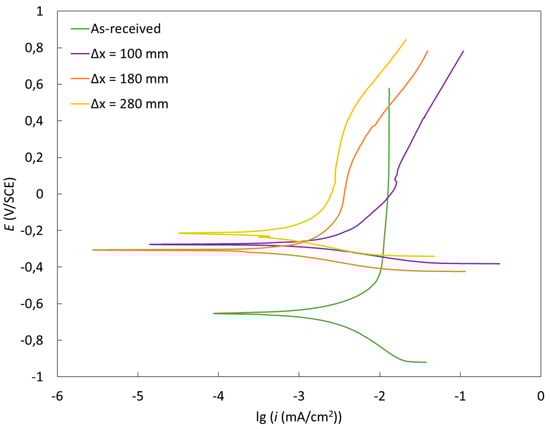
Figure 6.
Potentiodynamic curves for as-received and laser-textured Ti-6Al-4V surfaces in Hank’s solution.
Table 4.
Electrochemical parameters determined from the potentiodynamic curves.
4. Conclusions
Laser texturing of Ti-6Al-4V surfaces was used to fabricate surfaces with different surface characteristics and corrosion behaviors. Surface morphology was defined by scan line separation, resulting in a characteristic µ-channel structure. Microstructure analysis of laser-textured surfaces indicated that laser texturing with chosen parameters influenced the Ti-6Al-4V microstructure up to 2 µm deep with melting and rapid solidification of the tips into a crystalline structure with much finer grains. Due to the rapid solidification, the microstructure of the laser-textured part consists of very fine needles of α’ prime martensite. The α’ prime martensite phase was also attributed to the surface hardening after laser texturing, which was reflected in increased HV on laser-textured surfaces compared to the as-received surface. The bulk, on the other hand, remained unaffected α+β alloy. The average surface roughness decreased with increasing scan line separation. Laser texturing also defined the wettability of surfaces and enabled us to significantly change the surface wettability in comparison to the as-received Ti-6Al-4V surface, either into strongly hydrophilic or to moderately hydrophobic. Laser texturing therefore serves as a promising tool to manipulate Ti-6Al-4V surfaces with desirable properties. Improved corrosion resistance for laser-textured surfaces was observed and attributed to the grain refinement which improved the passive film formation. This was confirmed by XPS results, showing the formation of a thicker Ti oxide layer after laser texturing. On the other hand, wetting, which is very much related to the distance of the channels, probably has a decisive influence on corrosion. In addition, wetting is also affected not only by the shape of the channel formed by the laser but also by the ejected material at the edge of the channel.
Supplementary Materials
The following are available online at https://www.mdpi.com/2075-4701/10/11/1504/s1.
Author Contributions
Conceptualization, M.C. and A.K.; methodology, M.C.; validation, M.C., A.K., D.K. and M.G.; formal analysis, M.C., A.K. and M.G.; writing—original draft preparation, M.C. and A.K.; writing—review and editing, M.C., A.K. and M.G.; All authors have read and agreed to the published version of the manuscript.
Funding
This research was funded by the Slovenian Research Agency, grant number P2-0132.
Acknowledgments
The authors acknowledge the financial support from the Slovenian Research Agency (research core funding No. P2-0132).
Conflicts of Interest
The authors declare no conflict of interest.
References
- Galliano, F.; Landolt, D. Evaluation of corrosion protection properties of additives for waterborne epoxy coatings on steel. Prog. Org. Coat. 2002, 44, 217–225. [Google Scholar] [CrossRef]
- Talo, A.; Forsén, O.; Yläsaari, S. Corrosion protective polyaniline epoxy blend coatings on mild steel. Synth. Met. 1999, 102, 1394–1395. [Google Scholar] [CrossRef]
- Diniz, F.B.; De Andrade, G.; Martins, C.; De Azevedo, W.M. A comparative study of epoxy and polyurethane based coatings containing polyaniline-DBSA pigments for corrosion protection on mild steel. Prog. Org. Coat. 2013, 76, 912–916. [Google Scholar] [CrossRef]
- Moloney, A.C.; Kausch, H.H.; Kaiser, T.; Beer, H.R. Parameters determining the strength and toughness of particulate filled epoxide-resins. J. Mater. Sci. 1987, 22, 381–393. [Google Scholar] [CrossRef]
- Hussain, M.; Oku, Y.; Nakahira, A.; Niihara, K. Effects of wet ball-milling on particle dispersion and mechanical properties of particulate epoxy composites. Mater. Lett. 1996, 26, 177–184. [Google Scholar] [CrossRef]
- Giannelis, E.P. Polymer-layered silicate nanocomposites: Synthesis, properties and applications. Appl. Organomet. Chem. 1998, 12, 675–680. [Google Scholar] [CrossRef]
- Zerda, A.S.; Lesser, A.J. Intercalated clay nanocomposites: Morphology, mechanics, and fracture behavior. J. Polym. Sci. Part B Polym. Phys. 2001, 39, 1137–1146. [Google Scholar] [CrossRef]
- Singh, R.P.; Zhang, M.; Chan, D. Toughening of a brittle thermosetting polymer: Effects of reinforcement particle size and volume fraction. J. Mater. Sci. 2002, 37, 781–788. [Google Scholar] [CrossRef]
- Long, J.; Liu, W.; Zhang, H.; Fan, P. Superhydrophilicity to superhydrophobicity transition of picosecond laser microstructured aluminum in ambient air. J. Colloid Interface Sci. 2015, 441, 1–9. [Google Scholar] [CrossRef]
- Boinovich, L.; Emelyanenko, A.M.; Modestov, A.D.; Domantovsky, A.G.; Emelyanenko, K.A. Synergistic Effect of Superhydrophobicity and Oxidized Layers on Corrosion Resistance of Aluminum Alloy Surface Textured by Nanosecond Laser Treatment. ACS Appl. Mater. Interfaces 2015, 7, 19500–19508. [Google Scholar] [CrossRef]
- Ta, V.D.; Dunn, A.K.; Wasley, T.J.; Li, J.; Kay, R.W.; Stringer, J.; Smith, P.J.; Esenturk, E.; Connaughton, C.; Shephard, J.D. Laser textured superhydrophobic surfaces and their applications for homogeneous spot deposition. Appl. Surf. Sci. 2016, 365, 153–159. [Google Scholar] [CrossRef]
- Conradi, M.; Sever, T.; Gregorčič, P.; Kocijan, A. Short- and Long-Term Wettability Evolution and Corrosion Resistance of Uncoated and Polymer-Coated Laser-Textured Steel Surface. Coatings 2019, 9, 592. [Google Scholar] [CrossRef]
- Gregorčič, P.; Conradi, M.; Hribar, L.; Hočevar, M. Long-Term Influence of Laser-Processing Parameters on (Super)hydrophobicity Development and Stability of Stainless-Steel Surfaces. Materials 2018, 11, 2240. [Google Scholar] [CrossRef] [PubMed]
- Ta, D.V.; Dunn, A.K.; Wasley, T.J.; Kay, R.W.; Stringer, J.; Smith, P.J.; Connaughton, C.; Shephard, J.D. Nanosecond laser textured superhydrophobic metallic surfaces and their chemical sensing applications. Appl. Surf. Sci. 2015, 357, 248–254. [Google Scholar] [CrossRef]
- Kietzig, A.-M.; Hatzikiriakos, S.G.; Englezos, P. Patterned Superhydrophobic Metallic Surfaces. Langmuir 2009, 25, 4821–4827. [Google Scholar] [CrossRef]
- Boinovich, L.; Gnedenkov, S.; Alpysbaeva, D.; Egorkin, V.; Emelyanenko, A.; Sinebryukhov, S.; Zaretskaya, A. Corrosion resistance of composite coatings on low-carbon steel containing hydrophobic and superhydrophobic layers in combination with oxide sublayers. Corros. Sci. 2012, 55, 238–245. [Google Scholar] [CrossRef]
- Lin, N.; Li, D.; Zou, J.; Xie, R.; Wang, Z.; Tang, B. Surface Texture-Based Surface Treatments on Ti6Al4V Titanium Alloys for Tribological and Biological Applications: A Mini Review. Materials 2018, 11, 487. [Google Scholar] [CrossRef]
- Malinov, S.; Guo, Z.; Sha, W.; Wilson, A. Differential scanning calorimetry study and computer modeling of beta double right arrow alpha phase transformation in a Ti-6Al-4V alloy. Metall. Mater. Trans. A Phys. Metall. Mater. Sci. 2001, 32, 879–887. [Google Scholar] [CrossRef]
- Wenzel, R.N. Resistance of solid surfaces to wetting by water. Ind. Eng. Chem. 1936, 28, 988–994. [Google Scholar] [CrossRef]
- ASTM International. ASTM G102-89(2015)e1, Standard Practice for Calculation of Corrosion Rates and Related Information from Electrochemical Measurements; ASTM International: West Conshohocken, PA, USA, 2015. [Google Scholar]
- Kumari, R.; Scharnweber, T.; Pfleging, W.; Besser, H.; Majumdar, J.D. Laser surface textured titanium alloy (Ti-6Al-4V)—Part II—Studies on bio-compatibility. Appl. Surf. Sci. 2015, 357, 750–758. [Google Scholar] [CrossRef]
- Xu, Y.; Li, Z.; Zhang, G.; Wang, G.; Zeng, Z.; Wang, C.; Wang, C.; Zhao, S.; Zhang, Y.; Ren, T. Electrochemical corrosion and anisotropic tribological properties of bioinspired hierarchical morphologies on Ti-6Al-4V fabricated by laser texturing. Tribol. Int. 2019, 134, 352–364. [Google Scholar] [CrossRef]
- Kosec, T.; Legat, A.; Kovač, J.; Klobčar, D. Influence of Laser Colour Marking on the Corrosion Properties of Low Alloyed Ti. Coatings 2019, 9, 375. [Google Scholar] [CrossRef]
- Tian, Y.; Chen, C.; Li, S.; Huo, Q. Research progress on laser surface modification of titanium alloys. Appl. Surf. Sci. 2005, 242, 177–184. [Google Scholar] [CrossRef]
Publisher’s Note: MDPI stays neutral with regard to jurisdictional claims in published maps and institutional affiliations. |
© 2020 by the authors. Licensee MDPI, Basel, Switzerland. This article is an open access article distributed under the terms and conditions of the Creative Commons Attribution (CC BY) license (http://creativecommons.org/licenses/by/4.0/).