
Primary Recrystallization Behaviors of Hi-B Steel with Lower Initial Nitrogen Produced by the Thin Slab Casting and Rolling Process


Abstract
:1. Introduction
2. Materials and Methods
3. Results
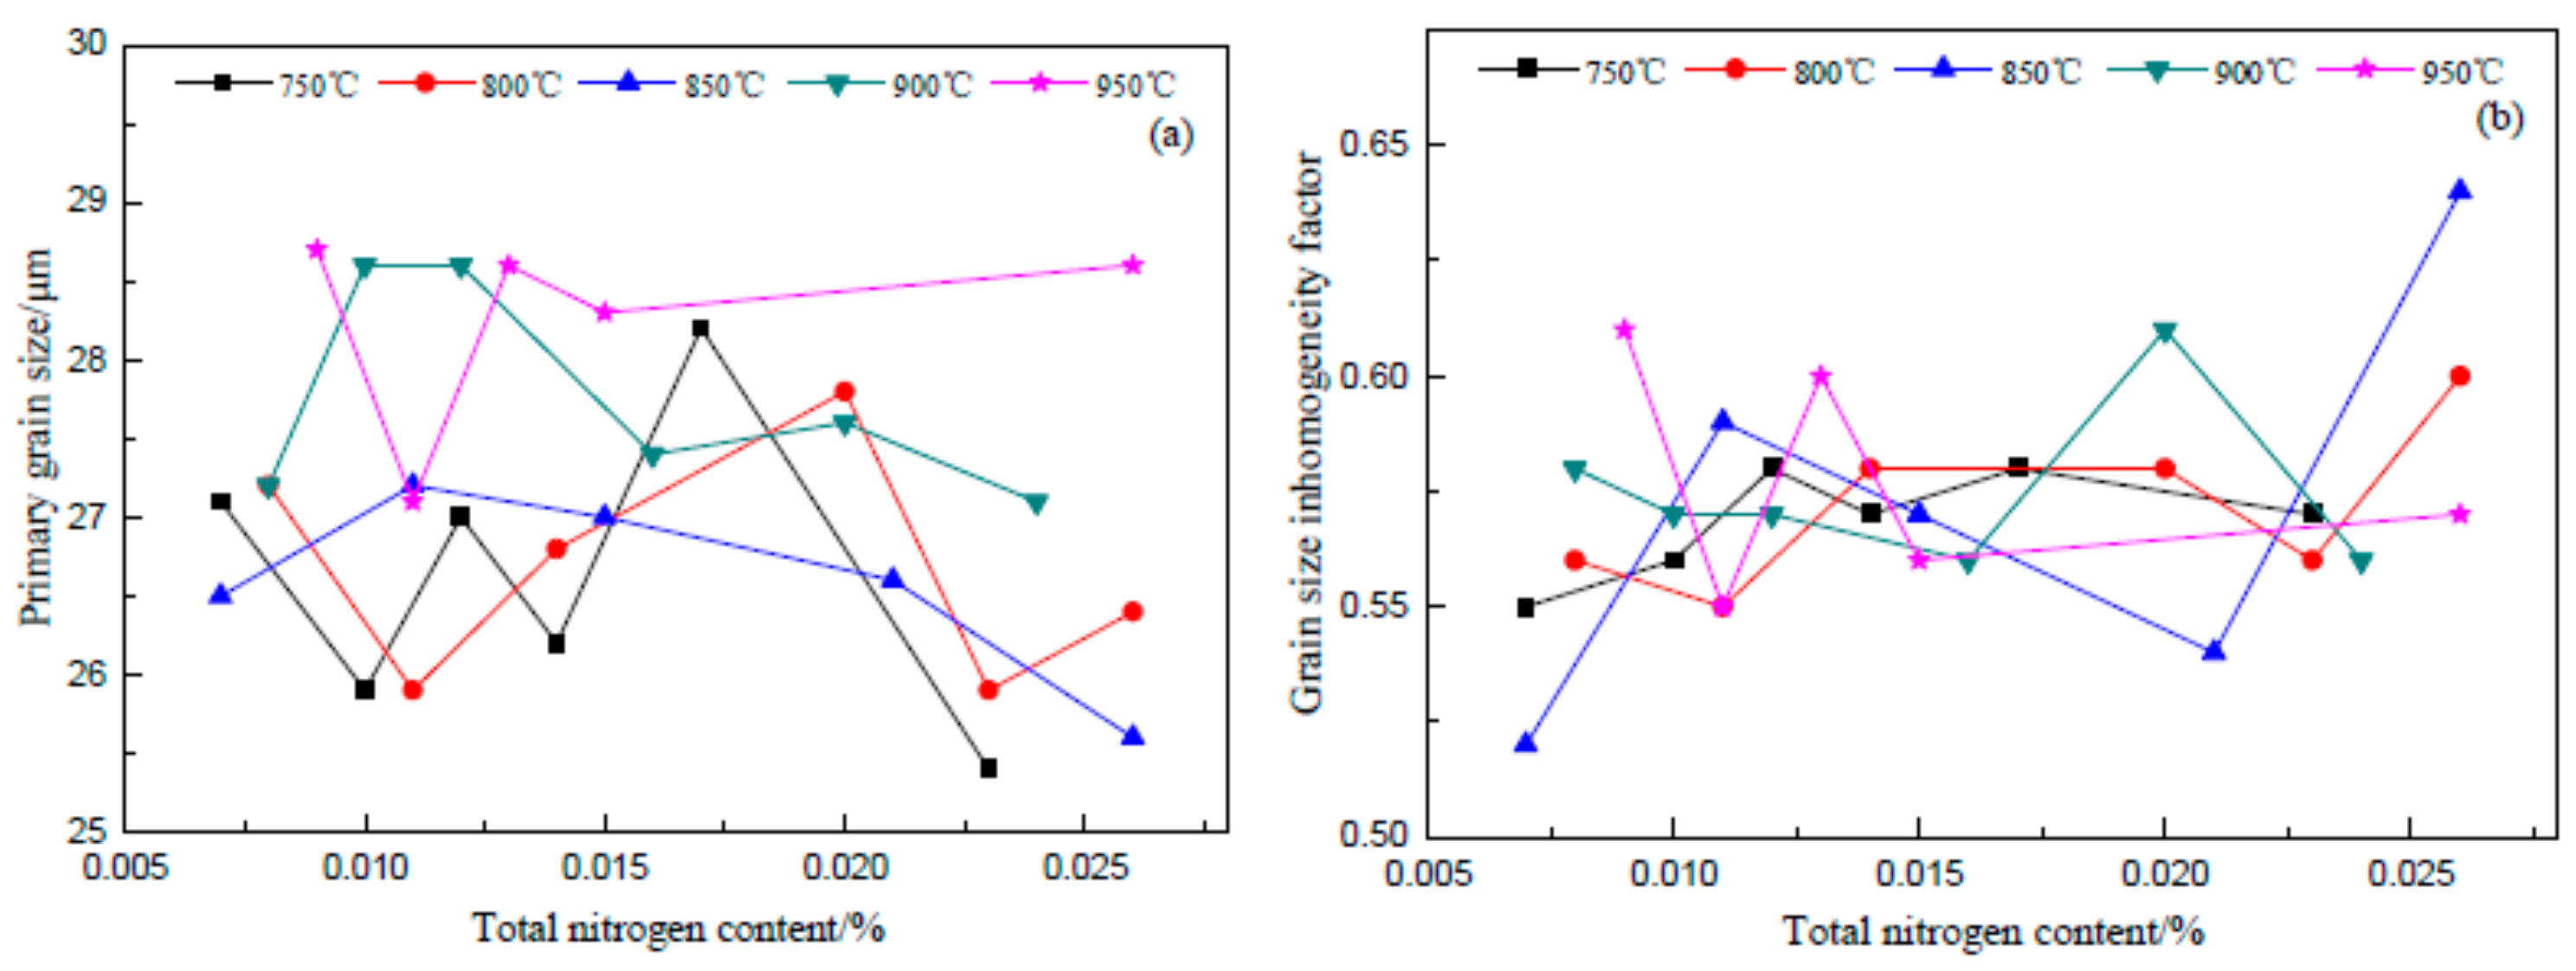
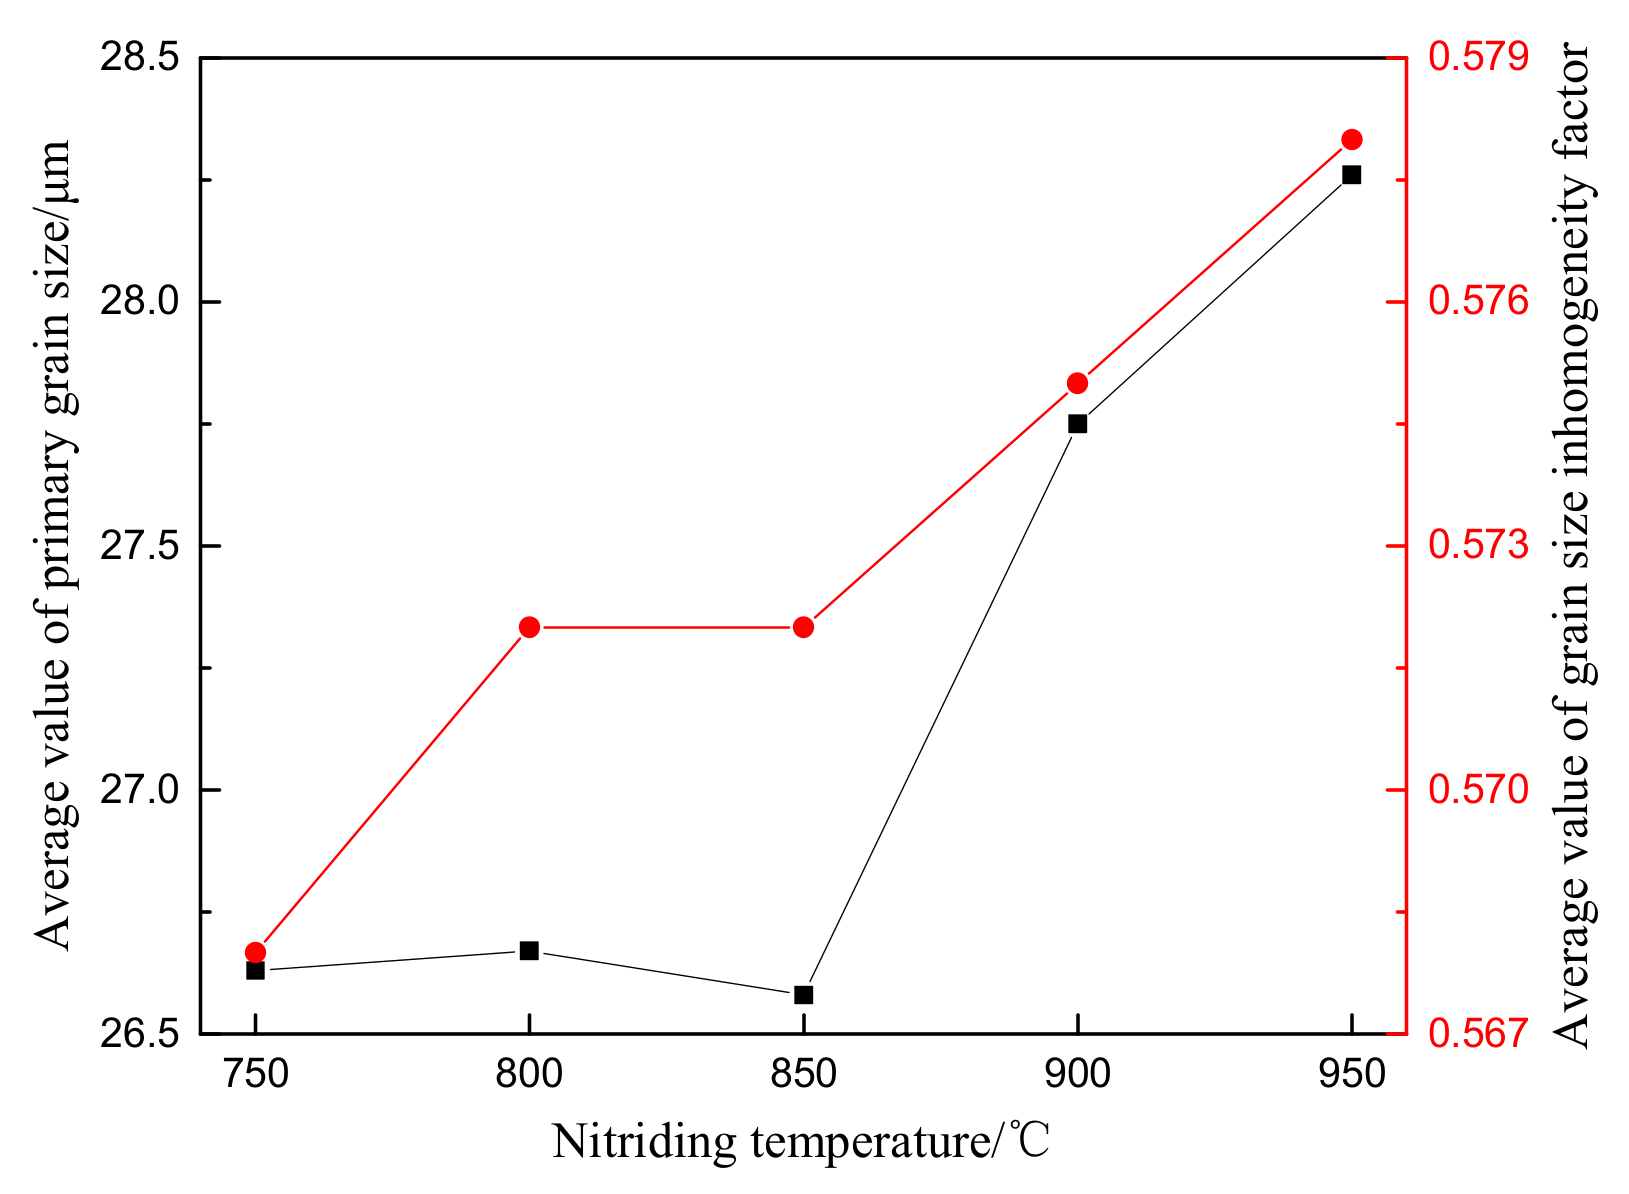
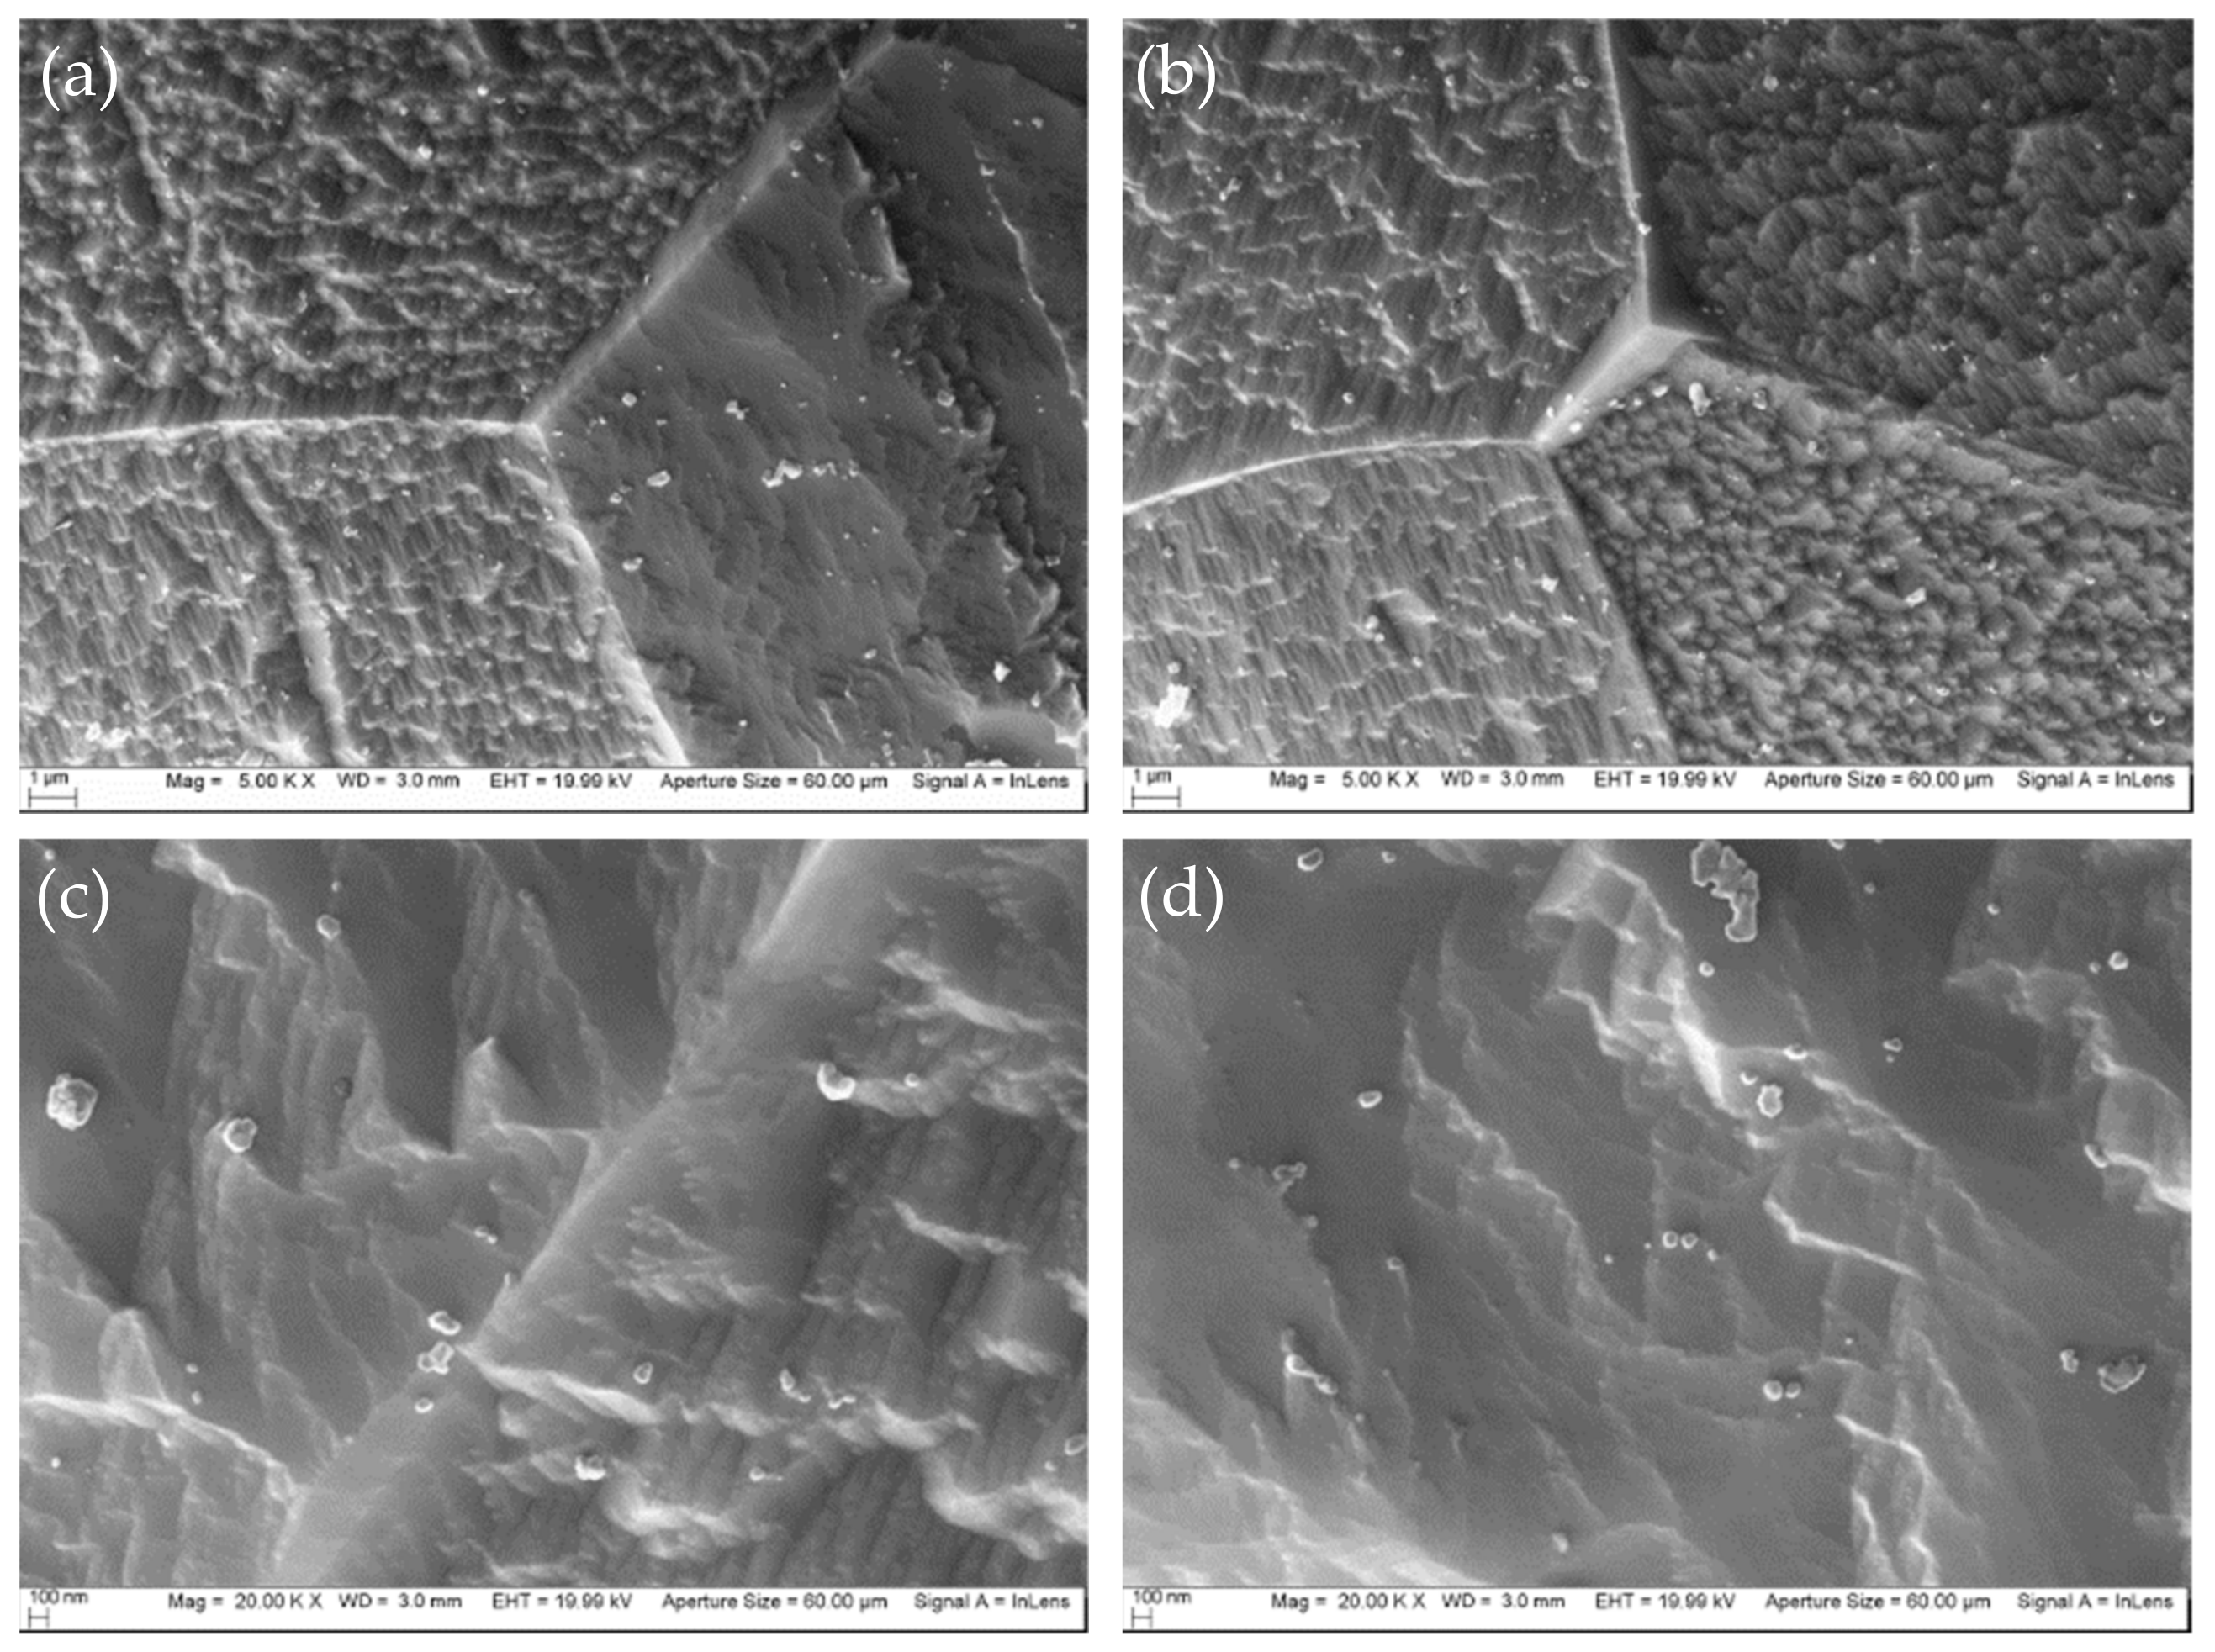
3.1. Effects of Total Nitrogen Content and Nitriding Temperature on Primary Recrystallization Microstructure
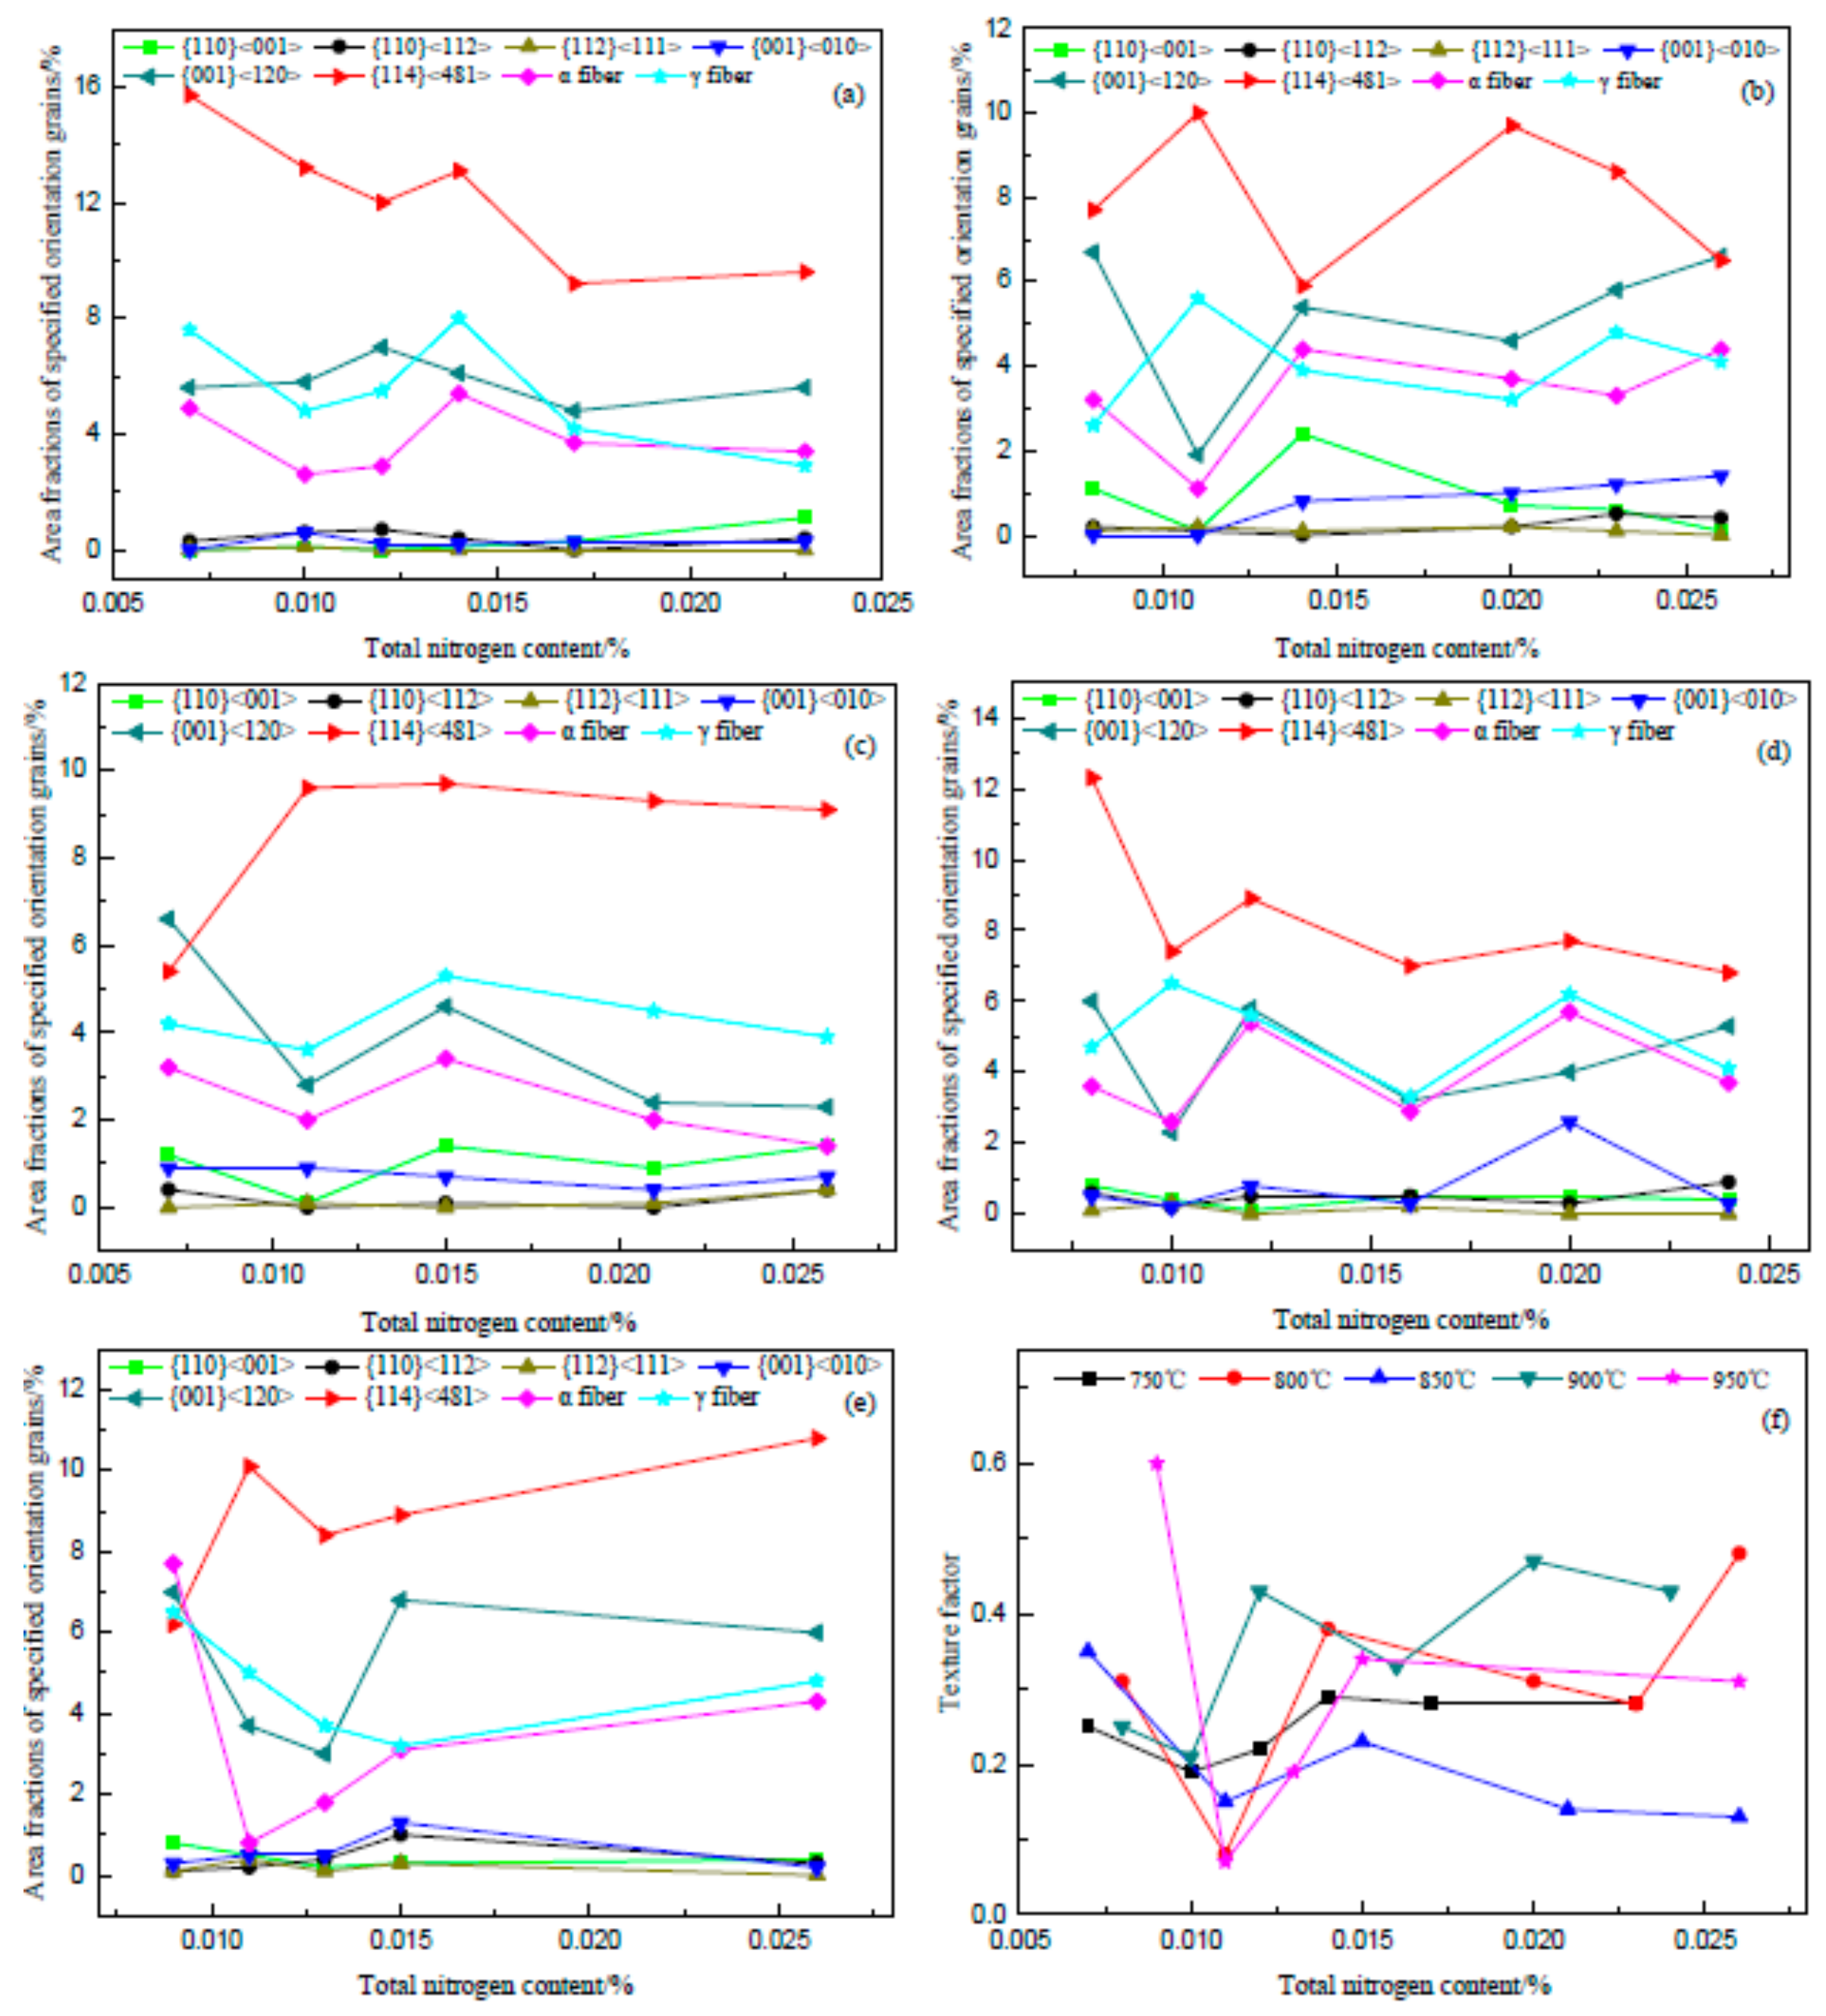
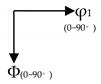
3.2. Effects of Total Nitrogen Content and Nitriding Temperature on Primary Recrystallization Texture
4. Discussions
5. Conclusions
- (1)
- After the decarburized sheet was nitrided at 750–950 °C, the average primary grain size and its inhomogeneity factor were in the range of 26.58–28.26 μm and 0.568–0.578, respectively. The components of primary recrystallization texture were mainly {001} <120>, {114} <481>, and γ fiber texture. Meanwhile, the area fraction of {114} <481> grains in the nitrided sheet was the highest, followed by {001} <120>, γ fiber, and α fiber grains, and the texture factor was mostly between 0.15 and 0.40.
- (2)
- At the same nitriding temperatures, the effects of the total nitrogen content on both the primary grain size and the inhomogeneity factor of a nitrided sheet were not obvious. The effects of total nitrogen content on the component and intensity of primary recrystallization texture, the distribution and area fractions of specified orientation grains, and the texture factor of nitrided sheet were also insignificant.
- (3)
- When the nitriding temperature was 750–850 °C, because the inhibition ability of inherent inhibitors in a decarburized sheet was relatively sufficient, the changes in nitriding temperature have little effect on the primary recrystallization microstructure and texture. When the nitriding temperature rose to 900–950 °C, the average value of primary grain size increased by 1.1–1.6 μm and the inhomogeneity factor also increased gradually. Moreover, some values of the texture factor increased sharply because of the area fraction of {112} <110> grains increased greatly in the nitrided sheet. In order to ensure that the decarburized sheet had better primary recrystallization microstructure and texture characteristics, the nitriding temperature should be controlled between 750 and 850 °C.
Author Contributions
Funding
Data Availability Statement
Conflicts of Interest
References
- Takahashi, N.; Suga, Y.; Kobayashi, H. Recent developments in grain-oriented silicon steel. J. Magn. Magn. Mater. 1996, 160, 98–101. [Google Scholar] [CrossRef]
- Kubota, T.; Fujikura, M.; Ushigami, Y. Recent progress and future trend on grain-oriented silicon steel. J. Magn. Magn. Mater. 2000, 215–216, 69–73. [Google Scholar] [CrossRef]
- Xia, Z.S.; Kang, Y.L.; Wang, Q.L. Developments in the production of grain-oriented electrical steel. J. Magn. Magn. Mater. 2008, 320, 3229–3233. [Google Scholar] [CrossRef]
- Qiu, S.T.; Fu, B.; Xiang, L.; Cheng, G.G. Recent research trends and developments of production process and technology for high magnetic induction grain-oriented silicon steel. Iron Steel. 2013, 48, 1–8. [Google Scholar]
- Li, X.H.; Meng, X.T.; Zhao, P.F.; He, X.G.; Yu, H.B.; Luo, H.W. Present status and future prospect of high permeability grain-oriented silicon steel. China Metall. 2019, 29, 1–7. [Google Scholar]
- Fu, B.; Xiang, L.; Qiu, S.T.; Cheng, G.G. Research advances in inhibitors control of low-temperature high magnetic induction grain-oriented silicon steel production with acquired inhibitor method. Chin. J. Process Eng. 2014, 14, 173–180. [Google Scholar]
- Luo, X.G.; Guo, X.L.; Gao, Y.; Chen, W.C.; Ding, Z. Effect of nitriding temperature on the inhibitor state of grain-oriented silicon steel. J. Wuhan Univ. Sci. Technol. 2019, 42, 8–12. [Google Scholar]
- Fortunati, S.; Cicale, S.; Abbruzzese, G. Process for the Production of Grain Oriented Electrical Steel Strip Having High Magnetic Characteristics, Starting from Thin Slabs. U.S. Patent 6,296,719B1, 2 October 2001. [Google Scholar]
- Cicale, S.; Fortunati, S.; Abbruzzese, G. Process for the Inhibition Control in the Production of Grain-Oriented Electrical Sheets. U.S. Patent 6,361,620B1, 26 March 2002. [Google Scholar]
- Fortunati, S.; Cicale, S.; Abbruzzese, G. Process for the Inhibition Control in the Production of Grain-Oriented Electrical Sheets. U.S. Patent 6,361,621B1, 26 March 2002. [Google Scholar]
- Fortunati, S.; Cicale, S.; Abbruzzese, G.; Matera, S. Process for the Treatment of Grain Oriented Silicon Steel. U.S. Patent 6,406,557B1, 18 June 2002. [Google Scholar]
- Günther, K.; Lahn, L.; Ploch, A.; Sowka, E. Method for Producing Grain Oriented Magnetic Steel Strip. U.S. Patent 8,088,229B2, 3 January 2012. [Google Scholar]
- Qiu, S.T.; Xiang, L.; Yue, E.B.; Zhao, P. Technology analysis of producing grain oriented silicon steel by thin slab casting and rolling process. Iron Steel 2008, 43, 1–7. [Google Scholar]
- Fu, B.; Xiang, L.; Qiu, S.T.; Cheng, G.G. Research status and technological analysis of producing high magnetic induction grain-oriented silicon steel by thin slab casting and rolling process. Mater. Rev. 2013, 27, 110–114. [Google Scholar]
- Xiang, L.; Chen, S.L.; Pei, Y.H.; Luo, Z.H.; Qiu, S.T. Domestic current status and research progress of producing electrical steel by thin slab casting and rolling process. In Proceedings of the 11th China Steel Congress, Beijing, China, 21–22 November 2017; pp. 69–74. [Google Scholar]
- Chen, S.L.; Fang, Z.M.; Luo, Z.H.; Wu, J.P.; Sun, L.; Wang, C.F.; Huang, B.; Guo, X.L.; Zhang, C.; Liang, Z.R.; et al. Method for Producing High Permeability Grain Oriented Silicon Steel by Thin Slab Casting and Rolling. China Patent CN102,517,429A, 27 June 2012. [Google Scholar]
- Yu, Y.M.; Xu, Y.B.; Li, C.S.; Wang, G.D. Inhibitor precipitation of Fe-3% Si strip by thin slab casting and rolling. Trans. Mater. Heat Treat. 2010, 31, 21–25. [Google Scholar]
- Li, C.S.; Yang, H.; Wang, Y.F.; Yu, Y.M. Texture of hot rolled strip for fe-3si steel produced by thin slab casting and rolling. J. Iron Steel Res. Int. 2010, 17, 46–53. [Google Scholar] [CrossRef]
- Bao, S.Q.; Xu, Y.; Zhao, G.; Huang, X.B.; Xiao, H.; Ye, C.L.; Song, N.N.; Chang, Q.M. Microstructure, texture and precipitates of grain-oriented silicon steel produced by thin slab casting and rolling process. J. Iron Steel Res. Int. 2017, 24, 91–96. [Google Scholar] [CrossRef]
- Huang, F.Y.; Zhao, G.; Xu, Y.; Su, C.Q. Influence of inhibitors on primary recrystallization structure of Hi-B electrical steel. J. Iron Steel Res. 2018, 30, 373–378. [Google Scholar]
- Su, C.Q.; Zhao, G.; Xiao, H.; Lan, Y.Z.; Huang, F.Y. Abnormal grain growth of Hi-B steel in the secondary recrystallization. Metallogr. Microstruct. Anal. 2018, 7, 608–617. [Google Scholar] [CrossRef]
- Bao, S.Q.; Liu, B.B.; Zhao, G.; Lan, Y.Z.; Huang, F.Y. Secondary recrystallisation behaviours of grain-orientated silicon steel produced by TSCR process. Ironmak. Steelmak. 2018, 45, 924–928. [Google Scholar] [CrossRef]
- Huang, F.Y.; Bao, S.Q.; Zhao, G.; Su, C.Q. Effect of different nitriding temperature on secondary recrystallization of Hi-B steel with an element of Cu. Metallogr. Microstruct. Anal. 2019, 8, 12–22. [Google Scholar] [CrossRef]
- Fu, B.; Xiang, L.; Wang, H.J.; Qiu, S.T. Effects of nitrogen content and nitriding temperature on primary recrystallization behaviors of high magnetic induction grain-oriented silicon steel. In Proceedings of the Seminar Conference on Production Technology and Application of Domestic High-performance Electrical Steel, Dalian, China, 25–26 August 2016; pp. 22–34. [Google Scholar]
- Wang, H.J.; Fu, B.; Xiang, L.; Rong, Z.; Qiu, S.T. Effect of nitrogen content on primary recrystallization behavior and magnetic property of Hi-B steel. J. Iron Steel Res. Int. 2016, 23, 1080–1085. [Google Scholar] [CrossRef]
- Xiang, L.; Rong, Z.; Fu, B.; Wang, H.J.; Qiu, S.T. Characterizing microstructure and texture after recrystallization annealing of hi-b steel with simutaneous decarburization and nitriding. J. Iron Steel Res. Int. 2017, 24, 1215–1222. [Google Scholar] [CrossRef]
- Wu, Z.W.; Li, J.; Zhao, Y.; Li, B. Low-temperature heating technology oriented silicon steel decarburization and nitriding process and organization. In Proceedings of the 11th China Electrical Steel Professional Academic Annual Conference, Xiamen, China, 9–12 December 2010; pp. 172–176. [Google Scholar]
- Wu, Z.W.; Zhao, Y.; Li, J.; Li, B. Study on precipitates of grain-oriented silicon steel produced by acquired inhibitor method. J. Mater. Eng. 2012, 2, 55–58. [Google Scholar]
- Wang, R.; Yang, P.; Liu, G.T. Effect of nitriding temperature on inhibitor precipitation and the annealed microstructure of grain-oriented silicon steel produced by acquired inhibitor method. Chin. J. Stereol. Image Anal. 2016, 21, 272–278. [Google Scholar]
- Li, X.; Yang, P.; Jia, Z.W.; Zhang, H.L. Effects of normalizing process and nitriding process on the microstructure, texture, and magnetic properties in low-temperature grain-oriented silicon steel. Chin. J. Eng. 2019, 41, 610–617. [Google Scholar]
- Yasuda, M.; Kataoka, T.; Ushigami, Y.; Murakami, K.; Ushioda, K. texture evolution during recrystallization and grain growth in heavily cold-rolled fe-3%Si alloy. ISIJ Int. 2018, 58, 1893–1900. [Google Scholar] [CrossRef]
- Liu, G.T.; Liu, Z.Q.; Yang, P.; Mao, W.M. Correlation between primary and secondary recrystallization texture components in low-temperature reheated grain-oriented silicon steel. J. Iron Steel Res. Int. 2016, 23, 1234–1242. [Google Scholar] [CrossRef]
- Liu, G.T.; Liu, Z.Q.; Yang, P.; Mao, W.M. Effect of primary recrystallized microstructure and nitriding on secondary recrystallization in grain oriented silicon steel by low temperature slab reheating. J. Mater. Eng. 2018, 46, 16–24. [Google Scholar]
- Liu, Z.Q.; Yang, P.; Mao, W.M.; Cui, F.E. Effect of {114} <418> texture on abnormal growth during secondary recrystallization in grain-oriented steel. Acta Metall. Sin. 2015, 51, 769–776. [Google Scholar]


| Nitriding Temperature/°C | 750 | |||||
|---|---|---|---|---|---|---|
| Total Nitrogen Content/% | 0.007 | 0.010 | 0.012 | 0.014 | 0.017 | 0.023 |
| Microstructure |  |  |  |  |  |  |
| Nitriding Temperature/°C | 900 | |||||
| Total Nitrogen Content/% | 0.008 | 0.010 | 0.012 | 0.016 | 0.020 | 0.024 |
| Microstructure |  |  |  |  | 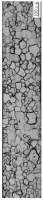 | 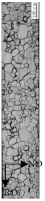 |
| Nitriding Temperature/°C | 750 | |||||
|---|---|---|---|---|---|---|
| Total Nitrogen Content/% | 0.007 | 0.010 | 0.012 | 0.014 | 0.017 | 0.023 |
 |  |  |  |  |  |  |
| Texture level |  |  |  |  |  |  |
| Nitriding Temperature/°C | 900 | |||||
| Total Nitrogen Content/% | 0.008 | 0.010 | 0.012 | 0.016 | 0.020 | 0.024 |
 |  |  |  |  |  |  |
| Texture level |  |  |  |  |  |  |
| Nitriding Temperature/°C | Total Nitrogen Content/% | Distribution of Specified Orientation Grains (the Misorientation Angle is 10°) |
|---|---|---|
| 750 | 0.007 | 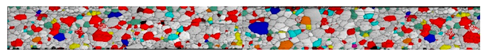 |
| 0.010 | 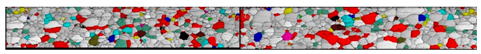 | |
| 0.012 |  | |
| 0.014 |  | |
| 0.017 |  | |
| 0.023 | 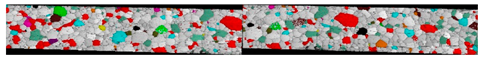 | |
| 850 | 0.0074 | 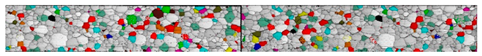 |
| 0.011 | 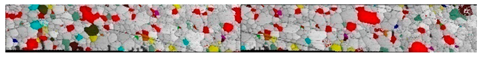 | |
| 0.015 |  | |
| 0.021 |  | |
| 0.026 | 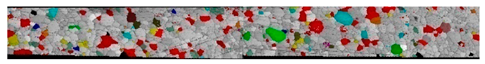 | |
| 950 | 0.0092 | 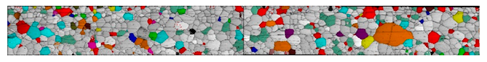 |
| 0.011 |  | |
| 0.013 | 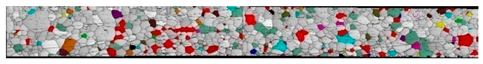 | |
| 0.015 |  | |
| 0.026 |  | |
 |  |
Publisher’s Note: MDPI stays neutral with regard to jurisdictional claims in published maps and institutional affiliations. |
© 2021 by the authors. Licensee MDPI, Basel, Switzerland. This article is an open access article distributed under the terms and conditions of the Creative Commons Attribution (CC BY) license (http://creativecommons.org/licenses/by/4.0/).
Share and Cite
Fu, B.; Xiang, L.; Qiao, J.-L.; Wang, H.-J.; Liu, J.; Qiu, S.-T. Primary Recrystallization Behaviors of Hi-B Steel with Lower Initial Nitrogen Produced by the Thin Slab Casting and Rolling Process. Metals 2021, 11, 189. https://doi.org/10.3390/met11020189
Fu B, Xiang L, Qiao J-L, Wang H-J, Liu J, Qiu S-T. Primary Recrystallization Behaviors of Hi-B Steel with Lower Initial Nitrogen Produced by the Thin Slab Casting and Rolling Process. Metals. 2021; 11(2):189. https://doi.org/10.3390/met11020189
Chicago/Turabian StyleFu, Bing, Li Xiang, Jia-Long Qiao, Hai-Jun Wang, Jing Liu, and Sheng-Tao Qiu. 2021. "Primary Recrystallization Behaviors of Hi-B Steel with Lower Initial Nitrogen Produced by the Thin Slab Casting and Rolling Process" Metals 11, no. 2: 189. https://doi.org/10.3390/met11020189
APA StyleFu, B., Xiang, L., Qiao, J.-L., Wang, H.-J., Liu, J., & Qiu, S.-T. (2021). Primary Recrystallization Behaviors of Hi-B Steel with Lower Initial Nitrogen Produced by the Thin Slab Casting and Rolling Process. Metals, 11(2), 189. https://doi.org/10.3390/met11020189