Article

The Effect of Drawing Deformation Rate Induced Inhomogeneous Local Distortion on Phase Transformation of 304H Stainless Wire

1
Jiangyin Fasten Hopesun Stainless Steel Products Co. Ltd., Jiangyin 214400, China
2
The State Key Laboratory of Refractories and Metallurgy, Wuhan University of Science and Technology, Wuhan 430081, China
*
Authors to whom correspondence should be addressed.
Metals 2020, 10(10), 1304; https://doi.org/10.3390/met10101304
Submission received: 5 August 2020 / Revised: 7 September 2020 / Accepted: 21 September 2020 / Published: 29 September 2020

Abstract

:
The micro/macro magnetic properties, local element distribution, martensite transformation, and mechanical properties of 304H stainless wires are determined for two cold drawing chains. Finite element simulations are used to analyse the local strain and heat generation. The results show that there is obvious inhomogeneity in the magnetic properties, strain/stress relationship, and strain-induced heat within the drawn wires. Comparing wires with the same total strain, a larger area reduction of previous drawing processes contributes to a higher volume of the martensite phase, while a smaller area reduction of the first process results in an inhibited phase transformation. A higher single strain in the first drawing process leads to additional heat generation at the subsurface of the wire, which would eventually retard the martensite transformation. The inhomogeneous deformation-induced differences in the grain size affect the stability of austenite and transform the final martensite.

1. Introduction

Austenite series stainless steel wires have earned a reputation for their outstanding corrosion resistance, weldability, and good mechanical properties and surface finish that have made them widely applicable in the petroleum industry, chemical instrumentation, and nuclear engineering [1]. Cold drawing is the most common wire processing technology and results in refined and fiberized austenite phases due to dramatic deformations. However, the relatively low stacking fault energy of austenite allows martensite transformations due to cold drawing [2,3]. The existence of martensite may cause the assembly to deviate or some other unexpected situations to occur due to its magnetic properties. Therefore, it is important to perform both theoretical and production research on the regular deformation-induced martensite (DIM) transformation.
The factors that affect the metastable austenite phase transformation are the chemical composition, microstructure, temperature, stress/strain characteristics, and their combination [4]. The martensite transformation criteria rely on the stacking fault energy (SFE) of austenite and the phase transformation temperature of martensite Ms [5]. Several works have reported that the low SFE (<20 mJ/m2) favours the phase transformation from austenitic to martensitic (ε- or α’-martensitic transformations). Moderate SFE (20–45 mJ/m2) yield deformations through twinning mechanisms, which leads to twinning-induced plasticity (TWIP) [6,7,8]. Zhang et al. [9] applied the Mossbauer spectrum method and found that when there are high contents of carbon and carbide-forming elements, a larger driving force is needed for DIM. Lee et al. [10] studied DIM of Fe–18Cr–10Mn–N austenite steel and concluded that a higher nitrogen content could inhibit the DIM. Furthermore, DIM is eliminated at nitrogen concentrations above 0.5 wt%.
In addition, the grain size of austenite (and other factors) can significantly influence SFE. Kisko et al. [11] demonstrated that when the grain size is larger than 1.5 μm, the strain-induced martensitic transformation rate decreases for smaller grain sizes. Shin et al. [12] discussed the relationship between the strain rate and DIM to show that the volume ratio of martensite is positively related to the strain. A higher strain rate produces more fault intersections in austenite grains, which increases the number of nucleation sites of martensite and promotes the transformation of α’-martensite [13,14,15]. Nakada et al. [16] studied the content of DIM in 316L austenitic stainless steel after cold drawing. They found that there is a significantly greater volume fraction of martensite produced by cold drawing compared with cold rolling due to the differences in the deformation mode and the number of martensite nucleation sites.
Jayahari et al. [17] compared the DIM for ASS-304 stainless steel under different temperatures and strain rates. They concluded that higher deforming temperatures suppress the martensite transformation. In addition, the amount of transformed martensite first increases before decreasing with the deformation rate. However, the complexity of the cold drawing process necessitates more detailed information about the microscale deformation of wires. Pouyan et al. [18] reported that there are significant differences between the axis and subsurface of drawn wires. Therefore, a relationship is found between the configuration of the drawing pass deformation rate and the local uneven deformation in the steel wire, while the final martensitic phase variable and magnetic properties need further exploration.
This paper took 304H austenitic stainless steel wire to determine the influence of the drawing strain on the martensitic transformation in the microzone of austenitic stainless steel. Two drawing chains were designed with the same total strain and number of passes but different pass strain rates. The phase and mechanical properties of steel wire were studied using metallographic microscopy, field emission scanning electron microscopy (SEM), energy dispersive spectrometry, X-ray diffraction (XRD), and a mechanical testing machine. The macro/micro magnetic properties of drawn steel wires were analysed using a magnetic flux-meter and magnetic force microscope (MFM). The non-uniform deformation characteristics of drawn steel wires were analysed via the finite element method (FEM) with the ABAQUS software (2018, Dassault, Paris, France). The effects of the pass strain rate on martensitic transformations in stainless steel wires were discussed.

2. Materials and Methods

The commercial 304H stainless steel wire was selected with a chemical composition as shown in Table 1. The area reduction (AR) is defined as [19]:
A R = A i 1 A i A i 1 × 100 %
where Ai−1 is the cross-sectional area before the drawing sequence i and Ai is the cross-sectional area after the drawing sequence i.
The true strain ε is defined as [19,20]:
ε = 2 ln ( d 0 d i )
where d0 is the diameter of the base wire and di is the diameter of the wire after the drawing sequence i. The double-process drawing procedures with different single area reductions were conducted on the same wire. The drawing die was made of synthetic diamond with an equipped water-cooling device. At the beginning of the drawing procedures, the base wire was solution-treated at 1100 °C for 1 min. The wire was then air-cooled and submerged in an isothermal cleaning solution before drawing. The wire moving speed remained at 50 m/min. The actual strain, AR, diameter of each wire, and detected temperature (laser thermometer) are given in Table 2.
The cross-sections of each wire were mechanically flattened and polished before etching with a 1.5 wt% CuCl2 solution. The microstructure and radial elemental distribution on the wire cross-sections were observed using optical microscopy, field emission scanning electron microscopy (SEM, FEI Nova 400), and energy dispersive spectrometry (EDS). A Bruker D8-ADVANCE XRD system was used for the phase analysis, and a LAKE SHORE 480 magnetic meter determined the saturation magnetization Ms. The tensile properties of the drawn wires were tested on an INSTRON 8801 series machine equipped with a BLUEHILL module. The microstructures of the drawn steel wire cross-sections were characterised using the tapping mode of a 5500 atomic force microscope (AFM, Agilent) and a Co-Cr coated MFM magnetic probe (<60 nm, NSC18, Coercivity 300–400 Oe).
The local deformation and deformation heat of the steel wires during drawing were analysed in ABAQUS. The two-dimensional axisymmetric model was adopted, the drawing die was constrained as a rigid body, the steel wires adopted an elastic-plastic model, and the steel wires and die were treated as hourglass elements with a reduced integral form (CAX4RT). For the input parameters, the Young’s modulus of the wires was 200 GPa, Poison’s ratio was 0.3, the wire density was 7890 kg·m−3, the thermal conductibility was 17 W·m−1·K−1 [21], the specific heat capacity was 500 J·kg−1·K−1, and the inelastic coefficient of heat production was 0.9.

3. Results

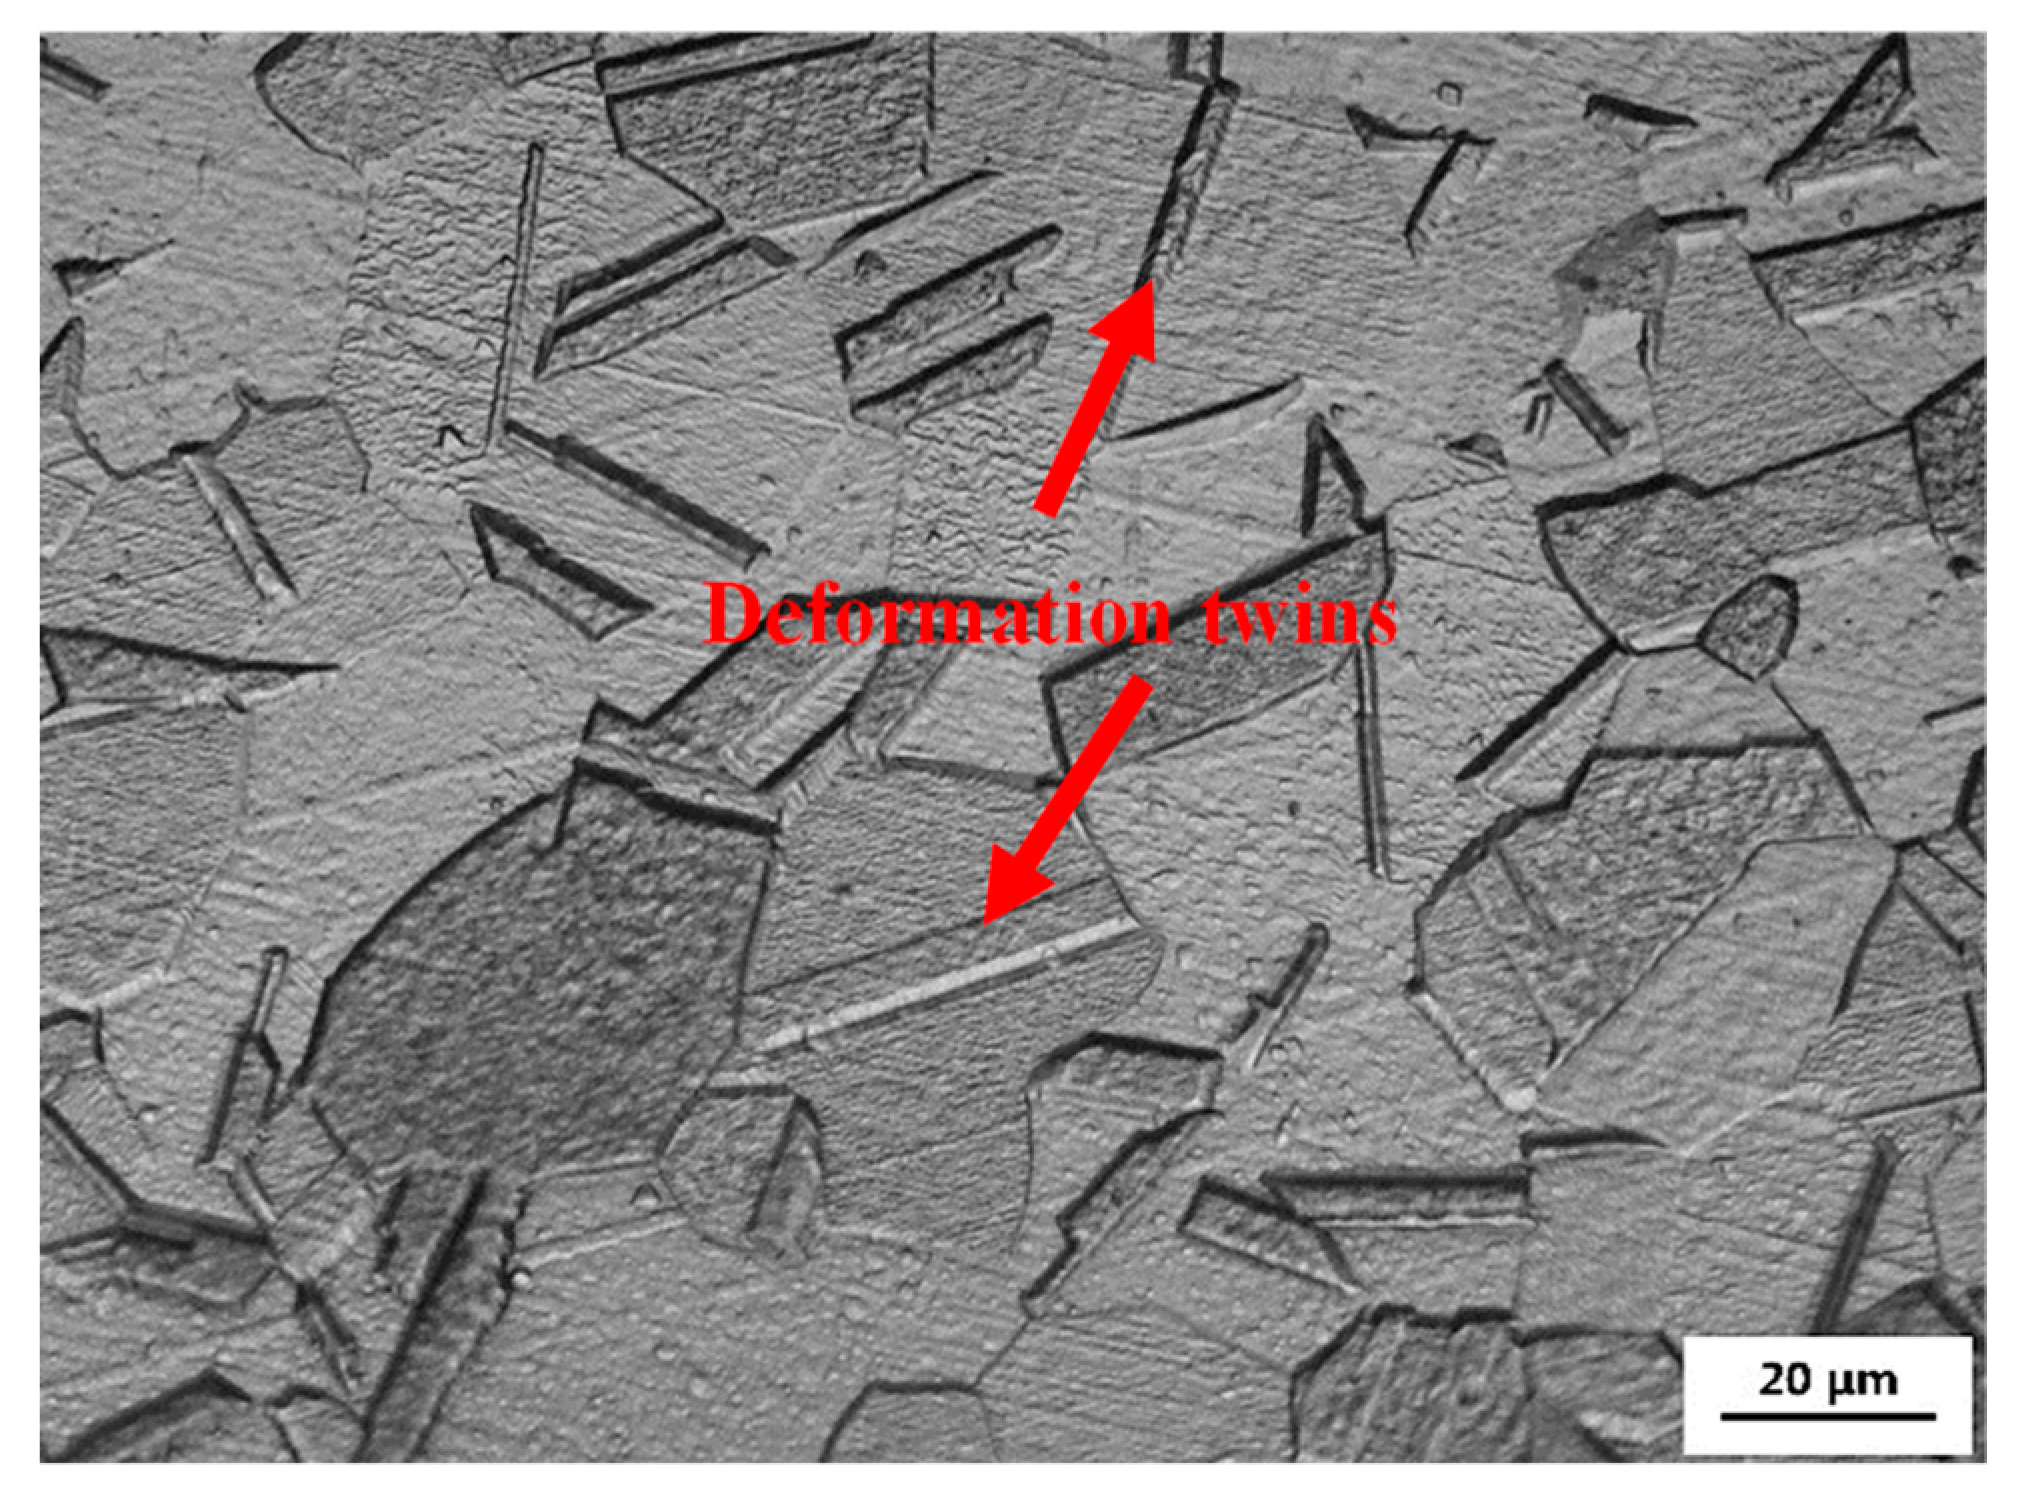
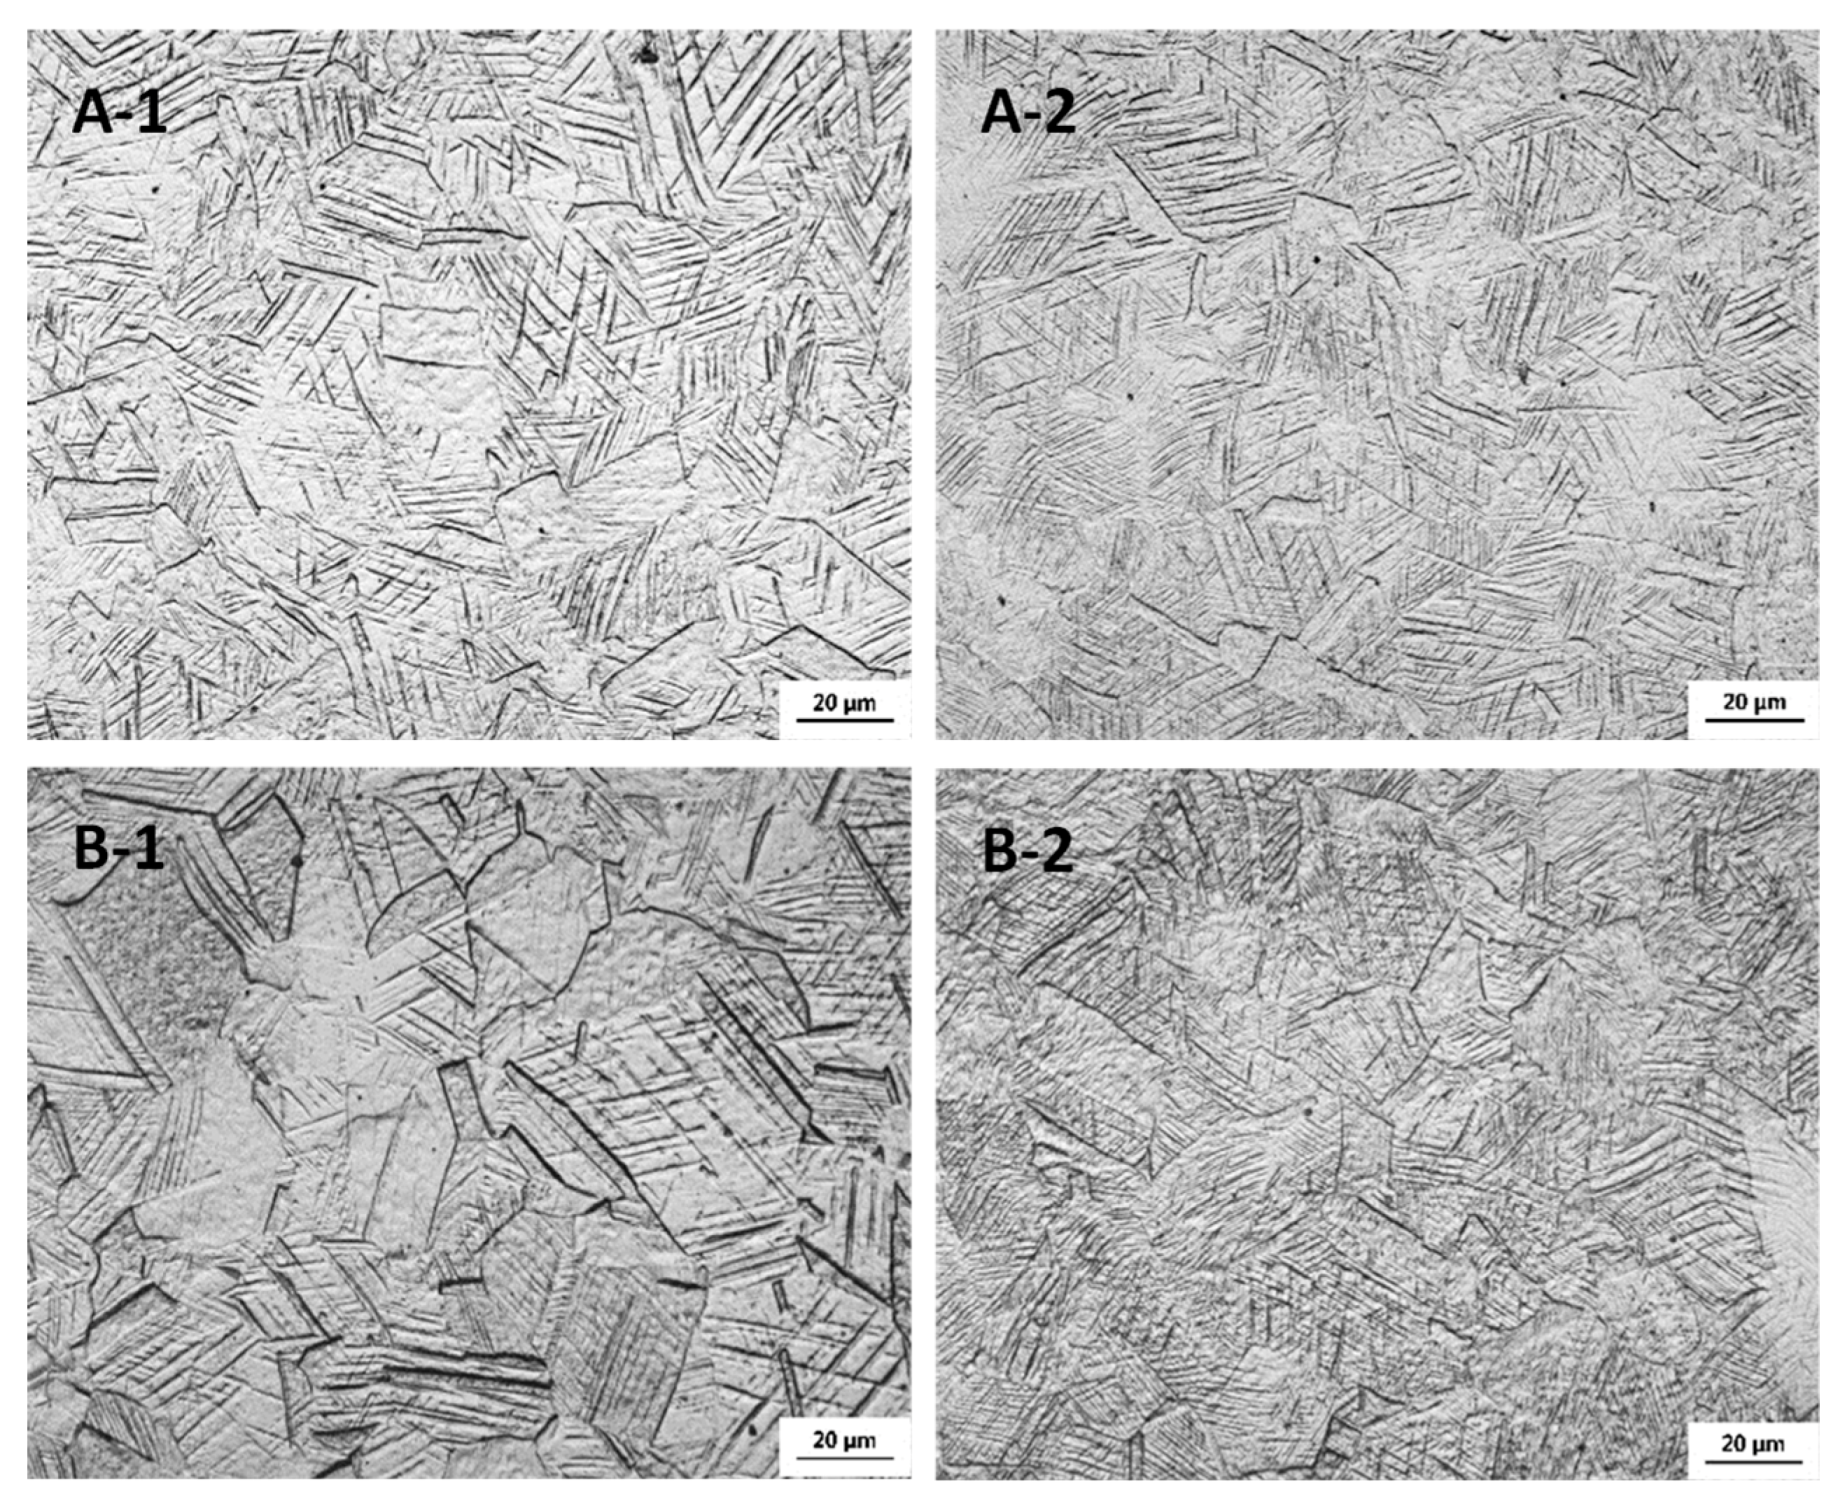
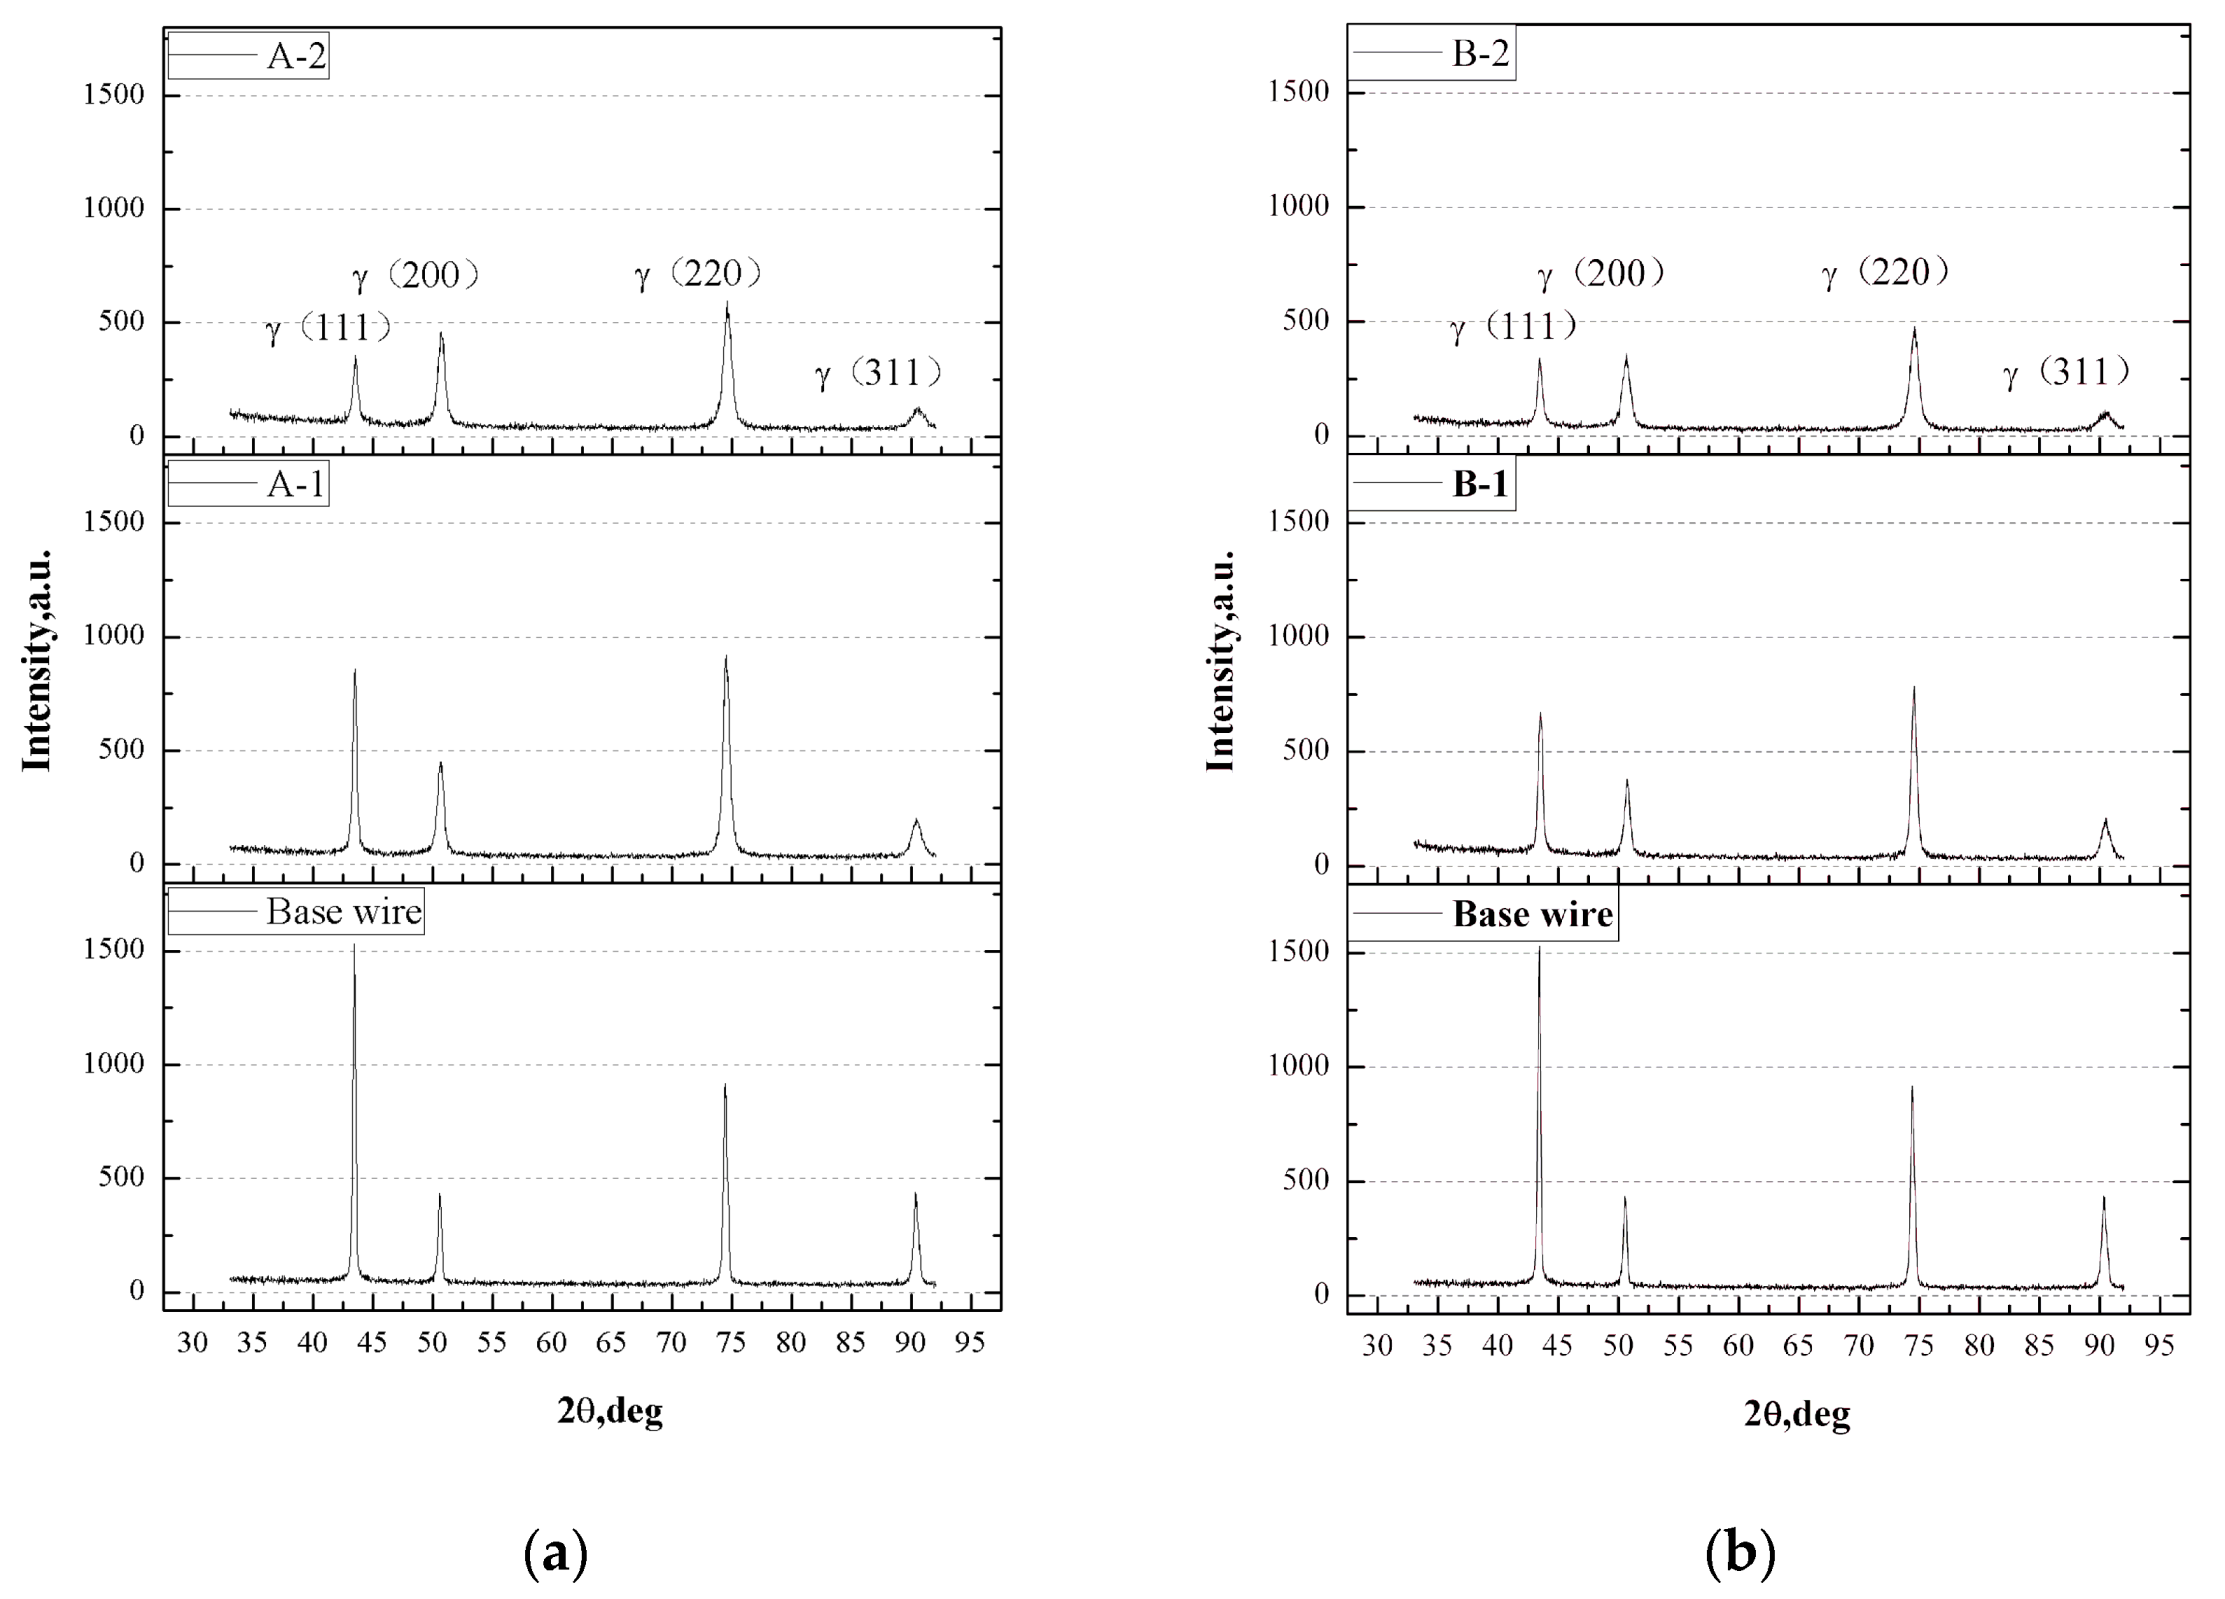
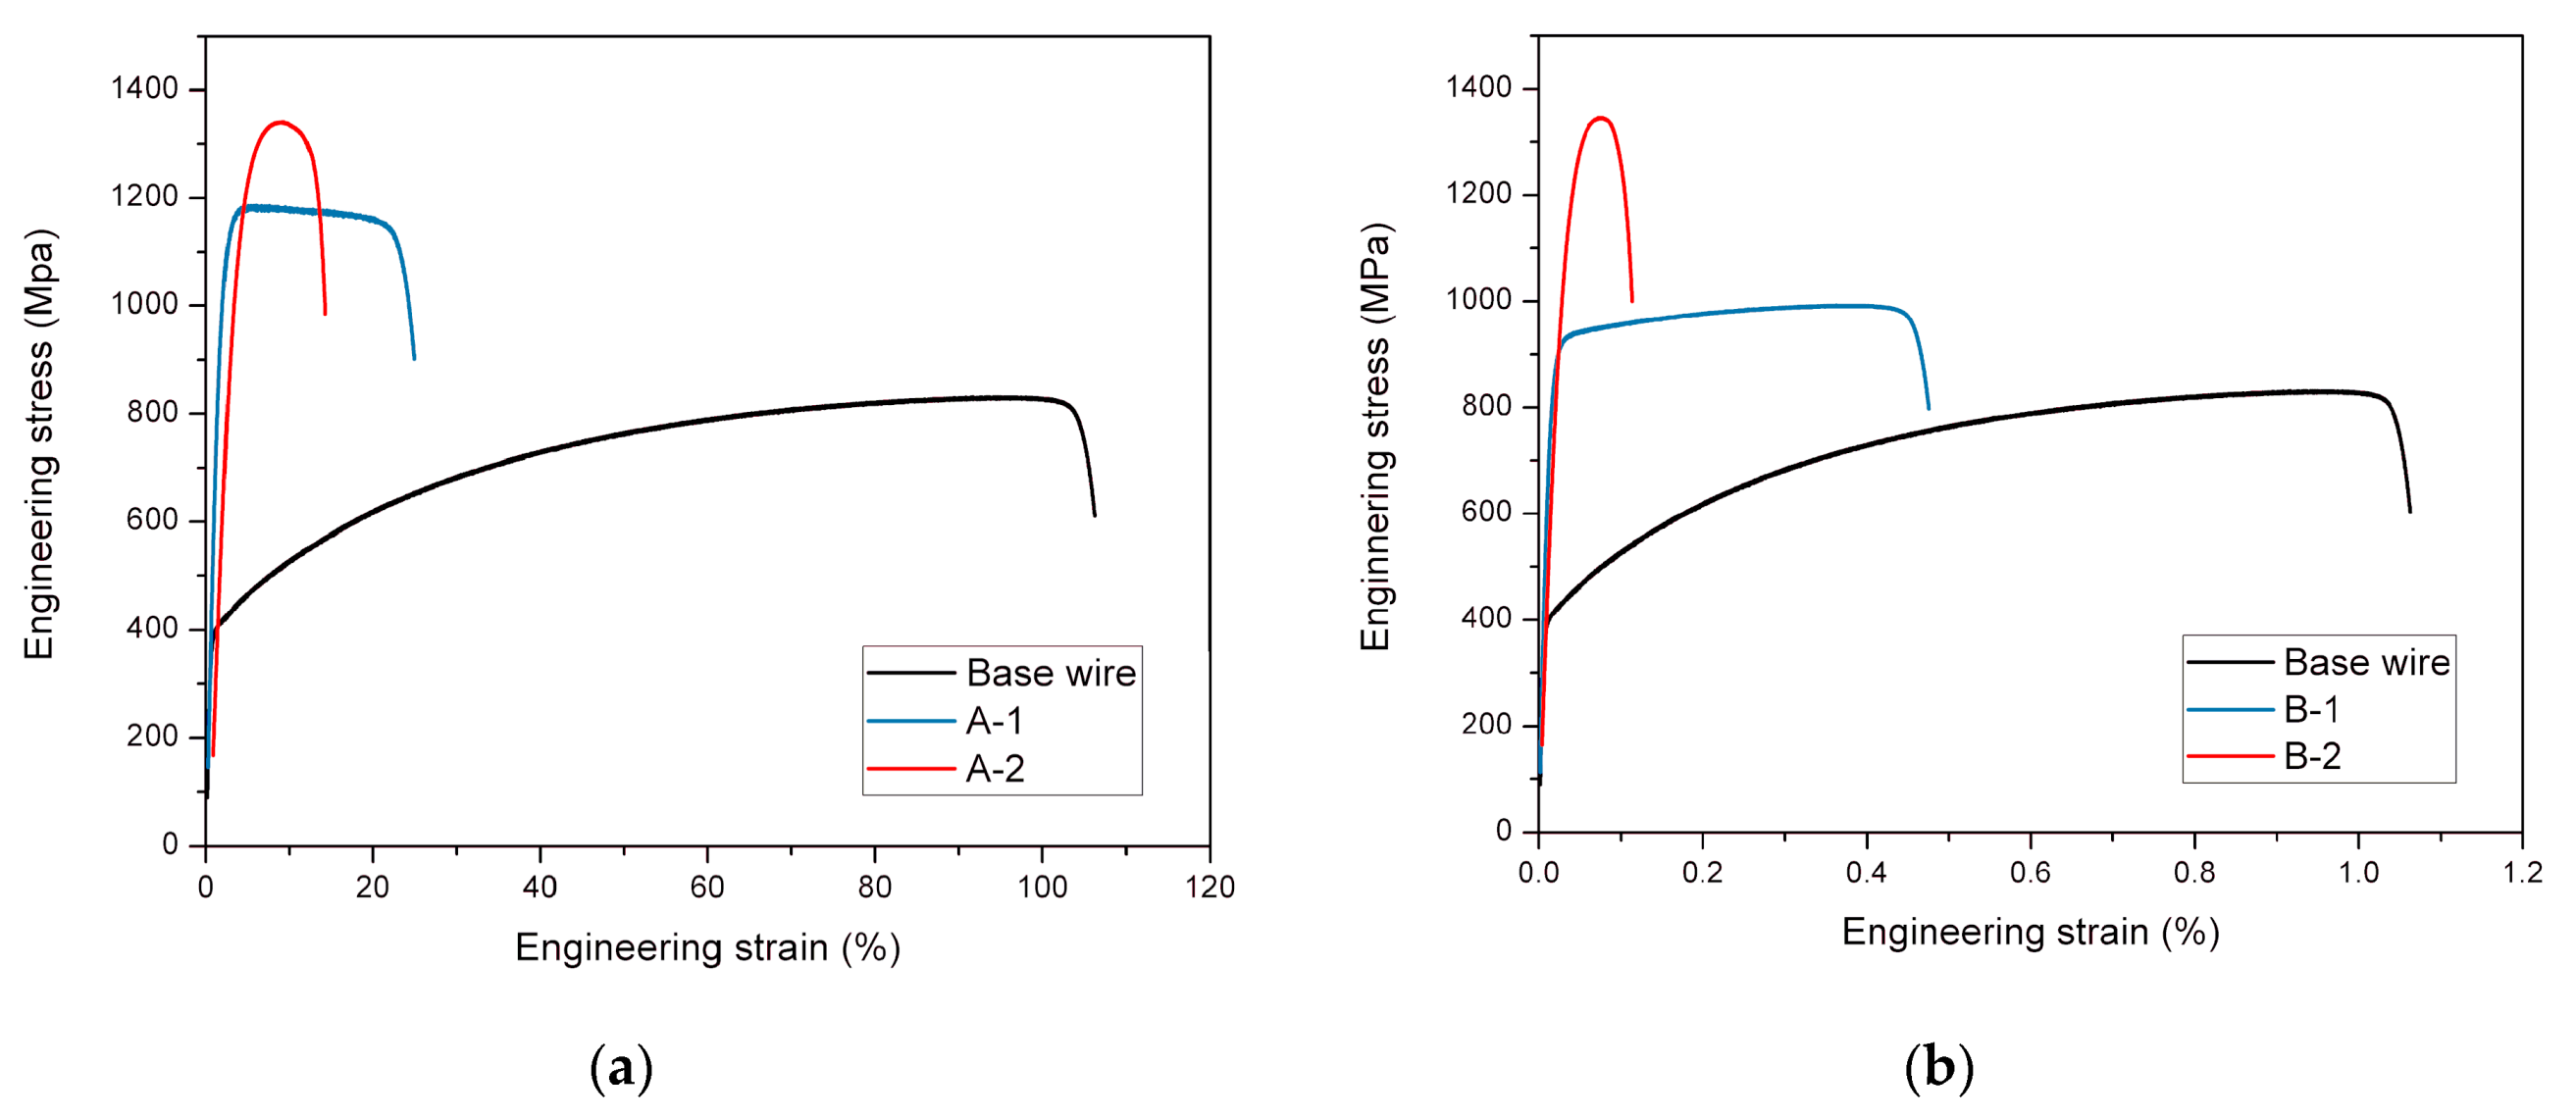
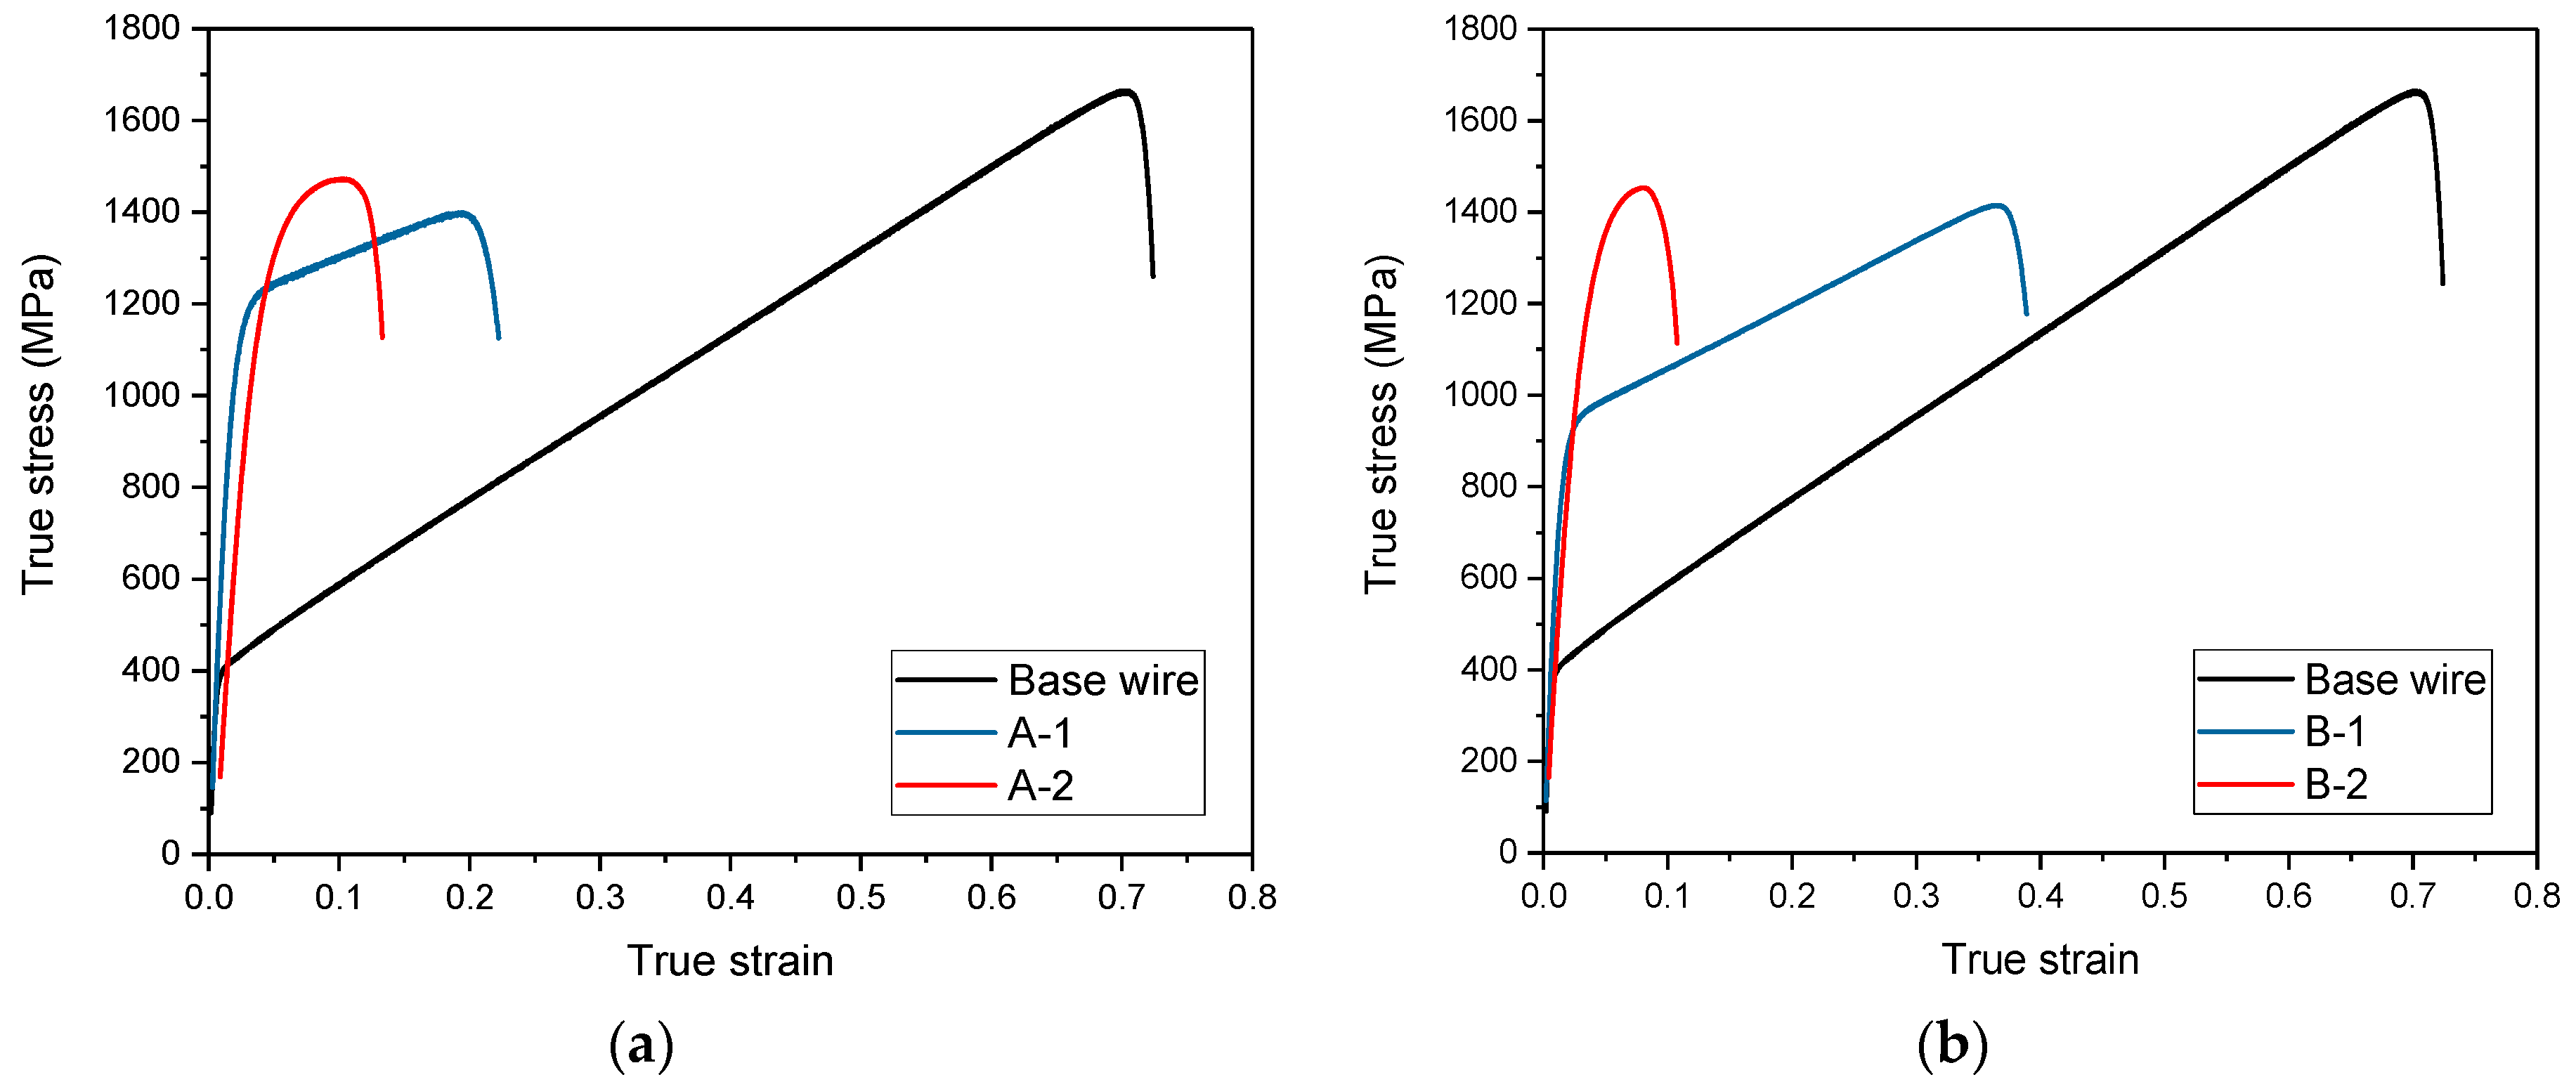
3.1. Microstructure and Mechanical Properties of Steel Wires During Drawing

Figure 1 shows the microstructure of the base wire after the solution treatment. It is seen that the wire consists primarily of austenite with an average size of 32 μm. It is also noted that the twin crystal is inserted in the austenite which formed after solidification. Figure 2 displays the microstructure located at the 1/4 diameter of the wires after different drawing processes. The increased area reduction caused the deformation to become more apparent and the number of deform-induced twin crystals increased in both drawing chains. Specifically, after a one-time drawing pass, the output wire A-1 presented significantly narrowed and proliferated deformation twins with an average width of 2.6 μm. After the second drawing pass, the output wire A-2 showed a finer grain width of 0.75 μm. For the drawing chain B, the lower area reduction of the first drawing pass caused undeformed austenite to remain after a certain number of deformation twins, as seen in wire B-1. However, after the second drawing pass, the wire B-2 had a dramatically refined shear band with a mean width of 0.82 μm. Thus, a larger strain creates more and finer deformation twins, and the obtained microstructures of the wires from the two drawing chains vary subtly.
Figure 3 shows the XRD spectrums of the processed wires. The results show that there are four main diffraction peaks amongst all of the tested wires as γ (111), γ (220), γ (311), and γ (200) [22,23]. At larger AR, the intensity of peaks γ (111), γ (311), and γ (220) diminished for both drawing chains. Nonetheless, the intensity of the peak γ (111) for specimen B-1 was larger than that of A-1 after the first pass but was comparable after the second pass. In addition, the intensity of peak γ (220) for drawing chain A was larger than chain B for all passes.
The strength of the wires during the drawing process varied with changes in the area reduction. As shown in Figure 4 and Figure 5, the nominal tensile strengths of the wires in both processes A and B increased for larger AR, which is the same trend as the true tensile stress.
The Hall-Petch formula is σ0.2 = σ0 + kyD1/2 [24,25], where σ0 is the friction stress of the lattice (MPa), ky is the Hall-Petch coefficient (Mpa·mm1/2), and D is the mean grain size (mm). However, it is widely accepted that the rheological stress (or yield strength) of metal is positively related to the square root of the dislocation density [26,27,28], i.e., τ = τf + α · Gbρ1/2, where τf is the frictional coefficient between the moving dislocation and the lattice defect; α is the coefficient related to the material properties, dislocation structure, and distribution; G is the shear modulus of the material; b is the Burgess vector; and ρ is the dislocation density. Meanwhile, wires made from the two drawing chains had similar grain sizes. Thus, it is assumed that the primary reason for changes in the mechanical properties is the refinement of the austenite grains and increased number of dislocations during drawing.

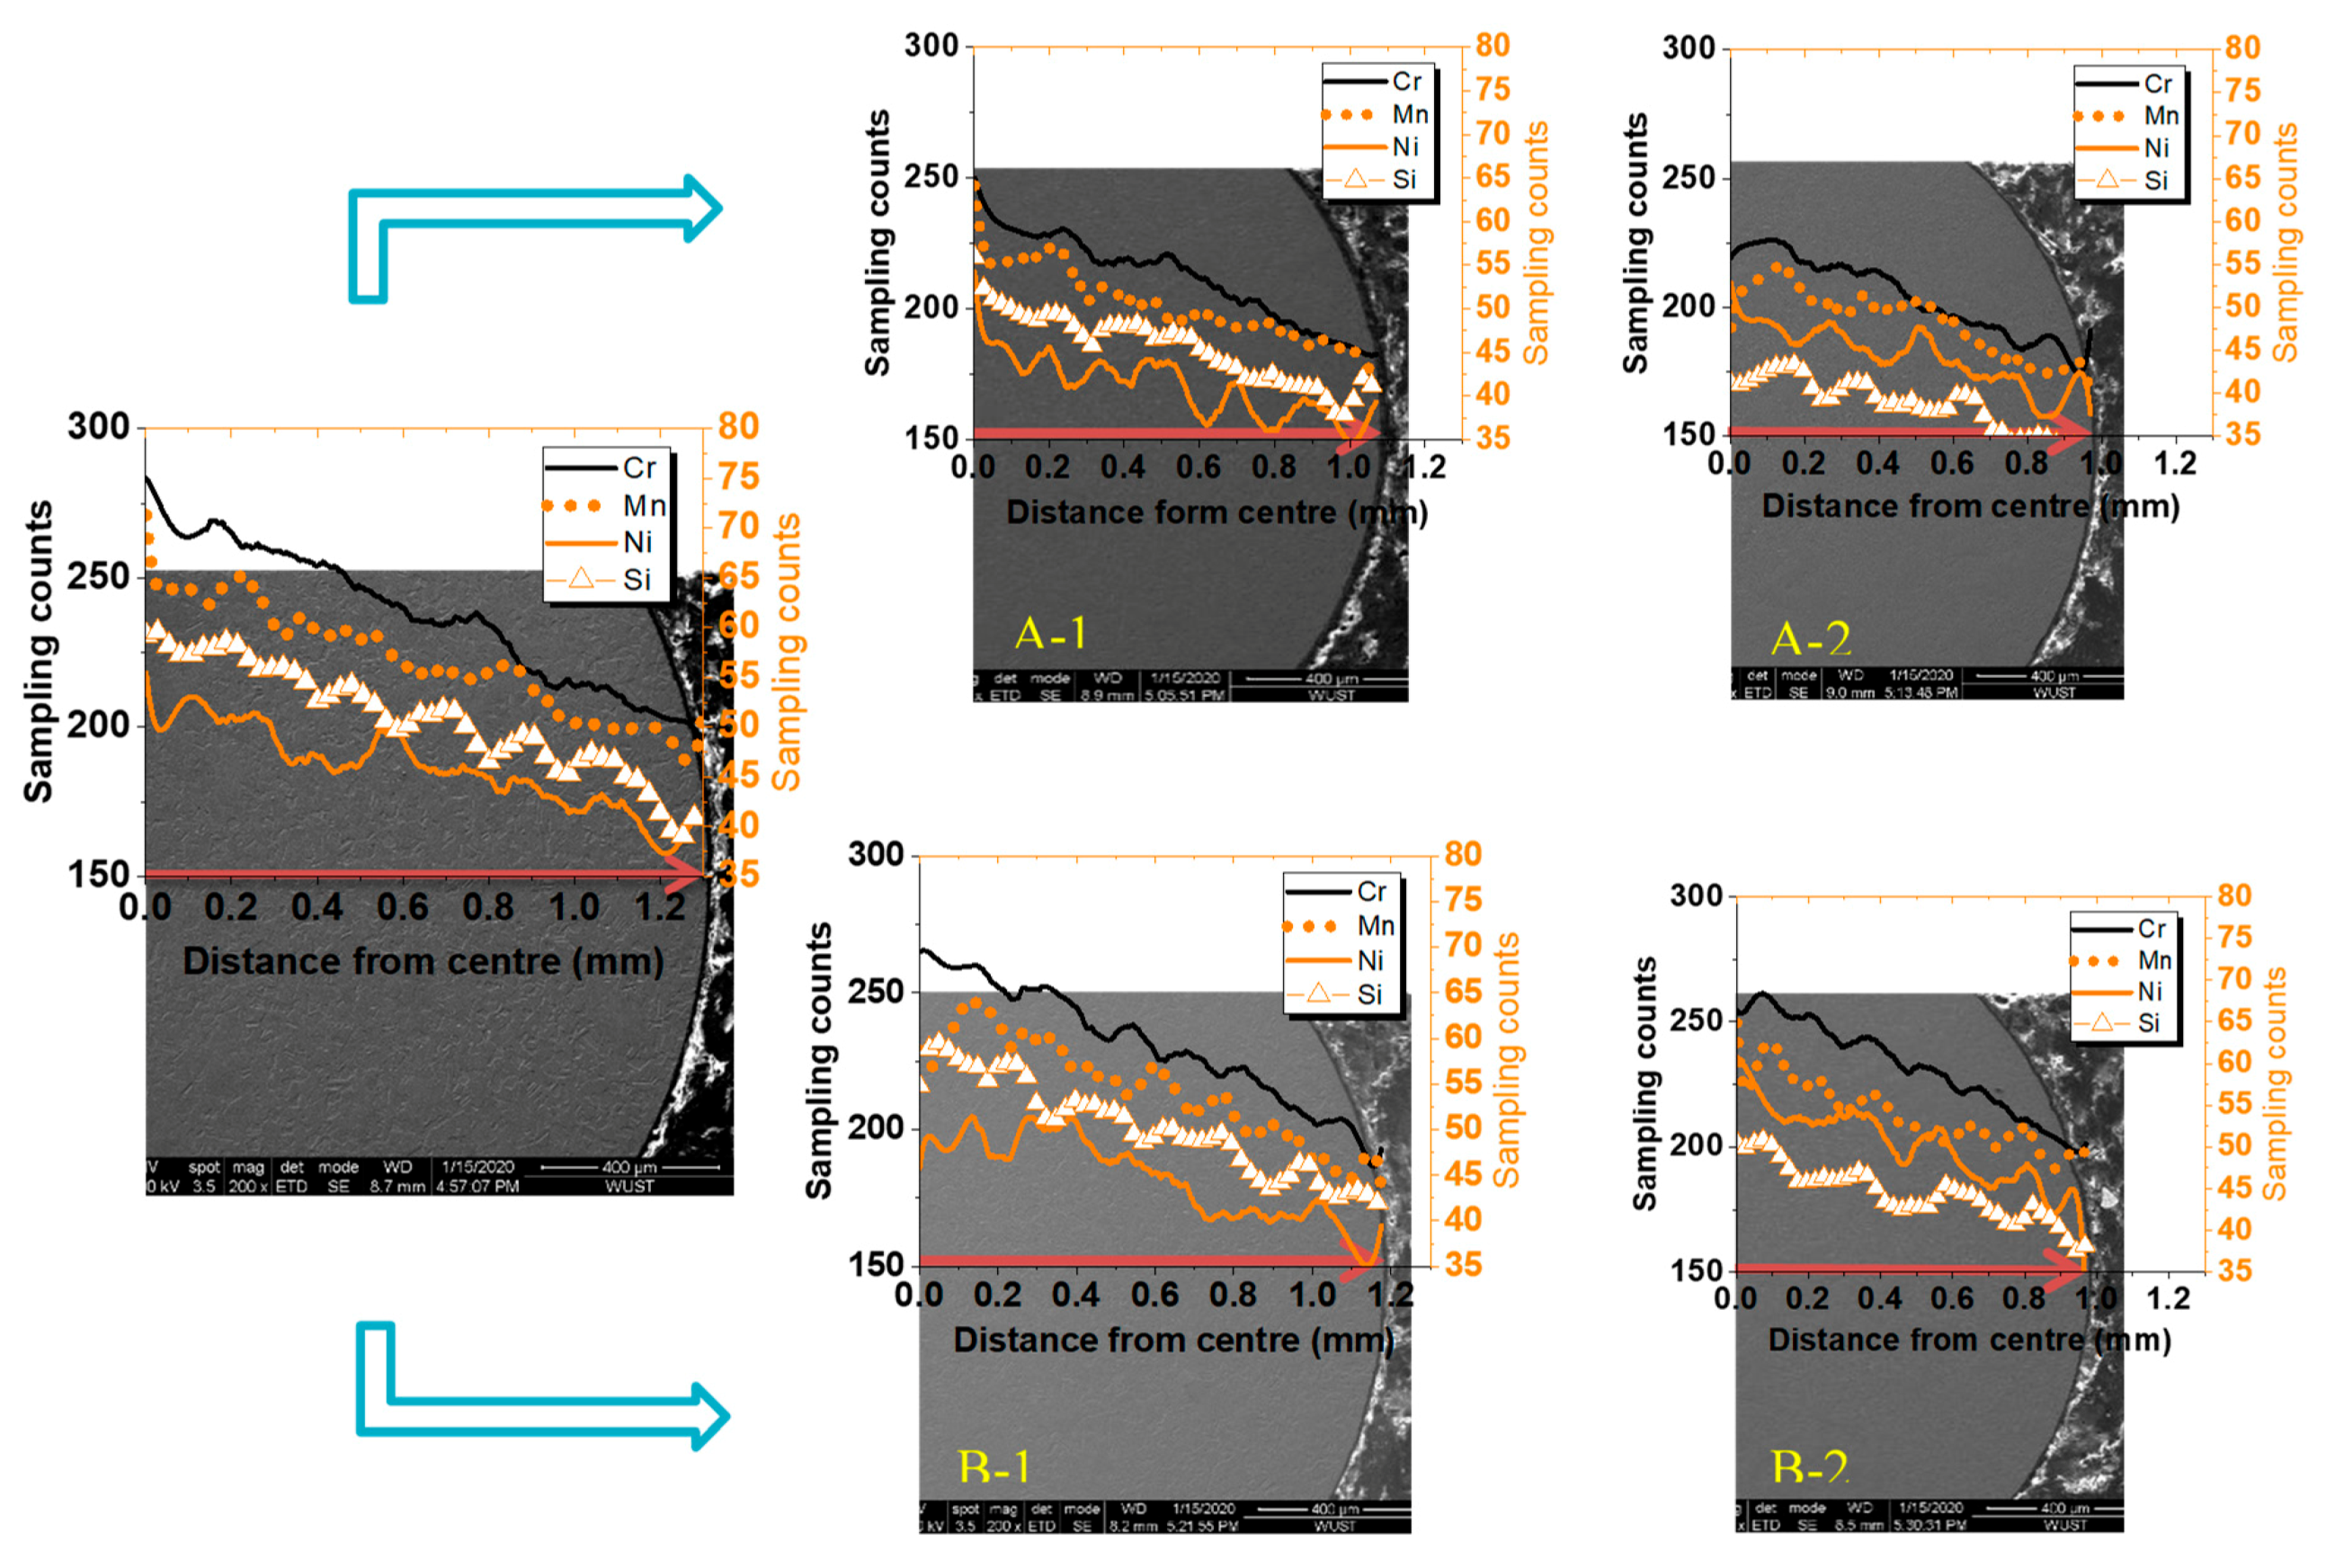
3.2. Elemental Redistribution on Cross-Sections

The cross-sections of the steel wire after drawing were analysed using SEM and EDS, and the distributions of the cross-sectional elements in the drawing process were explored. Figure 6 shows the line scan energy spectrum after smoothing. Table 3 displays the maximum values of the elements corresponding to the centre and the minimum values corresponding to the edge of the samples. The figure indicates that the base materials and the drawn steel wires differed. The concentrations of Cr, Mn, Ni, and Si were unevenly distributed where the contents in the centre were greater than that at the edges. Among the base metal and the four groups of samples after drawing, the largest difference between the centre and edge elements was in the B-1 sample.

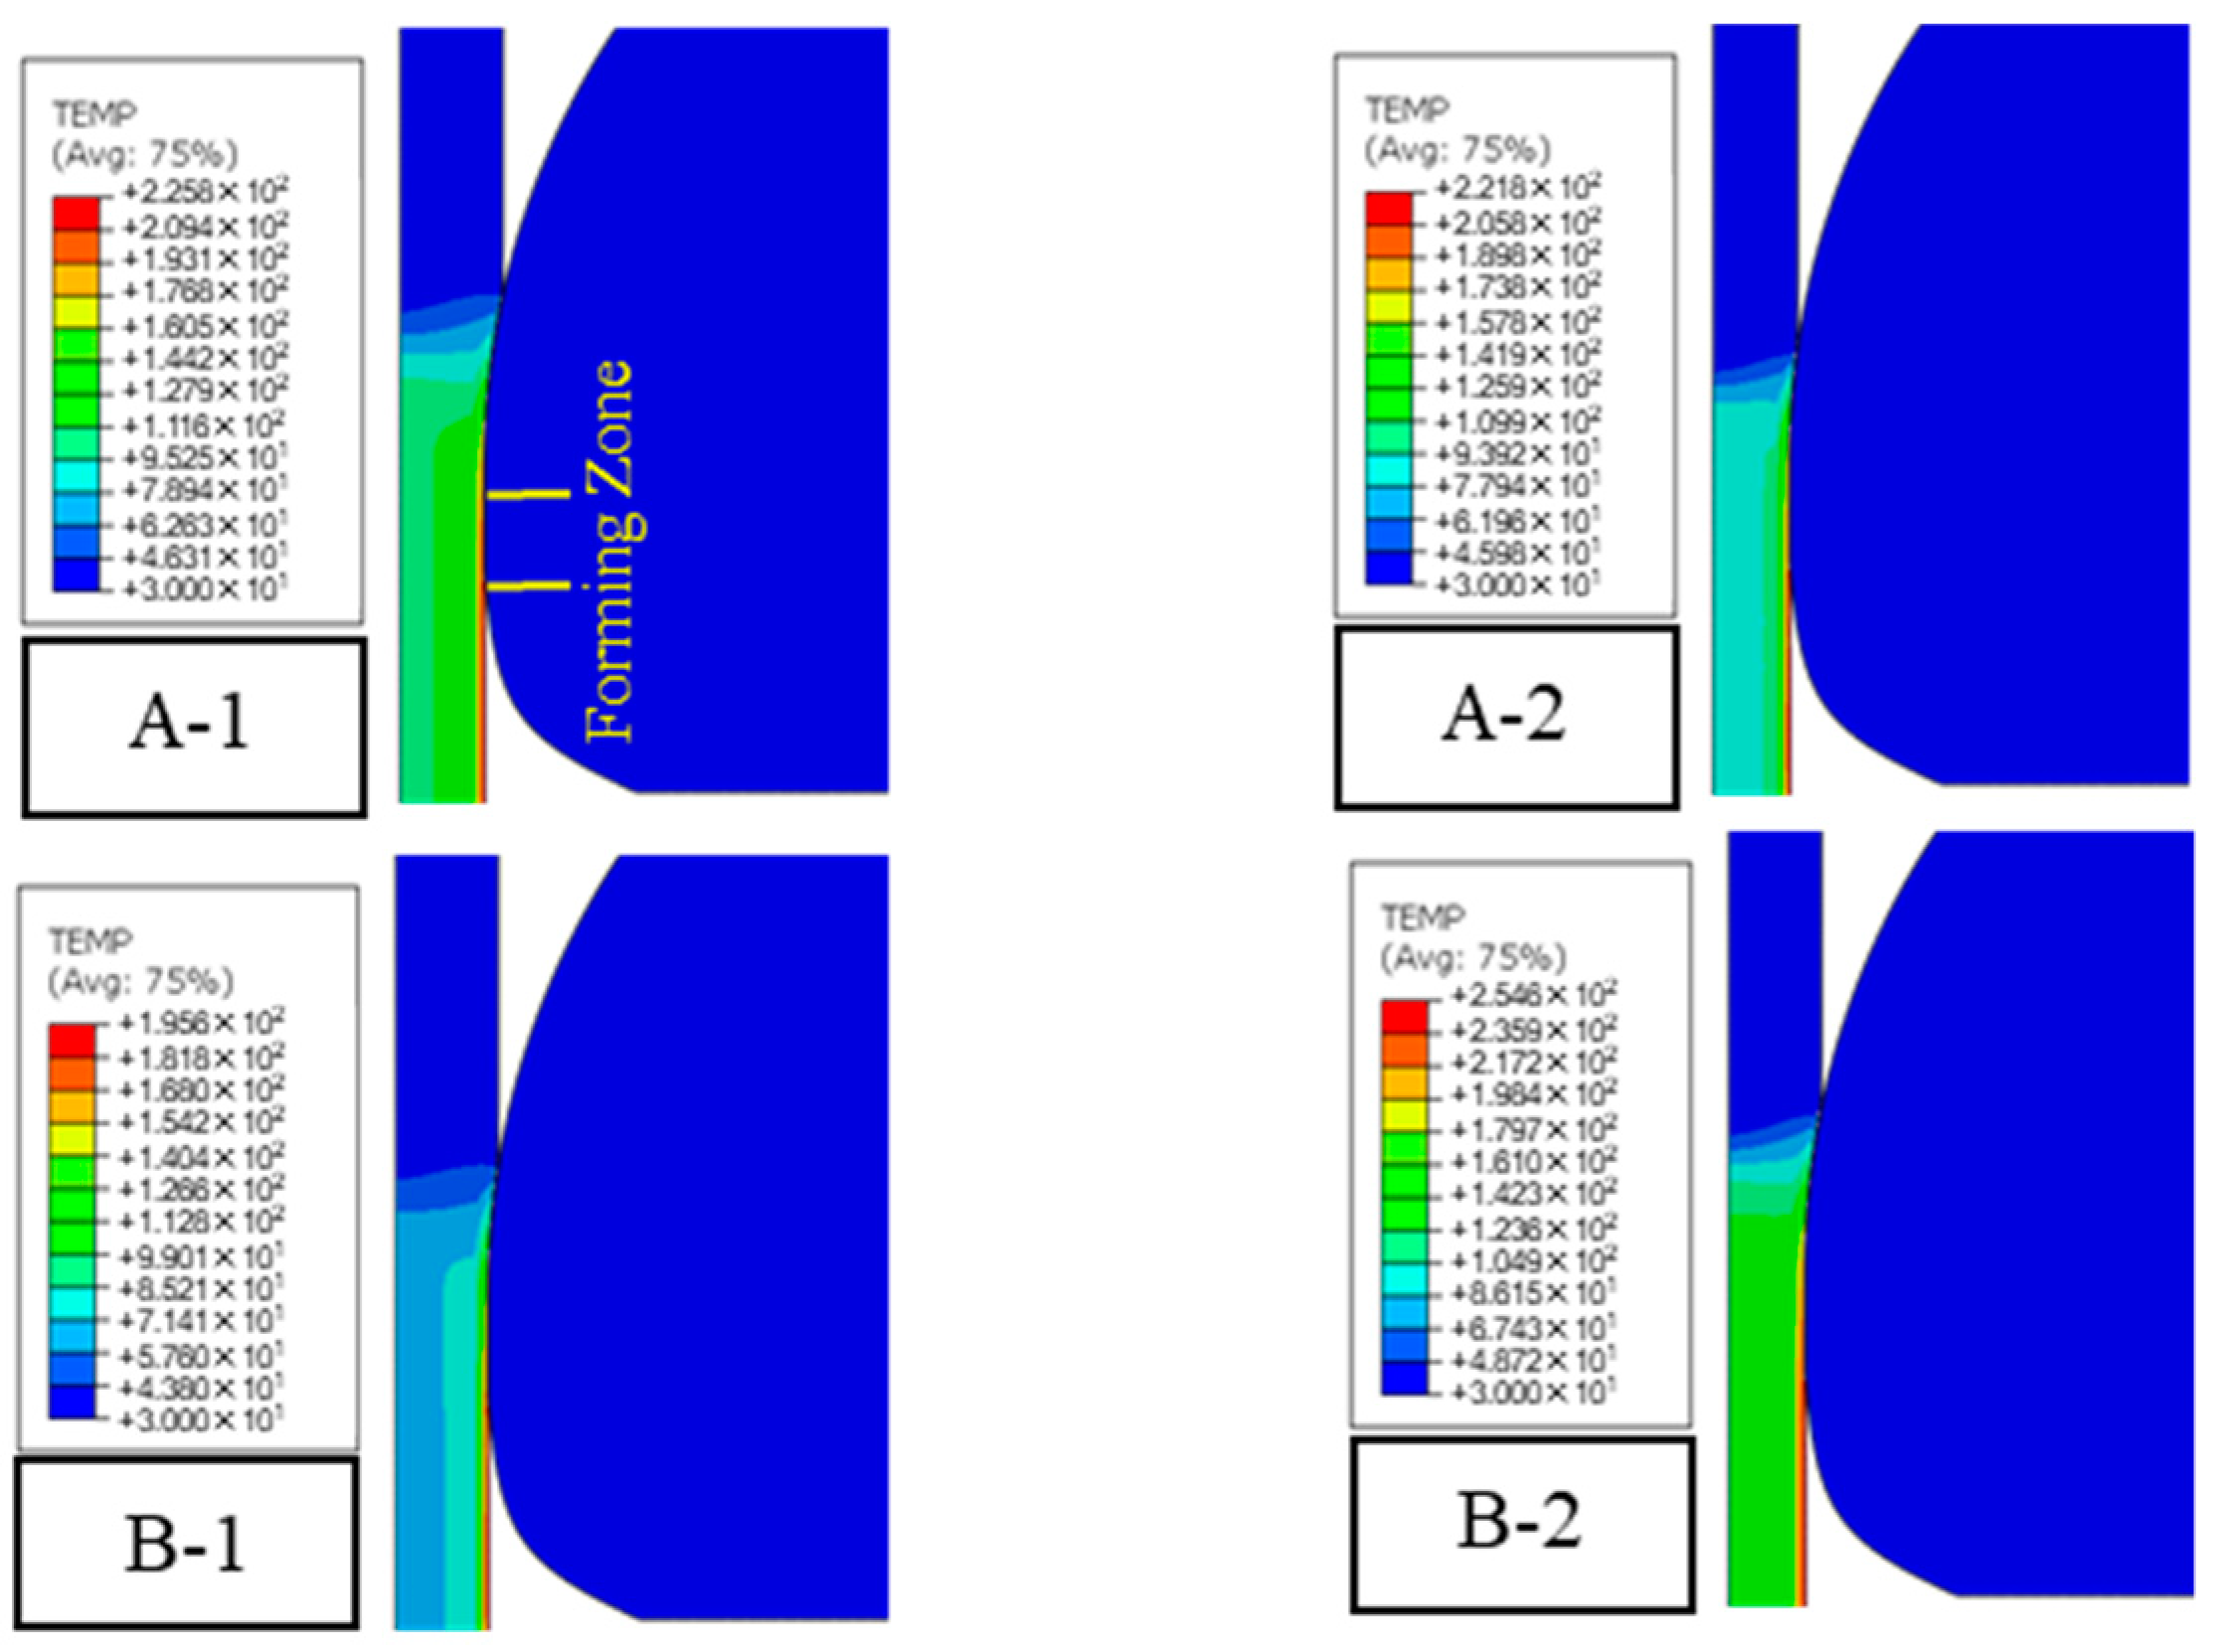
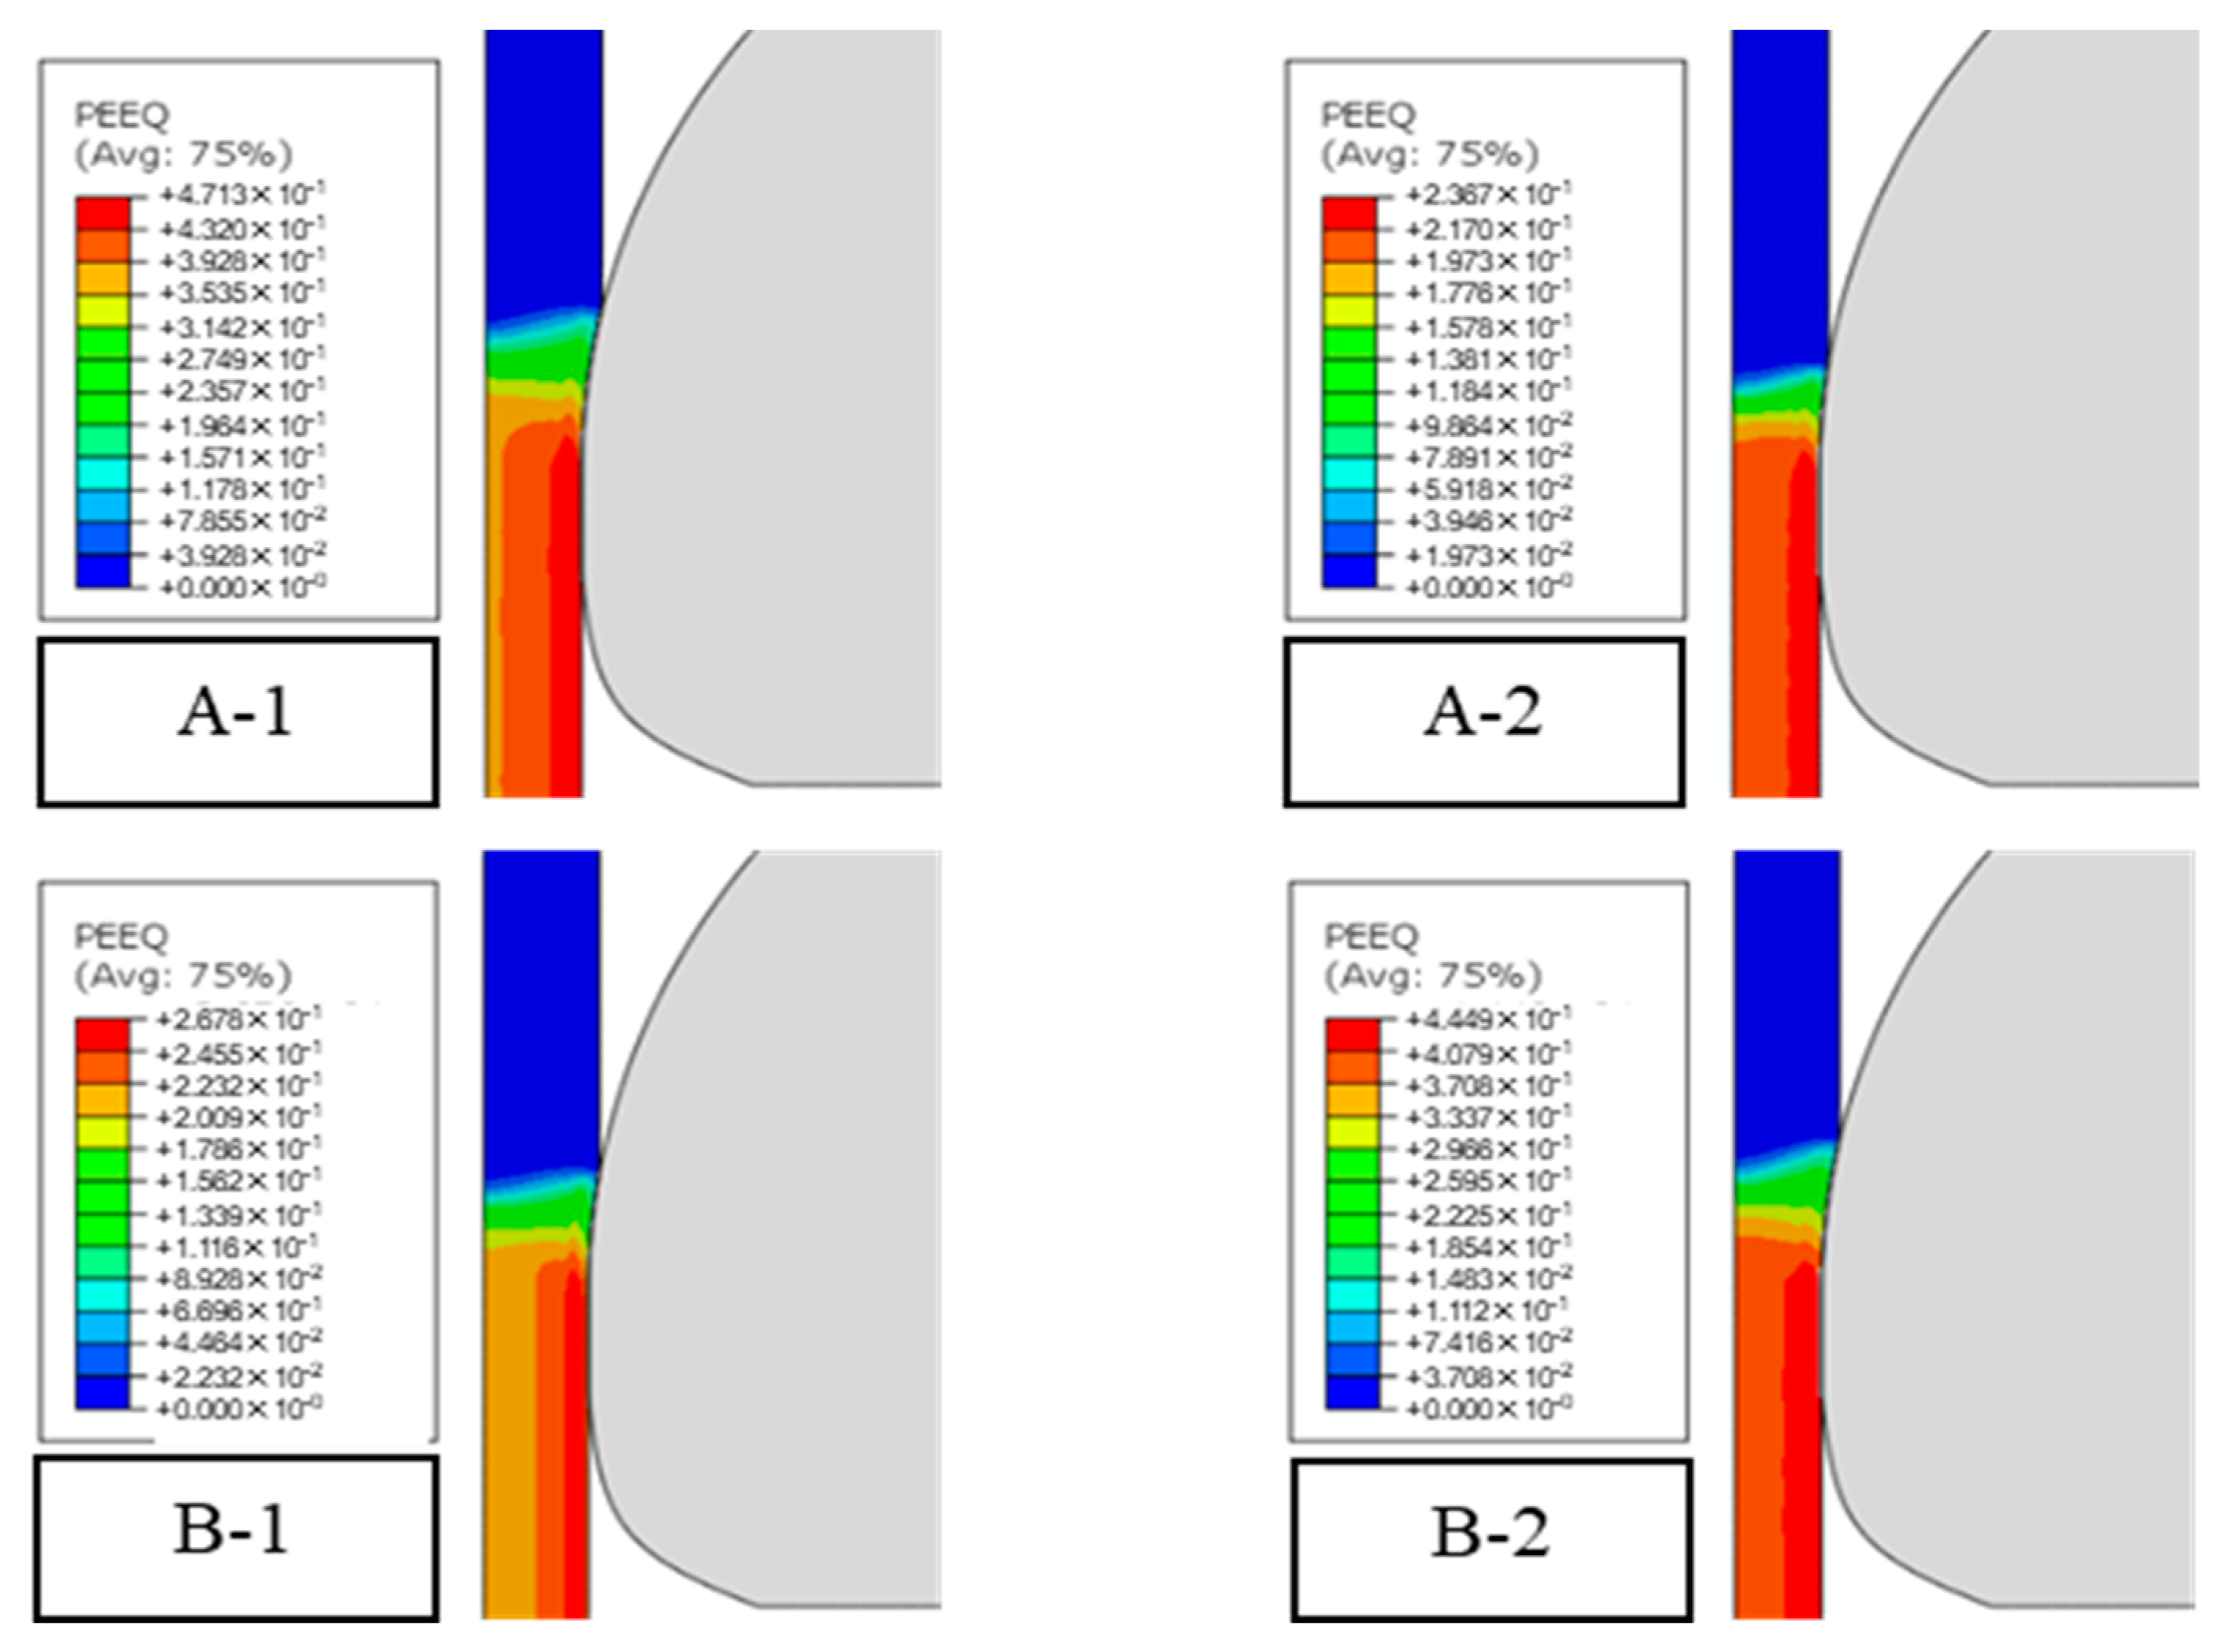
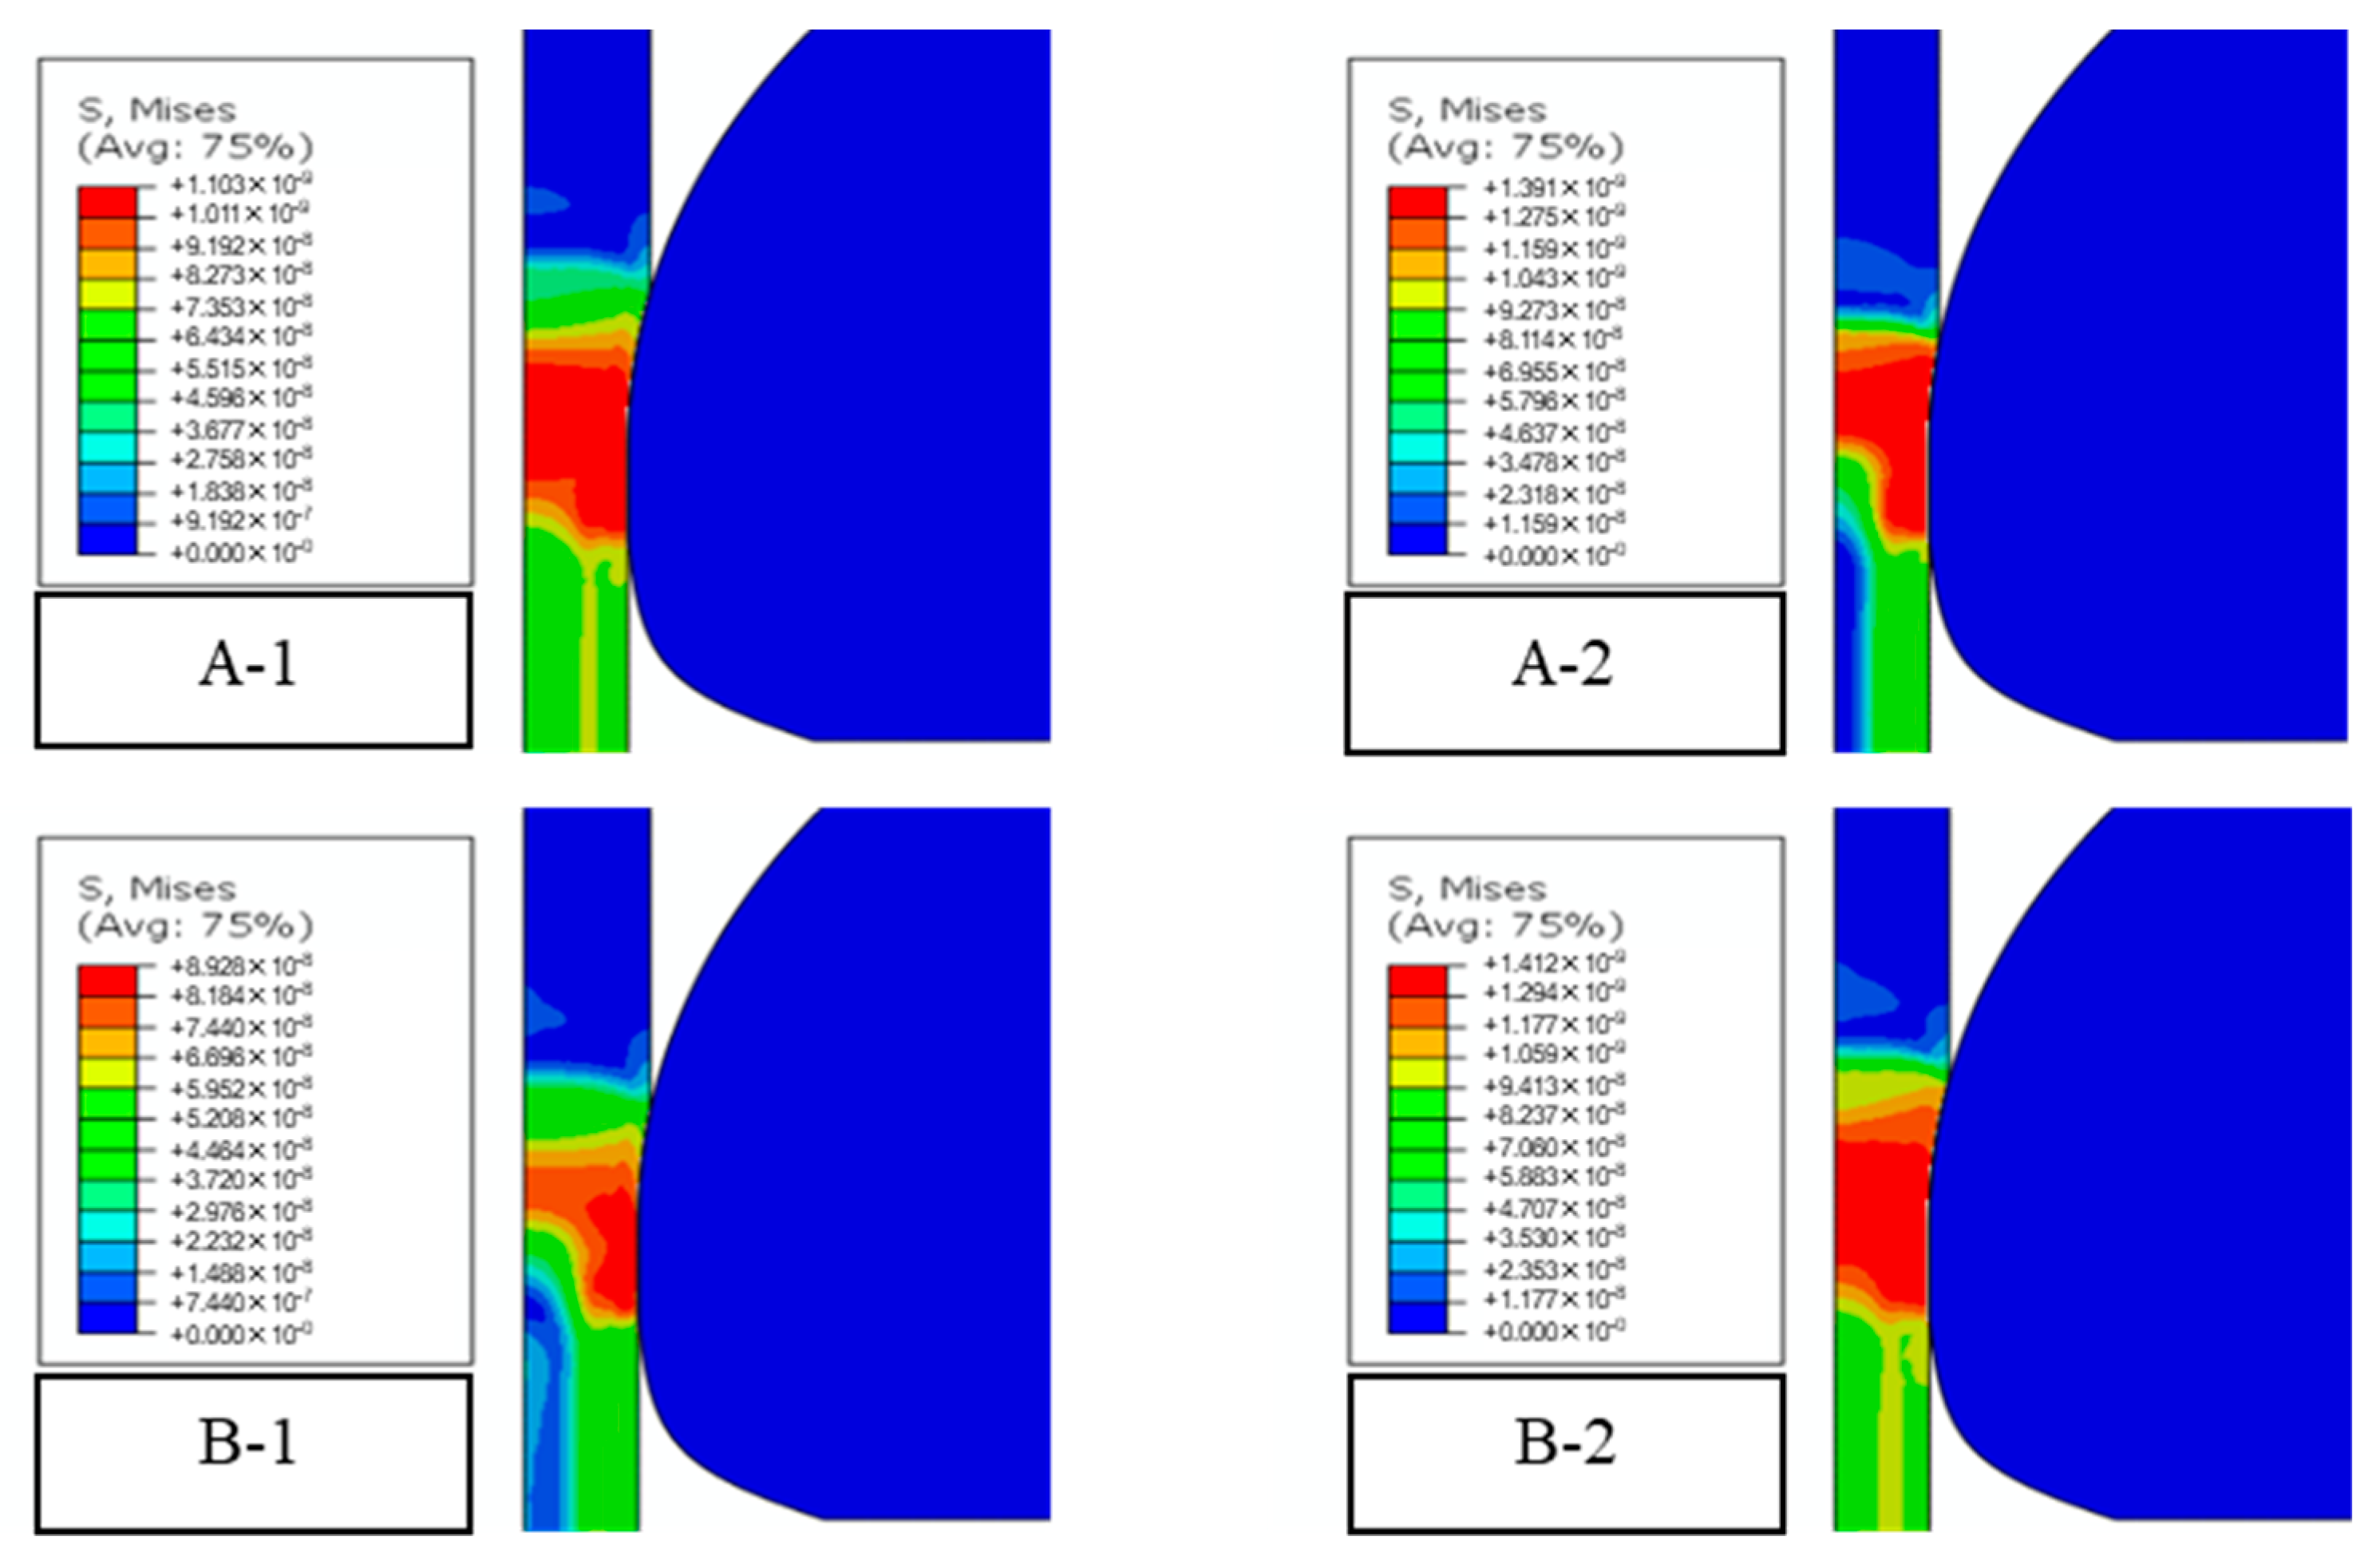
3.3. FEM Simulation on Drawing Induced Heat Distribution

Figure 7 and Figure 8 show the explicit analysis and simulation using the ABAQUS software. The simulation curve and cloud diagram of the radial temperature distribution are shown from the centre to the edge for the drawn steel wire during the deformation stage for the die sizing area. It is seen in Figure 7 that the contact temperature between the steel wire and the mould was the largest at the steel wire surface. A larger single-pass strain leads to a higher strain heat and local equivalent strain amplitude. At a single-pass wire drawing reduction rate of 32%, the maximum surface temperature reached ~222 °C. At a single-pass reduction rate of 18%, the maximum temperature of the mould contact surface was ~190 °C. After the second drawing, the yield plasticity parameter of the steel wire was derived from the uniaxial tensile test, and the stress-strain curve of the steel wire reflects the work hardening effect. The maximum temperatures of the mould contact surface of the steel wire in the forming stage under scenarios A and B were ~213 and ~262 °C, respectively. It is noted that when the steel wire is formed in the mould, the temperature near its core showed little change. The highest temperature at the centre was for the B-2 sample at ~134 °C, and the smallest was for the B-1 sample at ~68 °C.
Figure 9 illustrates the equivalent plastic strain cloud diagram for the steel wire drawing stage. The figure indicates that the equivalent plastic strain rate of the drawn steel wire gradually increased from its core and along the radial direction. For drawing plan A, the maximum equivalent effect on the side near the A-1 wire drawing contact surface became 0.47 at a wire drawing reduction rate of 32%. During the second drawing, the maximum equivalent effect on the side of the A-2 wire drawing surface became 0.24. For drawing plan B, the maximum equivalent strain near the B-1 wire drawing contact surface was only 0.27 at a wire drawing reduction rate of 18%. When the reduction rate of the second drawing was 32%, the maximum equivalent effect near the drawing contact surface of the B-2 steel wire became 0.44.
It is seen from Figure 10 that the Von Mises stress was concentrated during the wire forming stage. When the steel wire entered the sizing area, the drawing reduction ratio was 32% and the Von Mises stress acted on the entire steel wire forming area. When the drawing reduction area rate was 18%, the steel wire entered the sizing area at the initial Von Mises force, which acted on the full-diameter area. However, at the latter part of the sizing area, the Von Mises force only acted on the outer 1/2 radius annulus of the wire.

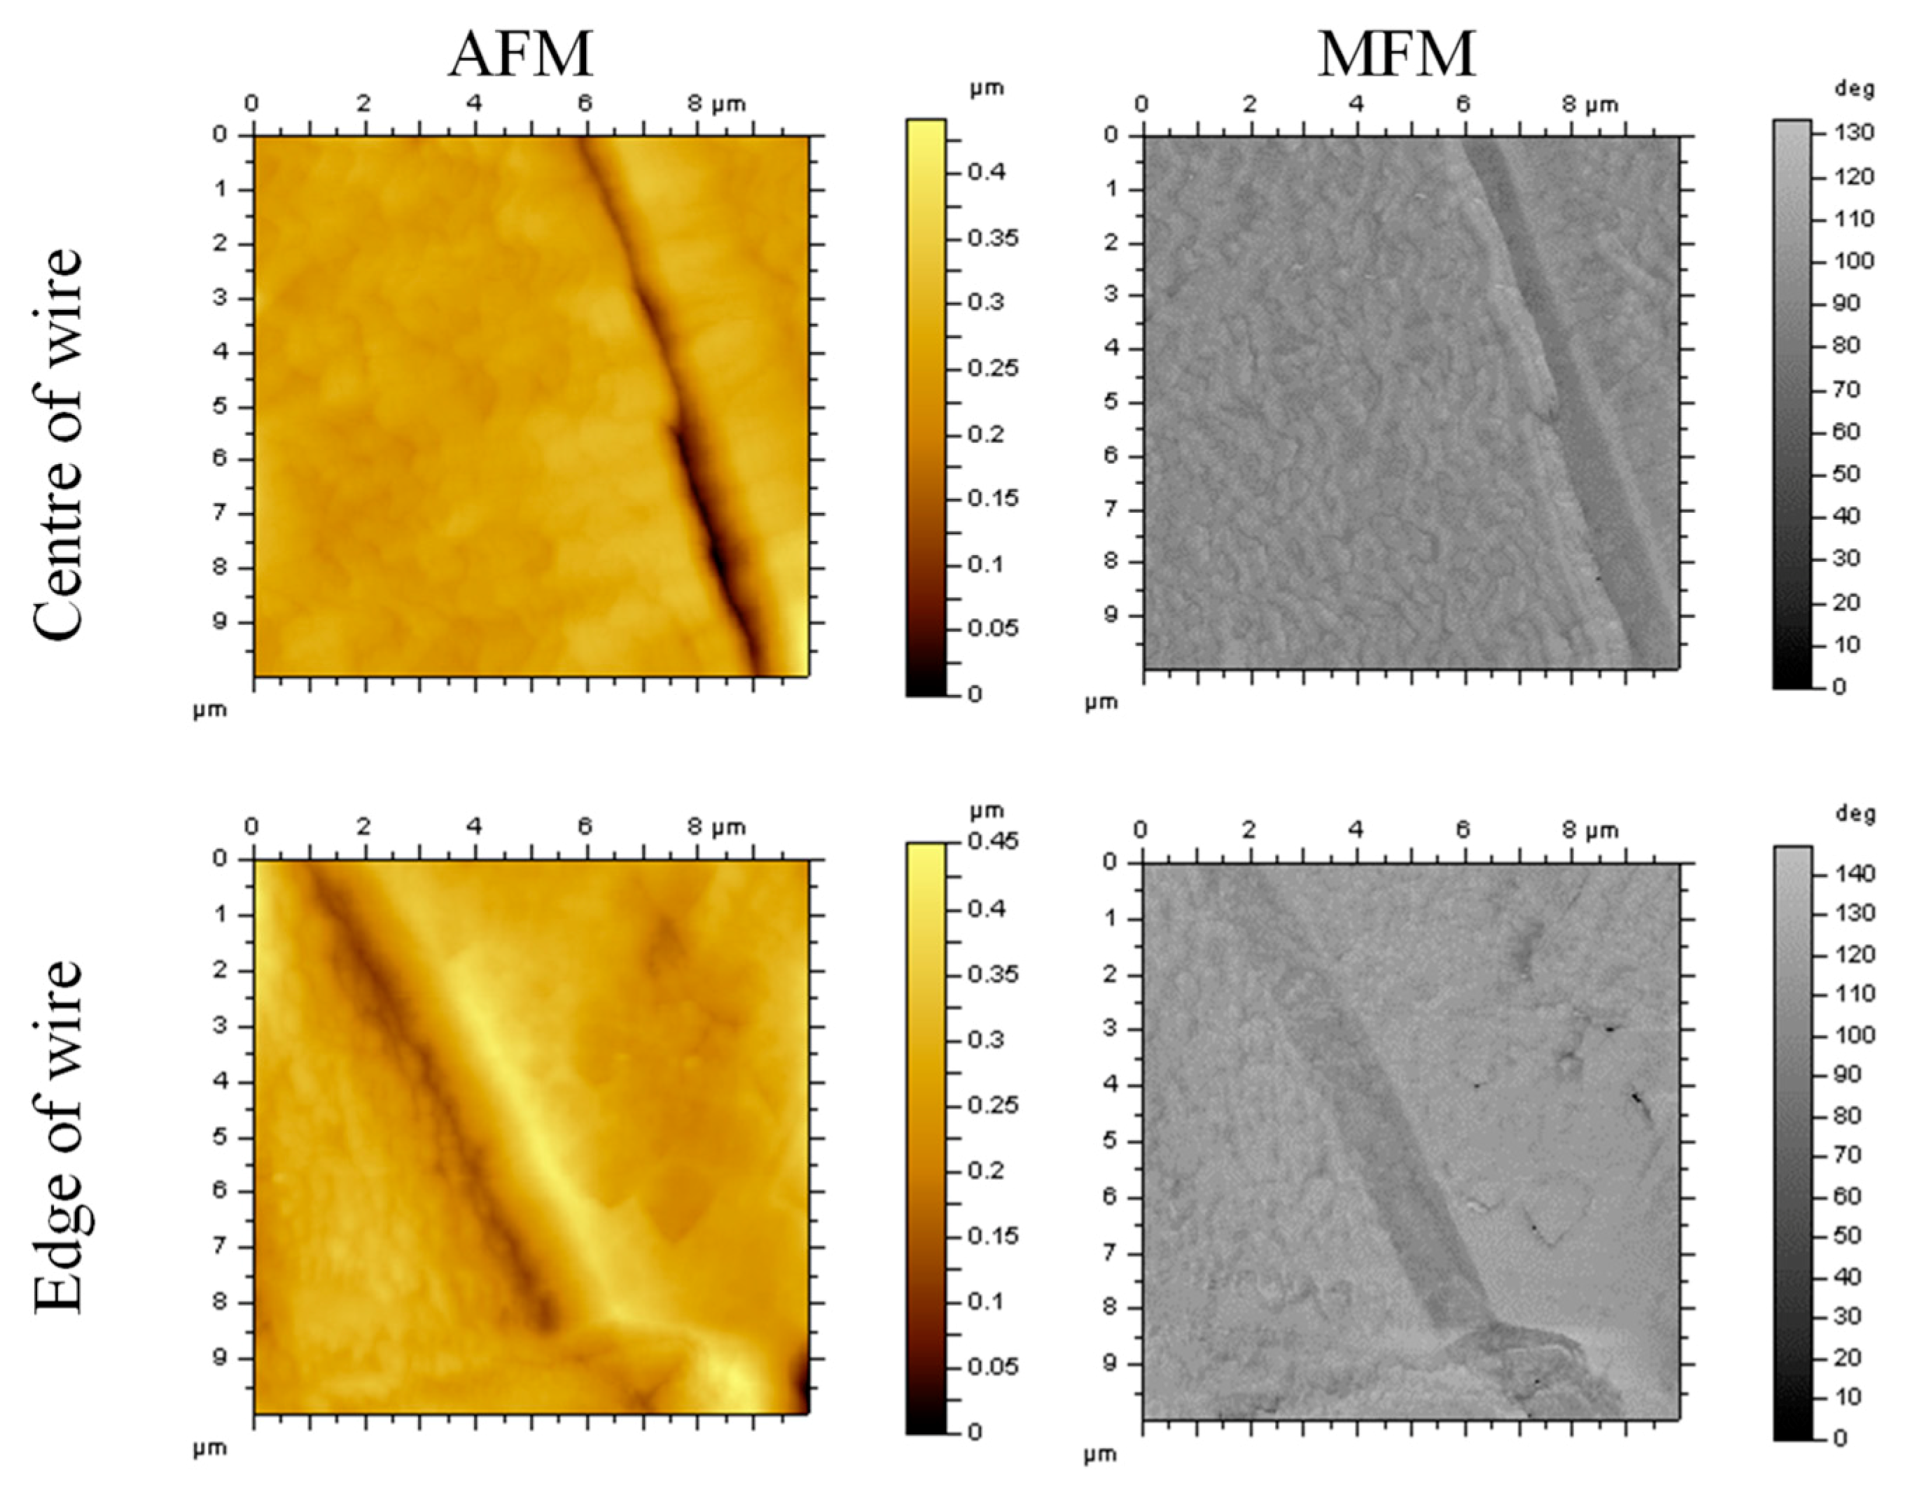
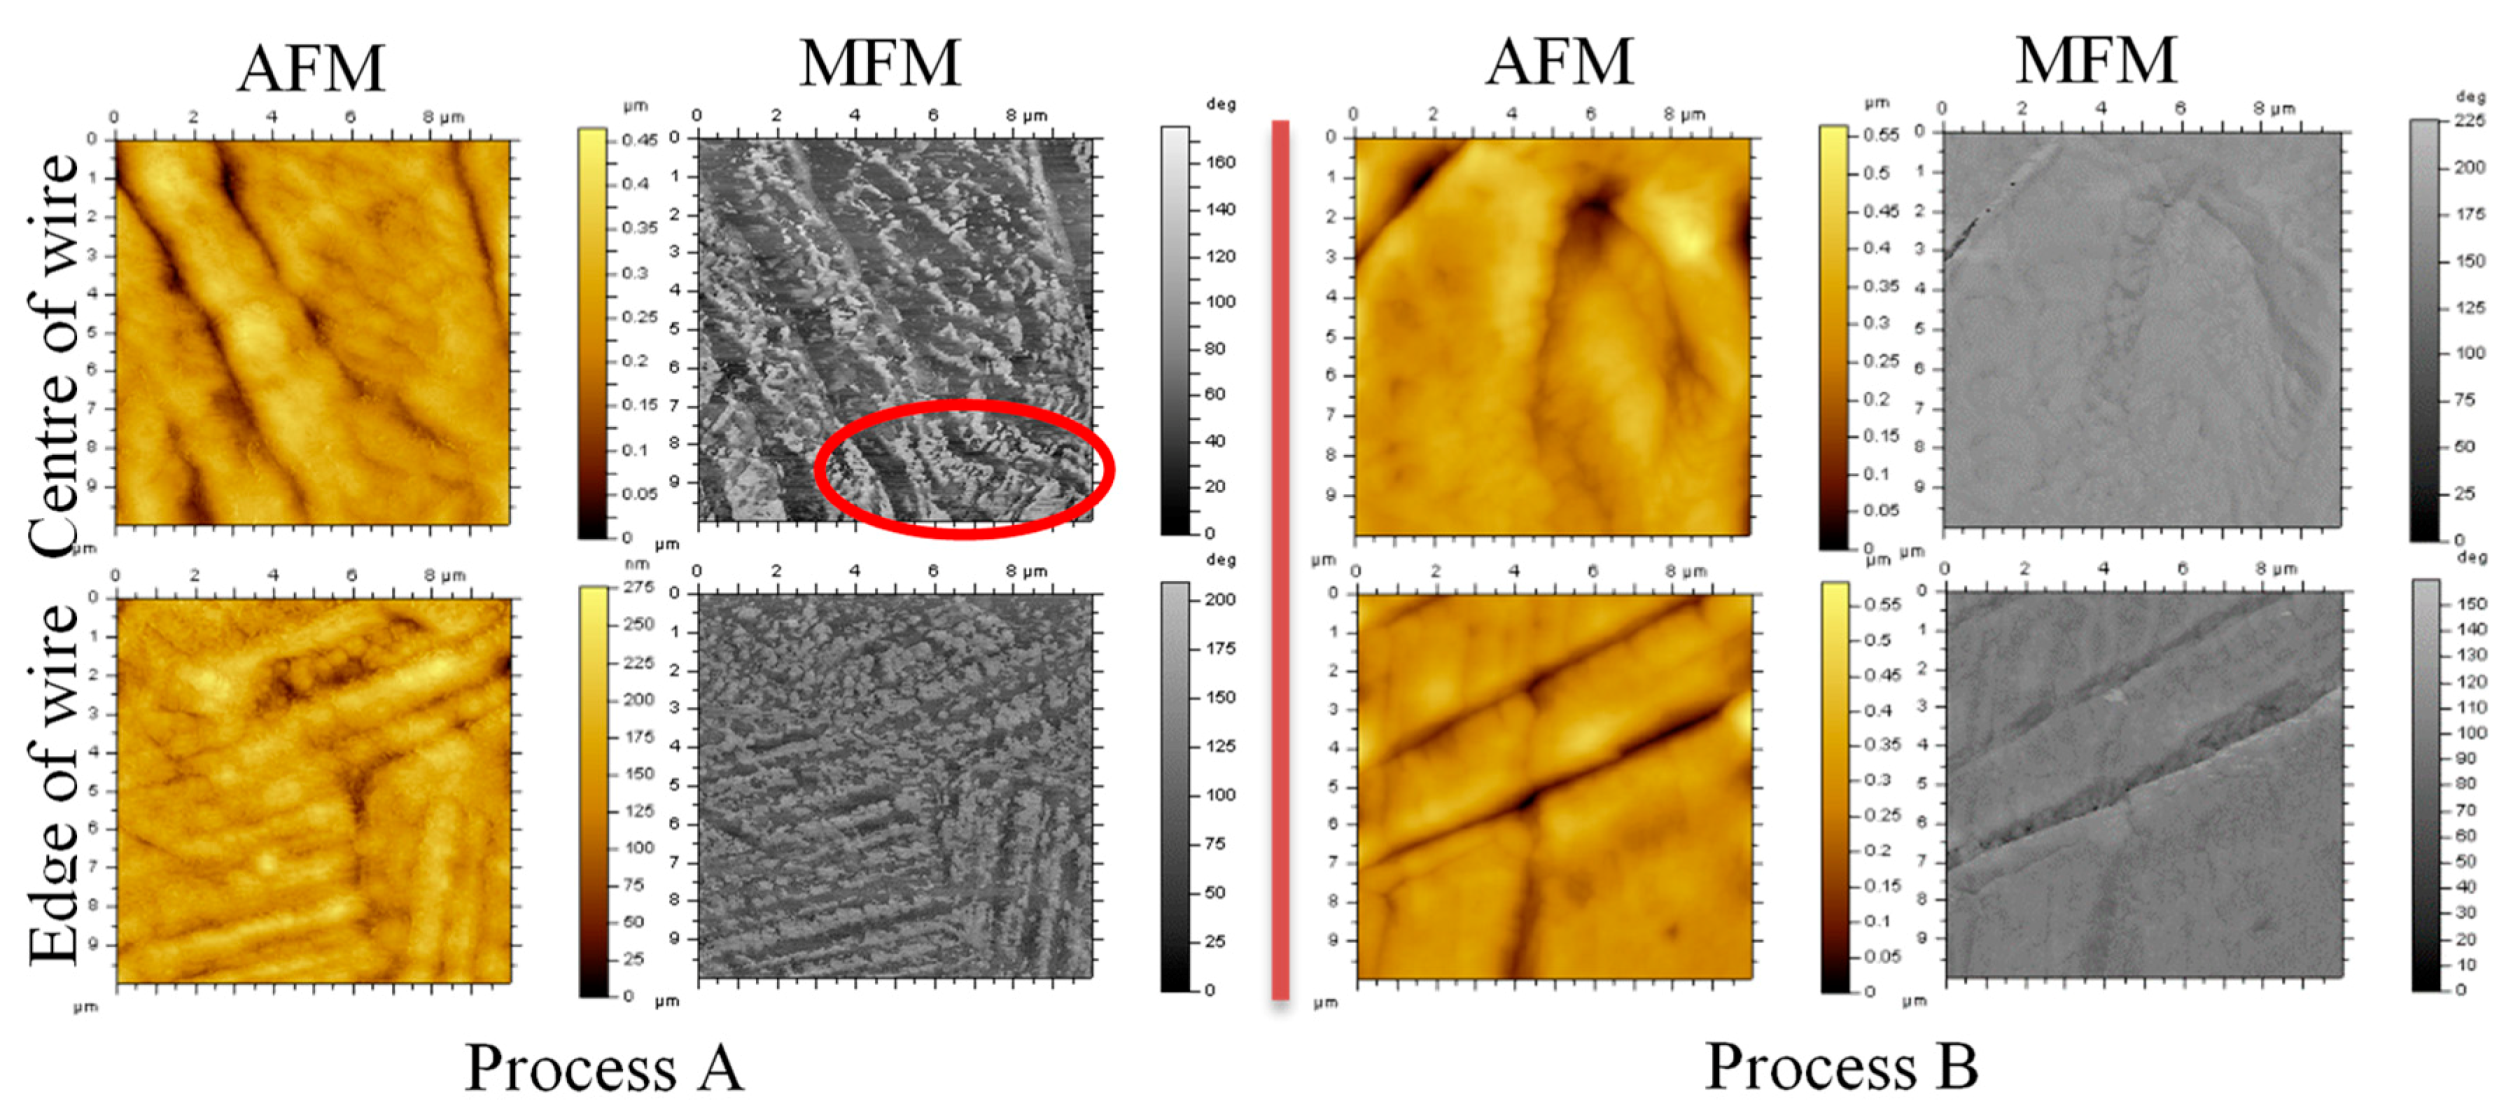
3.4. Magnetic Property Deviation and Local Distribution

Figure 11 shows the relationship between the saturation magnetic induction strength Bs and the true strain under the two drawing schemes measured using a flux meter. For drawing chains A and B, as the true drawing strain increased, the saturation magnetic induction strength of the A-1 sample drawn with a second large strain was greater than for the B-1 sample. This suggests that a larger deformation strain for the single pass leads to a higher saturation magnetic intensity. In the subsequent second pass drawing process, although the strain variables were different, the A-2 sample under drawing scheme A had a greater saturation magnetic induction intensity.
Magnetic force microscopy (MFM) can effectively detect the transformation-induced magnetic phase in steel and distinguish the untransformed non-magnetic austenite phase [26,27]. The MFM test was performed using an AFM. A magnetic coated probe was used to measure the surface morphology of the sample in the tapping mode (AC mode) of the AFM. The needle tip was then raised by 60 nm and the scanning process was repeated. The core and edge parts of the cross-sections of the steel wires drawn using the A and B processes were measured in each pass.
As shown in Figure 12, the austenitisation of the base material after solution treatment was sufficient as there was no obvious magnetic phase found after the MFM scan. The steel wires drawn with different deformations in a single pass are compared in Figure 13. The A-1 steel wire drawn with a reduction of 32% in a single pass possessed a clear magnetic area in the MFM results. No apparent magnetic phase was observed at the edge of the A-1 steel wire, there were intersecting deformation twins in the cross-section of steel wire B-1 in the AFM mode. No apparent magnetic phase was found in the core and edge of the cross-section of the steel wire, and the characteristics of the deformed twins were observed on the B-1 edge.

4. Discussion

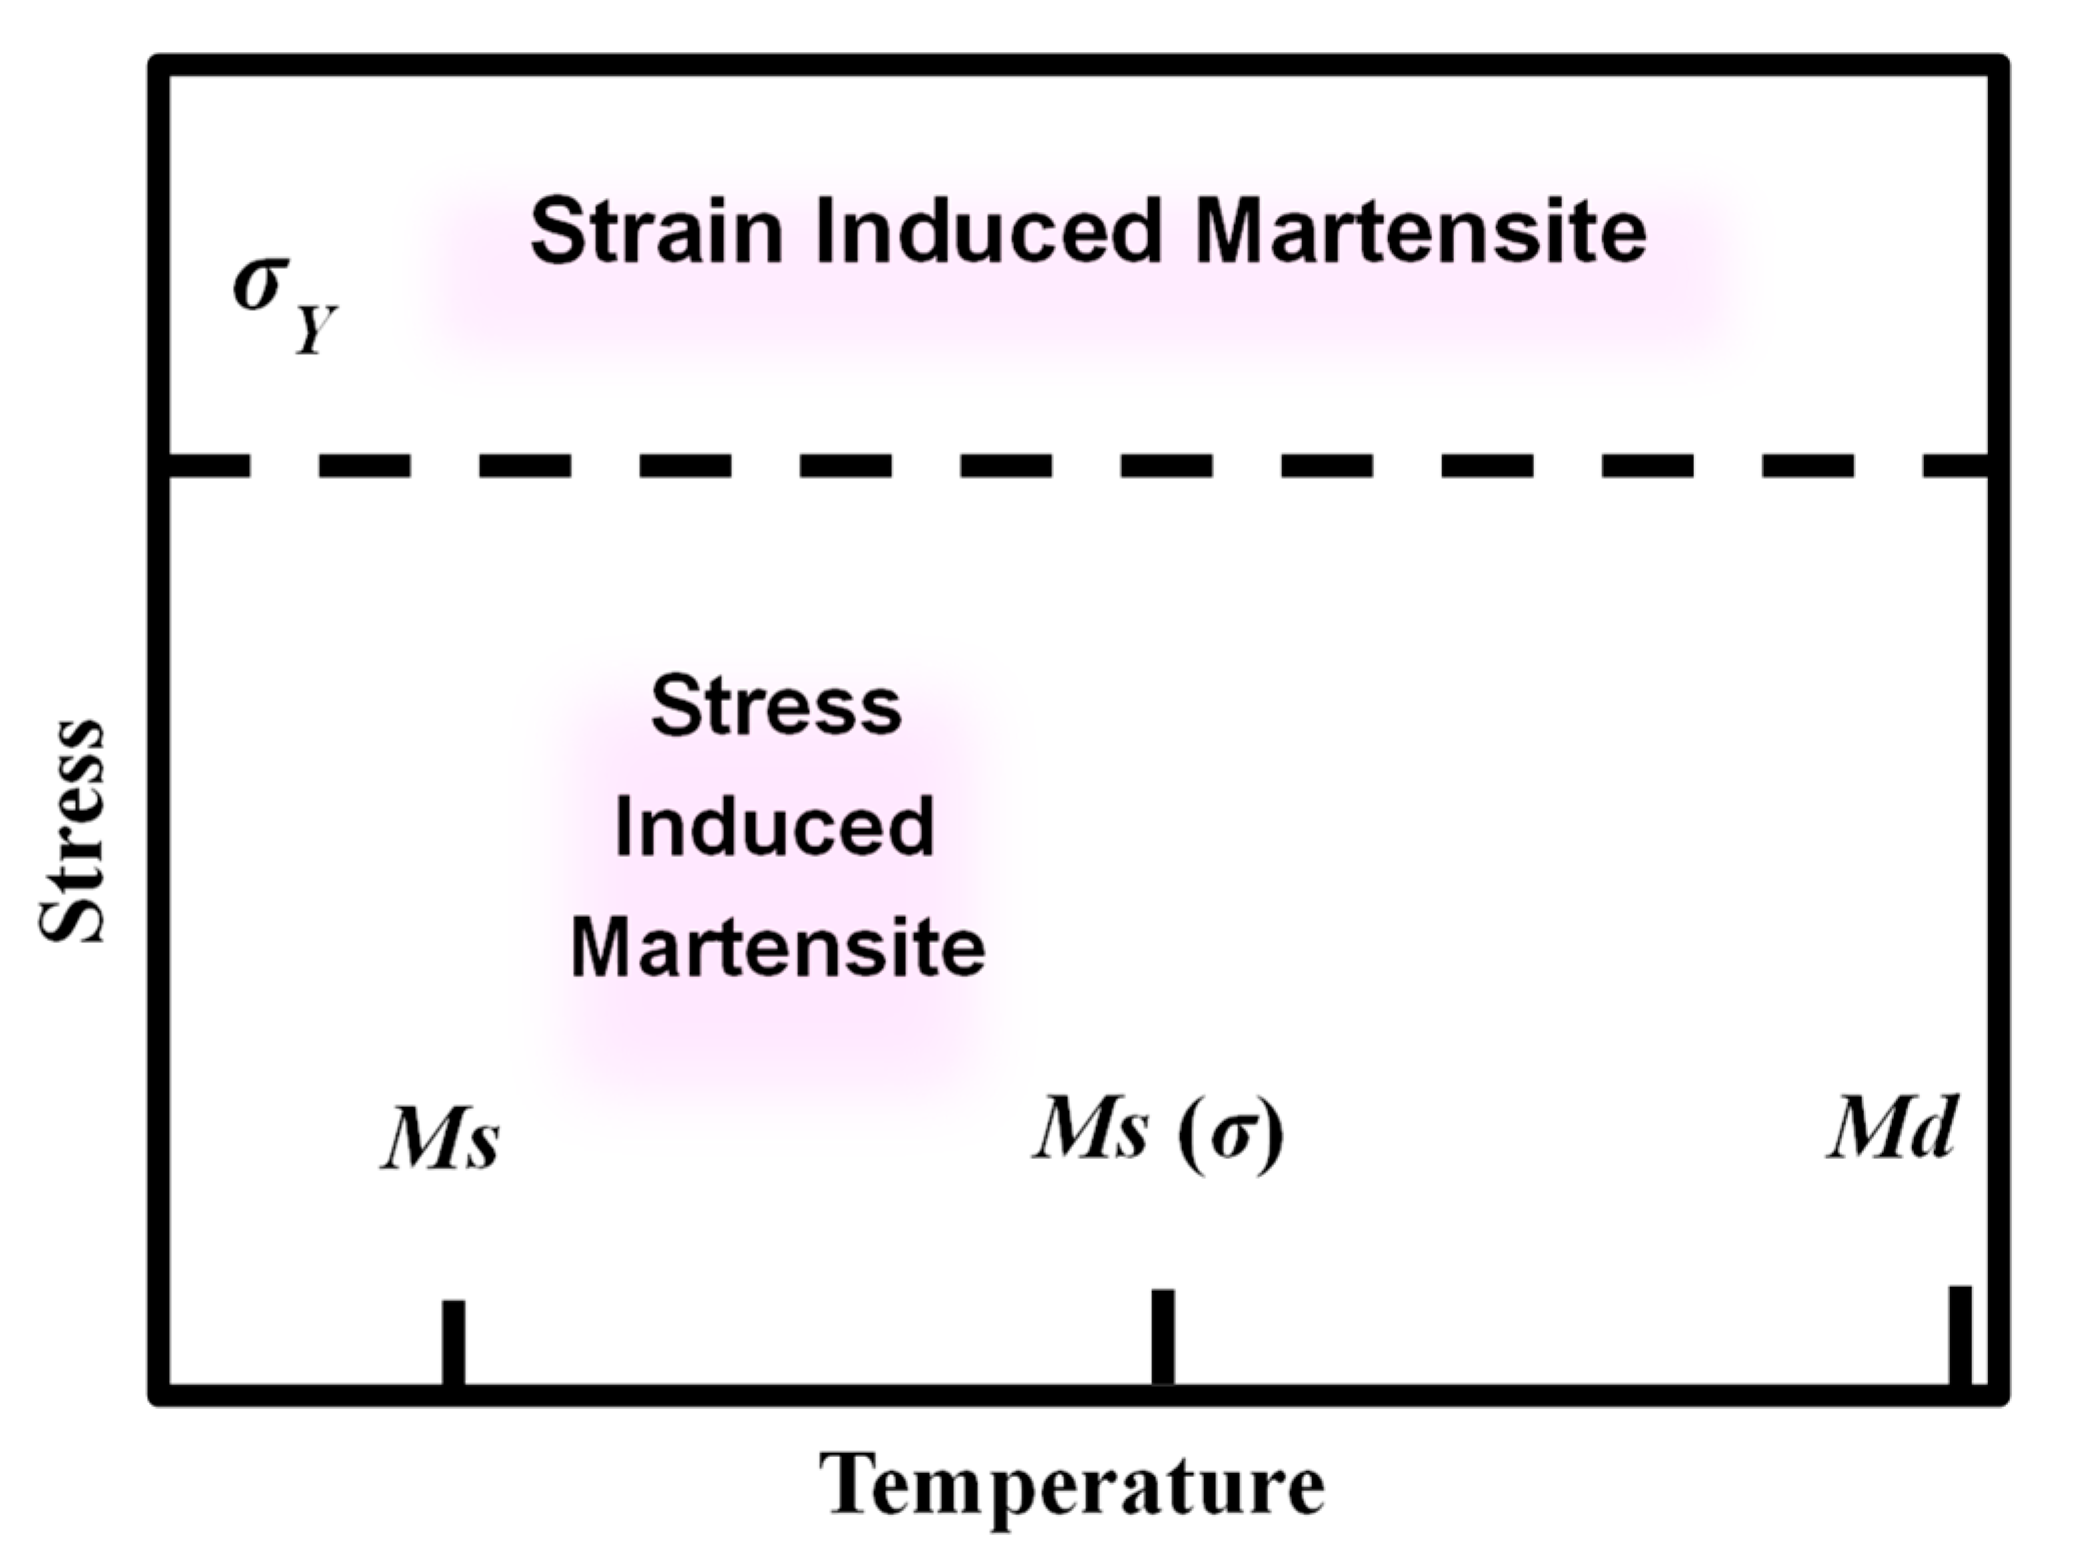
4.1. Effect of Elements on Phase Transformations

SFE is detrimental to austenite phase transformations during deformation. In general, DIM tends to occur when the SFE is less than 18–20 mJ/m2 and is entirely inhibited when larger than 18–20 mJ/m2 [8,29]. The deformation is sufficient for the proliferation of partial dislocations and nucleation sites for α’-martensite when the SFE is low [8,16]. In contrast, a higher SFE in the austenite prefers to generate intragranular twins during deformation [30,31]. The formula proposed by Schramm-Reed [7] suggests the element related to the SFE expression is defined as SFE = −53 + 6.2 (%Ni) + 0.7 (%Cr) + 3.2 (%Mn) + 9.3 (%Mo). The maximum and minimum SFE of the wires can be deduced by introducing the detected elemental deviations from the EDS into this formula (see Table 3). Due to relatively small elemental deviations, the SFE of all tested wires were within the range to trigger martensite transformation [8,29].

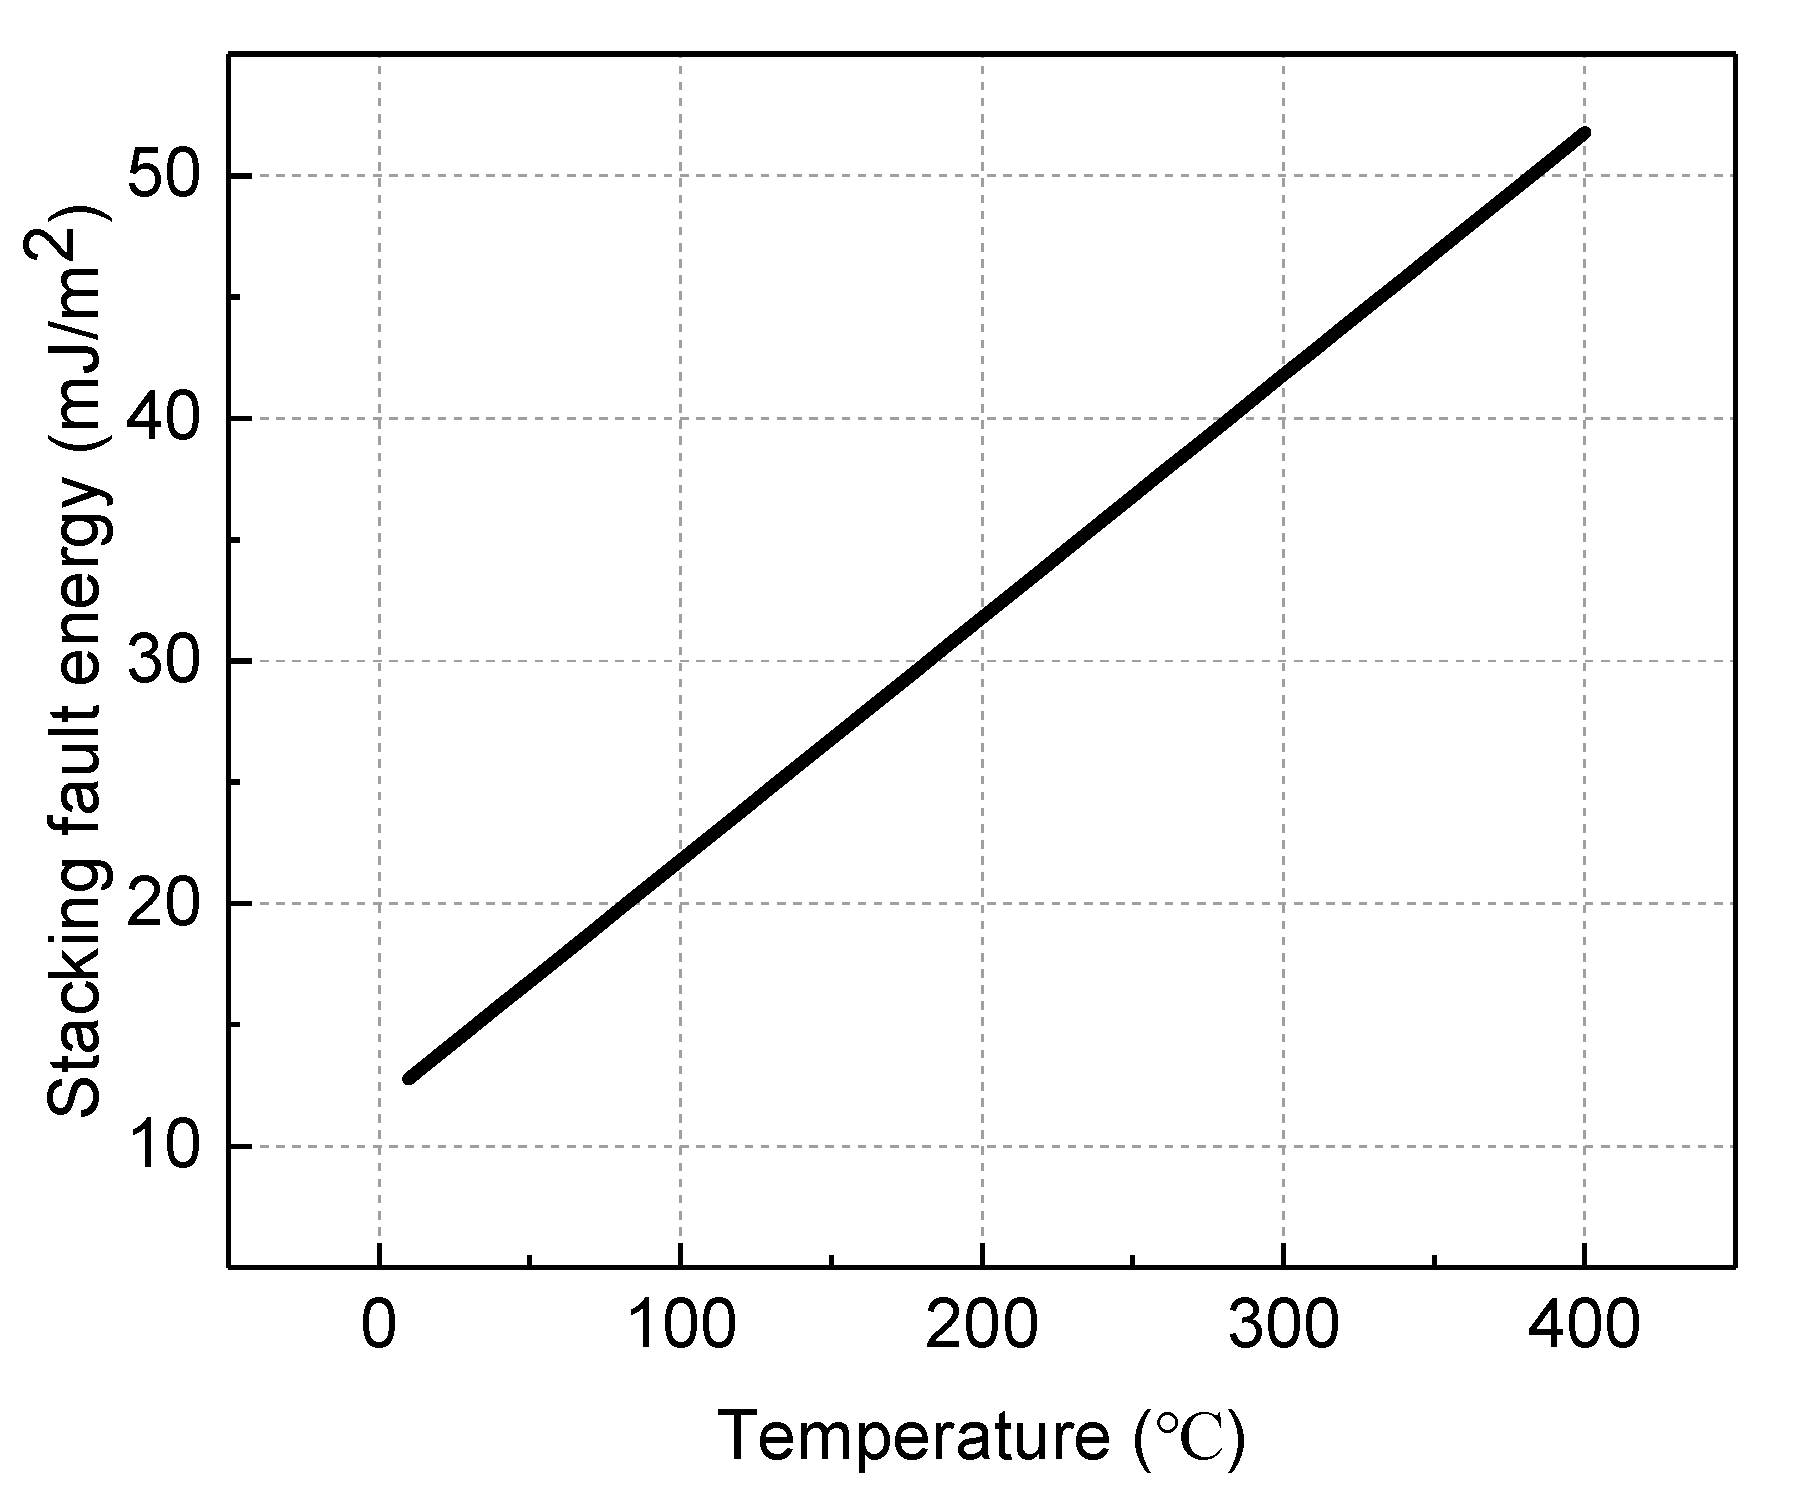
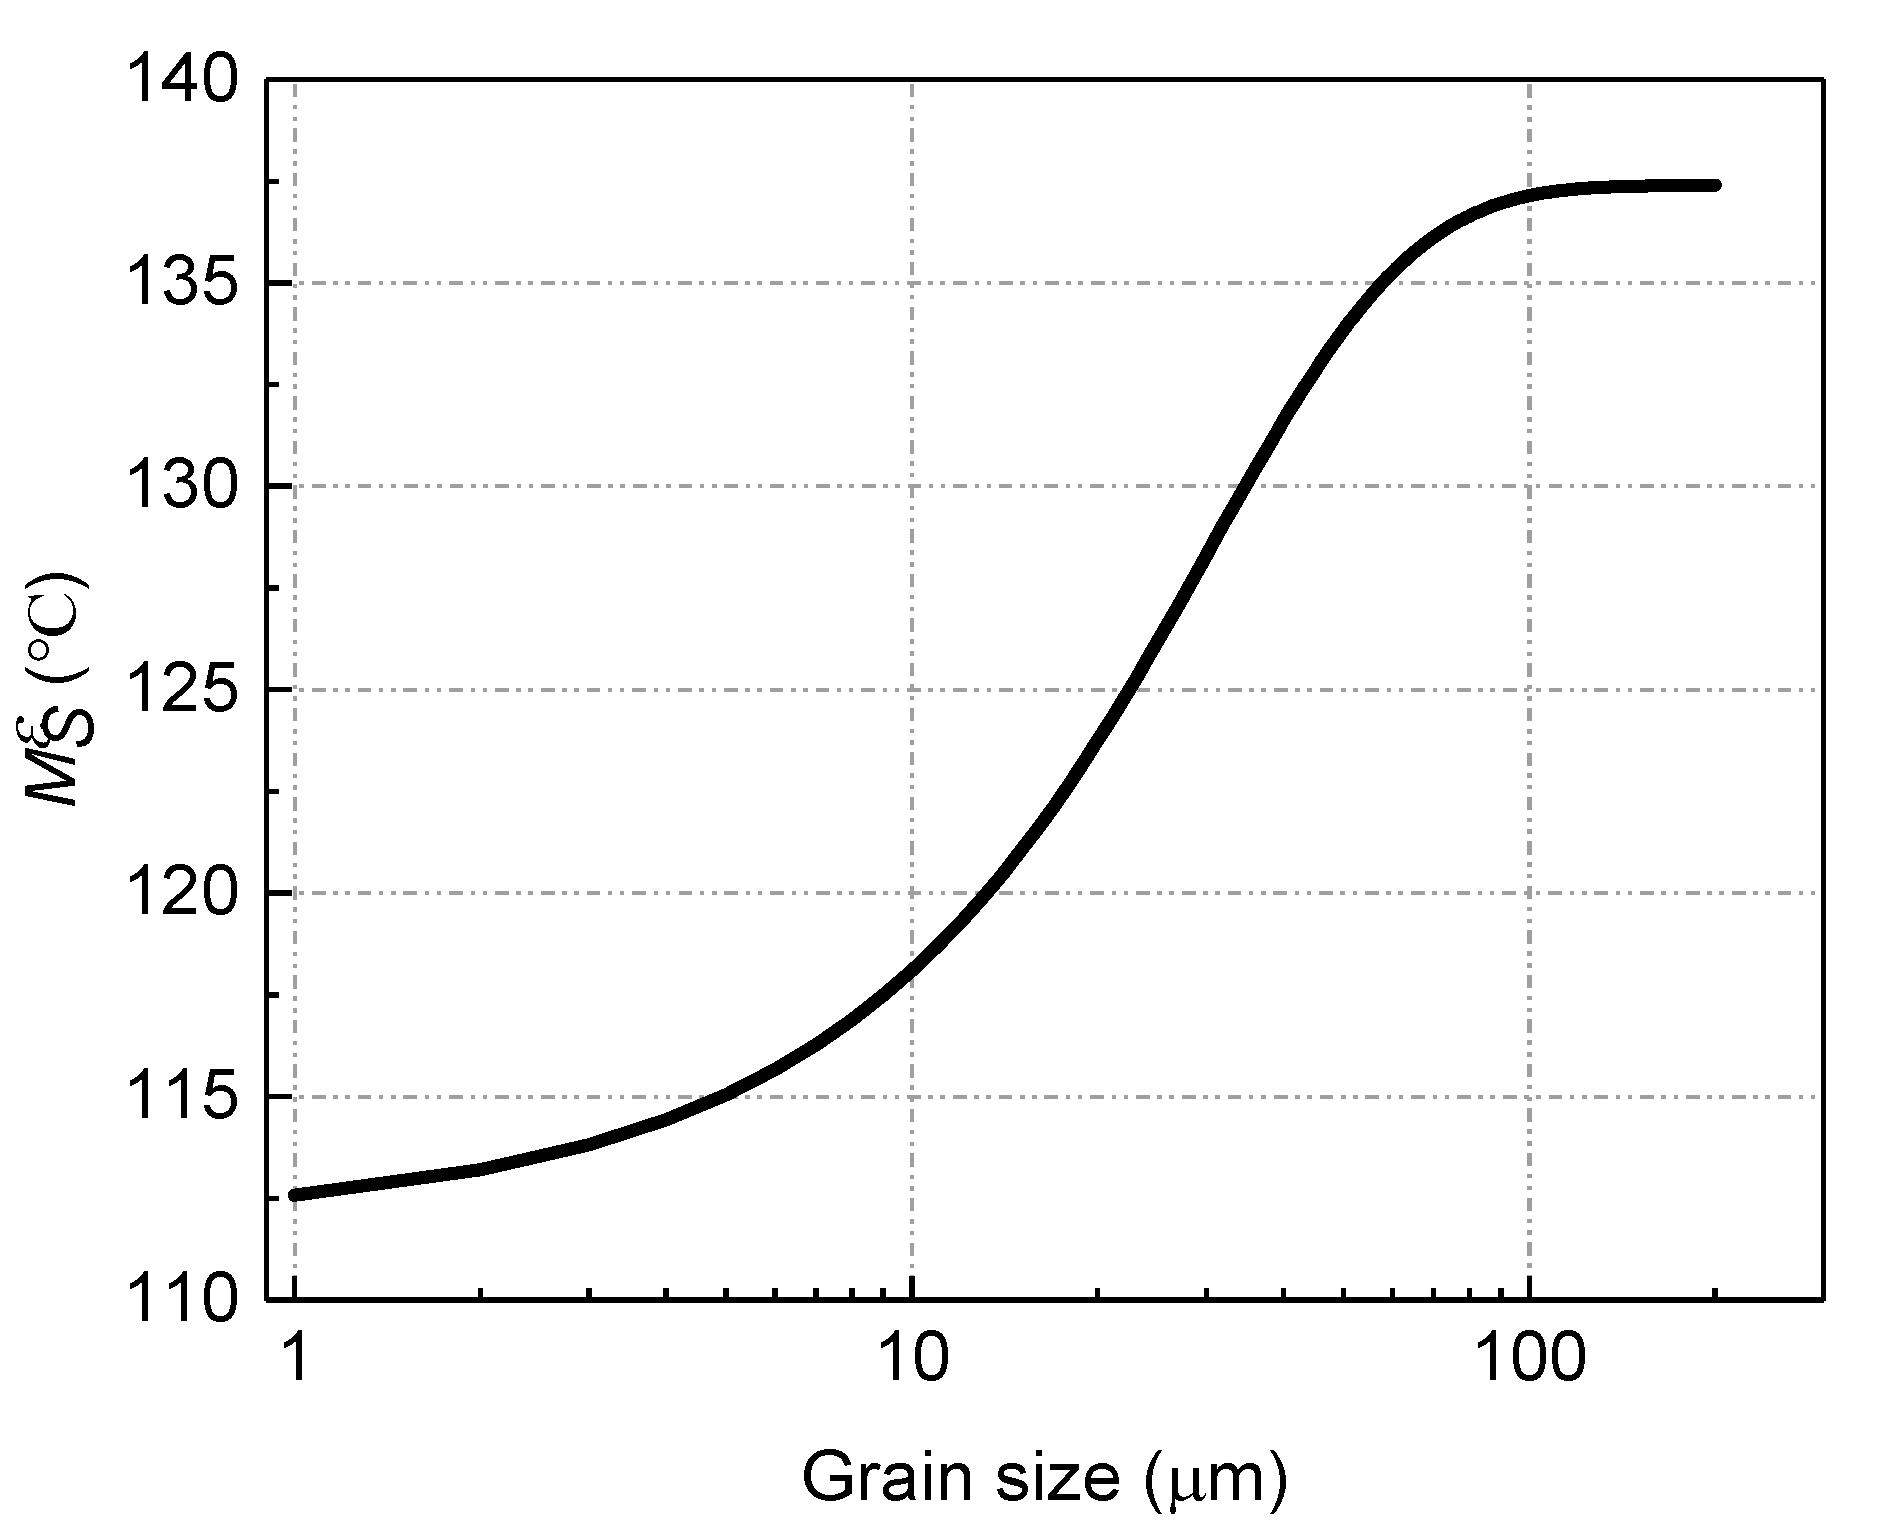
4.2. Synergistic Effects of Grain Size and Temperature on Martensitic Phase Transitions

Austenitic grains undergo severe deformation during wire drawing, and the rapid friction and extrusion between the drawing die and the wire generate significant heat. Changes in temperature inevitably lead to changes in the SFE during the drawing process. In addition, as the internal grain of the wire is significantly refined after the first drawing deformation, the SFE of the steel wire also changes correspondingly during the second drawing.
Mosecker et al. [32] noted that increases to the deformation temperature promote SFE and complicate the DIM. Talonen et al. [33] stated that the SFE of austenite materials is linear with temperature with a slope of 0.1 mJ/(m2·K−1) when temperatures are above ambient. This work applies the slope and the element-deduced SFE to determine the relationship between the SFE and temperature, as shown in Figure 14. Saeed et al. [34] proposed the austenite grain size-based SFE formula as:
S F E = 2 ρ Δ G + 2 σ + 2 ρ Δ G e x
where ρ = 4 3 1 a 2 N is the specific atomic surface density of the crystal plane γ (111) [32], N is Avogadro’s constant, a is the lattice constant, σ is the interface energy of austenite and martensite, ∆G is the Schramm-Reed [7] solution element-based SFE, and ∆Gex is the additional grain size-related SFE expressed as:
Δ G e x = 170.06 exp ( d 18.55 )
where d is the mean grain size of austenite. Thus, for the same austenite material, a finer grain size contributes to a larger SFE, which makes it more difficult to transform martensite [35].
The grain size affects the phase transformation temperature Ms of martensite as well. Souza et al. [35] established the relationship between the SFE and Ms as:
M S ε ( ° C ) = ( 364.8 + 370.6 S F E ) 273.15
Substituting Equations (3) and (4) into Equation (5), the sigmoid relationship between grain size and Ms is obtained as shown in Figure 15.
When the temperature for austenite deformation is above 100 °C, the value of SFE is greater than 20 mJ/m2. In this case, forming the deformation-induced martensite on the wire subsurface becomes difficult [29,30,31,32,33,36]. According to the FEM results, the maximum temperature of wire A-1 reached ~222 °C (Figure 7 and Figure 8). At these temperatures, the DIM in austenite is still hindered though it experienced a dramatic deformation. Nevertheless, the centre part of wire A-1 underwent a considerable deformation rate (≥0.39, Figure 9) and was the same level of stress as the edge of wire A-1. However, the deformation-induced heat was relatively low (≤110 °C). Meanwhile, the initial grain size of the base material at the first drawing was approximately 32 μm, which corresponds to a martensite transition temperature Ms of ~135 °C. Therefore, some austenite structures in the core were transformed into martensite under strain, as shown in Figure 13.
The strain level of wire B-1 was low (<0.2). According to Olson and Talon [31,33], the austenite cannot readily transform into martensite when the temperature is above 50 °C and the strain is <0.2. Thus, the high temperature at the centre of the wire B-1 and relatively low strain level (~0.24) gives a negligible magnetic phase measurement. This is the same as the edge part of wire B-1. The XRD results show that during the first drawing pass, the decrement of the γ (111) phase peak intensity for chain B was larger than that for A (see Figure 3). Some reports have demonstrated that the stacking faults of face centred cube materials were strongly dependent on the γ (111) plane [6,7]. This implies that a larger decrease in the γ (111) phase intensity reflects additional crystal twin formations rather than martensite [33]. Furthermore, after drawing twice, the grain size of wire A-2 was below 10 μm. The calculated relationship depicted in Figure 15 and the FEM simulated temperature show that the relatively low deformation heat increased the feasibility of the DIM in wire B-2. Under drawing plan B, the internal grain size of the B-1 steel wire was larger after the first pass, which still satisfied the martensite transformation temperature but the second pass strain was greater (the area reduction rate is 32%). This results in a greater deformation temperature, which suppresses a portion of the martensite transformation. Thus, the B-2 steel wire had lower macroscopic magnetic properties than the A-2.
It is noted that although the drawing temperature satisfies the condition that no martensite was produced, both A-2 and B-2 steel wires showed some macro-magnetism. The relationship between the austenite martensite transformation and temperature and the deformation stress can be represented with the schematic diagram shown in Figure 16 [5]. The figure shows that there are two transformation mechanisms for martensite: stress and strain-induced transformation of martensite. A stress-induced martensite transformation will occur when the stress is less than the yield stress and the transition temperature is between Ms and Ms (σ). A strain-induced martensite transformation occasionally occurs when the stress is greater than the austenite yield strength and the temperature is between Ms (σ) and Md. Although the finite element simulation results show that the second pass temperature condition inhibits the martensite transformation, in the actual wire drawing processes, the grain distribution inside the wire is uneven, especially after one pass. The actual strain of the grains at the inner part of the wire is also much greater than in the simulations, causing strain-induced martensite transformation. Thus, there was martensite could be detected in the wires A-2 and B-2.

5. Conclusions

This paper focused on 304H austenitic stainless steel and designed a pair of two-pass drawing schemes using the same total drawing variable but at different strain rates per pass. The microstructures, elemental distributions, mechanical properties, and micro/macro magnetic properties for all output wires were analysed. The effects of the drawing deformation and deformation heat on the phase transformation of the steel wires were studied using finite element simulations. The main conclusions are as follows:
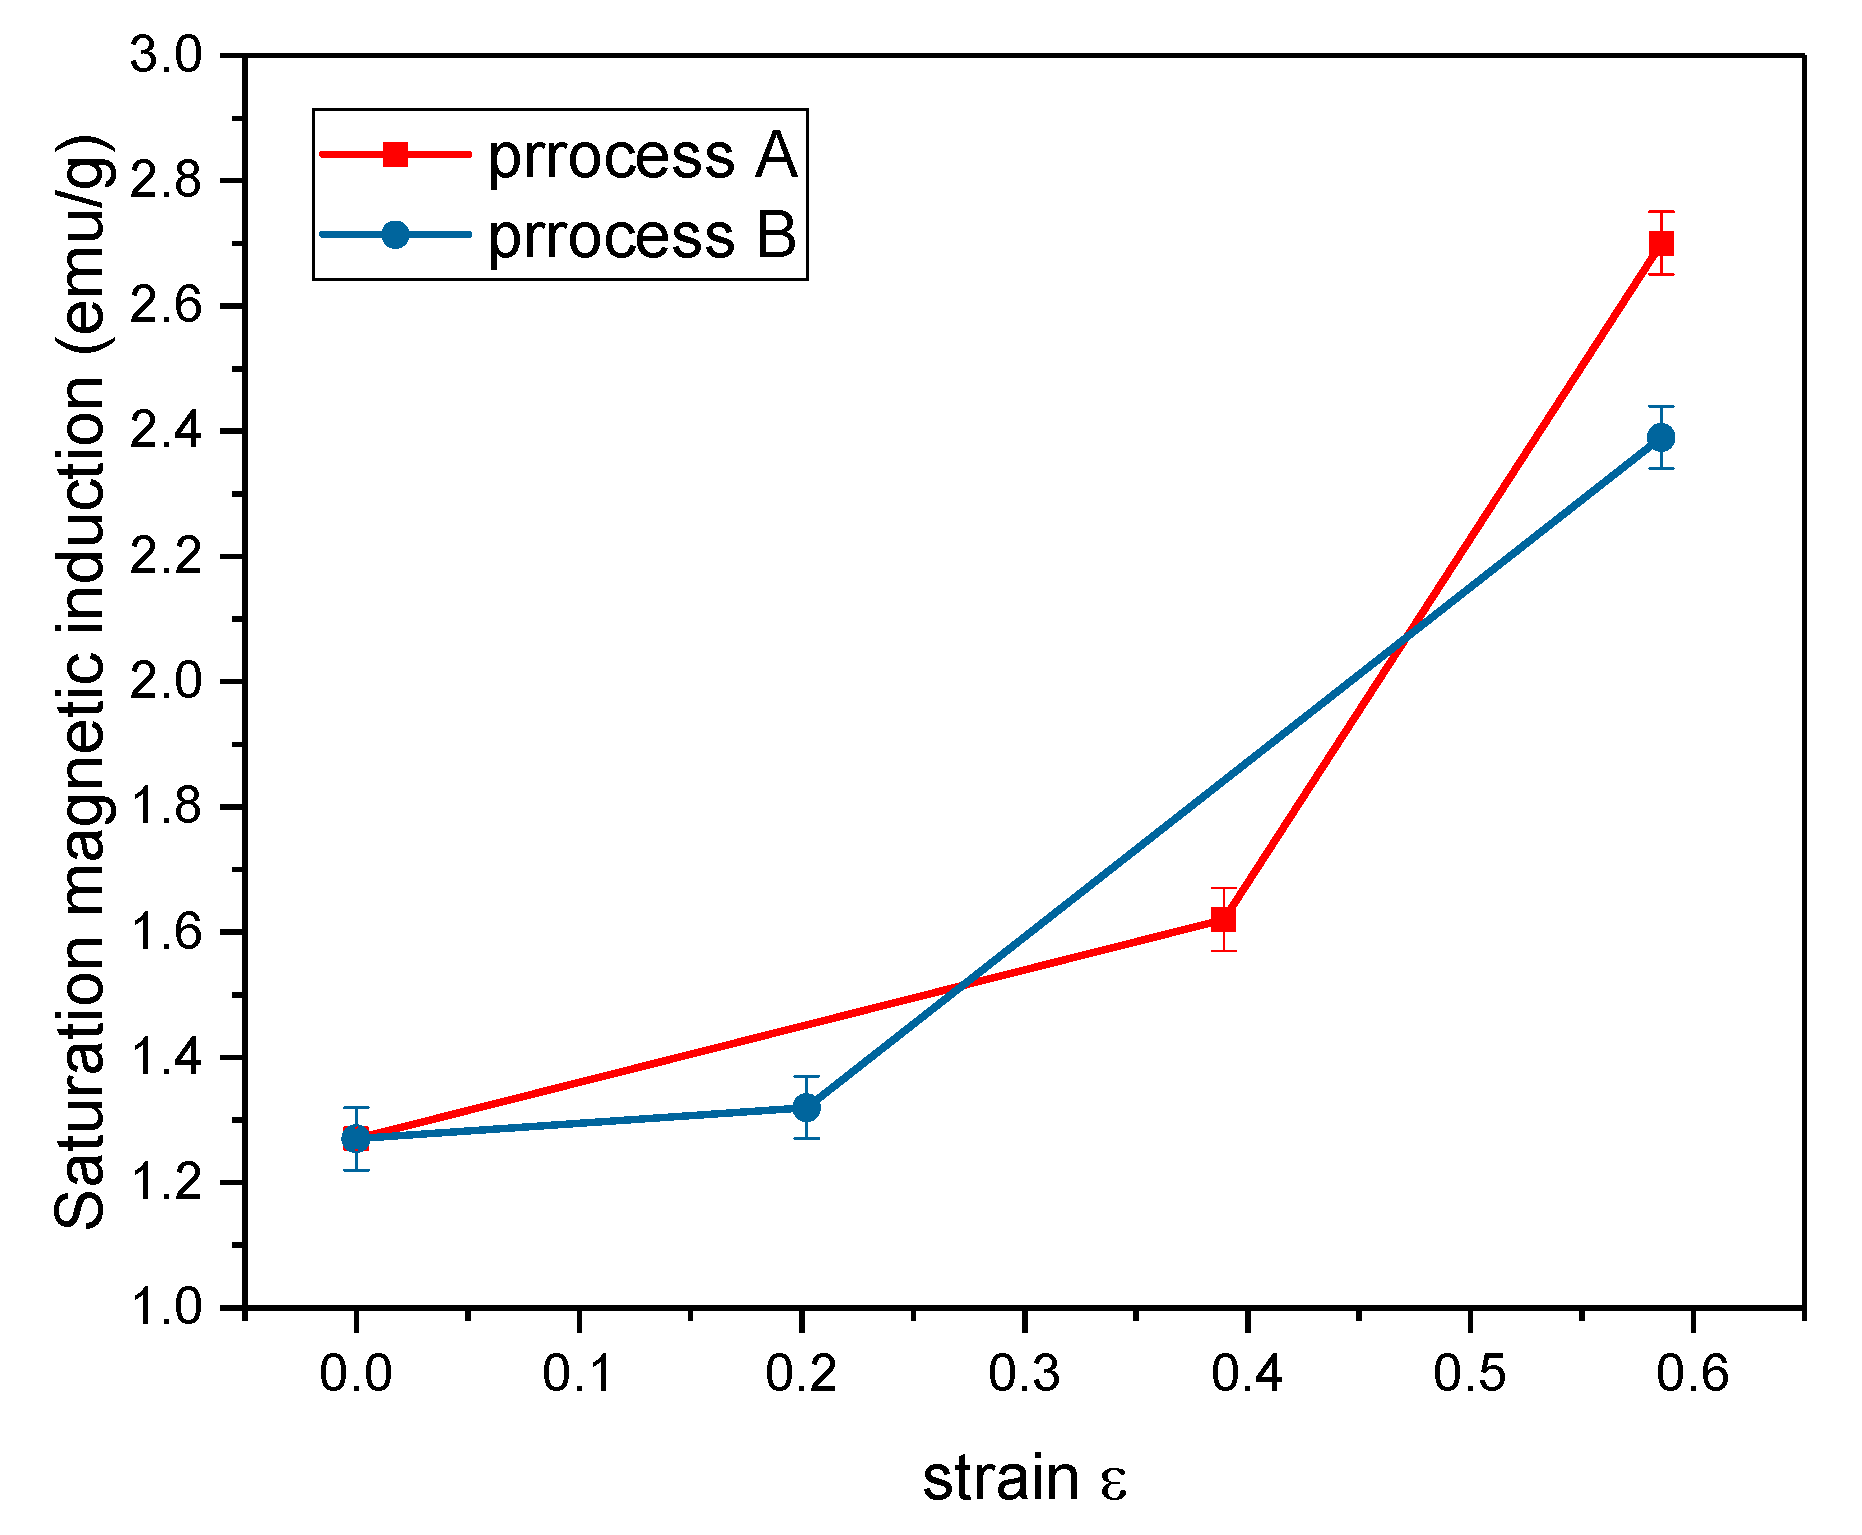
  • The order of the strain rate configuration for the second pass affects the micro-region martensitic transformation behaviour of the steel wire. The first pass had a larger area reduction rate, while the later pass was smaller and more α’-Martens occurred inside the wire. The smaller former pass inhibited the α’-martensite phase transformation.
  • The temperature of the drawing contact surface was significantly higher than that of the centre area, and the drawing equivalent strain rate also followed the same law. The unevenness of the local drawing strain caused a greater single-pass drawing strain rate. Thus, there was more surface deformation heat when the steel wire was formed in the mould, which significantly suppressed the transformation of austenite to martensite on the steel wire surface.
  • The difference in the radial element distribution of the steel wire was not the primary factor that affected the uneven transformation of martensite inside steel wires. Instead, the inhomogeneous thermal distribution of the deformation during the drawing process of the steel wires and the grain refinement that affects the austenite SFE were the main reasons.
  • In the production of steel, reducing the area reduction of the first drawing pass will be effective and efficient during the process of producing austenitic wire with a low level of magnetism. On the contrary, enlarging the area reduction of the first drawing pass will also result in the detectable magnetism of wires.

Author Contributions

Conceptualization, Q.X. and J.L.; methodology, K.P.; software, Z.P.; validation, J.Z., Y.Z. and Z.C.; formal analysis, M.L.; investigation, L.Y.; resources, C.L.; data curation, Z.C.; writing—original draft preparation, K.P.; writing—review and editing, Z.P.; visualization, K.P.; supervision, J.L.; project administration, Q.X.; funding acquisition, J.L. All authors have read and agreed to the published version of the manuscript.

Funding

This work is founded by Major industrial innovation Project of Transformation Program of Scientific and Technology Achievements of Jiangsu Province (BA2018047) and National Natural Science Foundation of China (51871171).

Conflicts of Interest

The authors declare no conflict of interest.

References

  1. Gallée, S.; Pilvin, P. Deep drawing simulation of a metastable austenitic stainless steel using a two-phase model. J. Mater. Process. Technol. 2010, 210, 835–843. [Google Scholar] [CrossRef]
  2. Smaga, M.; Walther, F.; Eifler, D. Deformation-induced martensitic transformation in metastable austenitic steels. Mater. Sci. Eng. A 2008, 483, 394–397. [Google Scholar] [CrossRef]
  3. Kaoumi, D.; Liu, J. Deformation induced martensitic transformation in 304 austenitic stainless steel: In-situ vs. ex-situ transmission electron microscopy characterization. Mater. Sci. Eng. A 2018, 715, 73–82. [Google Scholar] [CrossRef]
  4. Hotz, H.; Kirsch, B.; Becker, S.; Müller, R.; Aurich, J.C. Combination of cold drawing and cryogenic turning for modifying surface morphology of metastable austenitic AISI 347 steel. J. Iron Steel Res. Int. 2019, 26, 1188–1198. [Google Scholar] [CrossRef] [Green Version]
  5. Eres-Castellanos, A.; Caballero, F.; Garcia-Mateo, C. Stress or Strain Induced Martensitic and Bainitic transformations during ausforming processes. Acta Mater. 2020, 189, 60–72. [Google Scholar] [CrossRef]
  6. Lu, J.; Hultman, L.; Holmström, E.; Antonsson, K.H.; Grehk, M.; Li, W.; Vitos, L.; Golpayegani, A. Stacking fault energies in austenitic stainless steels. Acta Mater. 2016, 111, 39–46. [Google Scholar] [CrossRef]
  7. Schramm, R.; Reed, R. Stacking fault energies of seven commercial austenitic stainless steels. Metall. Trans. A 1975, 6, 1345. [Google Scholar] [CrossRef]
  8. Chandan, A.K.; Mishra, G.; Mahato, B.; Chowdhury, S.; Kundu, S.; Chakraborty, J. Stacking Fault Energy of Austenite Phase in Medium Manganese Steel. Metall. Mater. Trans. A 2019, 50, 4851–4866. [Google Scholar] [CrossRef]
  9. Zhang, F.; Zhang, M. Effect of distribution of carbon and alloying element on martensite transformation in metastable austenitic manganese steel. J. Mater. Sci. Lett. 2003, 22, 573–574. [Google Scholar] [CrossRef]
  10. Lee, T.-H.; Oh, C.-S.; Kim, S.-J. Effects of nitrogen on deformation-induced martensitic transformation in metastable austenitic Fe–18Cr–10Mn–N steels. Scr. Mater. 2008, 58, 110–113. [Google Scholar] [CrossRef]
  11. Kisko, A.; Misra, R.D.K.; Talonen, J.; Karjalainen, L.P. The influence of grain size on the strain-induced martensite formation in tensile straining of an austenitic 15Cr–9Mn–Ni–Cu stainless steel. Mater. Sci. Eng. A 2013, 578, 408–416. [Google Scholar] [CrossRef]
  12. Shin, H.C.; Ha, T.K.; Chang, Y.W. Kinetics of deformation induced martensitic transformation in a 304 stainless steel. Scr. Mater. 2001, 45, 823–829. [Google Scholar] [CrossRef]
  13. Sun, G.; Du, L.; Hu, J.; Zhang, B. Significant influence of rolling modes on martensitic transformation, microstructural evolution and texture development in a 304 stainless steel. Mater. Charact. 2020, 159, 110073. [Google Scholar] [CrossRef]
  14. Staudhammer, K.; Murr, L.; Hecker, S. Nucleation and evolution of strain-induced martensitic (bcc) embryos and substructure in stainless steel: A transmission electron microscope study. Acta Metall. 1983, 31, 267–274. [Google Scholar] [CrossRef]
  15. Sinclair, C.; Hoagland, R. A molecular dynamics study of the fcc→bcc transformation at fault intersections. Acta Mater. 2008, 56, 4160–4171. [Google Scholar] [CrossRef]
  16. Nakada, N.; Ito, H.; Matsuoka, Y.; Tsuchiyama, T.; Takaki, S. Deformation-induced martensitic transformation behavior in cold-rolled and cold-drawn type 316 stainless steels. Acta Mater. 2010, 58, 895–903. [Google Scholar] [CrossRef]
  17. Jayahari, L.; Naik, B.B.; Singh, S.K. Effect of Process Parameters and Metallographic Studies of ASS-304 Stainless Steel at Various Temperatures under Warm Deep Drawing. Procedia Mater. Sci. 2014, 6, 115–122. [Google Scholar] [CrossRef] [Green Version]
  18. Parnian, P.; Parsa, M.H.; Mirzadeh, H.; Jafarian, H.R. Effect of drawing strain on development of martensitic transformation and mechanical properties in AISI 304L stainless steel wire. Steel Res. Int. 2017, 88, 1600423. [Google Scholar] [CrossRef]
  19. Hwang, J.-K. Effect of grain size on tensile and wire drawing behaviors in twinning-induced plasticity steel. Mater. Sci. Eng. A 2020, 772, 138709. [Google Scholar] [CrossRef]
  20. Ohsaki, S.; Yamazaki, K.; Hono, K. Alloying of immiscible phases in wire-drawn Cu–Ag filamentary composites. Scr. Mater. 2003, 48, 1569–1574. [Google Scholar] [CrossRef]
  21. Assael, M.J.; Gialou, K. Measurement of the Thermal Conductivity of Stainless Steel AISI 304L Up to 550 K. Int. J. Thermophys. 2003, 24, 1145–1153. [Google Scholar] [CrossRef]
  22. De, A.K.; Murdock, D.C.; Mataya, M.C.; Speer, J.G.; Matlock, D.K. Quantitative measurement of deformation-induced martensite in 304 stainless steel by X-ray diffraction. Scr. Mater. 2004, 50, 1445–1449. [Google Scholar] [CrossRef]
  23. Moser, N.H.; Gross, T.S.; Korkolis, Y.P. Martensite formation in conventional and isothermal tension of 304 austenitic stainless steel measured by X-ray diffraction. Metall. Mater. Trans. A 2014, 45, 4891–4896. [Google Scholar] [CrossRef]
  24. Hall, E.O. The deformation and ageing of mild steel: Discussion of results. Proc. Phys. Soc. 1951, 64, 747–753. [Google Scholar] [CrossRef]
  25. Petch, N.J. The cleavage strength of polycrystals. J. Iron Steel Inst. 1953, 174, 25–28. [Google Scholar]
  26. Hou, C.; Li, Z.; Huang, M.; Ouyang, C. Discrete dislocation plasticity analysis of single crystalline thin beam under combined cyclic tension and bending. Acta Mater. 2008, 56, 1435–1446. [Google Scholar] [CrossRef]
  27. Kocks, U.F.; Mecking, H. Physics and phenomenology of strain hardening: The FCC case. Prog. Mater. Sci. 2003, 48, 171–273. [Google Scholar] [CrossRef]
  28. Malygin, G.A. Plasticity and strength of micro- and nanocrystalline materials. Phys. Solid State 2007, 49, 1013–1033. [Google Scholar] [CrossRef]
  29. Curtze, S.; Kuokkala, V.-T.; Oikari, A.; Talonen, J.; Hänninen, H. Thermodynamic modeling of the stacking fault energy of austenitic steels. Acta Mater. 2011, 59, 1068–1076. [Google Scholar] [CrossRef]
  30. Olson, G.B.; Cohen, M. A General Mechanism of Martensitic Nucleation: Part III. Kinetics of Martensitic Nucleation. Metall. Mater. Trans. A 1976, 7, 1915–1923. [Google Scholar] [CrossRef]
  31. Olson, G.; Cohen, M. Kinetics of strain-induced martensitic nucleation. Metall. Trans. A 1975, 6, 791. [Google Scholar] [CrossRef]
  32. Mosecker, L.; Pierce, D.; Schwedt, A.; Beighmohamadi, M.; Mayer, J.; Bleck, W.; Wittig, J. Temperature effect on deformation mechanisms and mechanical properties of a high manganese C + N alloyed austenitic stainless steel. Mater. Sci. Eng. A 2015, 642, 71–83. [Google Scholar] [CrossRef]
  33. Talonen, J.; Hänninen, H. Formation of shear bands and strain-induced martensite during plastic deformation of metastable austenitic stainless steels. Acta Mater. 2007, 55, 6108–6118. [Google Scholar] [CrossRef]
  34. Saeed-Akbari, A.; Imlau, J.; Prahl, U.; Bleck, W. Derivation and Variation in Composition-Dependent Stacking Fault Energy Maps Based on Subregular Solution Model in High-Manganese Steels. Metall. Mater. Trans. A 2009, 40, 3076–3090. [Google Scholar] [CrossRef]
  35. Jun, J.-H.; Choi, C.-S. Variation of stacking fault energy with austenite grain size and its effect on the MS temperature of γ→ε martensitic transformation in Fe–Mn alloy. Mater. Sci. Eng. A 1998, 257, 353–356. [Google Scholar] [CrossRef]
  36. Souza Filho, I.R.; Sandim, M.J.R.; Cohen, R.; Nagamine, L.C.C.M.; Sandim, H.R.Z.; Raabe, D. Magnetic properties of a 17.6Mn-TRIP steel: Study of strain-induced martensite formation, austenite reversion, and athermal α’-formation. J. Magn. Magn. Mater. 2019, 473, 109–118. [Google Scholar] [CrossRef]
Figure 1. Cross section OM micrographs of base wire.
Metals 10 01304 g001
Figure 2. Cross section OM micrographs of drawn wires, 1st drawn wire of process A (A-1), 2nd drawn wire of process A (A-2), 1st drawn wire of process B (B-1), 2nd drawn wire of process B (B-2).
Metals 10 01304 g002
Figure 3. XRD patterns of two sets of drawn wires, XRD patterns of drawing process A (a) and B (b).
Metals 10 01304 g003
Figure 4. The engineering strain-stress curves of two sets of drawn wires, engineering stress-strain curves of drawing process A (a) and B (b).
Metals 10 01304 g004
Figure 5. The true strain-stress curves of two sets of drawn wires, true strain-stress curves of drawing process A (a) and B (b).
Metals 10 01304 g005
Figure 6. Liner scanning of the element distribution on cross section. (The red arrow line is the scanning routine).
Metals 10 01304 g006
Figure 7. Radial variation of temperature in wires.
Metals 10 01304 g007
Figure 8. 2D cloud diagrams of temperature distribution in wires.
Metals 10 01304 g008
Figure 9. Axisymmetric cloud diagrams of equivalent plastic strain distribution in wires.
Metals 10 01304 g009
Figure 10. Axisymmetric cloud diagrams of Von Mises stress distribution in wires.
Metals 10 01304 g010
Figure 11. Deviation of saturation magnetic induction Bs with the change of strain.
Metals 10 01304 g011
Figure 12. The AFM topography and MFM images of different region in base wire.
Metals 10 01304 g012
Figure 13. The AFM topography and MFM images of the 1st drawn wires.
Metals 10 01304 g013
Figure 14. Variation of SFE with the change of temperature.
Metals 10 01304 g014
Figure 15. Variation of Ms with the change of grain size.
Metals 10 01304 g015
Figure 16. The simplified schematic representation of the different phase transformations that occur under either an applied constant or increasing stress as a function of the deformation temperature. The stress where the phase transformation begins is at the yield strength, σY.
Metals 10 01304 g016
Table 1. Chemical composition of 304H stainless steel.
CCrNiSiMnPSMoN
0.0617.888.110.441.300.0320.0060.0350.1
Table 2. Drawing chains with their deformation parameters and temperatures.
Drawing Chain SequencesParametersBase Steel1st Drawn Wire2nd Drawn Wire
Chain ADiameter/mm2.62.141.94
Area reduction (AR)032%18%
True strain ε00.390.59
Temperature before and after drawing/°C2544 → 18628 → 175
Chain BDiameter/mm2.62.351.94
Area reduction (AR)018%32%
True strain ε00.200.59
Temperature before and after drawing/°C2545 → 18031 → 210
Table 3. The maximum and minimum values of the EDS results for the tested samples.
SampleThe Maximum or Minimum Detected Counting Number of ElementsCrMnNiSi
Base wireMax.18.461.347.880.56
Min.17.881.147.520.55
A-1Max.18.301.287.750.56
Min.17.561.047.360.54
A-2Max.18.451.337.560.56
Min.17.651.077.150.56
B-1Max.18.561.247.710.61
Min.17.710.987.270.59
B-2Max.18.411.137.720.58
Min.17.790.927.330.57

