Article

Hole-Edge Corrosion Expansion Monitoring Based on Lamb Wave

1
School of Energy and Power Engineering, Beihang University, Beijing 100191, China
2
Collaborative Innovation Centre for Advanced Aero-Engine, Beihang University, Beijing 100191, China
3
School of Reliability and Systems Engineering, Beihang University, Beijing 100191, China
*
Author to whom correspondence should be addressed.
Metals 2020, 10(11), 1469; https://doi.org/10.3390/met10111469
Submission received: 2 October 2020 / Revised: 31 October 2020 / Accepted: 2 November 2020 / Published: 4 November 2020
(This article belongs to the Special Issue Localized Corrosion of Metals and Alloys)

Abstract

:
Corrosion is a critical issue for engineered metallic components in mechanical and aerospace industries. Due to the complexity of aerospace aluminum alloy structure, corrosion is particularly tend to occur and expand in stress concentration areas, such as the edge of a hole, which causes the overall structure to be more likely to fail. In this paper, a Lamb wave-based active sensing method with improved sensors network was used to detect the hole-edge corrosion expansion. A0 wave packet of Lamb wave is extracted from signals, and two damage factors are used as characteristics of the signals. Probabilistic imaging algorithm is used to imaging and quantify the hole-edge corrosion area. Five corrosion extension tests show that the proposed method can effectively locate and quantify the hole-edge corrosion damage expansion of a single-hole structure; furthermore, the normalized amplitude damage index and phase change damage index can be used to predict hole-edge corrosion expansion effectively.

1. Introduction

Corrosion causes the loss of billions of dollars on an annual basis because of damage to structures worldwide [1]. The direct costs come in the form of premature deterioration or failure resulting in the need for maintenance, repair and/or replacement of damaged equipment. Corrosion is a representative modality of damage in metallic structures serving in humid or corrosive environments, such as aluminum alloy rivet hole [2]. When working in this environment, the rivet and aluminum alloy structure are prone to corrosion when there is moisture or fluid in the rivet and aluminum alloy structure. These defects are a real threat to the reliability of the structure, because they will grow rapidly and lead to catastrophic failure of the whole system [3]. Therefore, improving the understanding of corrosion in the initial stage is the key measure to prevent the deterioration and failure of these structures in the future. In the past, once corrosion was found in the key structure, it was considered ought to be repaired as soon as possible until completed. In fact, by increasing the frequency of monitoring, the structure can still be used until it must be replaced. The structure health monitor technology to monitor them can switch from scheduled maintenance to condition-based maintenance or replace time-consuming and labor-consuming nondestructive testing [4,5].
At present, there are many detection methods for corrosion, mainly including ultrasonic technology, magneto-optical imaging technology, magnetic particle testing technology, radiographic testing technology, eddy current testing technology, visual inspection method, etc. [6]. These methods are mainly used for regular maintenance, which are time-consuming, laborious and difficult to inspect the inaccessible parts. The corrosion damage of the structure is increasing with the service time of the structure. When the corrosion reaches the damage tolerance during the empty window period of regular maintenance, the lag of maintenance leads to a great potential safety hazard.
In recent years, elastic waves, especially guided waves, have been increasingly studied and used to monitor structural damage [7,8]. Ultrasonic Lamb wave is particularly concerned in structure health monitoring (SHM) researches and the corrosion monitoring technology [9,10,11]. Jenot detected and evaluated the corrosion thickness of steel plate by measuring the group velocity of S0 mode Lamb wave [12]. The research showed that the group velocity of Lamb wave is very sensitive to the decrease of structure thickness. Rao et al. achieved thickness reconstruction of corrosion damage accurately by using the dispersion region of selected guided waves and reconstruction algorithm [13]. Piezoelectric (PZT) sensors were employed as another effective tool due to the high accuracy and high speed of response signal. Yu et al. used PZT sensors for corrosion damage monitoring in plate-like aluminum structures [14]. Thomas et al. designed a circular array of piezoelectric disk active sensors to detect material loss in thin plates [15]. Recently, corrosion damage identification and location have been becoming a vital issue in the SHM field. Rathod proposed a method to quickly identify corrosion damage types and locate damage in metal plates, using wavelet coefficients to calculate the cumulative damage index under different damage sizes [16]. Rathod et al. used the symmetrical failure mode algorithm to locate the damage in plate-shaped aluminum [17]. Bao et al. used the transmitter beamforming and weighted image fusion based on the multiple signal classification algorithm to locate the corrosion damage on the thin plate [18]. Hua et al. used three different types of damage index to locate the corrosion damage of aluminum plate [19]. Adam Stawiarski et al. studied the fatigue damage initiation of isotropic circular hole plate by using elastic wave propagation phenomenon [20,21]. Marek Barski et al. designed an SHM system for crack length detection and evaluation, and carried out simulation and experimental verification [22]. Giurgiutiu et al. proposed the damage index (DI) based on root mean square value and Cohen type excitation cross time-frequency analysis, in order to quantitatively evaluate the corrosion damage of internal and external surfaces and the structural thickness loss [23]. However, there are few reports on monitoring the corrosion of rivet hole structure [24]. Rivet holes in aircraft aluminum alloy may be corroded by air or other factors; therefore, it is necessary to investigate the corrosion damage around rivet holes.
In this study, a Lamb wave-based on active sensing method with improved sensors network design was improved to detect the hole-edge corrosion expansion. A hole-edge corrosion monitoring experiment for aluminum alloy plate based on Lamb waves was designed. A real corrosion environment of rivet hole was simulated during experiments, then the corrosion area was expanded in turn. The probability imaging algorithm was used to image and quantify the corrosion area. Two Dis, namely, normalized amplitude and phase change, were extracted from the A0 wave packet for predicting the area of corrosion damage. In the forthcoming section of this paper, the propagation of guided waves and the extraction of characteristic parameters are briefly introduced. Then, the propagation of corrosion damage at the hole-edge of single-hole aluminum alloy plate is monitored. The imaging results are quantitatively analyzed and compared with the evaluation results of two damage indexes. Finally, a conclusion is drawn.

2. Background

2.1. Guided Wave in Aluminum Alloy

Generally speaking, there are two kinds of layout when using piezoelectric sensor to monitor damage: pitch-catch and pulse-echo [25]. Pitch-catch is used in this study, and its principle is shown in Figure 1. The PZT transducer generates ultrasonic guided waves which propagate into the structure, interact with the corrosion damage, carry the damage information, and are picked up by another PZT transducer. For structural discontinuities, with corrosion intersecting or approaching one or more sensors path, wave signals propagating along the affected path are modulated, and information about damage can be obtained from detected signals. Guided waves can propagate in the structure with minimum distortion and are sensitive to induced defects. When a propagating guided wave encounters a discontinuity in the geometry of the structure, the wave will be scatted, reflected, and mode converted [26].
Time of flight (ToF) and time window of guided wave signal are important research objects in damage detection. ToF is the time of flight from an actor to a receiver. It can be used to express the propagation distance and calculate the propagation velocity. The calculated time window is the main component of the received signal with relatively large amplitude and more information and energy. The time window is the time duration between Tstart and Tend, which are given in Equations (1) and (2), respectively:
T start = T 1 + T oF 1 2 T 0
T end = T 1 + T oF + 1 2 T 0
where T1 represents the wave excitation time of an actuator, which is the middle time point of T0 time window, ToF is the time of flight from an actuator to a receiver, and T0 is the period of excitation wave envelope. The time window is illustrated in Figure 2.
The current methodology used for the diagnostic process is based on comparing the current sensor responses to previously recorded “baseline” sensor responses from the undamaged structure. The baseline is the health signal measured by the PZT sensors when the structure is undamaged. The difference between the damage signal and health signal contains information about existing damage [27].

2.2. Corrosion Damage Parameters Selection

The damage characteristic parameters used in the existing references represent the characteristic difference between the damage signal and the baseline signal, and the influence of corrosion damage on the signal is quantitatively analyzed [28,29]. For the hole-edge corrosion damage, the common damage factors included normalized amplitude, phase difference, and so on [2]. In this study, two parameters related to amplitude and phase, respectively, were extracted from signals as two damage factors.
When an elastic wave travels through a region where material properties change, wave scattering and transmitting occurs [30]. As shown in Figure 3a, when the excitation signal from piezoelectric sensor propagates through the corrosion damage area, it interacts with the damage edge and alters the wave amplitude. The response signals are influenced by several factors, including the power of the input signal, attenuation of the signal, geometry of monitored structure, sensor array, and so on. A way to partially alleviate this situation can be achieved through normalization of the sensor signal. In this study, the Hilbert energy spectrum values of the baseline signal and the damage signal are calculated for signal normalization [31]. The damage index is defined as the normalization of signal amplitude difference, which according to the energy spectrum values before and after the damage is determined as:
D IE = | E h E d | max ( E h , E d )
where E h and E d are the maximum energy value of Lamb wave signal in health state and damage state, respectively. The maximum energy value is defined as the amplitude of the signal after normalization.
When the excitation signal passes through the corrosion damage area, it will bypass the damage as shown in Figure 3b. The red line is the baseline signal and the blue line is the damage signal. The propagation path of wave and the arrival time of wave packet increase Δt. When the corrosion area expands, the thickness of structure decreases. In terms of dispersion nature of guided wave, the product of wave frequency and structural thickness will changes, so that the velocity of guided wave and the arrival time also change. Therefore, the damage factor of wave phase is expressed as:
D IP = T d T h T h
where T h is the ToF of direct wave of health signal and T d is the ToF of direct wave of damage signal.
Probabilistic imaging algorithm is used to image the hole-edge corrosion damage expansion. As shown in Figure 4, transducer A is for excitation and transducer S is for receiving. There are 6 sensors in the figure, corresponding to 30 paths. Assuming that a certain echo is caused by defect M, then its path is AM + MS, which is a constant. Then, A and S are two focuses of ellipses. After calculating the damage probability of the monitoring point for each single path in the elliptical region, the damage probability of this point is obtained by the sum of these damage probabilities for all the paths in the piezoelectric sensor array.
Next, the damage probability of each point (x,y) of monitoring area is calculated as:
P ( x , y ) = k = 1 n T start T end θ ( L k ( x , y ) ) · D k 2 ( t ) d t
where P ( x , y ) is the possibility of each point (x,y) as the defect location, θ is the weight the k-th path to the point, D k ( t ) is the difference between the damage signal and the health signal of the k-th path, T start and T end are the start time and the end time of the extract time window respectively, L k is the relative distance of the point (x,y) to the k-th path, k is the path number, and n is the total number of paths.
The relative distance between each monitoring point M and the sensors A, S is expressed as:
L k ( x , y ) = d AM + d SM d AS 1
where d X Y is the distance between the point X and point Y. In order to express the importance of path AM + SM to the damage probability of monitoring point (x,y), the weight θ is defined as the correlation of the k-th path signal and the damage probability of the point (x,y), which is expressed as:
θ ( L k ( x , y ) ) = { 1 L k ( x , y ) β L k ( x , y ) < β 0 L k ( x , y ) β
where β is the coefficient. β increases when ellipse enlarges, and then the ellipse contains more paths. When the defect is on the sensor path, θ is considered to be 1. The weight of each point on the same ellipse is the same. The weight decreases as the ellipse enlarges, and eventually converges to 0. When the point (x,y) is on the path, L = 0 and θ = 1 .

3. Experimental Procedure

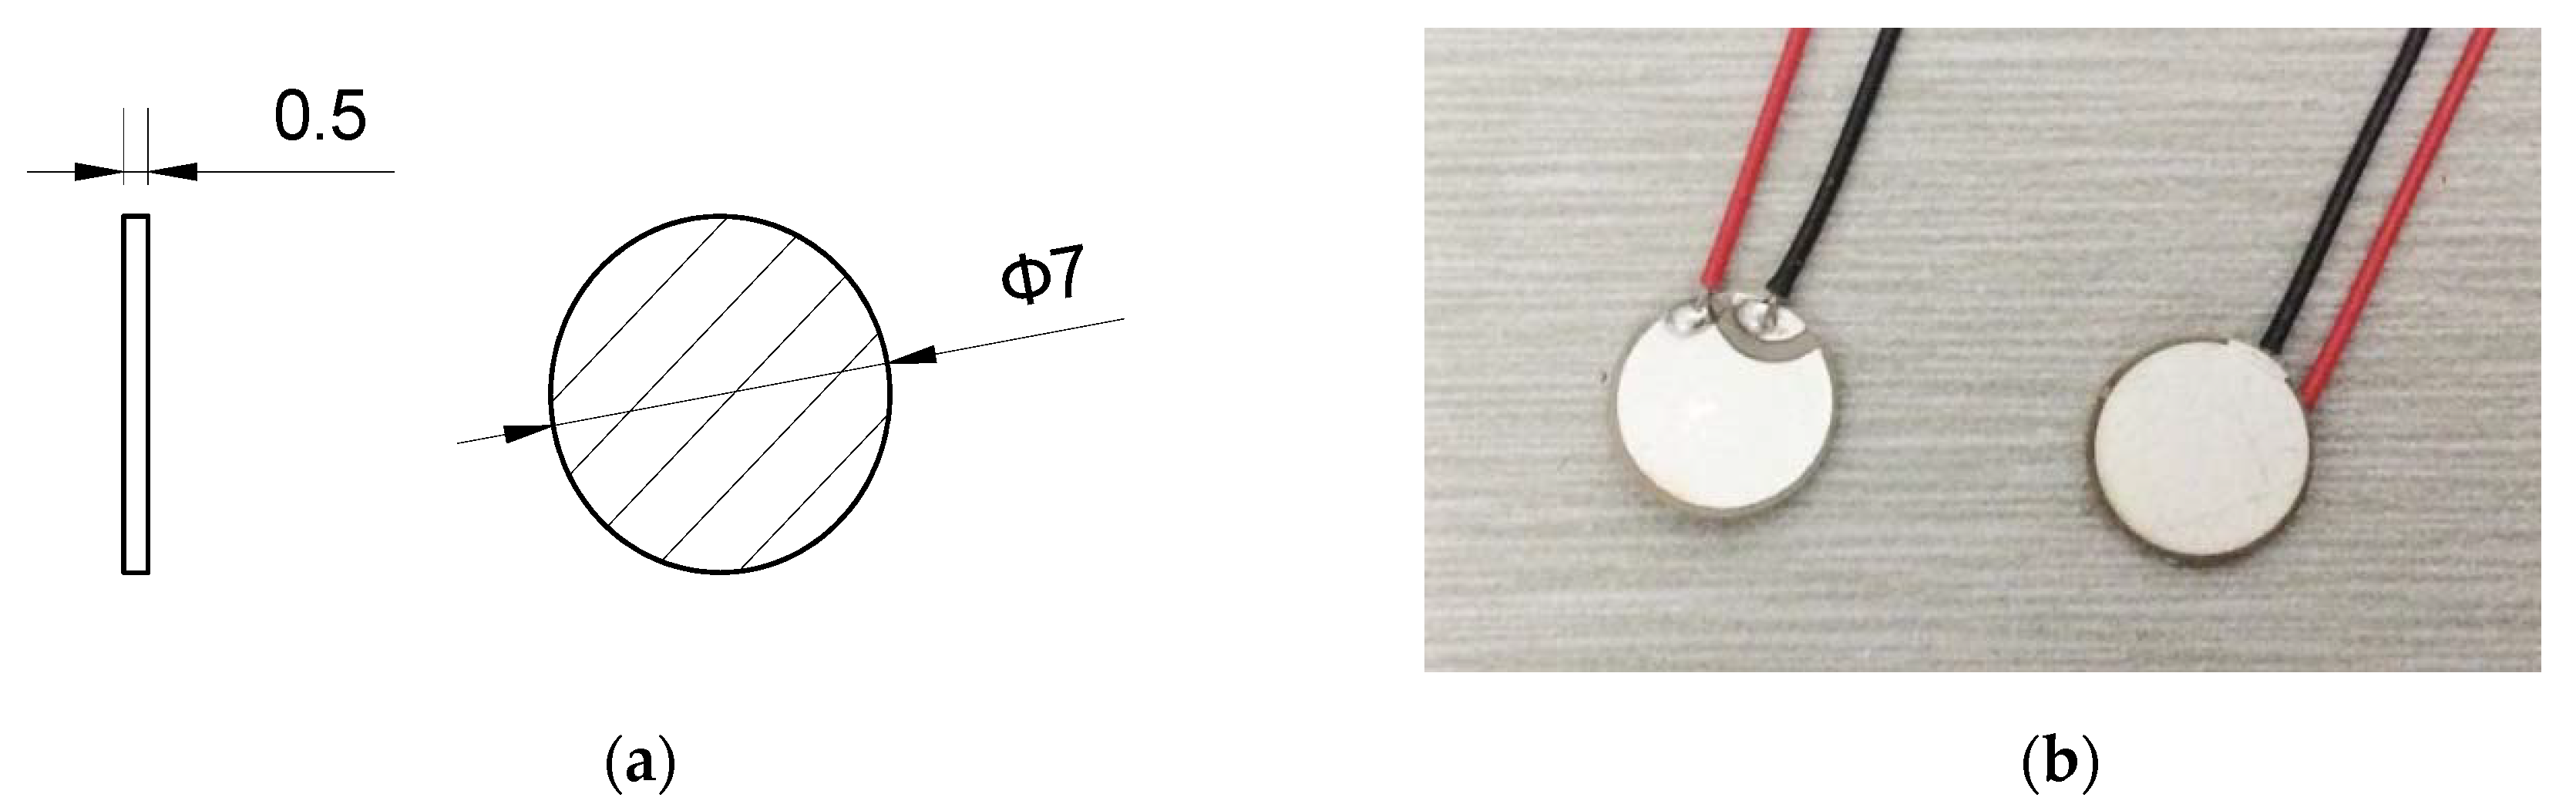
3.1. Experiment Equipment

ScanGenie-II integrated structural health monitoring scanning system produced by Acellent Technologies (Sunnyvale, CA, USA) is used in the experiment. The monitoring system accompanied with piezoelectric sensors array can achieve multi-site health monitoring scanning of a large area. The main technical indicators of the equipment are shown in Table 1. Figure 5 shows the overall test setup which includes ScanGenie-II piezoelectric monitoring device, piezoelectric sensors, digital acquisition software, signal generator, connecting box, and testing specimen. The appearance and geometry of the piezoelectric sensors used in this paper are shown in Figure 6, and the parameters are shown in Table 2.

3.2. Test Design

The specimen is made of aluminum 2024-T3 with the dimension of 400 mm × 200 mm × 2 mm. The material properties of specimen are summarized in the Table 3. A through hole with a diameter of 10 mm is made in the center of the specimen. The layout of the piezoelectric sensors is shown in Figure 7. PZT sensors are bonded to the surface of the aluminum plate numbered from 1 to 6 as shown in Figure 8. AW106 epoxy resin AB adhesive is selected to stick the sensors. A total of 30 effective sensing paths is achieved because the sensors are used as both transmitter and receptor.

3.3. Excitation Signal

In this study, the Acellent SMART Suitcase is used to record the pitch-catch signals of the piezoelectric sensors mounted on the specimens during the experiment. The diagnostic waveform from SMART Suitcase is a five-peak sine wave with a center frequency ranged from 50 kHz to 200 kHz. As shown in the Figure 9, when the product of frequency and specimen thickness is less than 0.7 MHz·mm, the Lamb wave has only two modes, i.e., A0 and S0. Such a frequency, in the non-dispersion region aforementioned, is lower than the cut-off frequencies of high-order modes in the aluminum plate, and as a consequence, only the S0 and A0 modes co-exist. As shown in Figure 2, at this frequency, the A0 mode features higher magnitude in a captured signal in comparison with the S0 mode [32]. Therefore, the time window of A0 wave packet is extracted. With the change of f · d , the group velocity of the A0 mode changes more significant than the S0 mode. It reflects that under the premise of fixed frequency, the A0 mode Lamb wave is more sensitive to the variation of the structural thickness, which is advantageous for the identification of corrosion defects.
The excitation signal is a smoothed 5-count Hann-windowed sine tone burst as shown in Figure 10. The expression of the excitation signal is [30]
u ( t ) = A [ H ( t ) H ( t N f c ) ] × ( 1 cos 2 π f c t N ) sin 2 π f c t
where f c is the central frequency of the signal, N is the number of crests, A is the signal amplitude, and H ( t ) is the Heaviside step function. The excitation signal of 90 kHz is shown in Figure 10. Through these means, it is intended that the dispersion effect is minimized and the characteristics of wave propagation is readily understood. The smoothed tone burst resulted from this process is numerically synthesized and stored in PC memory as the excitation signal. The sampling rate is 24 MSPS, and the sampling length is 10,000 points.

3.4. Corrosion Process

After the experiment setup, the Lamb wave for 30 actuator-sensor paths of health condition are obtained by the Acellent PZT device. The hole-edge damage in the center of specimen is made artificially with diameter of 10 mm. Hydrofluoric (HF) acid solution provided by Hengxing Reagents is used to make the artificial hole-edge corrosion on the specimen. The chemical compositions of hydrofluoric acid are shown in Table 4.
The corrosion experiments are carried out five times and the process of initial hole-edge corrosion is presented below. First, the corrosion-resistant PVC pipe with an inner diameter of 19 mm is fixed at the hole-edge corrosion position. An etching solution groove is formed on the surface of the aluminum plate. In order to prevent the corrosion solution from flowing out of the preset hole, the plastic piece is fixed with glass glue on the back side of the corrosion hole as shown in Figure 11. After the glass glue solidified, 8 mL of hydrofluoric acid is taken up using a medical syringe and completely injected into the PVC tube corrosive solution tank. In the preliminary test, hydrofluoric acid corrodes the surface of plate with bubbling. When no bubbles continue to be produced in the tank, the corrosion is completed. Finally, remove the PVC tube, glass glue and plastic piece.
In the second corrosion experiment, the corroded area is filled with glass glue, and a 22 mm diameter PVC pipe adhered to the aluminum alloy plate concentrically with the prefabricated hole with glass glue. After the glass glue is solidified, the same etching solution is poured into the same etching as in the previous step. In the following corrosion experiments, PVC pipes of different diameters are used to control the contact area between hydrofluoric acid solution and test piece, so as to control the corrosion area. Glass glue is filled in the corroded area to prevent the corrosion area from re-corrosion. According to the pre-test, the volume and time of corrosion solution are obtained, and the corrosion depth is 0.35 mm. Five corrosion states are shown in Figure 12, and the specific volume and time are shown in Table 5. After the corrosion reaction is over, the glue and PVC tube are removed and data are collected.

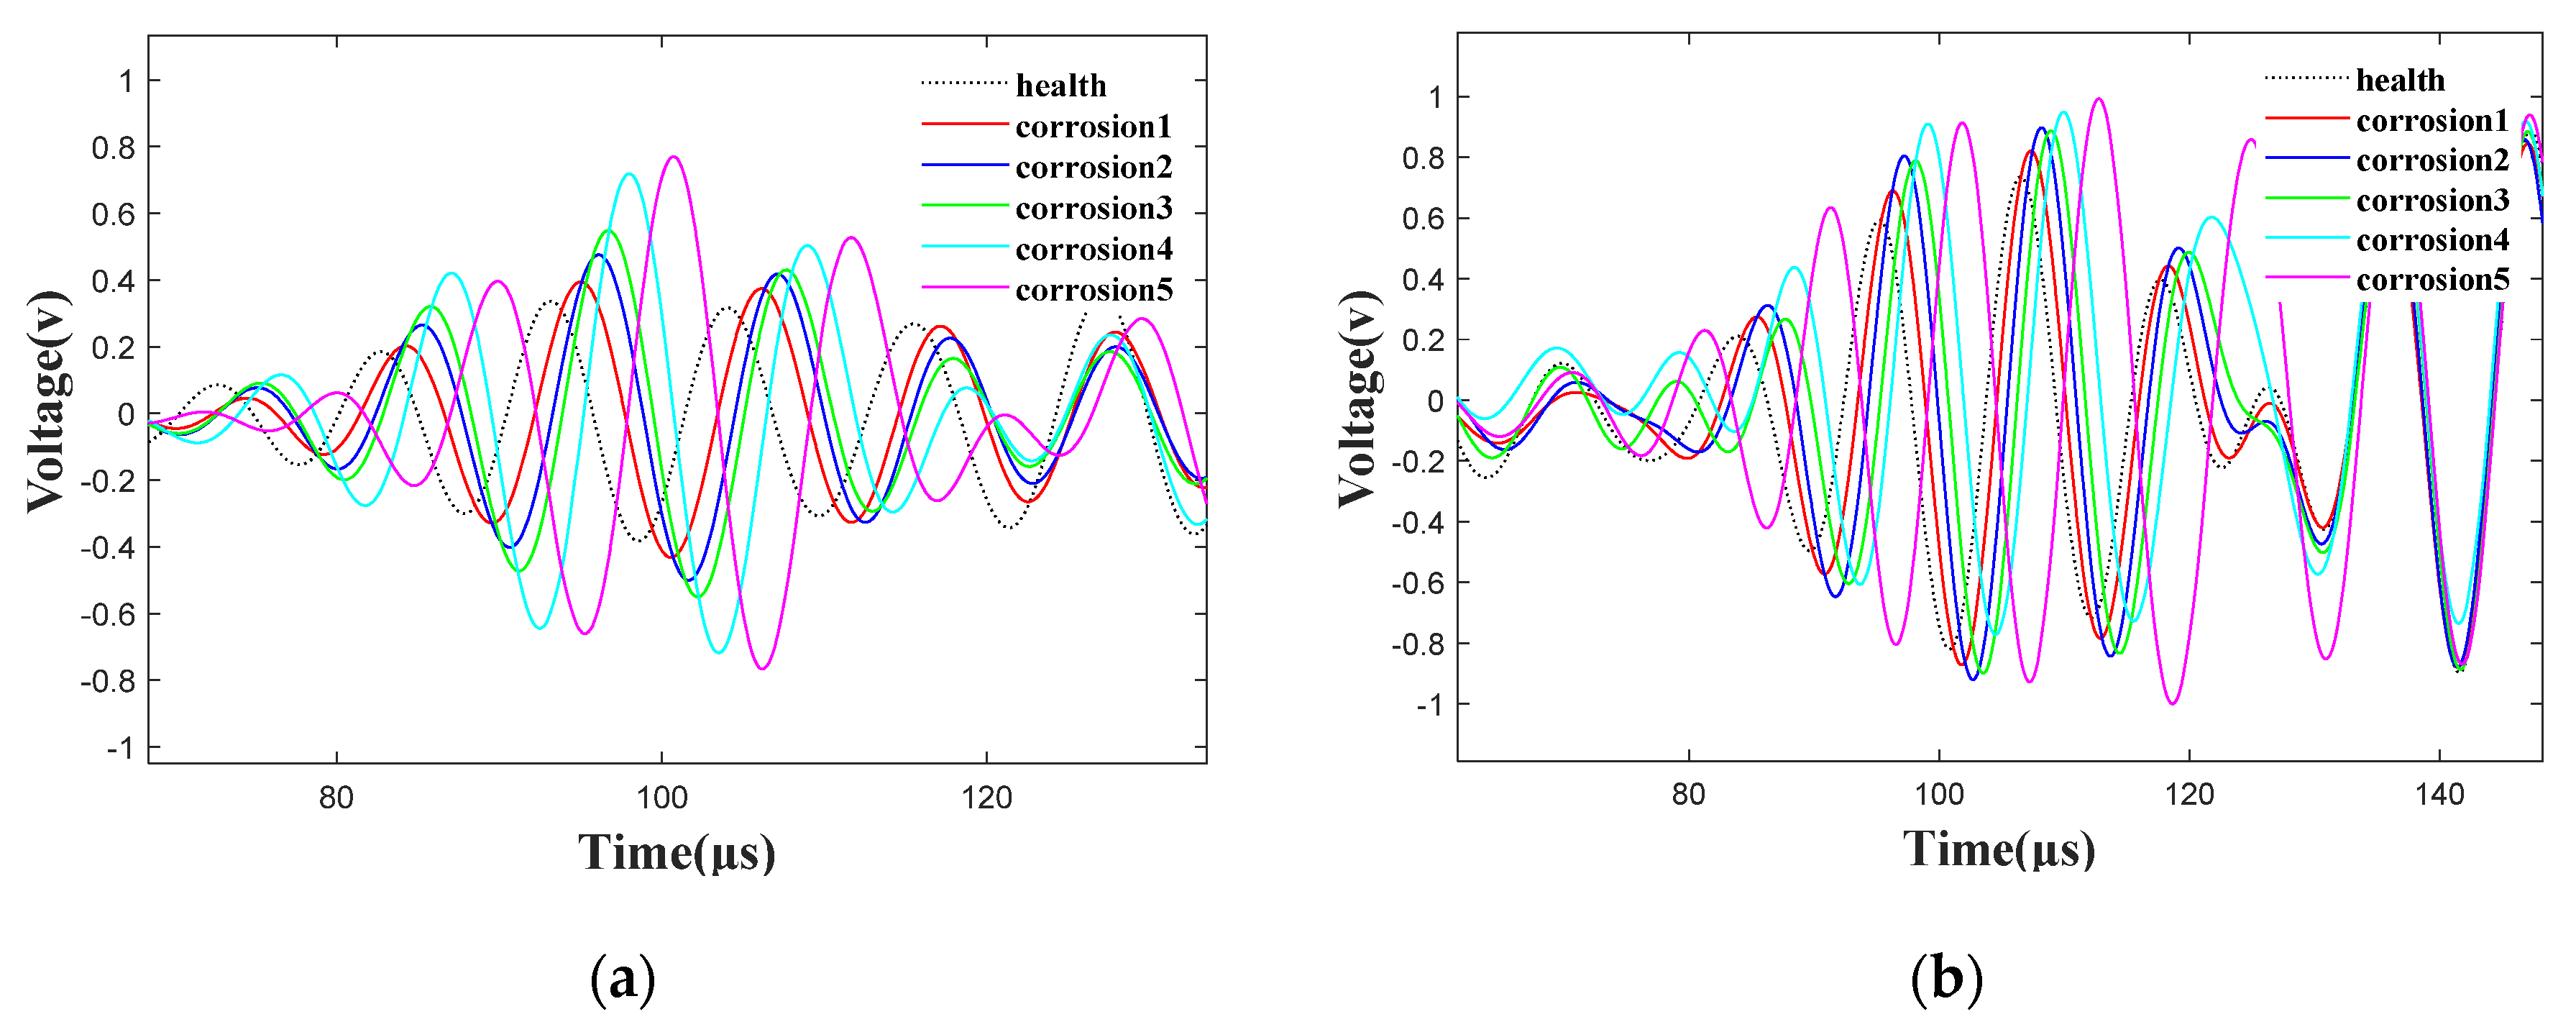
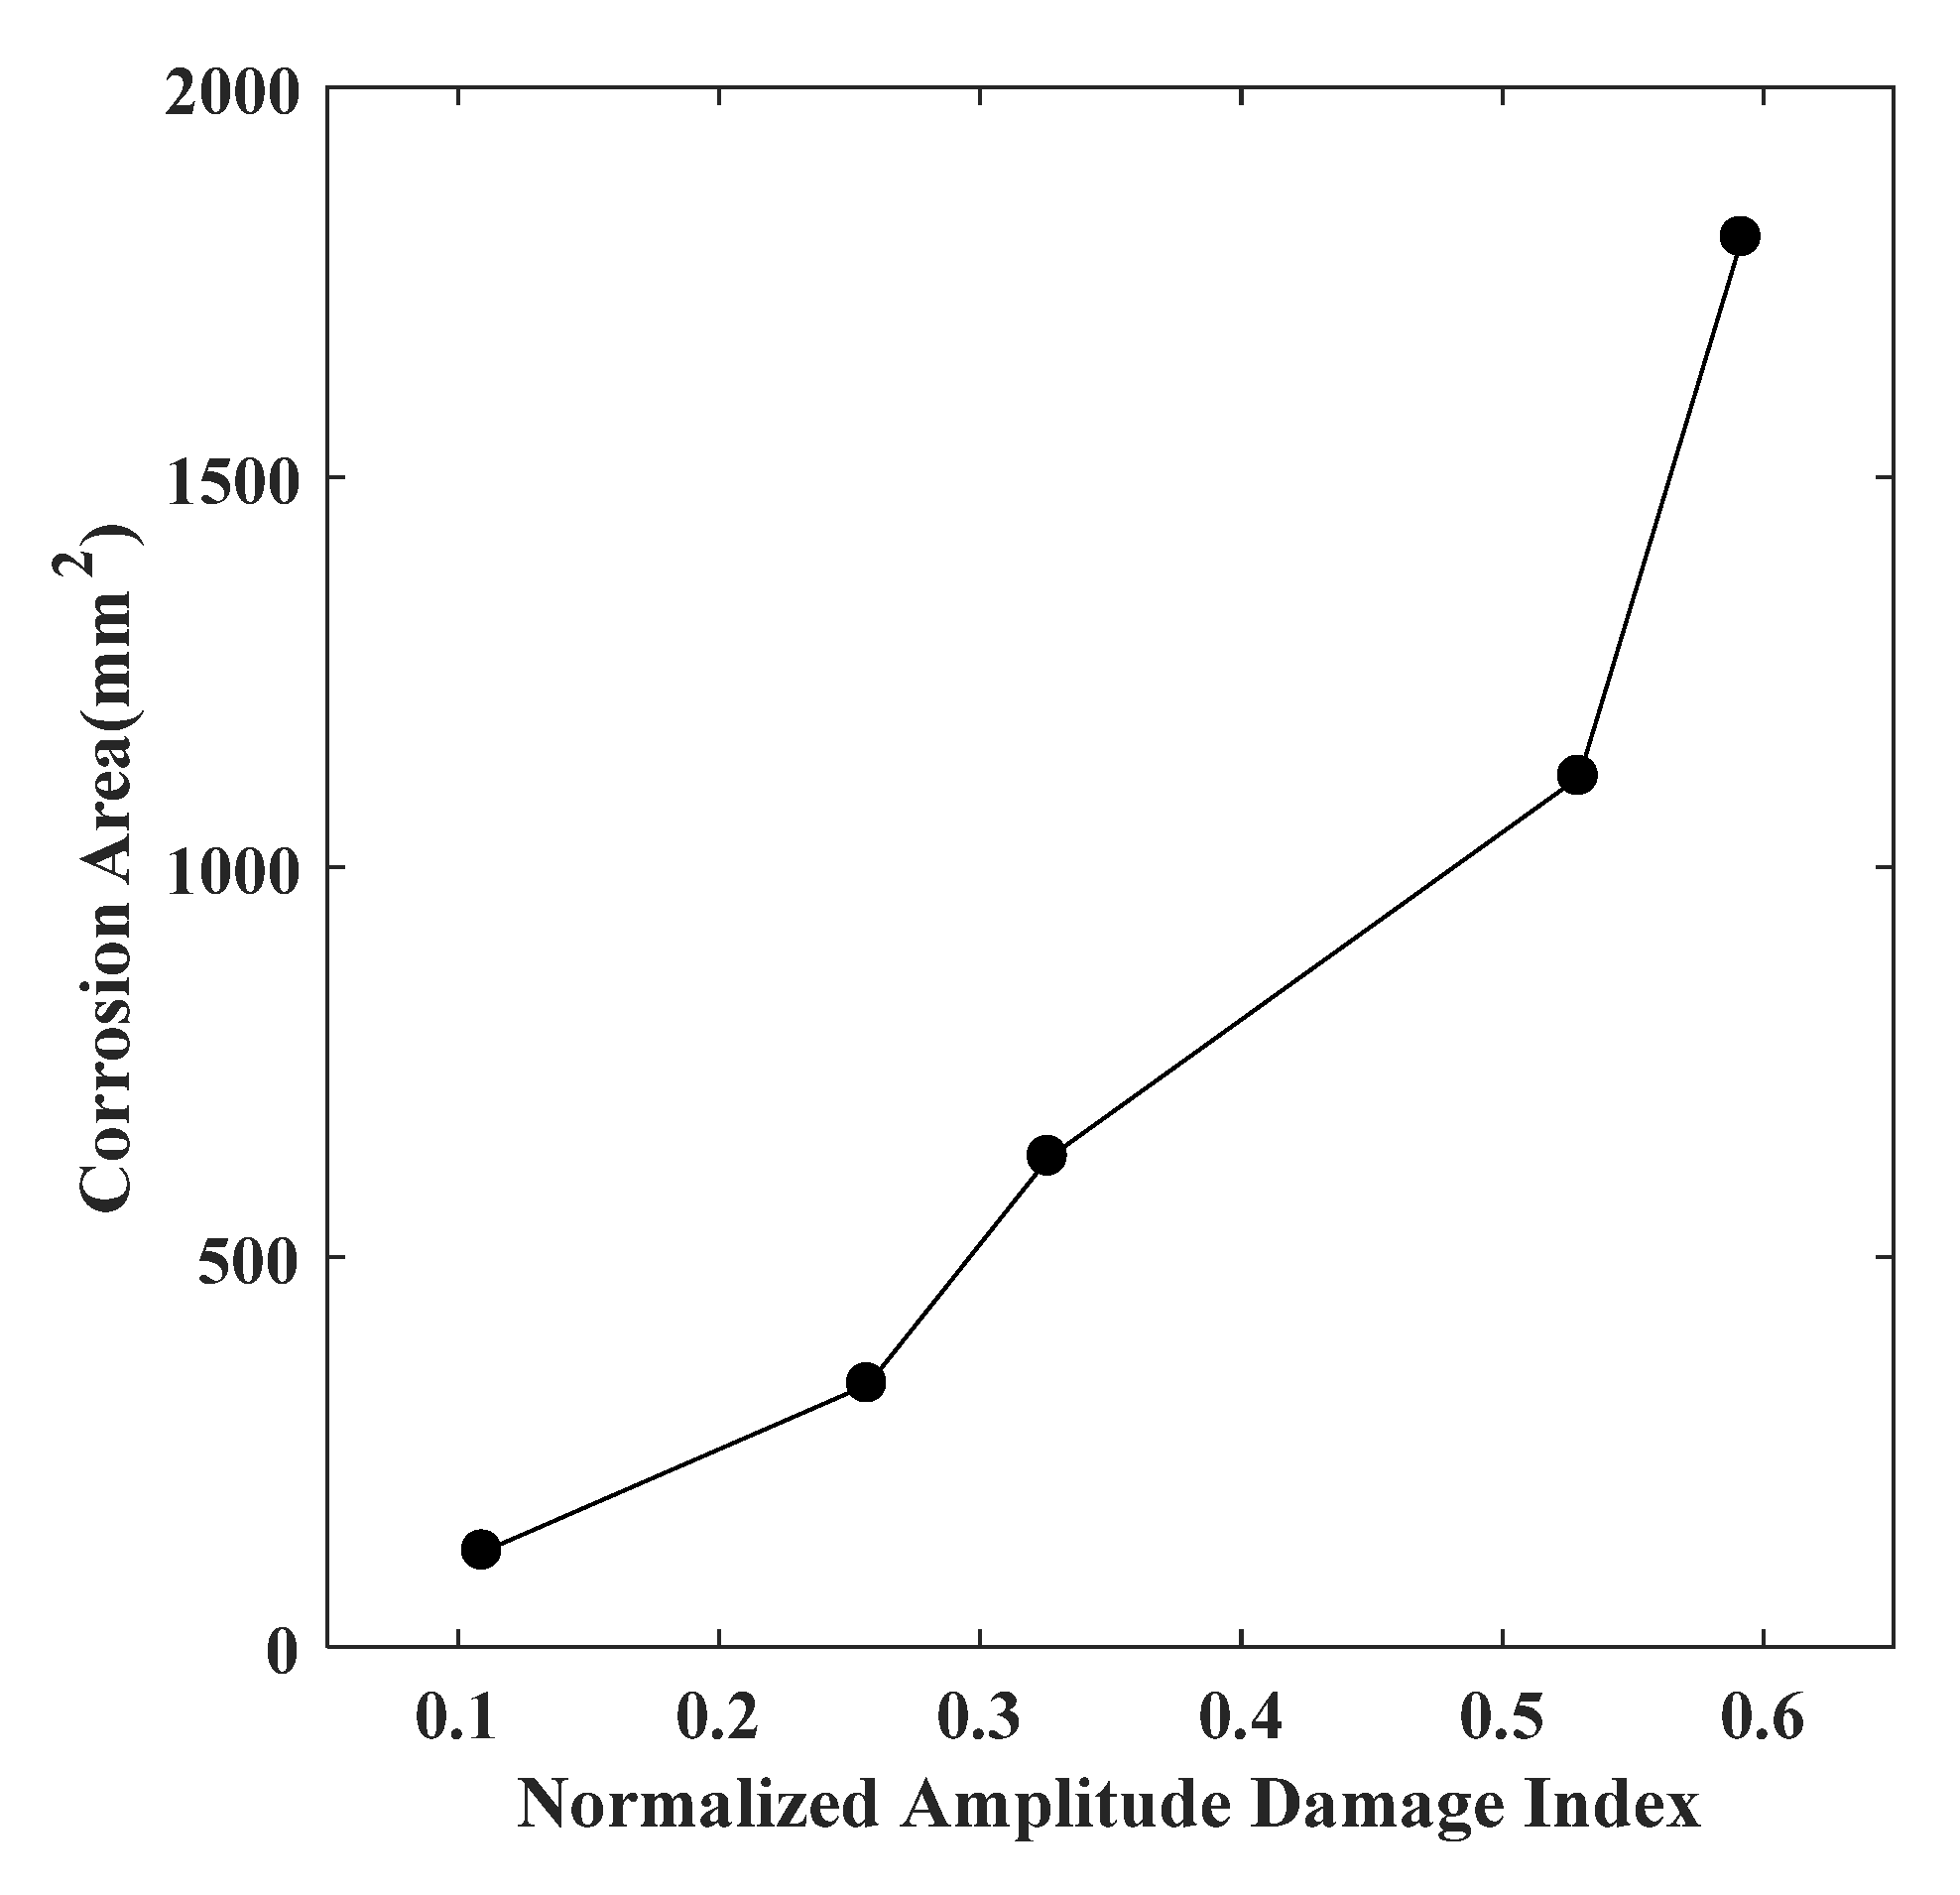
4. Results and Discussion

During corrosion experiment, both the health and damage signals are collected by Acellent device. Figure 13 shows the comparison of received signal of sensor pair 2–5 with and without corrosion damage. Each group of signals is collected six times to get the average value and filtered in order to eliminate the human error and the external environment noise. Figure 14a,b show the comparison of health signal and damage signal of sensor pair 2–5 and sensor pair 3–6, respectively.
Generally speaking, both the S0 and A0 modes can be used for identifying a variety of structural damage [33]. In recent years, some studies have shown that A0 mode has higher sensitivity to small damage at low frequency [34]. In order to identify the damage, the half-wavelength of the selected mode must be less than or equal to the damage size to allow the wave to interact with the damage. In this study, the wavelength of A0 at 90 kHz is 24.88 mm, and its half wavelength is 12.44 mm. The wavelength of S0 is 59.99 mm at 90 kHz, and its half wavelength is 29.99 mm. A0 mode has a shorter wavelength at the given excitation frequency, so it is more sensitive to the damage. At the same time, the A0 mode in the Lamb wave signal is usually have more energy than the S0 mode at a relatively low frequency (such as 90 kHz), resulting in high signal-to-noise ratio signals [35].
As can be seen from Figure 13, A0 mode is studied. One reason is that it is confirmed that A0 is more sensitive to corrosion damage than S0; another reason is, as shown in Figure 2, the amplitude of A0 is greater than S0, which is easier to extract wave packet for analysis. After the A0 wave packet is partial enlarged, as shown in Figure 14, it can be seen that with the expansion of the corrosion area, the amplitude of A0 wave packet increases gradually, and the phase shifts backward.
Generally speaking, when Lamb wave encounters damage, its amplitude will decrease. However, it can be clearly seen in Figure 13 and Figure 14 that the amplitude of A0 wave packet increases. One of the reasons for this is that, with the expansion of corrosion area, the thickness of the structure is reduced, and the proportion of damage become larger, which makes the attenuation of signal weaker. The other reason is that the mode conversion occurs when Lamb wave passes through the damage, and the S0 wave packet is transformed into A0 wave packet when passing through the defect. In addition, wave interference may also be one of the reasons [36]. Therefore, the amplitude of S0 decreases and the amplitude of A0 increases. However, due to the S0 wave packet submerged by the crosstalk, the A0 wave packet is used to extract characteristic parameters.
In order to facilitate observation after experiment, the specimen is cut to measure the real corrosion damage area by an optical microscope. Figure 15 shows the real and predicted corrosion damage of five times corrosion. The red area is identified as the corrosion damage area, which is closely consistent with the position of the corrosion area. The experimental prediction results are compared with the actual corrosion results to demonstrate the effectiveness of proposed method. Table 6 shows the corrosion state and corrosion area measurement results. The first predicted hold-edge corrosion damage area is 145.7 mm2. The first real hole-edge corrosion damage area is 122.5 mm2. The percentage error δ x refers to the error between the predicted damage and the real damage, which is calculated as:
δ x = | x 0 x | x × 100 %
where x is the area of real corrosion and x 0 is the area of predicted corrosion damage. The percentage error between the first predicted corrosion damage area and the first real corrosion damage area is 18.9%. With the increase of corrosion area, the error is relatively reduced. When the damage area increases, the imaging effect becomes more obvious. Thus, the variety of A0 wave packet is more obvious, and the imaging results are more accurate.
The formula (1) and (2) mentioned in Section 2.2 are used to calculate the damage factors, respectively, D I E and D I P . The curves related to the damage area are drawn respectively as shown in Figure 16 and Figure 17. It can be seen that with the increase of corrosion area, both the amplitude and the phase change of the A0 wave packet increase. The results show that D I E and D I P can reflect the variation trend of the damage size.

5. Conclusions

A Lamb wave-based active sensing method with improved sensor network design is presented to detect the hole-edge corrosion expansion. The method uses A0 mode Lamb waves to detect the corrosion damage expansion in an aluminum plate. With the development of the hole-edge corrosion propagation test, A0 mode is extracted from signals. Two damage indexes, namely, normalized amplitude and phase change, are used as characteristics of the signals. The probabilistic imaging algorithm is applied to calculate the possibility of each point as the defect location pixel matrix value. Five predicted images of corrosion damage are taken on the same aluminum alloy plate and used to estimate the actual corrosion size. Percentage error of damage area is calculated to detect the comparative difference between the predicted and actual results quantitatively. Through the above researches, quantitative detection of corrosion propagation at hole-edge is achieved using Lamb wave with the probabilistic imaging algorithm. Normalized amplitude damage index and phase change damage index can be used to characterize the corrosion area. Both normalized amplitude damage index and phase change damage index monotonically with the increase of corrosion area, so they can be used to predict hole-edge corrosion expansion.

Author Contributions

Conceptualization, X.W. and W.D.; methodology, W.Z.; software, D.X.; validation, X.W., Y.R. and R.W.; formal analysis, W.Z.; investigation, D.X.; resources, Y.R.; data curation, X.W.; writing—original draft preparation, Y.R.; writing—review and editing, X.W.; visualization, D.X.; supervision, Y.R.; project administration, W.Z.; funding acquisition, R.W. All authors have read and agreed to the published version of the manuscript.

Funding

This work was supported by the Technical foundation program (grant JSZL2019601C006) from the Ministry of Industry and Information Technology of China.

Conflicts of Interest

The authors declare no conflict of interest.

References

  1. Qing, X.P.; Beard, S.; Shen, S.B.; Banerjee, S.; Bradley, I.; Salama, M.M.; Chang, F.K. Development of a real-time active pipeline integrity detection system. Smart Mater. Struct. 2009, 18, 115010. [Google Scholar] [CrossRef]
  2. He, J.; Guan, X.; Peng, T.; Liu, Y.; Saxena, A.; Celaya, J.; Goebel, K. A multi-feature integration method for fatigue crack detection and crack length estimation in riveted lap joints using Lamb waves. Smart Mater. Struct. 2013, 22, 105007. [Google Scholar] [CrossRef]
  3. Salehnasab, B.; Poursaeidi, E.; Mortazavi, S.A.; Farokhian, G.H. Hot corrosion failure in the first stage nozzle of a gas turbine engine. Eng. Fail. Anal. 2016, 60, 316–325. [Google Scholar] [CrossRef]
  4. Leonard, K.R.; Malyarenko, E.V.; Hinders, M.K. Ultrasonic Lamb wave tomography. Inverse Probl. 2002, 18, 1795–1808. [Google Scholar] [CrossRef]
  5. Nondestructive Characterization and Monitoring of Advanced Materials, Aerospace, Civil Infrastructure, and Transportation XIII; SPIE: Bellingham, WA, USA, 2019.
  6. Watanabe, T.; Trang, H.T.H.; Harada, K.; Hashimoto, C. Evaluation of corrosion-induced crack and rebar corrosion by ultrasonic testing. Constr. Build. Mater. 2014, 67, 197–201. [Google Scholar] [CrossRef]
  7. Jurek, M.; Radzieński, M.; Kudela, P.; Ostachowicz, W. Non-contact excitation and focusing of guided waves in CFRP composite plate by air-coupled transducers for application in damage detection. Procedia Struct. Integr. 2018, 13, 2089–2094. [Google Scholar] [CrossRef]
  8. Prado, G.D.O.; Tamba, A.K.; Dotta, F.; Vieira, C.; Rulli, R.P.; Silva, G.R.; Moreira, J. Further Results of lamb waves approach to assess corrosion damage in an aeronautical aluminum alloy. In Proceedings of the 8th European Workshop On Structural Health Monitoring (EWSHM 2016), Bilbao, Spain, 5–8 July 2016. [Google Scholar]
  9. Capineri, L.; Bulletti, A.; Calzolai, M.; Francesconi, D. Piezopolymer interdigital transducers for a structural health monitoring system. Lect. Notes Electr. Eng. 2014, 268, 9–12. [Google Scholar]
  10. Hua, J.; Cao, X.; Yi, Y.; Lin, J. Time-frequency damage index of Broadband Lamb wave for corrosion inspection. J. Sound Vib. 2020, 464, 114985. [Google Scholar] [CrossRef]
  11. Canle, D.V.; Salmi, A.; Hggstrom, E. Non-contact damage detection on a rotating blade by Lamb wave analysis. NDT E Int. 2017, 92, 159–166. [Google Scholar] [CrossRef] [Green Version]
  12. Jenot, F.; Ouaftouh, M.; Duquennoy, M.; Ourak, M. Corrosion thickness gauging in plates using Lamb wave group velocity measurements. Meas. Sci. Technol. 2001, 12, 1287–1293. [Google Scholar] [CrossRef]
  13. Rao, J.; Ratassepp, M.; Fan, Z. Guided wave tomography based on full waveform inversion manuscript. IEEE Trans. Ultrason. Ferroelectr. Freq. Control 2016, 5, 737–745. [Google Scholar] [CrossRef]
  14. Yu, L.; Giurgiutiu, V.; Pollock, P. A multi-mode sensing system for corrosion detection using piezoelectric wafer active sensors. Proc. SPIE Int. Soc. Opt. Eng. 2008, 6932, 69321–69322. [Google Scholar]
  15. Thomas, D.T.; Welter, J.T.; Giurgiutiu, V. Corrosion damage detection with piezoelectric wafer active sensors. In Health Monitoring and Smart Nondestructive Evaluation of Structural and Biological Systems III; SPIE: San Diego, CA, USA, 2004; Volume 5394, p. 11. [Google Scholar]
  16. Rathod, V.T.; Mahapatra, D.R. Ultrasonic Lamb wave based monitoring of corrosion type of damage in plate using a circular array of piezoelectric transducers. NDT E Int. 2011, 44, 628–636. [Google Scholar] [CrossRef]
  17. Giridhara, G.; Rathod, V.T.; Naik, S.; Mahapatra, D.R.; Gopalakrishnan, S. Rapid localization of damage using a circular sensor array and Lamb wave based triangulation. Mech. Syst. Signal Process. 2010, 24, 2929–2946. [Google Scholar] [CrossRef]
  18. Bao, Q.; Yuan, S.; Guo, F.; Qiu, L. Transmitter beamforming and weighted image fusion–based multiple signal classification algorithm for corrosion monitoring. Struct. Health Monit. 2018, 18, 621–634. [Google Scholar] [CrossRef]
  19. Cao, X.; Zeng, L.; Lin, J.; Hua, J.; Lin, J. A correlation-based approach to corrosion detection with lamb wave mode cutoff. J. Nondestruct. Eval. 2019, 38, 87. [Google Scholar] [CrossRef]
  20. Stawiarski, A.; Barski, M.; Paj, P. Fatigue crack detection and identification by the elastic wave propagation method. Mech. Syst. Signal Process. 2017, 89, 119–130. [Google Scholar] [CrossRef]
  21. Method, W.P. On transducers localization in damage detection by wave propagation method. Sensors 2019, 19, 1937. [Google Scholar] [CrossRef] [Green Version]
  22. Barski, M.; Stawiarski, A. The crack detection and evaluation by elastic wave propagation in open hole structures for aerospace application. Aerosp. Sci. Technol. 2018, 81, 141–156. [Google Scholar] [CrossRef]
  23. Yu, L.; Giurgiutiu, V.; Wang, J.; Shin, Y.J. Corrosion detection with piezoelectric wafer active sensors using pitch-catch waves and cross-time-frequency analysis. Struct. Health Monit. 2012, 11, 83–93. [Google Scholar] [CrossRef]
  24. Dai, W.; Wang, X.; Zhang, M.; Zhang, W.; Wang, R. Corrosion monitoring method of porous aluminum alloy plate hole edges based on piezoelectric sensors. Sensors 2019, 19, 1106. [Google Scholar] [CrossRef] [Green Version]
  25. Chang, F.-K.; Yu, P.; Beard, S.; Kumar, A.; Qing, P.; Zhang, D.C. A new SMART sensing system for aerospace structures. Unmanned Syst. Technol. IX 2007, 6561, 656107. [Google Scholar]
  26. Zhu, W.; Rose, J.L.; Barshinger, J.N.; Agarwala, V.S. Ultrasonic guided wave NDT for hidden corrosion detection. Res. Nondestruct. Eval. 1998, 10, 205–225. [Google Scholar] [CrossRef]
  27. Tibaduiza, D.; Torres-arredondo, M.; Mujica, L.E.; Rodellar, J. A study of two unsupervised data driven statistical methodologies for detecting and classifying damages in structural health monitoring. Mech. Syst. Signal Process. 2013, 41, 1–18. [Google Scholar] [CrossRef]
  28. Pau, A.; Achillopoulou, D.V. Interaction of shear and Rayleigh-Lamb waves with notches and voids in plate waveguides. Materials 2017, 10, 841. [Google Scholar] [CrossRef] [Green Version]
  29. Wang, Q.; Hong, M.; Su, Z. An In-Situ Structural Health Diagnosis Technique and Its Realization via a Modularized System. IEEE Trans. Instrum. Meas. 2015, 64, 873–887. [Google Scholar] [CrossRef]
  30. Wilson, C.L.; Chang, F.K. Monitoring fatigue-induced transverse matrix cracks in laminated composites using built-in acousto-ultrasonic techniques. Struct. Health Monit. 2016, 15, 335–350. [Google Scholar] [CrossRef]
  31. Giurgiutiu, V. Piezoelectric Wafer Active Sensors for Structural Health Monitoring of Composite Structures Using Tuned Guided Waves. J. Eng. Mater. Technol. 2013, 133, 1–6. [Google Scholar] [CrossRef]
  32. Chen, J.; Su, Z.; Cheng, L. Identification of corrosion damage in submerged structures using fundamental anti-symmetric Lamb waves. Smart Mater. Struct. 2010, 19, 015004. [Google Scholar] [CrossRef] [Green Version]
  33. Hillger, W.; Pfeiffer, U. Structural health monitoring using lamb waves. In Proceedings of the 9th European NDT Conference (ECNDT), Berlin, Germany, 25–29 September 2006; pp. 1–7. [Google Scholar]
  34. Rao, J.; Ratassepp, M.; Lisevych, D.; Caffoor, M.H.; Fan, Z. On-line corrosion monitoring of plate structures based on guided wave tomography using piezoelectric sensors. Sensors 2017, 17, 2882. [Google Scholar] [CrossRef] [Green Version]
  35. Giurgiutiu, V. Tuned Lamb wave excitation and detection with piezoelectric wafer active sensors for structural health monitoring. J. Intell. Mater. Syst. Struct. 2005, 16, 291–305. [Google Scholar] [CrossRef]
  36. Masserey, B.; Fromme, P. Analysis of high frequency guided wave scattering at a fastener hole with a view to fatigue crack detection. Ultrasonics 2017, 76, 78–86. [Google Scholar] [CrossRef]
Figure 1. Monitoring principle of piezoelectric sensors based on guided wave.
Metals 10 01469 g001
Figure 2. Schematic illustration for the time window calculation.
Metals 10 01469 g002
Figure 3. Illustration of changes for Lamb waves passing through a corrosion. (a) Amplitude change, (b) phase change.
Metals 10 01469 g003
Figure 4. The probability imaging diagram.
Metals 10 01469 g004
Figure 5. The experiment device.
Metals 10 01469 g005
Figure 6. (a) Geometrical dimensions (mm) and (b) appearance of piezoelectric sensors.
Metals 10 01469 g006
Figure 7. The sensors network design of testing specimen (a) diagram (mm) (b) the real layout.
Metals 10 01469 g007
Figure 8. The layout of piezoelectric sensor network.
Metals 10 01469 g008
Figure 9. Dispersion curve of the Lamb wave in the tested aluminum plate.
Metals 10 01469 g009
Figure 10. Excitation signal of 90 kHz.
Metals 10 01469 g010
Figure 11. Sample being corroded.
Metals 10 01469 g011
Figure 12. Five corrosion states, from (a) to (e).
Metals 10 01469 g012
Figure 13. Comparison of health signal of sensor pair 2–5 and received signal of corrosion damage.
Metals 10 01469 g013
Figure 14. Partial enlargement of A0 wave packet of health signal and five times corrosion damage received signal of (a) sensor pair 2–5; (b) sensor pair 3–6.
Metals 10 01469 g014
Figure 15. Comparison of five times real corrosion damage and predicted damage, from (a) to (e).
Metals 10 01469 g015aMetals 10 01469 g015b
Figure 16. Normalized amplitude damage index versus corrosion area.
Metals 10 01469 g016
Figure 17. Phase change damage index versus corrosion area.
Metals 10 01469 g017
Table 1. Piezoelectric monitoring equipment technical indicators.
Device NumberScanGenie-II
Frequency10–700 kHz
Conversion Rates1.5, 6, 12, 24, 48 MHz
Integrated Power Amplifier±60 V
Memory16,000 Samples
Sampling Rates6, 12, 24, 48 MS/s
Resolution12-bit
ADC Range±1 V
Table 2. Performance of piezoelectric sensor.
Product NumberSMD07T05R412WL
MaterialSM412
Geometrydiameter: 7 mm
thickness: 0.5 mm
Resonance frequency4.25 MHz ± 5%
Electrostatic capacitance2.5 nF ± 30%
Table 3. Material properties of aluminum for experiment.
Specimen Material GradeAluminum 2024-T3
Poisson’s Ratio0.33
Density2.78 g/cc
Young’s Modulus73.1 GPa
Fatigue Strength130 MPa
Table 4. The chemical composition of hydrofluoric acid.
Molecular FormulaHF
Content of HF≥40%
Impurity content (%)Fe≤0.0001
Cl≤0.001
PO4≤0.0002
Heavy metal (Pb)≤0.0005
Fluorosilicate (SiF6)≤0.04
Others≤0.004
Table 5. Corrosion state and specific volume and time.
Corrosion StateAmount of Hydrofluoric Acid Added (mL)Corrosion Diameter (mm)Corrosion Area (mm2)Corrosion Time (h)
No Corrosion00
10 (hole)
0
78.5 (hole)
0
1st Corrosion816122.58
2nd Corrosion1023336.815
3rd Corrosion123062822.5
4th Corrosion14391115.527
5th Corrosion16491806.332
Table 6. Corrosion state and corrosion area measurement results.
Corrosion StateActual Corrosion Area
(mm2)
Predicted Corrosion Area
(mm2)
Percentage Error
No Corrosion0
(hole 78.5)
--
1st Corrosion122.5145.718.9%
2nd Corrosion336.8388.915.5%
3rd Corrosion628715.312.3%
4th Corrosion1115.51202.77.8%
5th Corrosion1806.31963.38.7%
Publisher’s Note: MDPI stays neutral with regard to jurisdictional claims in published maps and institutional affiliations.

