Investigation of Effects of Strip Metals and Relative Sliding Speeds on Friction Coefficients by Reversible Strip Friction Tests

Department of Mechanical and Electro-Mechanical Engineering, National Sun Yat-sen University, No. 70, Lein-Hai Rd., Kaohsiung 804, Taiwan
*
Author to whom correspondence should be addressed.
Metals 2020, 10(10), 1369; https://doi.org/10.3390/met10101369
Submission received: 12 September 2020
/
Revised: 10 October 2020
/
Accepted: 10 October 2020
/
Published: 14 October 2020
(This article belongs to the Special Issue Latest Hydroforming Technology of Metallic Tubes and Sheets)
Abstract
:Friction at the interface between strips and dies is an important factor influencing the formability of strip or sheet forming. In this study, the frictional behaviors of strips at variant speeds were investigated using a self-developed strip friction test machine with a dual tension mechanism. This friction test machine, stretching a strip around a cylindrical friction wheel, was used to investigate the effects of various parameters, including sliding speeds, contact angles, strip materials, and lubrication conditions on friction coefficients at the strip–die interface. The friction coefficients at the strip–die interface were calculated from the drawing forces at the strip on both ends and the contact angle between the strip and die. A series of friction tests using carbon steel, aluminum alloy, and brass strips as the test piece were conducted. From the friction test results, it is known that the friction coefficients can be reduced greatly with lubricants on the friction wheel surface and the friction coefficients are influenced by the strip roughness, contact area, relative speeds between the strip and die, etc. The friction coefficients obtained under various friction conditions can be applied to servo deep drawing or servo draw-bending processes with variant speeds and directions.
1. Introduction
Friction conditions between the workpiece and die influence the deformed sheet or strip material properties significantly. The surface grinding of the workpiece in contact with the die during the stretching process not only affects the finally stretched sheet surface quality, but also the formability of the forming process. The friction coefficient at the sheet–die interface is influenced by the surface roughness of the sheet and die, as well as the relative sliding speeds between the sheet and die and the contact pressure [1,2,3]. Tamai et al. [1] proposed a friction test apparatus, in which two identical compressive forces act on the test piece surfaces and a drawing force is imposed at one end of the test piece. The friction coefficient can be easily obtained from the force ratio. Tamai et al. [4] also developed a nonlinear friction coefficient model that considers contact pressure, sliding velocity, and sliding length to improve the accuracy of predictions of the formability of steel sheets. The effects of contact pressure and sliding velocity under mixed lubrication were estimated based on a friction test in which a long steel sheet was drawn between two dies. Servo press forming processes for a thin sheet utilize more complicated slide motion control, and the sliding direction of the material relative to the die is changed not only in sheet-forming but also in tube-forming processes. Such kinds of forming machines and forming processes are increasing [4]. Thus, it is important to investigate the friction characteristics when the slip direction is reversed in such a forming process.
Some researchers have proposed some friction test methods to measure friction coefficients in sheet-forming processes. For example, Weinmann et al. [5] proposed a friction coefficient measuring apparatus in which a metal strip is bent into a U shape through two fixed cylindrical friction pins. From the interaction of the pin and strip, coefficients of friction were calculated. Saha and Wilson [6] also conducted similar friction tests. They found that the friction coefficients of the steel sheet with the pins increased with the strip strain. That is because the plastic strain affected the strip surface roughness and the actual contact surface area. However, the friction coefficients from aluminum strip friction tests decreased with the strip strain because the severe plastic deformation made the contact area smaller. Hsu and Kuo [7] discussed the effects of dry friction and lubrication conditions on the friction coefficient and developed a boundary friction model, including plowing phenomena and bonding stresses. Kim et al. [8] measured the friction coefficient to investigate the friction characteristics of a coated metal and found that tool steel STD11 and copper alloys AMPCO have better surface roughness and formability than other metals. Lemu and Trzepiecinski [9] explored the friction behavior of steel, brass, and aluminum alloys with a self-developed friction test apparatus and discussed the effects of the deformation strains on the friction coefficient under dry and lubricated conditions. Ramezani et al. [10] used a steel pin as the counterpart under dry sliding conditions to investigate the friction coefficients of ZE10 and AZ80 magnesium alloys numerically and experimentally. The experimental results showed that increasing contact pressure lead to an increase in coefficient of friction for both alloys, while the effect of sliding speed was negligible. Fridmen and Levesque [11] investigated the effects of sonic vibrations on the coefficient of static friction for highly polished, ground, and sand-pitted steel surfaces. The coefficient of static friction could virtually be reduced to zero as a result of increased vibrations at frequencies between 6 and 42 kHz. Chowdhury et al. [12] carried out friction experiments under a normal load of 10–20 N and rotation speed of 500–2500 rpm. The experimental results showed that the friction coefficient decreased with the increase of sliding speed and normal load for aluminum sheets. They also found that the wear rates increased with the increase of sliding speed and normal load. Saha [13] developed a sheet tensile testing apparatus to measure the friction coefficient under various conditions. It was found that the friction force of the steel sheet increased with the plastic strain. That is because of a larger sheet roughness and a larger actual contact surface.
The level of generated vibrations is one of the most important exploitation parameters of rolling bearings. Adamczak and Zmarzły [14] examined five pieces of type 6304 ball bearings by measuring 2D and 3D roughness parameters of the bearings races with a contact method on a Form Talysurf PGI 1230 device made by Taylor Hobson. Statistical analysis based on the correlation calculation was used to evaluate the impact of 2D and 3D roughness parameters of active surfaces of rolling bearings on the level of generated vibrations. Ali et al. [15] adopted an experimental study to minimize the boundary friction coefficient via nanolubricant additives. The tribological characteristics of Al2O3 and TiO2 nanolubricants were evaluated under reciprocating test conditions to simulate a piston ring/cylinder liner interface in automotive engines. The experimental results have shown that the boundary friction coefficient reduced by 35%–51% near the top and bottom dead center of the stroke for the Al2O3 and TiO2 nanolubricants. Escosa et al. [16] evaluated the influence of both coating and austenitization treatment of 22MnB5 steel on friction and wear of tool steels. The results showed that Al–10%Si reduced the friction coefficient, while the hardening treatment resulted in an increase of friction coefficient due to Fe2Al5 brittle compounds. Wu et al. [17] investigated the friction and wear properties of the textured surfaces as well as the relationship between the tribological properties and the texture parameters by high-speed dry sliding tests. The results showed that the dimple textured titanium surfaces filled with molybdenum disulfide solid lubricants can effectively reduce the friction coefficient, as well as its fluctuation, compared with the untextured samples and textured samples without lubricants.
The above literature investigated the friction coefficients under only one pass of friction test with one kind of tested strip material. In this paper, a reversible friction test machine with a capacity of forward and backward moving directions was developed. A series of friction tests with multiple stages were conducted to make the friction situations similar to the loading path of a servo press. The effects of relative sliding speeds, different strip materials, strip contact angles, lubrication conditions, etc., on the friction coefficients are discussed.
2. Determination of Friction Coefficient
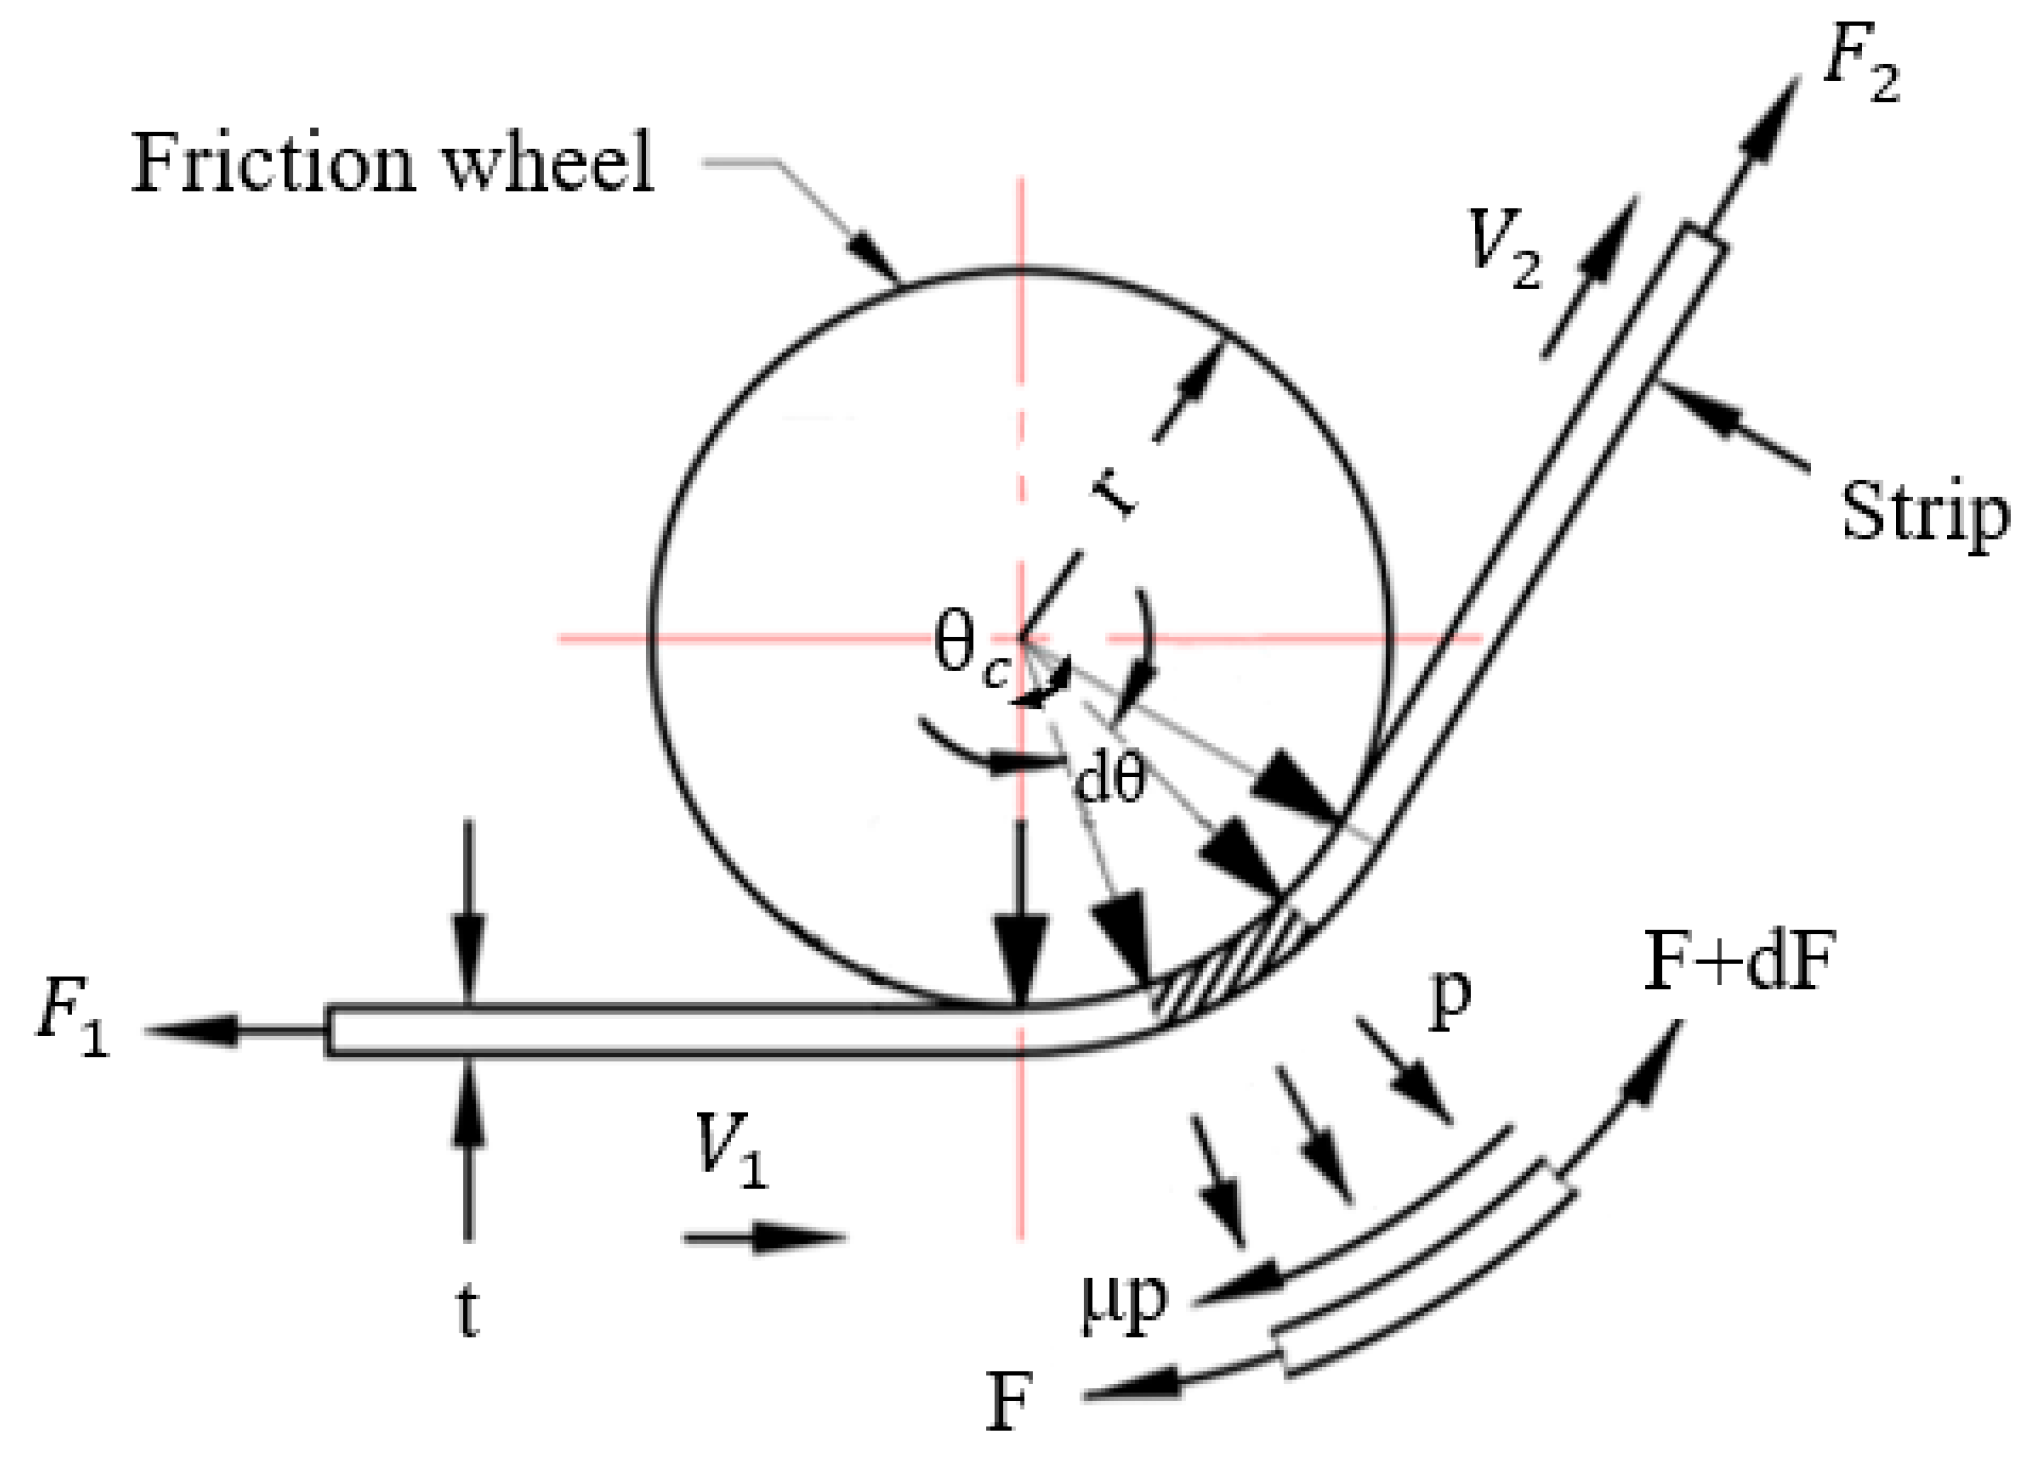
The geometric configurations between a strip and a friction wheel is shown in Figure 1. Bending and pulling of the strip are implemented by forces F1 and F2 acting on the two ends of the strip. A contact angle θc between the friction wheel and strip can be adjusted by changing the direction of F2. As F2 > F1, the strip moves forward. On the contrary, as F2 < F1, the strip moves backward.
From the free body diagram shown in Figure 1, the force equilibrium in the radial direction yields:
where w is the strip width and r is the friction wheel radius. The term of dFsin(dθ/2) can be ignored and sin(dθ/2) is approximately equal to dθ/2. Thus, the contact pressure p can be obtained as below:
From the force equilibrium in the circumferential direction, we can get:
The above equation can be simplified as below:
Substituting Equation (2) into Equation (4) and after definite integration, we get:
Taking exponential function on both sides yields
where c is the integral constant. From the boundary condition, F = F1 as θ = 0°, we get
At θ = θc, F2 can be obtained as follows:
From the above equation, the friction coefficient at the interface of the trip and friction wheel can be obtained as a function of F2, F1 and θc as below:
For a thick sheet, the bending effect has to be considered. Please refer to Reference [18] for the friction coefficient formula derivation.
3. Experimental Apparatus and Friction Test Conditions
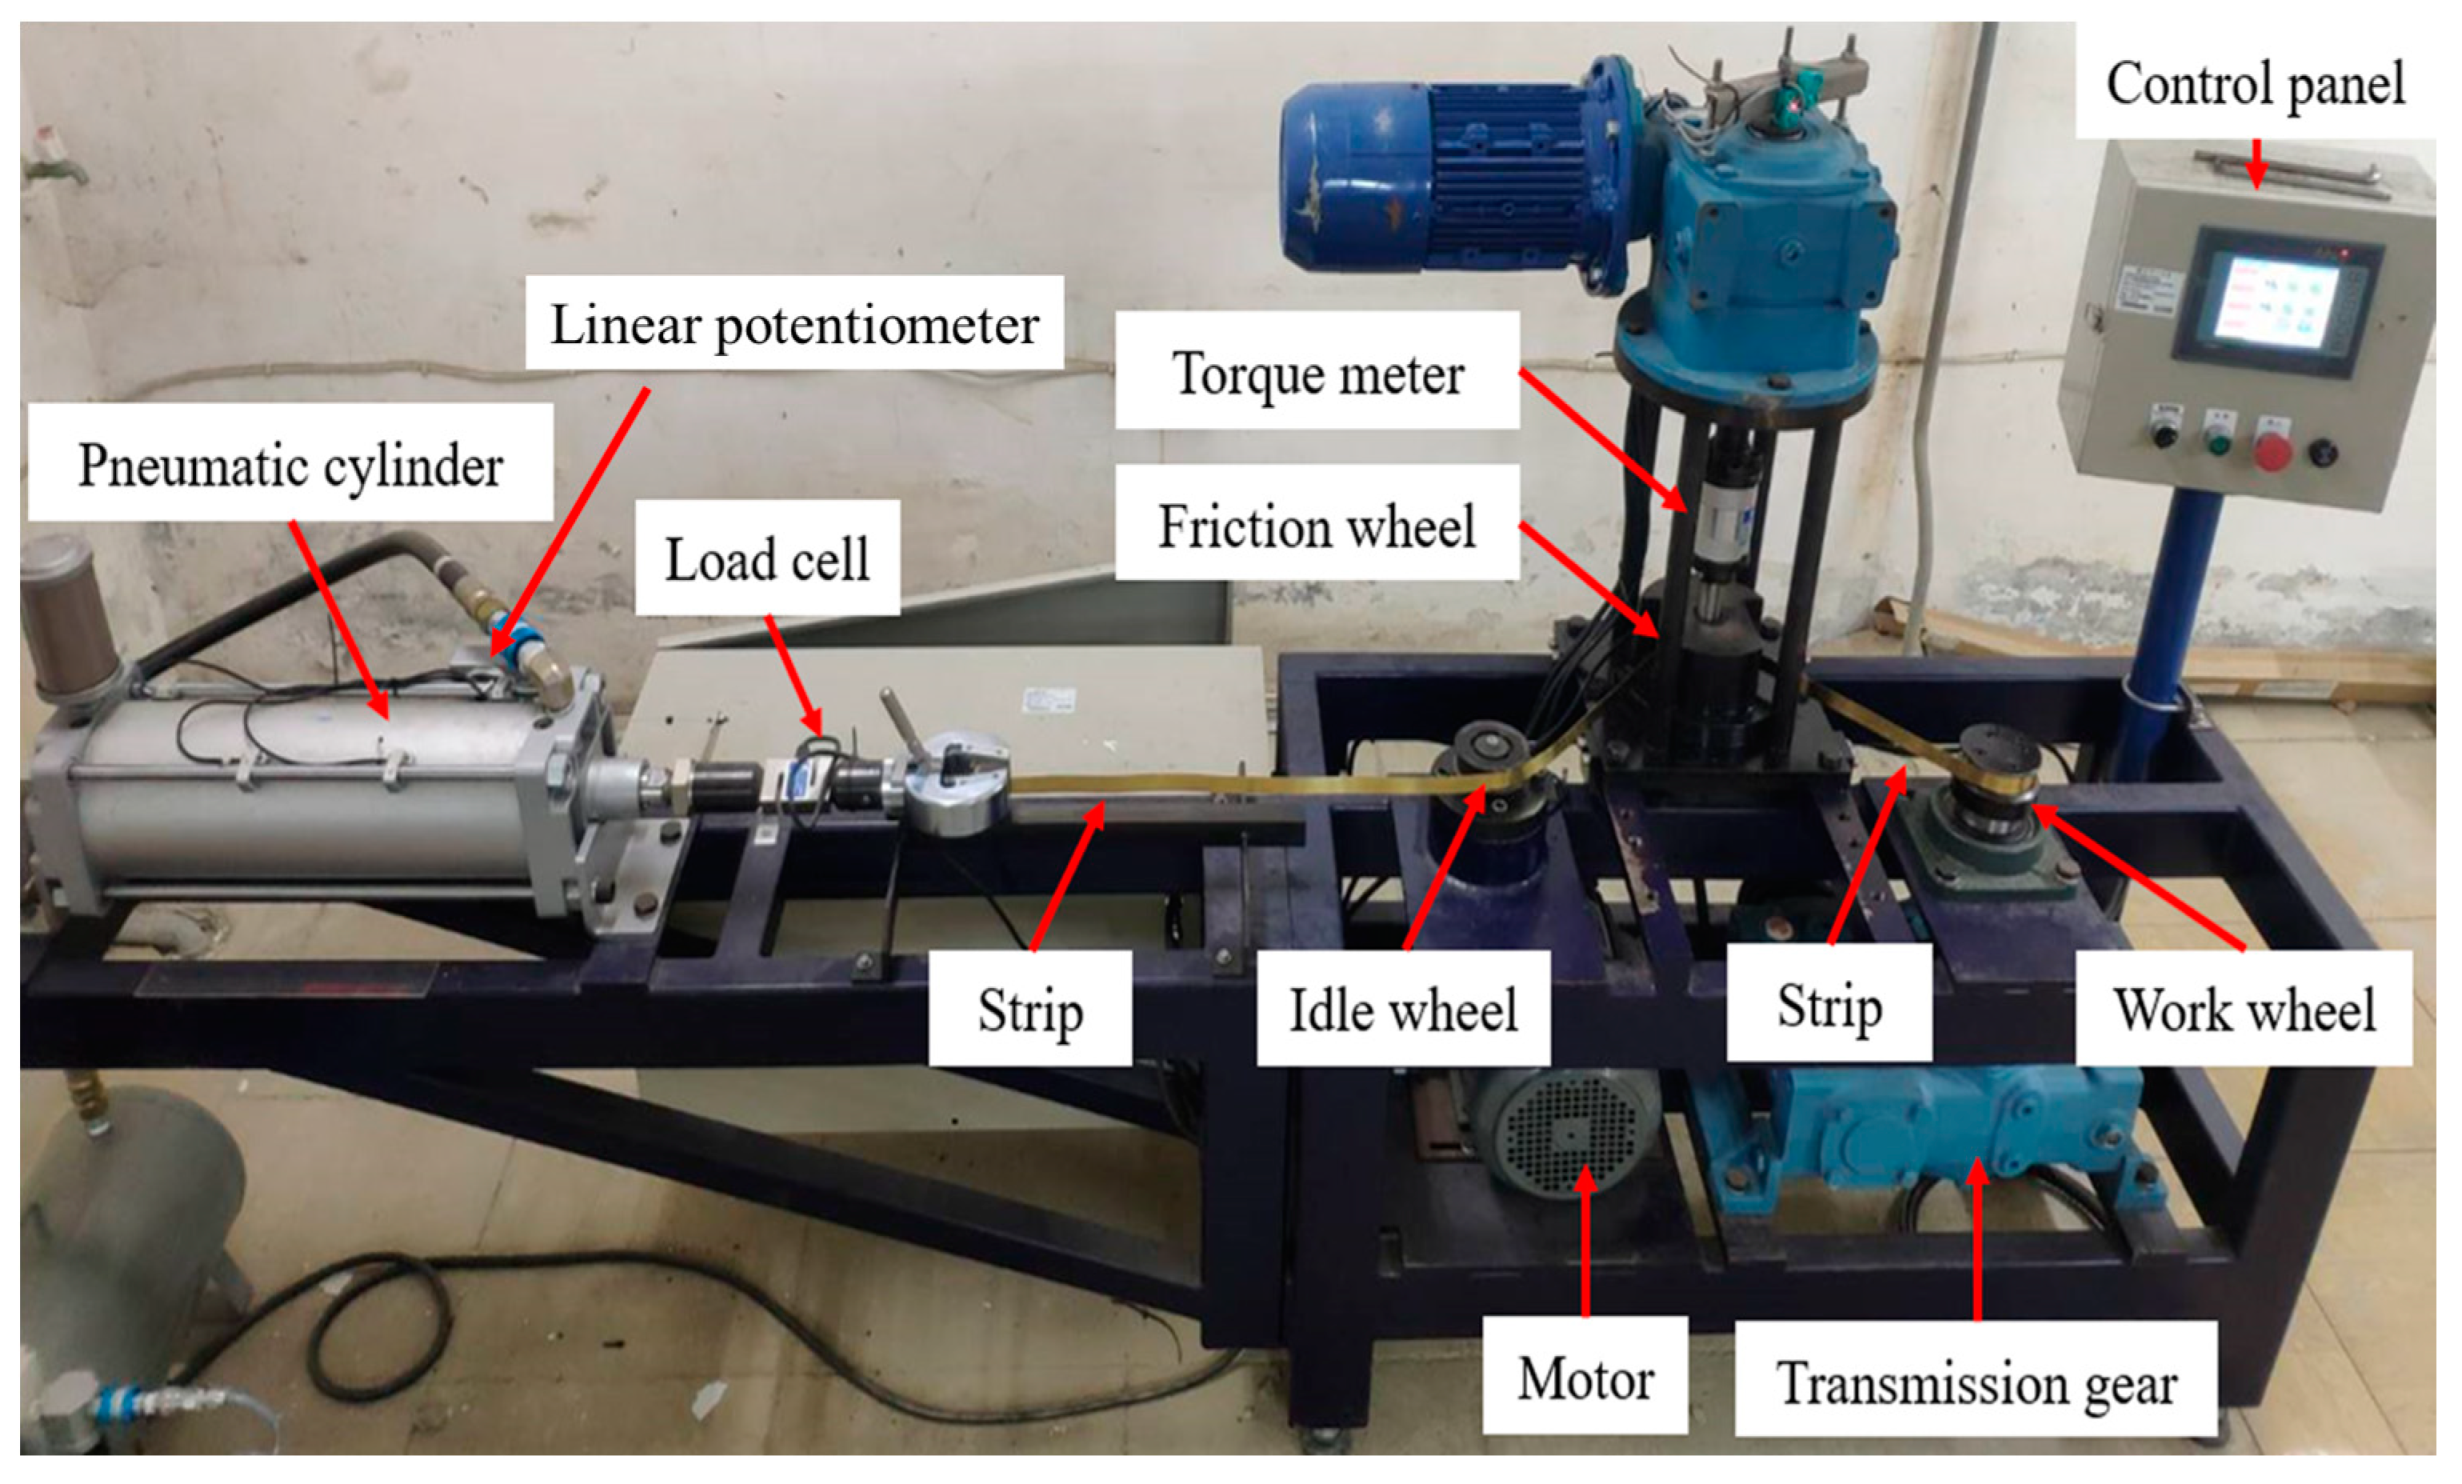
A self-developed friction test machine using a motor driving mechanism is shown in Figure 2. This apparatus consists of four main parts: (1) a driving system, including a motor, a work wheel, and a pneumatic cylinder, which is used to control the strip movement; (2) a measuring unit, including a load cell and a torque meter, which are used to measure force F1 and torque T, respectively; (3) a friction mechanism, including a friction wheel and a strip, which generate a friction interface; and (4) a control panel, which is used to control the rotation speed of the work wheel and the strip moving speed. The advantages of this self-developed test machine are (1) the forward and backward movement of the strip can be easily controlled and (2) the contact angle can be easily arranged from 30° to 90°.
A series of friction tests for various friction conditions, such as the rotation speeds, interface conditions, contact angles, and different strip metals, were conducted. The friction wheel was fixed, whereas, the rotation speed of the work wheel was set as 5–9 rpm. The contact angles were 30°, 60°, and 90°. By adjusting the distance between the friction wheel and the center line connecting the idle wheel and work wheel, the contact angle could be easily arranged. Two kinds of surface conditions, dry friction and oil lubrication, at the interface between the friction wheel and strip metal were adopted. The friction wheel made of middle carbon steel had a surface roughness of Ra = 1.73 µm. It was difficult to install a load cell between the friction wheel and the work wheel to measure F2 directly. For a thick sheet, F2 is affected by the bending of the sheet. An alternative equation for thick sheet friction tests was given in the former publication Reference [18]. From drawing force F1, measured from the load cell, drawing force F2 could be obtained from the following equation:
where torque T is measured from the torque meter. Substituting F2 into Equation (9), the friction coefficients for various friction conditions could be obtained.
Table 1 shows the friction test conditions for different strip materials, Vickers hardness, rotation speeds ω, contact angles θc, interface condition, and gauge pressure in the pneumatic cylinder. Carbon steel S25C, brass C2680, and aluminum alloy 6063T6, some kinds of metal materials commonly used in stamping or deep drawing processes, were adopted in this paper for friction tests. The strip thickness for different materials was 0.5–1.5 mm. The length of the test piece was 1800 mm. The radius of the friction wheel was 25 mm. The surface conditions at the strip and friction wheel interface were divided into dry friction and oil lubrication. The lubrication oil used was SAE 5W–30, the viscosity of which was 61.4 mm2/s at 40 °C and density is 850 kg/m3 at 20 °C. The pneumatic cylinder was used to act as a buffer or a brake while the strip was moved forward and acted as a driver as the strip was moved backward. A higher pneumatic cylinder pressure p0 was set for a harder strip material used. The basis friction test conditions were rotation speed of ω = 5 rpm, contact angle of θc = 90°, and dry friction for the interface condition.
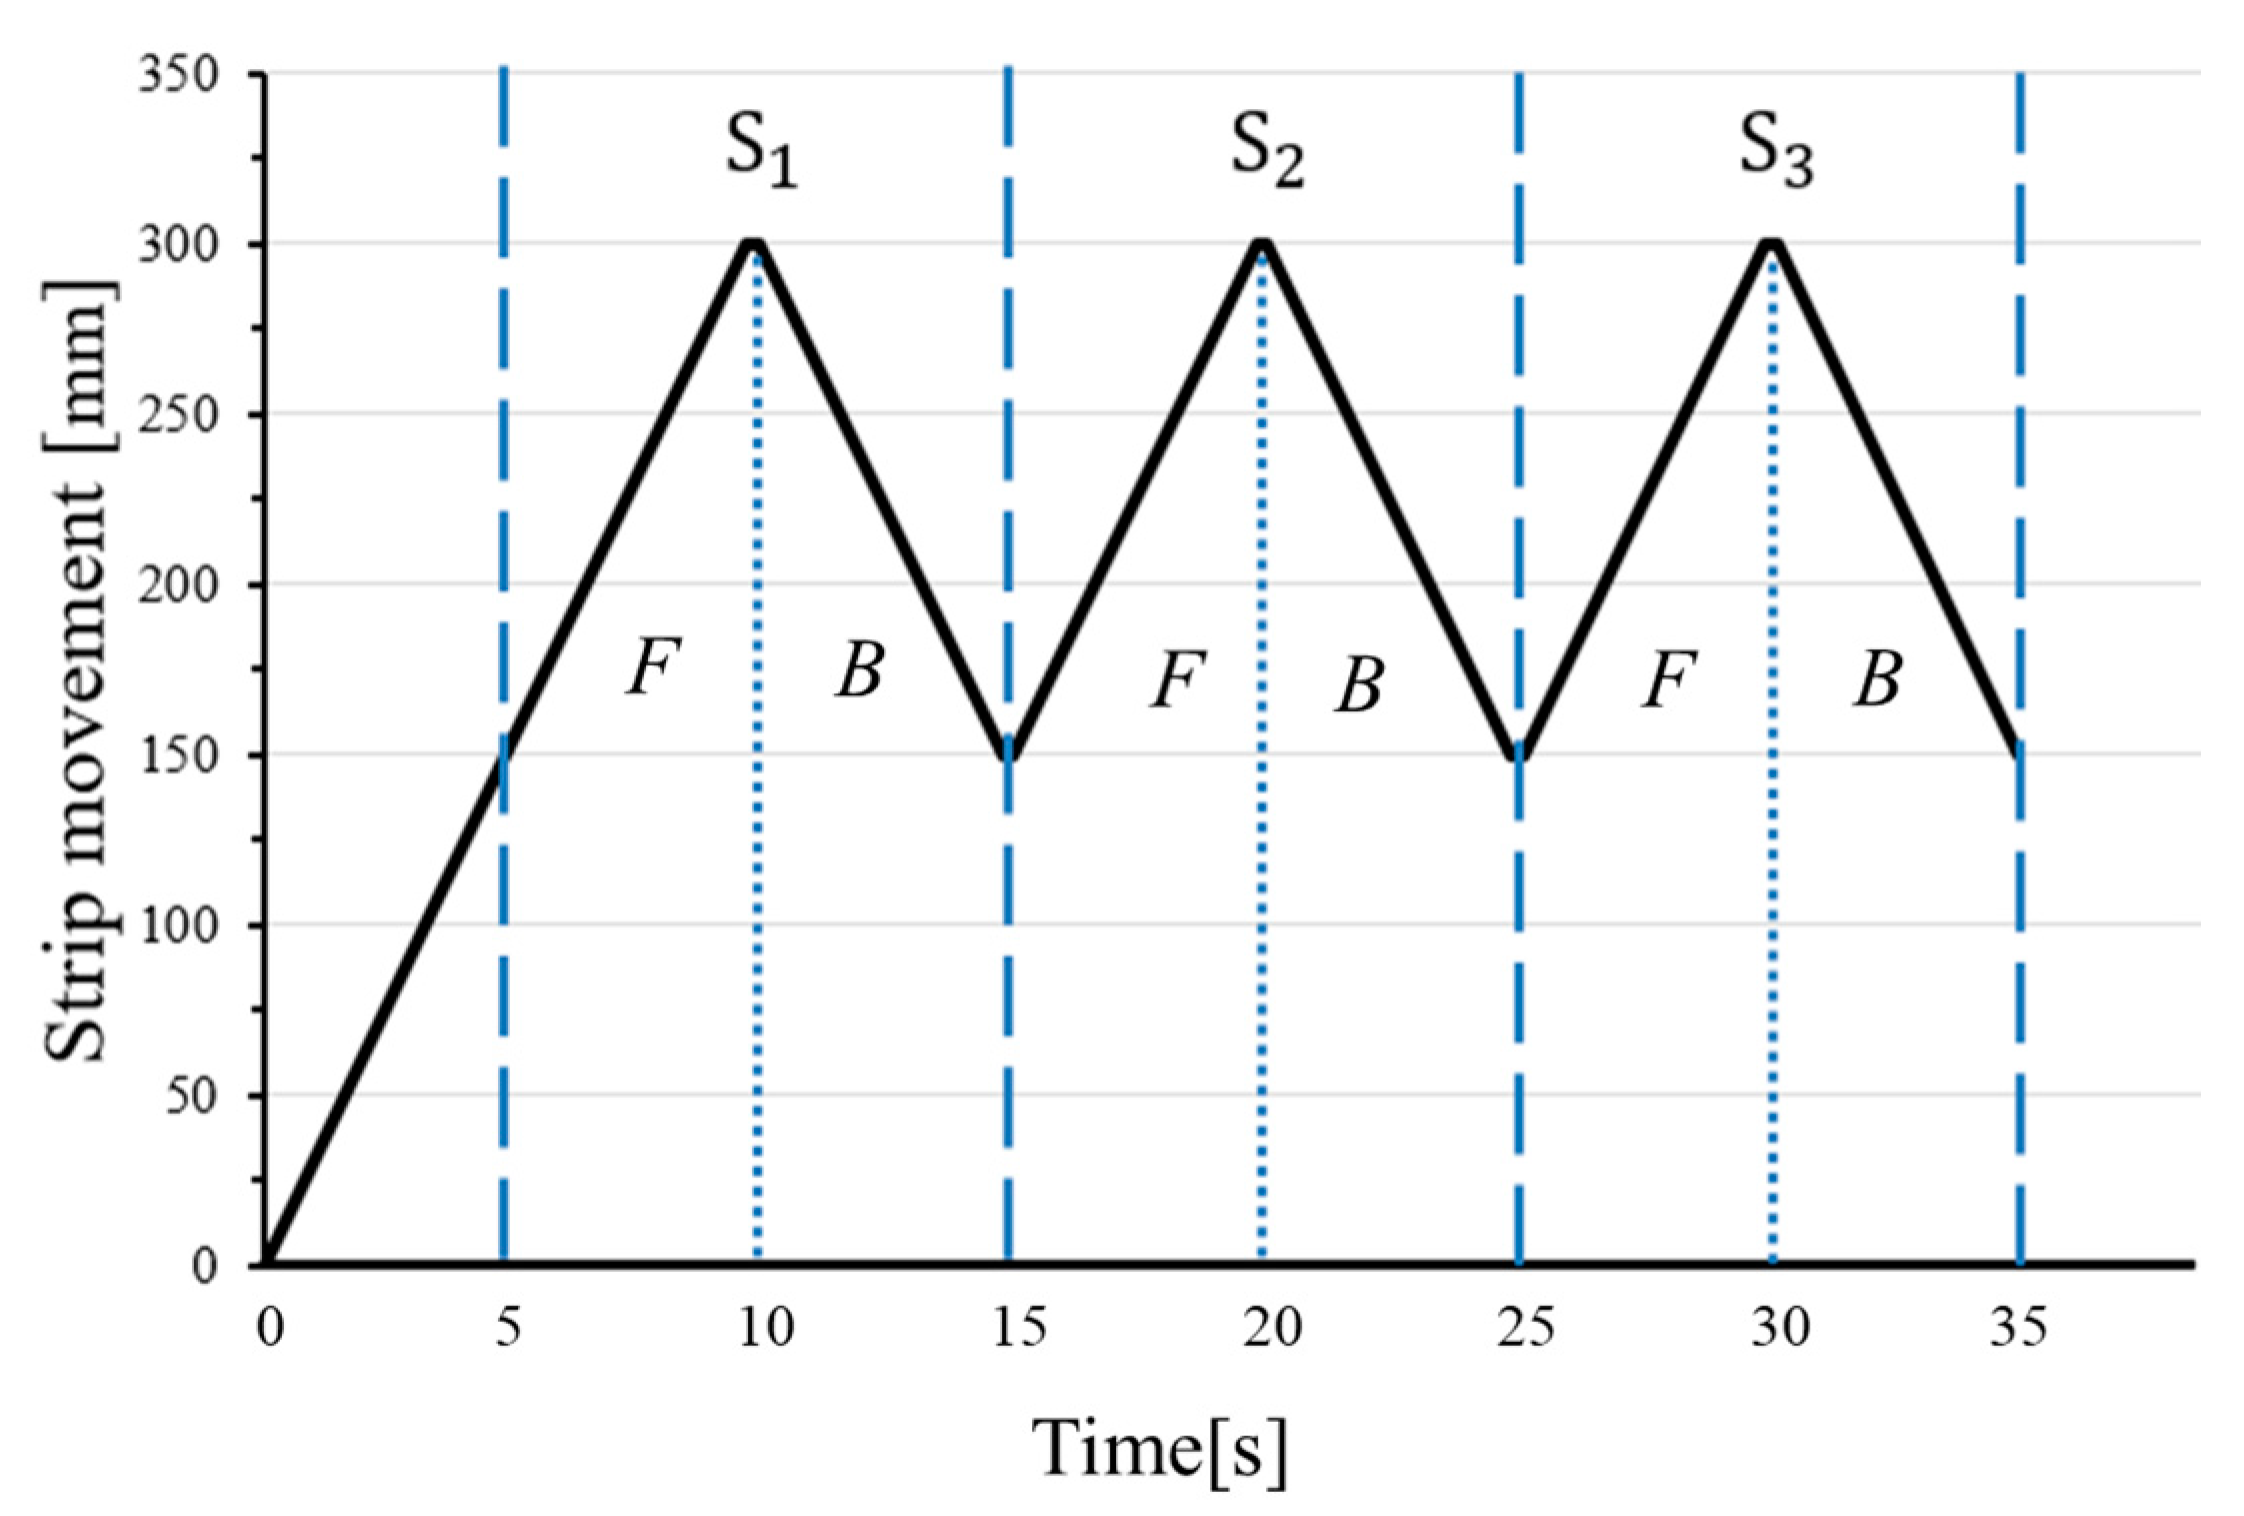
Figure 3 shows strip movement variations during friction tests. The whole friction tests were composed of three stages. A linear potentiometer shown in Figure 2 was installed beside the pneumatic cylinder to monitor the displacement of the cylinder. Accordingly, the strip movement could be recorded. At stage 1, the work wheel was driven to pull the strip metal toward the work wheel side (forward) by 300 mm. The strip movement route or stage from 150 to 300 mm was called S1F. As the work wheel was driven to rotate with inverse direction, the strip metal was pulled by the pneumatic cylinder and moved backward with a distance of 150 mm. This stage was called S1B. The strip movement pattern was repeated two times, and the four stages were designated as and S3B. The strip movement pattern in Figure 3 was designed to be analogous to the punch movement in a servo press, so that the friction coefficients obtained by this reversible friction test machine can be applied to servo stamping or servo deep drawing processes.
4. Friction Test Results and Discussion
Friction tests of carbon steel S25C strips were conducted repeatedly three times under identical rotation speeds ω, identical contact angles , identical pneumatic pressures , and identical strip surface treatments. Figure 4 shows the drawing force variations F1 and F2 for the repeated three times with ± SD. The drawing force F1 was measured from a load cell which was installed on the connecting rod in front of the pneumatic cylinder. From Figure 4, it is known that the measured drawing forces F1 from the pneumatic cylinder were almost identical at all stages in the three repeated tests, because the gauge pressure in the pneumatic cylinder was quite steady. However, there was a slight difference in force F2 at stages S1B and S3F. The maximal difference was about ±0.2 kN (±8%). That is because a variable frequency motor was used in this friction test machine, which could not control the rotation speed as accurately as a servo motor could.
4.1. Friction Tests of Carbon Steel S25C Strip
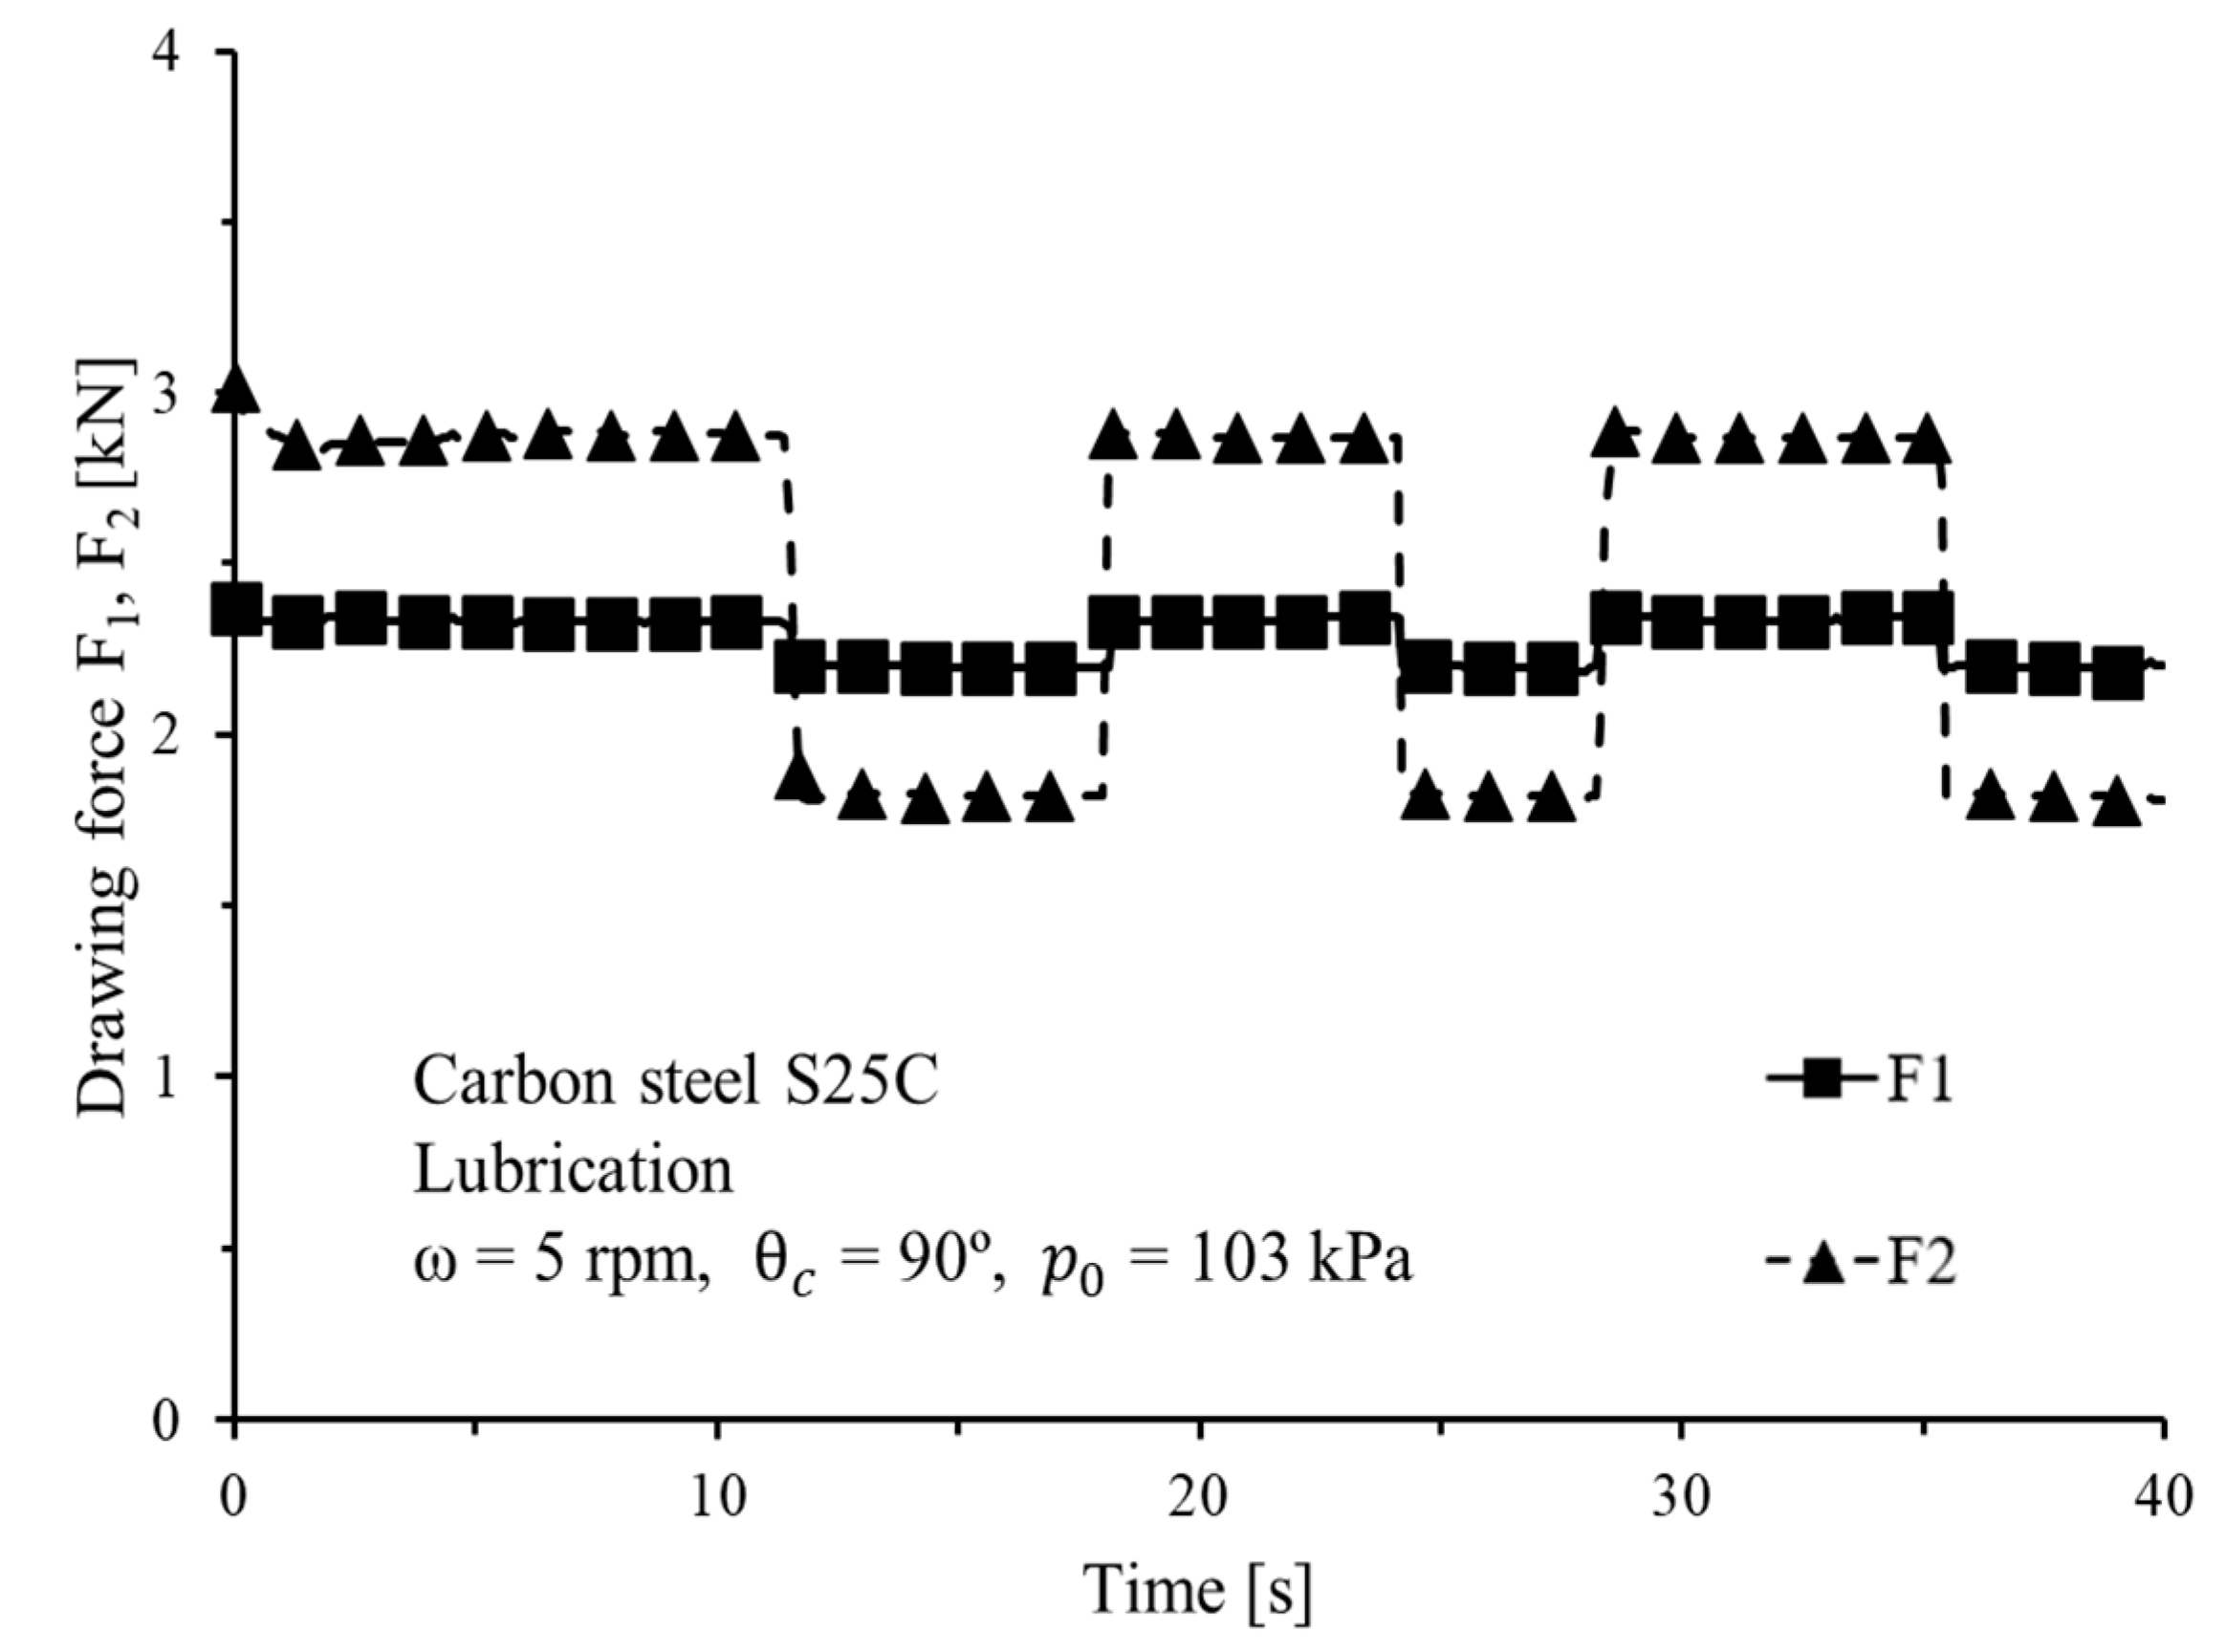
Carbon steel S25C strips with a thickness of 1.1 mm were used as the test piece. The gauge pressure P0 inside the pneumatic cylinder was set as 103 kPa. The contact angle of the strip at the friction wheel was 90°. The other testing conditions are given in Table 1 (case 1). The drawing force variations F1 and F2 with rotation speed of 5 rpm, equivalent to sliding speed of 30 mm/s at the interface of the strip and friction wheel, are shown in Figure 5. The drawing force F1 was obtained from the load cell, which was installed between the pneumatic cylinder and the strip. The drawing force F2 was obtained from Equation (10) and the torque meter, which was installed at the top of friction wheel. From Figure 5, it is known that a slightly larger F2 was obtained at the very beginning of each stage. That is because static friction occurred as the work wheel changed its rotation direction. It is clear that F1 values at the backward stages were smaller than those at the forward stages. That is because the pulling force from the pneumatic cylinder has to overcome the friction resistance at the piston ring as the pneumatic cylinder moves backward.
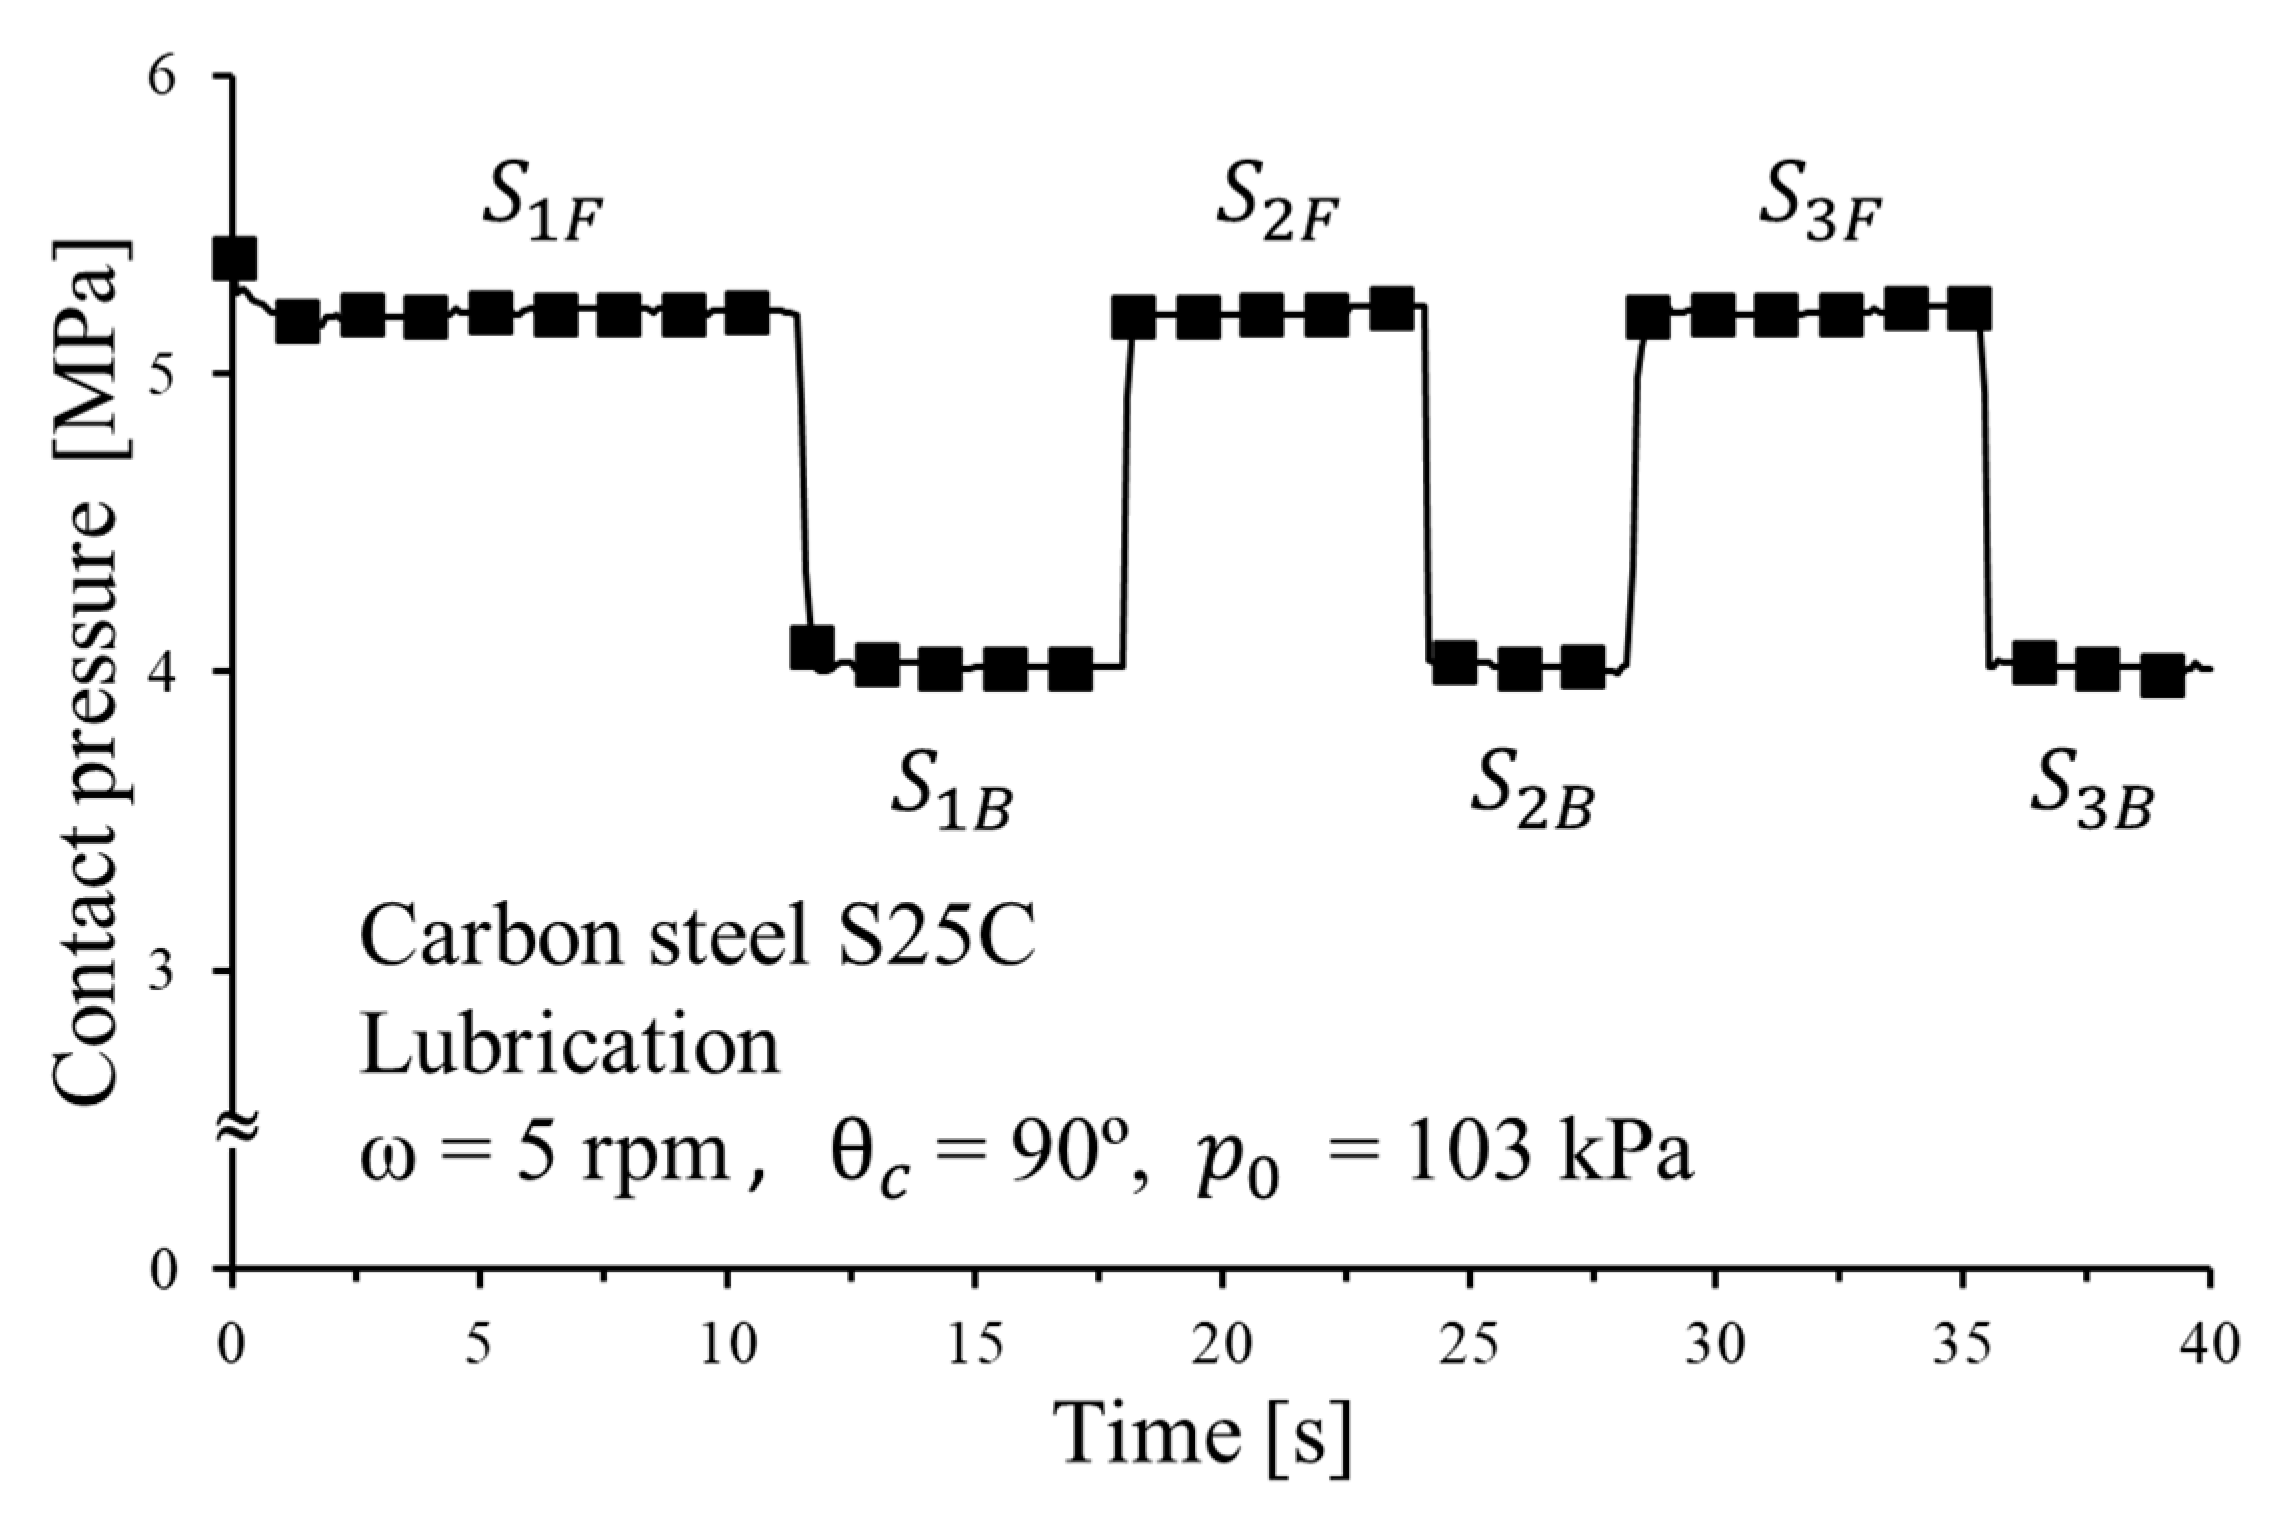
Figure 6 shows the contact pressure variations during the friction tests. The contact pressure was obtained from Equation (2), and the friction force F was regarded as the average value of F1 and F2. The drawing force variations of F1 and F2 are shown in Figure 5. It is clear that the contact pressures at the forward stages were larger than those at the backward stages. The maximal difference of the contact pressures at the forward and backward stages was about 1.2 MPa.
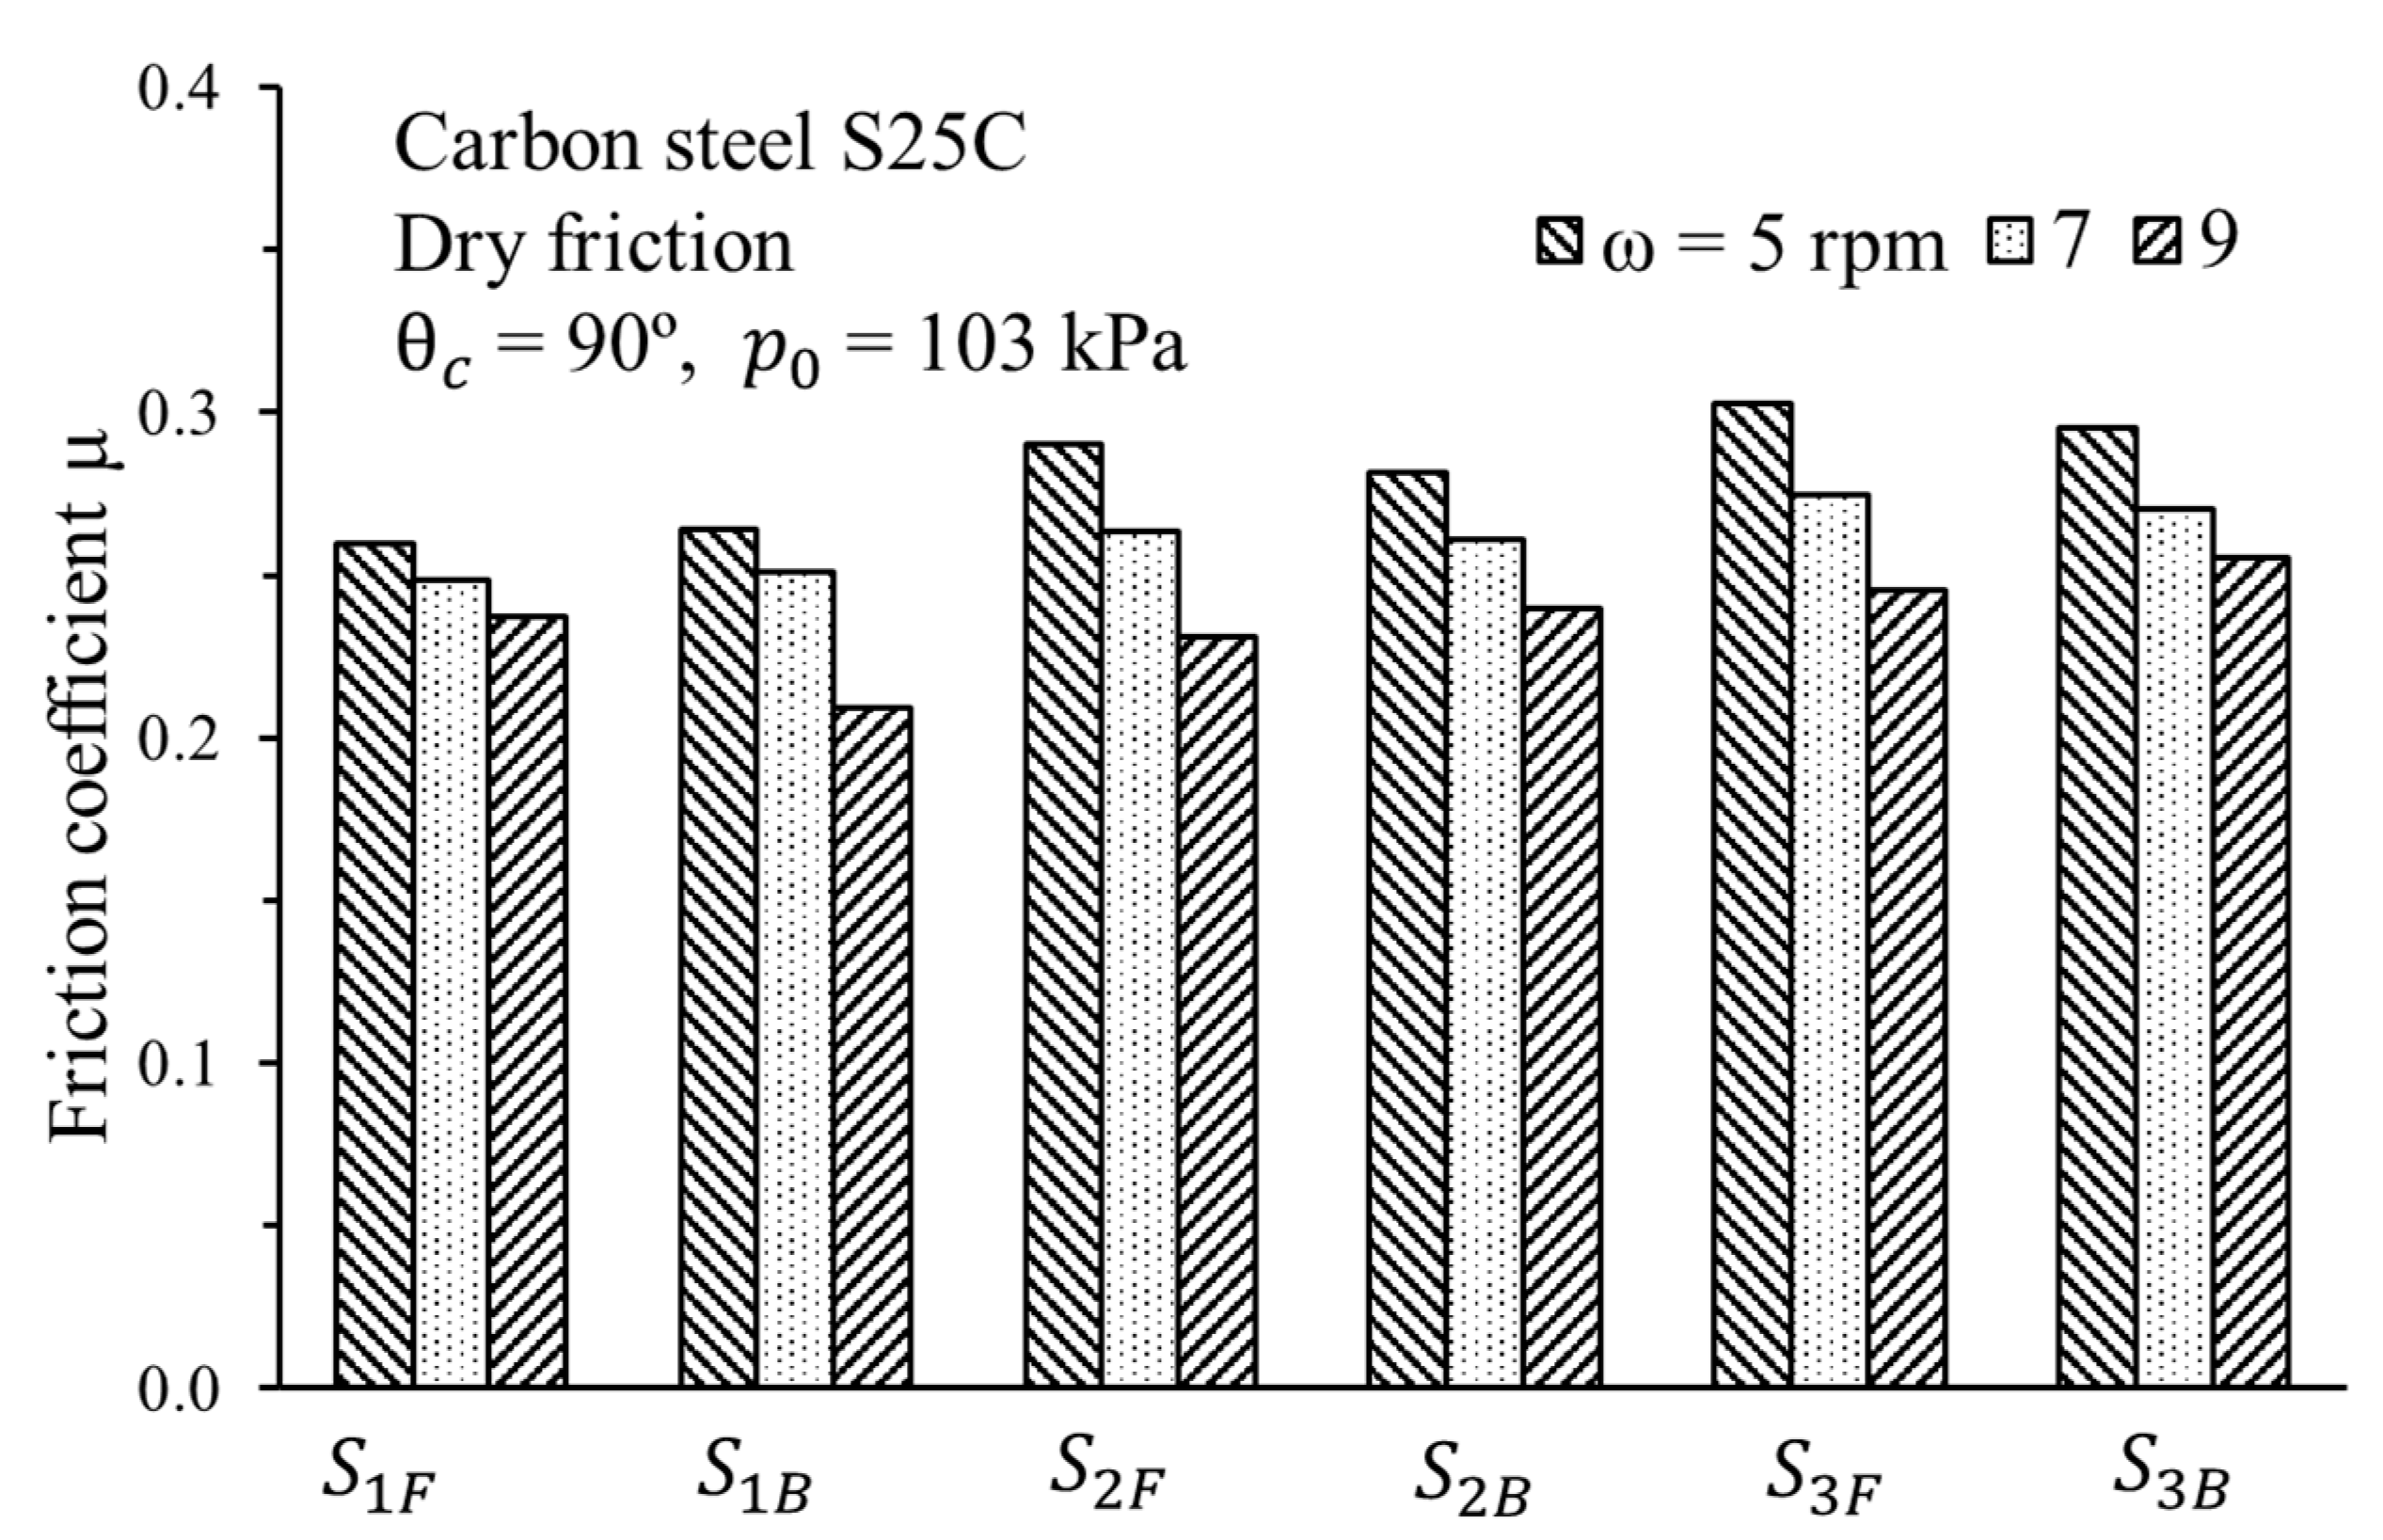
Figure 7 shows the variations of the friction coefficient with rotation speeds of 5, 7, and 9 rpm under dry friction condition. The rotation speeds of 5, 7, and 9 rpm are equivalent to relative sliding speeds of 30, 40, and 50 mm/s, respectively, at the interface of the strip and friction wheel. The friction coefficient was determined from Equation (9) and the drawing forces F1 and F2 are shown in Figure 5. A smaller friction coefficient was obtained at the first stage (S1F and S1B), and a slightly larger friction coefficient was obtained at the third stage (S3F and S3B). Generally, the friction coefficient decreased as the rotation speed increases. The reason is probably that as the relative sliding speed at the interface increased, the strip momentum in the normal direction increased, which resulted in an increased separation force at the interface and reduced the real contact area. Accordingly, the friction coefficient decreased [9].
Figure 8 shows the variations of friction coefficients with rotation speeds of 5, 7, and 9 rpm under lubricated conditions (SAE 5W–30). The friction test conditions are given in Table 1 (case 1). The friction coefficients obtained were 0.12–0.15. Generally, the friction coefficient increased at a later stage, like the tendency in the case under dry friction condition shown in Figure 7. This is because the strip surface became rougher after reciprocating friction test at the late stage. It was also found that the friction coefficients at the forward stages were larger than those at the backward stages, because of a larger contact pressure at the forward stages. The friction coefficient increased as the rotation speed increased, which is opposite to the tendency in the case under dry friction conditions. The reason is probably that for a dynamic viscous flow at the interface between the strip and friction wheel, a larger drawing force is needed at a higher relative sliding speed.
4.2. Friction Tests of Brass C2680
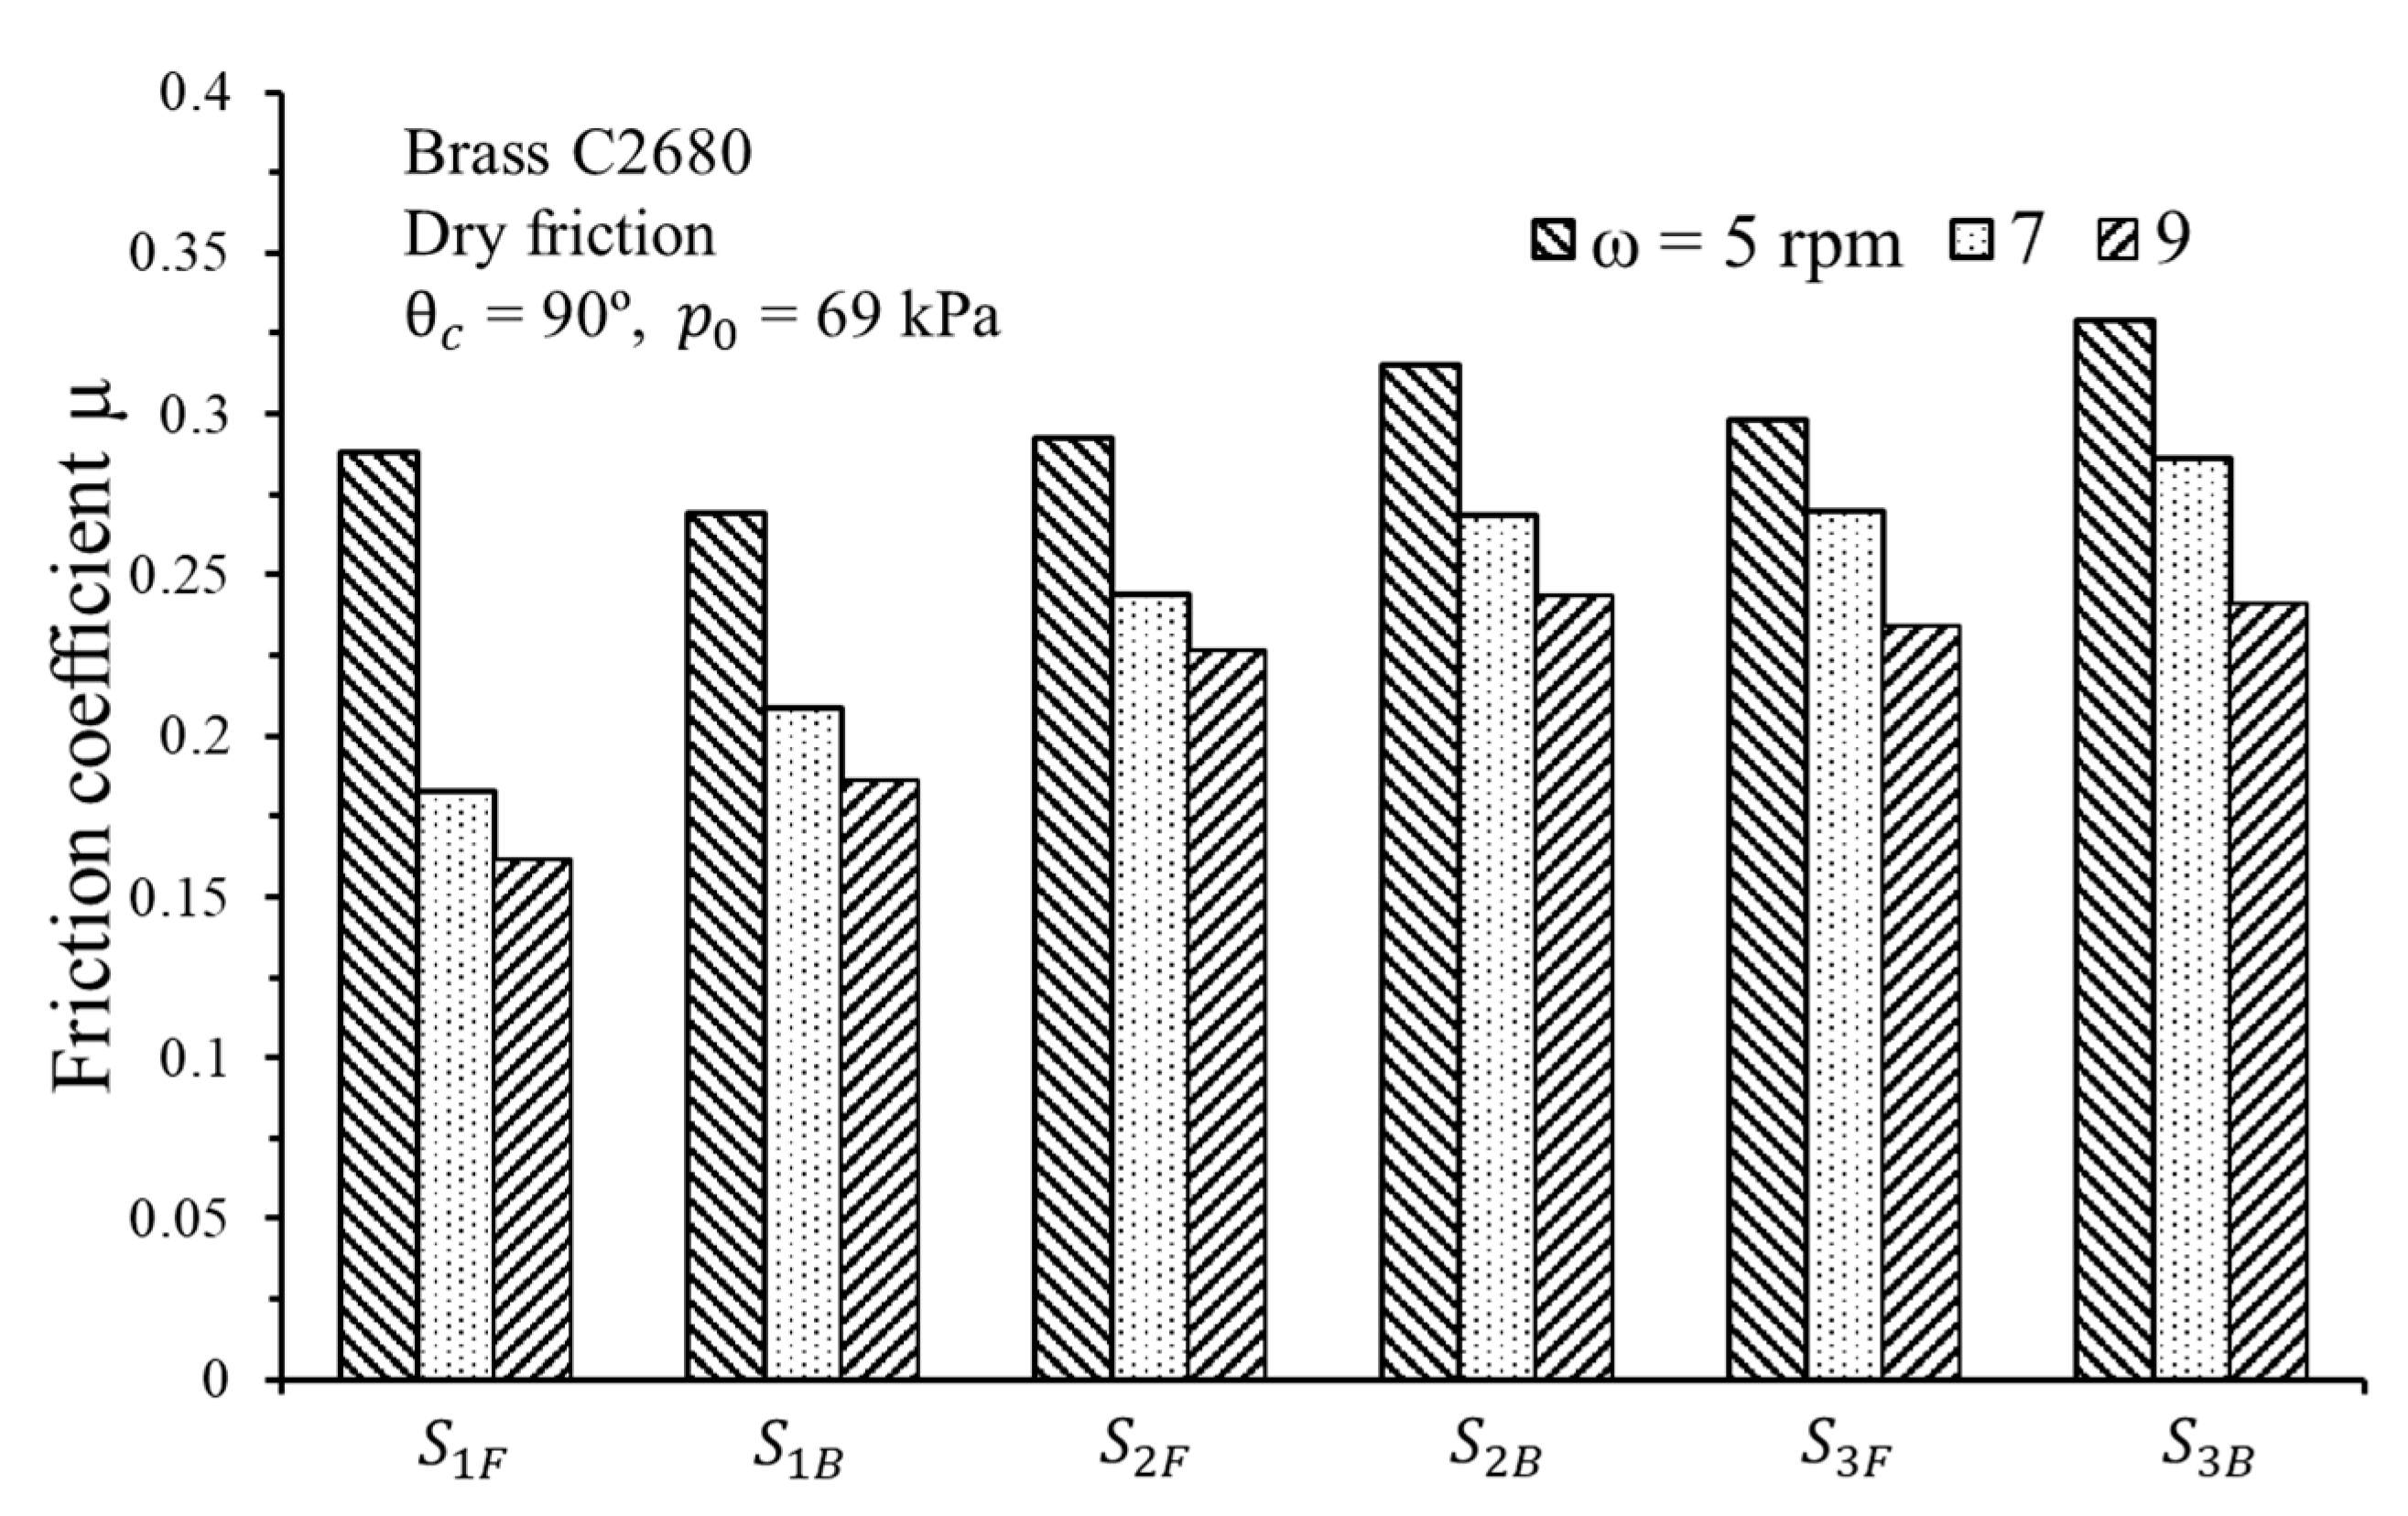
In this section, brass C2680 strips with a thickness of 0.5 mm were used as the test piece. The Vickers hardness of brass C2680 is 128 MPa, quite close to 130 MPa, the hardness of carbon steel S25C strips. The gauge pressure P0 in the pneumatic cylinder was set as 69 kPa. The contact angle of the strip at the friction wheel was 90°. The other friction test conditions are given in Table 1 (case 2). Figure 9 shows the variations of friction coefficients with rotation speeds of 5, 7, and 9 rpm (equivalent to relative sliding speeds of 30, 40, and 50 mm/s, respectively) under the dry friction condition. Clearly, the friction coefficient decreased with the rotation speed and a larger friction coefficient could be obtained at a later stage. The tendency of the variations of friction coefficients for brass C2680 strips was the same as that in the friction tests of carbon steel strips under dry friction conditions.
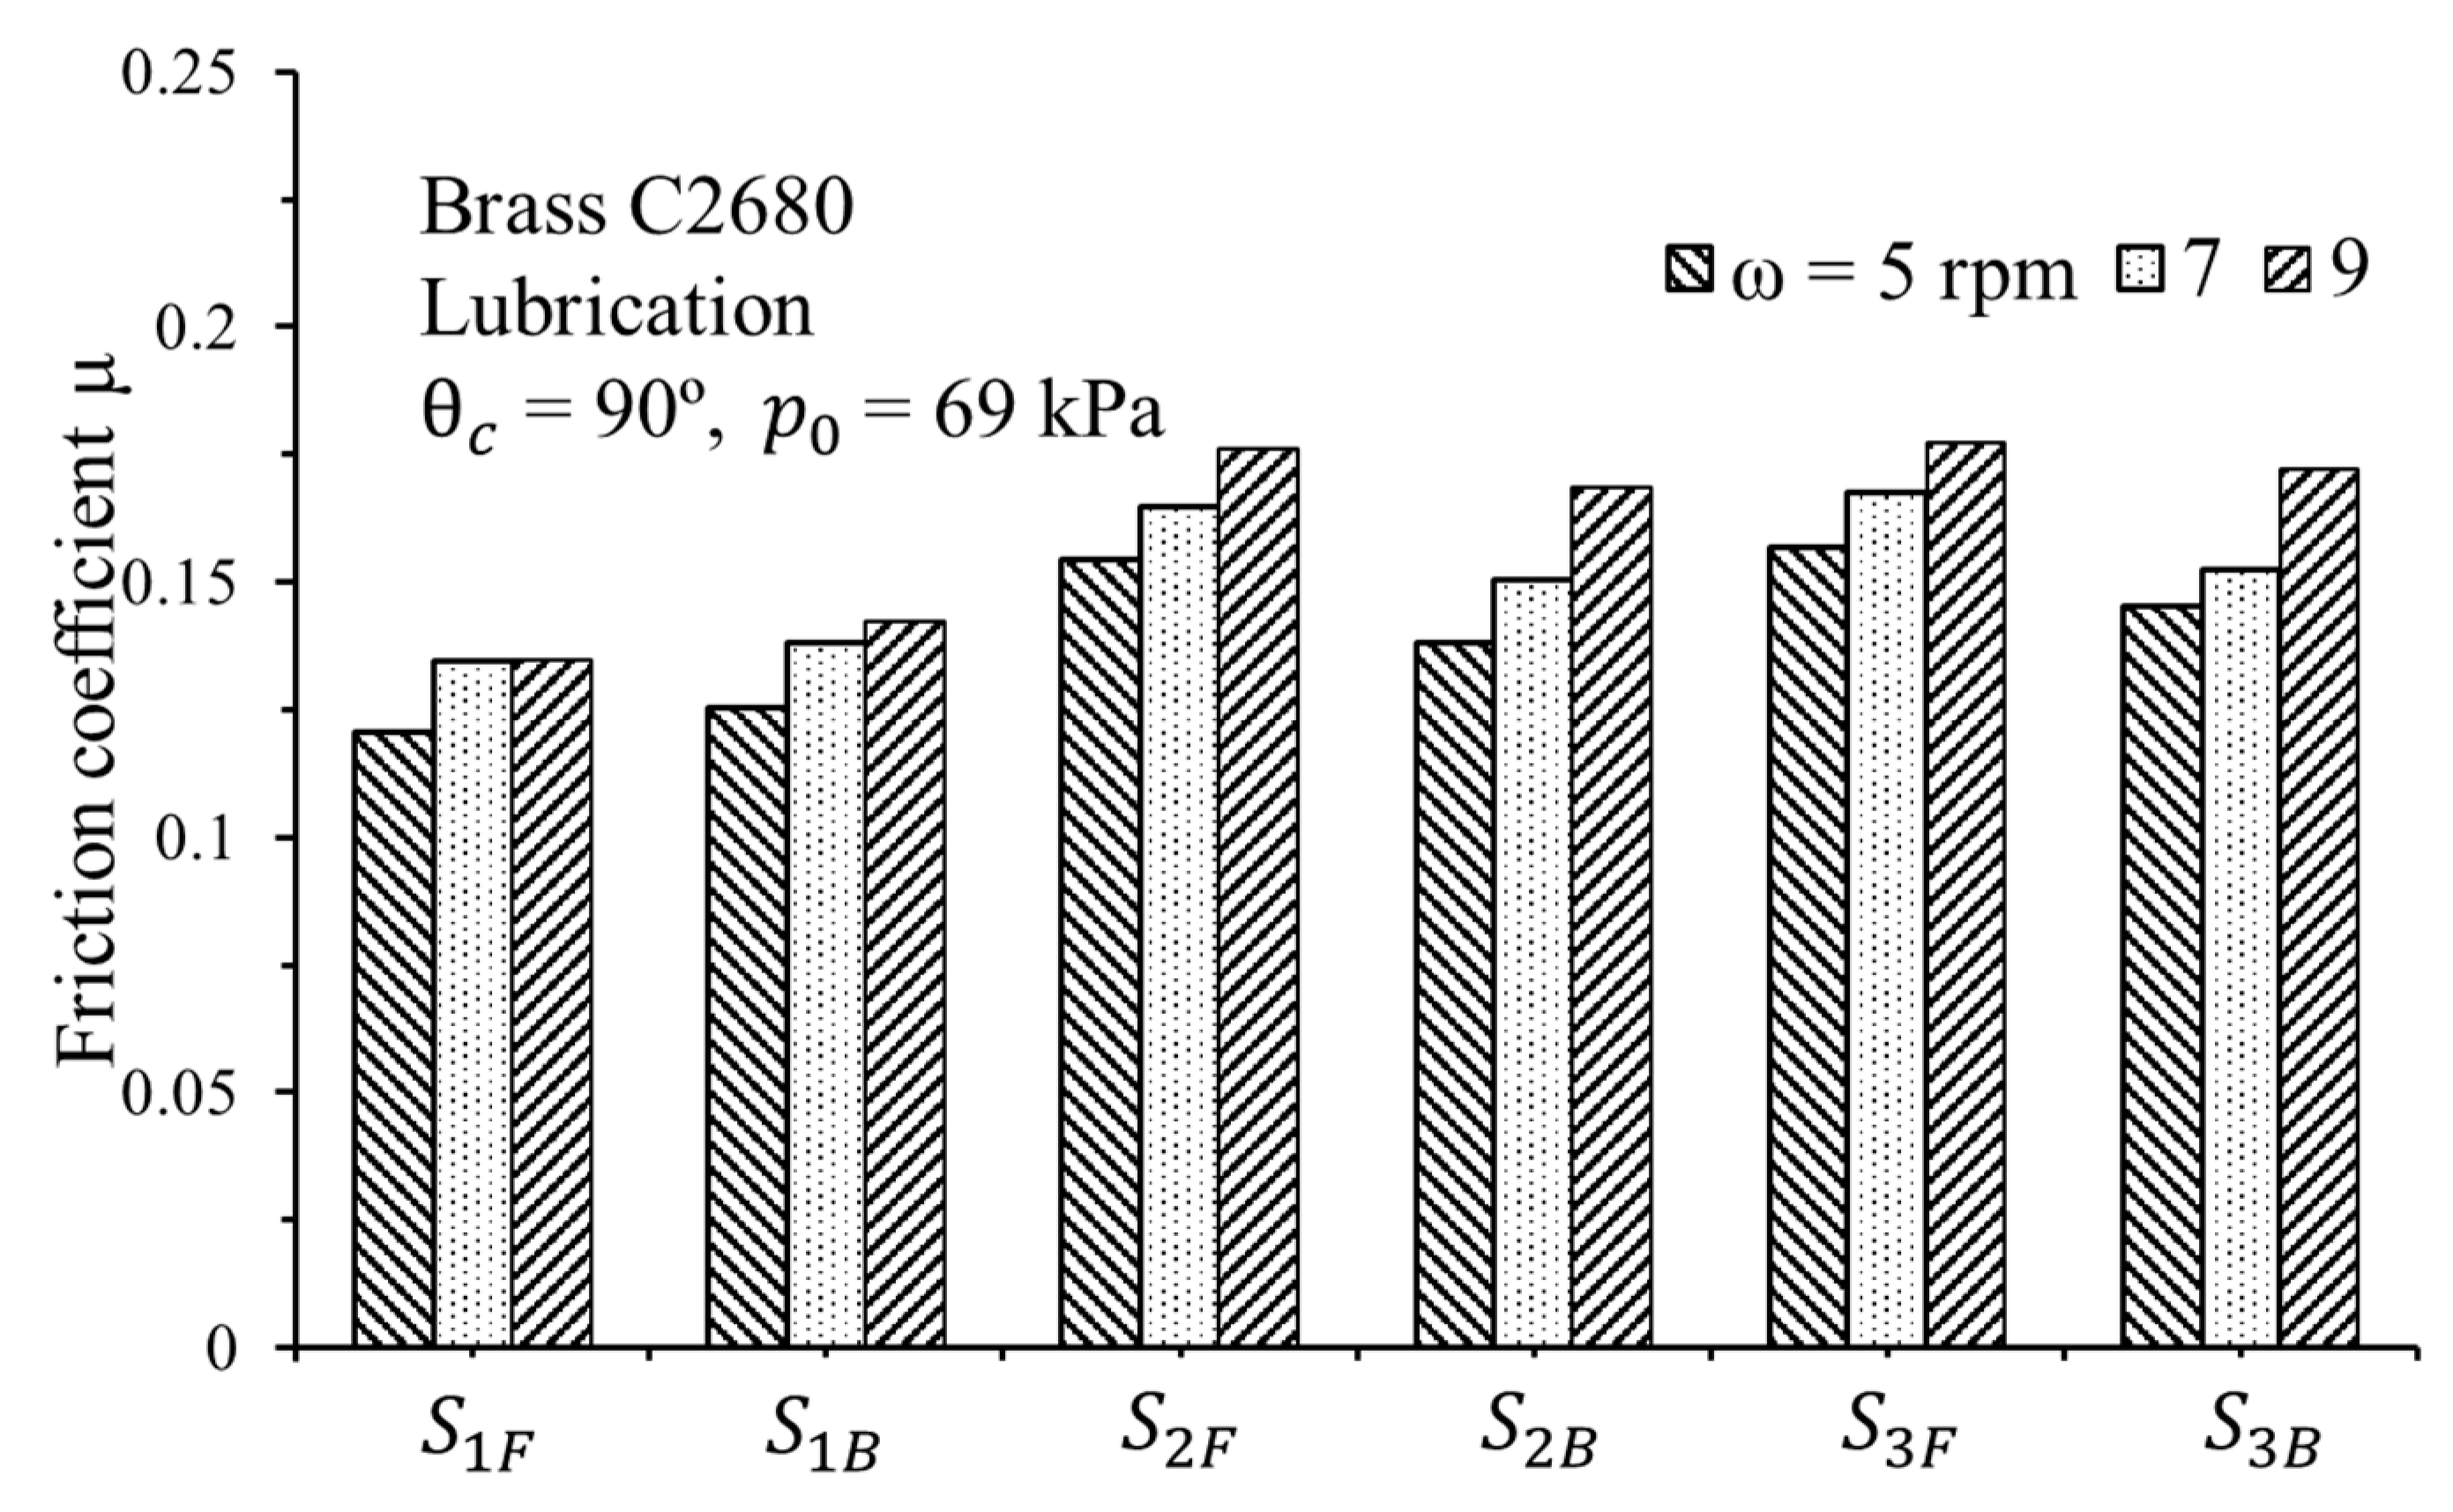
Figure 10 shows the variations of the friction coefficients with rotation speeds of 5, 7, and 9 rpm under lubricated conditions. It is known that the friction coefficient increases with the rotation speed, and a larger friction coefficient can be obtained at a later stage. The tendency of the variations of friction coefficients for brass C2680 strips was the same as that in the friction tests of carbon steel strips under lubricated conditions.
The friction coefficients obtained from friction tests of brass C2680 strips with 5 rpm at forward stages under dry friction and lubricated conditions are summarized in Table 2. µ1, µ2, and µ3 correspond to the friction coefficients at S1F, S2F, and S3F stages, respectively. The friction coefficient differences between two successive stages under dry friction conditions increased slightly, and the differences were less than 2%. Whereas, under lubricated conditions, the friction coefficient difference between µ1 and µ2 reached 22.1%, and the friction coefficient difference between µ2 and µ3 was only 1.9%. That is because the lubrication oil was greatly squeezed out after the first stage S1F.
4.3. Friction Tests of Aluminum 6063-T6
In this section, aluminum alloy 6063-T6 strips with a thickness of 1.3 mm were used as the test piece. The aluminum alloy 6063-T6 strips with a Vickers hardness of 83 MPa is a relatively softer material compared with carbon steel and brass strips used in the previous sections. Friction tests were conducted under dry friction conditions. The contact angle of the strip with the friction wheel was 90°, and the other testing conditions are given in Table 1 (case 3). Figure 11 shows the variations of friction coefficients with rotation speeds of 5, 6 and 7 rpm, which correspond to relative sliding speeds of 30, 40, and 50 mm/s, respectively. From Figure 11, it is clear that a larger friction coefficient was obtained at forward stages and at a lower rotation speed. The tendency is the same as that in friction tests of carbon steel strips under dry friction conditions. Whereas, the friction coefficients decreased at a later stage, which is different from the tendency in the case of carbon steel strip. That is because the initial roughness of aluminum alloy 6063-T6 was Ra = 0.248 μm and the roughness after the first stage became Ra = 0.448 μm, which was larger than 0.410 and 0.365 μm, the roughness after the second and third stages, respectively. Due to the fact that only arithmetic mean surface roughness Ra values were used to evaluate the friction coefficient at the sheet-die interface in literature [1,6,12], only Ra values, no Rt values, were recorded during the surface roughness measurements.
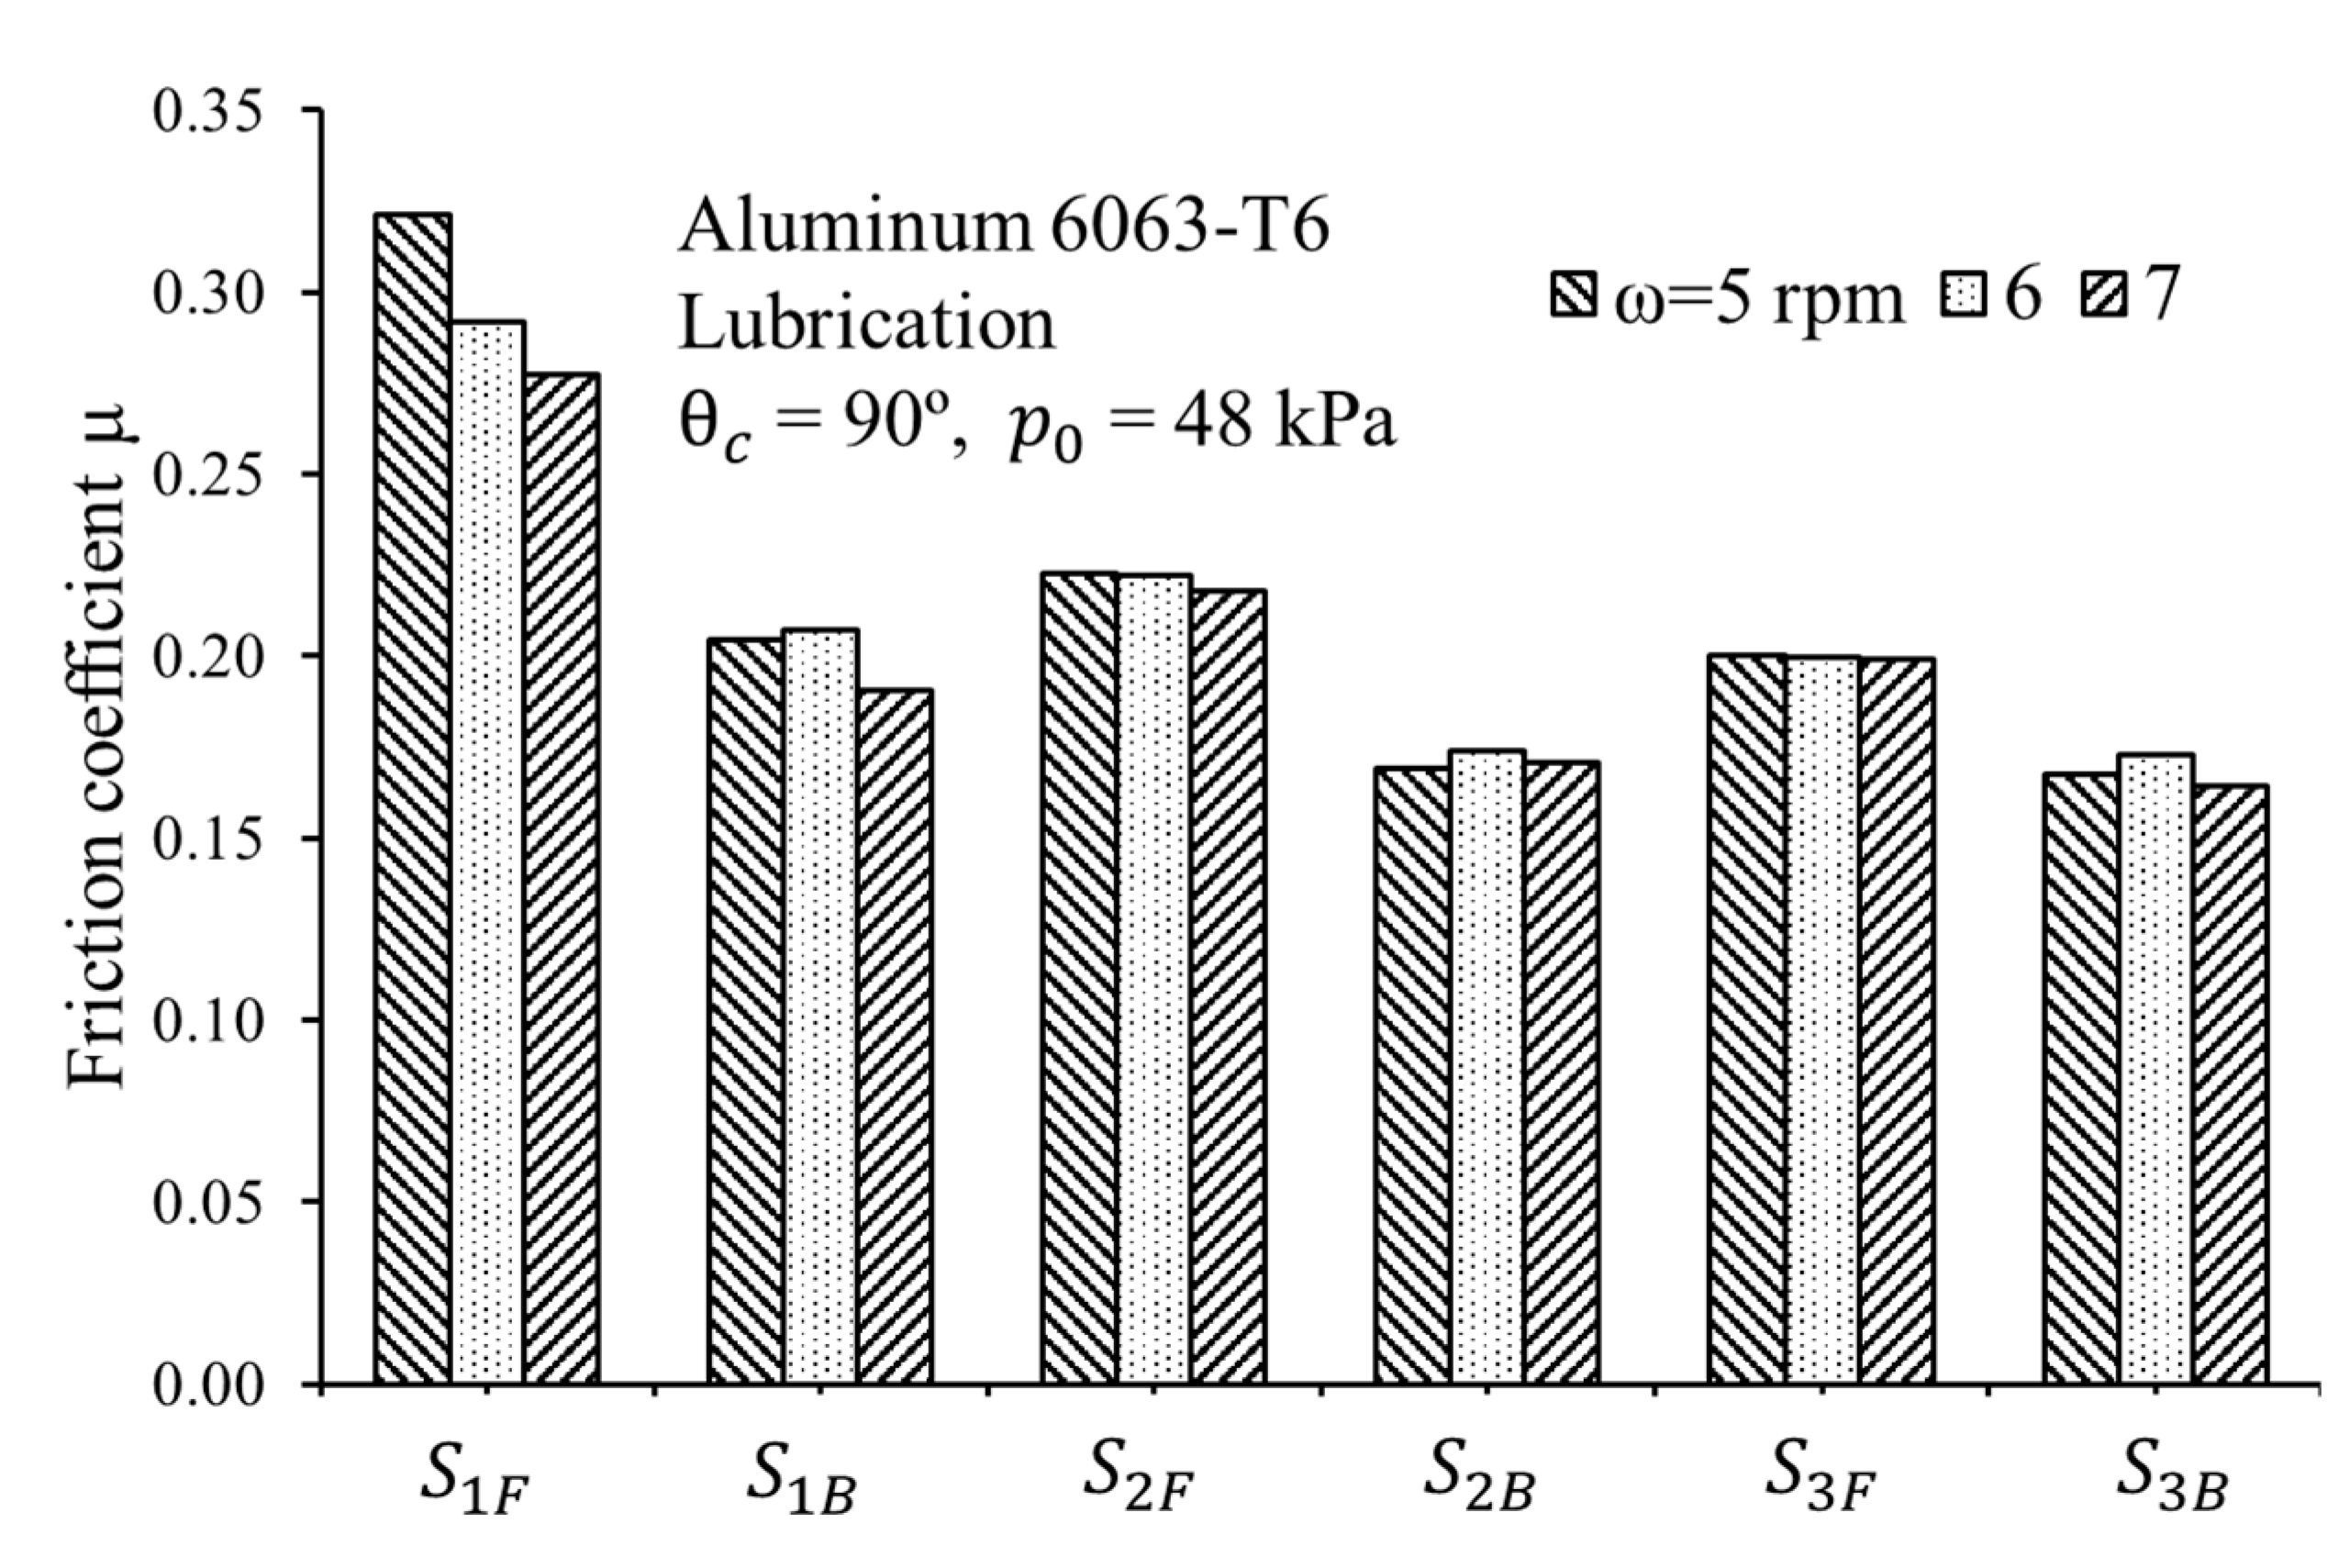
Figure 12 shows the variations of friction coefficients with rotation speeds of 5, 6, and 7 rpm under lubricated conditions. The other testing conditions were the same as those shown in Figure 11 and are given in Table 1 (case 3). The friction coefficients became smaller at a later stage, and the friction coefficients at the forward stages were larger than those at the backward stages. The friction coefficients under lubricated conditions were significantly lower than those under dry friction conditions, shown in Figure 11. Generally, the friction coefficients became smaller as the rotation speed increases. That resulted from the surface roughness reduction after each stage. The surface roughness after stage 1 at rotation speeds of ω = 5, 6, and 7 rpm were Ra = 0.376, 0.338 and 0.289 μm, respectively.
Figure 13 shows the contact pressure variations with contact angles of 30°, 60°, and 90° under dry friction conditions. The gauge pressure p0 in the pneumatic cylinder was set as 48 kPa, and rotation speed was 5 rpm. Friction test conditions are given in Table 1 (case 4). Clearly, the contact pressure increased with the contact angle at the forward stages, whereas the contact pressure decreased slightly with the contact angle at the backward stages.
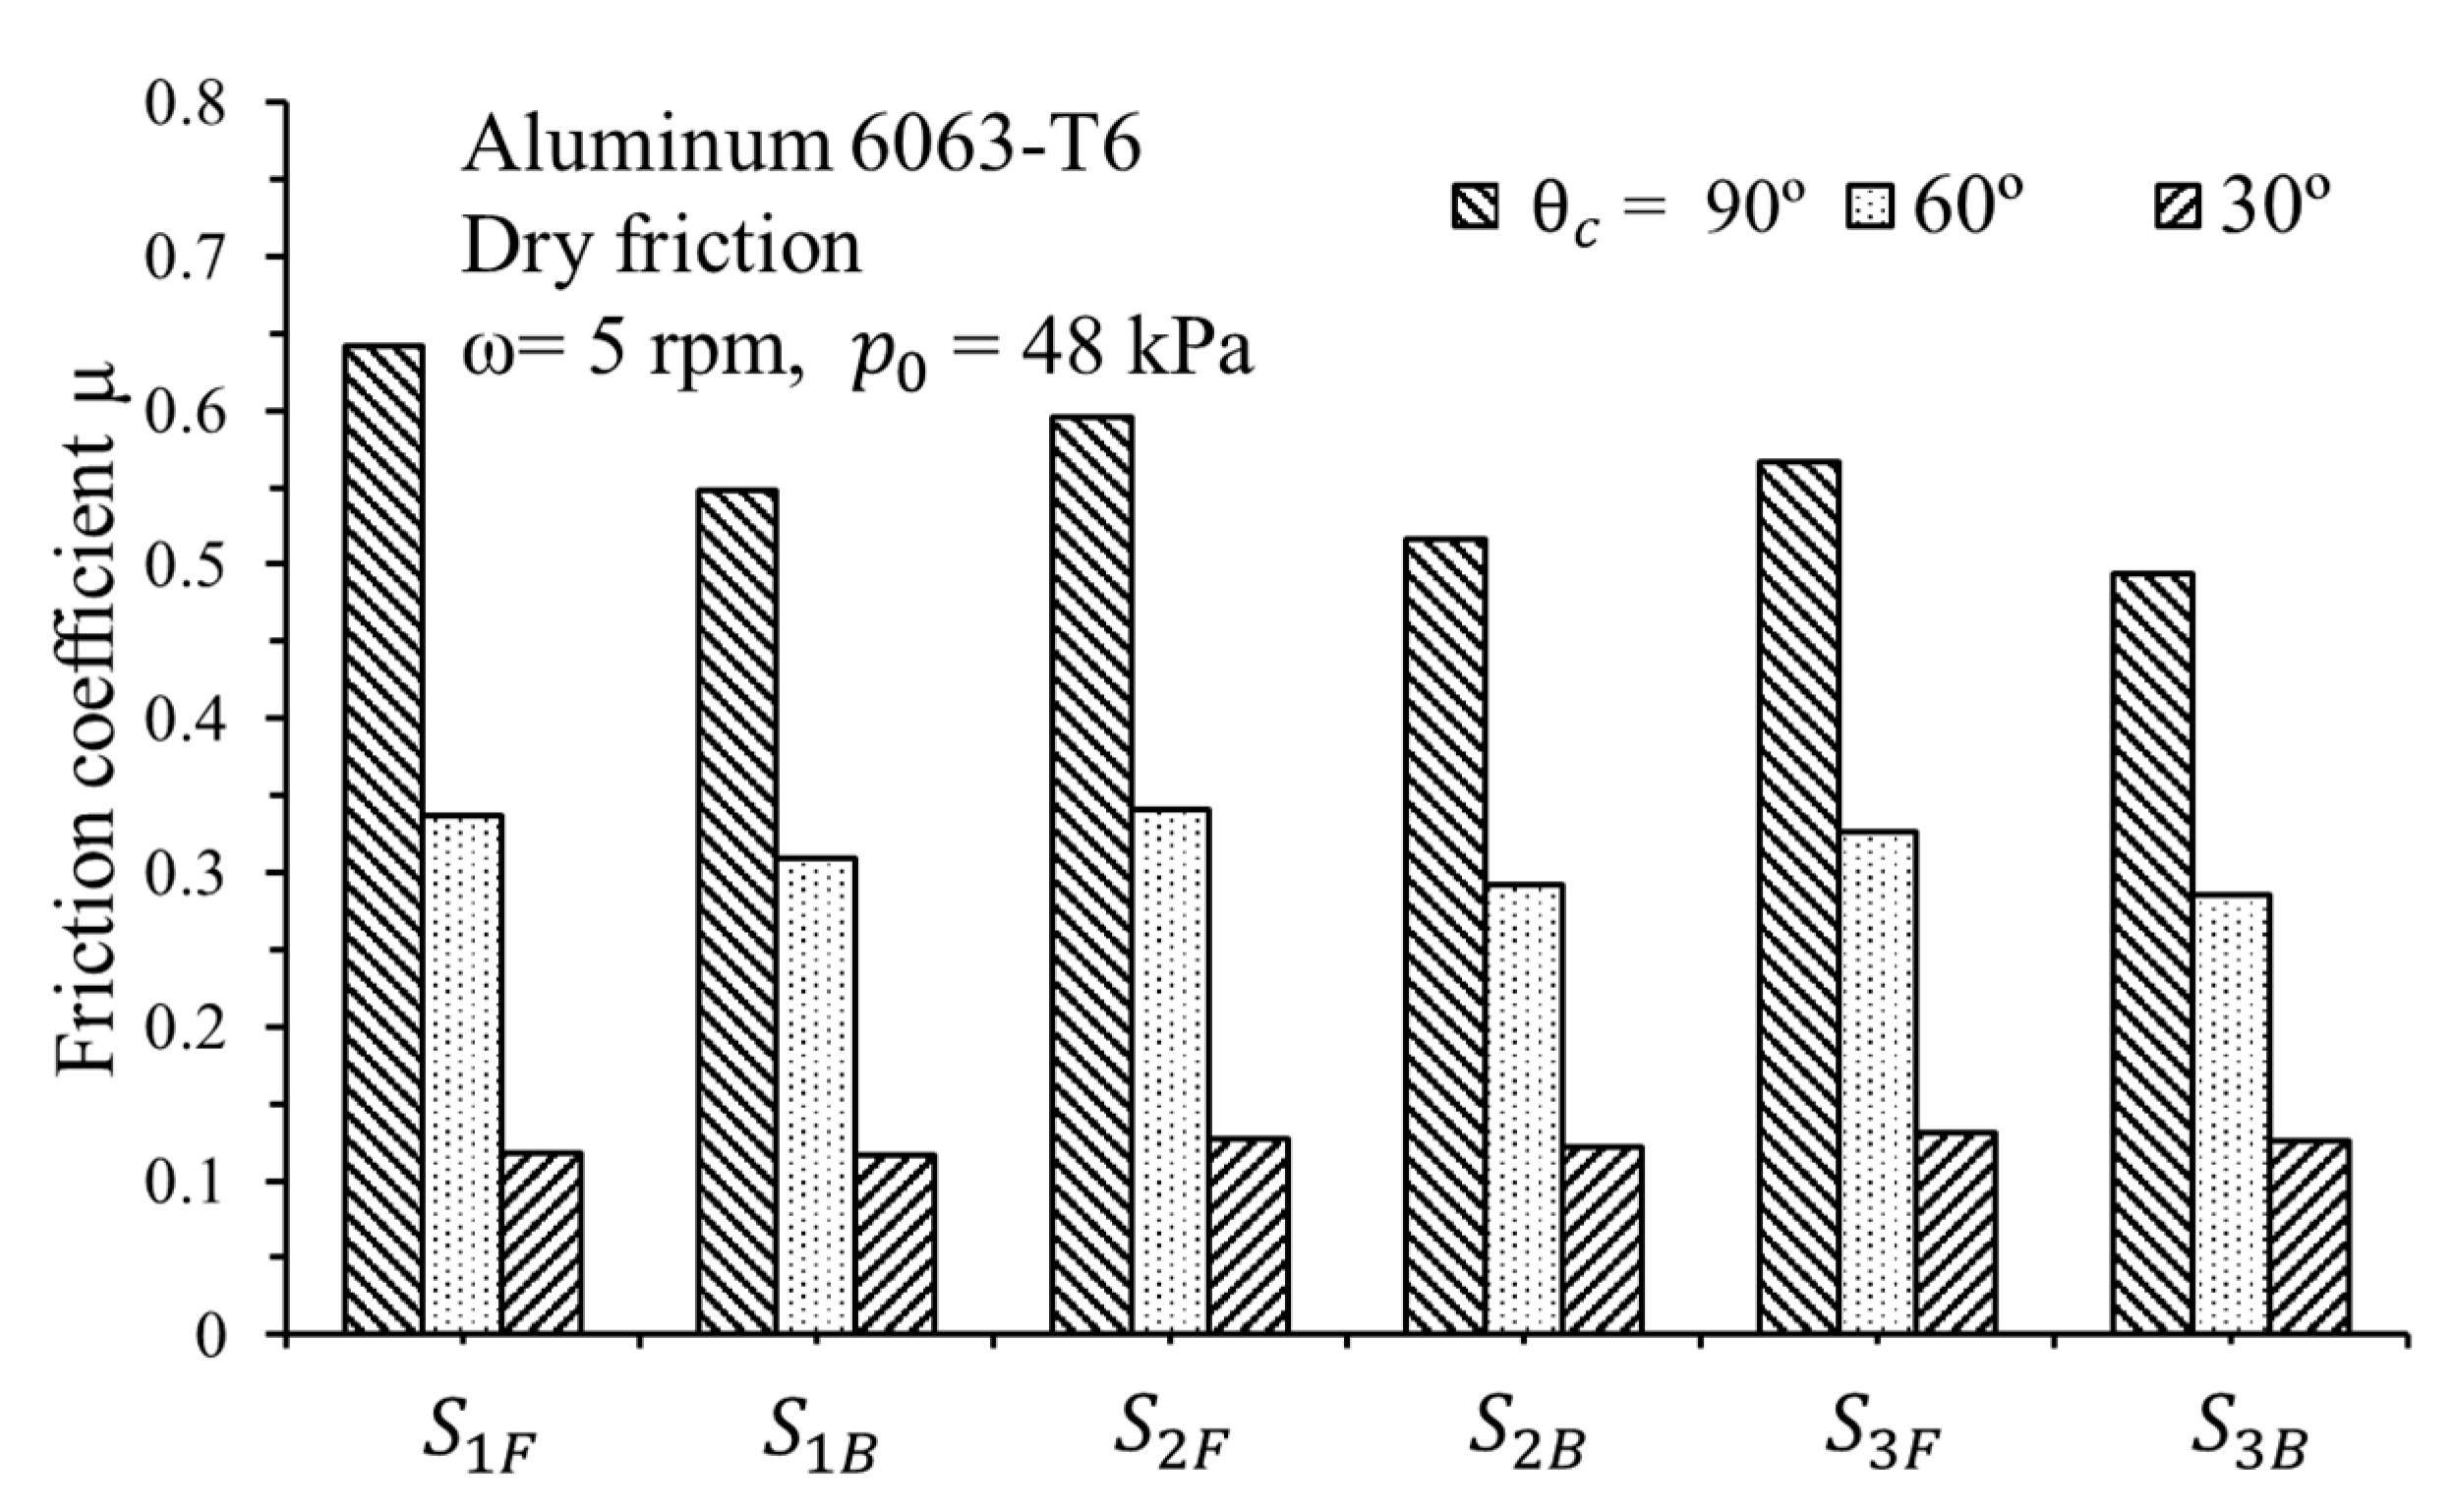
Figure 14 shows of friction coefficient variations with different contact angles under dry friction conditions. Clearly, the friction coefficients increased with the contact angle. That is because the contact pressure and contact area between the strip and friction wheel became larger at a larger contact angle.
Table 3 summarizes the friction coefficients obtained at different stages under dry friction with various friction test conditions given in Table 1. The values in square brackets denote the friction coefficients under lubricated conditions. It is clear that the friction coefficients under lubricated conditions were much smaller than those under dry friction conditions. Large friction coefficients of about 0.6 for aluminum alloy A6063T6 were obtained at a large contact angle of 90° and a low rotation speed of 5 rpm under dry friction conditions. The magnitude of the friction coefficients under dry friction is quite close to those obtained in Reference [12]. The friction coefficients obtained from the friction tests of carbon steel were about 0.1–0.14, which is quite close to the range of 0.1–0.18 obtained by Tamai et al. [1]. The friction coefficients decreased with increasing sliding speed under dry friction, the tendency of which was the same as that in Reference [1].
5. Conclusions
A reversible friction test machine was developed and a series of friction tests with three stages were conducted to investigate the effects of contact angles, strip materials, surface lubrication, sliding speeds etc., on the friction coefficients at the interface of the strip and friction wheel. Generally, the friction coefficients increased with the contact angle between the strip and friction wheel and the friction coefficients decreased with increasing rotation speed under dry friction conditions. For harder strips of carbon steel and brass, the friction coefficients increased with increasing rotation speed under lubricated conditions, whereas, the friction coefficients decreased with increasing rotation speed for softer strips of aluminum alloy. Generally, the friction coefficients obtained in the friction tests of the three kinds of strip metals under dry friction conditions were approximately twice the values obtained in the friction tests with oil lubricant at the strip–die interface. From a series of friction tests, it is known that the friction coefficients at the forward stages during the friction tests were different from those at the backward stages and the friction coefficients at the earlier stages were different from those at the later stages. It is noteworthy that a variant, not a constant friction coefficient model, at the sheet–die interface should be considered in a servo press forming process with repeated forward and backward punch motions. In the future, the friction parameters or conditions can be adjusted in the reversible friction tests to extend the application scopes, such as shortening stroke distances to resemble the movement of a servo press, increasing force F1 to increase the contact pressure, rotating the friction wheel to increase the relative sliding speed between the strip and die, adopting different lubricants, coating the surface of the friction wheel with a chromium film to decrease the roughness of the friction wheel, and so on. The effects of the surface texture on the friction behavior will be explored. Furthermore, a nonlinear friction coefficient model for servo press forming processes will be developed.
Author Contributions
Conceptualization, methodology, research supervision and writing—review and editing were conducted by Y.-M.H.; experiments, validation and writing—original draft preparation were completed by C.-C.C. All authors have read and agreed to the published version of the manuscript
Funding
The authors would like to extend their thanks to the Ministry of Science and Technology of the Republic of China under Grant no. MOST 107-2622-E-110-006-CC2. The advice and financial support of MOST are gratefully acknowledged.
Acknowledgments
The authors would like to extend their thanks to the Ministry of Science and Technology of the Republic of China under grant no. MOST 107-2622-E-110-006 -CC2. The advice and financial support of MOST are greatly acknowledged.
Conflicts of Interest
The authors declare no conflict of interest.
References
- Tamai, Y.; Fuzita, T.; Inazumi, T.; Manabe, K. Effects of contact pressure, sliding velocity and sliding length on friction behavior of high-tensile-strength steel sheets. J. JSTP 2012, 54, 537–541. [Google Scholar]
- Hwang, Y.M.; Huang, L.S. Friction tests in tube hydroforming. Proc. IMechE Part B J. Eng.Manuf. 2005, 219, 587–594. [Google Scholar] [CrossRef]
- Fratini, L.; Lo Casto, S.; Lo Valvo, E. A technical note on an experimental device to measurefriction coefficient in sheet metal forming. J. Mater. Process. Technol. 2006, 172, 16–21. [Google Scholar] [CrossRef]
- Tamai, Y.; Inazumi, T.; Manabe, K. FE forming analysis with nonlinear friction coefficient model considering contact pressure, sliding velocity and sliding length. J. Mater. Process. Technol. 2016, 227, 161–168. [Google Scholar] [CrossRef]
- Weinmann, K.; Bhonsle, S.; Gerstenberger, J. On the determination of the coefficient of friction and the friction factor by the strip-tension friction test. CIRP Ann. 1990, 39, 263–266. [Google Scholar] [CrossRef]
- Saha, P.K.; Wilson, W.R. Influence of plastic strain on friction in sheet metal forming. Wear 1994, 172, 167–173. [Google Scholar] [CrossRef]
- Hsu, T.C.; Kuo, S.G. Boundary friction model in punch friction test. J. Mater. Process. Technol. 1994, 45, 601–606. [Google Scholar] [CrossRef]
- Kim, H.; Hwang, B.; Bae, W. An experimental study on forming characteristics of pre-coated sheet metals. J. Mater. Process. Technol. 2002, 120, 290–295. [Google Scholar] [CrossRef]
- Lemu, H.G.; Trzepiecinski, T. Numerical and experimental study of frictional behavior in bending under tension test. Stroj. Vestn. J. Mech. Eng. 2013, 59, 41–49. [Google Scholar] [CrossRef]
- Ramezani, M.; Neitzert, T.; Pasang, T.; Selles, M.A. Dry sliding frictional characteristics of ZE10 and AZ80 magnesium strips under plastic deformation. Tribol. Int. 2015, 82, 255–262. [Google Scholar] [CrossRef]
- Fridman, H.D.; Levesque, P. Reduction of static friction by sonic vibrations. J. Appl. Phys. 1959, 30, 1572–1575. [Google Scholar] [CrossRef]
- Chowdhury, M.A.; Khalil, M.K.; Nuruzzaman, D.M.; Rahaman, M.L. The effect of sliding speed and normal load on friction. Mechatron. Eng. 2011, 11, 45–49. [Google Scholar]
- Saha, P.K. Factors affecting the accuracy and control of the sheet metal forming simulator. Trans. NAMRI/SME 1994, 22, 47–54. [Google Scholar]
- Adamczak, S.; Zmarzły, P. Research of the influence of the 2D and 3D surface roughness parameters of bearing raceways on the vibration level. J. Phys. Conf. Ser. 2019, 1183. [Google Scholar] [CrossRef]
- Ali, M.K.A.; Xianjun, H.; Elagouz, A.; Essa, F.A.; Abdelkareem, M.A.A. Minimizing of the boundary friction coefficient in automotive engines using Al2O3 and TiO2 nanoparticles. J. Nanopart. Res. 2016, 18, 377. [Google Scholar] [CrossRef]
- Escosa, E.G.; García, I.; Damborenea, J.J.D.; Conde, A. Friction and wear behaviour of tool steels sliding against 22MnB5 steel. J. Mater. Res. Technol. 2017, 6, 241–250. [Google Scholar] [CrossRef]
- Wu, Z.; Xing, Y.; Huang, P.; Liu, L. Tribological properties of dimple-textured titanium alloys under dry sliding contact. Surf. Coat. Technol. 2017, 309, 21–28. [Google Scholar] [CrossRef]
- Hwang, Y.M.; Yu, H.P.; Chen, C.C. Study of friction tests of strips with variant relative speeds, Tube Hydroforming Technology. In Proceedings of the 9th International Conference On Tube Hydroforming, Kaohsiung, Taiwan, 18–21 November 2019; pp. 178–183. [Google Scholar]
Publisher’s Note: MDPI stays neutral with regard to jurisdictional claims in published maps and institutional affiliations. |
Figure 1.
Free body diagram and geometric configurations between strip and friction wheel.

Figure 2.
Appearance of self-developed friction test machine.

Figure 3.
Strip movement variations during friction tests.

Figure 4.
Drawing force variations in friction tests.
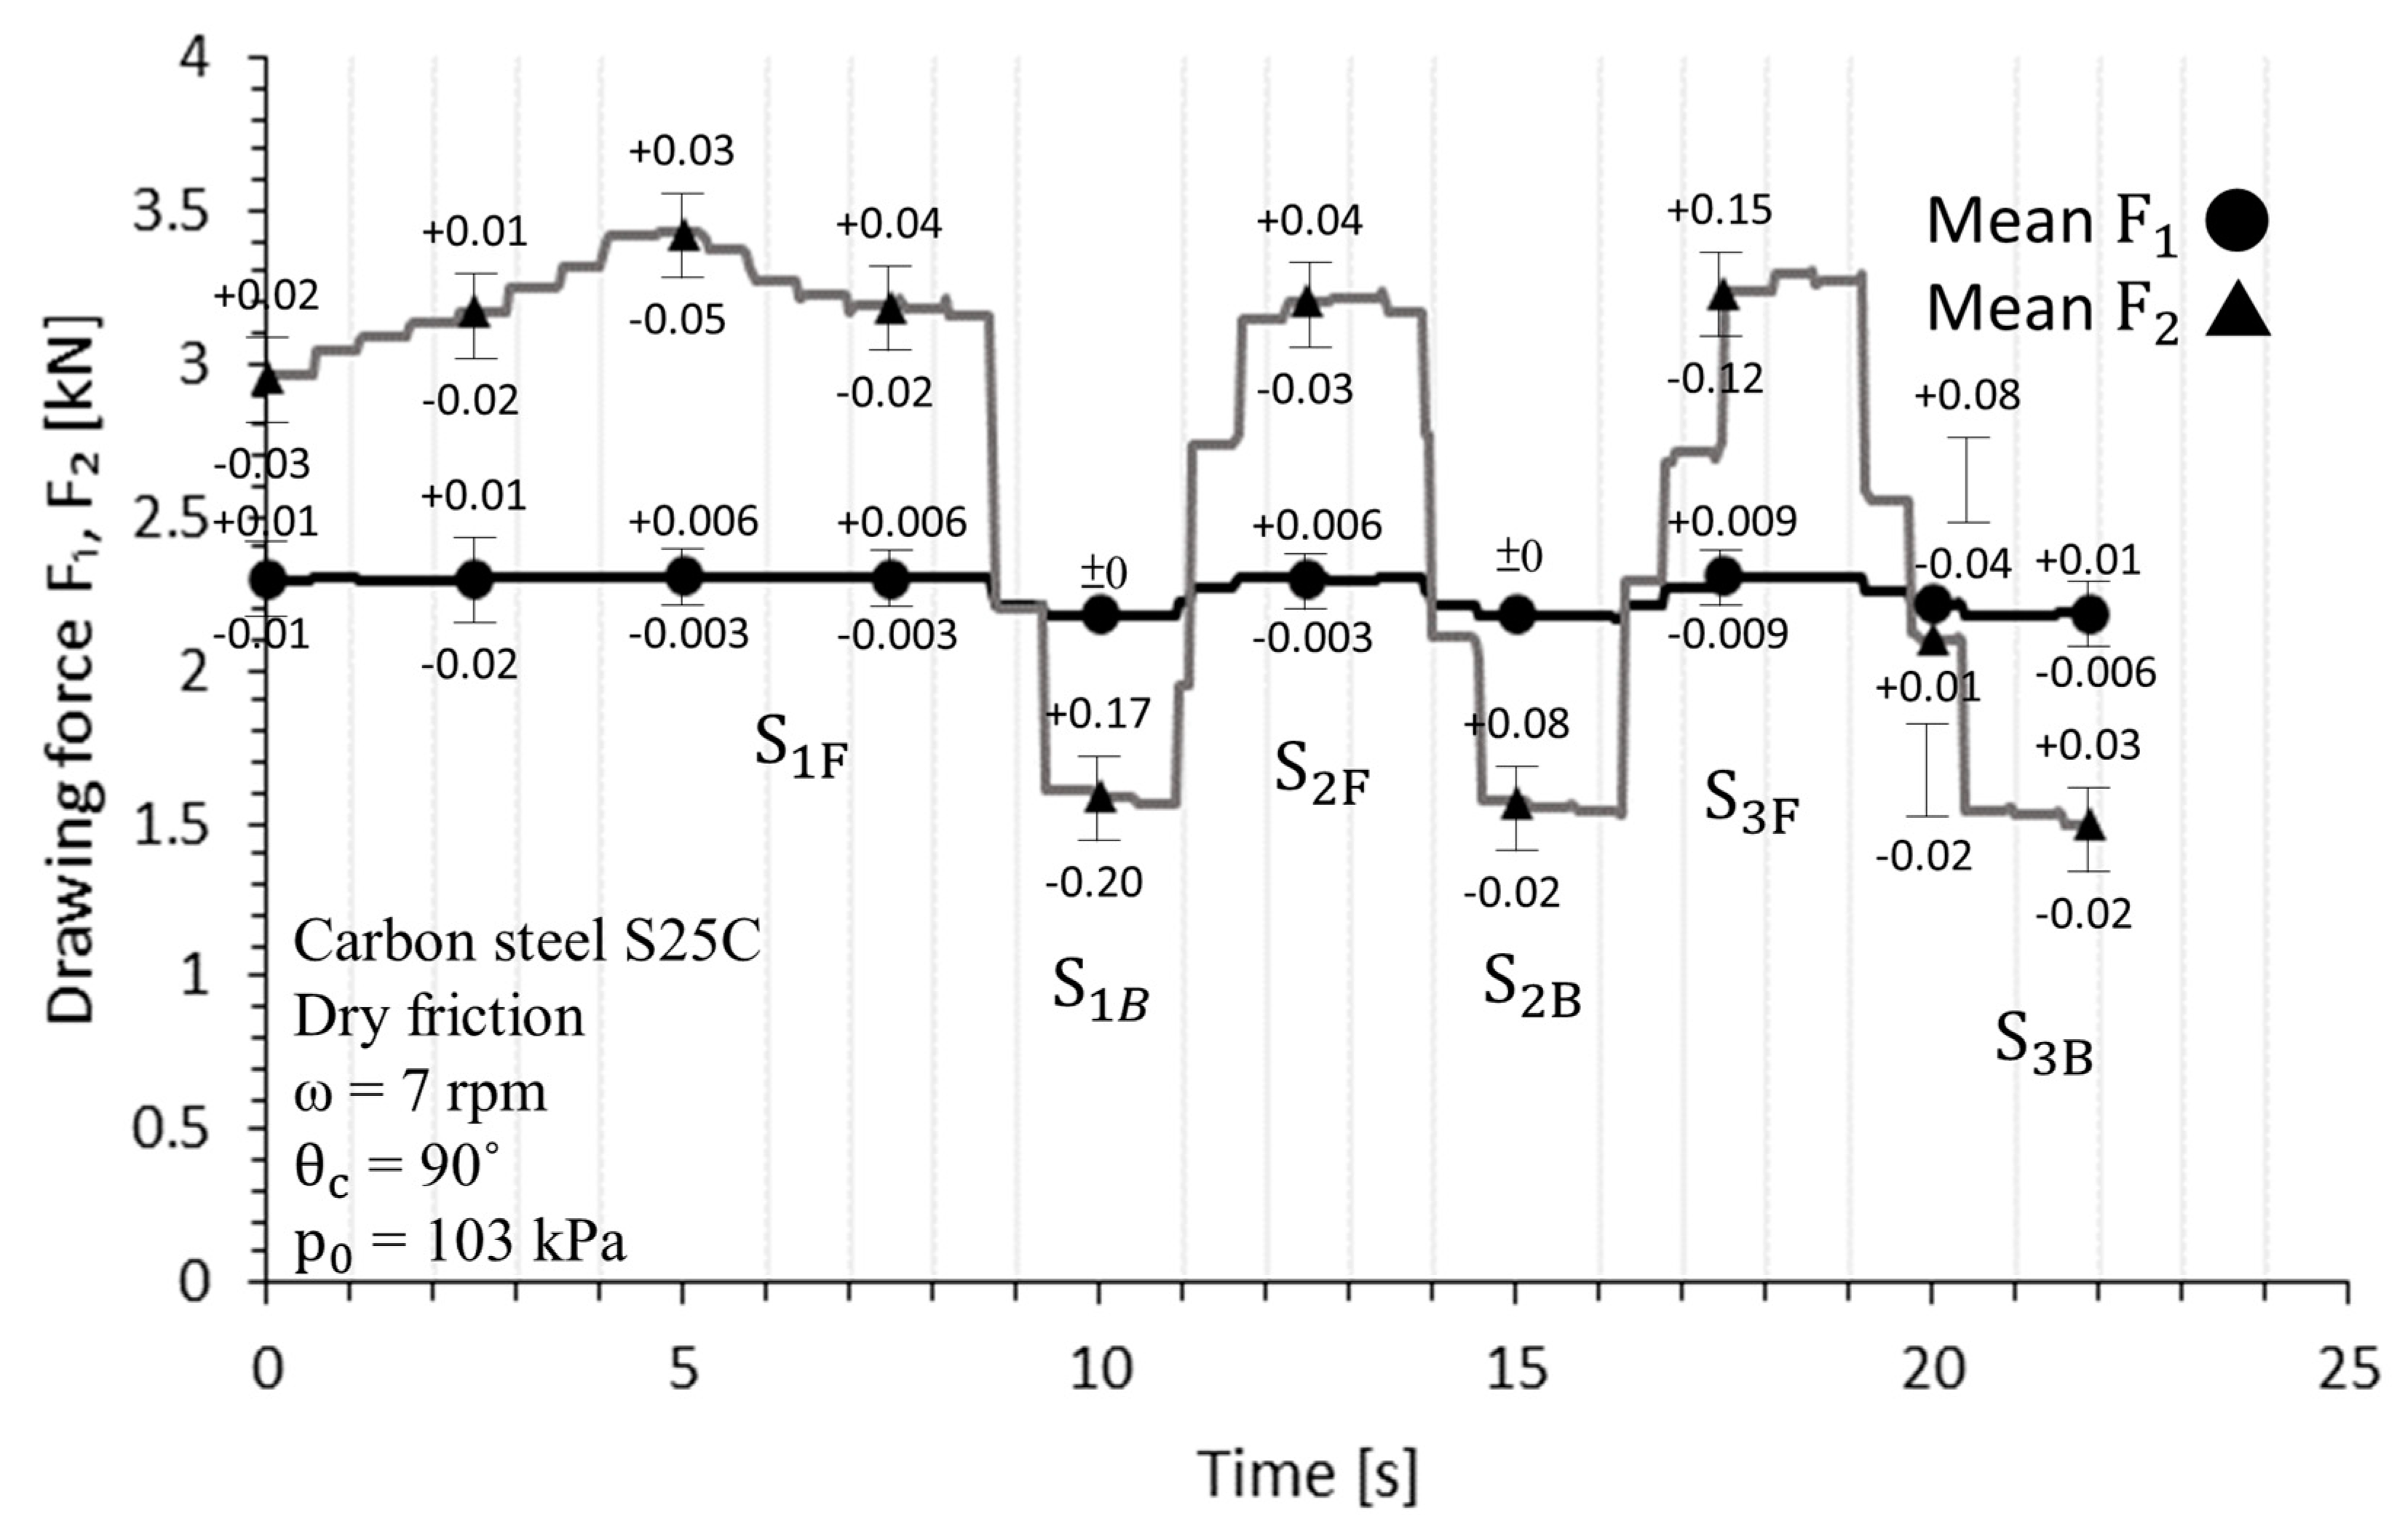
Figure 5.
Drawing force variations with rotation speed of 5 rpm.

Figure 6.
Contact pressure variations during friction tests.

Figure 7.
Effects of rotation speed on friction coefficient under dry friction condition.

Figure 8.
Effects of rotation speed on friction coefficient under lubricated condition.
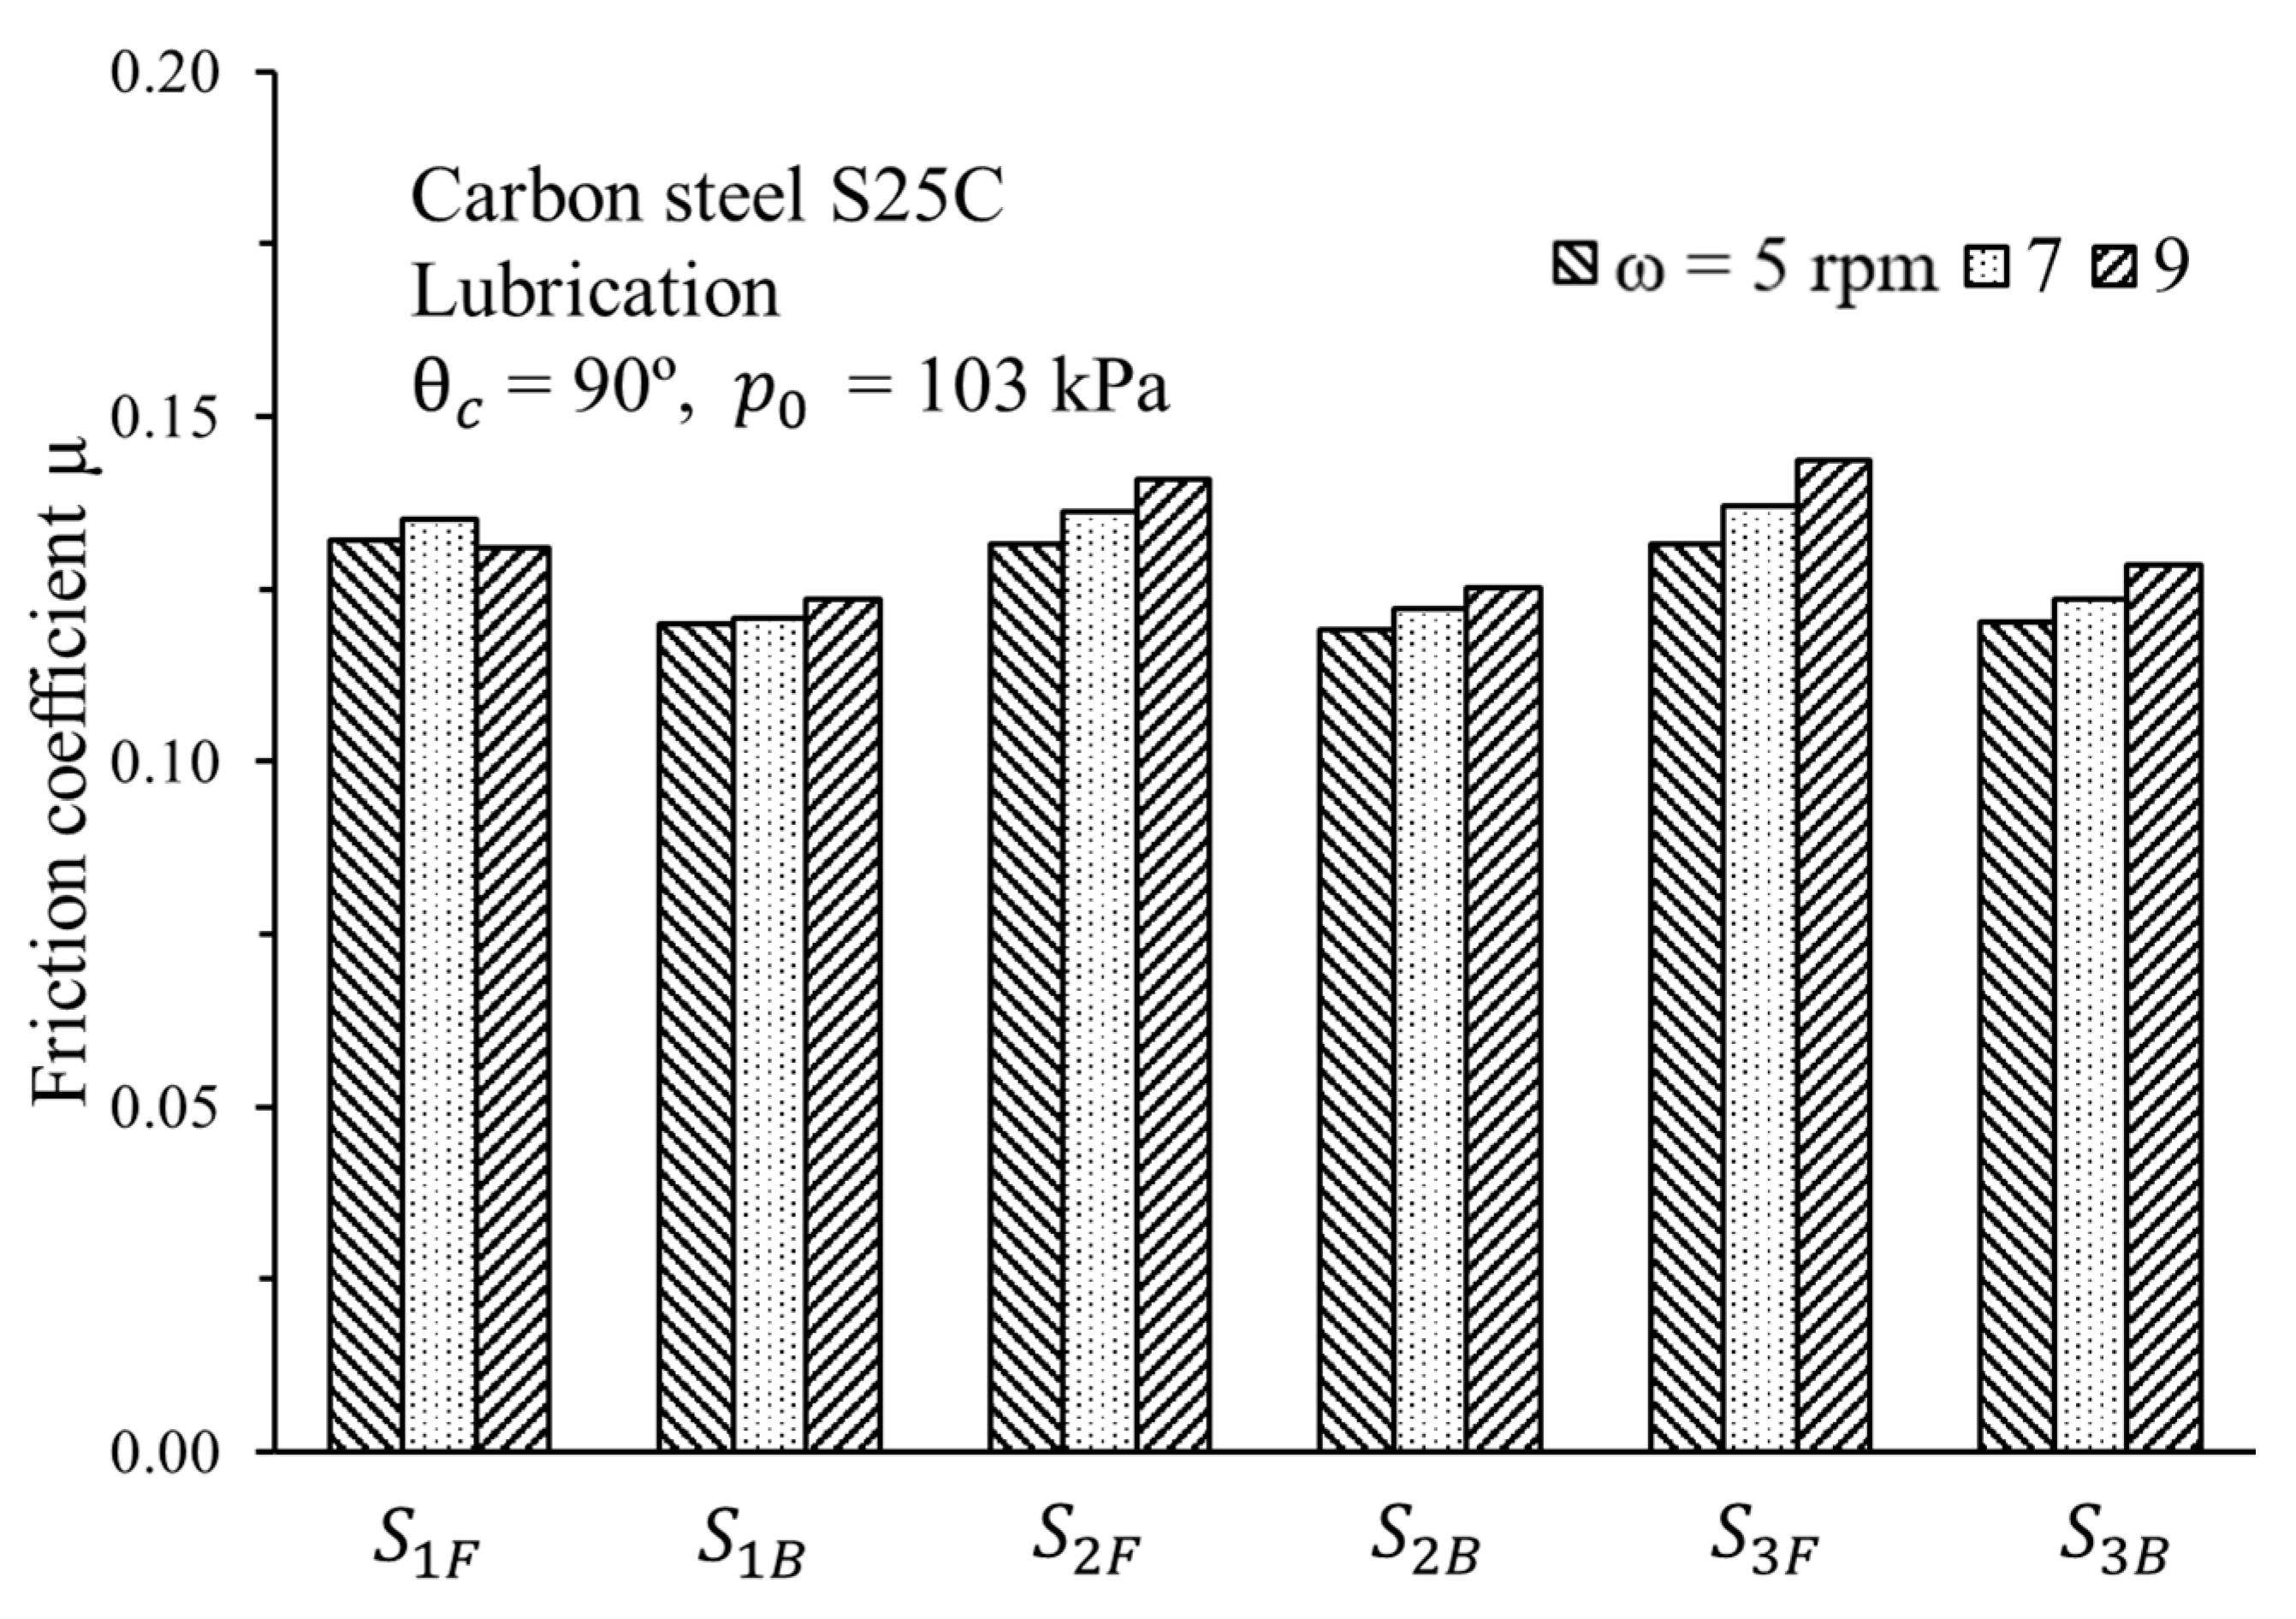
Figure 9.
Effects of rotation speed on friction coefficient under dry friction conditions.

Figure 10.
Effects of rotation speed on friction coefficient under lubricated conditions.

Figure 11.
Effects of rotation speed on friction coefficient under dry friction conditions for aluminum alloy 6063-T6 strips.
Figure 11.
Effects of rotation speed on friction coefficient under dry friction conditions for aluminum alloy 6063-T6 strips.
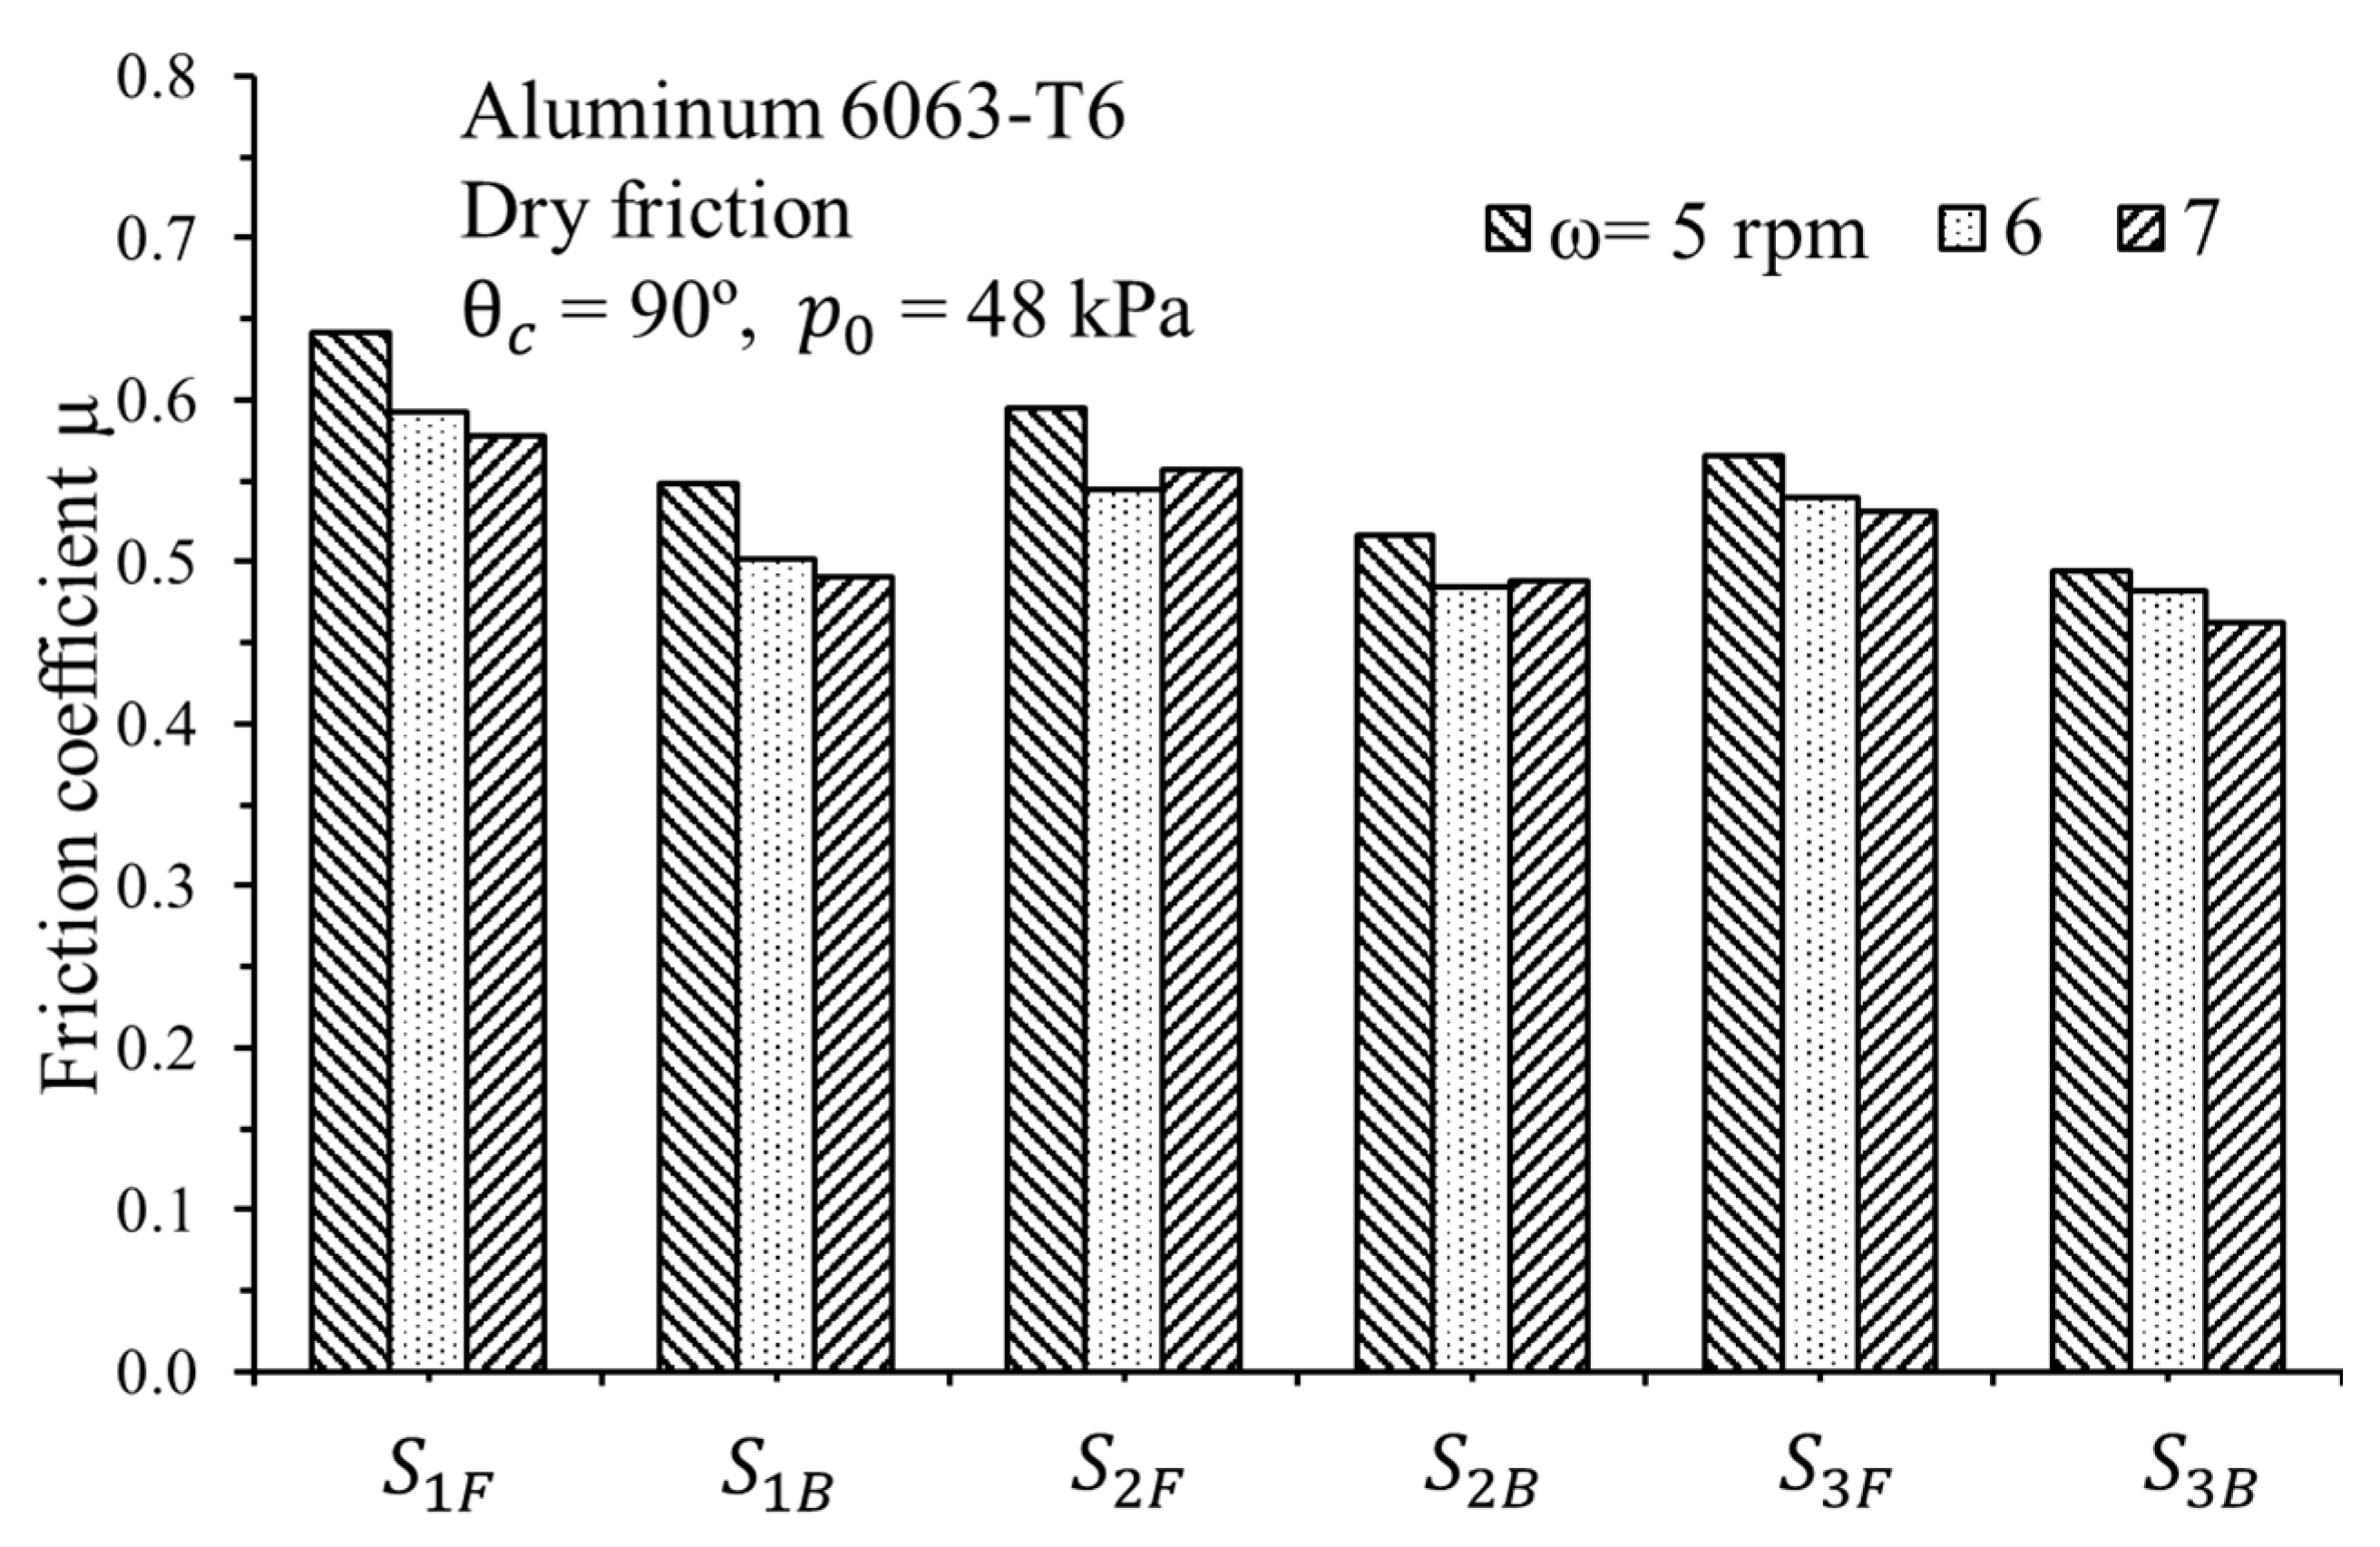
Figure 12.
Effects of rotation speed on friction coefficient under lubricated conditions for aluminum alloy 6063-T6 strips.
Figure 12.
Effects of rotation speed on friction coefficient under lubricated conditions for aluminum alloy 6063-T6 strips.

Figure 13.
Contact pressure variations with different contact angles for Al6063-T6.
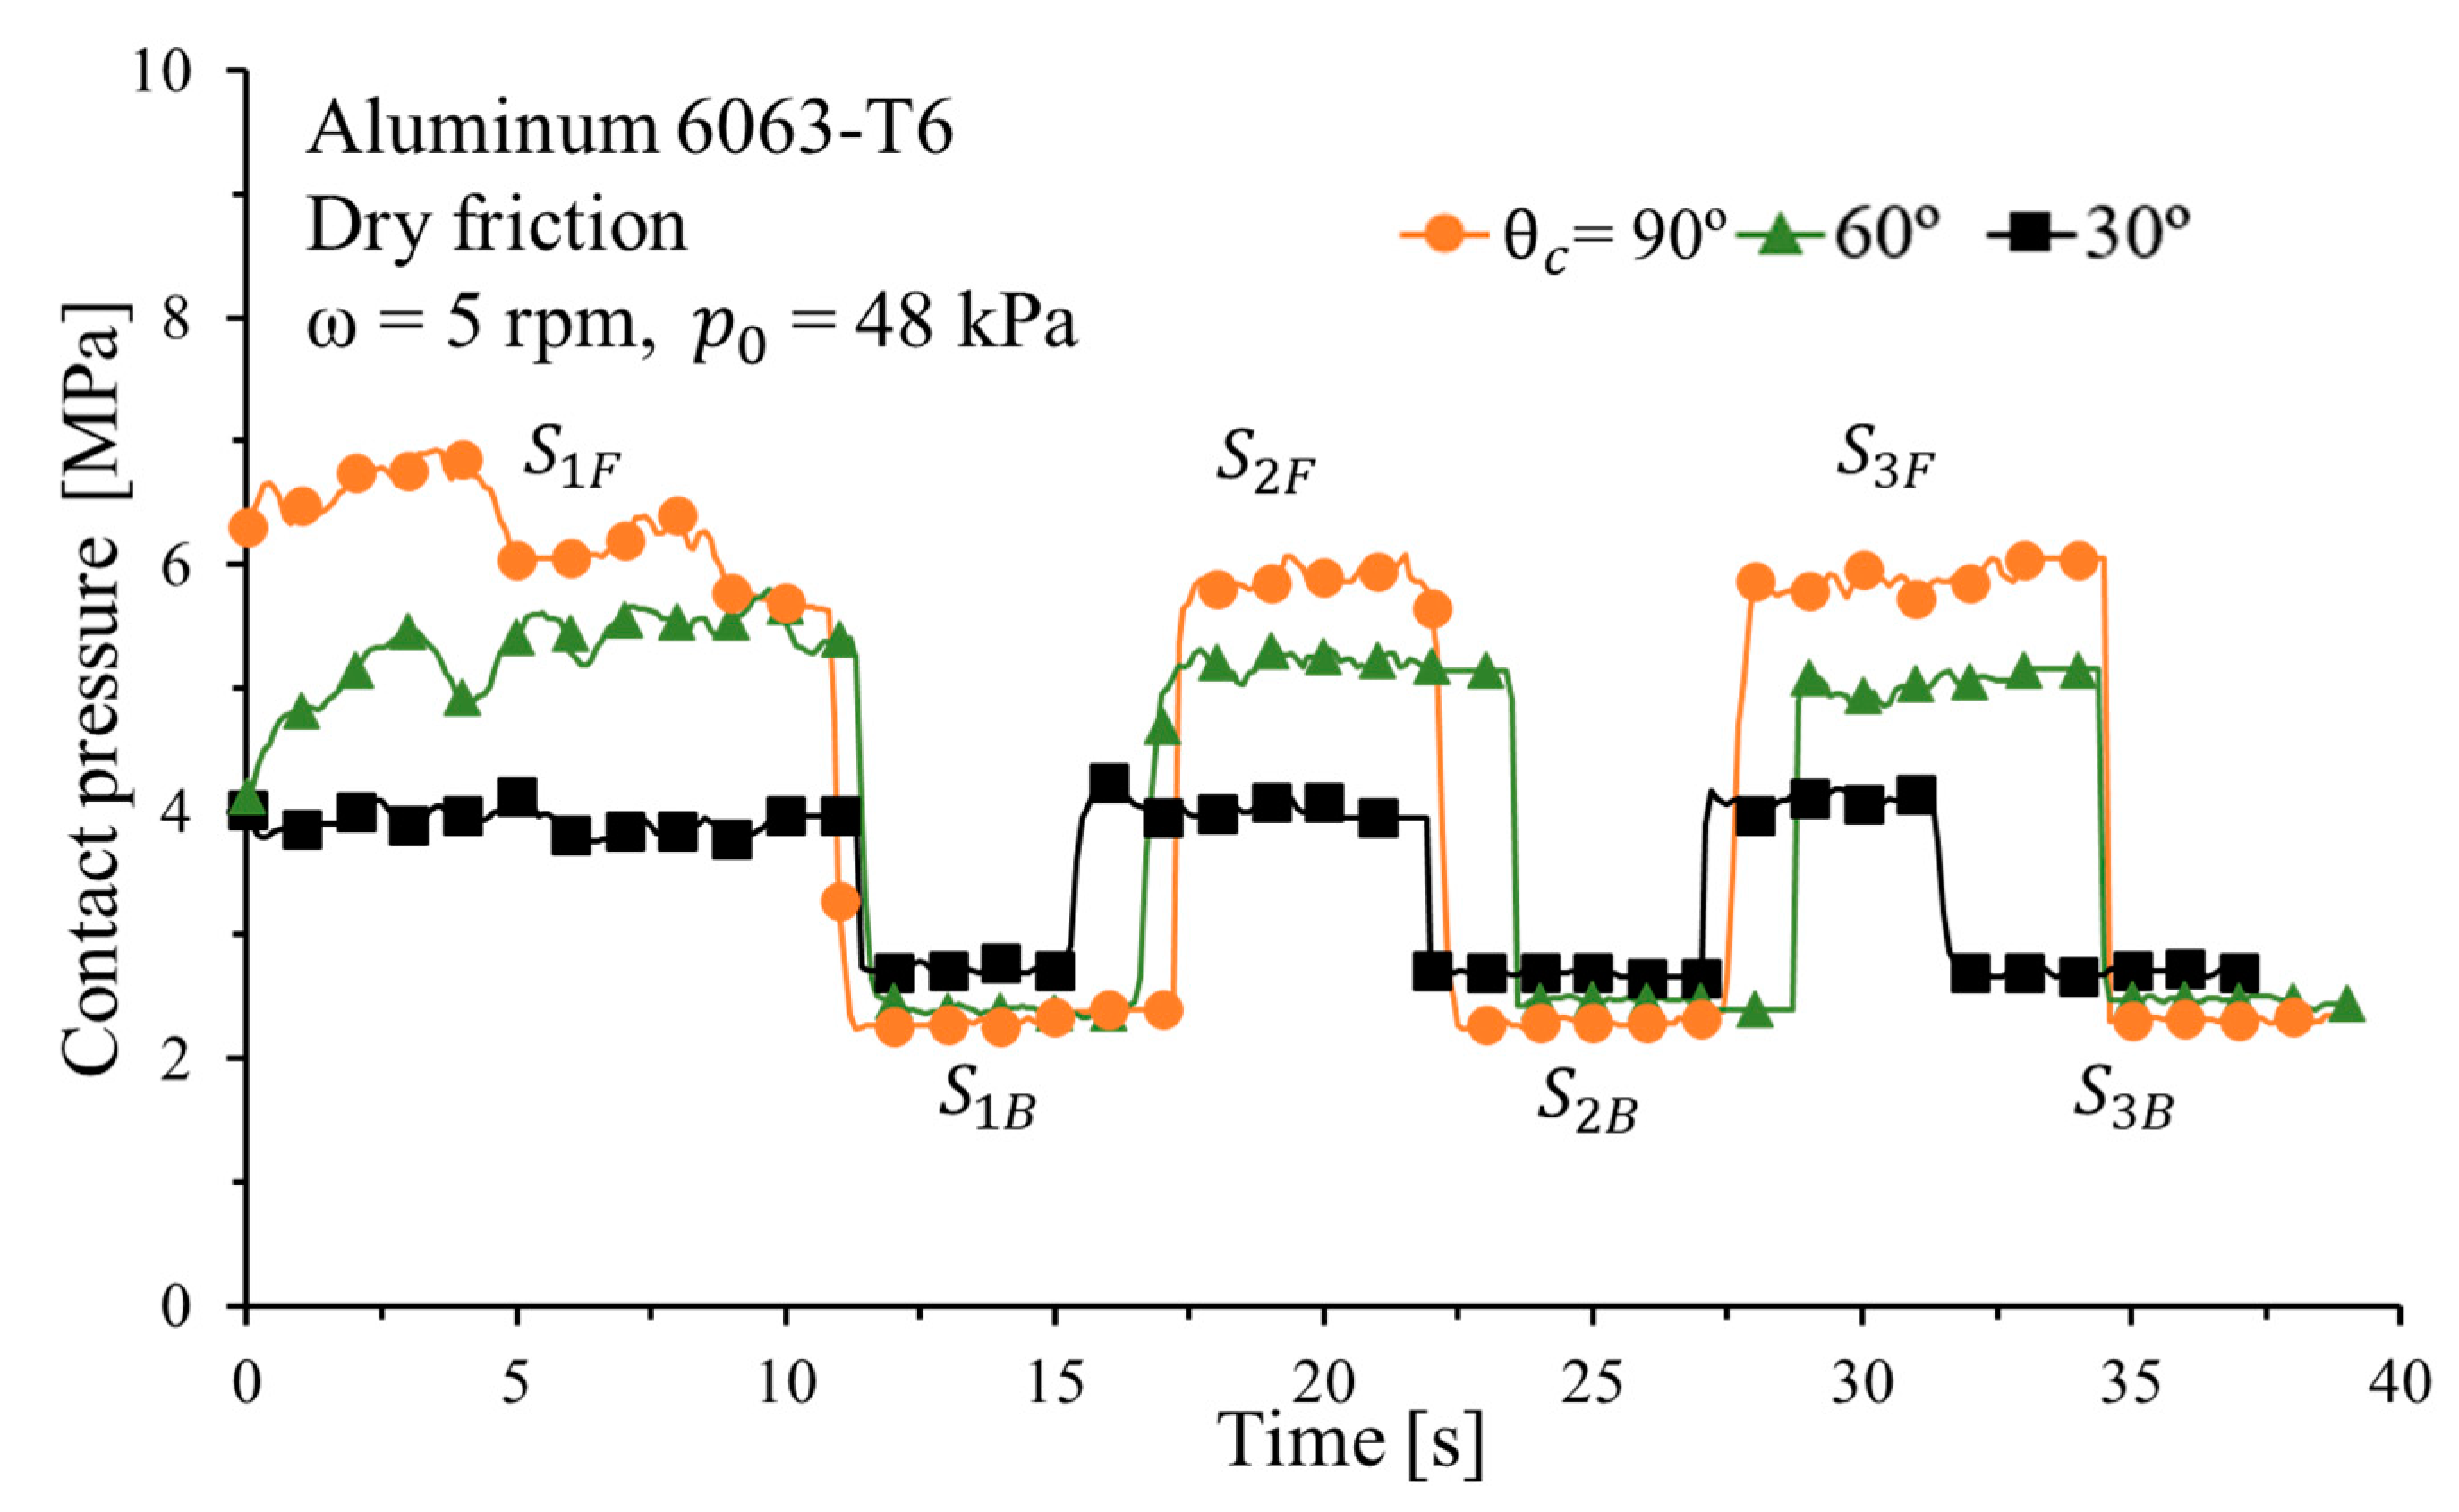
Figure 14.
Friction coefficient variations with different contact angles for Al6063-T6.

Table 1.
Friction tests conditions.
| Strip Material | Vickers Hardness (HV) | Rotation Speed ω (rpm) | (°) | Interface Condition | ||
|---|---|---|---|---|---|---|
| Case 1 | Carbon steel S25C (t = 1.1 mm) | 130 | 5, 7, 9 | 90 | Oil lubrication/Dry friction | 103 |
| Case 2 | Brass C2680 (t = 0.5 mm) | 128 | 5, 7, 9 | 90 | Oil lubrication/Dry friction | 69 |
| Case 3 | Aluminum 6063-T6 (t = 1.3 mm) | 83 | 5, 6, 7 | 90 | Oil lubrication/Dry friction | 48 |
| Case 4 | Aluminum 6063-T6 | 83 | 5 | 30, 60, 90 | Dry friction | 48 |
Table 2.
Friction coefficients of brass C2680 at different forward stages with 5 rpm.
| Dry Friction | Lubrication | |||
|---|---|---|---|---|
| Friction Coefficient μ | Friction Coefficient μ | |||
| 0.288 | 0.120 | |||
| 0.292 | 1.4% | 0.154 | 22.1% | |
| 0.298 | 2.0% | 0.157 | 1.9% | |
Table 3.
Average friction coefficients μ under dry friction, values in square brackets denote μ under lubricated conditions.
Table 3.
Average friction coefficients μ under dry friction, values in square brackets denote μ under lubricated conditions.
| Material | Carbon Steel S25C | Al6063-T6 | Brass C2680 | ||||||||
|---|---|---|---|---|---|---|---|---|---|---|---|
| Rotation Speed (rpm) | 5 | 7 | 9 | 5 | 5 | 5 | 6 | 7 | 5 | 7 | 9 |
| Contact angle | 90 | 90 | 90 | 30 | 60 | 90 | 90 | 90 | 90 | 90 | 90 |
| 0.248 | 0.248 | 0.238 | 0.191 | 0.478 | 0.642 | 0.593 | 0.578 | 0.288 | 0.183 | 0.161 | |
| [0.132] | [0.135] | [0.131] | [0.321] | [0.292] | [0.277] | [0.120] | [0.135] | [0.135] | |||
| 0.264 | 0.251 | 0.209 | 0.191 | 0.407 | 0.548 | 0.501 | 0.491 | 0.269 | 0.209 | 0.186 | |
| [0.120] | [0.121] | [0.124] | [0.204] | [0.207] | [0.190] | [0.125] | [0.138] | [0.142] | |||
| 0.29 | 0.263 | 0.231 | 0.209 | 0.434 | 0.595 | 0.544 | 0.557 | 0.292 | 0.244 | 0.226 | |
| [0.131] | [0.136] | [0.141] | [0.223] | [0.222] | [0.218] | [0.154] | [0.165] | [0.176] | |||
| 0.282 | 0.261 | 0.24 | 0.198 | 0.373 | 0.517 | 0.484 | 0.489 | 0.29 | 0.243 | 0.219 | |
| [0.119] | [0.122] | [0.125] | [0.169] | [0.174] | [0.171] | [0.138] | [0.150] | [0.168] | |||
| 0.303 | 0.275 | 0.246 | 0.214 | 0.412 | 0.566 | 0.54 | 0.531 | 0.298 | 0.27 | 0.234 | |
| [0.131] | [0.137] | [0.144] | [0.200] | [0.199] | [0.199] | [0.157] | [0.168] | [0.177] | |||
| 0.295 | 0.271 | 0.255 | 0.205 | 0.361 | 0.494 | 0.483 | 0.463 | 0.304 | 0.261 | 0.221 | |
| [0.120] | [0.124] | [0.128] | [0.168] | [0.173] | [0.164] | [0.145] | [0.152] | [0.172] | |||
© 2020 by the authors. Licensee MDPI, Basel, Switzerland. This article is an open access article distributed under the terms and conditions of the Creative Commons Attribution (CC BY) license (http://creativecommons.org/licenses/by/4.0/).
Share and Cite
MDPI and ACS Style
Hwang, Y.-M.; Chen, C.-C. Investigation of Effects of Strip Metals and Relative Sliding Speeds on Friction Coefficients by Reversible Strip Friction Tests. Metals 2020, 10, 1369. https://doi.org/10.3390/met10101369
AMA Style
Hwang Y-M, Chen C-C. Investigation of Effects of Strip Metals and Relative Sliding Speeds on Friction Coefficients by Reversible Strip Friction Tests. Metals. 2020; 10(10):1369. https://doi.org/10.3390/met10101369
Chicago/Turabian StyleHwang, Yeong-Maw, and Chiao-Chou Chen. 2020. "Investigation of Effects of Strip Metals and Relative Sliding Speeds on Friction Coefficients by Reversible Strip Friction Tests" Metals 10, no. 10: 1369. https://doi.org/10.3390/met10101369
Note that from the first issue of 2016, this journal uses article numbers instead of page numbers. See further details here.