Use of the Critical Acidification Model to Estimate the Influence of W in the Localized Corrosion Resistance of 25Cr Super Duplex Stainless Steels


Abstract
:1. Introduction
Crevice-Like-Solutions and the Critical Acidification Model
2. Materials and Methods
2.1. Materials
2.2. Galvele’s Critical Acidification Model
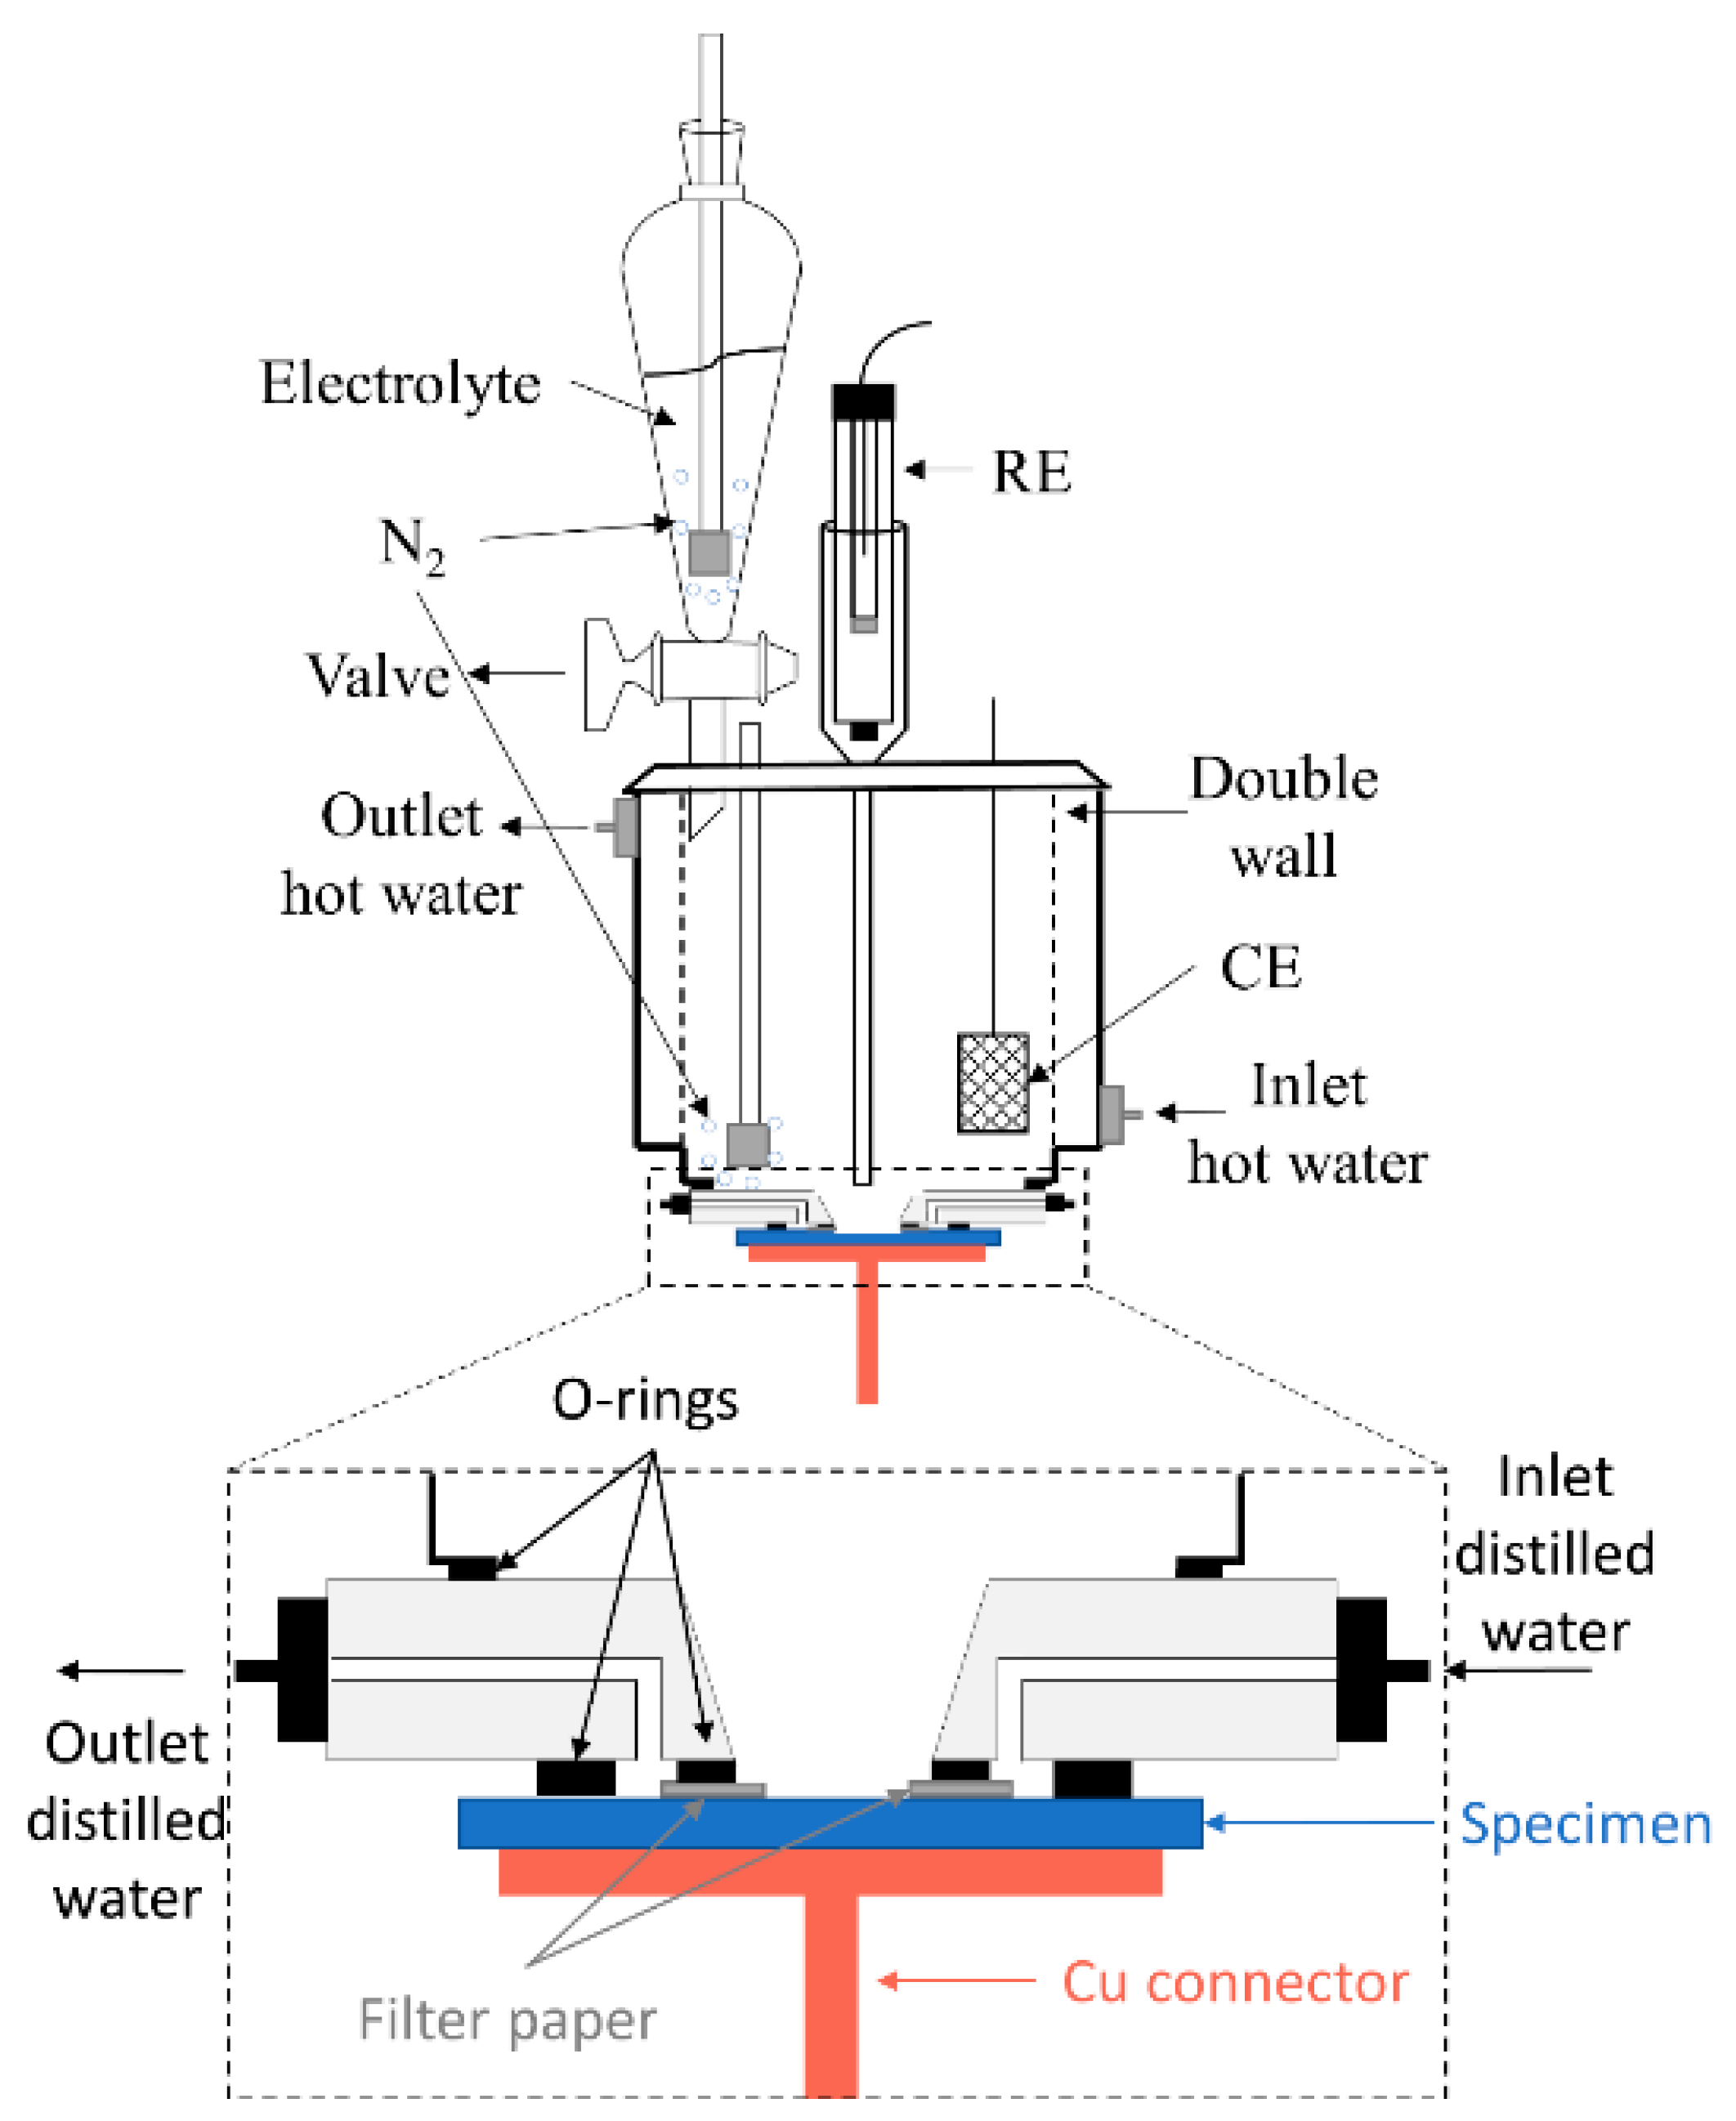
2.3. Crevice-Like-Solutions
2.4. Characterization
2.5. Statistical Analysis
3. Results
3.1. Crevice-Like-Solutions
3.2. Galvele’s Acidification Model
3.3. Statistical Analysis
4. Discussion
4.1. Choice of Parameters for the Critical Acidification Model
4.2. Role of W in Crevice-Like-Solutions
4.3. Prediction of Crevice Corrosion Repassivation Potential
5. Conclusions
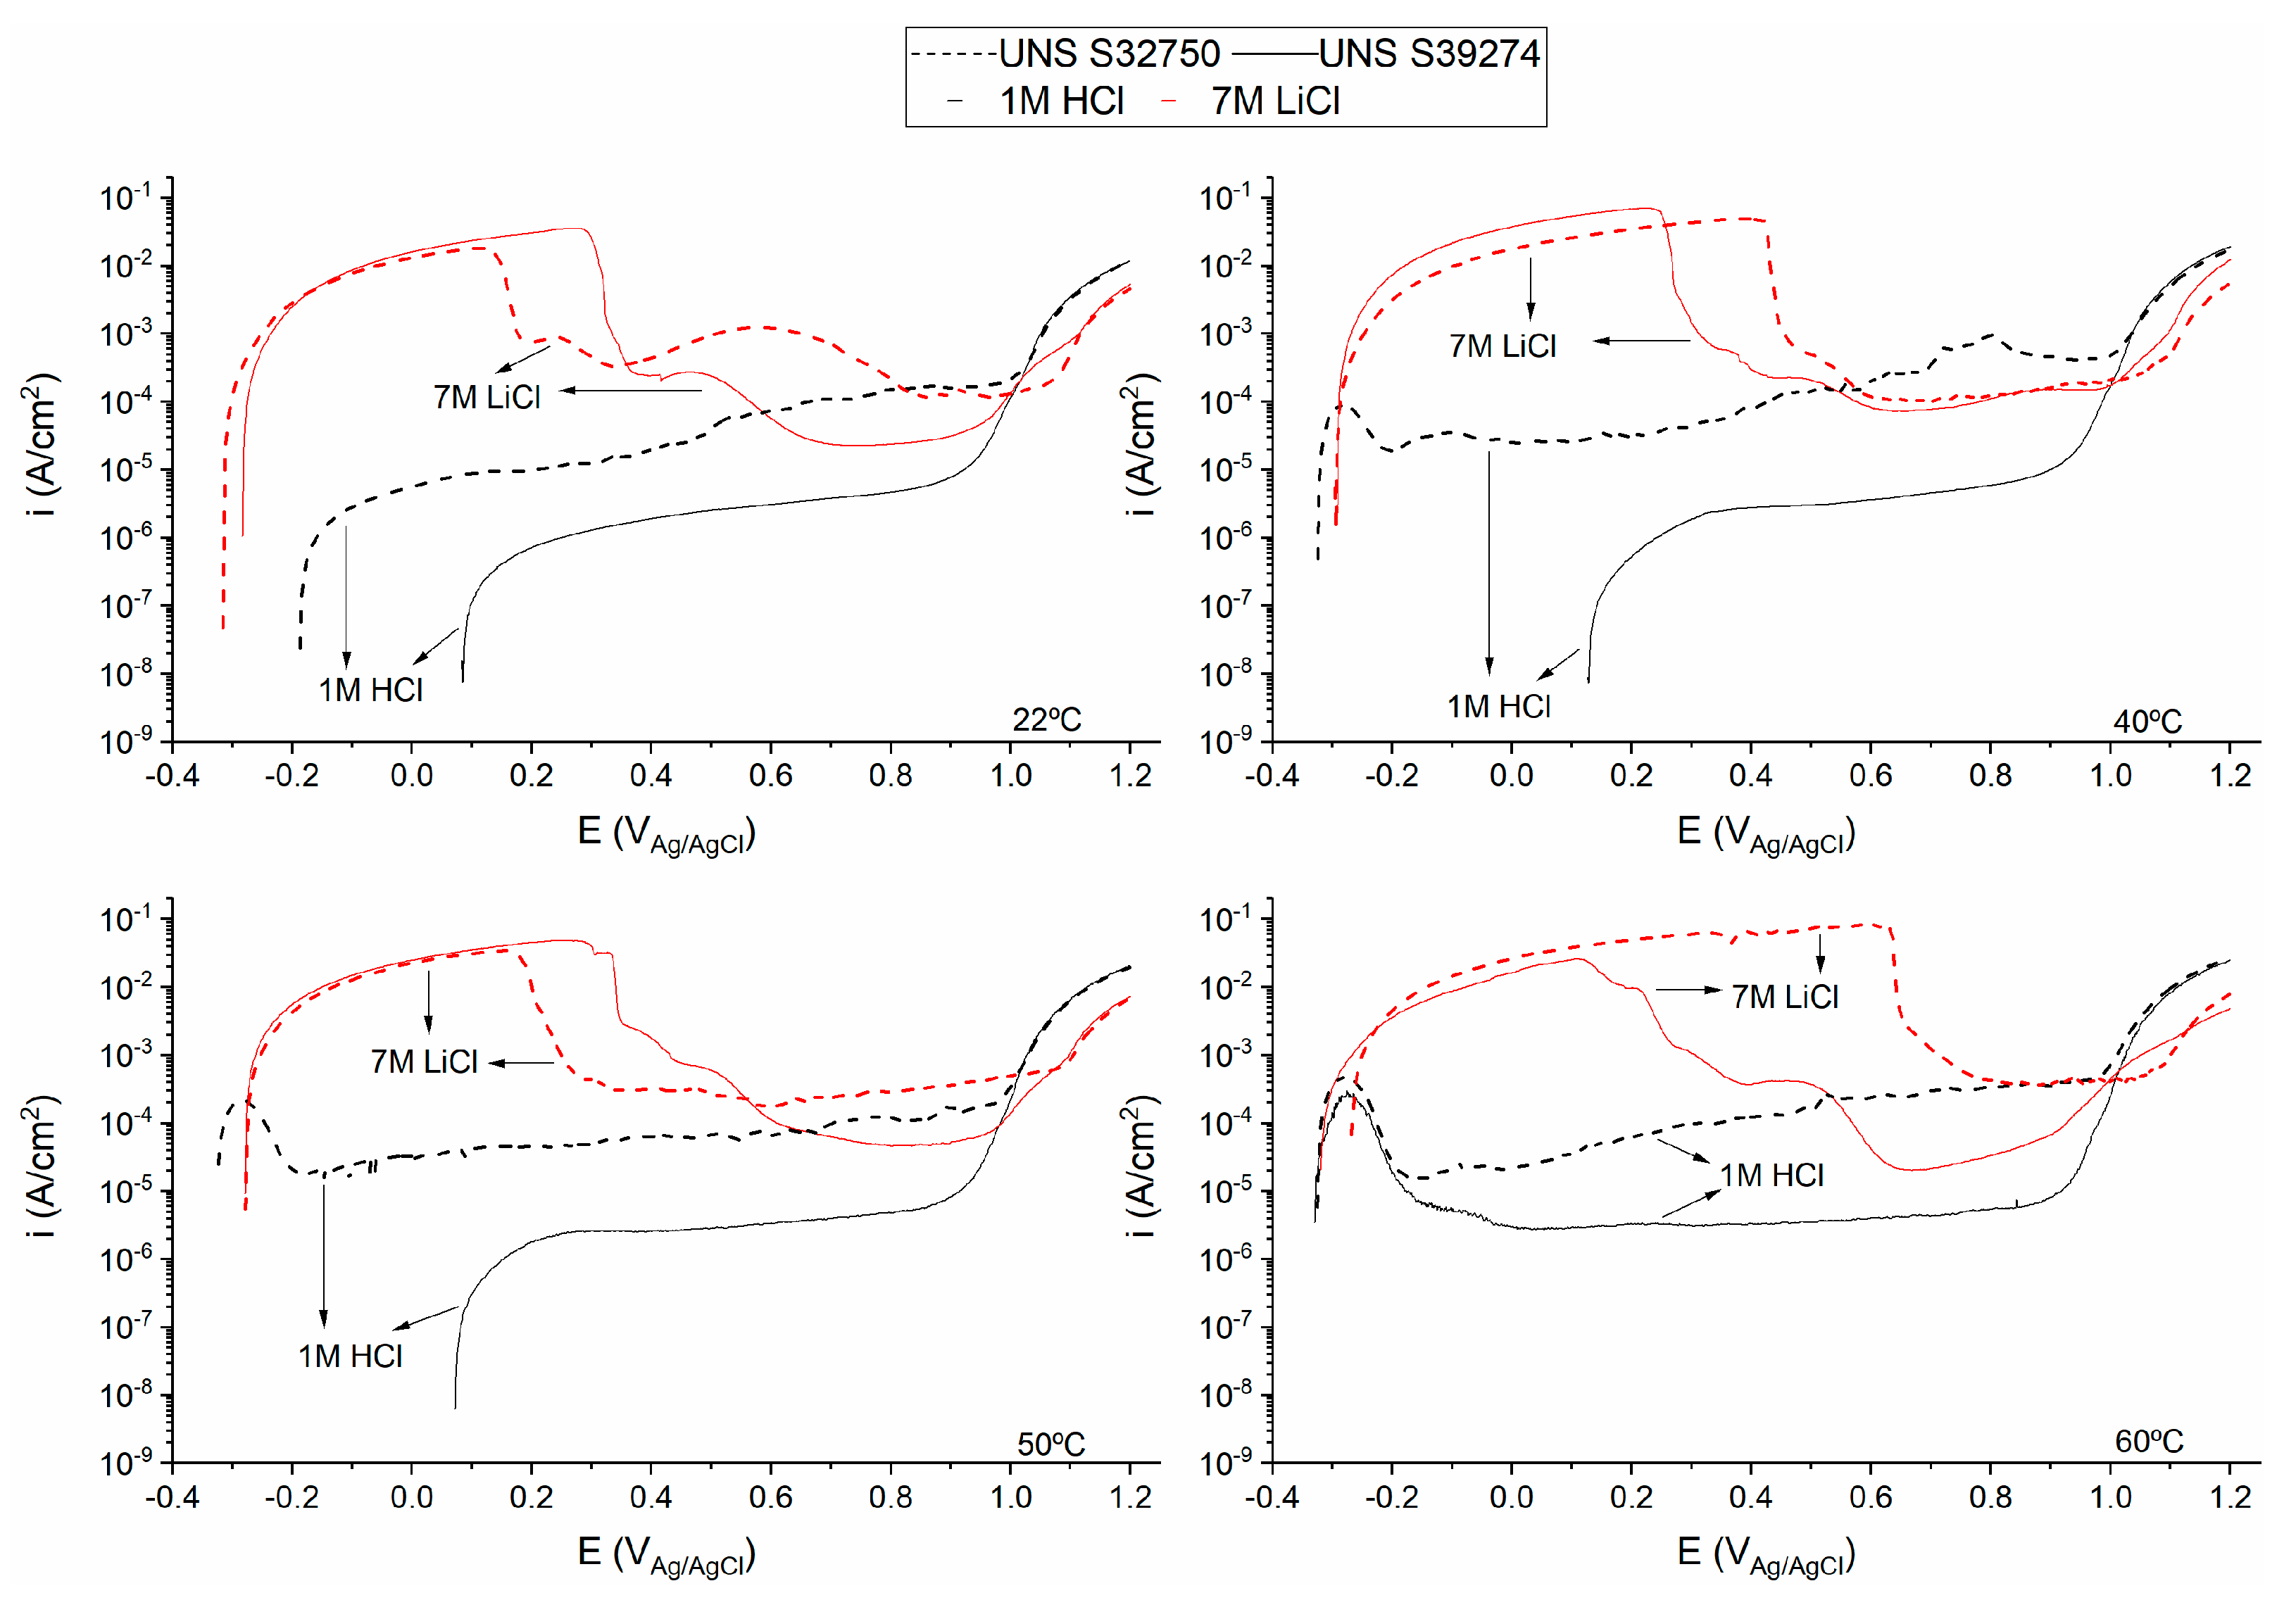
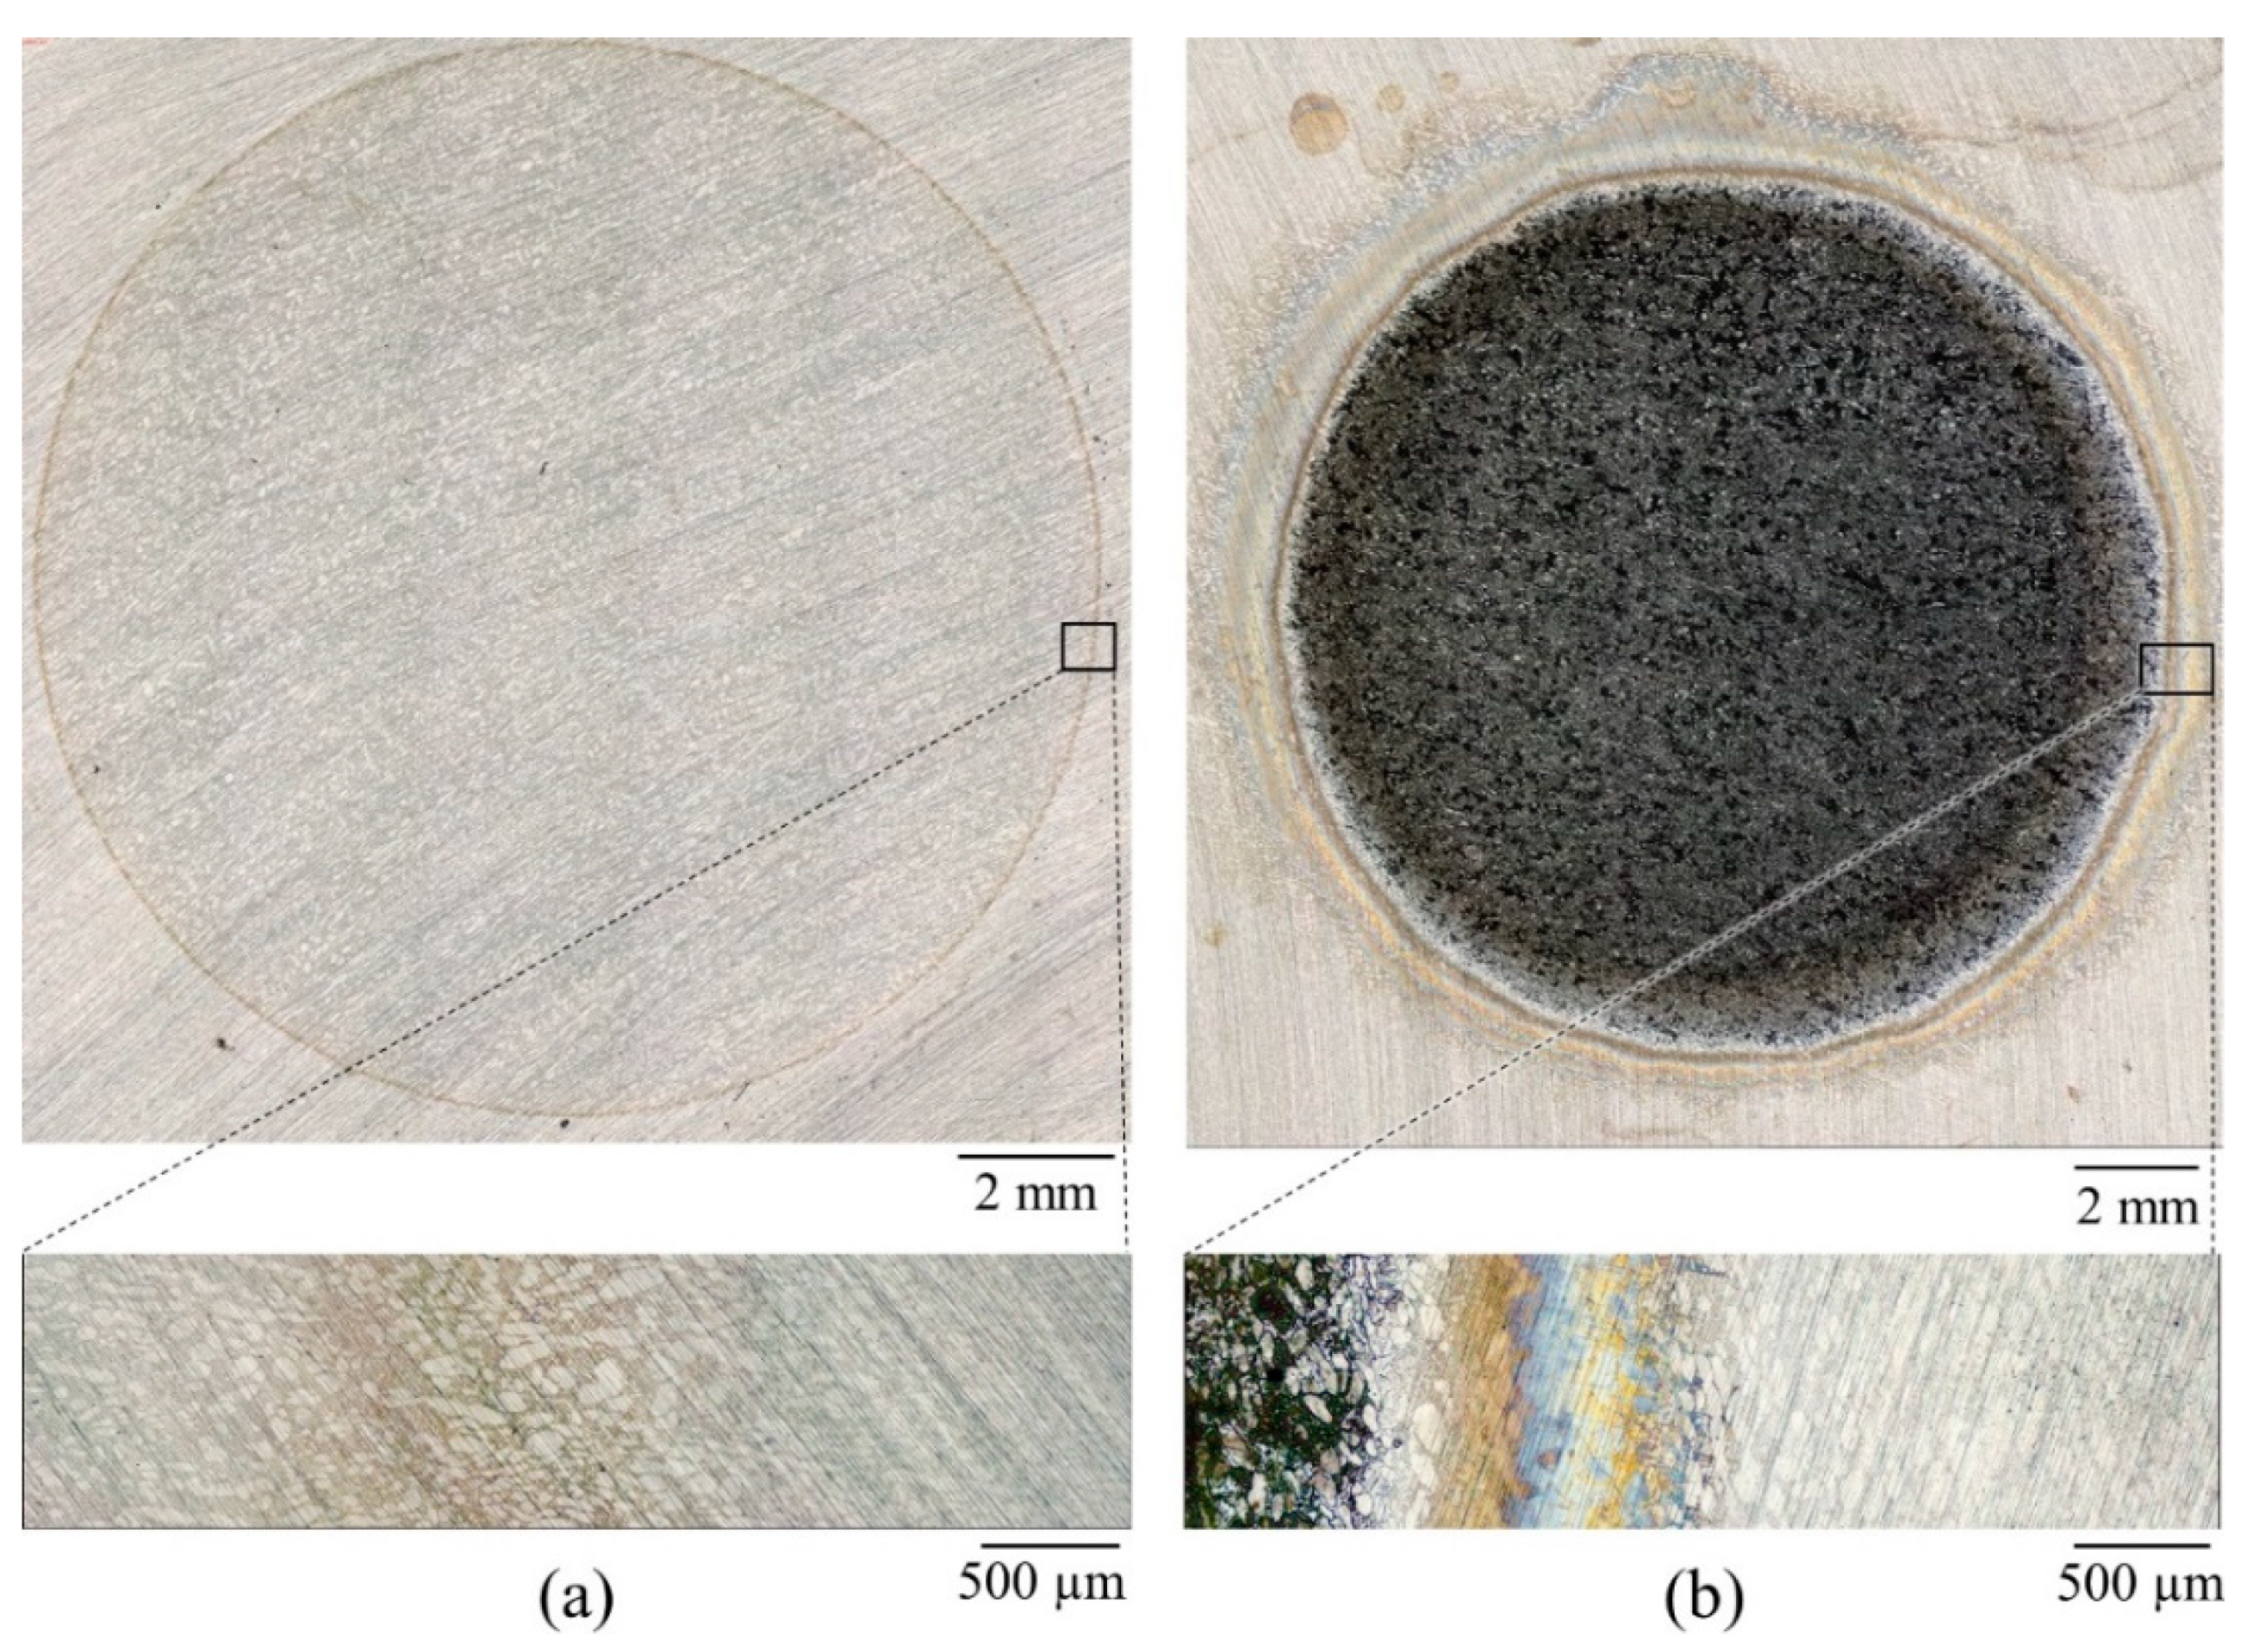
- A 7 N Cl− (pH = 0) crevice-like solution was necessary to simulate stable crevice propagation, suggesting that W additions could be beneficial only in situations of localized corrosion propagation under a salt film.
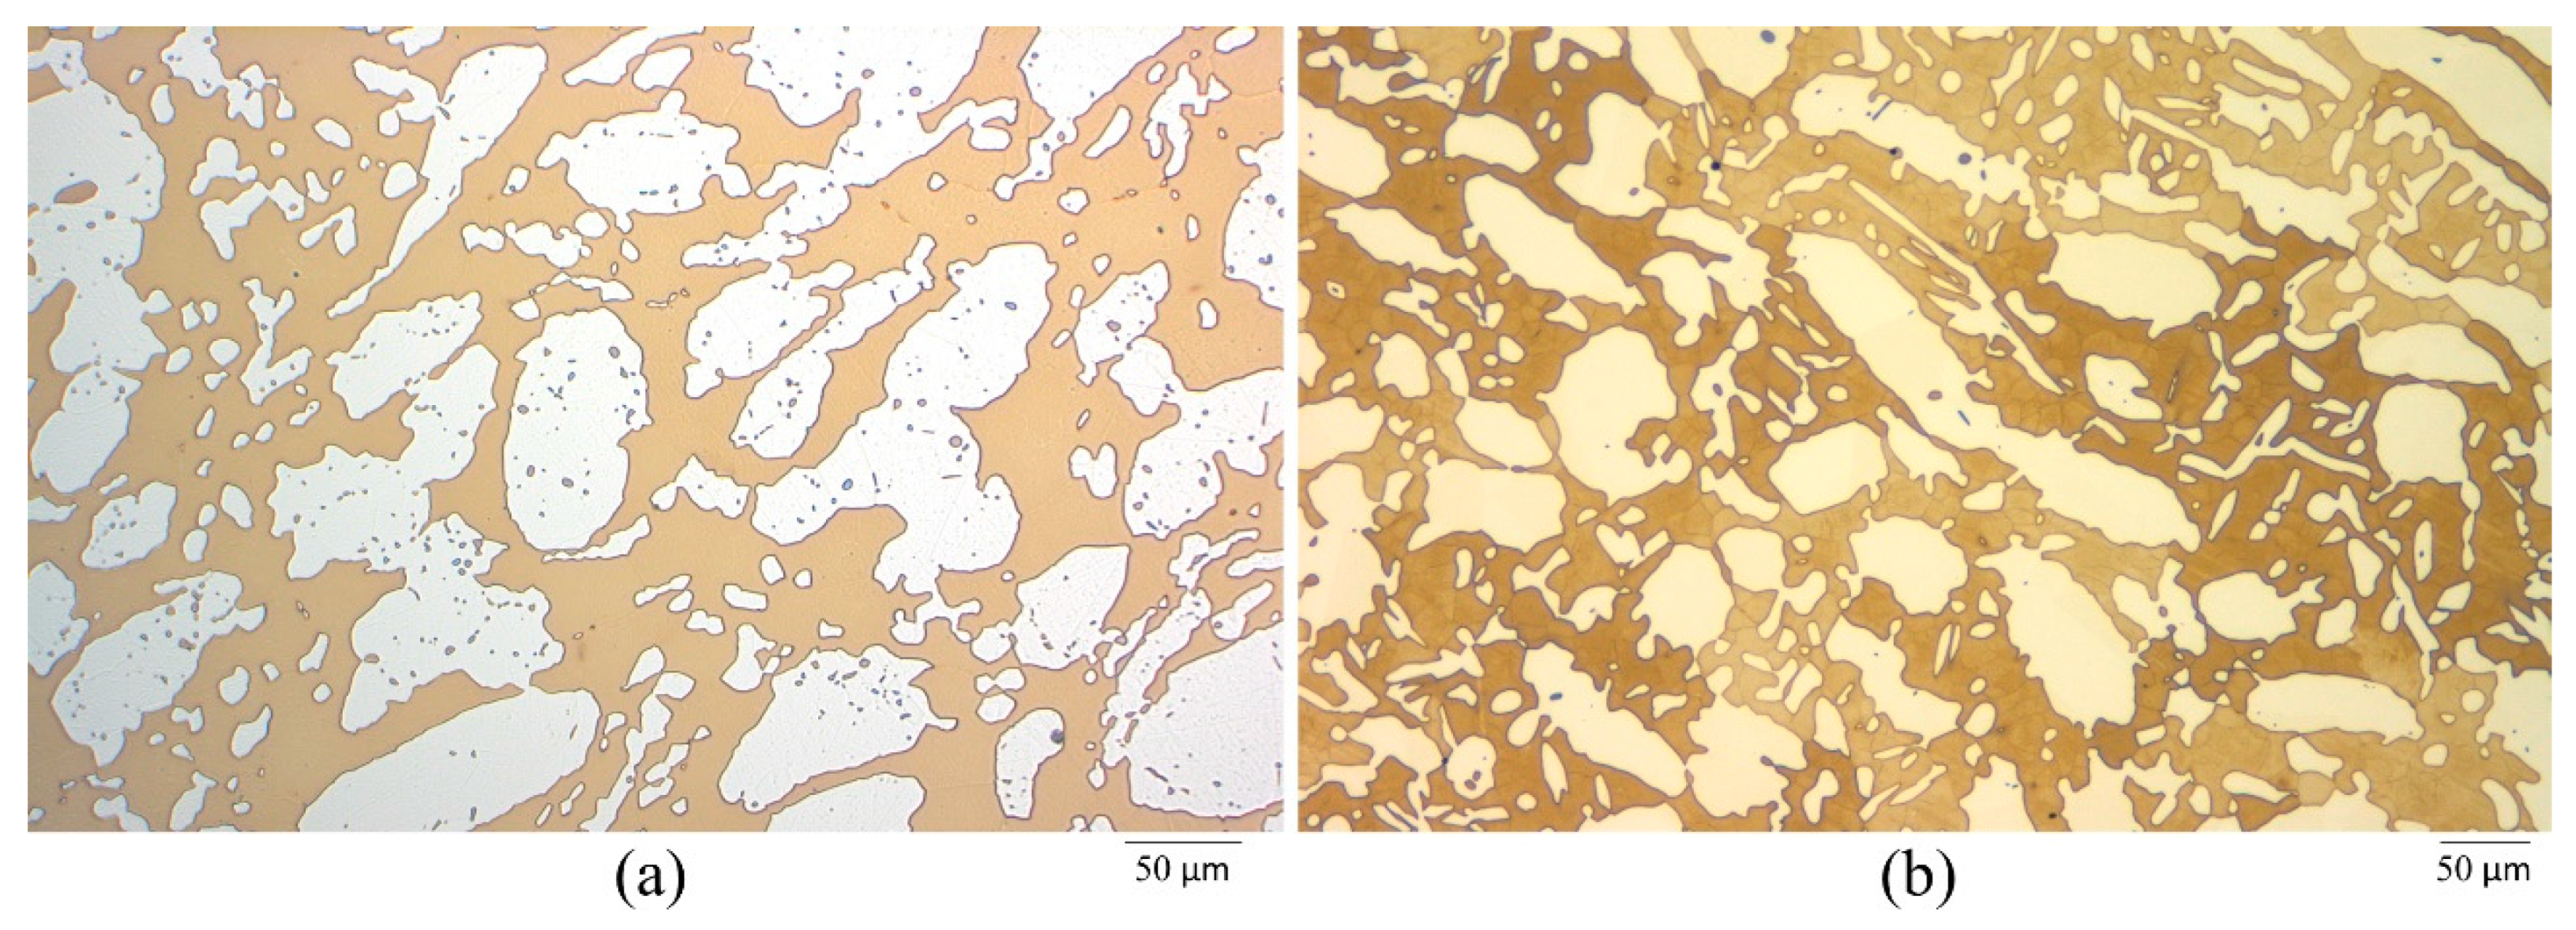
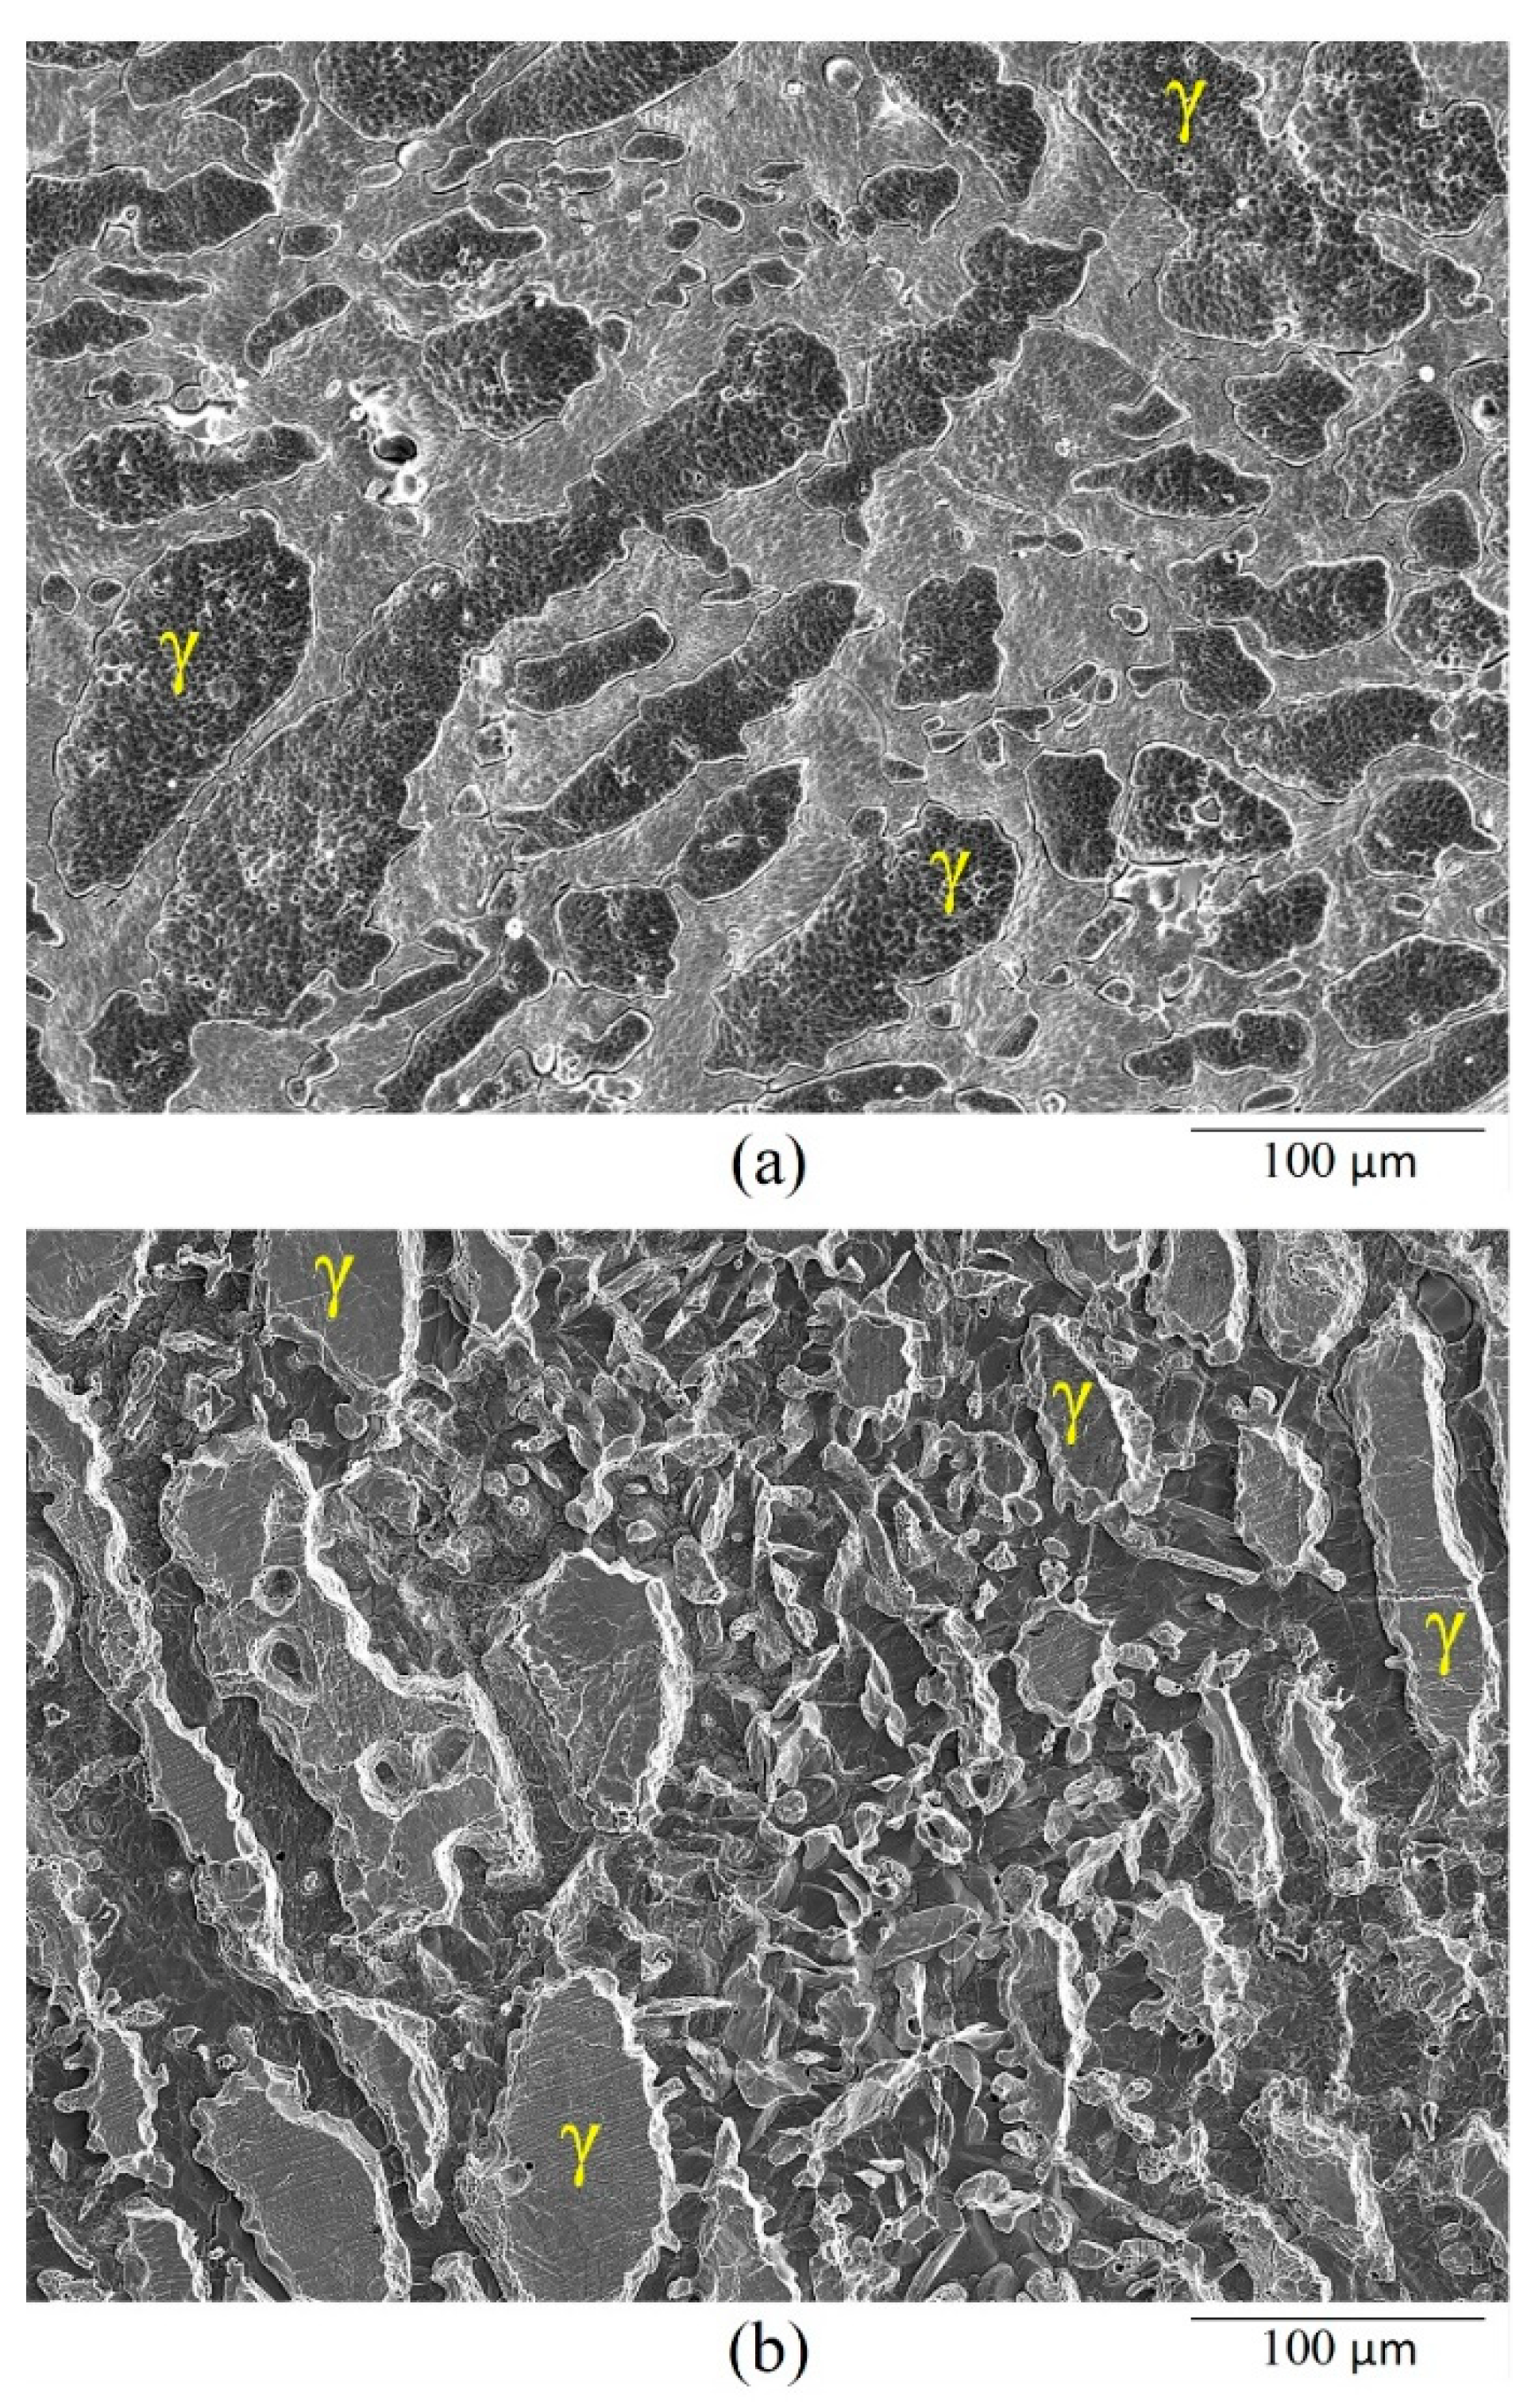
- The dissolution morphology was different between materials in 7 N Cl−. UNS S32750 experienced uniform corrosion of austenite and ferrite phases, whereas α-phase selectively dissolved in UNS S39274.
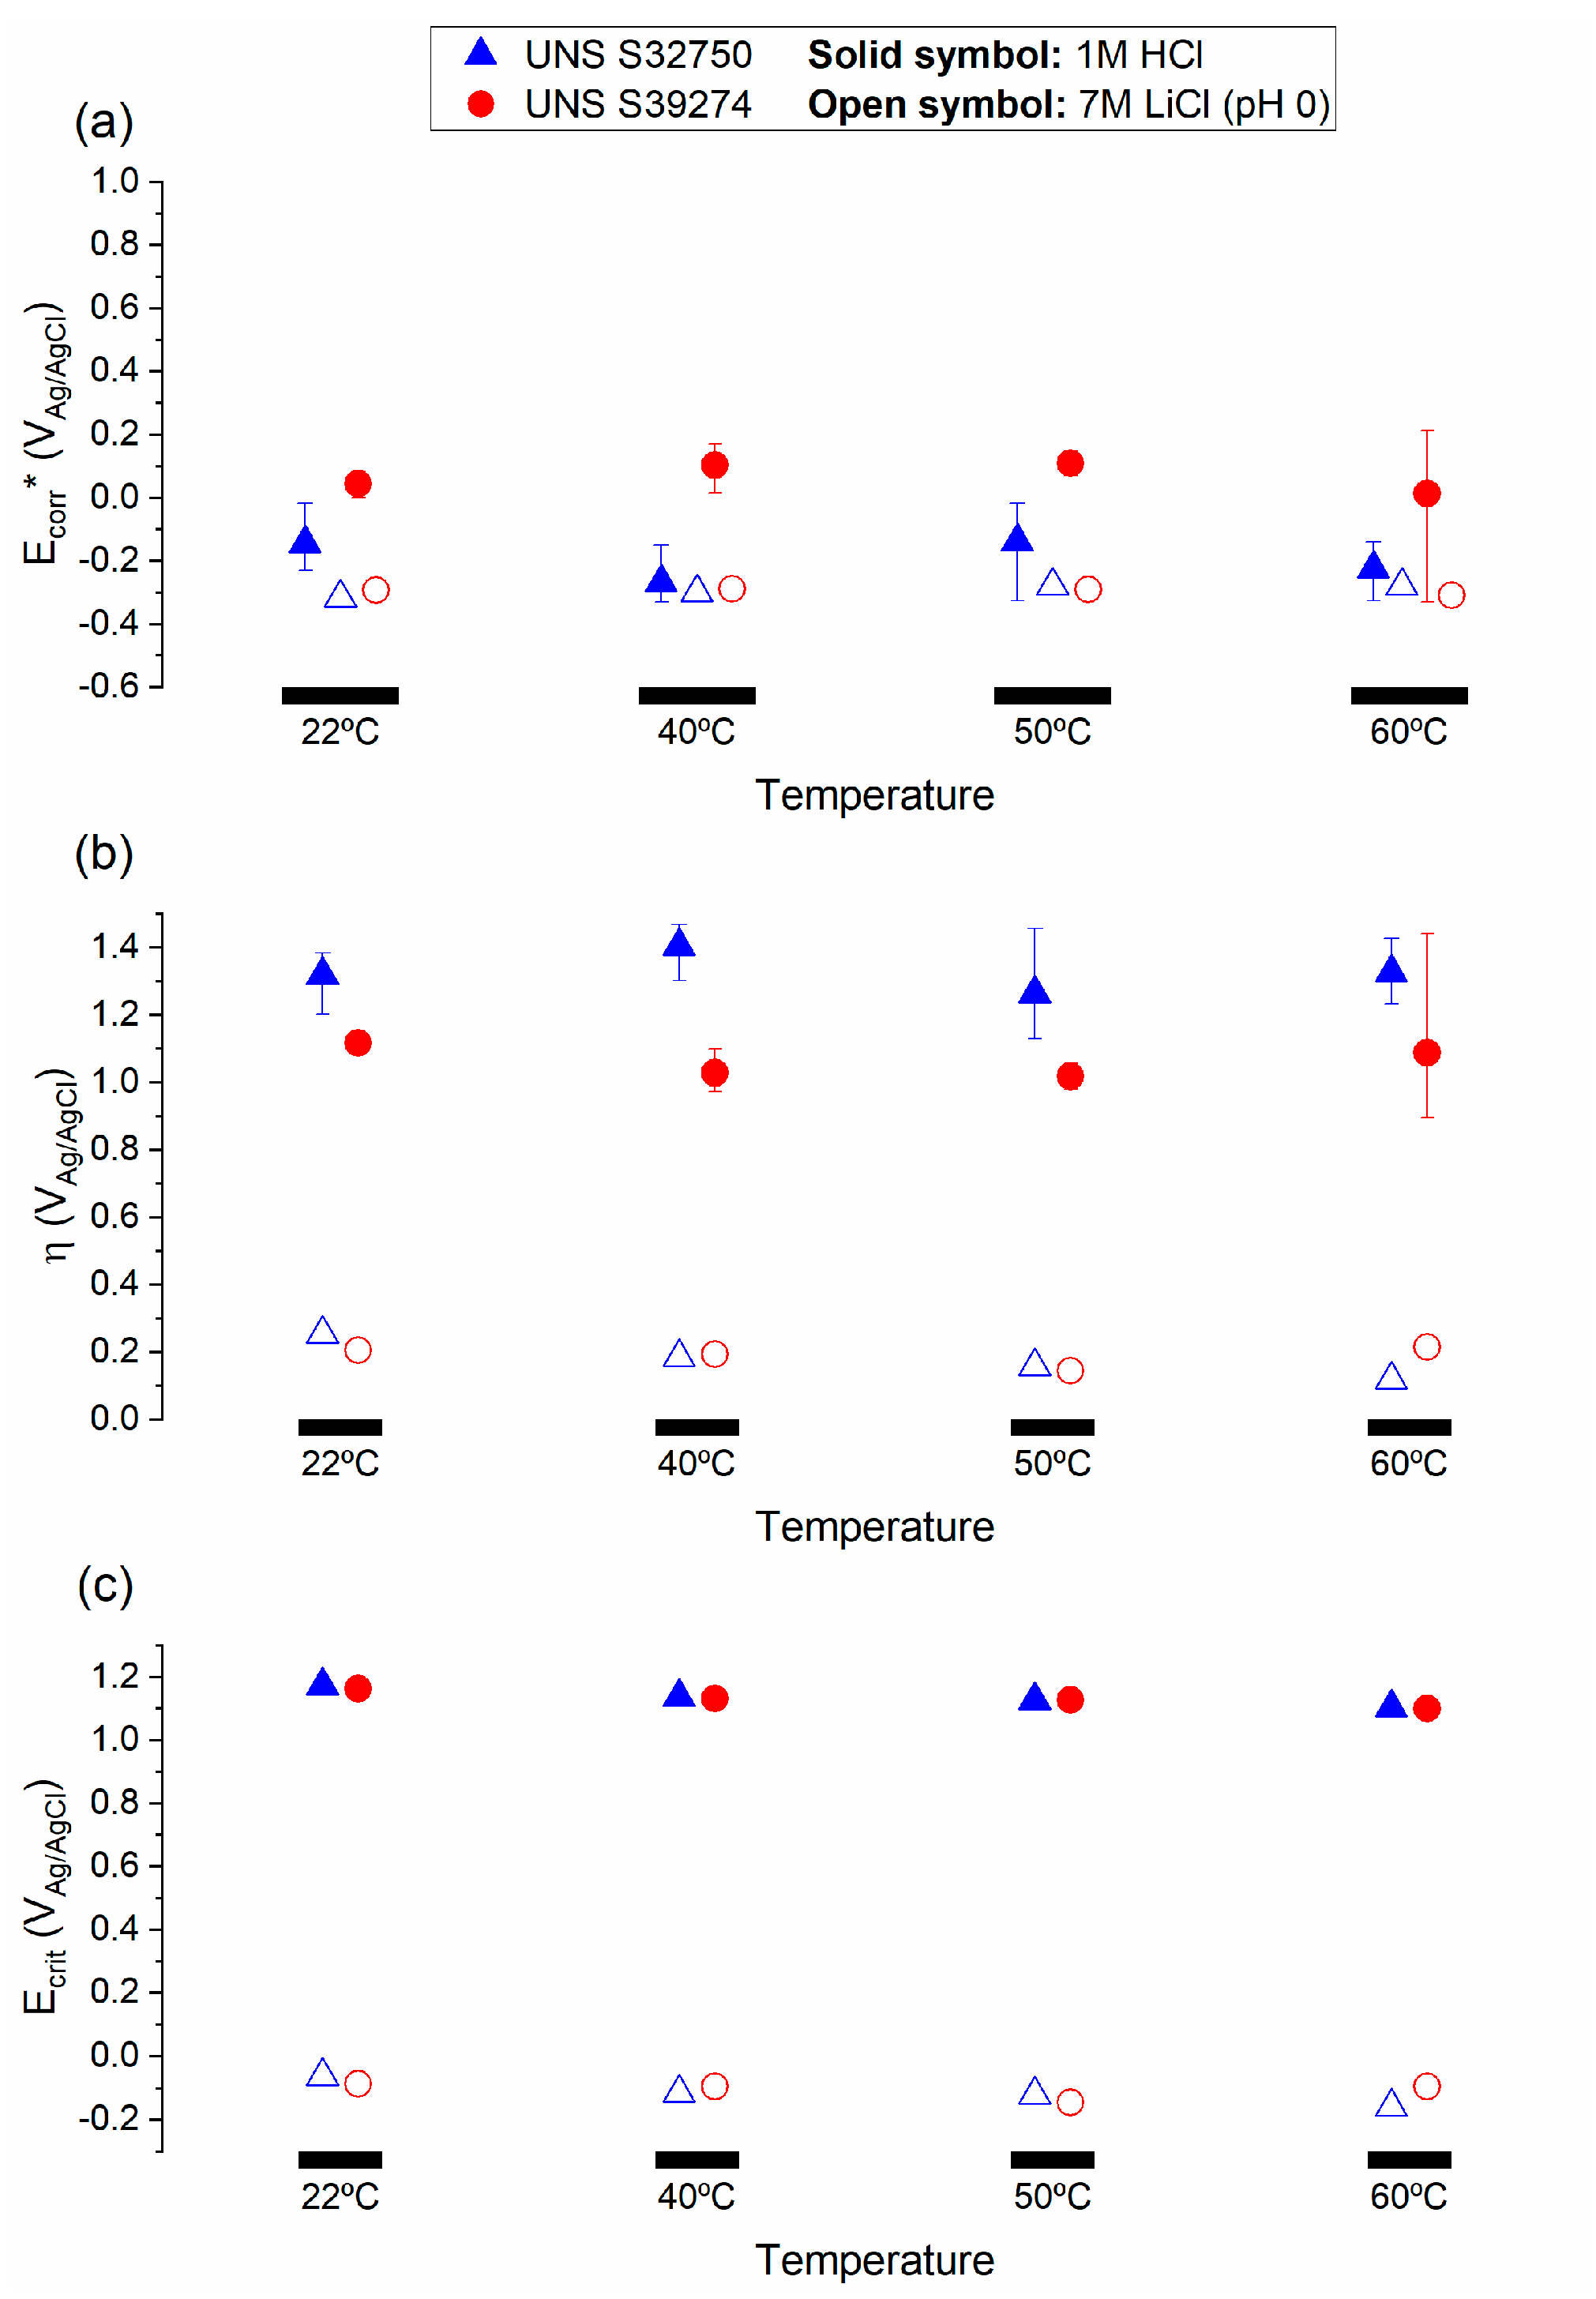
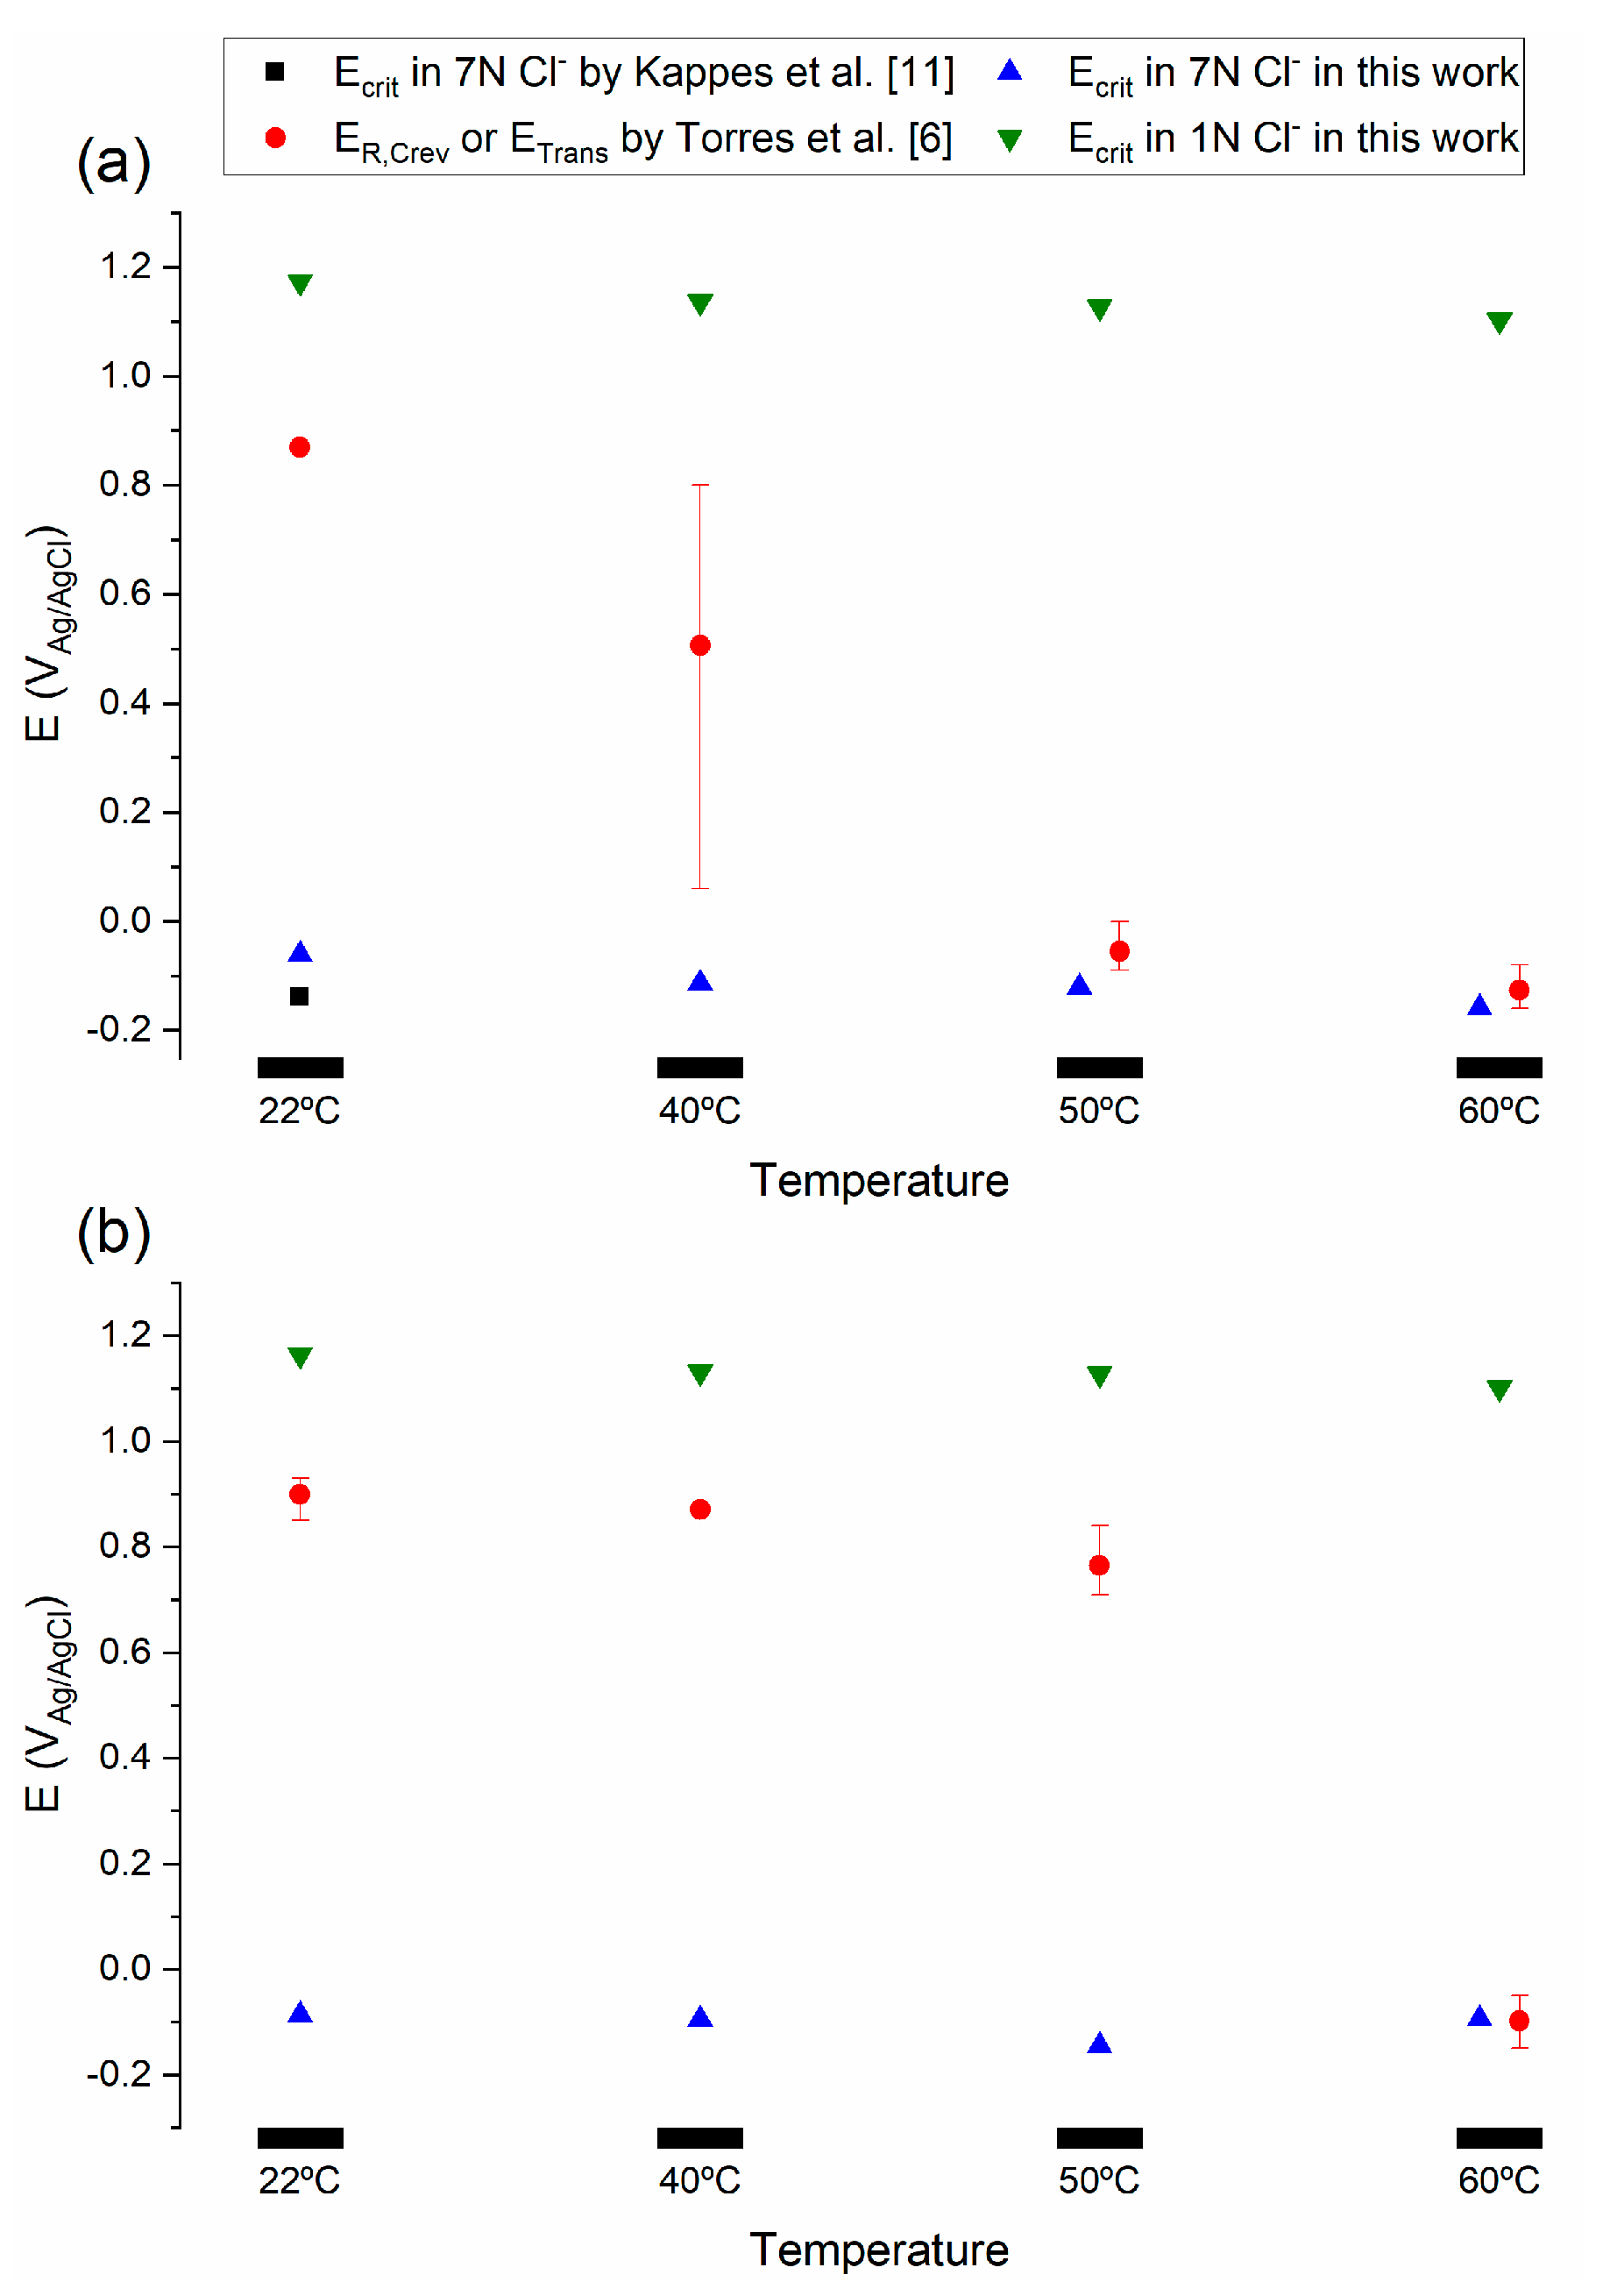
- Ecrit values obtained using the critical acidification model were independent of temperature, which contrasted with previous findings in simulated seawater environments. In line with the new Li-Scully-Frankel framework, the discrepancy was attributed to the stability of the passive film as a rate-determining step below a Tcrit. Conversely, Ecrit values obtained by the critical acidification model were in good agreement with ER,Crev results obtained by the PD-GS-PD technique in 3.5 wt.% NaCl for temperatures above TR,Crev.
Author Contributions
Funding
Acknowledgments
Conflicts of Interest
References
- Sedriks, A.J. Plenary Lecture—1986: Effects of Alloy Composition and Microstructure on the Passivity of Stainless Steels. Corrosion 1986, 42, 376–389. [Google Scholar] [CrossRef]
- Olsson, C.O.A.; Landolt, D. Passive films on stainless steels—Chemistry, structure and growth. Electrochim. Acta 2003, 48, 1093–1104. [Google Scholar] [CrossRef]
- Newman, R.C. 2001 WR Whitney Award Lecture: Understanding the Corrosion of Stainless Steel. Corrosion 2001, 57, 1030–1041. [Google Scholar] [CrossRef]
- Nilsson, J.O. Super duplex stainless steels. Mater. Sci. Technol. 1992, 8, 685–700. [Google Scholar] [CrossRef]
- Torres, C.; Hazarabedian, M.S.; Quadir, Z.; Johnsen, R.; Iannuzzi, M. The Role of Tungsten on the Phase Transformation Kinetics and its Correlation with the Localized Corrosion Resistance of 25Cr Super Duplex Stainless Steels. J. Electrochem. Soc. 2020, 167, 081510. [Google Scholar] [CrossRef]
- Torres, C.; Johnsen, R.; Iannuzzi, M. Crevice Corrosion of Solution Annealed 25Cr Duplex Stainless Steels: Effect of W on Critical Temperatures. Corros. Sci. 2020. submitted for publication. [Google Scholar] [CrossRef]
- Galvele, J.R.; Lumsden, J.B.; Staehle, R.W. Effect of Molybdenum on the Pitting Potential of High Purity 18% Cr Ferritic Stainless Steels. J. Electrochem. Soc. 1978, 125, 1204. [Google Scholar] [CrossRef]
- Newman, R.C.; Ajjawi, M.A.A.; Ezuber, H.; Turgoose, S. An experimental confirmation of the pitting potential model of Galvele. Corros. Sci. 1988, 28, 471–477. [Google Scholar] [CrossRef]
- Suzuki, T.; Yamabe, M.; Kitamura, Y. Composition of Anolyte Within Pit Anode of Austenitic Stainless Steels in Chloride Solution. Corrosion 1973, 29, 18–22. [Google Scholar] [CrossRef]
- Hornus, E.C.; Rodríguez, M.A.; Carranza, R.M.; Rebak, R.B. Comparative Study of the Crevice Corrosion Resistance of UNS S30400 and UNS S31600 Stainless Steels in the Context of Galvele’s Model. Corrosion 2017, 73, 41–52. [Google Scholar] [CrossRef]
- Kappes, M.A.; Ortíz, M.R.; Iannuzzi, M.; Carranza, R.M. Use of the Critical Acidification Model to Estimate Critical Localized Corrosion Potentials of Duplex Stainless Steels. Corrosion 2017, 73, 31–40. [Google Scholar] [CrossRef]
- Hornus, E.C.; Giordano, C.M.; Rodriguez, M.A.; Carranza, R.M.; Rebak, R.B. Effect of Temperature on the Crevice Corrosion of Nickel Alloys Containing Chromium and Molybdenum. J. Electrochem. Soc. 2015, 162, C105–C113. [Google Scholar] [CrossRef]
- Galvele, J.R. Transport Processes and the Mechanism of Pitting of Metals. J. Electrochem. Soc. 1976, 123, 464. [Google Scholar] [CrossRef] [Green Version]
- Bocher, F.; Huang, R.; Scully, J.R. Prediction of Critical Crevice Potentials for Ni-Cr-Mo Alloys in Simulated Crevice Solutions as a Function of Molybdenum Content. Corrosion 2010, 66, 055002-1–055002-15. [Google Scholar] [CrossRef]
- Srinivasan, J.; Kelly, R.G. On a Recent Quantitative Framework Examining the Critical Factors for Localized Corrosion and Its Impact on the Galvele Pit Stability Criterion. Corrosion 2017, 73, 613–633. [Google Scholar] [CrossRef]
- Grimm, R.D.; Landolt, D. Salt films formed during mass transport controlled dissolution of iron-chromium alloys in concentrated chloride media. Corros. Sci. 1994, 36, 1847–1868. [Google Scholar] [CrossRef]
- Li, T.; Scully, J.R.; Frankel, G.S. Localized Corrosion: Passive Film Breakdown vs. Pit Growth Stability: Part III. A Unifying Set of Principal Parameters and Criteria for Pit Stabilization and Salt Film Formation. J. Electrochem. Soc. 2018, 165, C762–C770. [Google Scholar] [CrossRef]
- Li, T.; Scully, J.R.; Frankel, G.S. Localized Corrosion: Passive Film Breakdown vs. Pit Growth Stability: Part IV. The Role of Salt Film in Pit Growth: A Mathematical Framework. J. Electrochem. Soc. 2019, 166, C115–C124. [Google Scholar] [CrossRef]
- Statoil ASA. Technical Note—Metallographic Etching of Duplex Stainless Steels; Statoil ASA: Oslo, Norway, 2010; MAT–2010080. [Google Scholar]
- Robertson, W.D. Molybdate and Tungstate as Corrosion Inhibitors and the Mechanism of Inhibition. J. Electrochem. Soc. 1951, 98, 94–100. [Google Scholar] [CrossRef]
- Alentejano, C.R.; Aoki, I.V. Localized corrosion inhibition of 304 stainless steel in pure water by oxyanions tungstate and molybdate. Electrochim. Acta 2004, 49, 2779–2785. [Google Scholar] [CrossRef]
- Mu, G.; Li, X.; Qu, Q.; Zhou, J. Molybdate and tungstate as corrosion inhibitors for cold rolling steel in hydrochloric acid solution. Corros. Sci. 2006, 48, 445–459. [Google Scholar] [CrossRef]
- Galvele, J.R. Tafel’s law in pitting corrosion and crevice corrosion susceptibility. Corros. Sci. 2005, 47, 3053–3067. [Google Scholar] [CrossRef]
- Galvele, J.R. Transport processes in passivity breakdown—II. Full hydrolysis of the metal ions. Corros. Sci. 1981, 21, 551–579. [Google Scholar] [CrossRef]
- Artemov, V.G.; Volkov, A.A.; Sysoev, N.N.; Volkov, A.A. Conductivity of aqueous HCl, NaOH and NaCl solutions: Is water just a substrate? EPL (Europhys. Lett.) 2015, 109, 26002. [Google Scholar] [CrossRef]
- Qvarfort, R. New electrochemical cell for pitting corrosion testing. Corros. Sci. 1988, 28, 135–140. [Google Scholar] [CrossRef]
- Frankel, G.S. Pitting Corrosion, in Corrosion: Fundamentals, Testing, and Protection; Cramer, S.D., Covino, B.S., Eds.; ASM International: Cleveland, OH, USA, 2003; pp. 236–241. [Google Scholar]
- Henderson, J.D.; Li, X.; Shoesmith, D.W.; Noël, J.J.; Ogle, K. Molybdenum surface enrichment and release during transpassive dissolution of Ni-based alloys. Corros. Sci. 2019, 147, 32–40. [Google Scholar] [CrossRef]
- Salkind, N. Encyclopedia of Measurement and Statistics; SAGE Publications: Thousand Oaks, CA, USA, 2007. [Google Scholar]
- Pearson, K. Mathematical Contributions to the Theory of Evolution. III. Regression, Heredity, and Panmixia. Philos. Trans. R. Soc. Lond. Ser. A 1896, 187, 253–318. [Google Scholar]
- Croux, C.; Dehon, C. Influence functions of the Spearman and Kendall correlation measures. Stat. Methods Appl. 2010, 19, 497–515. [Google Scholar] [CrossRef] [Green Version]
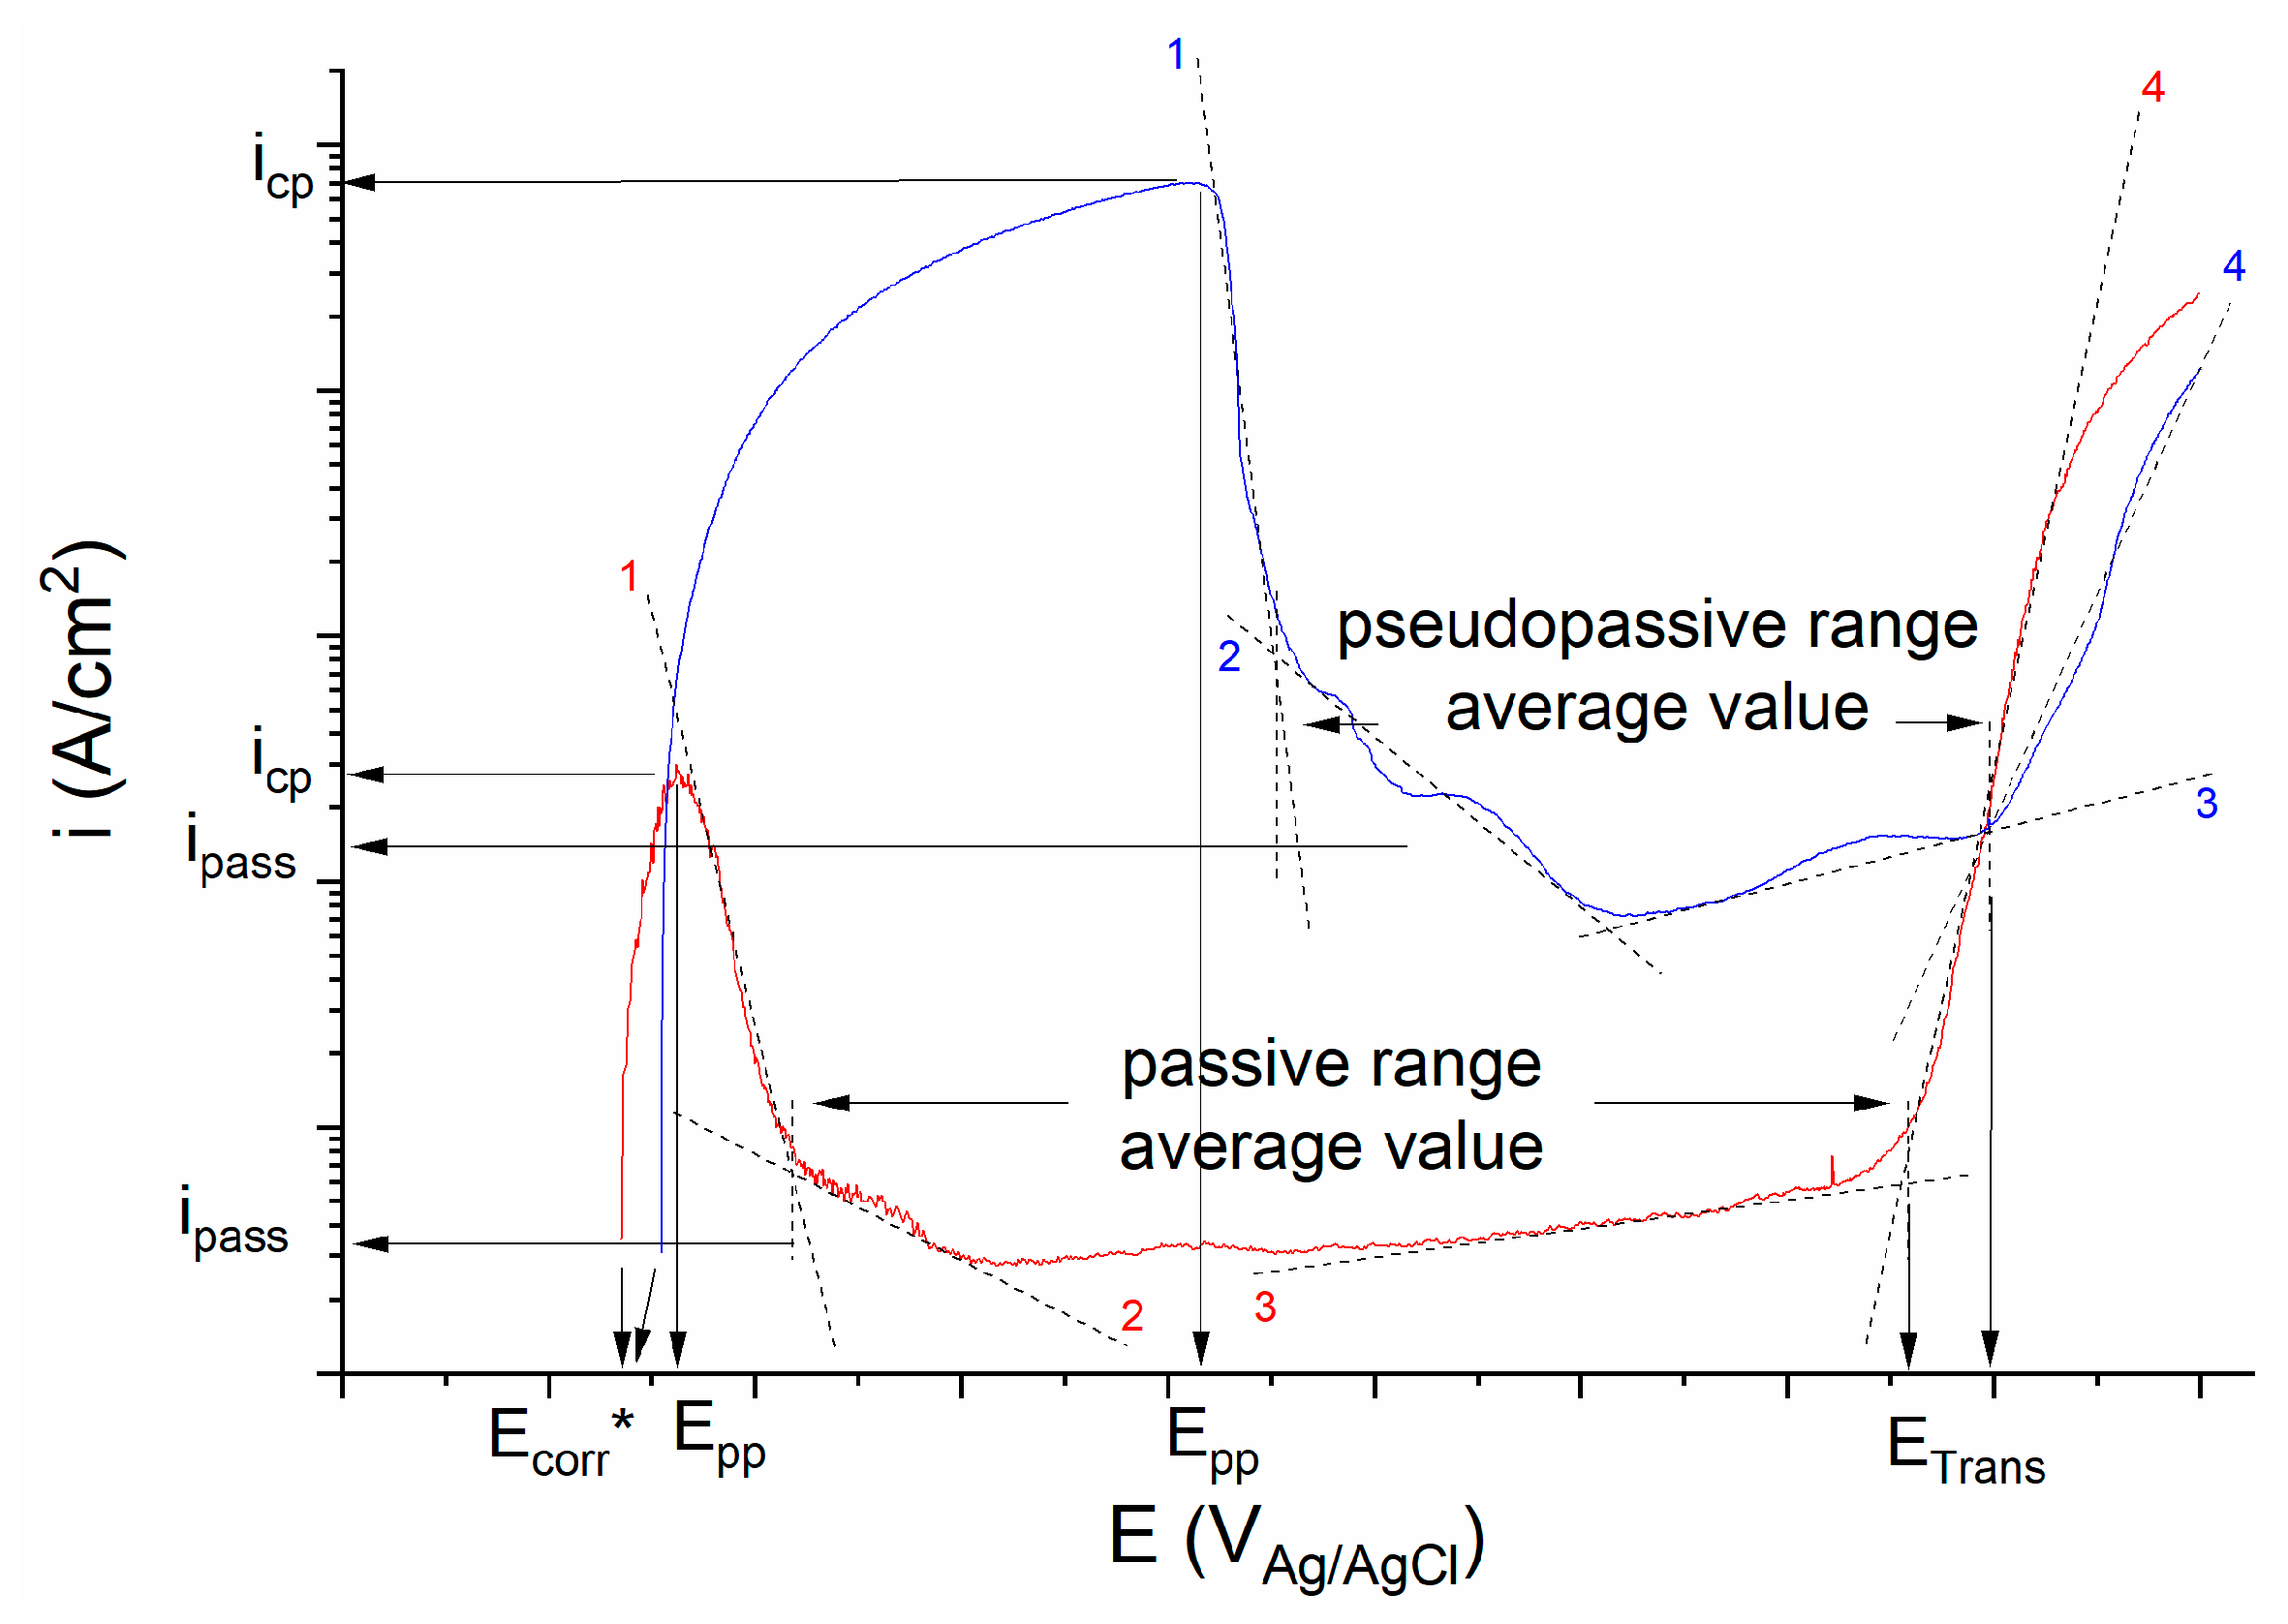
- Bellezze, T.; Giuliani, G.; Roventi, G. Study of stainless steels corrosion in a strong acid mixture. Part 1: Cyclic potentiodynamic polarization curves examined by means of an analytical method. Corros. Sci. 2018, 130, 113–125. [Google Scholar] [CrossRef]
- Pourbaix, M. Atlas of Electrochemical Equilibria in Aqueous Solutions; National Association of Corrosion Engineers (NACE): Houston, TX, USA, 1974. [Google Scholar]
- Knyazeva, M.; Pohl, M. Duplex Steels: Part I: Genesis, Formation, Structure, Metallography, Microstructure, and Analysis. Metall. Microstruct. Anal. 2013, 2, 113–121. [Google Scholar] [CrossRef] [Green Version]
- Frankel, G.S. Pitting Corrosion of Metals. J. Electrochem. Soc. 1998, 145, 2186–2198. [Google Scholar] [CrossRef]
- Mankowski, J.; Szklarska-Smialowska, Z. Studies on accumulation of chloride ions in pits growing during anodic polarization. Corros. Sci. 1975, 15, 493–501. [Google Scholar] [CrossRef]
- Srinivasan, J.; McGrath, M.J.; Kelly, R.G. Mass Transport and Electrochemical Phenomena Influencing the Pitting and Repassivation of Stainless Steels in Neutral Chloride Media. ECS Trans. 2014, 58, 1–11. [Google Scholar] [CrossRef]
- Truman, J.E. Stainless Steels. In Materials Science and Technology; John Wiley & Sons: Hoboken, NJ, USA, 2006; pp. 529–581. [Google Scholar] [CrossRef]
- Bui, N.; Irhzo, A.; Dabosi, F.; Limouzin-Maire, Y. On the mechanism for improved passivation by additions of tungsten to austenitic stainless steels. Corrosion 1983, 39, 491–496. [Google Scholar] [CrossRef]
- Örnek, C.; Leygraf, C.; Pan, J. Passive film characterisation of duplex stainless steel using scanning Kelvin probe force microscopy in combination with electrochemical measurements. NPJ Mater. Degrad. 2019, 3, 1–8. [Google Scholar] [CrossRef] [Green Version]
- Rahimi, E.; Kosari, A.; Hosseinpour, S.; Davoodi, A.; Zandbergen, H.; Mol, J.M.C. Characterization of the passive layer on ferrite and austenite phases of super duplex stainless steel. Appl. Surf. Sci. 2019, 496, 143634. [Google Scholar] [CrossRef]
- Långberg, M.; Örnek, C.; Evertsson, J.; Harlow, G.S.; Linpé, W.; Rullik, L.; Carlà, F.; Felici, R.; Bettini, E.; Kivisäkk, U.; et al. Redefining passivity breakdown of super duplex stainless steel by electrochemical operando synchrotron near surface X-ray analyses. NPJ Mater. Degrad. 2019, 3, 1–11. [Google Scholar] [CrossRef]
- Johnsen, R.; Vingsand, H. Corrosion Properties Of UNS S32750, UNS N06022 And UNS N10276 In Seawater. In Proceedings of the CORROSION 2009, Atlanta, GA, USA, 22–26 March 2009; p. 09195. [Google Scholar]
- Haugan, E.B.; Næss, M.; Torres Rodriguez, C.; Johnsen, R.; Iannuzzi, M. Effect of Tungsten on the Pitting and Crevice Corrosion Resistance of Type 25Cr Super Duplex Stainless Steels. Corrosion 2017, 73, 53–67. [Google Scholar] [CrossRef] [Green Version]
- Martínez, P.A.; Hornus, E.C.; Rodríguez, M.A.; Carranza, R.M.; Rebak, R.B. Crevice Corrosion Resistance of Super-Austenitic and Super-Duplex Stainless Steels in Chloride Solutions. In Proceedings of the Corrosion 2015, Dallas, TX, USA, 15–10 March 2015; p. 5740. [Google Scholar]
- Deng, B.; Jiang, Y.; Gong, J.; Zhong, C.; Gao, J.; Li, J. Critical pitting and repassivation temperatures for duplex stainless steel in chloride solutions. Electrochim. Acta 2008, 53, 5220–5225. [Google Scholar] [CrossRef]
- Jargelius-Pettersson, R.F.A.; Pires Duarte, B.; Duchamp, G. Pitting Corrosion in Austenitic and Duplex Stainless Steels. Mater. Sci. Forum 1998, 289–292, 1029–1040. [Google Scholar] [CrossRef]
- Machuca, L.L.; Bailey, S.I.; Gubner, R. Systematic study of the corrosion properties of selected high-resistance alloys in natural seawater. Corros. Sci. 2012, 64, 8–16. [Google Scholar] [CrossRef]
- Meng, Q.J.; Adeleke, A.; Derrickson, S. Localized Corrosion Resistance Of UNS S32750 And UNS S33207 Duplex Umbilical Tubes In Synthetic Seawater. In Proceedings of the Corrosion 2010, San Antonio, TX, USA, 14–18 March 2010; p. 10344. [Google Scholar]
- Frankel, G.S.; Li, T.; Scully, J.R. Perspective—Localized Corrosion: Passive Film Breakdown vs Pit Growth Stability. J. Electrochem. Soc. 2017, 164, C180–C181. [Google Scholar] [CrossRef]
- Li, T.; Scully, J.R.; Frankel, G.S. Localized Corrosion: Passive Film Breakdown vs Pit Growth Stability: Part II. A Model for Critical Pitting Temperature. J. Electrochem. Soc. 2018, 165, C484–C491. [Google Scholar] [CrossRef]


| Material (UNS) | PREN 1/PREN,W 2 | C 3 | Si | Mn | S 3 | Cu | Ni | Cr | Mo | N | W | Fe |
|---|---|---|---|---|---|---|---|---|---|---|---|---|
| S32750 | 43/43 | 0.03 | 0.27 | 0.5 | 0.02 | 0.14 | 6.42 | 25.6 | 3.83 | 0.3 | - | 62.9 |
| S39274 | 40/43 | 0.02 | 0.24 | 0.7 | 0.02 | 0.52 | 6.3 | 24.9 | 3.1 | 0.29 | 2.1 | 61.8 |
| - | Before Corrosion Testing | After Corrosion Testing | ||||||
|---|---|---|---|---|---|---|---|---|
| Elements | UNS S32750 | UNS S39274 | UNS S32750 | UNS S39274 | ||||
| - | α | γ | α | γ | α | γ | α | γ |
| O | - | - | - | - | 2.4 | 3.7 | 1.7 | 0.9 |
| Cr | 28.1 | 25.2 | 26.4 | 24.1 | 26.2 | 23.1 | 26.5 | 24.6 |
| Fe | 63.9 | 64.9 | 63.5 | 64.7 | 57.6 | 56.3 | 58.6 | 60.9 |
| Ni | 4.6 | 7.5 | 4.7 | 7.3 | 5.3 | 8.0 | 4.4 | 7.0 |
| Mo | 3.6 | 2.3 | 2.9 | 1.9 | 5.8 | 4.0 | 3.6 | 2.4 |
| W | - | - | 2.5 | 1.9 | - | - | 3.2 | 1.8 |
| Material | Solution | T (°C) | d’W | d’Cr | d’Fe | d’Ni | d’Mo |
|---|---|---|---|---|---|---|---|
| UNS S32750 | 1 M HCl | 22 | - | 1.05 | 1.00 | 1.01 | 1.03 |
| 40 | - | 1.01 | 1.00 | 0.98 | 1.03 | ||
| 50 | - | 1.03 | 1.00 | 1.02 | 1.04 | ||
| 60 | - | 0.99 | 1.00 | 0.96 | 1.00 | ||
| 7 M LiCl | 22 | - | 1.08 | 1.00 | 0.97 | 1.09 | |
| 40 | - | 1.02 | 1.00 | 0.97 | 1.06 | ||
| 50 | - | 1.07 | 1.00 | 0.95 | 1.08 | ||
| 60 | - | 1.05 | 1.00 | 0.96 | 1.06 | ||
| UNS S39274 | 1 M HCl | 22 | 0.90 | 1.04 | 1.00 | 0.99 | 1.05 |
| 40 | 1.01 | 1.03 | 1.00 | 1.01 | 1.02 | ||
| 50 | 0.96 | 1.01 | 1.00 | 0.96 | 1.02 | ||
| 60 | 0.93 | 0.98 | 1.00 | 0.93 | 0.98 | ||
| 7 M LiCl | 22 | 0.25 | 1.07 | 1.00 | 1.06 | 1.10 | |
| 40 | - | - | - | - | - | ||
| 50 | 0.57 | 1.06 | 1.00 | 0.96 | 1.08 | ||
| 60 | 0.66 | 1.04 | 1.00 | 0.96 | 1.06 |
| - | Cr | Fe | Ni | Mo | T | icp | ETrans | ipass | Epp | Ecorr* | Ecrit | η |
|---|---|---|---|---|---|---|---|---|---|---|---|---|
| W | 0.93 | 0.93 | 0.93 | 1 | 0.91 | - | −0.65 | 0.00 | - | 0.07 | −0.71 | −0.21 |
| Cr | 1 | 0.99 | 0.91 | 0.80 | 1 | −0.32 | 0.02 | 0.18 | −0.09 | −0.84 | −0.02 | |
| Fe | 0.99 | 0.91 | 0.80 | 1 | −0.32 | 0.02 | 0.18 | −0.09 | −0.84 | −0.02 | ||
| Ni | 0.93 | 0.78 | 1 | −0.31 | 0.03 | 0.18 | −0.10 | −0.82 | 0.00 | |||
| Mo | 0.78 | 1 | −0.24 | 0.10 | 0.18 | −0.15 | −0.75 | 0.04 | ||||
| T | 0.82 | −0.40 | −0.05 | 0.67 | 0.00 | −0.73 | −0.10 | |||||
| icp | −0.55 | −0.33 | 0.18 | −0.33 | −1 | −1 | ||||||
| ETrans | 0.56 | −0.80 | −0.42 | 0.35 | 0.50 | |||||||
| ipass | −0.91 | −0.34 | −0.09 | 0.35 | ||||||||
| Epp | −0.18 | −0.18 | −0.18 | |||||||||
| Ecorr* | 0.04 | −0.90 | ||||||||||
| Ecrit | 0.06 |
| - | Cr | Fe | Ni | Mo | T | icp | ETrans | ipass | Epp | Ecorr* | Ecrit | η |
|---|---|---|---|---|---|---|---|---|---|---|---|---|
| W | 0.52 | 0.52 | 0.52 | 0.52 | 0.11 | 0.52 | −0.59 | −0.62 | 0.20 | 0.14 | −0.33 | −0.33 |
| Cr | 1 | 0.98 | 0.93 | 0.16 | 0.91 | 0.06 | −0.32 | 0.75 | 0.30 | −0.58 | −0.63 | |
| Fe | 0.98 | 0.93 | 0.16 | 0.91 | 0.06 | −0.32 | 0.75 | 0.30 | −0.58 | −0.63 | ||
| Ni | 0.91 | 0.14 | 0.93 | 0.03 | −0.34 | 0.77 | 0.28 | −0.56 | −0.60 | |||
| Mo | 0.11 | 0.85 | 0.12 | −0.30 | 0.77 | 0.32 | −0.52 | −0.56 | ||||
| T | 0.22 | −0.17 | 0.14 | −0.03 | 0.29 | −0.34 | −0.47 | |||||
| icp | −0.03 | −0.32 | 0.75 | 0.30 | −0.58 | −0.63 | ||||||
| ETrans | 0.43 | 0.12 | 0.03 | −0.03 | −0.03 | |||||||
| ipass | −0.24 | −0.10 | 0.08 | 0.12 | ||||||||
| Epp | 0.18 | −0.33 | −0.38 | |||||||||
| Ecorr* | −0.36 | −0.54 | ||||||||||
| Ecrit | 0.82 |
© 2020 by the authors. Licensee MDPI, Basel, Switzerland. This article is an open access article distributed under the terms and conditions of the Creative Commons Attribution (CC BY) license (http://creativecommons.org/licenses/by/4.0/).
Share and Cite
Torres, C.; Iannuzzi, M.; Johnsen, R. Use of the Critical Acidification Model to Estimate the Influence of W in the Localized Corrosion Resistance of 25Cr Super Duplex Stainless Steels. Metals 2020, 10, 1364. https://doi.org/10.3390/met10101364
Torres C, Iannuzzi M, Johnsen R. Use of the Critical Acidification Model to Estimate the Influence of W in the Localized Corrosion Resistance of 25Cr Super Duplex Stainless Steels. Metals. 2020; 10(10):1364. https://doi.org/10.3390/met10101364
Chicago/Turabian StyleTorres, Cristian, Mariano Iannuzzi, and Roy Johnsen. 2020. "Use of the Critical Acidification Model to Estimate the Influence of W in the Localized Corrosion Resistance of 25Cr Super Duplex Stainless Steels" Metals 10, no. 10: 1364. https://doi.org/10.3390/met10101364