Article

In Situ Determination of Phase Stress States in an Unstable Medium Manganese Duplex Steel Studied by High-Energy X-ray Diffraction

by
Mathias Lamari
1,*,
Sébastien Y. P. Allain
1,
Guillaume Geandier
1,
Jean-Christophe Hell
2,
Astrid Perlade
2 and
Kangying Zhu
2
1
Institut Jean Lamour, UMR CNRS UL 7198, Campus Artem, 2 allée André Guinier, 54000 Nancy, France
2
ArcelorMittal Maizières Research SA, Products Research Center, Voie Romaine, 57280 Maizières-lès-Metz, France
*
Author to whom correspondence should be addressed.
Metals 2020, 10(10), 1335; https://doi.org/10.3390/met10101335
Submission received: 10 September 2020 / Revised: 1 October 2020 / Accepted: 3 October 2020 / Published: 6 October 2020
(This article belongs to the Special Issue Advanced Multiphase Steels)

Abstract

:
Duplex medium Mn steels are high-potential advanced high-strength steels (AHSS) for automotive construction. Their excellent forming properties stem from the specific stress partitioning between their constituting phases during deformation, namely the ferritic matrix, unstable retained austenite, and strain-induced fresh martensite. The stability of the retained austenite and the 3D stress tensors of each phase are determined simultaneously in this work by in situ high energy X-ray diffraction on synchrotron beamline during a tensile test. The role of internal stresses inherited from the manufacturing stage are highlighted for the first time as well as new insights to understand the origin of the serrations shown by these alloys.

1. Introduction

Third-generation advanced high-strength steels (AHSS) are a family of new steels which present a very high balance between strength and ductility. They are in consequence the subject of intense studies by major steelmakers. Different metallurgical concepts belong to third-generation AHSS, such as medium Mn steels [1,2,3], carbide-free bainitic steels [4,5,6], or Q&P (quenching and partitioning) steels [7,8,9]. Nevertheless, they present common characteristics such as a refined, and sometimes nanostructured, ferritic matrix that gives the alloy its strength and toughness, and contain a high amount of retained austenite. This latter austenite is often unstable and can transform in fresh martensite during straining [10,11,12,13]. This strain-induced transformation can conduct to an efficient TRIP effect (transformation-induced plasticity) which gives the alloy its formability by increasing its uniform elongation [14,15,16,17]. In fact, the continuous transformation of austenite into martensite with a far higher yield strength leads to an increase in the macroscopic work-hardening of the alloy and delays the apparition of necking [18,19]. In the case of carbide-free bainitic steels, the ferritic matrix is essentially bainitic whereas it is martensitic (tempered or recovered) in the case of Q&P and medium Mn ART (austenite reverse transformation) concepts [4,7,9,20].
Each constituting phase of these multiphase steels shows a specific yield strength and work-hardening behavior which depends on specific and distinctive metallurgical features. The mechanical properties of the ferritic phase (here the matrix made of bainite or recovered martensite) depend mainly on the possible presence of carbides, the dislocation density, and the respective size of the prior austenite grain/packet/block/lath structures [21,22]. Among them, the most flexible microstructure features permitting properties optimization remains the dislocation density and the prior austenite grain size. On the other hand, the properties of austenite and fresh martensite grains depend mainly on their composition (carbon and manganese contents in particular), their dislocation density, their internal stresses, and possibly their sizes. In the case of stable austenite/ferrite duplex [23] and unstable austenite/ferrite duplex [24,25] medium Mn steels, it was shown that austenite often presents a higher flow stress than the matrix (generally considering an equivalent von Mises stress). During straining, complex mechanical interplays occur between the ferritic matrix, retained austenite, and fresh martensite [26,27,28].
In medium Mn ART steels, the evolution of the 3D stress state (full Cauchy stress tensor) in each phase including hydrostatic components has not been determined so far. These components are the key to understanding the load transfer between phases, and require the stress state inherited from the manufacturing conditions (intercritical annealing). Moreover, some medium Mn steels present an additional complexity as they can show mechanical instabilities during simple tensile trials. Such serrations are often related to a possible dynamic strain ageing phenomenon [29,30]. The mechanism behind the appearance of such instabilities, and more generally the links they may have with the mechanically induced martensitic transformation, is still unclear. To better understand those phenomena, it is necessary to obtain the deformation behavior and stress partitioning of each constituting phase, which is difficult by using post-mortem observations.
The recent works of Zhang et al. in 2019 [24] has shown that in situ high-energy x-ray diffraction (HEXRD) synchrotron experiments enable obtaining the kinetics of strain-induced transformations during tensile tests and the von Mises stress of each phase during a mechanical loading. In the studied microstructures, austenite is shown to be always harder than the ferritic matrix, but surprisingly, martensite can appear to be the less loaded component of the structure. This last result is really surprising accounting for the obvious TRIP effect undergone by the studied steels. It could be related to the fact that the authors have not succeeded to establish the full stress tensors for each phases. In the present study, we have addressed these issues and we have obtained new results concerning the interactions between the strain-induced transformation and the macroscopic mechanical instabilities (serrations observed on the tensile curves).
In this study, we have employed basically the same methodology as Zhang et al. [24]. The internal stresses of the ferritic matrix and austenite have been determined with the well-known sin²ψ method and the internal stress of fresh martensite has been calculated by a micromechanical model. However, as it will be explained in the next section, we have employed a set-up permitting an analysis of full Debye Scherrer rings (not only in the transverse direction (TD) and tensile direction (RD)), thus to reach a higher resolution on the stress components. This has been useful to reveal which phase seems affected by the dynamic strain ageing (DSA). We have also carried out prior calculations permitting the assessment of the hydrostatic stresses in phases before the beginning of the tensile trials and thus to determine the full stress tensors from in situ experiment.

2. Materials and Methods

2.1. Studied Steel and Processing Conditions

In this paper, the chemical composition of the studied fibrous medium Mn steel is 0.2 wt.% C, 3.94 wt.% Mn, 1.46 wt.% Si, and 0.78 wt.% Al. The thickness of the sample is 1.5 mm. Its microstructure is composed of ultra-fine fibrous recovered martensite and austenite. They both have a lath-like morphology. HEXRD experiments coupled with the Rietveld analysis described below shows that the volume fraction of retained austenite is 22% (±1)%. A scanning electron microscopy (SEM) micrograph after Nital etching is shown in Figure 1a. This microstructure is obtained through the intercritical annealing of a fully martensitic steel between the Ac1 and Ac3 temperatures, at 715 °C during 5 min, followed by a quenching. This intermediate fully martensitic microstructure is obtained after the austenitization at 900 °C during 5 min and the quenching of cold rolled strips. Such a thermal cycle corresponds to a conventional ART schedule [1,31]. The heating rate is 10 °C/s. At the end of the thermal treatment, a large volume fraction of austenite (about 22%) is retained. The stabilization of austenite at room temperature permitted by the diminution in its Ms temperature, is mainly due to chemical partitioning of carbon and manganese in austenite [32], the small size of microstructure features (typically below 1 µm) [33], and the possible effect of internal stresses [7].
In fact, the difference in the coefficient of thermal expansion of recovered martensite (basically behaving as ferrite) and austenite is sufficient to induce high internal stresses in phases during the final cooling stage [7]. In a prior study on Q&P steels by in situ HEXRD, authors have shown that if the fraction of austenite is low, austenite will be put in a high tensile hydrostatic stress state. The micromechanical Mori-Tanaka model proposed in [7] provides an estimate of these stresses in austenite when considering the intercritical annealing as a starting point for the calculations. In the present case, the calculated value is 715 MPa for a fraction of austenite of 22% (considering a bulk modulus of 487.5 GPa, according to Ghosh and Olson [34]). The values provided by this model must be considered as an upper bound as no relaxation mechanisms are taken into account in this purely elastic approach. The internal stresses in the recovered martensitic matrix are more difficult to calculate with the proceeding model. However, as the equilibrium must be fulfilled in mean, a mechanical balance shows that the compressive hydrostatic pressure in recovered martensite is about 200 MPa. Neglecting these internal stresses in the undeformed state is the principal oversight made by Zhang et al. [24].
From ortho-equilibrium thermodynamic calculations at 715 °C, the steel is expected to contain solely ferrite and austenite. Calculations were made with CEQCSI software (Chemical EQuilibrium Calculation for Steel Industry), which is an ArcelorMittal in-house-built thermodynamic equilibrium calculation software (no commercial version available). According to these calculations, the fraction of retained austenite is supposed to be 47% and the local composition of manganese and of carbon is 6.2 wt.% and 0.39 wt.%, respectively. Obviously, such equilibrium is not reached in the studied steel, which presents solely a fraction of austenite of 22%. The chemical compositions of the phases have not been determined by direct measurements. However, it is unlikely that the substitutional elements could reach the expected equilibrium in such conditions. Moreover, the steel contains a significant fraction of undissolved cementite at the end of the annealing cycle, meaning that a significant fraction of carbon trapped in carbides is not available to stabilize austenite. The Figure 1b shows the 1D HEXRD diffractogram (method explained in the next section) of the steel before deformation highlighting of the minor diffraction peaks of cementite between large peaks of ferrite and austenite. The average carbon content of austenite is thus expected to be lower than the one expected from a full partition of carbon (0.83%). Our HEXRD experiments show that the lattice parameter of austenite at room temperature before deformation is 3.602 Å. This value takes into account not only the chemical composition of austenite as described by the Toji et al. equation (compositions given in wt.%) [35]:
a γ ( Å ) = 3.572 + 0.033 [ C ] + 0.0012 [ Mn ] 0.00157 [ Si ] + 0.0056 [ Al ]
but also the effect of the hydrostatic stresses described above (715 MPa). The stress-free lattice parameter of enriched austenite is estimated at 3.597 Å. If we consider the absence of partition of substitutional elements (Mn, Si, and Al) between martensite and austenite, the carbon content in austenite from Equation (1) is about 0.55 wt.%. This value is very consistent with the carbon content of fresh martensite appearing during the deformation (0.45 wt.%, as explained in the next section).
Hence, the initial microstructure of the studied steel shows a phase chemistry which does not correspond to an ortho-equilibrium and presents high tensile internal stresses resulting from the manufacturing stage. Accounting for both chemical and mechanical contributions (Patel and Cohen [11]), the estimated Ms is 170 °C – 26 °C = 144 °C for the austenite with the composition given by the thermodynamical calculation at equilibrium. Despite the possible stabilization by a size effect in austenite, it cannot be excluded that the steel contains already fresh martensite inherited from the thermal treatment (final cooling). The fraction must, however, be low as explained in the next section.

2.2. In Situ HEXRD Experiments

The high-energy X-Ray diffraction (HEXRD) experiments were performed at the Deutsches Electronen-Synchrotron (DESY, Hamburg, Germany), on the PETRA III P07 beamline. The monochromatic beam was set at high energy (87.1 keV) and had a section of 500 × 500 µm2. The diffraction patterns (Debye-Scherrer rings) were recorded on a high-performance PerkinElmer 2-D plate detector (PerkinElmer Inc., Waltham, MA, United States of America) placed at 1.2 m behind the sample (permitting to record about 6 full Debye-Scherrer rings per phase). The high acquisition rate (10 Hz) of the detector enables time-resolved investigation of the microstructures during experiments. Similar configurations on DESY beamline are described in [36,37]. With such in-transmission geometry, the analyzed volume is thus 500 × 500 × 1500 µm3 and contains around 100 million of grains/islands. This large statistic allows recording perfectly continuous rings and to gain accuracy in the post-treatments.
To investigate the retained austenite mechanical stability during loading, tensile test was conducted in situ on the beamline. The tensile specimen was machined from cold-rolled and annealed thin plates of the studied steel. Tensile sample had a dog-bone shape with large heads. The dimensions of the lamellar sample were 15 × 4 × 1.5 mm3. The sample coordinates were noted RD (in plane tensile direction corresponding the rolling direction of the sample), TD (in plane transverse direction), and ND (out of plane normal direction). The beam was aligned in the ND direction (thus perpendicular to the plate).
The crosshead speed was imposed at 0.01 mm/s. Macroscopic stress Σ and applied crosshead displacement were acquired all along the tensile test at the same time as the diffraction patterns. The deformation of the gauge length was determined using the crosshead displacement (no available extensometer). All curves presented in the following are interrupted when macroscopic necking occurs as the position of the beam cannot be set a priori at the necking position.
A second trial has been carried out at ArcelorMittal Maizières (Maizières-lès-Metz, France) according to the standards on a normalized sample of the material. This second trial has only served to determine the uniform elongation of the material (24%) in order to be able to calculate the true behavior during the in situ trial (assuming a linear correlation between the crosshead displacement and the elongation during yielding).

2.3. Rietveld Analysis

Due to the polycrystalline nature of samples, recorded 2D diffraction patterns consist of Debye-Scherrer rings. Each ring corresponds to a particular crystallographic plane family of a phase in the sample. Circular integrations of each 2D diffraction pattern have been conducted with pyFAI library [38], to produce 1D diffractograms. These integrated patterns will serve to determine in situ martensitic transformation kinetics during deformation. The evolution of the circularity of the rings due to the applied tensile stress does not affect the measured kinetics by this mean. In fact, if the integration and the refinement are made simultaneously on the different angular sectors of the Debye-Scherrer rings, i.e., considering independently all the texture components, the mean kinetics corresponds closely to the kinetics determined by a complete circular integration (results not shown here).
The Rietveld method consists of modelling a theoretical line profile based on radio-crystallographic parameters until it matches the measured experimental profile. The convergence procedure follows a least-squares method. Pseudo-Voigt functions were chosen to approximate the characteristic diffraction peaks of each phase.
During the refinement procedure, two body-centered cubic (BCC) phases and one face-centered cubic (FCC) phase were considered respectively for the ferritic matrix, strain-induced martensite, and the austenite. Diffractograms were refined with Fullprof software in a 2θ range from 2.5° to 10°, with θ the Bragg angle, including the {110}α, {200}α, {211}α, {220}α, {310}α, and {222}α peaks for BCC phases (space group I m3m) and the {111}γ, {200}γ, {220}γ, {311}γ, {222}γ, {400}γ, and {331}γ peaks for FCC phase (space group F m-3m). Six thousand pictures have been indexed for a single tensile trial.
Indeed, the matrix of the studied fibrous microstructure is martensite. However, as it is annealed at high temperature (715 °C), the structure is highly recovered. It presents thus a very low tetragonality and can be considered as a ferritic BCC phase. Throughout the remainder of the paper, recovered martensite will be referred as ferrite. When fresh martensite appears, it shows on the contrary a higher carbon content and a high tetragonality. Figure 2a,b show the 1D diffraction patterns corresponding to the angle ranges of the {211}α diffraction peak of ferrite (BCC) before deformation and just before necking. In Figure 2a, a single well-defined and symmetric peak is observed, which can be interpreted by a single BCC structure. The profile obtained by the Rietveld refinement is represented for the sake of comparison. Before any deformation, the fraction of FCC austenite is 22 wt.% and the fraction of BCC ferrite is 78 wt.%. The uncertainty is estimated to be around ±1%. On the contrary, in Figure 2b, the single diffraction peak of ferrite shown in Figure 2a shows an obvious shoulder at low angles. This shoulder can be interpreted by the presence of fresh martensite with a body-centered tetragonal (BCT) structure but also with a far higher lattice parameter. A BCC structure was chosen to represent fresh martensite, as it is not possible to determine, convincingly, the tetragonality of the lattice in such conditions, i.e., when the peak is partially masked. Figure 2b shows the Rietveld refinement obtained with the two BCC structures to elucidate the nature of the shoulder. Even if the deconvolution looks excellent, the respective fractions between ferrite and strain-induced martensite cannot be determined with a high level of confidence. In fact, the measured fractions of both phases appear to increase with strain when applying the methodology described above. The fraction of recovered matrix is supposed to remain constant and cannot evolve. Indeed, a certain fraction of strain-induced martensite contributes to the integral breadth of ferrite peaks. This is the reason why only the fraction of retained austenite will be considered as correct in the following. The fraction of strain-induced martensite fα’ will be calculated as the fraction of transformed austenite fγ (i.e., fα’ = fγ,0 − fγ with fγ,0 = 22%).
Applied on the whole profile, the Rietveld refinement gives 89 wt.% of ferrite, 8 wt.% of fresh martensite, and 3 wt.% of austenite at necking. If only one BCC phase is considered in the refinement procedure (considering that the fraction of fresh strain-induced martensite contributes solely to the integral breadth of the BCC peak of ferrite), the fractions found at the end of the trial are 5 wt.% of FCC austenite and 95 wt.% of BCC phase. The differences between the methods (3 or 2 phases) remain at the limit of the accuracy of the technique. This choice to neglect the presence of the strain-induced martensite peak was made by Zhang et al. [24], who also consider the relative height of the BCC and FCC peaks to evaluate transformation kinetics, thus neglecting the presence of strain-induced martensite in the diffractogram.
At the end of the trial, the differences in lattice parameters between the two BCC structures (fresh strain-induced martensite and ferritic matrix) is 2.8973 − 2.8669 = 0.0304 Å. The higher lattice parameter of the BCC phase corresponding to fresh martensite can be related to a hydrostatic stress state but also to a different chemical composition. As explained at the end of the present paper, strain-induced fresh martensite undergoes at the end of the trial a tensile hydrostatic stress of +55 MPa and ferrite a tensile hydrostatic stress of +470 MPa. Considering a bulk modulus for these phases of 469.3 GPa (according to Ghosh and Olson [34]), the estimated difference in stress-free lattice parameters is 0.0367 Å. If we assume the same composition in substitutional elements in both ferrite (matrix) and strain-induced fresh martensite (former austenite), the law proposed by Garcia-Mateo et al. [39] permits to calculate the difference in carbon content between the two phases. In the present case, fresh martensite shows a carbon content of 0.45 wt.%C (0.36 wt.%C if we do not take into account internal stresses) assuming no carbon in ferrite. This value is consistent with the measurements made in austenite before straining considering that the first austenite islands to transform statistically shows the lower carbon content.

2.4. Sin²ψ Analysis

The in situ evolution of 3D stress tensor of the phases has been determined with the sin²ψ method [40]. Only the strain in ferrite (BCC) and austenite (FCC) were directly determined. In fact, as the peaks of strain-induced martensite were found in the shoulders of the ferritic matrix peak, it was not possible to determine the strain in this phase with a good accuracy (Figure 2).
The normal vector of a plane is defined according to two angles ψ and φ, ψ being the angle between RD and the normal vector, φ being the angle between TD and the projection of the normal vector in the TD and ND planes. To construct a sin²ψ curve, partial integration of 2D diffraction pattern is done with pyFAI software. The area of integration is composed of a sector centered on an azimuthal angle χ with a small aperture (4° in this study) and another sector centered on χ + 180° (the diametrically opposed sector). Then, the Bragg angle θ for a specific peak is measured. For ferrite (BCC phase), peak {211}α was chosen to measure θ. For austenite (FCC phase), it was peak {311}γ. The plane families associated with those peaks are less anisotropic in their elastic behavior, which is necessary for the sin²ψ method to be representative of the bulk behavior of the sample [41]. This procedure gives a couple of angles (2θ, χ). In the case of HEXRD experiments, with a transmission geometry and no tilt between the sample and the incoming X-ray beam, the value of sin²ψ and the true strain εφψ are linked with the angles θ and χ by the following formulae [42,43,44]:
{ sin 2 ψ = 1 cos 2 θ ( 1 sin 2 χ ) ε ϕ ψ = l n ( sin θ 0 sin θ )
where θ0 is the Bragg angle of the considered peak assuming the phase is stress-free, and ln is the natural logarithm. Doing so for an angle χ gives one point of the ellipse. The sin²ψ ellipse linked with a phase of a given diffraction pattern is obtained by varying the azimuthal angle χ from 0° to 180°. A linear regression is then conducted on this curve to obtain its intercept and its slope, as the opening of the curve is negligible (as shown in Figure 3b,c). In this study, as we conducted in transmission HEXRD experiments, it was supposed that elastic strains in the transverse and normal directions of the sample are equal during tensile test (i.e., εTD = εND). Under these conditions, the relationship between the strains in tensile and transverse directions and the intercept and the slope of the sin²ψ curve are [44]:
{ ε R D = i n t e r c e p t ε T D = i n t e r c e p t + s l o p e
Repeating the whole procedure for all diffraction patterns, it is thus possible to determine the evolution of stress state of each phase all along the tensile test. Indeed, after determining strains all along the experiments, stresses are calculated using Hooke’s law for isotropic materials. The Young’s moduli for ferrite and austenite are calculated through Ghosh-Olson formula [34], taking into account the chemical composition of each phase and the temperature. The respective values found are Eα = 207 GPa and Eγ = 201 GPa. The Poisson’s ratio is v = 0.3 [45,46]. The bulk elastic constants are used for both ferrite and austenite since we consider the most isotropic family planes ({211}α and {311}γ) for each phase in the stress analysis.
It must be emphasized that the determinations of the transformation kinetics with the Rietveld procedure and of the phase stresses with the sin²ψ method are completely independent.

3. Results

3.1. Transformation Kinetics

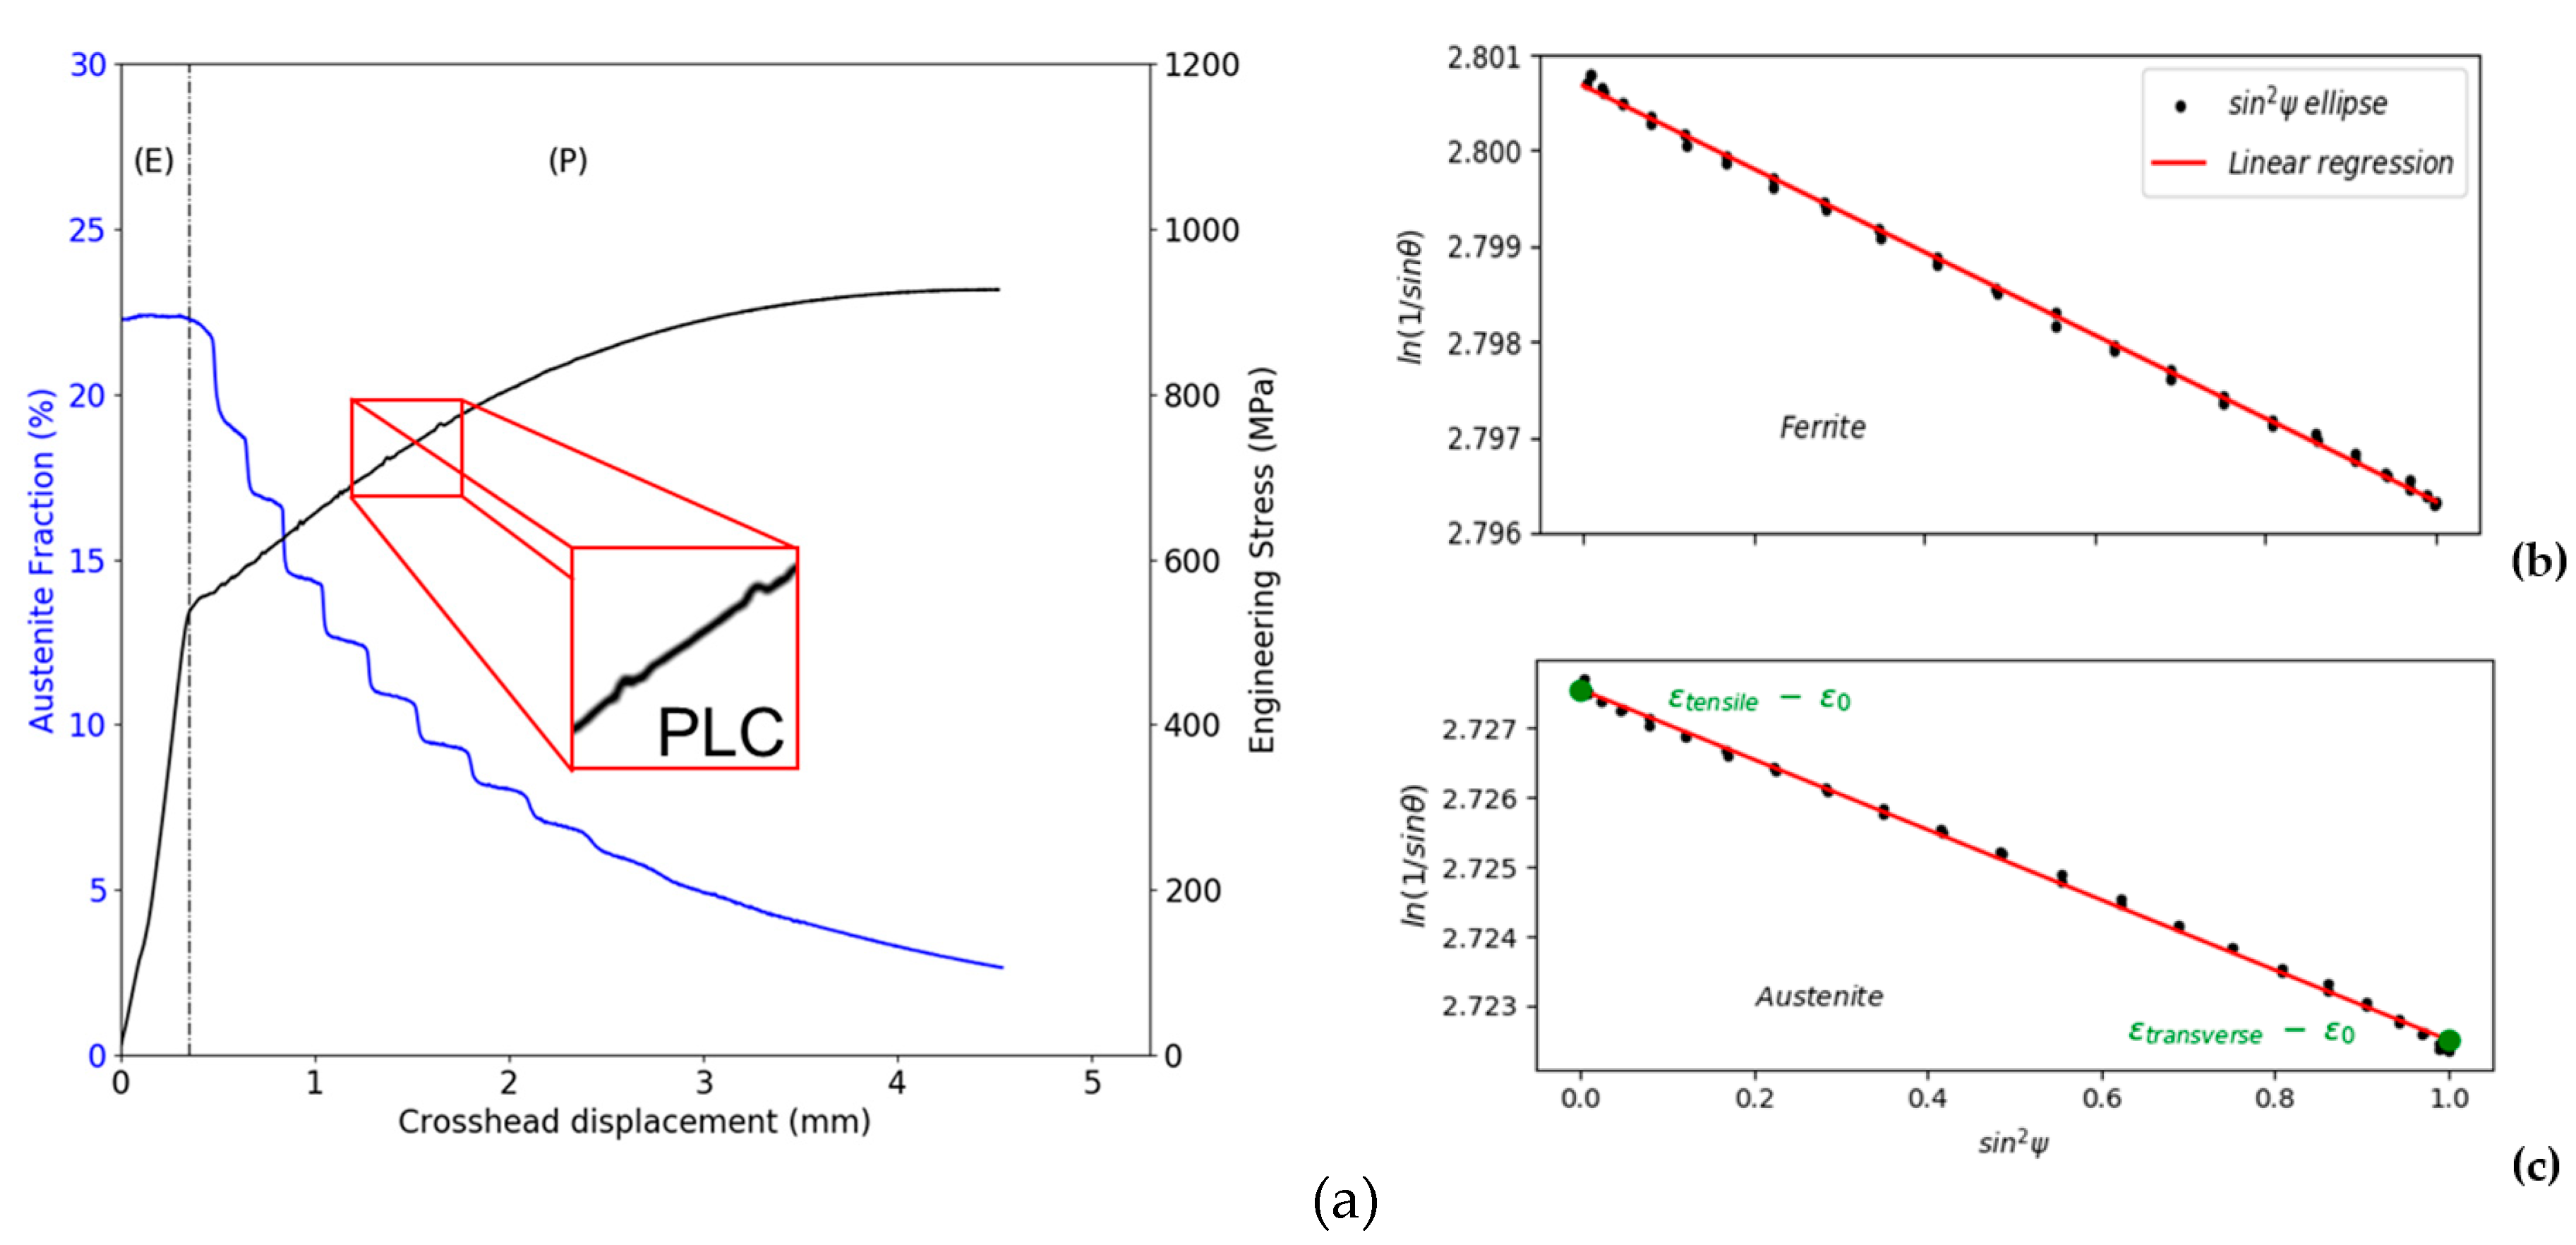
Retained austenite phase fractions fγ as a function of the crosshead displacement, determined with successive Rietveld refinements and the engineering tensile curve, are shown in Figure 3a. The samples show a Yield Strength of 550 MPa and an Ultimate Tensile Strength of 927 MPa. Small serrations are observed on the tensile curve (black). The occurrence of such serrations has already been reported in medium Mn steels [3,47]. According to the literature, they are interpreted as a Portevin-Le Chatelier effect (PLC) [29] induced by a dynamic strain ageing mechanism. Even if well described in a phenomenological way, it is still not clear which phase is affected by the mechanisms nor the profound nature of the PLC effect in these steels.
In the elastic regime (region (E) on the Figure 3a), no martensitic transformation occurs as the fraction of austenite remains constant. The austenite to martensite transformation only begins at the start of the plastic regime (region (P)). In the plastic regime, the fraction decreases progressively. The curve is obviously not smooth and shows successive steps, especially at the begin of the plasticization. These steps correspond to the passage of a PLC deformation bands in the analyzed volume (in the front of the beam). They are due to the fact that the analyzed volume only corresponds to a small area of the sample. The initial austenite fraction is 22%. The final austenite fraction is 3% at necking.

3.2. 3D Stress States in Ferrite and in Austenite

The point-to-point sin²ψ ellipses calculated using the above procedure in the elastic regime are shown in Figure 3b,c for ferrite and austenite respectively. In those Figures, the Y-axis is ln(1/sinθ). The real sin²ψ plot (i.e., εφψ vs. sin²ψ) is obtained by adding ln(sinθ0) to the Y-axis of Figure 3b,c. While this addition is not necessary to obtain the von Mises stresses of each phase, it is necessary to obtain relevant values for the stresses in tensile and transverse directions. The agreement between the experimental values and the linear regression is very good (correlation coefficient ≈0.998 for both phases). The flatness of the ellipses means that shear stresses are negligible compared to normal stresses. The same kind of flat ellipses is also found during the plastic regime. Then, with the isotropic hypothesis εTD = εND, strain and stress tensors have only two independent components ε11 = ε22 and ε33 that will be denoted εtransverse = εTD = ε11 and εtensile = εRD = ε33 (respectively σtransverse and σtensile). In this simple case, von Mises stress σMises is simply equal to σtensile − σtransverse, and is independent from the initial hydrostatic stress imposed by the choice of θ0.
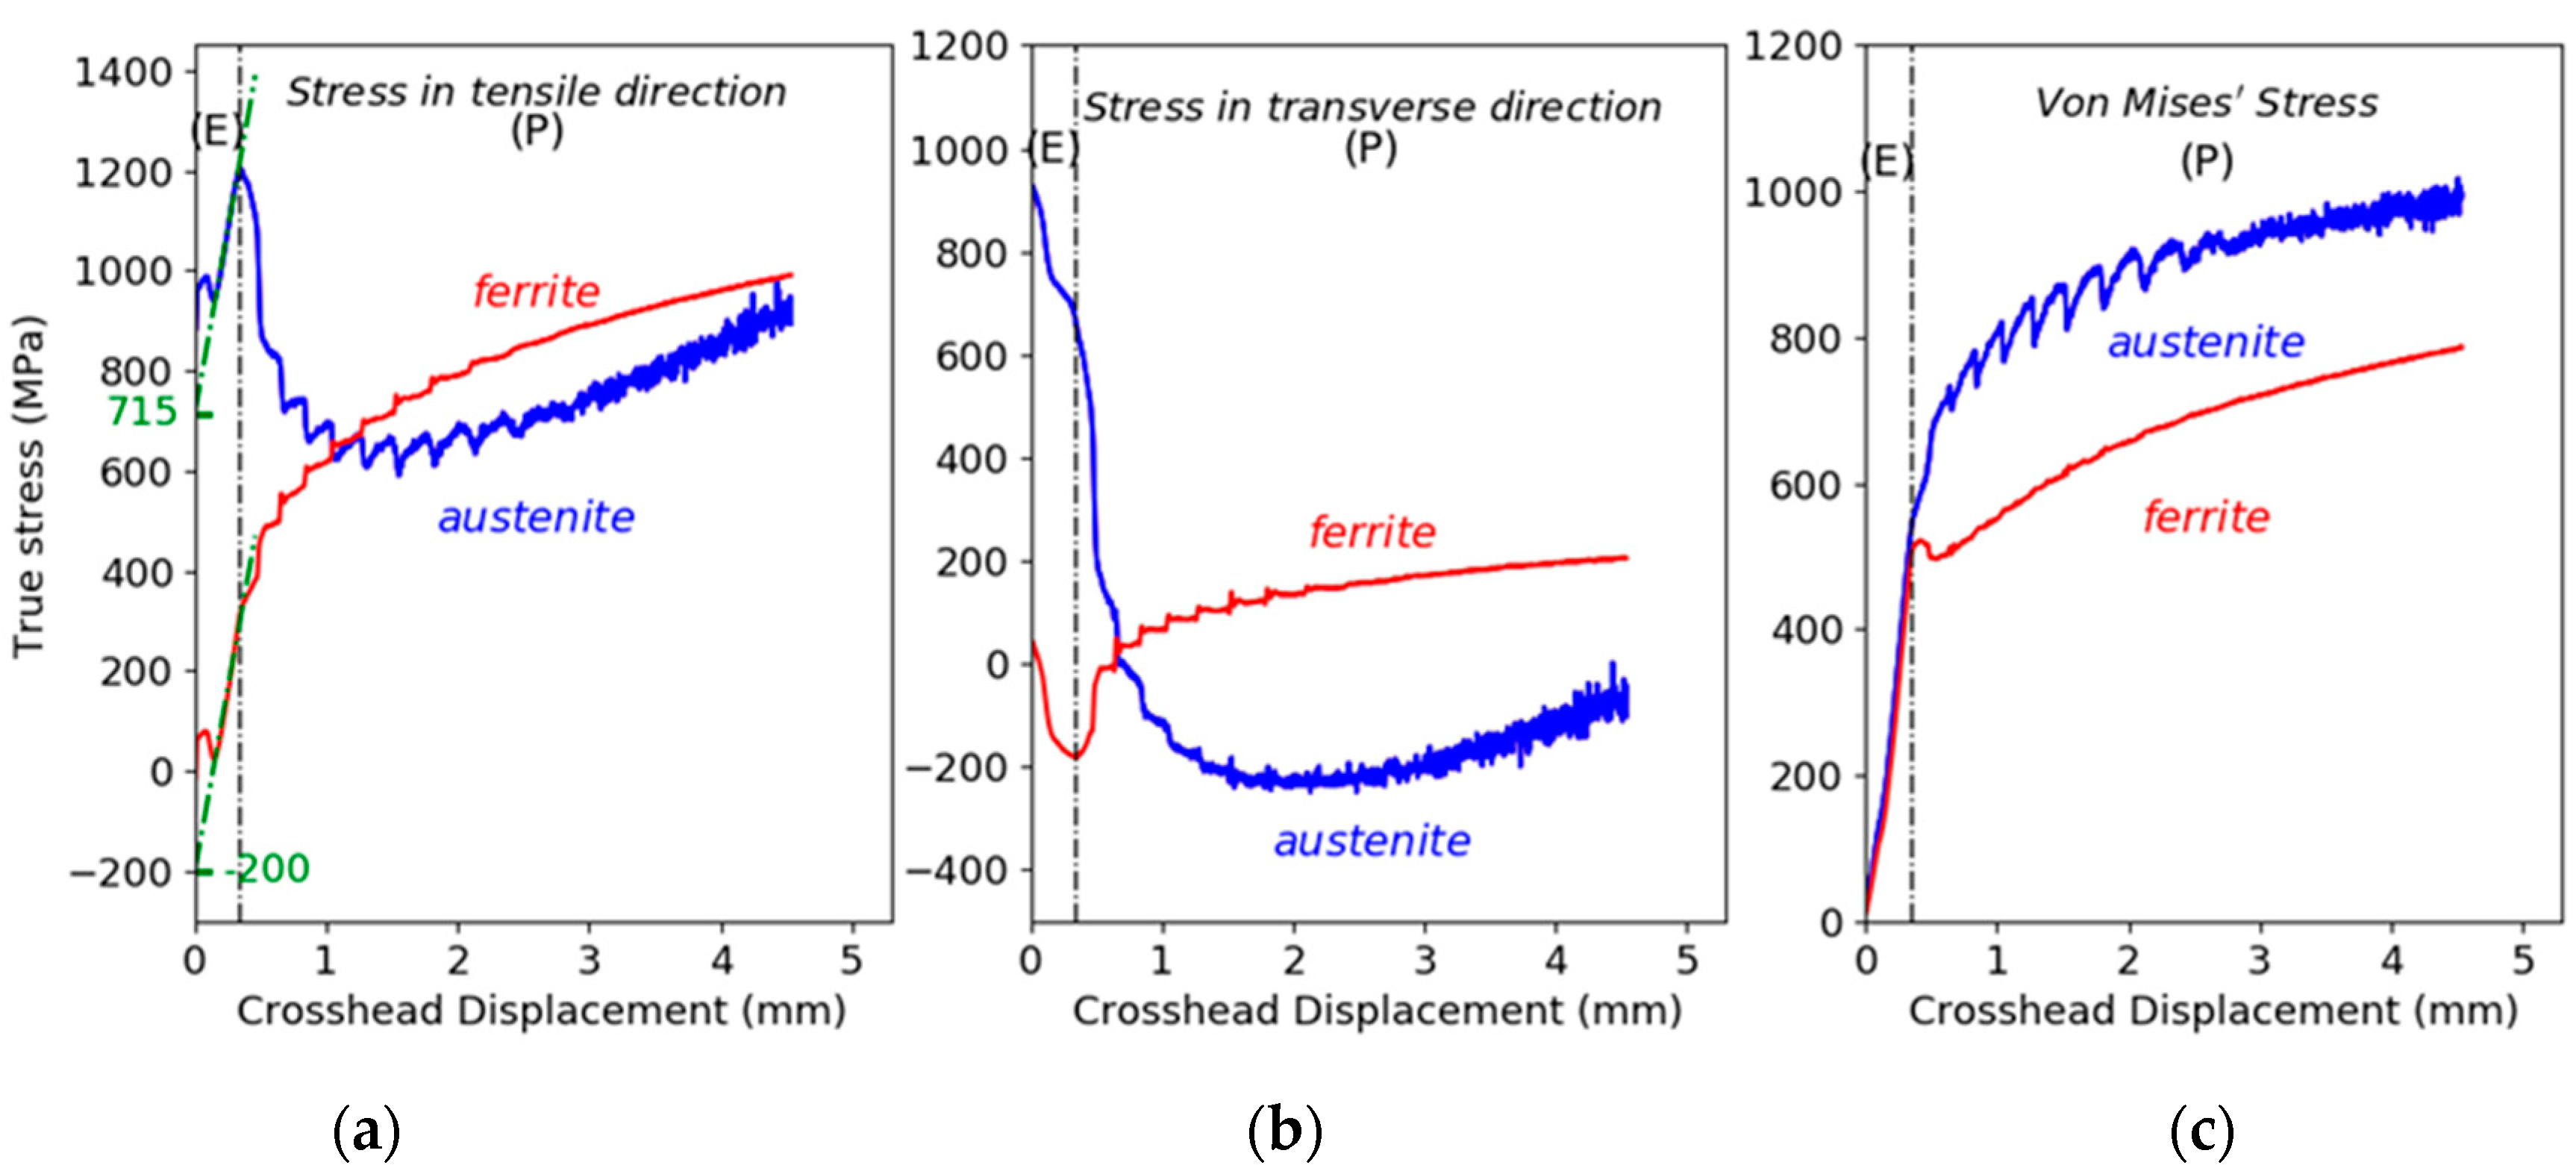
The stresses σtensile, σtransverse and σMises for ferrite and austenite calculated with sin²ψ method are shown in Figure 4a–c), (respectively red and blue curves). To calculate σtensile and σtransverse in both phases, it is necessary to choose the stress-free Bragg angle θ0 of both {211}α and {311}γ peaks. However, as this value is not measurable, the initial hydrostatic stresses in both phases were imposed at the beginning of the tensile test as discussed in the experimental methods section (+715 MPa in austenite and −200 MPa in ferrite).
As the measured longitudinal stress shows obviously mechanical instabilities at the very beginning of the tensile test due to the setup, the linear behaviors of the phases in the elastic regime have served as references to extrapolate the initial behavior. In both phases, the apparent Young’s moduli are similar, confirming the choice made above. By doing so, the choice of ε0 (initial hydrostatic stresses) for both phases allows respecting the mechanical balances in the longitudinal and transverse direction at the yield point (transition between the (E) and (P)). The weighted mean stress in the longitudinal direction is equal to the macroscopic yield strength and is equal to 0 in the transverse direction, as expected. In the elastic regime, the transverse stresses in phases are almost constant and equal the initial values of the hydrostatic stress component as expected.
At the yield point, austenite shows a high tensile stress state in the longitudinal direction explained by the initial hydrostatic stress state and the external loading (715 + 515 = 1230 MPa), but also in the transverse direction (715 + 0 = 715 MPa). On the contrary, in the ferritic matrix, both stresses are limited in the longitudinal direction (−200 + 520=320 MPa) and in the transverse direction (–200 MPa).
During the plastic regime, the high longitudinal stress in austenite starts to rapidly decrease to about 600 MPa, whereas the stress in ferrite continues to increase as in the elastic regime. After about 1.5 mm of crosshead displacement (typically 6% of elongation), the tensile stress in austenite rises again and reaches similar values to those for ferrite. In the transverse direction, a similar behavior is observed for both phases, respectively. For austenite, the simultaneous sharp decreases of stresses in the longitudinal and transverse direction reflect mainly a decrease in the hydrostatic stress state.
During the elastic regime, von Mises stresses for austenite and ferrite are similar as expected (no effect of initial hydrostatic stress states). At the beginning of the plastic regime, a gap appears rapidly between σγMises and σαMises. Then, both stresses continue to increase due to work-hardening, at almost the same rates. In this steel, retained austenite is stronger than the ferritic matrix (about +250 MPa) as von Mises stresses reveal the true plastic behavior of the phases. It must be emphasized that serrations are only observed for austenite, the curve of ferrite remaining almost smooth.

4. Discussion

4.1. Behaviour of Strain-Induced Martensite

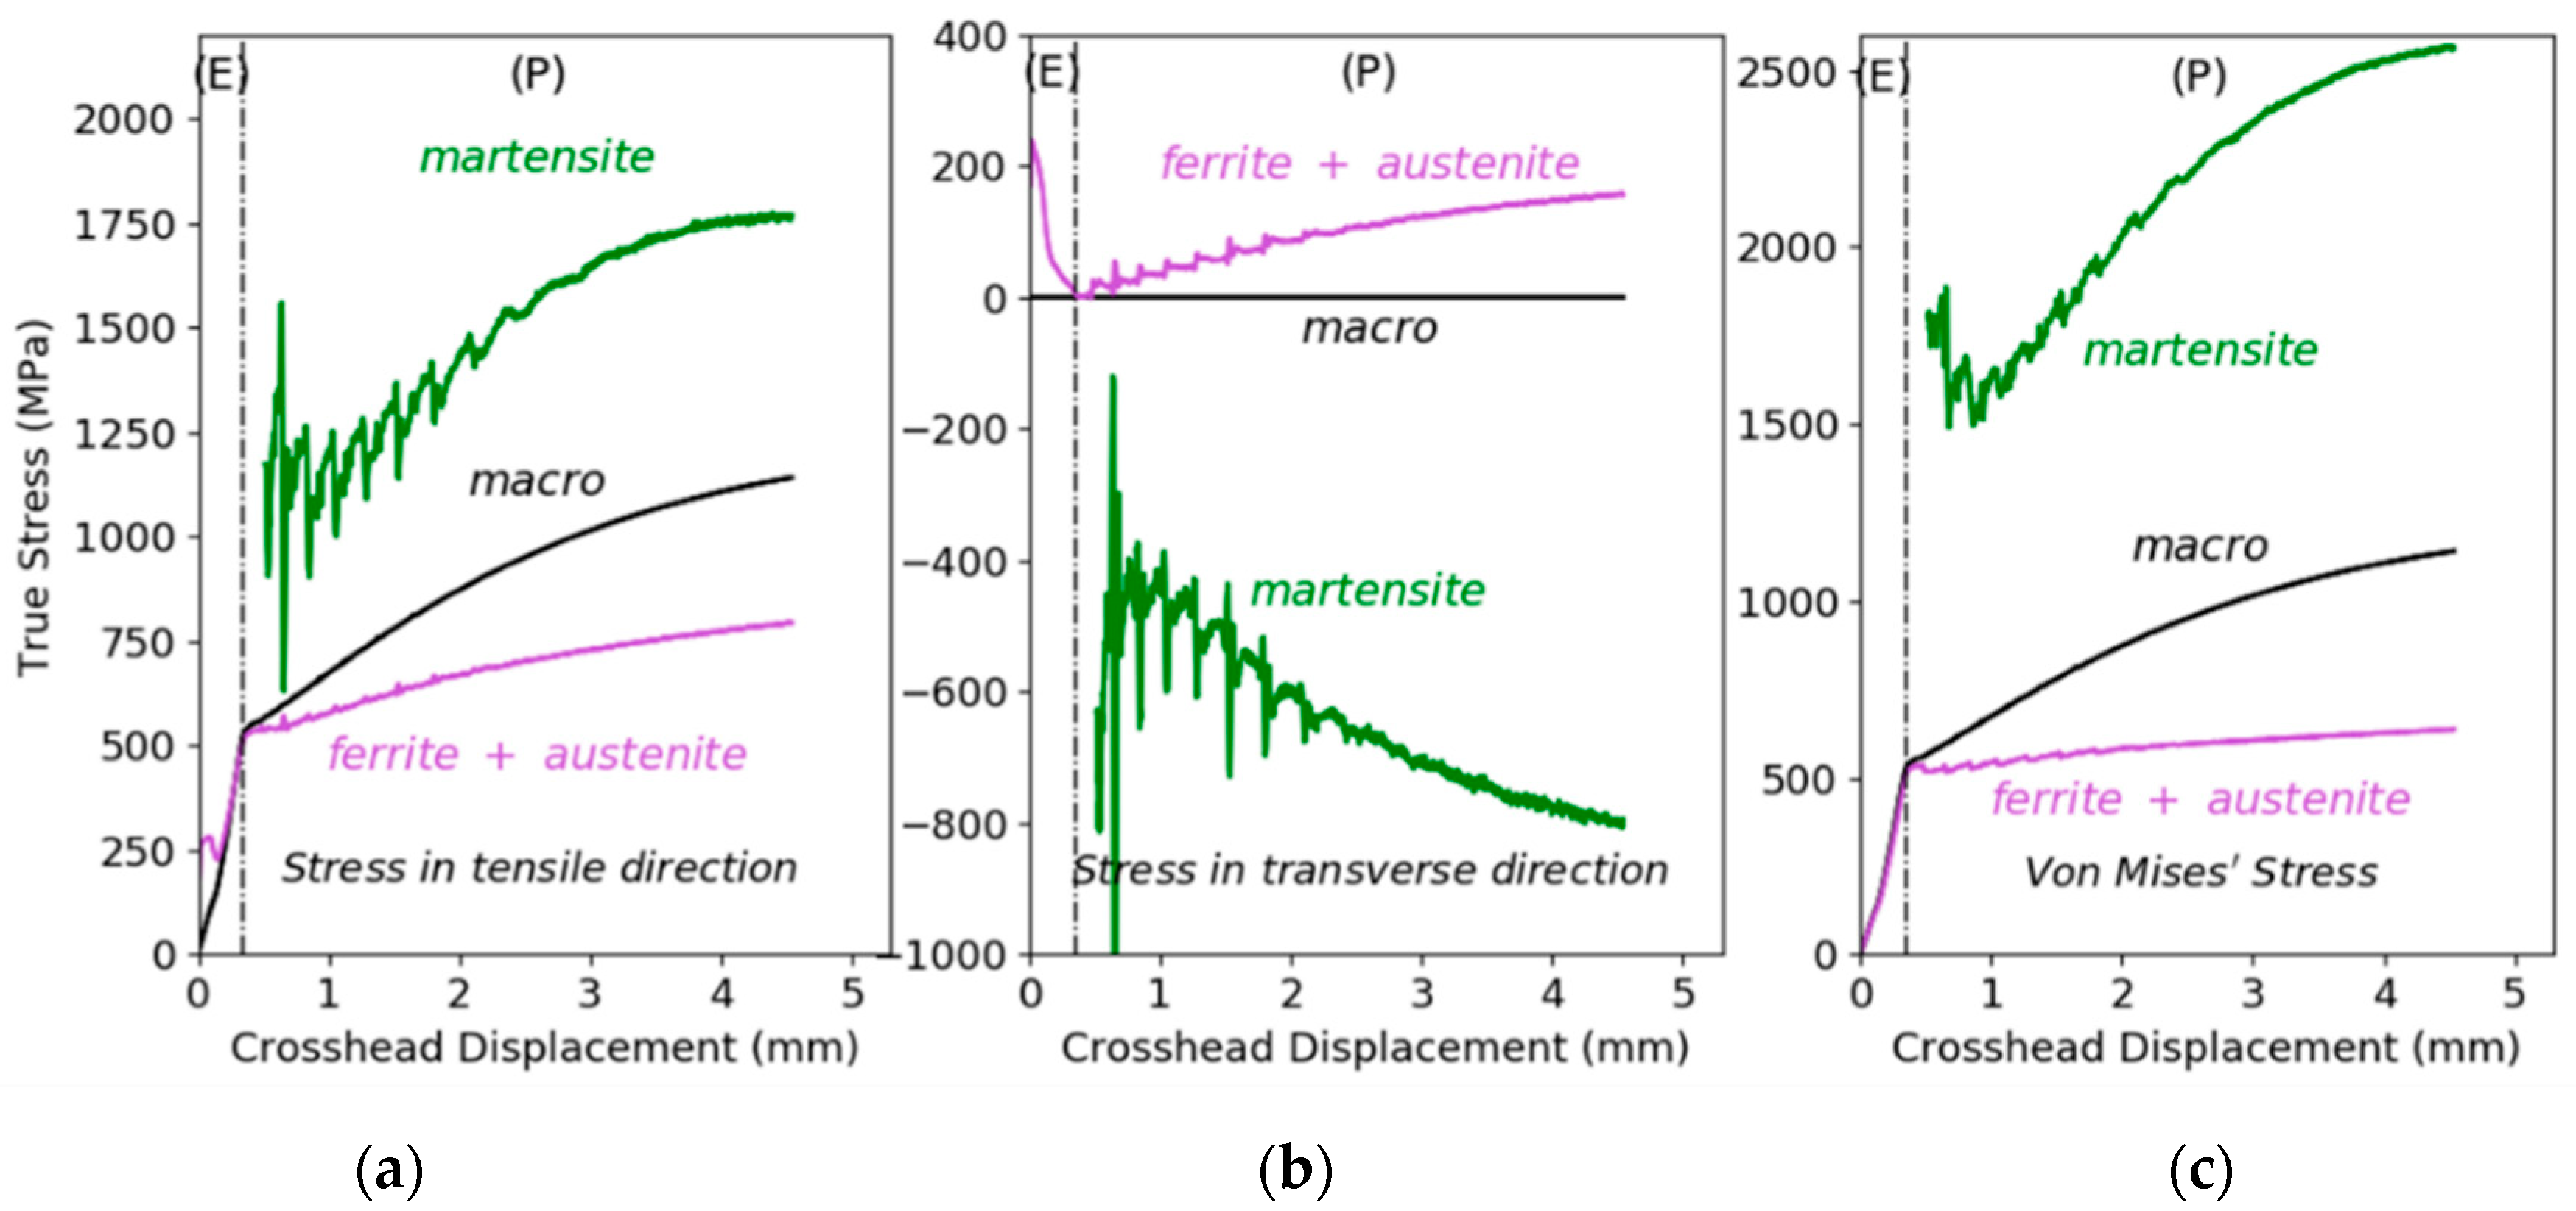
The stress in martensite was calculated from the comparison between the measured true macroscopic stress in the considered direction (Σtensile = ΣMises = Σtrue and Σtransverse = 0) and the Hill mixture law considering only ferrite and austenite respectively shown in blue and red curves in Figure 4 [48]. It comes:
σ i α = Σ i ( f α σ i α + f γ σ i γ ) f α
where i = tensile, transverse or Mises. The results are shown in green in Figure 5. The true behavior of the material (not measured during the trial) has been estimated using the ex-situ trials. The Young’s modulus of fα σαtensile + fγ σγtensile and Σtensile are similar at the beginning as expected. During the plastic regime, the work-hardening of fα σαtensile + fγ σγtensile is very low, as expected for a duplex austenite-ferrite steel [23]. In the transverse direction, the mixture law fα σαtransverse + fγ σγtransverse is very low (<200 MPa). In the elastic regime, the macroscopic stress and the von Mises stress mixture law fα σαMises + fγ σγMises are identical, until martensitic transformation occurs. Then, the difference between the two curves can be explained by a von Mises stress in martensite increasing from 1.5 GPa to 2.6 GPa, which can be decomposed at necking in a tensile stress in the tensile direction of 1.8 GPa and a compressive transverse stress of –0.8 GPa. The strength of 2.6 GPa is consistent for fully martensitic steels with a carbon content of 0.5 wt.% [49].

4.2. Evolution of the Hydrostatic Stresses in Phases

At the start of the tensile test, huge residual hydrostatic stresses inherited from thermal treatment are present in austenite (Figure 4a,b). In the plastic regime, austenite relaxes in both tensile and transverse direction, while stresses in ferrite highly increase in compensation. First bursts of martensitic transformation are followed by a relaxation in austenite and a diminution of its von Mises stress, as the martensitic transformation accommodates a part of the deformation in austenite. There is a strict correlation between the serrations on the tensile curve and the steps observed on the transformation kinetics (Figure 2a). As a consequence, the hydrostatic pressure inherited from the manufacturing process will be suppressed progressively by the strain-induced transformation. At around 2 mm of crosshead displacement, the stress in tensile direction in austenite increases again. This might be due to the end of the relaxation of hydrostatic stress inherited from thermal treatments and the work-hardening of austenite revealed by the continuous increase in von Mises stress, as shown in Figure 4c.

4.3. Mechanical Instabilities

Considering the individual components of the stress tensors of austenite and ferrite (Figure 4a,b), mechanical instabilities seem to affect both austenite and ferrite at the beginning of the plastic deformation between 0.4 mm to 2.5 mm. The regular serrations are representative of A-type PLC. After 2.5 mm, in tensile and transverse directions, the stress curves of ferrite become smooth, while austenite curves continue to present serrations, which are more densely and randomly distributed. Those serrations in austenite might also be due or amplified by the fact that the austenitic peaks become very small at this stage of the tensile test (less than 6% of austenite). However, mechanical instabilities are only observed in the evolution of the von Mises stresses in austenite (Figure 4c). In this case, the ferrite curve remains almost smooth all along the tensile test. This suggests that the physical source of the serrations is austenite. This result is consistent with the fact that PLC mechanisms are commonly observed in carbon-rich austenite at room temperature, as in FeMnC TWIP (Twinning-Induce Plasticity) steels [50,51,52]. On the contrary, PLC is reported in ferritic phases only at high temperatures (typically 300–400 °C) [53,54]. The observed instabilities seem also to evolve as a function of the deformation, switching from a A-type PLC to a B or C-type PLC (after a displacement of 2.5 mm, i.e., 10% of elongation). This point clearly deserves further investigations, but our observations plead in favor of a mechanism in austenite and having measurable consequences in the surrounding ferritic (load transfer) matrix and thus at macroscopic levels. It cannot be excluded that the dynamic strain ageing in austenite favors the strain-induced transformation, as the transformation strain might enable the phase to follow certain strain rates which are forbidden by the DSA.

5. Conclusions

In summary, HEXRD experiments have been conducted on a medium Mn steel. Time-resolved transformation kinetics have been obtained during tensile test, the austenite fraction going from 22% to 3%. It is the first time that the in situ 3D stress tensor is determined in unstable duplex steel. It was revealed that in this microstructure, austenite is stronger than ferrite, the difference in both von Mises stress being 250 MPa at necking. At the start of the experiment, initial hydrostatic stresses of +715 MPa for austenite and −200 MPa for the ferritic matrix were calculated, which is coherent with the determined partitioning of stress between phases all along the experiment. Moreover, martensitic transformation always appears simultaneously with an unloading in austenite. A micromechanical calculation showed that the presence of fresh martensite is enough to explain the difference between the micromechanical stress measured for austenite and ferrite and the macroscopic true stress. The stress in martensite is calculated to be around 2.6 GPa at necking. Finally, this work provides direct evidence that mechanical instabilities mainly affect austenite, which is coherent with a PLC mechanism.

Author Contributions

Conceptualization, S.Y.P.A. and A.P.; formal analysis, M.L., G.G. and K.Z.; funding acquisition, A.P.; investigation, M.L., J.-C.H. and G.G.; methodology, G.G.; project administration, S.Y.P.A., K.Z. and A.P.; supervision, A.P.; writing—original draft, M.L. and S.Y.P.A.; writing—review and editing, G.G., K.Z., J.-C.H. and A.P. All authors have read and agreed to the published version of the manuscript.

Funding

This work was funded by ArcelorMittal Maizières les Metz (Product Research Centre), by the Université de Lorraine, by the CNRS (Centre National de la Recherche Scientifique) and the French ANRT (Agence National de la Recherche et de la Technologie) under the CIFRE convention (2019/0663). The HEXRD experiments were conducted at DESY (PETRAIII-P07 beamline) in Hamburg.

Acknowledgments

A special thanks is dedicated to the team of the P-07 line. Their expertise was much appreciated and widely contributed to the success of the study. The Laboratory of Excellence on Design of Alloy Metals for low-mass Structures (Labex DAMAS) from the Université de Lorraine (France) and the i-SITE Lorraine Université d’Excellence program (LUE) are also fully acknowledged for their support.

Conflicts of Interest

The authors declare no conflict of interest.

References

  1. Kim, N.J.; Thomas, G. Effects of morphology on the mechanical behavior of a dual phase Fe/2Si/0.1C steel. Metall. Trans. A 1981, 12, 483–489. [Google Scholar] [CrossRef]
  2. Sugimoto, K.; Kanda, A.; Kikuchi, R.; Hashimoto, S.; Kashima, T.; Ikeda, S. Ductility and Formability of Newly Developed High Strength Low Alloy TRIP-aided Sheet Steels with Annealed Martensite Matrix. ISIJ Int. 2002, 42, 910–915. [Google Scholar] [CrossRef] [Green Version]
  3. Arlazarov, A.; Bouaziz, O.; Masse, J.P.; Kegel, F. Characterization and modeling of mechanical behavior of quenching and partitioning steels. Mater. Sci. Eng. A 2015, 620, 293–300. [Google Scholar] [CrossRef]
  4. Bhadeshia, H.K.D.H.; Edmonds, D.V. The mechanism of bainite formation in steels. Acta Metall. 1980, 28, 1265–1273. [Google Scholar] [CrossRef]
  5. Hell, J.-C.; Dehmas, M.; Allain, S.; Prado, J.M.; Hazotte, A.; Chateau, J.-P. Microstructure—Properties Relationships in Carbide-free Bainitic Steels. ISIJ Int. 2011, 51, 1724–1732. [Google Scholar] [CrossRef] [Green Version]
  6. Caballero, F.G.; Allain, S.; Cornide, J.; Puerta Velásquez, J.D.; Garcia-Mateo, C.; Miller, M.K. Design of cold rolled and continuous annealed carbide-free bainitic steels for automotive application. Mater. Des. 2013, 49, 667–680. [Google Scholar] [CrossRef] [Green Version]
  7. Allain, S.Y.P.; Gaudez, S.; Geandier, G.; Hell, J.C.; Gouné, M.; Danoix, F.; Soler, M.; Aoued, S.; Poulon-Quintin, A. Internal stresses and carbon enrichment in austenite of Quenching and Partitioning steels from high energy X-ray diffraction experiments. Mater. Sci. Eng. A 2018, 710, 245–250. [Google Scholar] [CrossRef] [Green Version]
  8. Sun, J.; Yu, H. Microstructure development and mechanical properties of quenching and partitioning (Q&P) steel and an incorporation of hot-dipping galvanization during Q&P process. Mater. Sci. Eng. A 2013, 586, 100–107. [Google Scholar] [CrossRef]
  9. Speer, J.; Matlock, D.K.; De Cooman, B.C.; Schroth, J.G. Carbon partitioning into austenite after martensite transformation. Acta Mater. 2003, 51, 2611–2622. [Google Scholar] [CrossRef]
  10. Angel, T. Formation of Martensite in Austenitic Stainless Steels. J. Iron Steel Inst. 1954, 177, 165–174. [Google Scholar]
  11. Patel, J.R.; Cohen, M. Criterion for the action of applied stress in the martensitic transformation. Acta Metall. 1953, 1, 531–538. [Google Scholar] [CrossRef]
  12. Olson, G.B.; Cohen, M. A mechanism for the strain-induced nucleation of martensitic transformations. J. Less-Common Met. 1972, 28, 107–118. [Google Scholar] [CrossRef]
  13. Olson, G.B.; Cohen, M. Kinetics of strain-induced martensitic nucleation. Metall. Trans. A 1975, 6, 791–795. [Google Scholar] [CrossRef]
  14. Dan, W.J.; Li, S.H.; Zhang, W.G.; Lin, Z.Q. The effect of strain-induced martensitic transformation on mechanical properties of TRIP steel. Mater. Des. 2008, 29, 604–612. [Google Scholar] [CrossRef]
  15. Greenwood, G.W.; Johnson, R.H. The deformation of metals under small stresses during phase transformations. Proc. R. Soc. Lond. Ser. A 1965, 283, 403–422. [Google Scholar] [CrossRef]
  16. Magee, C.L. Phase Transformations; ASM: Metals Park, OH, USA, 1970; pp. 15–156. [Google Scholar]
  17. Fischer, F.D.; Reisner, G.; Werner, E.; Tanaka, K.; Cailletaud, G.; Antretter, T. A new view on transformation induced plasticity (TRIP). Int. J. Plast. 2000, 16, 723–748. [Google Scholar] [CrossRef]
  18. Jacques, P. On the role of martensitic transformation on damage and cracking resistance in TRIP-assisted multiphase steels. Acta Mater. 2001, 49, 139–152. [Google Scholar] [CrossRef]
  19. Bhadeshia, H.K.D.H. TRIP-Assisted Steels? ISIJ Int. 2002, 42, 1059–1060. [Google Scholar] [CrossRef] [Green Version]
  20. Suh, D.-W.; Kim, S.-J. Medium Mn transformation-induced plasticity steels: Recent progress and challenges. Scr. Mater. 2017, 126, 63–67. [Google Scholar] [CrossRef]
  21. Gao, G.; Gao, B.; Gui, X.; Hu, J.; He, J.; Tan, Z.; Bai, B. Correlation between microstructure and yield strength of as-quenched and Q&P steels with different carbon content (0.06–0.42 wt%C). Mater. Sci. Eng. A 2019, 753, 1–10. [Google Scholar] [CrossRef]
  22. Peng, F.; Xu, Y.; Gu, X.; Wang, Y.; Liu, X.; Li, J. The relationships of microstructure-mechanical properties in quenching and partitioning (Q&P) steel accompanied with microalloyed carbide precipitation. Mater. Sci. Eng. A 2018, 723, 247–258. [Google Scholar] [CrossRef]
  23. Shiekhelsouk, M.N.; Favier, V.; Inal, K.; Allain, S.; Bouaziz, O.; Cherkaoui, M. Residual and Internal Stress States in Duplex Steel with TWIP Effect; Trans Tech Publications Ltd.: Freienbach, Switzerland, 2006; pp. 833–838. [Google Scholar]
  24. Zhang, M.; Chen, H.; Wang, Y.; Wang, S.; Li, R.; Li, S.; Wang, Y.D. Deformation-induced martensitic transformation kinetics and correlative micromechanical behavior of medium-Mn transformation-induced plasticity steel. J. Mater. Sci. Technol. 2019, 35, 1779–1786. [Google Scholar] [CrossRef]
  25. Tian, J.; Xu, G.; Jiang, Z.; Zhou, M.; Hu, H.; Yuan, Q. Transformation Behavior of Bainite during Two-step Isothermal Process in an Ultrafine Bainite Steel. ISIJ Int. 2018, 58, 1875–1882. [Google Scholar] [CrossRef]
  26. Dutta, A.; Ponge, D.; Sandlöbes, S.; Raabe, D. Strain partitioning and strain localization in medium manganese steels measured by in situ microscopic digital image correlation. MaterIals 2019, 5, 100252. [Google Scholar] [CrossRef]
  27. Kumar, A.; Dutta, A.; Makineni, S.K.; Herbig, M.; Petrov, R.H.; Sietsma, J. In-situ observation of strain partitioning and damage development in continuously cooled carbide-free bainitic steels using micro digital image correlation. Mater. Sci. Eng. A 2019, 757, 107–116. [Google Scholar] [CrossRef]
  28. Tan, X.; Ponge, D.; Lu, W.; Xu, Y.; Yang, X.; Rao, X.; Wu, D.; Raabe, D. Carbon and strain partitioning in a quenched and partitioned steel containing ferrite. Acta Mater. 2019, 165, 561–576. [Google Scholar] [CrossRef]
  29. Callahan, M.; Perlade, A.; Schmitt, J.-H. Interactions of negative strain rate sensitivity, martensite transformation, and dynamic strain aging in 3rd generation advanced high-strength steels. Mater. Sci. Eng. A 2019, 754, 140–151. [Google Scholar] [CrossRef]
  30. Picu, R.C. A mechanism for the negative strain-rate sensitivity of dilute solid solutions. Acta Mater. 2004, 52, 3447–3458. [Google Scholar] [CrossRef]
  31. Yi, J.J.; Kim, I.S.; Choi, H.S. Austenitization during intercritical annealing of an Fe-C-Si-Mn dual-phase steel. Metall. Trans. A 1985, 16, 1237–1245. [Google Scholar] [CrossRef]
  32. van Bohemen, S.M.C. Bainite and martensite start temperature calculated with exponential carbon dependence. Mater. Sci. Technol. 2012, 28, 487–495. [Google Scholar] [CrossRef]
  33. Jimenez-Melero, E.; Van Dijk, N.H.; Zhao, L.; Sietsma, J.; Offerman, S.E.; Wright, J.P.; Van der Zwaag, S. Characterization of individual retained austenite grains and their stability in low-alloyed TRIP steels. Acta Mater. 2007, 55, 6713–6723. [Google Scholar] [CrossRef]
  34. Ghosh, G.; Olson, G.B. The isotropic shear modulus of multicomponent Fe-base solid solutions. Acta Mater. 2002, 50, 2655–2675. [Google Scholar] [CrossRef]
  35. Toji, Y.; Matsuda, H.; Herbig, M.; Choi, P.-P.; Raabe, D. Atomic-scale analysis of carbon partitioning between martensite and austenite by atom probe tomography and correlative transmission electron microscopy. Acta Mater. 2014, 65, 215–228. [Google Scholar] [CrossRef]
  36. Yi, S.B.; Brokmeier, H.-G.; Bolmaro, R.E.; Kainer, K.U.; Lippmann, T. In situ measurements of texture variations during a tensile loading of Mg-alloy AM20 using synchrotron X-ray radiation. Scr. Mater. 2004, 51, 455–460. [Google Scholar] [CrossRef]
  37. Maawad, E.; Brokmeier, H.G.; Zhong, Z.Y.; Al-Hamdany, N.; Salih, M.; Wagner, L.; Schell, N. Determination of polycrystal diffraction elastic constants of Ti–2.5Cu by using in situ tensile loading and synchrotron radiation. Mater. Sci. Eng. A 2014, 594, 62–67. [Google Scholar] [CrossRef] [Green Version]
  38. Kieffer, J.; Ashiotis, G. PyFAI: A Python library for high performance azimuthal integration on GPU. arXiv 2014, arXiv:1412.6367. Available online: http://arxiv.org/abs/1412.6367 (accessed on 11 May 2020). [CrossRef] [Green Version]
  39. Garcia-Mateo, C.; Peet, M.; Caballero, F.G.; Bhadeshia, H.K.D.H. Tempering of hard mixture of bainitic ferrite and austenite. Mater. Sci. Technol. 2004, 20, 814–818. [Google Scholar] [CrossRef] [Green Version]
  40. Hauk, V. Structural and Residual Stress Analysis by Nondestructive Methods: Evaluation—Application—Assessment; Elsevier: Aachen, Germany, 1997. [Google Scholar]
  41. Castex, L.; Lebrun, J.-L.; Maeder, G.; Sprauel, J.-M. Détermination Des Contraintes Résiduelles Par Diffraction Des Rayons X; ENSAM: Paris, France, 1981. [Google Scholar]
  42. Heidelbach, F.; Riekel, C.; Wenk, H.-R. Quantitative texture analysis of small domains with synchrotron radiation X-rays. J. Appl. Crystallogr. 1999, 32, 841–849. [Google Scholar] [CrossRef]
  43. Heidelbach, F.; Stretton, I.C.; Kunze, K. Texture development of polycrystalline anhydrite experimentally deformed in torsion. Int. J. Earth Sci. 2001, 90, 118–126. [Google Scholar] [CrossRef]
  44. Geandier, G.; Vautrot, L.; Denand, B.; Denis, S. In Situ Stress Tensor Determination during Phase Transformation of a Metal Matrix Composite by High-Energy X-ray Diffraction. Materials 2018, 11, 1415. [Google Scholar] [CrossRef] [Green Version]
  45. Lani, F.; Furnémont, Q.; Van Rompaey, T.; Delannay, F.; Jacques, P.J.; Pardoen, T. Multiscale mechanics of TRIP-assisted multiphase steels: II. Micromechanical modelling. Acta Mater. 2007, 55, 3695–3705. [Google Scholar] [CrossRef]
  46. He, B.B.; Liang, Z.Y.; Huang, M.X. Nanoindentation investigation on the initiation of yield point phenomenon in a medium Mn steel. Scr. Mater. 2018, 150, 134–138. [Google Scholar] [CrossRef]
  47. Callahan, M.; Hubert, O.; Hild, F.; Perlade, A.; Schmitt, J.-H. Coincidence of strain-induced TRIP and propagative PLC bands in Medium Mn steels. Mater. Sci. Eng. A 2017, 704, 391–400. [Google Scholar] [CrossRef] [Green Version]
  48. Hill, R. Elastic properties of reinforced solids: Some theoretical principles. J. Mech. Phys. Solids 1963, 11, 357–372. [Google Scholar] [CrossRef]
  49. Allain, S.Y.P.; Bouaziz, O.; Pushkareva, I.; Scott, C.P. Towards the microstructure design of DP steels: A generic size-sensitive mean-field mechanical model. Mater. Sci. Eng. A 2015, 637, 222–234. [Google Scholar] [CrossRef]
  50. Bouaziz, O.; Allain, S.; Scott, C.P.; Cugy, P.; Barbier, D. High manganese austenitic twinning induced plasticity steels: A review of the microstructure properties relationships. Curr. Opin. Solid State Mater. Sci. 2011, 15, 141–168. [Google Scholar] [CrossRef]
  51. Schmitt, J.-H.; Iung, T. New developments of advanced high-strength steels for automotive applications. C.R. Phys. 2018, 19, 641–656. [Google Scholar] [CrossRef]
  52. Kozłowska, A.; Grzegorczyk, B.; Morawiec, M.; Grajcar, A. Explanation of the PLC Effect in Advanced High-Strength Medium-Mn Steels. A Review. Materials 2019, 12, 4175. [Google Scholar] [CrossRef] [Green Version]
  53. Torabian, N.; Favier, V.; Ziaei-Rad, S.; Dirrenberger, J.; Adamski, F.; Ranc, N. Thermal response of DP600 dual-phase steel under ultrasonic fatigue loading. Mater. Sci. Eng. A 2016, 677, 97–105. [Google Scholar] [CrossRef] [Green Version]
  54. Torabian, N.; Favier, V.; Dirrenberger, J.; Adamski, F.; Ziaei-Rad, S.; Ranc, N. Correlation of the high and very high cycle fatigue response of ferrite based steels with strain rate-temperature conditions. Acta Mater. 2017, 134, 40–52. [Google Scholar] [CrossRef] [Green Version]
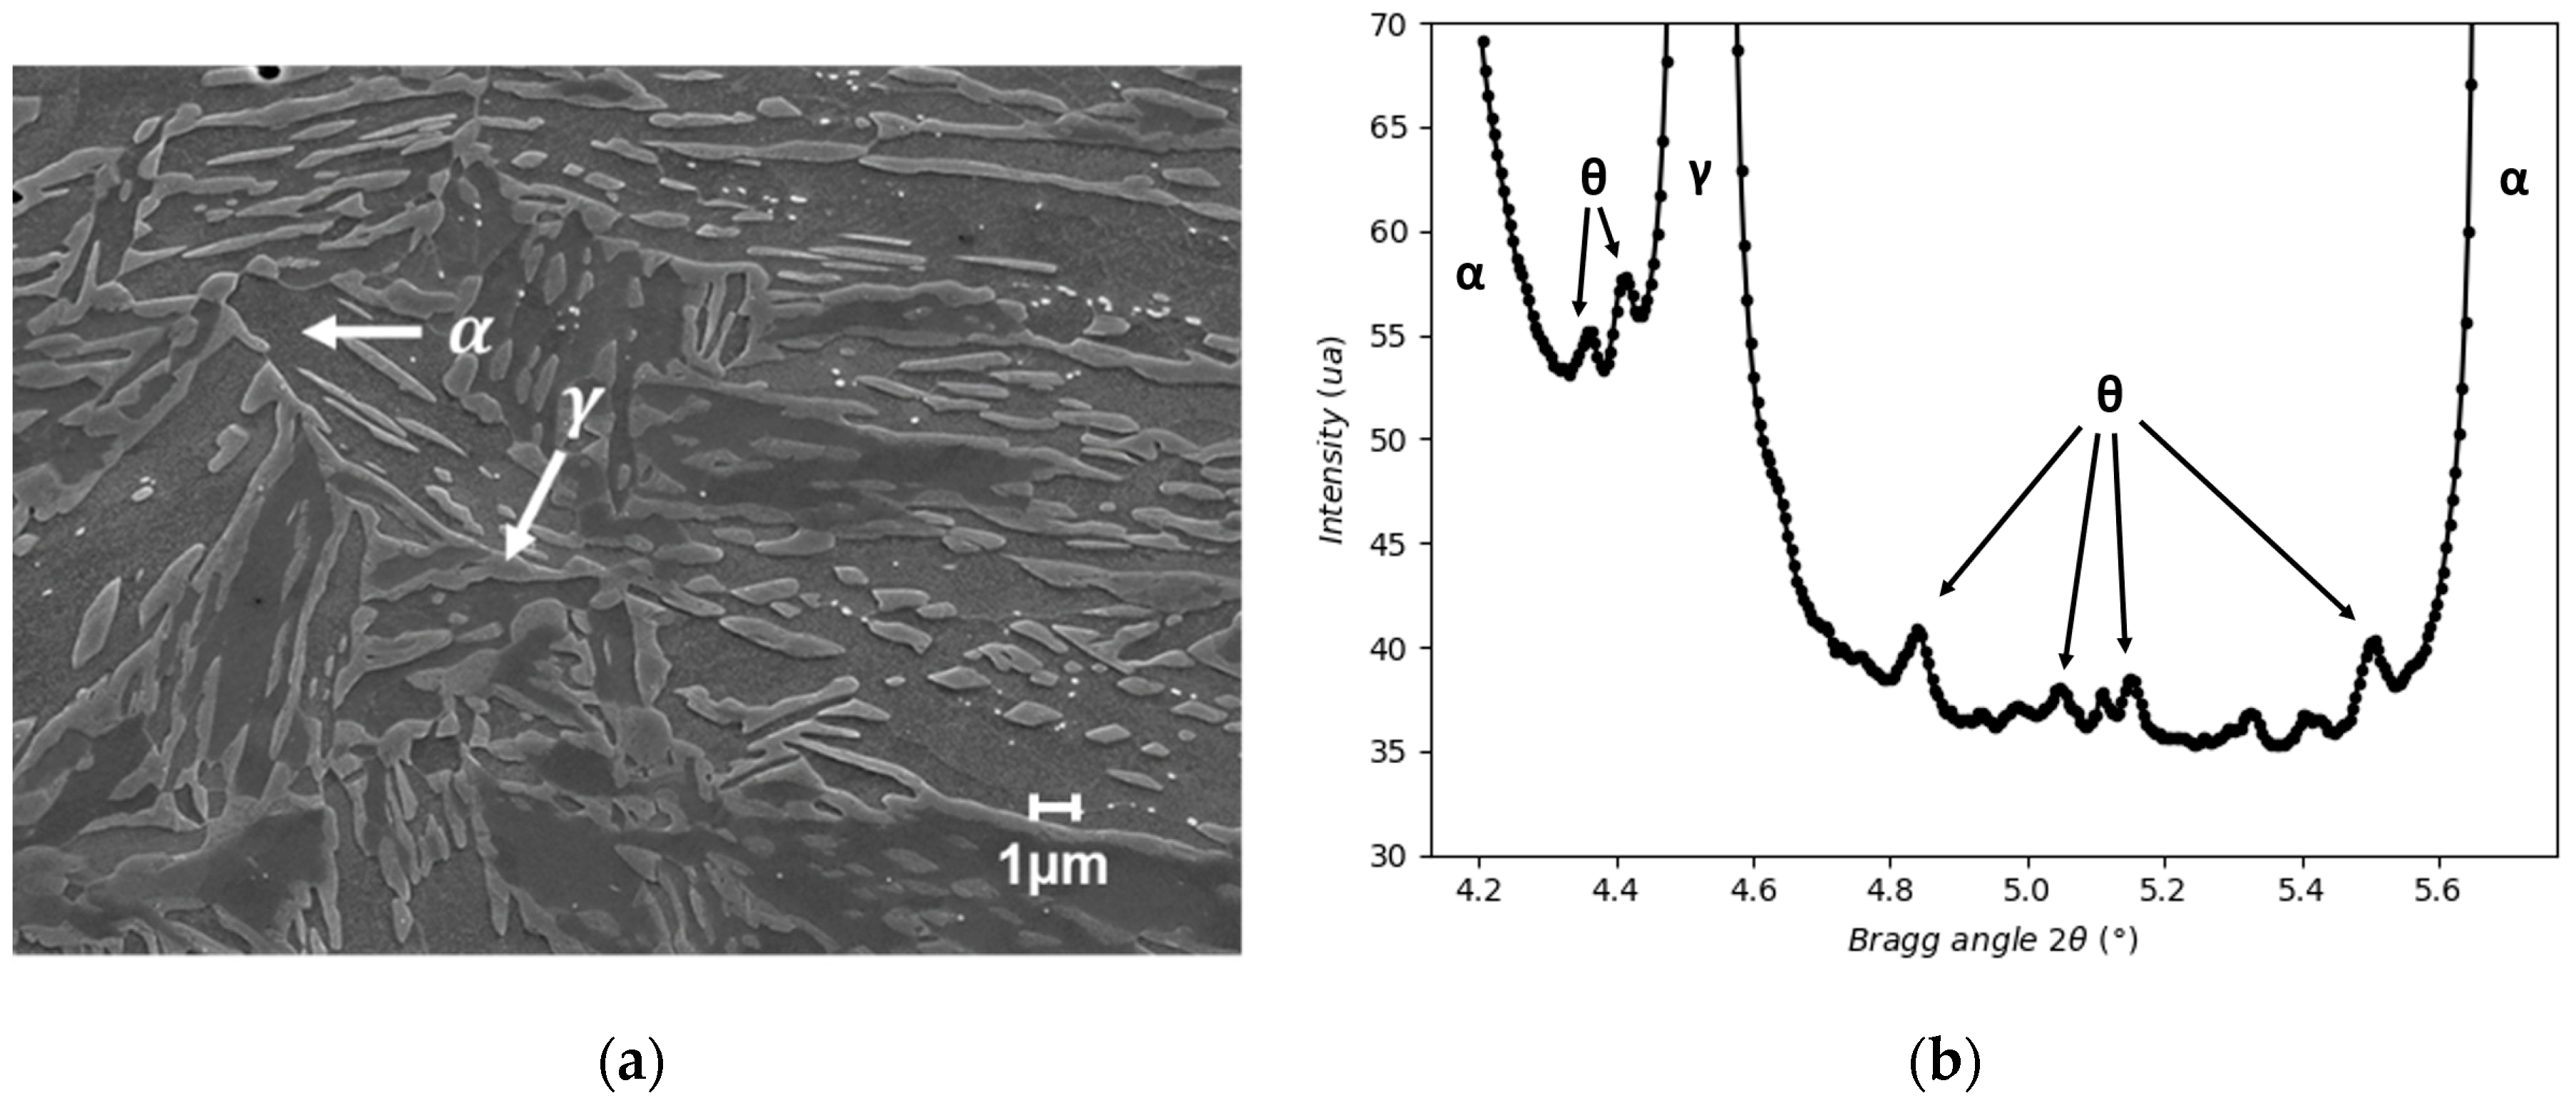
Figure 1. (a) Microstructure observation (SEM micrographs after Nital etching) of the fibrous microstructure (austenite in light grey; ferrite in dark grey). (b) 1D diffractogram obtained by high-energy X-ray diffraction (HEXRD) before deformation in the 4.1–5.7° ranges highlighting minor cementite θ diffraction peaks. For comparison, in this diffractogram, the most intense peak is the {111}α (situated at 4.02° and not observed in the Figure) and has an intensity of 7000.
Metals 10 01335 g001
Figure 2. Comparison between the experimental diffractogram (in black) and the modelled profiles for the two BCC phases (ferrite in red and strain-induced martensite in green) (a) before the tensile trial and (b) just before necking.
Metals 10 01335 g002
Figure 3. (a) Evolution of the austenite fraction determined by the Rietveld refinement (blue) and engineering tensile curve (black). The error on phase fraction is 1% with Rietveld refinement. (E) and (P) correspond to the elastic and plastic regimes, respectively. Measured strains (b) for the {211}α and (c) for the {311}γ planes as a function of sin²ψ in the elastic regime. Each dot (black) corresponds to a measurement in a 4° sector of the Debye-Scherrer. The Y-axis ln(1/sinθ) is linked to the strain in the φ,ψ direction by Equation: ln(1/sinθ) = εφψ – ln(sinθ0). A linear interpolation (red curve) is represented for the sake of readability. The green dots correspond to the elastic strain measured in the tensile and transverse directions, respectively.
Metals 10 01335 g003
Figure 4. Stress in ferritic matrix (red) and retained austenite (blue) in the tensile direction (a), the transverse direction (b) and the von Mises stress (c) all along the experiment obtained through sin²ψ method. The measurement error on stress is 25 MPa. (determined on the Si calibrant).
Metals 10 01335 g004
Figure 5. Comparison between macroscopic stress Σi (black), ferrite, and austenite mixture law fα σαi + fγ σγi (purple) and stress in martensite σα’i considering stresses in the tensile direction (a), stresses in the transverse direction (b), and von Mises stresses (c).
Metals 10 01335 g005