Abstract
Temporal and spatial epigenetic modifications in the brain occur during ontogenetic development, pathophysiological disorders, and aging. When epigenetic marks, such as histone methylations, in brain autopsies or biopsy samples are studied, it is critical to understand their postmortem/surgical stability. For this study, the frontal cortex and hippocampus of adult rats were removed immediately (controls) or after a postmortem delay of 15, 30, 60, 90, 120, or 150 min. The patterns of unmodified H3 and its trimethylated form H3K9me3 were analyzed in frozen samples for Western blot analysis and in formalin-fixed tissues embedded in paraffin for confocal microscopy. We found that both the unmodified H3 and H3K9me3 showed time-dependent but opposite changes and were altered differently in the frontal cortex and hippocampus with respect to postmortem delay. In the frontal cortex, the H3K9me3 marks increased approximately 450% with a slow parallel 20% decrease in the unmodified H3 histones after 150 min. In the hippocampus, the change was opposite, since H3K9me3 marks decreased steadily by approximately 65% after 150 min with a concomitant rapid increase of 20–25% in H3 histones at the same time. Confocal microscopy located H3K9me3 marks in the heterochromatic regions of the nuclei of all major cell types in the control brains: oligodendrocytes, astrocytes, neurons, and microglia. Therefore, epigenetic marks could be affected differently by postmortem delay in different parts of the brain.
1. Introduction
Epigenetics is the study of mitotically heritable, but reversible, changes in gene expression that occur without a change in the genomic DNA sequence [1,2]. Epigenetic modifications are critical in neural development [3,4,5], aging [6,7], and neurological disorders [8,9,10,11,12]. Although animal models have provided valuable information on epigenetic events in the brain [13], the study of human brain tissue is necessary to fully understand human pathologies. Because it is not yet feasible to perform in vivo epigenetic studies for tissues such as the brain, only retrospective study designs using postmortem brain samples are viable [14]. Variations in circumstances before death or postmortem delay can influence gene expression and molecular constituents of brain tissue [14,15,16,17,18,19,20]. For human autopsies, postmortem delays from several hours up to a day are typical [21,22], while much shorter delays between experimental intervention and tissue preservation can be measured in animal models. For example, high levels of acetylation and methylation at certain sites of the H3 and H4 core histones in liver cells were found to be evident within 60 min of growth hormone treatment [23,24]. Therefore, it is important to understand postmortem changes in epigenetic modifications and report postmortem delay along with other vital parameters of the patients [21,25,26].
Epigenetic mechanisms act in advance of specific gene transcription events and are encoded in various histone post-translational modification (PTM) patterns, as well as in DNA methylation [18,19,27]. One of the main epigenetic modifications is histone methylation [2]. Reversible addition and removal of the methyl group(s) in the amino group (mono-, di-, or trimethylation) is governed by histone methyltransferases and histone demethylases [28]. In particular, in the case of histone H3, its PTMs are closely related to fundamental cellular events such as activation and repression of transcription. Methylation of histone lysine (K) residues plays an important and varied role in the regulation of gene expression [29]. The histone H3 methylation marks that are linked to transcriptional activation are H3K4, H3K36, and H3K79, while the transcriptional repression-specific methylation marks are H3K9 and H3K27 [30]. However, one methyl mark itself might have only a limited biological relevance. H3K9 trimethylations have been well studied due to their fundamental roles in heterochromatin formation, transcriptional silencing, X chromosome inactivation, and DNA methylation [31]. These modifications are associated with changes in gene transcription through alteration of the chromatin structure [32]. For example, H3K9me3 is a typical mark of constitutive heterochromatin [33].
We hypothesized that postmortem delay (the time between death and tissue removal/preservation for study) would affect epigenetic modifications in brain tissue. We addressed this by determining the stability of histone methylation in samples from different areas of the brain after death using Western blot analysis and confocal immunohistochemistry. In the present study, we examined the H3 and H3K9me3 patterns as a function of postmortem delay in two distinct regions of the brain of the adult rat.
2. Results
The postmortem delay progressively affected the amounts and patterns of immunologically detectable H3 and H3K9me3. Western blot analysis showed that changes in the amounts of unmodified H3 and H3K9me3 immunosignals were time-dependent and altered oppositely in the frontal cortex and hippocampus with respect to postmortem delay (Figure 1). For example, H3K9me3 marks increased by about 450% (* p < 0.05 at 150 min; Figure 1A), with a parallel slow 20% decrease in unmodified H3 histones (*** p < 0.001 at 150 min) in the frontal cortex (Figure 1B). However, in the hippocampus, the change was opposite, as the H3K9me3 marks decreased steadily by about 65% (** p < 0.01) after a postmortem delay of 150 min (Figure 1C), with a concomitant increase of 20–25% in the H3 histones (* p < 0.05) at the same time (Figure 1D).
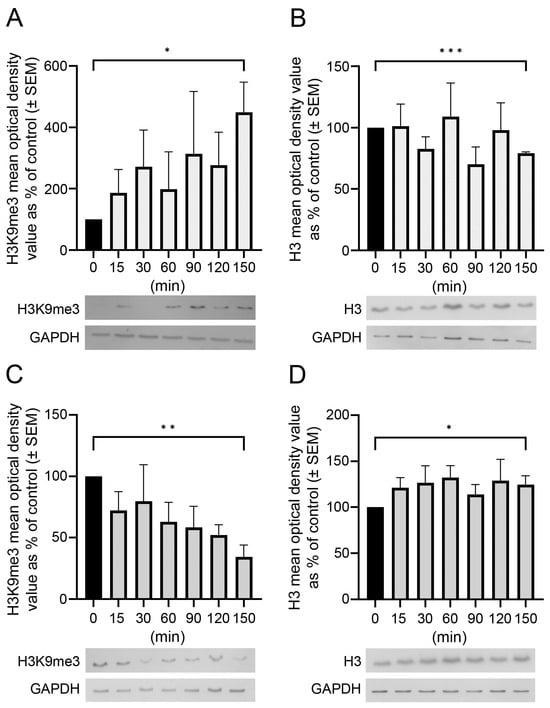
Figure 1.
Postmortem delay-dependent changes in H3 and H3K9me3 immunoreactivities in the frontal cortex and hippocampus of rats. Quantitative Western blot analysis on samples from the frontal cortex (A,B) and hippocampus (C,D) was performed as described in Section 4. Samples were analyzed from control (delayed by 0 min) and postmortem-delayed (by 15–150 min) brain tissues. Three and four sets of animals were used for studying histone levels in the hippocampus and frontal cortex, respectively. The immunoreactive densities of equally loaded lanes on the membranes were quantified and the samples were normalized to internal (GAPDH) controls. Data are presented as mean % of control ± SEM from three to four separate experiments. Representative Western blots are shown below the graphs. Statistical analyses were performed using GraphPad Prism for Windows (v. 9.4.0). Differences were calculated using an unpaired two-tailed Student’s t-test. Asterisks denote statistical significances: * p < 0.05; ** p < 0.01, *** p < 0.001.
Confocal microscopy localized the immunosignals of unmodified H3 and K3K9me3 primarily in heterochromatic regions, labeled with the fluorescent DNA intercalator DAPI, in all major cell types in the frontal cortex (Figure 2, Figure 3 and Figure 4) and hippocampus (data not shown) of the control animals: oligodendrocytes (Figure 2A–H), astrocytes (Figure 2I–P), neurons (Figure 3A–H), and microglia (Figure 3I–P). Similarly, for all major cell types analyzed in the frontal cortex, the nuclear distribution of unmodified H3 was more homogeneous (Figure 4A–D), while the H3K9me3 immunolabel was clustered as puncta (arrows in Figure 4E) and was predominantly found at the chromocenters of the neuronal nuclei (Figure 4E–H). The intensity of the DAPI stain was typically localized in a few dense chromocenters and in the marginal heterochromatin (arrows in Figure 4F). Based on NeuN immunofluorescence, the majority of cells were neurons in the adult brain tissue (Figure 3D–H and Figure 4D–H).
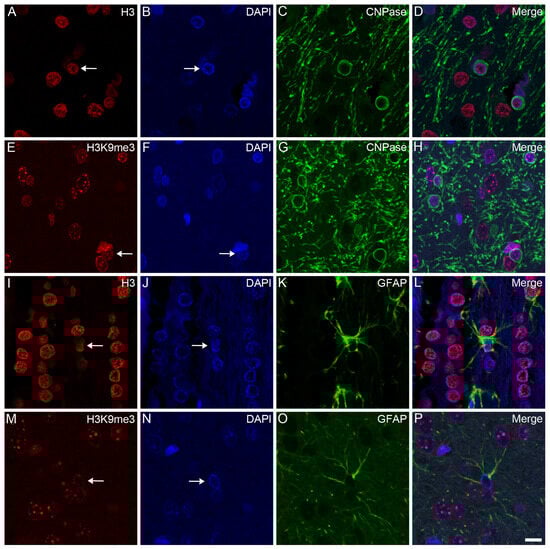
Figure 2.
Immunohistochemical localization of H3 and H3K9me3 in oligodendrocytes and astrocytes in the frontal cortex of control rats. The immunolabeled sections were examined with a confocal laser scanning microscope, as described in Section 4. Oligodendrocytes and astrocytes were labeled with anti-CNPase (C,G) and anti-GFAP (K,O) antibodies, respectively. The tissue sections were also stained with an anti-H3 (A,I) or anti-H3K9me3 (E,M) antibody and counterstained with DAPI (B,F,J,N). The merged images (D,H,L,P) show the distributions of H3 (D,L) and H3K9me3 (H,P) relative to the heterochromatic foci labeled with DAPI. H3 and H3K9me3 distributed diffusely in oligodendrocytes (arrows in (A,E)) and astrocytes (arrows in (I,M)), where the immunolabel was accompanied by a typically marginal heterochromatin (arrows in (B,F,J,N)). Scale bar in (P): 10 μm.
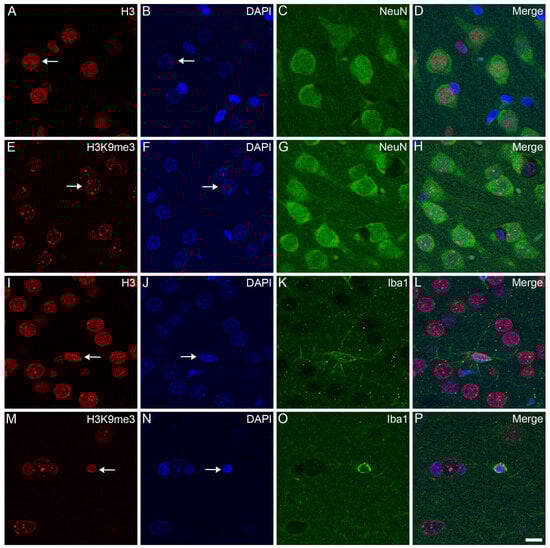
Figure 3.
Immunohistochemical localization of H3 and H3K9me3 in neurons and microglia in the frontal cortex of control rats. The immunolabeled sections were examined with a confocal laser scanning microscope, as described in Section 4. Neurons and microglia were labeled with anti-NeuN (C,G) and anti-Iba1 (K,O) antibodies, respectively. The tissue sections were also stained with an anti-H3 (A,I) or anti-H3K9me3 (E,M) antibody and counterstained with DAPI (B,F,J,N). The merged images (D,H,L,P) show the distributions of H3 (D,L) and H3K9me3 (H,P) relative to the heterochromatic foci labeled with DAPI. Note that while the immunolabel for H3 in the neurons (arrow in (A)) and microglia (arrow in (I)) is diffuse, the signal for H3K9me3 in the neurons (arrow in (E)) and microglia (arrow in (M)) is more puncta-like. While the chromatin shows weak DAPI staining in the neurons (arrows in (B,F)), its stains are stronger and more heterochromatic in the microglia (arrows in (J,N)). Scale bar in (P): 10 μm.
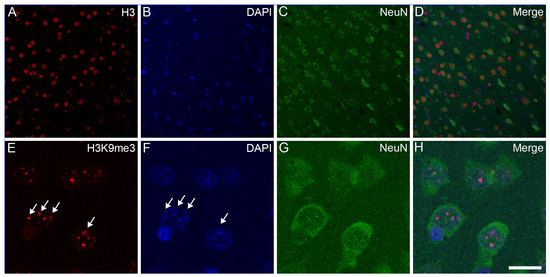
Figure 4.
Subnuclear localization of H3 and H3K9me3 immunosignals in neurons in the frontal cortex of control rats. The immunolabeled sections were examined with a confocal laser scanning microscope, as described in Section 4. The neurons were labeled with an anti-NeuN antibody (C,G) together with either an anti-H3 (A) or anti-H3K9me3 (E) antibody, and counterstained with DAPI (B,F). The merged images (D,H) show H3 and H3K9me3 distributions, respectively, relative to DAPI-labeled heterochromatic foci. Several intense clusters of H3K9me3 marks (arrows in (E)) are visible in most neuronal nuclei (H). Note that H3K9me3 immunoreactivity in the NeuN-labeled neurons is localized predominantly to transcriptionally inactive heterochromatin that overlap with DAPI-labeled heterochromatin (arrows in (E,F)). Scale bar in (H): 20 μm.
3. Discussion
Postmortem brain tissue is invaluable for the study of disorders of the human nervous system. After autopsy, brain samples must be studied immediately or preserved for later diagnosis that could include molecular biological/proteomic work. However, premortem and postmortem factors can interfere with molecular biology studies, and erroneous conclusions might be drawn because of the disregard of possible sources of pitfalls and artifacts [16,34]. For example, a recent study showed that even a brief (20 min) general anesthesia promoted the hypermethylation of certain genes in the brain [35]. Postmortem variables include the environment after death, storage temperature, time between death and autopsy (postmortem delay), and preservation method [34].
There are several studies that aim to study ultrastructural, biochemical, molecular biological, gene expression, etc., changes in the nervous system as a function of time after death. For example, a number of in vivo and in vitro studies have examined ultrastructural changes in organelles such as the mitochondria and endoplasmic reticulum [36,37,38,39]. In many cases, significant changes could be detected as a consequence of the hypoxic tissue environment [38,40,41,42]. For example, rats kept under mild hypoxic conditions for a short period of time (16% O2 environment for 60 min) exhibited an increase in certain interneuron populations showing early signs of neurodegeneration, detected by Gallyas-type silver impregnation [43], in different parts and layers of the hippocampus compared to normoxic conditions (21% O2) [40]. Most of the compacted silver-impregnated inhibitory neurons were also immunopositive for somatostatin. Ultrastructural changes associated with such silver-impregnated dark neurons as early forms of neurodegeneration have been described in detail [43].
In another study, neurohypophyseal pituicytes and neurosecretory axons were ultrastructurally examined after experimentally induced clinical death lasting 15 min [39]. Hyperactive forms of pituicytes rich in subcellular organelles, including lysosomes, as well as hypoactive forms of cells scarce in organelles but containing numerous electron-lucent vacuoles were observed in neurohypophysis after the hypoxic period. Hypoxia alters not only cellular characteristics but also biochemical characteristics. For example, hypobaric (mimicking an altitude of 9000 m, where air pressure = 30.7 kPa, pO2 = 6.4 kPa), short-term hypoxia (30 min) increased lipid peroxide formation in different parts of developing and adult rat brains [44].
In vitro studies are also used to study hypoxic or anoxic conditions. For instance, an electron microscopic examination of organotypic cultures of the rat hippocampus, exposed to 10 and 20 min anoxic insults, revealed some morphological characteristics typical of both necrotic and apoptotic neuronal cell death: for example, organelle swelling and nuclear chromatin condensation, respectively [41]. In another study, using primary microglial cell culture (BV-2), short-term hypoxia (30 min) significantly increased the expression of a subset of pro-inflammatory (tumor necrosis factor α, interleukin 1β) and oxidative stress-related (hypoxia-inducible factor 1α) genes [45].
In one human study, the astroglial calcium-binding protein S-100, an early and sensitive marker of hypoxic brain damage and outcome of cardiac arrest in humans, was studied [46]. In 66 patients who underwent cardiopulmonary resuscitation after non-traumatic cardiac arrest, blood samples were drawn immediately after; 15, 30, 45, and 60 min after; 2, 8, 24, 48, and 72 h after; and 7 days after the initiation of cardiopulmonary resuscitation. They found that maximum levels of S-100 within 2 h after cardiac arrest were significantly higher in patients with documented brain damage than in patients without brain damage. Furthermore, significant differences between these two groups were observed from 30 min to 7 days after cardiac arrest. This study concluded that S-100 was a reliable early marker of brain damage and an outcome of hypoxia caused by cardiac arrest [46].
Postmortem delay also affects epigenetic modifications [14]. Accordingly, Jarmasz et al. [19] showed that a postmortem delay of ≤24 h in brain tissue from pigs and mice had adverse effects on some histone acetylation marks; when several histone acetylation marks were tested in a human brain microarray, they were found to be relatively stable for up to 96 h. Therefore, special care must be taken to consider these circumstances when dealing with postmortem brain tissue from humans for research, as not all samples from such tissues are equally suitable for molecular biology studies.
Some epigenetic markers are associated with brain dysfunction and therefore could be important diagnostic markers. For example, one study found that a histone methyltransferase inhibitor decreased hippocampal H3K9me3, a site of lysine trimethylation, which is commonly involved in gene silencing, concomitantly improving performance in a complex spatial environment learning task in aged mice [47]. However, abnormal heterochromatin remodeling by H3K9me3 was recently shown to lead to down-regulation of genes related to synaptic function, suggesting that epigenetic alteration by H3K9me3 is associated with synaptic pathology seen in the sporadic form of Alzheimer’s disease [48]. H3K9me3 levels are negatively correlated with memory, since high levels have been measured in the hippocampus of old male mice; a varying pattern of H3K9me3 expression was also observed in different subregions of the aging hippocampus [49]. Furthermore, while they were increased by acute stress, chronic stress decreased H3K9me3 patterns in the dentate gyrus and CA1 region of the hippocampus, indicating a relatively rapid regionally specific change in methylation mechanisms prior to death [50]. Therefore, not only age-related but stress-related differences could influence neuronal epigenetic mark levels. However, the possible diagnostic value of these epigenetic alterations could rapidly decrease when there is a substantial postmortem delay.
We demonstrated a brain region-dependent distribution of H3K9me3 marks that change as a function of postmortem delay. We also showed that as the H3K9me3 marks changed, unmodified H3 patterns reciprocally changed in both tissues in a time-dependent manner: as H3K9me3 marks increased, unmodified H3 histones decreased in the frontal cortex, while the opposite direction of change was observed in the hippocampus. As the degree of conversion between histone types was different, we speculate that this could be due to different activities of epigenetic readers, writers, and erasers in different subregions of the brain. Most H3K9me3 marks were in heterochromatic regions of the nucleus, consistent with previous studies that placed this immunolabel on late-replicating pericentric heterochromatin in mouse cells and at sites of DAPI-dense intranuclear heterochromatin in human and hamster cells [51]. This intranuclear localization supports the inhibitory role that these marks play during transcription. Neurons are the dominant cell type in the adult rat brain, comprising about 60% of the total number of cells [52]. Therefore, due to their abundance, they probably contribute the most to the postmortem delay-related distribution of H3 and H3K9me3 seen in the rat frontal cortex and hippocampus.
Histone demethylases are epigenetic erasers that remove methyl groups from modified histones, thus activating or suppressing gene transcription [53,54]. Histone demethylases such as the Jumonji domain-containing protein 2B (JMJD2B) or lysine-specific demethylase 1 (LSD1) remove methylation marks on lysine 9 in histone H3 (H3K9me2/3, H3K4me1/2, or H3K9me1/2) and work as transcription activators [55,56]. We theorize that histone demethylase activity is still preserved and enzymes such as JMJD2B and LSD1 are still capable of converting trimethylated, dimethylated, and monomethylated H3K9 marks during a prolonged postmortem delay. In fact, Lu et al. [57] demonstrated that hypoxic stress decreased H3K4 methylation, another target of LSD1 [58]; hypoxia is often present around the time of death and could therefore precipitate the demethylation of lysine sites, followed by the accumulation of unmodified H3. It should be noted that (1) the antibody we used to detect H3K9me3 did not recognize mono- or dimethylated forms at this site, and (2) we did not have antibodies to detect mono- and dimethylated forms of H3K9; so, we were unable to quantitatively analyze how different demethylation processes increased the amount of unmodified H3 during postmortem delay.
In summary, we demonstrated time-dependent and opposite alterations of histone patterns in two regions of the brain as functions of postmortem delay. When evaluating potential chromatin stress responses, thorough documentation of all possible regulatory effects on epigenetic marks, such as vital statistics, premortem clinical diagnoses (trauma, medication, infection, inflammation, stress circumstances, substance abuse, etc.), as well as postmortem delay and autopsy findings, should be available. We believe that our results contribute to a better understanding of the stability of epigenetic marks and may have diagnostic implications. Furthermore, our results show the importance of postmortem delay in analyzing gene regulatory factors, such as post-translational histone modifications.
4. Materials and Methods
4.1. Animal Handling and Establishment of Postmortem Delay
We carried out all animal experiments in strict compliance with the European Council Directive (86/609/EEC) and the EC regulations (O.J. of EC No. L 358/1, 18/12/1986) regarding the care and use of laboratory animals for experimental procedures and followed the relevant requirements of Hungarian and local legislation. The experimental protocols presented in this study were approved by the Institutional Animal Welfare Committee of the University of Szeged (II./1131/2018). Adult female Sprague Dawley rats (190–210 g) were kept in standard housing conditions and fed ad libitum with regular laboratory food. After the animals were decapitated and the heads were kept at room temperature (RT) for different time periods to provide different postmortem delays (0, 15, 30, 60, 90, 120, and 150 min), the brains were removed and the frontal cortex and hippocampus were dissected for further analysis. For Western blot analysis, 3 sets of animals that each underwent different postmortem delays were used for the study of hippocampal histone H3 and H3K9me3 levels, while 4 sets of rats were used for the analysis of H3 and H3K9me3 levels in the frontal cortex. For fluorescent immunohistochemistry, tissue samples from the frontal cortices of control animals were processed to provide representative light microscopic images to demonstrate the tissue cytoarchitecture and immunohistochemical distribution of the cell-specific and histone immunolabels.
4.2. Histology
The brains were removed, fixed via immersion in 0.05 M phosphate-buffered saline (PBS; pH 7.4 at 4 °C) containing 4% formaldehyde, and then embedded in paraffin for immunohistochemistry. Paraffin-embedded sections (6 µm thick) were cut on a microtome (Leica RM2235; Leica Mikrosysteme Vertrieb GmbH, Wetzlar, Germany), mounted on glass microscope slides coated with (3-aminopropyl)triethoxysilane (Menzel, Darmstadt, Germany), and used for confocal immunohistochemistry.
4.3. Antibodies
The primary and secondary antibodies used for the confocal immunohistochemistry and Western blot analyses are listed in Table 1. We used antibodies for cell-specific markers to detect neurons (anti-neuronal nuclei protein; anti-NeuN), astrocytes (anti-glial fibrillary acidic protein; anti-GFAP), oligodendrocytes (anti-2′,3′-cyclic nucleotide 3′-phosphodiesterase; anti-CNPase), and microglia (anti-ionized calcium-binding adaptor molecule 1; anti-Iba1). Furthermore, we used antibodies against the unmodified core histone H3 protein and its PTM at a lysine site, H3K9me3. An antibody raised against the enzyme glyceraldehyde 3-phosphate dehydrogenase (anti-GAPDH) was used as an internal control in the Western blot experiments.

Table 1.
Antibodies used in Western blot analysis and confocal immunohistochemistry *.
4.4. Western Blot Analysis
Brain samples (frontal cortex and hippocampus) from the adult rats were dissected at each time point, homogenized in a 50 mM Tris–HCl (pH 7.5 at 4 °C) solution containing 150 mM NaCl, 1 μg/mL pepstatin, 2 μg/mL leupeptin, 2 mM phenylmethylsulfonyl fluoride, and 2 mM EDTA. The homogenate was centrifuged at 10,000× g for 10 min. The supernatant was aliquoted and the pellet was homogenized in a 50 mM Tris–HCl (pH 7.5 at 4 °C) solution containing 150 mM NaCl, 0.1% Nonidet P40, 0.1% cholic acid, 1 μg/mL pepstatin, 2 μg/mL leupeptin, 2 mM phenylmethylsulfonyl fluoride, and 2 mM EDTA. Protein concentration was determined using the method of Lowry et al. [59]. For Western blot analysis, 10–15 μg of proteins was separated on a sodium dodecyl sulfate/polyacrylamide gel (4–12% stacking gel/resolving gel). After being separated, the proteins were transferred to Hybond-ECL nitrocellulose membranes (Amersham Biosciences, Little Chalfont, Buckinghamshire, England), the membranes were blocked for 1 h in 5% non-fat dry milk in Tris-buffered saline (TBS) containing 0.1% Tween-20 (to prevent nonspecific antibody binding), and incubated overnight with one of the appropriate primary antibodies (Table 1), as well as with that of the internal control (mouse anti-GAPDH monoclonal antibody). The membranes were subjected to 5 rinses in 0.1% TBS–Tween-20, then incubated for 1 h with secondary antibodies conjugated to peroxidase, and washed three times as above. We used the enhanced chemiluminescence method (ECL Plus Western blot detection reagents; Amersham Biosciences) to visualize immunoreactive bands according to the manufacturer’s protocol. The exposure time and development were optimized for each antibody.
4.5. Confocal Immunohistochemistry
Immunohistochemistry was performed as previously described [13]. Paraffin-embedded tissue sections were deparaffinized, rehydrated, and placed in a Coplin jar filled with 0.01 M citrate buffer (pH 6.0) containing 0.05% Tween-20 and then heated at 95 °C for 20 min. The tissue sections were washed three times for 10 min, each in 0.05 M PBS solution containing 0.05% Tween-20. To prevent nonspecific antibody binding to the tissue, the sections were blocked in a 0.05 M PBS solution containing 0.05% Tween-20 and 5% normal goat serum (NGS) for 1 h at RT. The tissue sections were then incubated with primary antibodies in a 0.05 M PBS solution containing 0.05% Tween-20 and 5% NGS overnight at 4 °C. After extensive washing (4 × 10 min in 0.05 M PBS containing 0.05% Tween-20), the primary antibodies were labeled with secondary antibodies conjugated to one of the photostable fluorescent dyes (Alexa 488 or Alexa 568; Invitrogen, Carlsbad, CA, USA) in a blocking solution for 3 h at RT (for final dilutions, see Table 1). After 4 × 10 min rinses in 0.05 M PBS containing 0.05% Tween-20, cell nuclei were stained with a 2-[4-(aminoiminomethyl)phenyl]-1H-indole-6-carboximidamide hydrochloride solution (DAPI; ThermoFisher Scientific, Waltham, MA, USA). Immunolabeled tissue sections were examined with a Leica Stellaris DLS laser-scanning super-resolution confocal microscope (Leica Microsystems, Wetzlar, Germany). Digital images (1024 × 1024 pixels) were captured using the following confocal microscope configuration: objective lens, UPLSAPO 60×; numerical aperture, 1.35; sampling speed, 4 μs/pixel; optical zoom, 2×; scanning mode, sequential unidirectional. The excitation wavelengths were as follows: 405 nm (for DAPI), 488 nm (for Alexa Fluor 488), and 543 nm (for Alexa Fluor 568).
4.6. Image and Statistical Analyses
Digital grayscale images of the Western blots were acquired by scanning autoradiographic films with a 24-bit desktop scanner (Epson Perfection V750 PRO; Seiko Epson Corp., Suwa, Nagano, Japan). The scanned images were captured at a resolution of 600 × 600 dots per inch and processed in identical settings to allow comparisons of the Western blots of different samples. Bands were analyzed using the computer program ImageJ (version 1.47; developed at the US National Institutes of Health [60], available at https://imagej.net/Downloads, accessed on 10 July 2013). The mean values of the equally loaded lanes were quantified as follows: the background was subtracted, the data were normalized to the internal GAPDH load controls, and the data were expressed as a % of the control values. All statistical analyses were performed with GraphPad Prism for Windows software (version 9.4.0; GraphPad Software, San Diego, CA, USA). Data were presented as mean % of control ± standard error of the mean (SEM) of at least three immunoblots, each representing an independent experiment. Statistical differences were calculated using an unpaired two-tailed Student’s t-test for the Western blots. A p value of <0.05 was considered significant.
Author Contributions
K.G. conceived and designed the experiments; K.D., N.L. and K.N. performed and analyzed the experiments; K.G. contributed reagents/materials/analysis tools; K.D. and K.G. wrote the paper; K.G. edited the paper. All authors have read and agreed to the published version of the manuscript.
Funding
This work was supported by a grant from the Ministry of National Resources (GINOP 2.3.2-15-2016-00030 and 2.3.2-15-2016-00034) through the European Union Cohesion Fund. The funders had no role in the study’s design, data collection, or analyses; in the decision to publish the results; or in the preparation of the manuscript. At the time of the experiments, K.D. and N.L. were Ph.D. students, partly supported by the Doctoral School of Theoretical Medicine, Faculty of Medicine, University of Szeged.
Institutional Review Board Statement
We followed all applicable international, national, and/or institutional guidelines for the care and use of animals. The experimental procedures were carried out in strict compliance with the European Communities Council Directive (86/609/EEC) and followed the requirements of Hungarian and local legislation (XXVIII/1998 and 243/1998) and university guidelines regarding the care and use of laboratory animals. The experimental protocols were approved by the Institutional Animal Welfare Committee of the University of Szeged (II./1131/2018; date of approval: 30 May 2018).
Informed Consent Statement
Not applicable.
Data Availability Statement
All data are contained within the article.
Acknowledgments
The authors thank the Hungarian Center of Excellence for Molecular Medicine, University of Szeged, for providing the confocal microscope. The authors also thank Edina Ratkai for her excellent technical assistance.
Conflicts of Interest
The authors declare that they have no conflicts of interest.
Abbreviations
| CNPase | 2′,3′-cyclic nucleotide 3′-phosphodiesterase (EC 3.1.4.37) |
| DAPI | 2-[4-(aminoiminomethyl)phenyl]-1H-indole-6-carboximidamide hydrochloride |
| GAPDH | glyceraldehyde 3-phosphate dehydrogenase (EC 1.2.1.12) |
| GFAP | glial fibrillary acidic protein |
| H | histone |
| H3K | histone Lys modification |
| Iba1 | ionized calcium-binding adaptor molecule 1 |
| IgG | immunoglobulin G |
| NeuN | neuronal nuclei protein (hexaribonucleotide-binding protein-3 |
| PBS | phosphate-buffered saline |
| PTM | post-translational modification |
| RT | room temperature |
| SEM | standard error of the mean |
| TBS | Tris-buffered saline |
| WB | Western blot |
References
- Berger, S.L.; Kouzarides, T.; Shiekhattar, R.; Shilatifard, A. An operational definition of epigenetics. Genes Dev. 2009, 23, 781–783. [Google Scholar] [CrossRef] [PubMed]
- Kouzarides, T. Chromatin modifications and their function. Cell 2007, 128, 693–705. [Google Scholar] [CrossRef] [PubMed]
- Roidl, D.; Hacker, C. Histone methylation during neural development. Cell Tissue Res. 2014, 356, 539–552. [Google Scholar] [CrossRef] [PubMed]
- Samudyata; Castelo-Branco, G.; Liu, J. Epigenetic regulation of oligodendrocyte differentiation: From development to demyelinating disorders. Glia 2020, 68, 1619–1630. [Google Scholar] [CrossRef] [PubMed]
- Yao, B.; Christian, K.M.; He, C.; Jin, P.; Ming, G.L.; Song, H. Epigenetic mechanisms in neurogenesis. Nat. Rev. Neurosci. 2016, 17, 537–549. [Google Scholar] [CrossRef]
- Sen, P.; Shah, P.P.; Nativio, R.; Berger, S.L. Epigenetic mechanisms of longevity and aging. Cell 2016, 166, 822–839. [Google Scholar] [CrossRef] [PubMed]
- Zocher, S.; Toda, T. Epigenetic aging in adult neurogenesis. Hippocampus 2023, 33, 347–359. [Google Scholar] [CrossRef]
- Balan, S.; Iwayama, Y.; Ohnishi, T.; Fukuda, M.; Shirai, A.; Yamada, A.; Weirich, S.; Schuhmacher, M.K.; Dileep, K.V.; Endo, T.; et al. A loss of function variant in SUV39H2 identified in autism-spectrum disorder causes altered trimethylation of H3K9 and dysregulation of protocadherin β-cluster genes in the developing brain. Mol. Psychiatry 2021, 26, 7550–7559. [Google Scholar] [CrossRef] [PubMed]
- Basavarajappa, B.S.; Subbanna, S. Histone methylation regulation in neurodegenerative disorders. Int. J. Mol. Sci. 2021, 22, 4654. [Google Scholar] [CrossRef]
- Berson, A.; Nativio, R.; Berger, S.L.; Bonini, N.M. Epigenetic regulation in neurodegenerative diseases. Trends Neurosci. 2018, 41, 587–598. [Google Scholar] [CrossRef]
- Chase, K.A.; Gavin, D.P.; Guidotti, A.; Sharma, R.P. Histone methylation at H3K9: Evidence for a restrictive epigenome in schizophrenia. Schizophr. Res. 2013, 149, 15–20. [Google Scholar] [CrossRef] [PubMed]
- Kundakovic, M.; Jiang, Y.; Kavanagh, D.H.; Dincer, A.; Brown, L.; Pothula, V.; Zharovsky, E.; Park, R.; Jacobov, R.; Magro, I.; et al. Practical guidelines for high-resolution epigenomic profiling of nucleosomal histones in postmortem human brain tissue. Biol. Psychiatry 2017, 81, 162–170. [Google Scholar] [CrossRef] [PubMed]
- Dulka, K.; Szabo, M.; Lajkó, N.; Belecz, I.; Hoyk, Z.; Gulya, K. Epigenetic consequences of in utero exposure to rosuvastatin: Alteration of histone methylation patterns in newborn rat brains. Int. J. Mol. Sci. 2021, 22, 3412. [Google Scholar] [CrossRef] [PubMed]
- Pidsley, R.; Mill, J. Epigenetic studies of psychosis: Current findings, methodological approaches, and implications for postmortem research. Biol. Psychiatry 2011, 69, 146–156. [Google Scholar] [CrossRef]
- Bär, W.; Kratzer, A.; Mächler, M.; Schmid, W. Postmortem stability of DNA. Forensic Sci. Int. 1988, 39, 59–70. [Google Scholar] [CrossRef]
- Ferrer, I.; Martinez, A.; Boluda, S.; Parchi, P.; Barrachina, M. Brain banks: Benefits, limitations and cautions concerning the use of post-mortem brain tissue for molecular studies. Cell Tissue Bank. 2008, 9, 181–194. [Google Scholar] [CrossRef] [PubMed]
- Heng, Y.; Dubbelaar, M.L.; Marie, S.K.N.; Boddeke, E.W.G.M.; Eggen, B.J.L. The effects of postmortem delay on mouse and human microglia gene expression. Glia 2021, 69, 1053–1060. [Google Scholar] [CrossRef]
- Jarmasz, J.S.; Stirton, H.; Basalah, D.; Davie, J.R.; Clarren, S.K.; Astley, S.J.; Del Bigio, M.R. Global DNA methylation and histone posttranslational modifications in human and nonhuman primate brain in association with prenatal alcohol exposure. Alcohol. Clin. Exp. Res. 2019, 43, 1145–1162. [Google Scholar] [CrossRef]
- Jarmasz, J.S.; Stirton, H.; Davie, J.R.; Del Bigio, M.R. DNA methylation and histone post-translational modification stability in post-mortem brain tissue. Clin. Epigenet. 2019, 11, 5. [Google Scholar] [CrossRef]
- Sjöholm, L.K.; Ransome, Y.; Ekström, T.J.; Karlsson, O. Evaluation of post-mortem effects on global brain DNA methylation and hydroxymethylation. Basic Clin. Pharmacol. Toxicol. 2018, 122, 208–213. [Google Scholar] [CrossRef] [PubMed]
- Beliczai, Z.; Varszegi, S.; Gulyas, B.; Halldin, C.; Kasa, P.; Gulya, K. Immunohistoblot analysis on whole human hemispheres from normal and Alzheimer diseased brains. Neurochem. Internat. 2008, 53, 181–183. [Google Scholar] [CrossRef] [PubMed]
- Blair, J.A.; Wang, C.; Hernandez, D.; Siedlak, S.L.; Rodgers, M.S.; Achar, R.K.; Fahmy, L.M.; Torres, S.L.; Petersen, R.B.; Zhu, X.; et al. Individual case analysis of postmortem interval time on brain tissue preservation. PLoS ONE 2016, 11, e0151615, Erratum in PLoS ONE 2016, 11, e0157209. [Google Scholar] [CrossRef]
- Chia, D.J.; Rotwein, P. Defining the epigenetic actions of growth hormone: Acute chromatin changes accompany GH-activated gene transcription. Mol. Endocrinol. 2010, 24, 2038–2049. [Google Scholar] [CrossRef] [PubMed]
- Chia, D.J.; Young, J.J.; Mertens, A.R.; Rotwein, P. Distinct alterations in chromatin organization of the two IGF-I promoters precede growth hormone-induced activation of IGF-I gene transcription. Mol. Endocrinol. 2010, 24, 779–789. [Google Scholar] [CrossRef] [PubMed][Green Version]
- Koshi-Mano, K.; Mano, T.; Morishima, M.; Murayama, S.; Tamaoka, A.; Tsuji, S.; Toda, T.; Iwata, A. Neuron-specific analysis of histone modifications with post-mortem brains. Sci. Rep. 2020, 10, 3767. [Google Scholar] [CrossRef]
- Nagy, C.; Maheu, M.; Lopez, J.P.; Vaillancourt, K.; Cruceanu, C.; Gross, J.A.; Arnovitz, M.; Mechawar, N.; Turecki, G. Effects of postmortem interval on biomolecule integrity in the brain. J. Neuropath. Exp. Neurol. 2015, 74, 459–469. [Google Scholar] [CrossRef] [PubMed]
- Biel, M.; Wascholowski, V.; Giannis, A. Epigenetics—An epicenter of gene regulation: Histones and histone-modifying enzymes. Angew. Chem. (Int. Ed. Engl.) 2005, 44, 3186–3216. [Google Scholar] [CrossRef] [PubMed]
- Greer, E.L.; Shi, Y. Histone methylation: A dynamic mark in health, disease and inheritance. Nat. Rev. Genet. 2012, 13, 343–357. [Google Scholar] [CrossRef] [PubMed]
- Rowe, E.M.; Xing, V.; Biggar, K.K. Lysine methylation: Implications in neurodegenerative disease. Brain Res. 2019, 1707, 164–171. [Google Scholar] [CrossRef] [PubMed]
- Trojer, P.; Reinberg, D. Histone lysine demethylases and their impact on epigenetics. Cell 2006, 125, 213–217. [Google Scholar] [CrossRef] [PubMed]
- Bannister, A.J.; Zegerman, P.; Partridge, J.F.; Miska, E.A.; Thomas, J.O.; Allshire, R.C.; Kouzarides, T. Selective recognition of methylated lysine 9 on histone H3 by the HP1 chromo domain. Nature 2001, 410, 120–124. [Google Scholar] [CrossRef] [PubMed]
- Wang, C.; Liu, X.; Gao, Y.; Yang, L.; Li, C.; Liu, W.; Chen, C.; Kou, X.; Zhao, Y.; Chen, J.; et al. Reprogramming of H3K9me3-dependent heterochromatin during mammalian embryo development. Nat. Cell Biol. 2018, 20, 620–631. [Google Scholar] [CrossRef] [PubMed]
- Saksouk, N.; Simboeck, E.; Déjardin, J. Constitutive heterochromatin formation and transcription in mammals. Epigenet. Chromatin 2015, 8, 3. [Google Scholar] [CrossRef]
- Tozzo, P.; Scrivano, S.; Sanavio, M.; Caenazzo, L. The role of DNA degradation in the estimation of post-mortem interval: A systematic review of the current literature. Int. J. Mol. Sci. 2020, 21, 3540. [Google Scholar] [CrossRef] [PubMed]
- Pekny, T.; Andersson, D.; Wilhelmsson, U.; Pekna, M.; Pekny, M. Short general anaesthesia induces prolonged changes in gene expression in the mouse hippocampus. Acta Anaesthesiol. Scand. 2014, 58, 1127–1133. [Google Scholar] [CrossRef] [PubMed]
- Ferri, K.F.; Kroemer, G. Organelle-specific initiation of cell death pathways. Nat. Cell Biol. 2001, 3, E255–E263. [Google Scholar] [CrossRef]
- Hadley, G.; Neuhaus, A.A.; Couch, Y.; Beard, D.J.; Adriaanse, B.A.; Vekrellis, K.; DeLuca, G.C.; Papadakis, M.; Sutherland, B.A.; Buchan, A.M. The role of the endoplasmic reticulum stress response following cerebral ischemia. Int. J. Stroke 2018, 13, 379–390. [Google Scholar] [CrossRef]
- Hayashi, T.; Abe, K. Ischemic neuronal cell death and organellae damage. Neurol. Res. 2004, 26, 827–834. [Google Scholar] [CrossRef] [PubMed]
- Loesch, A.; Majkowska, J. Ultrastructural features of the neurohypophysis of reanimated rat in connection with experimentally induced clinical death lasting 15 min. A case report. J. Hirnforsch. 1990, 31, 99–106. [Google Scholar] [PubMed]
- Hencz, A.; Magony, A.; Thomas, C.; Kovacs, K.; Szilagyi, G.; Pal, J.; Sik, A. Mild hypoxia-induced structural and functional changes of the hippocampal network. Front. Cell. Neurosci. 2023, 17, 1277375. [Google Scholar] [CrossRef] [PubMed]
- Nagańska, E.; Matyja, E. Ultrastructural characteristics of necrotic and apoptotic mode of neuronal cell death in a model of anoxia in vitro. Folia Neuropathol. 2001, 39, 129–139. [Google Scholar]
- Ziakova, K.; Kovalska, M.; Pilchova, I.; Dibdiakova, K.; Brodnanova, M.; Pokusa, M.; Kalenska, D.; Racay, P. Involvement of proteasomal and endoplasmic reticulum stress in neurodegeneration after global brain ischemia. Mol. Neurobiol. 2023, 60, 6316–6329. [Google Scholar] [CrossRef] [PubMed]
- Gallyas, F.; Farkas, O.; Mázló, M. Gel-to-gel phase transition may occur in mammalian cells: Mechanism of formation of “dark” (compacted) neurons. Biol. Cell 2004, 96, 313–324. [Google Scholar] [CrossRef] [PubMed]
- Rauchová, H.; Vokurková, M.; Koudelová, J. Hypoxia-induced lipid peroxidation in the brain during postnatal ontogenesis. Physiol. Res. 2012, 61 (Suppl. S1), S89–S101. [Google Scholar] [CrossRef]
- Habib, P.; Slowik, A.; Zendedel, A.; Johann, S.; Dang, J.; Beyer, C. Regulation of hypoxia-induced inflammatory responses and M1-M2 phenotype switch of primary rat microglia by sex steroids. J. Mol. Neurosci. 2014, 52, 277–285. [Google Scholar] [CrossRef] [PubMed]
- Böttiger, B.W.; Möbes, S.; Glätzer, R.; Bauer, H.; Gries, A.; Bärtsch, P.; Motsch, J.; Martin, E. Astroglial protein S-100 is an early and sensitive marker of hypoxic brain damage and outcome after cardiac arrest in humans. Circulation 2001, 103, 2694–2698. [Google Scholar] [CrossRef] [PubMed]
- Snigdha, S.; Prieto, G.A.; Petrosyan, A.; Loertscher, B.M.; Dieskau, A.P.; Overman, L.E.; Cotman, C.W. H3K9me3 inhibition improves memory, promotes spine formation, and increases BDNF levels in the aged Hippocampus. J. Neurosci. 2016, 36, 3611–3622. [Google Scholar] [CrossRef] [PubMed]
- Lee, M.Y.; Lee, J.; Hyeon, S.J.; Cho, H.; Hwang, Y.J.; Shin, J.Y.; McKee, A.C.; Kowall, N.W.; Kim, J.I.; Stein, T.D.; et al. Epigenome signatures landscaped by histone H3K9me3 are associated with the synaptic dysfunction in Alzheimer’s disease. Aging Cell 2020, 19, e13153. [Google Scholar] [CrossRef] [PubMed]
- Kushwaha, A.; Thakur, M.K. Increase in hippocampal histone H3K9me3 is negatively correlated with memory in old male mice. Biogerontology 2020, 21, 175–189. [Google Scholar] [CrossRef] [PubMed]
- Hunter, R.G.; McCarthy, K.J.; Milne, T.A.; Pfaff, D.W.; McEwen, B.S. Regulation of hippocampal H3 histone methylation by acute and chronic stress. Proc. Natl. Acad. Sci. USA 2009, 106, 20912–20917. [Google Scholar] [CrossRef] [PubMed]
- Wu, R.; Terry, A.V.; Singh, P.B.; Gilbert, D.M. Differential subnuclear localization and replication timing of histone H3 lysine 9 methylation states. Mol. Biol. Cell 2005, 16, 2872–2881. [Google Scholar] [CrossRef] [PubMed]
- Bandeira, F.; Lent, R.; Herculano-Houzel, S. Changing numbers of neuronal and non-neuronal cells underlie postnatal brain growth in the rat. Proc. Natl. Acad. Sci. USA 2009, 106, 14108–14113. [Google Scholar] [CrossRef] [PubMed]
- Kim, J.H.; Jung, D.Y.; Kim, H.R.; Jung, M.H. Histone H3K9 Demethylase JMJD2B Plays a Role in LXRα-Dependent Lipogenesis. Int. J. Mol. Sci. 2020, 21, 8313. [Google Scholar] [CrossRef] [PubMed]
- Klose, R.J.; Zhang, Y. Regulation of histone methylation by demethylimination and demethylation. Nat. Rev. Mol. Cell Biol. 2007, 8, 307–318. [Google Scholar] [CrossRef]
- Gu, F.; Lin, Y.; Wang, Z.; Wu, X.; Ye, Z.; Wang, Y.; Lan, H. Biological roles of LSD1 beyond its demethylase activity. Cell Mol. Life Sci. 2020, 77, 3341–3350. [Google Scholar] [CrossRef] [PubMed]
- Whetstine, J.R.; Nottke, A.; Lan, F.; Huarte, M.; Smolikov, S.; Chen, Z.; Spooner, E.; Li, E.; Zhang, G.; Colaiacovo, M.; et al. Reversal of histone lysine trimethylation by the JMJD2 family of histone demethylases. Cell 2006, 125, 467–481. [Google Scholar] [CrossRef]
- Lu, Y.; Wajapeyee, N.; Turker, M.S.; Glazer, P.M. Silencing of the DNA mismatch repair gene MLH1 induced by hypoxic stress in a pathway dependent on the histone demethylase LSD1. Cell Rep. 2014, 8, 501–513. [Google Scholar] [CrossRef]
- Kim, D.; Kim, K.I.; Baek, S.H. Roles of lysine-specific demethylase 1 (LSD1) in homeostasis and diseases. J. Biomed. Sci. 2021, 28, 41. [Google Scholar] [CrossRef]
- Lowry, O.H.; Rosebrough, N.J.; Farr, A.L.; Randall, R.J. Protein measurement with the Folin phenol reagent. J. Biol. Chem. 1951, 193, 265–275. [Google Scholar] [CrossRef] [PubMed]
- Schneider, C.A.; Rasband, W.S.; Eliceiri, K.W. NIH Image to ImageJ: 25 years of image analysis. Nat. Meth. 2012, 9, 671–675. [Google Scholar] [CrossRef] [PubMed]
Disclaimer/Publisher’s Note: The statements, opinions and data contained in all publications are solely those of the individual author(s) and contributor(s) and not of MDPI and/or the editor(s). MDPI and/or the editor(s) disclaim responsibility for any injury to people or property resulting from any ideas, methods, instructions or products referred to in the content. |
© 2024 by the authors. Licensee MDPI, Basel, Switzerland. This article is an open access article distributed under the terms and conditions of the Creative Commons Attribution (CC BY) license (https://creativecommons.org/licenses/by/4.0/).