1. Introduction
A range of insect pests are found in buildings where grain and grain-based products are processed and stored, such as flour mills, processing facilities, warehouses, and retail stores and infestations can cause large monetary costs each year in lost product [
1]. The presence of insects inside these structures can lead to infestation of grain and finished products which can contaminate the food or lead to infestation of food material that accumulates in the building structure creating unsanitary conditions that can lead to later product infestation. Managing these pests can be a challenge as these facilities are spatially complex, dynamic, and features can vary considerably among locations. A foundation of an effective pest management program is a good monitoring program. Information from monitoring programs can be used to evaluate effectiveness of prevention programs that include tactics such as sanitation and structural modification and determine when additional tactics such as fumigation may be needed [
2,
3,
4,
5,
6,
7]. Monitoring programs can also help with determining the source of insects and help with targeted responses. For example, insect migration can play a substantial role in recolonization following fumigation or sanitization [
6,
7,
8,
9]. To better assess the potential effects of pest management techniques, monitoring can be used to quantify areas where populations of these insect pests are increasing in number and may warrant further attention or treatment [
6,
10].
Each food facility location can have distinct spatial features, but it is important to find common approaches and general conclusions. One such approach is that at all facilities it is helpful to assess insect activity both indoors and outdoors, since patterns in insect captures helps us understand where there are significant insect reservoirs and potential for migrant insects to recolonize indoor areas following treatment. For example, at one food facility insect captures inside and outside of the building were correlated for
Trogoderma variabile Ballion, but not for
Plodia interpunctella (Hübner), and more
T. variabile were captured overall than
P. interpunctella [
9], but at another location, indoor and outdoor captures of
P. interpunctella were correlated [
11,
12]. Some patterns that have been found to be consistent at several different facilities include less insects outside of food patches, greater numbers on the outside or edges of food bulk, and higher captures near doors, windows and loading docks when outside activity is high [
8,
13,
14].
There have been many monitoring studies in food facilities and several have investigated factors such as the number of traps needed for monitoring insect pests as well as the economic cost to employing these traps, but they have tended to focus on only a few years of data or monitoring only part of a facility [
9,
11,
15,
16]. Together, these studies suggest a large amount of variation in insect capture among different species [
14] and locations [
8,
15,
17], highlighting the importance of targeted integrated pest management (IPM) plans based on specific conditions at a facility [
9,
10,
18,
19]. These studies often do not find good predictors of past trends based on factors such as temperature or consistent patterns of trap captures based on location, but these predictors may be stronger with longer-term datasets. Studies that evaluate pest population patterns over multiple years and under different environmental conditions may provide a more complete picture of the factors that contribute to the spatial and environmental differences in insect captures [
20]. In addition, multi-year comparisons will provide us information on the consistency of insect spatial distribution and aid in the development of IPM plans [
21,
22].
Spatial patterns of insects can be greatly influenced by landscape structure, with differences between indoors and outdoors being a major landscape feature [
8,
9]. Much of the long-term trapping data from stored product facilities is focused on
Tribolium castaneum (Herbst), which tend to be found primarily inside of facilities and are not as mobile as some of the other stored product pests such as
P. interpunctella or
T. variabile [
6,
7,
9,
23,
24]. Common features in a food facility such as doors, loading docks, and windows, can be used to connect interior and exterior sub-populations [
8,
10,
14,
25,
26]. Spatial analysis and contour mapping based on insect captures and then superimposed onto floorplans allows researchers to identify patterns in distribution and correlate features of the facility with locations of high numbers of insects [
10,
11,
20,
22,
27]. However, relationships between correlated environmental or landscape features at a trap location with consistently high or low insect captures are generally weak, which calls into question if these patterns can be meaningfully applied across facilities. Given the high level of short term and localized variation in captures [
19], long-term monitoring data sets may provide a mechanism to develop a deeper understanding of patterns of activity and how they might be impacted by management tactics, such as fumigation or sanitation, and environmental variables. Broad seasonal patterns in activity have been reported [
12,
15,
23,
28] and environmental variables can vary between inside and outside of a food facility. Both indoor and outdoor factors can influence immigration and emigration and tracking their influence can also be a valuable source of understanding insect infestation changes [
23]. However, environmental variables may not be the greatest factors influencing insect captures in part because factors such as grain movement, sanitation, or treatments have larger, quicker impacts on pest abundance than temperature or other seasonal changes [
6,
8].
Two stored product insect pests,
Plodia interpunctella and
Trogoderma variabile, are of particular interest because they are often captured in high numbers both in and around food facilities and show strong seasonal patterns in abundance. They have some important differences and provide two different life history and habitat colonization strategies in storage and milling facilities [
29,
30,
31].
Plodia interpunctella, Indianmeal moth, is a strong flier and a previous study suggested that
P. interpunctella captures inside buildings even after fumigations and colonization was mostly via infested product instead of immigration from outdoor populations [
32]. However, other research has pointed to immigration through open doors and other routes of entry as a common method for infestation [
8,
9,
14].
Trogoderma variabile, the warehouse beetle, has flying capabilities starting at 12–16 °C [
33] and can move significant distances within and outside of a facility [
9,
10]. It is also caught both inside and outside of milling and storage facilities [
8,
9,
12,
34]. Both species infest processed wheat as well as other stored product commodities and can be particularly destructive pests. These species also have commercially available pheromone lures and are commonly monitored using pheromone traps to assess populations inside and outside of mills and warehouses, although most published data are on relatively short-term time scales [
8,
9,
11,
12].
Here, we analyze 10 years of monitoring data, capturing over 345,000 P. interpunctella and 270,000 T. variabile in pheromone baited traps, by comparing trends with environmental variables and analyzing spatial variability in captures. Monitoring was conducted at a wheat flour mill and with these data we assessed the relationship between insect captures and environmental variables such as temperature and precipitation. We also tracked insect capture consistency at different spatial scales and evaluated the impact of structural fumigation events on insect populations. In addition, we evaluated if there are threshold levels based on temperature or insect capture numbers that can predict risk thresholds of future population levels of insects within the flour mill.
2. Materials and Methods
Monitoring of
T. variabile and
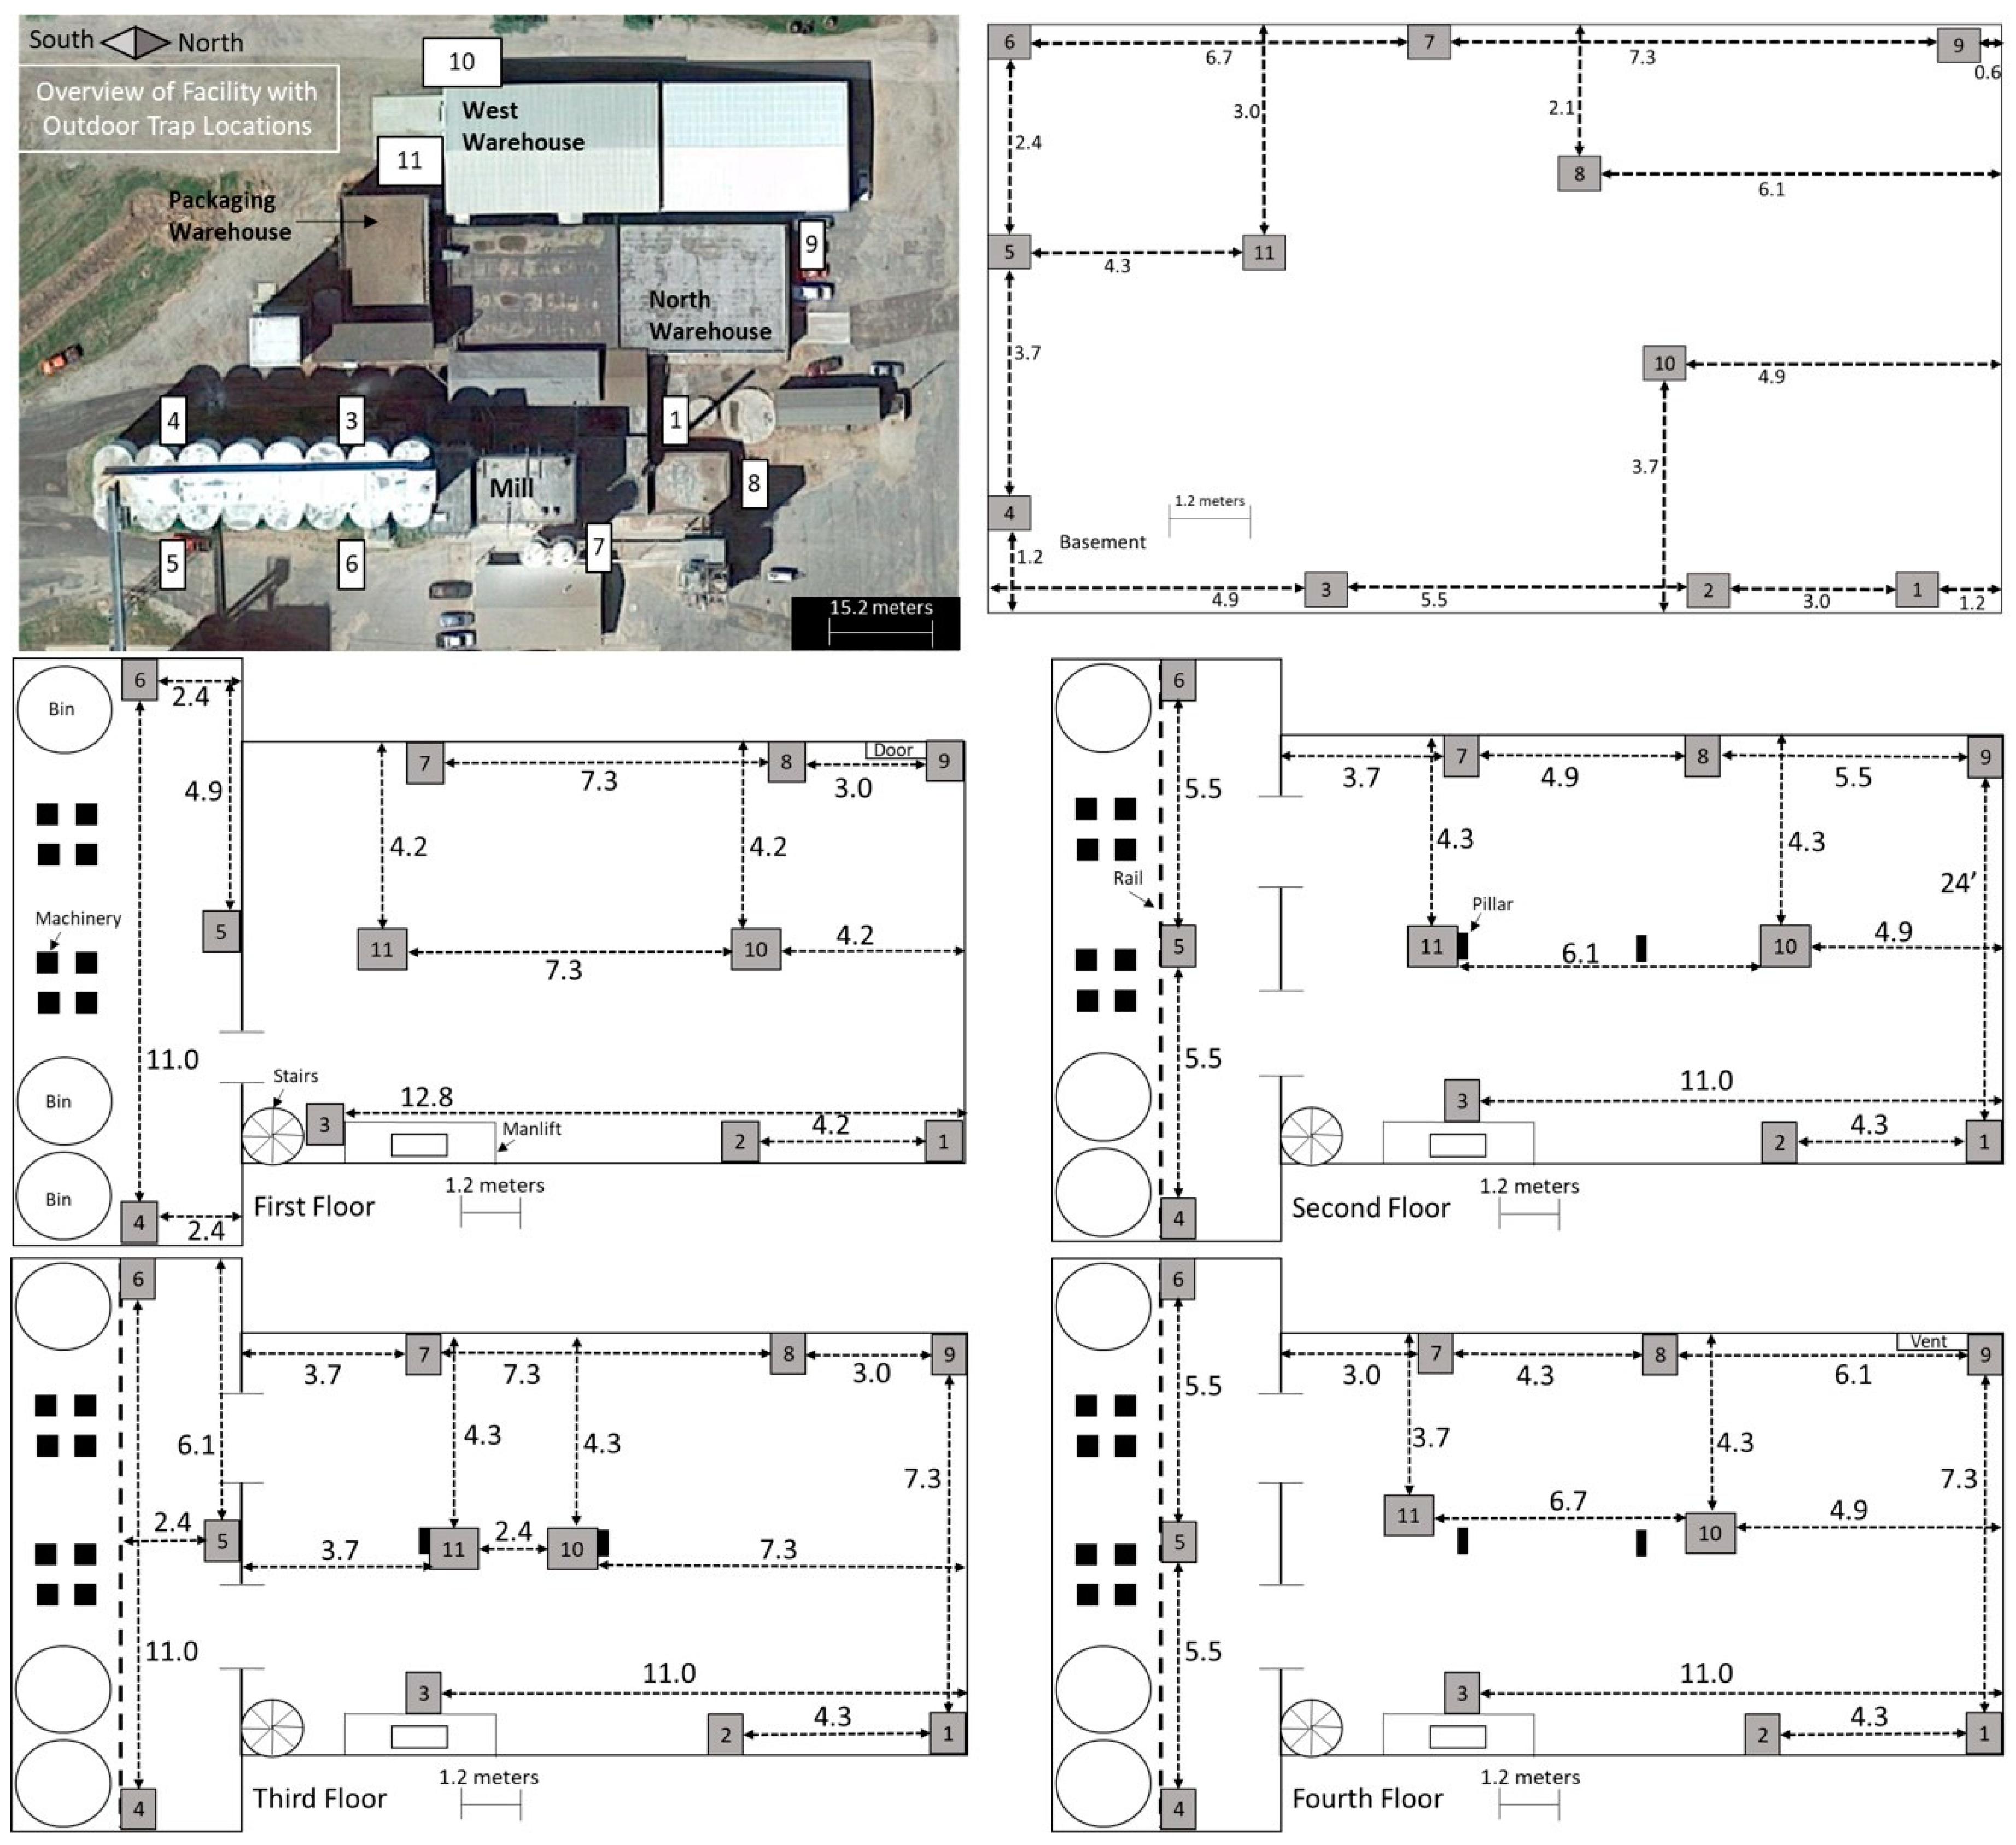
P. interpunctella was conducted from June 2001 to February 2012 at a flour mill in central USA (
Figure 1). The mill consists of five floors, including the basement floor. There is an open rectangular main area on each floor and a wider open area that spans floors 1 through 4 on the south end of the mill and contains 3 bins and 8 elevator legs. The two bins on the east are tempering bins and the west bin is for raw materials. Each floor had a similar floor plan but differed in the arrangement of structural features such as milling equipment. Each floor contains two pillars in the center of the main area and floors 1 through 4 contain stairs and a belt manlift in the southeast corner. Floor 1 has a door in the northwest corner and floor 4 has a vent to the roof in the northwest corner. Three warehouses were also monitored; they are connected to the mill with one on the north end of the facility cluster, one to the west, and a packaging warehouse to the south. Warehouses had a combination of man and overhead doors to the outside and connected to the mill.
Insects were monitored indoors using diamond traps for
P. interpunctella and Dome traps for
T. variabile (Trécé, Adair OK) and outside using delta traps (Scentry, Billings MT) for both species. Diamond traps and delta traps had a sticky surface to capture insects and traps were baited with
P. interpunctella and
T. variabile pheromones (Trécé, Adair OK). Dome traps consisted of a ramp into a deep well where insects could not exit. Diamond traps and Dome traps were placed in the same locations within the mill and warehouses. In the mill there were 11 traps per floor, with traps placed in the same locations throughout the data collection period (
Figure 1). In the warehouses there were four traps total in each warehouse, each placed in a corner of the square buildings. There were 8 outdoor traps for the first three years of data collection; trap 2 was then discontinued and traps 9, 10, and 11 were added in 2004 (
Figure 1). Traps were collected and replaced approximately every 14 days and the number of insects were counted; lures were replaced every 8 weeks. Outdoor traps were not deployed during winter months from December to March (2002–2003, 2003–2004, 2004–2005, and 2009–2010), December through April (2005–2006), November through March (2006–2007 and 2007–2008), and November through April (2008–2009 and 2010–2011).
Environmental data including maximum and minimum temperature, precipitation (inches), snow fall, and snow depth (inches) from the closest weather station were downloaded through the National Oceanic and Atmospheric Administration, National Centers for Environmental Information (ncdc.noaa.gov). Data were collected for every day from June 2001 to February 2012. For reporting here, degrees Fahrenheit (°F) was converted to degrees Celsius (°C). Trap capture data were used based on the date the trap was removed from inside or outside the mill, which usually standardizes to a 2-week trap capture period. To calculate the change from one monitoring period to the next, differences were calculated by subtracting captures at t from captures at t + 1, where t is the date trap was removed. Monthly or yearly data when reported or analyzed were averaged based on end date as well. To assess how our suite of variables influences insect capture we assessed the influence of our environmental factors (temperature, precipitation, and snow), location (mill floor, warehouse or outside; referred to as location for the remainder of the manuscript), season (warm or cool), and trap location (referred to as trap for the manuscript) we used stepwise models with proc phreg in SAS (v. 9.4, SAS Institute, Cary, NC, USA). Variables included are: year trap was deployed, precipitation, maximum temperature, minimum temperature, snow depth, location, season, and trap. We used a parameter of alpha = 0.15 for entry into the model and alpha = 0.05 for staying in the model.
Because time of year and date was influential in our model, we then assessed how season influences average insect captures. Seasons were divided as warm and cool periods based on Campbell et al. [
6], where warm is April through September and cool is October through March. We examined Pearson correlations between inside and outside data first for all seasons combined followed then by year and by season. We also calculated the rates of change for each season in each year by calculating the difference in insect capture from the current trapping period to the next trapping period and calculated the percentage change. We further examined the differences in rate of change by month instead of season.
Temperature was also influential in our model, so we assessed temperature for each species to determine when the difference in insect captures began to vary from zero. To evaluate how temperature impacts the increasing risk of insect captures in a trap, we calculated the difference in insect capture from the current trapping period to the next trapping period for each temperature range using only indoor trap data for all years; we wanted to focus on identifying temperatures that indicate a consistent change was happening in trap captures so changes in trap capture that were either 0 or 100% were removed. Using probnorm in SAS we calculated the Z-score probability that the absolute difference from the current trapping period to the next trapping period is greater than 0 at a given minimum or maximum temperature. We then calculated the frequency of observations for each temperature for both minimum and maximum temperatures and used a cut-off of greater than 10 observations and a 0.50 probability of the difference being greater than 0 to determine our temperature of increased insect capture. We also calculated this probability based on the month.
To examine whether trap locations had consistently high or consistently low numbers of insect captures, we calculated the yearly mean insect capture for all outdoor traps, all indoor traps, and for individual traps at each location (each floor or outdoors). We counted how many years a trap was among the highest three or lowest three average counts for all indoor traps, all outdoor traps, or individual traps at each location. We then statistically compared insect captures across years with Spearman rank correlations for each trap on a given floor. We focused on year-to-year correlations and counted how many significant correlations occurred from one year to the next year for each floor and trap to examine the consistency of insect captures for each trap on a given floor. Where there is any missing data, no correlation was calculated for those year-to-year comparisons. We then used
proc nlin to find parameters for the non-linear model comparing the average Spearman correlation for each trap to the mean insect captures for each species (Spearman correlation = θ
1*mean insect capture/(θ
2 + mean insect capture)). We used the Marquardt iterative method with starting parameters of θ
1 = 0.8248280 and θ
2 = 0 to 3.5592432 (iterated by a level of 0.2) for
P. interpunctella and θ
1 = 0.5450930 and θ
2 = 0 to 0.8140484 (iterated by 0.05) for
T. variabile. Comparisons are plotted with the default parameters of a Loess line and 0.95 confidence interval level, which uses a t-based approximation [
35].
The mill was treated by fumigation a total of 15 times over the course of the 10 years of data collection by commercial applicators following labeled rates. Sulfuryl fluoride was used on June 9, 2001; June 19, 2004; and June 11, 2005. Methyl bromide was used on July 13, 2002; November 16, 2002; June 28, 2003; August 23, 2003; September 4, 2004; November 12, 2005; November 4, 2006; November 3, 2007; November 15, 2008; December 19, 2009; December 10, 2010; and December 17, 2011. Methyl bromide has been shown to be effective at all life stage in
T. variabile [
36] and
P. interpunctella [
37]. The effect of fumigations on insect captures was tracked for each trap location both within and outside the mill. For each date of fumigation, we used the two pre-fumigation trapping period counts and two post-fumigation trapping counts (usually one month each) to compare the effect of fumigation on trap catches of
T. variabile and
P. interpunctella. We then compared pre- and post-fumigation counts using
proc glm in SAS with number of insects captured as the response variable and each pre- and post-fumigation group (date) and trap as main effects with trap as a random effect. Pairwise comparisons (contrasts) were used to track overall increases or decreases in insect capture between the pre- and post-fumigation periods. Percentage change from pre- to post-fumigation was also calculated to quantify the degree of change.
3. Results
A stepwise model was used to identify variables that potentially influence adult insect captures in traps. For
P. interpunctella, all variables except precipitation were entered in the model (
Table 1). The variables with the highest chi-square scores were location (i.e., mill floor, warehouse, or outside) (χ
2 = 2646.11) followed by minimum temperature and year (χ
2 = 2147.05 and χ
2 = 794.86, respectively). For
T. variabile, variables excluded from the model were maximum temperature, precipitation, snowfall, and corresponding trap locations on each floor within the mill (
Table 1). Location was again the variable with the highest Chi-square score (χ
2 = 2233.20) followed by minimum temperature and year (χ
2 = 480.64 and χ
2 = 52.50, respectively). Overall,
T. variabile had lower Chi-square scores for placement in the models, suggesting that these variables are less reliable predictors for
T. variabile than for
P. interpunctella.
3.1. Impact of Location on Insect Counts
Driving the stepwise model for both
P. interpunctella and
T. variabile was location. The combined indoor trap (warehouse and all floors of mill) captures were highly positively correlated to outside insect captures for both species; as outside insect captures increased, indoor traps also showed an increase in insect captures. Pearson product moment correlations between inside and outside insect captures were significant for all years and seasons for
P. interpunctella (R = 0.43–0.68,
p < 0.0001), except 2010 (R = 0.14,
p = 0.072), and significant for all years and seasons for
T. variabile (R = 0.29–0.75,
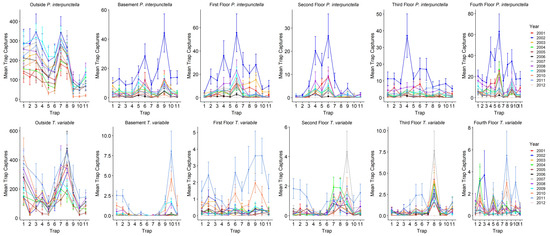
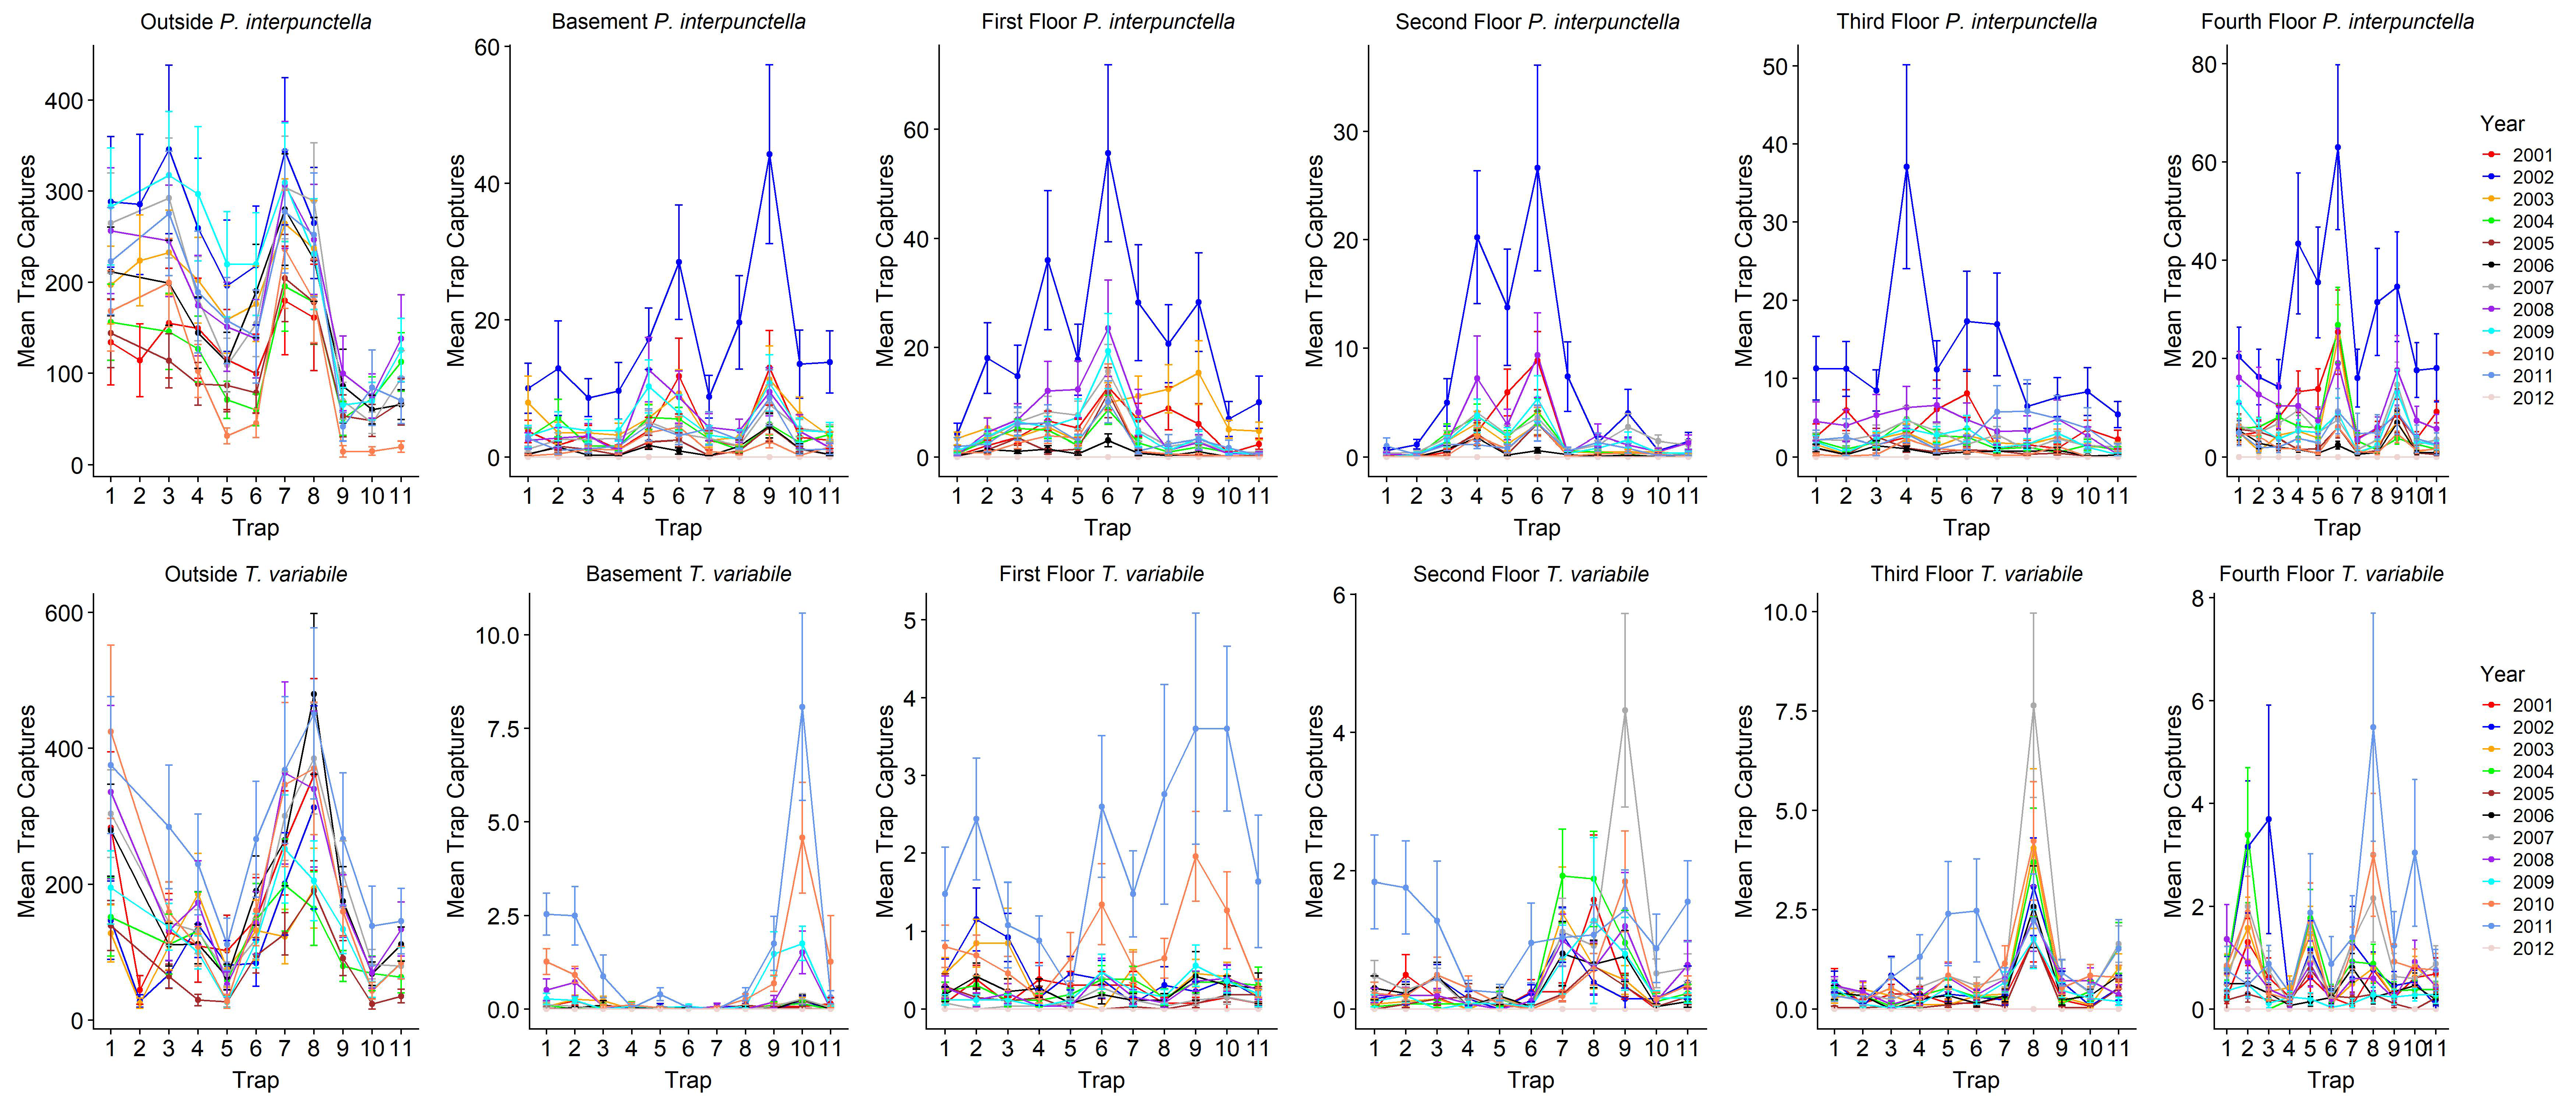
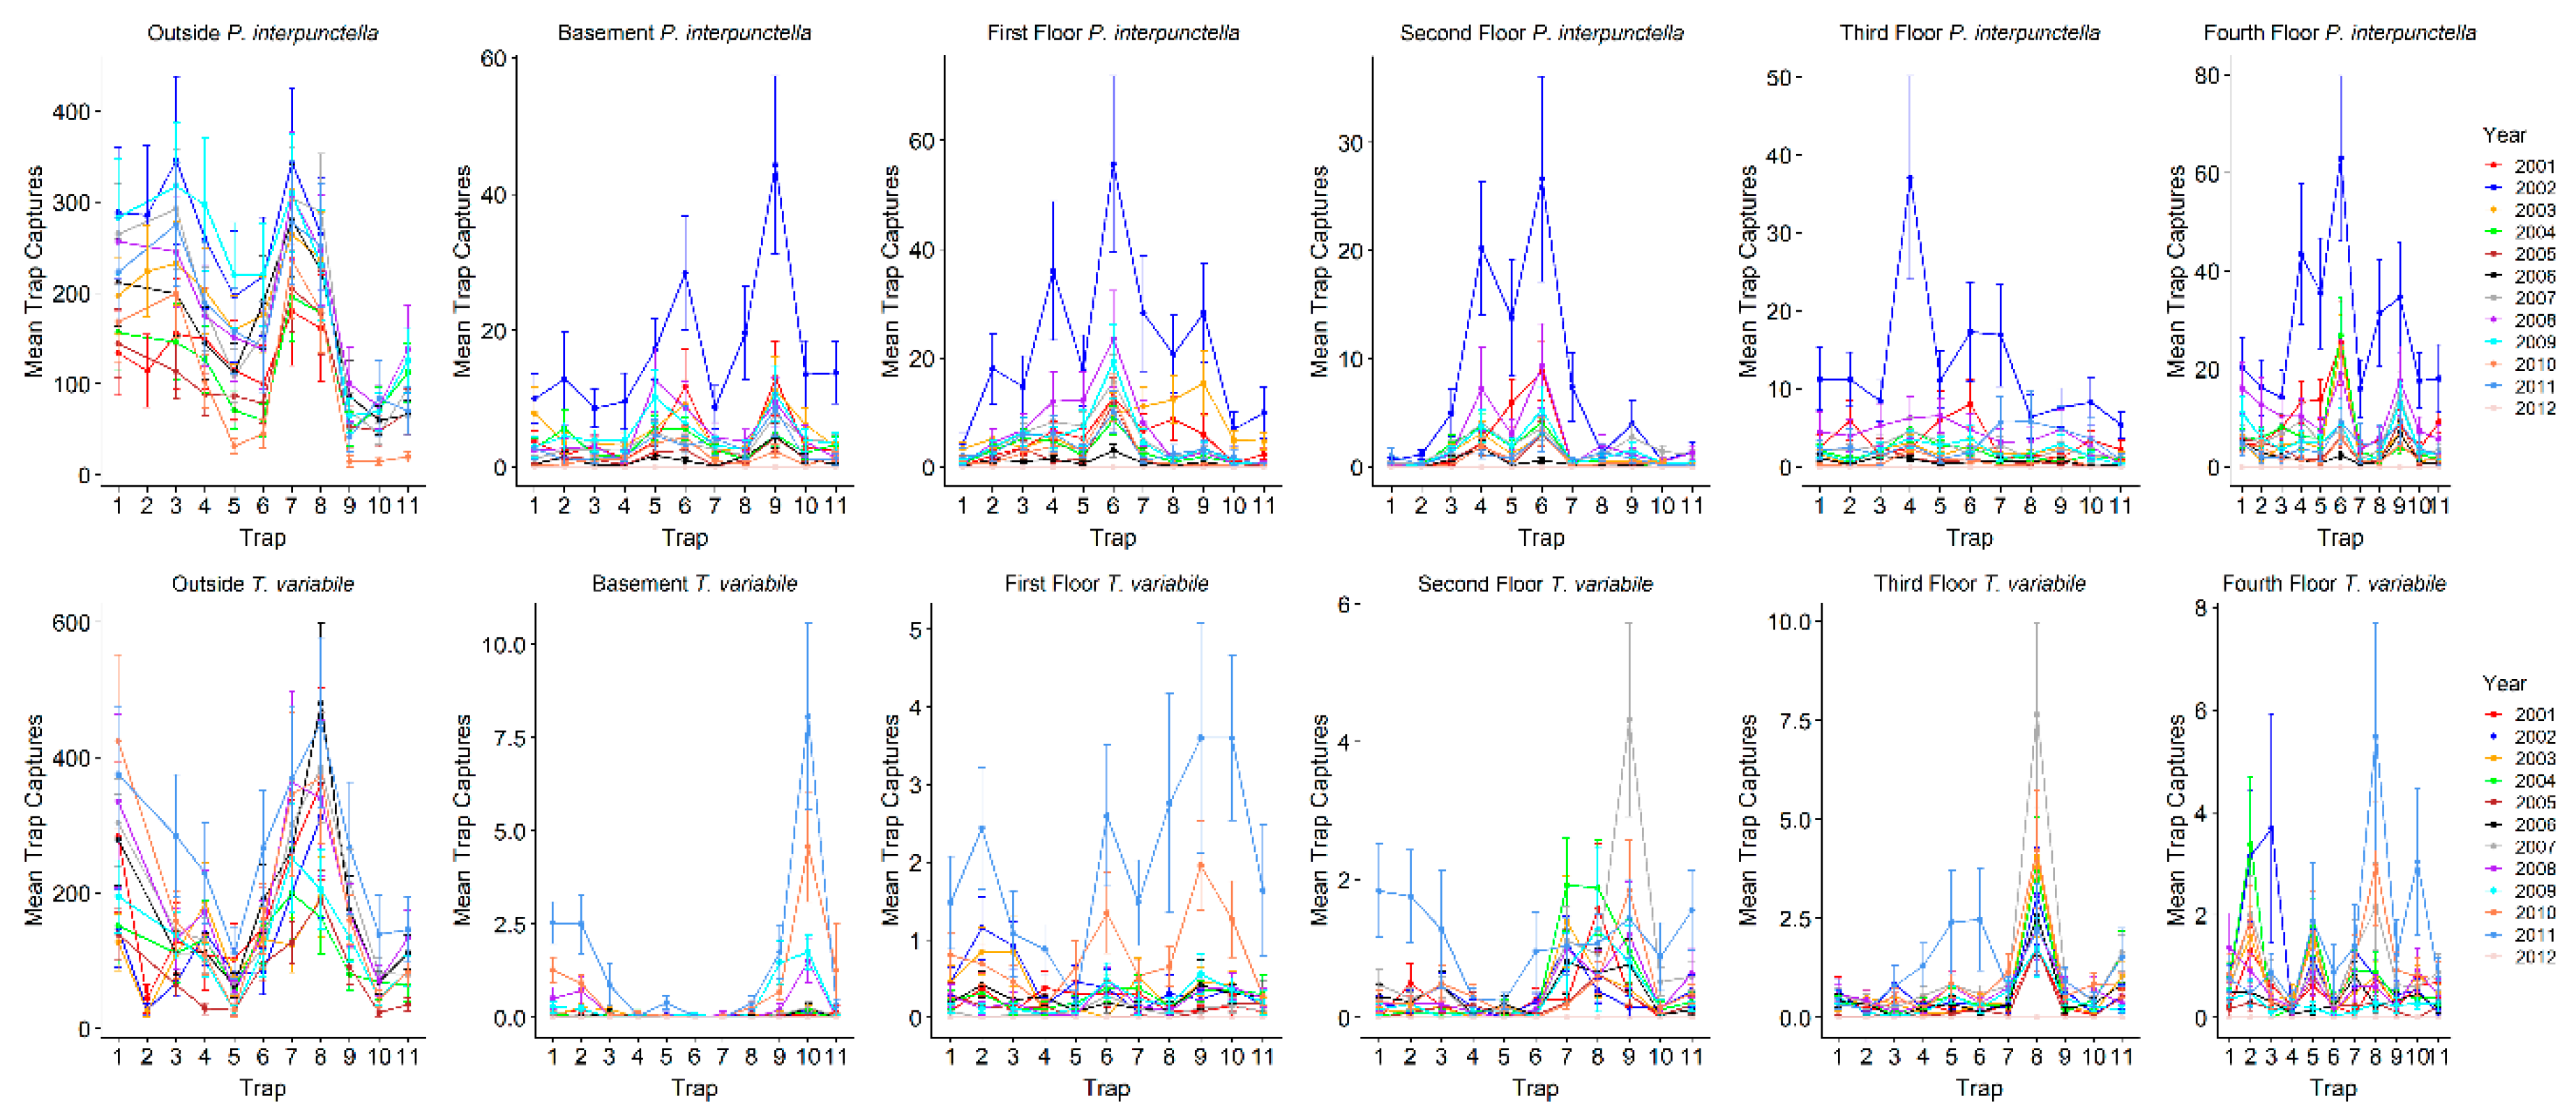
p < 0.0006). Overall, outside traps had the highest number of insects captured during both warm and cool seasons (
Table 2;
Figure 2). For total
P. interpunctella caught over the total observation period, outside insect captures ranged from a total of 0 to 888 insects for a single trap with a mean of 158.3 ± 4.7 insects/trap/monitoring period (± standard error), with 2002 having the highest mean insect/trap/monitoring period captures (
Table 3). In the warm season, average outside numbers were higher than in the cool season (206.9 ± 6.0 vs. 53.3 ± 4.6 insects/trap/monitoring period). Inside numbers ranged from a total of 0 to 281 insects for a single trap over the entire observation period, with an overall mean of 4.4 ± 0.1 insects/trap/monitoring period (
Table 3). During the cool season the mean number captured dropped to 0.7 ± 0.04 insects/trap/monitoring period as compared to 7.9 ± 0.2 insects/trap/monitoring period caught inside during the warm season. There was significant variability in the number of insects caught in indoor traps. Warehouses had the highest mean insect captures for all indoor traps while the fourth floor had the highest mean insect captures for the floors of the mill (
Table 2).
Compared to
P. interpunctella, T. variabile had overall lower numbers of insects captured indoors but not outdoors. For all outside traps,
T. variabile trap captures ranged from a total of 0 to 1803 for a single trap and had mean insect captures of 153.2 ± 5.7 insects/trap/monitoring period. For inside traps, total captures ranged from 0 to 48 for a single trap and averaged 0.5 ± 0.02 insects/trap/monitoring period for all inside traps. In the cool season, outside traps averaged 19.5 ± 2.8 insects/trap/monitoring period and inside traps averaged 0.07 ± 0.008 insects/trap/monitoring period, while in the warm season outside traps averaged 205.5 ± 7.4 insects/trap/monitoring period and inside traps averaged 0.9 ± 0.03 insects/trap/monitoring period. Among the inside locations, the third and fourth floors had the highest mean insect captures (
Table 2).
Using the difference in insect capture from one monitoring period to the next relative to the current trap capture counts can play an important role in understanding risk levels and developing thresholds for increased monitoring or treatment [
7]. Neither
P. interpunctella nor
T. variabile showed a consistent association between the difference in trap captures from one monitoring period to the next and mean trap capture and neither species had a mean capture threshold value associated with an increased risk of large insect capture increases. For
P. interpunctella, for example, when trap captures were 0 insects/trap/monitoring period, trap capture differences to the next monitoring period ranged from 0 to 111 insects/trap/monitoring period (mean difference ± standard error = 0.5 ± 0.03) with the range of differences maxing out when trap counts were 54 insects/trap/monitoring period (−44 to 115 insect/trap; mean difference = 7.5 ± 20.1) (
Table S1). Similarly, when
T. variabile trap captures were 0 insects/trap/monitoring period, differences to the next monitoring period ranged from 0 to 32 (mean difference = 0.2 ± 0.009) with a maximum range when trap captures were 16 insects/trap/monitoring period (−15 to 27 insects/trap; mean = 2.3 ± 6.1).
3.2. Impact of Temperature on Insect Captures
Temperature was also a significant factor in the models for both
P. interpunctella and
T. variabile, with minimum temperature a significant factor in predicting insect capture for both species and maximum temperature significant for
P. interpunctella only (
Table 1). Both species’ insect trap capture counts had positive and significant correlations with both the maximum and minimum temperatures of the day the traps were collected. For
P. interpunctella the correlation between insect capture and maximum temperature was always positive and ranged from 0.32–0.69 (
p < 0.0006) and for minimum temperature ranged from 0.34–0.71 (
p < 0.0003). For
T. variabile correlations between insect capture and maximum temperature ranged from 0.29–0.76 (
p < 0.002) and 0.29–0.77 (
p < 0.002) for minimum temperature. Outside insect captures had the highest correlation to temperature for both
P. interpunctella (R = 0.69,
p < 0.0001 for maximum temperature and R = 0.71,
p < 0.0001 for minimum temperature) and
T. variabile (R = 0.76,
p < 0.0001 for maximum temperature and R = 0.77,
p < 0.0001 for minimum temperature). For inside locations, the
P. interpunctella captures in the basement and first floor had the highest correlations to minimum (R = 0.52,
p < 0.0001 for both floors) and maximum temperature (R = 0.56,
p < 0.0001 and R = 0.54,
p < 0.0001, respectively), while for the number of
T. variabile captured in traps on the fourth floor and third floor had the highest correlation to minimum (R = 0.62,
p < 0.0001 for both floors) and maximum temperatures (R = 0.63,
p < 0.0001 for both floors).
Since temperature positively correlated with insect captures, we wanted to evaluate if there were ranges of temperatures where insect captures consistently began to change from one trapping period to the next. As temperature increased (using both the daily minimum and maximum temperatures) there was a trend for an increase in captures from one period to the next period increased and this occurred for both species. Z-scores indicated minimum temperatures where differences in insect captures from one trapping period to the next were greater than 0 were the same for both T. variabile and P. interpunctella but using maximum temperature a higher temperature needed to be reached before T. variabile changes were greater than 0. For P. interpunctella, the maximum temperature at this Z-score threshold was at 19.4 °C where there was a mean absolute difference of 5.4 ± 1.3 insects/trap/monitoring period and the minimum temperature was 6.7 °C where there was a mean absolute difference of 11.9 ± 2.2 insects/trap/monitoring period. For T. variabile specific maximum and minimum temperatures, Z-score probability was > 0.50 at a maximum daily temperature of 21.1 °C where there was a mean absolute difference of 6.1 ± 1.9 insects/trap/monitoring period and at a minimum temperature of 6.7 °C where there was a mean absolute difference of 3.8 ± 1.1 insects/trap/monitoring period). These results show that when these threshold temperatures are exceeded, insect captures become more variable and absolute differences from one monitoring period to the next become larger, typically between 5–11 insects/trap for P. interpunctella and 3–6 insects/trap for T. variabile.
In addition, rates of change from one monitoring period to the next that showed increases tended to cluster in the early warming months of April and May and decrease from September to October for both P. interpuntella and T. variabile. When comparing changes from one monitoring period to the next, for P. interpunctella April and May tended to have the greatest increases (>25% change in 5 of the 11 years of data recorded and >25% change in 9 of 11 years, respectively). In contrast, September, October, and November had the greatest decreases in captures (>−25% change in 6 out of 11 years, in all 11 years, and 6 out of 11 years, respectively). For T. variabile there was less consistency in monthly changes with March, April, and May having the greatest increases (>25% change in 4 out of 11 years, 4 out of 11 years, and 5 out of 11 years, respectively). September, October, and November also had the greatest declines in insect captures (>−25% change in 7 out of 11 years, 5 out of 11 years and 7 out of 11 years, respectively).
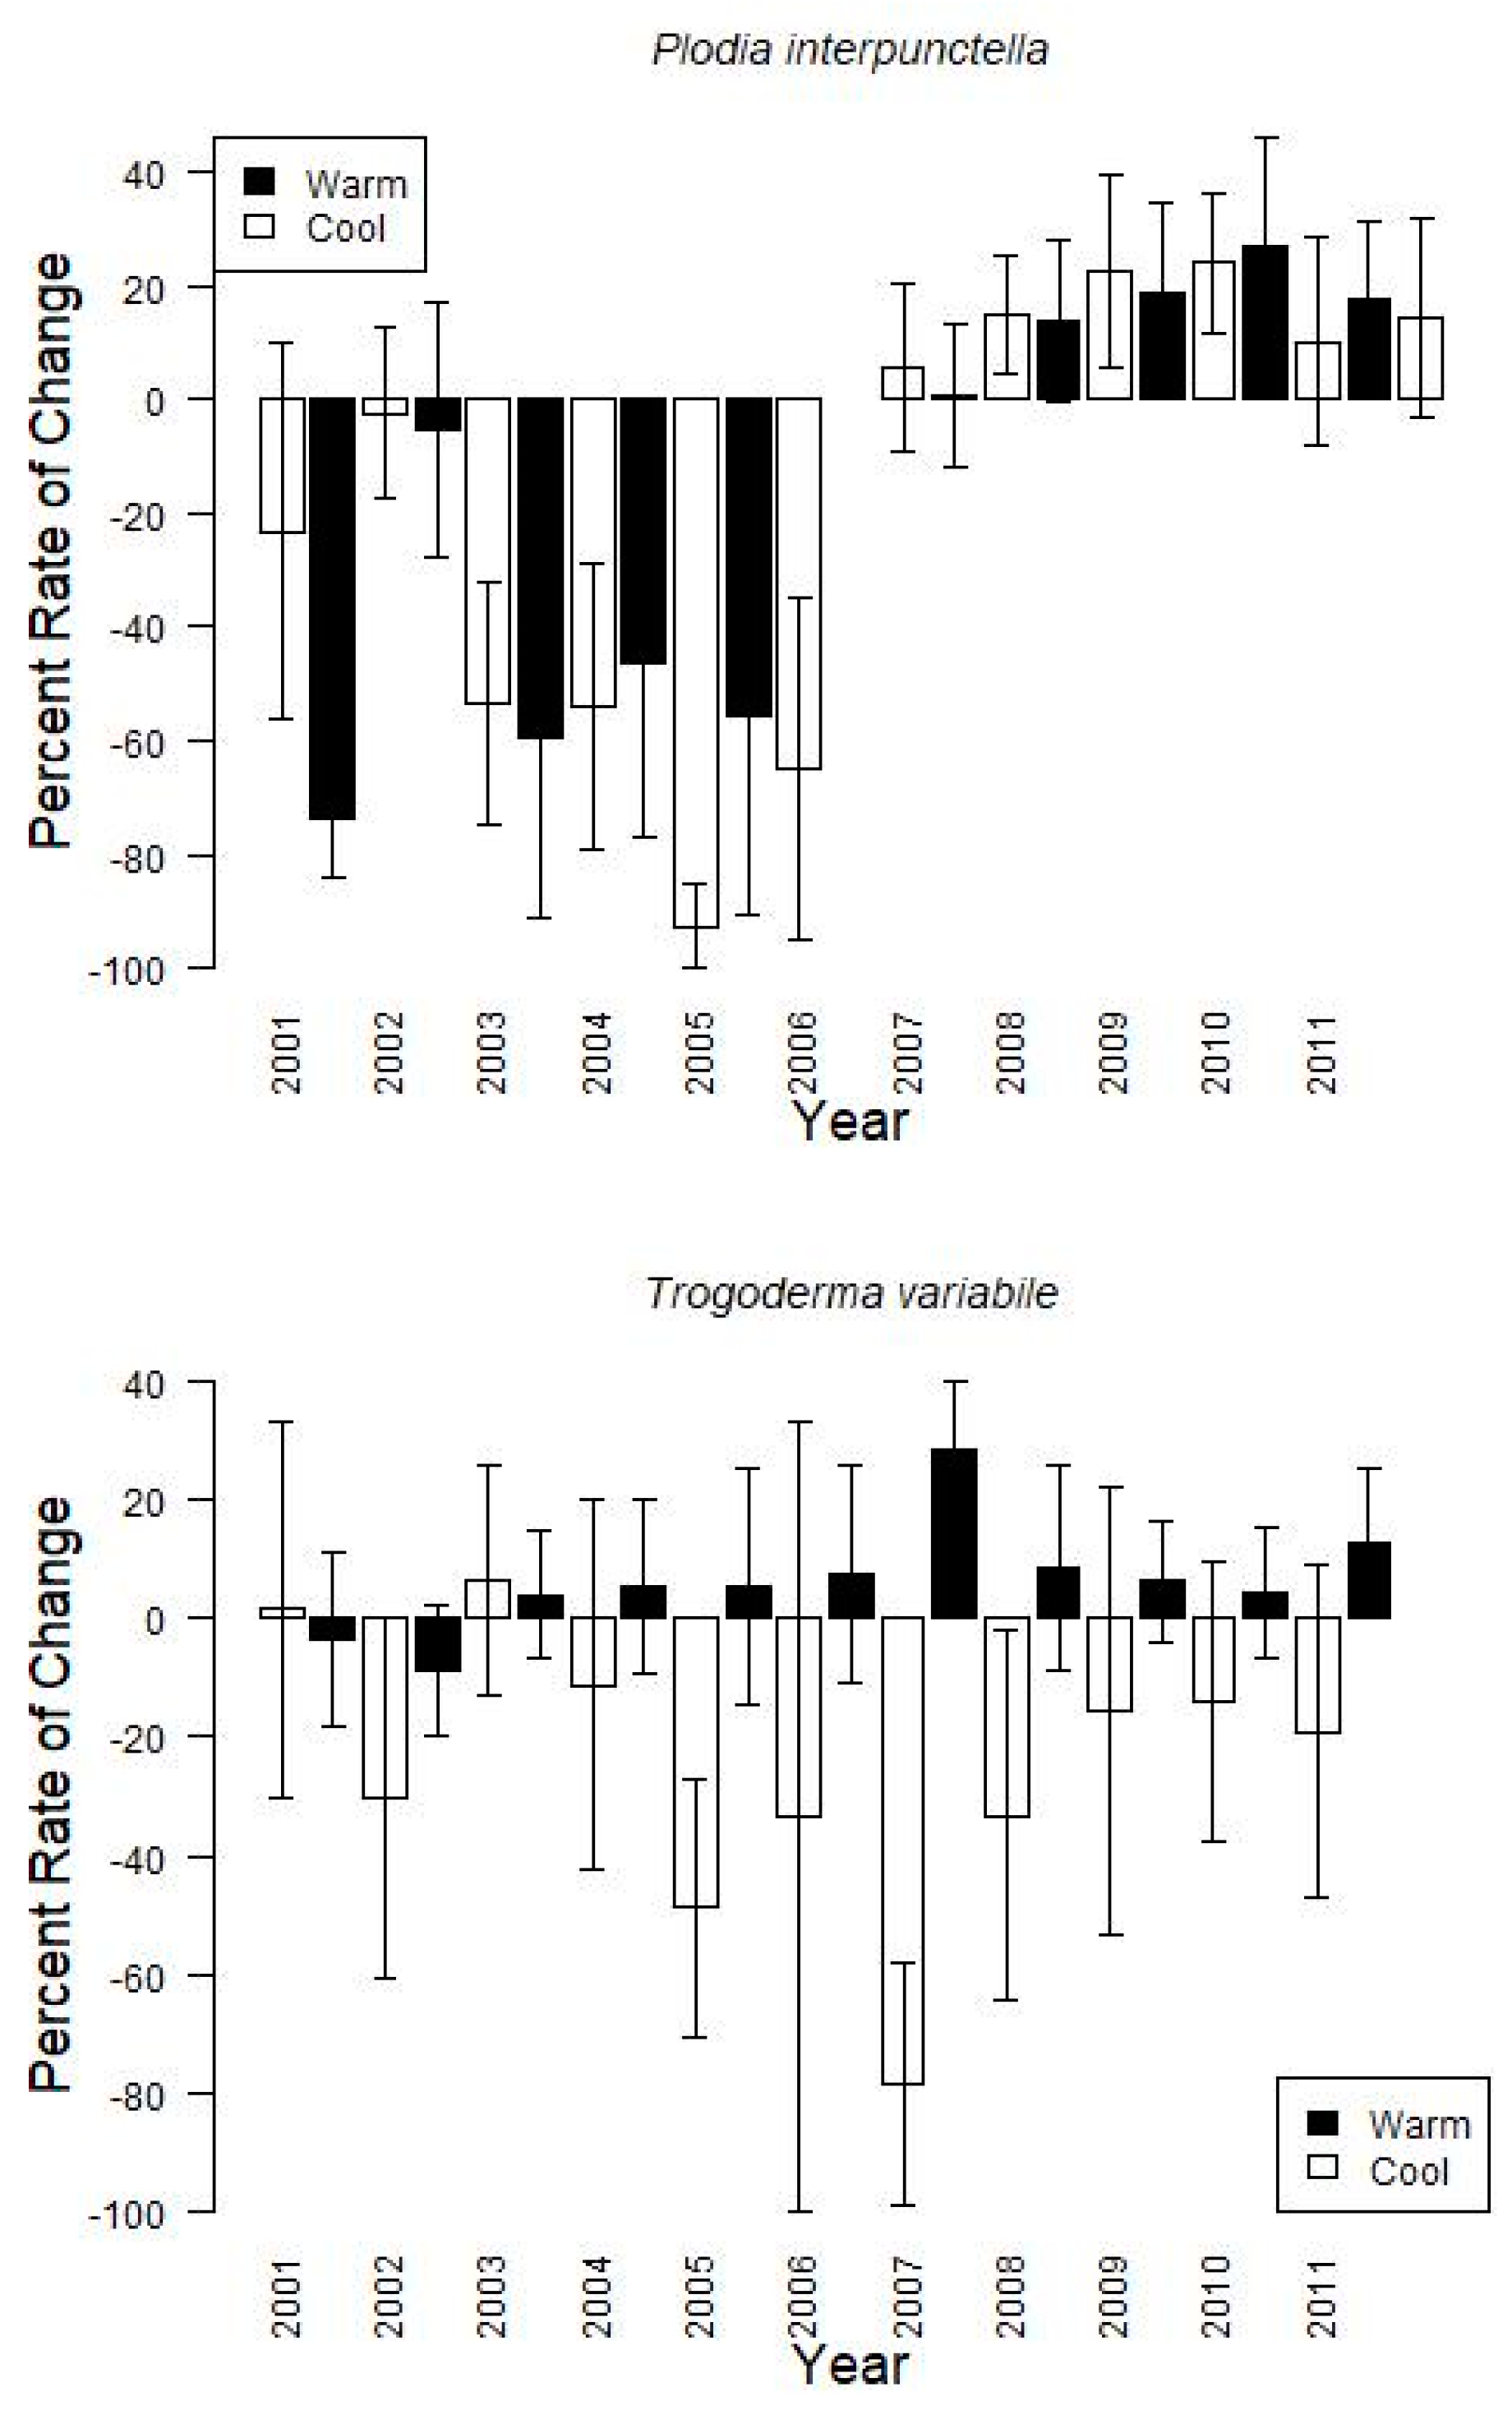
Finally, grouping the data by warm or cool season, showed that changes from one monitoring period to the next tended to increase during the warm season (15.6 ± 15.1% on average for
P. interpunctella, 6.5 ± 13.8% for
T. variabile) and decrease during the cool season (−48.3 ± 23.8% for
P. interpunctella, −25.0 ± 31.2% for
T. variabile) with large variation among years (
Figure 3). For example, during the cool seasons for
P. interpunctella, 2002, which also tended to have the coolest temperatures during the cool season, had the greatest average decreases (−74.0 ± 10.0%) and 2003 had the lowest decrease (−2.2 ± 15.1%); 2008 had the highest increase (27.1 ± 19.4%) and 2002 had the lowest increase (0.8 ± 12.8%) in the warm season. For
T. variabile from 2004 and onward, insect captures increased during the warm season and decreased during the cool season with 2007 having both the greatest decrease (−78.4 ± 20.4%) and increase (28.7 ± 11.6%) (
Figure 3).
3.3. Insect Capture Spatial Consistency
To evaluate consistency of insect captures over the years of the study, we calculated Spearman rank correlations for each location and trap for consecutive years (
Table S2). We then averaged the correlations for each trap to estimate which traps had the highest consistency. Outside insect captures were the most significantly correlated for all traps for both
T. variabile and
P. interpunctella (
Table S2). Overall,
T. variabile had lower correlation coefficients (range: 0.38–0.44) than
P. interpunctella (range: 0.49–0.75) suggesting that there is less consistency in insect captures for
T. variabile than
P. interpunctella. For
P. interpunctella the fourth floor had the highest consistency in insect captures and traps 3, 4, 6, and 9 had high correlation coefficients between years (
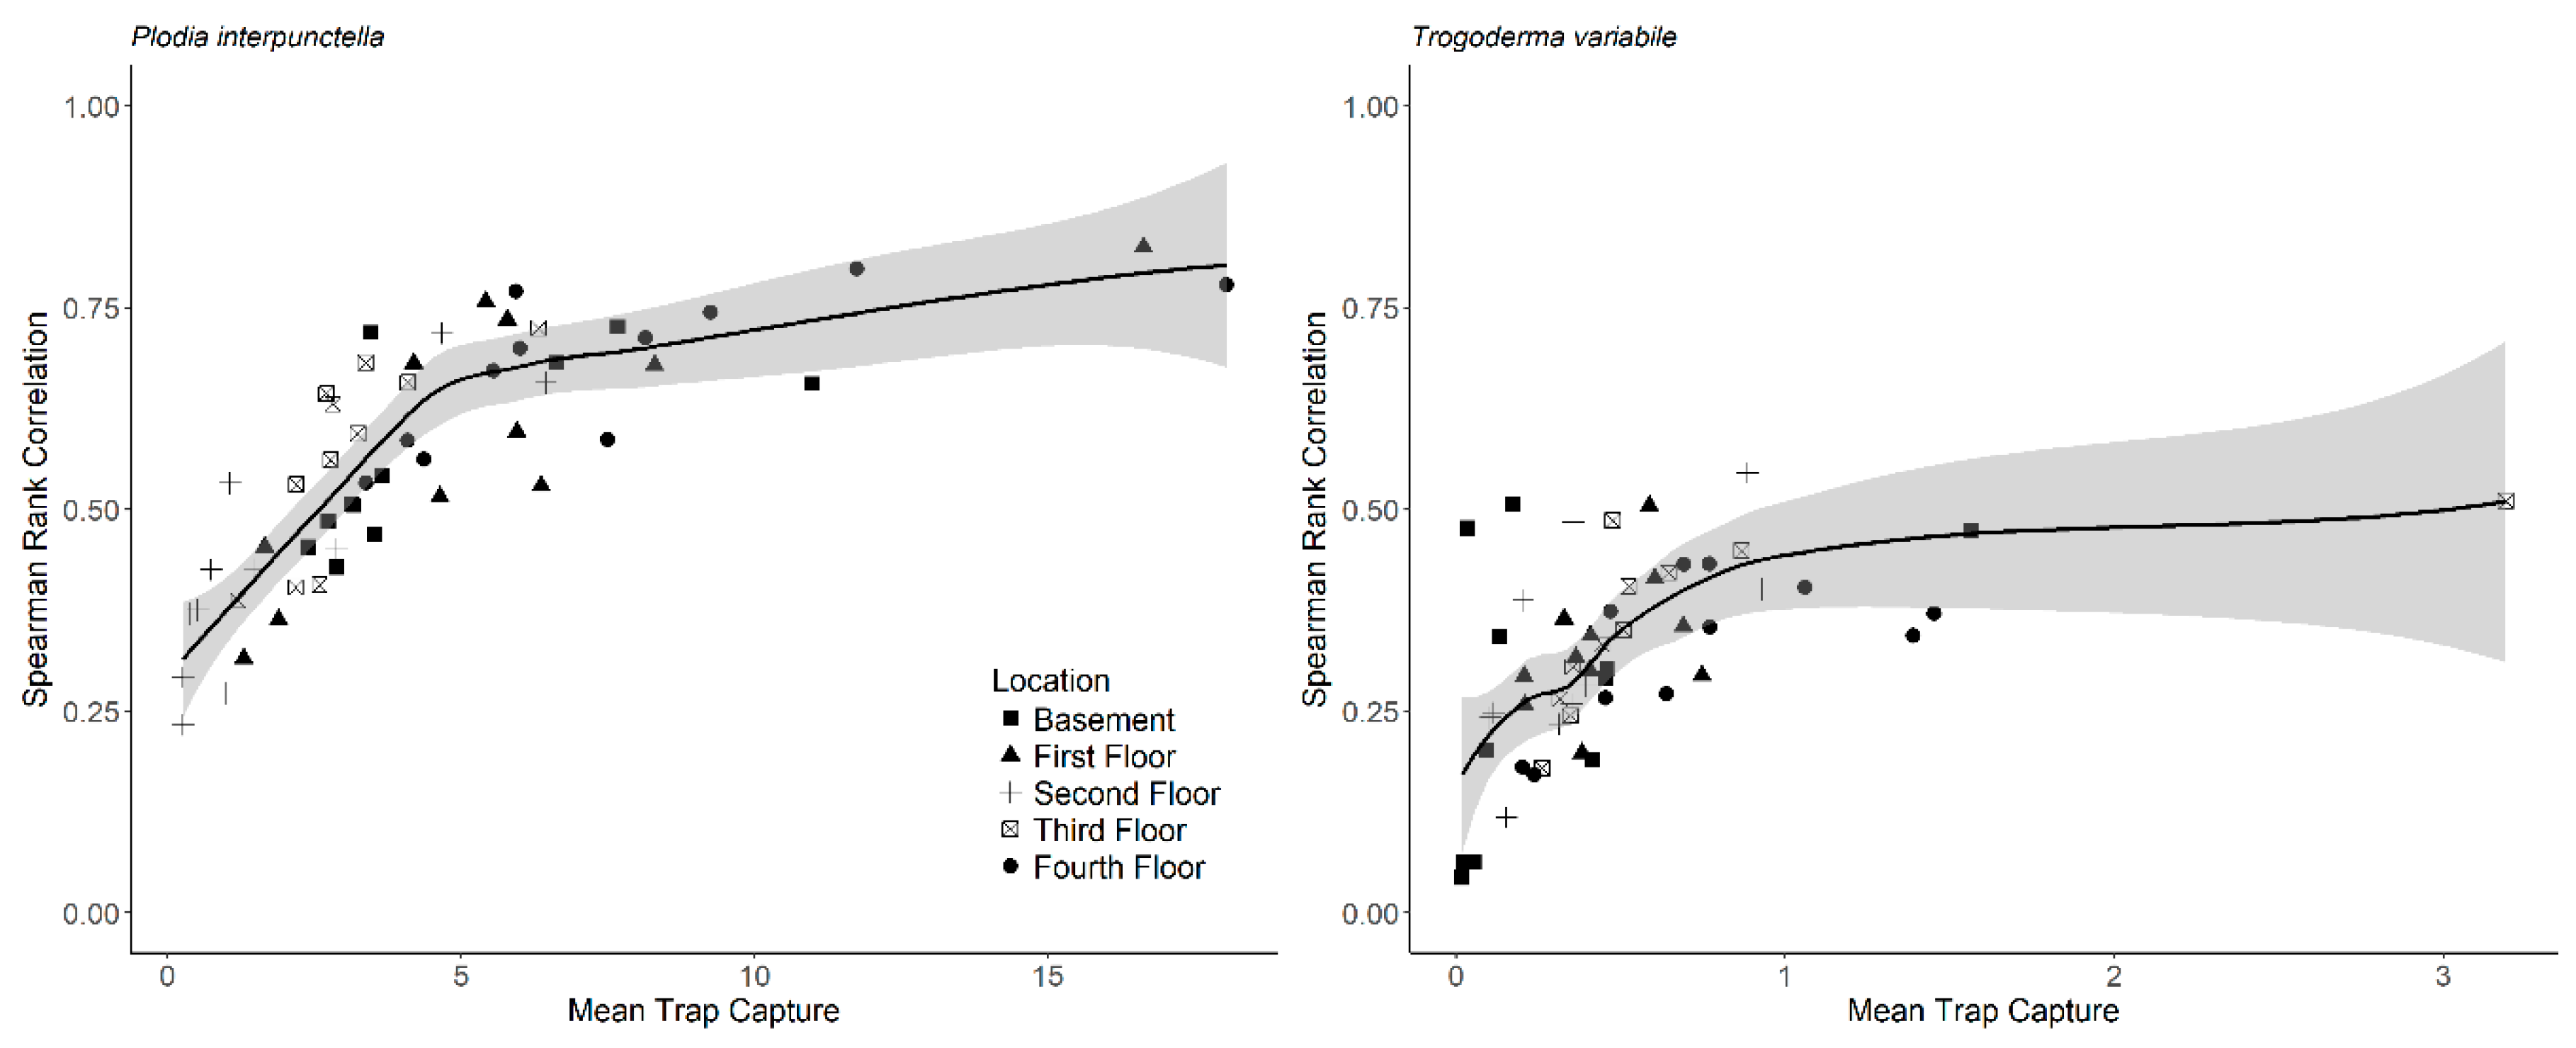
Supplemental Table S2). In addition, mean insect capture increased non-linearly with the correlation coefficient between years (
Figure 4). The parameters for the non-linear model for
P. interpunctella were θ
1 = 0.78 ± 0.035 with skewness = 0.25 and θ
2 = 1.15 ± 0.21 with skewness = 0.43 (± is approximate standard error). For
T. variabile, parameter values were θ
1 = 0.45 ± 0.038 with skewness = 0.46 and θ
2 = 0.12 ± 0.044 with skewness = 0.81.
To explore why certain traps tended to have high or low captures, we examined trap placement locations across floors since the traps were placed in the same areas on each floor and floors had similar layouts. Trap locations had significant variation in captures across years for both
P. interpunctella and
T. variabile. However, there were traps that typically had high or low insect captures/monitoring period. The consistency of traps across years was greater for
P. interpunctella than for
T. variabile and traps that had high insect captures for
P. interpunctella did not correspond with traps with high numbers of
T. variabile (
Figure 5). For
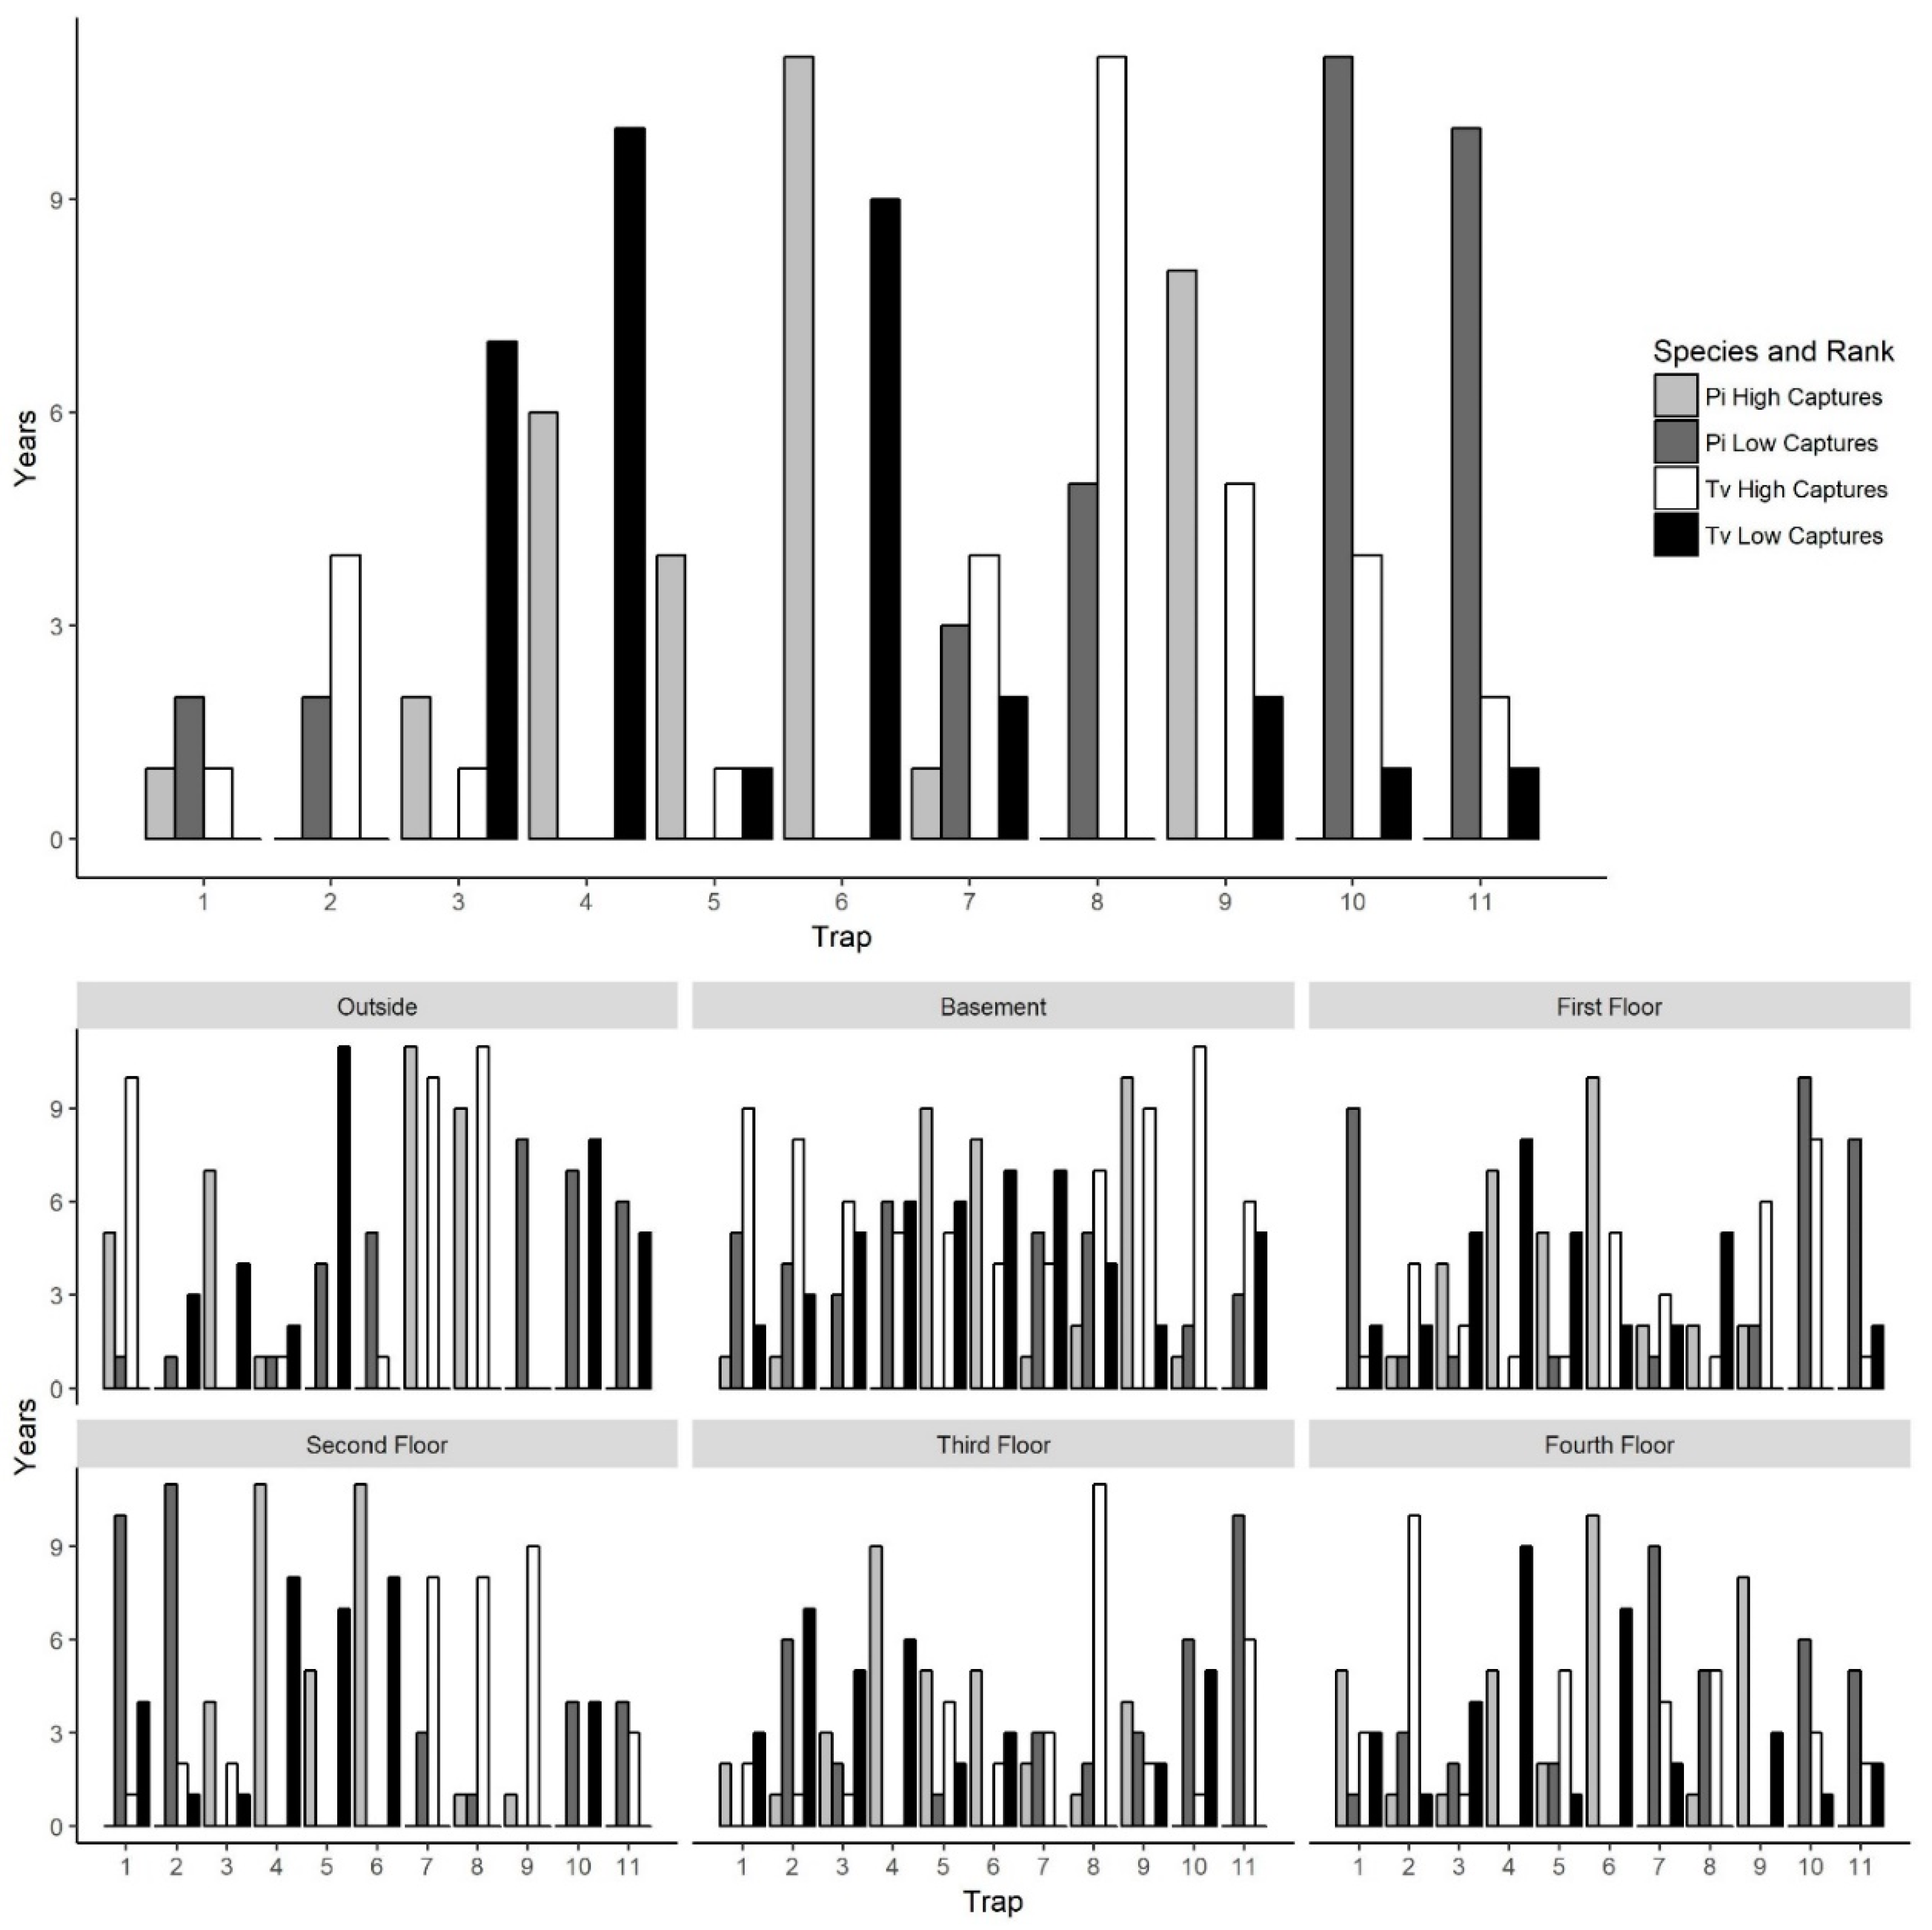
P. interpunctella, traps 6, 4, and 9 had the most years where they were in the top three traps with high insect captures and traps 10, 8, and 11 had the most years where they were in the bottom three in insect captures. For
T. variabile, traps 8, 9, and 10 had the most years in the top three highest inside insect captures and traps 4, 6, and 3 had the most years in the bottom three with the lowest insect captures (
Figure 5), but trap was not significant in the stepwise model for
T. variabile (
Table 1). There was little overlap between top three traps with high insect captures of
P. interpunctella and
T. variabile inside the mill. For example, on the first floor, traps 4 and 5 had the most years with high insect captures for
P. interpunctella but the most years with low insect captures for
T. variabile (
Figure 5). Traps 6 and 4 may have had high
P. interpunctella captures as they were located in an area of the mill where it was open from floors 1 to 4 and trap 9 was located by doors on the first and fourth floors, while traps 8, 10, and 11 were located out in the open, in the center of the mill floor leading to lower numbers of
P. interpunctella captures (
Figure 1).
For
P. interpunctella and
T. variabile traps with the highest number of captures did differ from floor to floor and patterns of high and low capture were also evident, but variable, in outside traps (
Figure 5). Outside traps 7 and 8 had the greatest number of years with the highest insect captures, while traps 9 and 10 had the greatest number of years where insect captures were lowest for both
P. interpunctella and
T. variabile. For inside traps, trap 6 ranked in the highest three in >6 years for
P. interpunctella for the basement, first, second, and fourth floors while traps 10 and 11 ranked in the bottom three for >5 years for the first, third, and fourth floors. For
T. variabile, trap 8 ranked in the highest three for >5 years for the basement, second, third, and fourth floors, while traps 4 and 5 ranked in the bottom three for >5 years for the basement, first, and second floors for both traps and the third and fourth floor for trap 4 only (
Figure 5).
3.4. Impact of Fumigation on Insect Captures
Following fumigations, there was an immediate decline in insect trap captures for
T. variabile but for
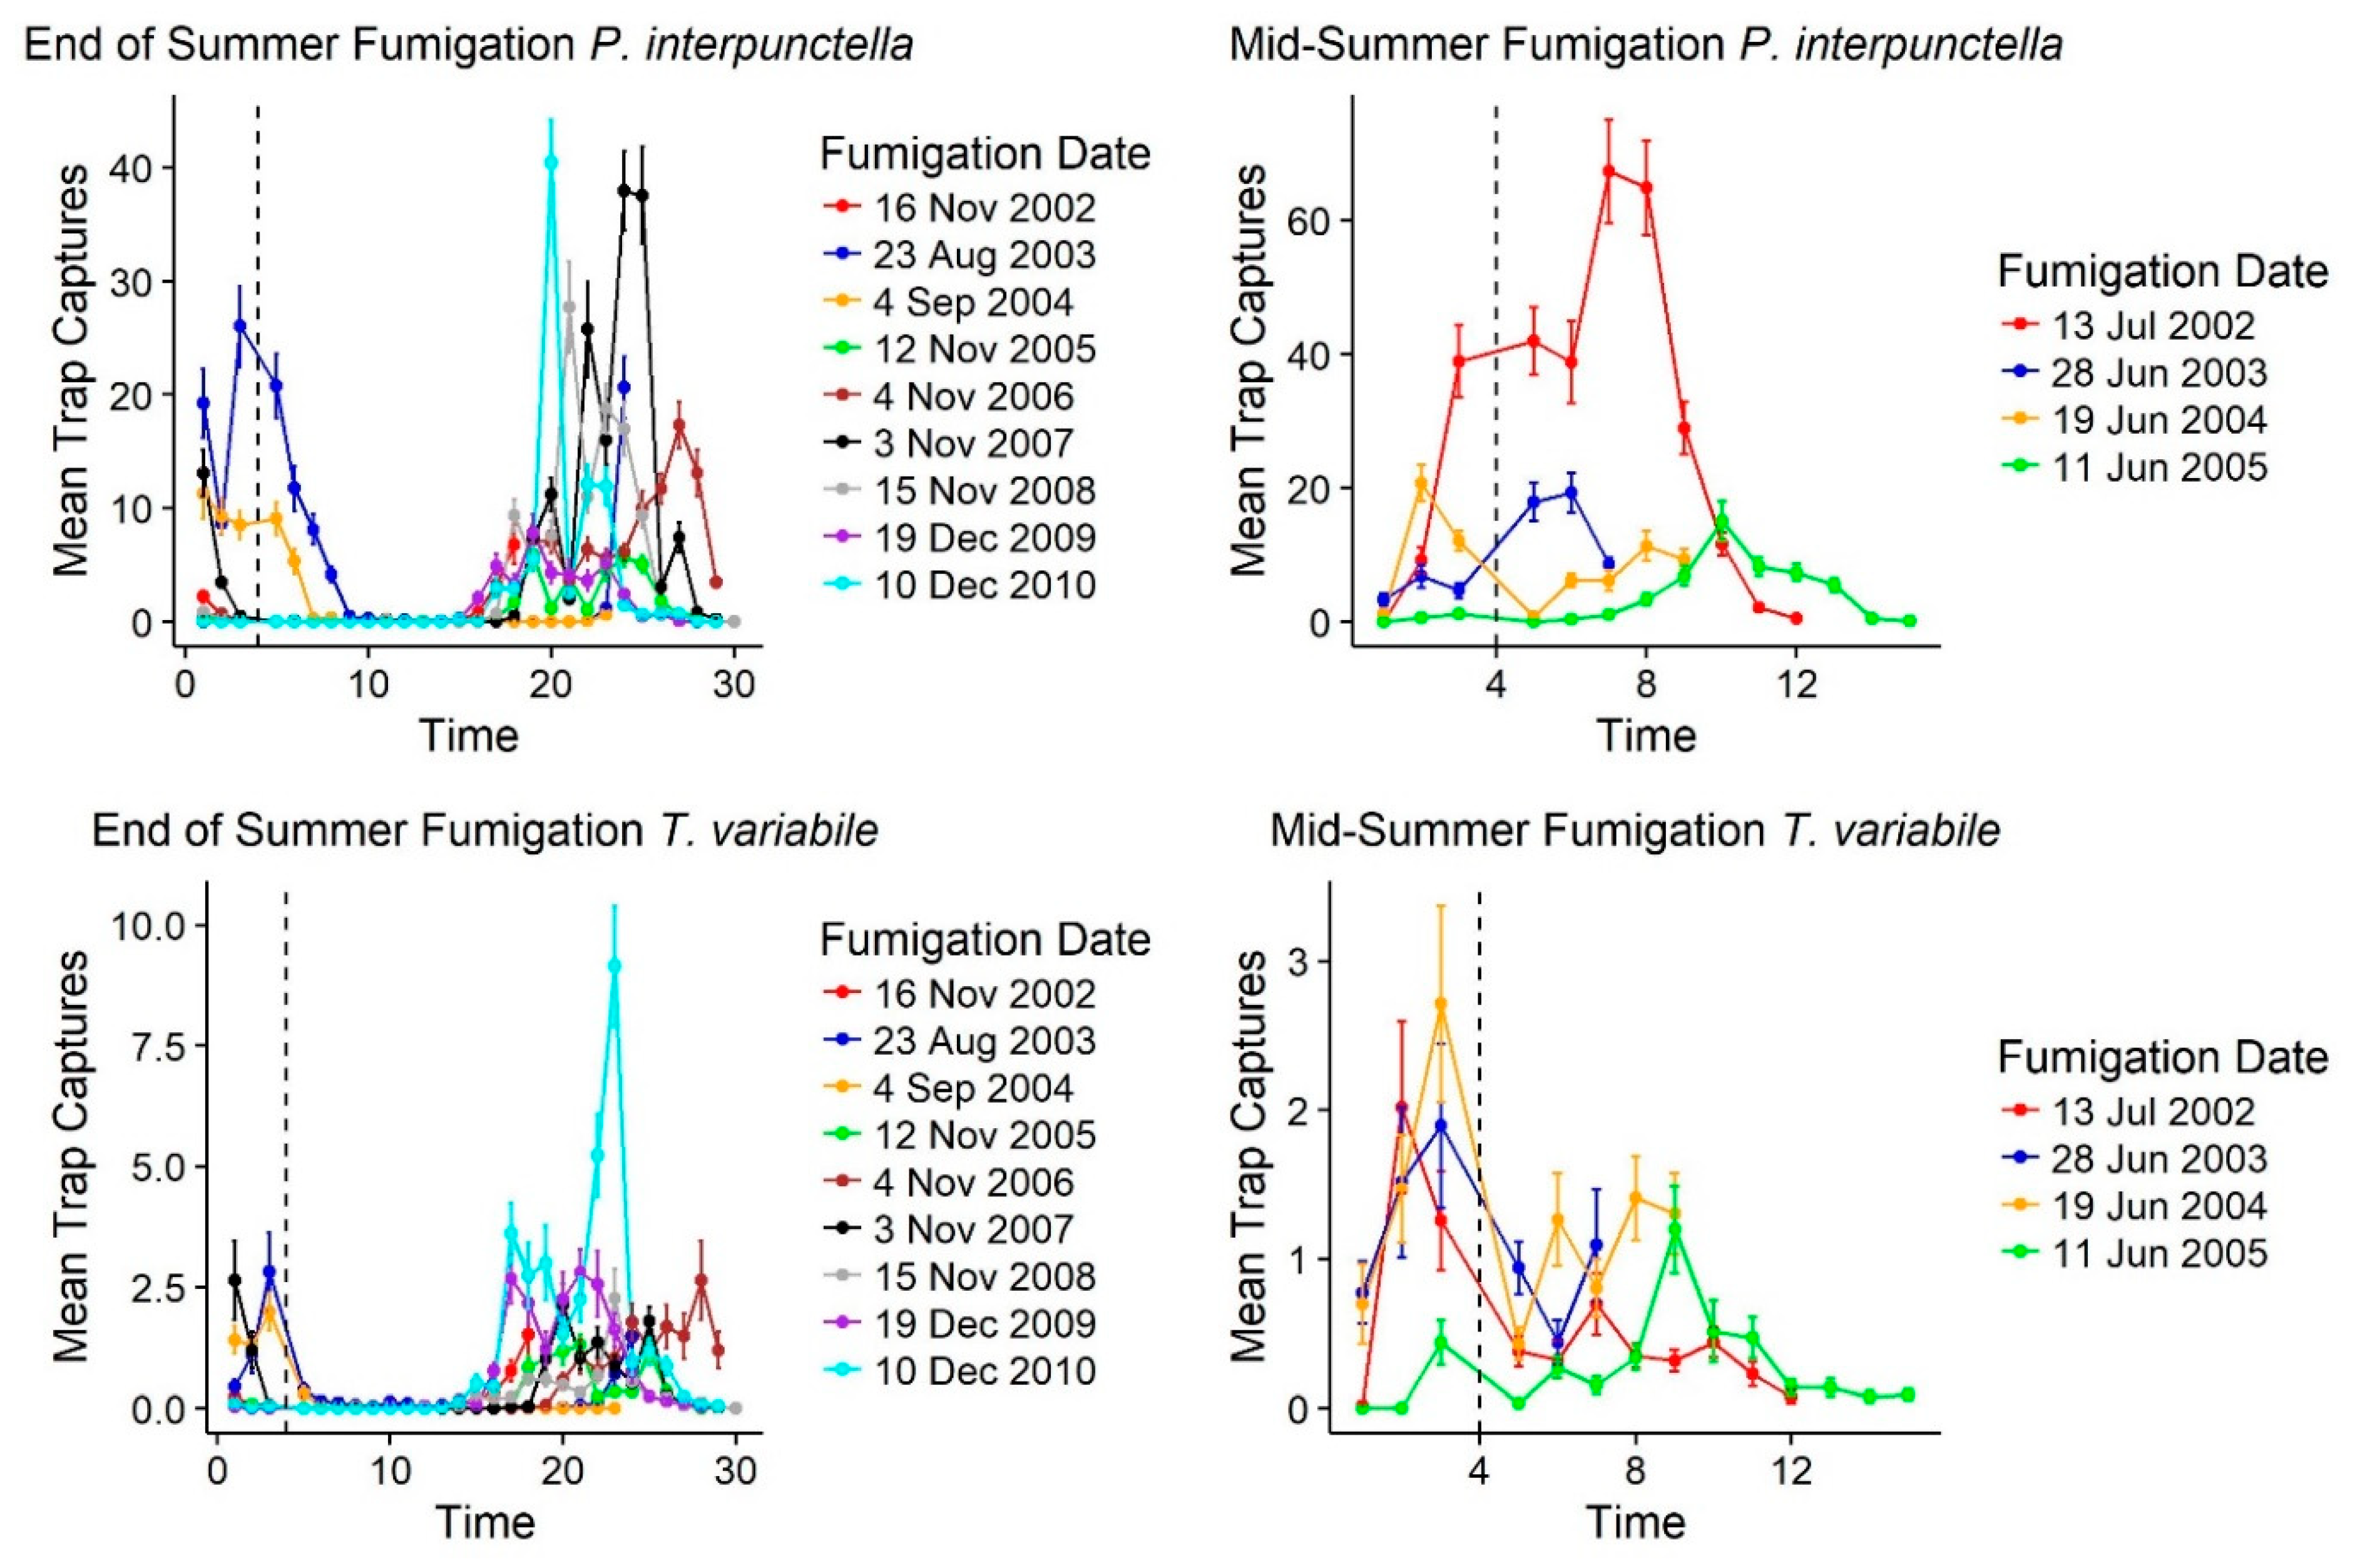
P. interpunctella fumigations that occurred in the middle of summer there was not a sustainable drop in insect captures. For both species, fumigations at the end of summer corresponded with declines in outdoor insect captures as well. Of the 15 fumigation events that occurred over 10 years of monitoring, following fumigation there was an immediate reduction in mean insect captures for
T. variabile (
Table 4;
Figure 6). For
P. interpunctella, there were two increases in mean insect captures following fumigation; however, these fumigations occurred in the middle of the warm season (June and July) when overall numbers were highest both inside and outside of the mill (
Table 2;
Figure 2) and correspond to increases in outside insect captures as well for these two time points. Following end of warm season fumigations, populations tended to decline immediately (
Supplemental Table S3) and only rebound at the beginning of the warm season (
Figure 6). For
T. variabile, every fumigation showed a reduction in mean number for each floor as well, except for the fourth floor on the June 11, 2005 fumigation and the west warehouse for the June 28, 2003 and June 19, 2004 fumigations (
Supplemental Table S3). These increases post-fumigation are likely due to quick immigration since they are in the middle of the warm season; outside insect captures also declined at these time points as well, but outside populations were still in large numbers allowing for recolonization following fumigation. Increased captures post-fumigation occurred for
P. interpunctella after the July 13, 2002 and June 28, 2002 fumigations for each floor except the fourth floor and the north warehouse and after the August 23, 2003 fumigation for the second, third, and fourth floors and the north warehouse (
Table S3). Outside trap captures also showed an increase at these fumigation dates, suggesting a quick replacement of indoor populations of
P. interpunctella following fumigation during these warmer months. Immediate declines in trap captures for
T. variabile following fumigation suggest that there is more of a residential population in the mill with less immigration following treatments.
4. Discussion
Long-term monitoring data are often hard to obtain, but they provide an important resource for pest management and prediction of where and when insects are most likely to infest within a facility. Short-term data can provide important information to guide pest management but given the considerable variation that is often reported for food facility monitoring data it may not be as useful for making predictions about pest abundance. We see in our data, insect captures can change dramatically from year to year at each trap, location (mill floors, warehouses, or outside), and overall totals. However, by evaluating trends in captures across years, patterns may be detected that can guide how many traps may be needed, and where they should be placed, to most accurately monitor insect populations within a facility. Here we see that there are strong seasonal patterns in captures for both P. interpunctella and T. variabile. We see consistent declines in insect captures during the cool season and increases during the warm season. In April and May (P. interpunctella) and March, April, and May (T. variabile) we see insect captures increase significantly from one trapping period to the next. It is possible that the number of traps used could vary throughout the year, with more traps needed during the warm season (starting in March or April) and fewer during the cool season. This can save money and time investment in using traps as a monitoring tool in these systems.
For
P. interpunctella and
T. variabile we found that environmental variables, specifically temperature, have a large impact on insect captures. Both minimum and maximum daily temperature had a significant influence on insect captures for
P. interpunctella but only minimum temperature was significant for
T. variabile, with insect captures tending to increase as temperature increased. For
P. interpunctella the mean difference in insect captures between sequential monitoring periods started to consistently show increases in May, with Z-scores indicating a temperature of 19.4 °C as the threshold where mean absolute differences are consistently different than zero. In contrast,
T. variabile were slightly delayed in their threshold timing and showed high mean differences in insect capture beginning in June, and a threshold of 21.1 °C for maximum temperature when differences in captures are consistently greater than zero. Temperature has been shown to be influential in
P. interpunctella biology with lower limits for survival and reproduction ranging from 16 to 20 °C and upper limits around 30 °C [
37,
38]. Temperature is also influential for
T. variabile with warmer temperatures increasing insect captures in other studies [
9] and temperatures higher than a mean temperature of 32.2 °C unfavorable to survival and a low temperature of 21.1 °C slowing down development dramatically [
39].
Season also had a strong influence on the increase or decrease in insect captures from one monitoring period to the next with cool seasons tending to have negative changes in insect captures from one trapping period to the next, pointing to a downward trend in insect captures from October through March. Warm seasons tended to have positive changes and the highest percent changes typically occurred in April for both
P. interpunctella and
T. variabile. For monitoring purposes, these months and temperature ranges would be ideal to begin to expect insect population increases within a facility. For cooler months Z-scores indicate that differences in mean indoor
T. variabile capture are not different from zero only in January; for
P. interpunctella, this trend occurs from February to April. These results suggest a few patterns. First, for
T. variabile there may be small resident populations within the facility since even during most of the cool months there are sometimes insect captures. For this species, monitoring of resident populations is important to ensure that these insects remain in check. In comparison,
P. interpunctella captures do not change from February to April which suggests that this species is more of a migratory species into food facilities and resident populations may not need to be monitored during the cool months. Arthur et al. [
11] also found a lack of
P. interpunctella captures during cool months in a large food warehouse and that cooler temperatures had more of an effect of
P. interpunctella than
T. variabile [
8]. Moths may also be in diapause at a larval stage, which would make monitoring them ineffective as they are not flying during this stage. However, even though air temperatures tend to drop within the mill during the cooler months, the mill is heated and is still relatively warm, maintaining the ability for resident populations to move and reproduce indoors even during cold months [
6].
Location outside or within the mill and warehouses had a significant impact on insect captures for both species examined. Outside traps consistently had the highest numbers of insect capture suggesting that there are multiple sources of insects in the surrounding environment [
8,
9,
12]. However, outside traps might also be more efficient in captures due to having more airflow increasing dispersal of the pheromone and the different trap design used. However, these differences are unlikely to generate such a large difference in captures, and other studies have also shown that these two species are found in high numbers outside of structures, which lends further to the evidence that immigration can play a large role in pest infestation within the mill [
8,
9,
15,
40]. In addition, specific outdoor trap locations tended to have the highest or lowest capture levels across years for both species (i.e., traps 7 and 8 with greatest and traps 10 and 11 with lowest captures for both species). These two groups of traps are set in different places around the outside of the mill and indicate that populations of these insects are not homogeneously distributed around the mill. Traps 7 and 8 are located near the mill itself, on the northern side of the cluster of buildings in the facility (
Figure 1). Traps 10 and 11 are located on the south side of the buildings, near the west and packaging warehouses. The insect capture differences may be due to several factors, including more odor emitting from the mill as the wheat is being processed and less odor from the packaging warehouse [
9]. While air flow is important in distributing pheromone plumes, differences in insect captures at these traps could indicate the importance of considering wind speed and direction relative to sources of the insect. Around this mill, strong winds are usually from the south, where traps 10 and 11 would be exposed to windy conditions possibly diminishing the effects of the pheromone lures. In contrast, traps 7 and 8 may be blocked from strong winds on the northern side of the facility and pheromone lures would be more efficient in drawing in insects. Outdoor trap 1 was also located on the north side of the facility, blocked by buildings from the south wind, and this trap also had high numbers of insect captures throughout years.
Interestingly, trap was not a significant factor for T. variabile as it was for P. interpunctella. This suggests that trap location may play a larger role for P. interpunctella than T. variabile. Indeed, trap consistency from year-to-year was lower for T. variabile than for P. interpunctella suggesting that to monitor T. variabile most accurately, managers may need more traps than needed to monitor populations of P. interpunctella. In addition, when comparing traps with highest and lowest insect captures, traps that had the highest counts for T. variabile did not overlap with traps with high counts for P. interpunctella suggesting independence in their niches or preferred habitats inside the mill. In addition, increasing mean insect capture also correlated with increasing consistency between years for both species, suggesting that traps with high captures were “hot-spots” of activity throughout the years of monitoring these species. For P. interpunctella this suggests that 3 or 4 traps could be enough for monitoring populations on each floor of the mill if we need to minimize the number of traps and focus our monitoring efforts.
When we combine consistency data from all traps on a floor across years, there was also variation in consistency of captures across floors. For
P. interpunctella the upper most floor had the greatest consistency in insect captures across years. Our data indicate high mean insect captures for
P. interpunctella on the first floor as well, so it seems as if these moths are also following the pattern of preferring the highest and lowest areas within the mill. Other behavioral analyses on
P. interpunctella suggested that they preferred traps at both the highest and lowest levels [
41]. Therefore, moth captures on the first and fourth floors of the mill might be due to a tendency to vertically orient within the mill. In addition, the top floor has openings to the outside environment, so higher activity could be associated with routes of entry, although there are considerably more routes on the lowest level relative to the top floor. The impact of the fourth-floor northwest vent, the first-floor northwest door, and the basement northwest vent door in insect capture are suggested by the higher levels of
P. interpunctella capture at indoor trap position 9 which is near these routes of entry. This pattern also points to the influence of outdoor access to increased numbers of insects at these locations [
8,
13,
14].
Unlike many agriculture or orchard systems there are no clear economic and action thresholds for pests within flour mills and other food facilities and with little consensus on what these thresholds might be for stored product pests [
7,
12]. However, there are studies that impose a threshold value of insect captures to assess the need for a response and to determine the necessity of the trap locations within an area [
6,
7,
11]. These thresholds have worked well for resident species such as
T. castaneum but may not work as well for more mobile species with strong patterns of movement into and out of the facility. To determine if this threshold approach would work for
P. interpunctella or
T. variabile, we assessed the difference in insect capture from one trapping period to the next compared to the mean insect capture and attempted to calculate the capture level when the difference started to increase as the threshold level of risk of infestation [
7]. Our data did not show a consistent pattern of an increasing difference at a given threshold; even when mean captures were 0 or low, differences from the current trapping period to the next had a large range. For
T. castaneum from this same mill, when 30% of traps captured > 2.5 beetles, trap capture was likely to begin to increase suggesting this species is a residential species and constant monitoring may be necessary to monitor risk thresholds [
7]. This pattern again suggests that
P. interpunctella and
T. variabile are less residential species within the mill and may rely more on migration into the mill during the warm seasons.
Structural treatments such as fumigation are important for treating whole populations to inhibit the rapid recolonization potential if the treatment is unsuccessful.
Tribolium castaneum from this facility responded strongly to fumigation treatments decreasing insect capture with insect populations rebounding around 100 days for spring fumigations and 250 days for fall fumigations [
7]. Pre-fumigation levels also provide an estimate of a risk threshold level of 2.5 beetles caught per trap as mentioned above; this threshold was used to calculate risk estimates based on the change in insect capture from one trapping period to the next, suggesting that below 2.5 beetles/trap on average the chances for an increase in insect population was low (about a 0.34 insect increase) but above the 2.5 beetle capture, insect captures increased by 1.76 insects from one trapping period to the next. Together, these results suggest these populations of
T. castaneum may be more resident than migratory with individuals following each fumigation treatment [
6,
7].
In contrast to the response of
T. castaneum to fumigation treatments, although we see a decrease in
P. interpunctella and
T. variabile insect captures immediately following fumigation (
Table 4), insect captures quickly rebound, suggesting that these insects are quickly immigrating following fumigation. In addition, insect captures indoors correspond to outdoor insect captures, even so far as to decrease at the same times that fumigations are occurring in the mill. Alternatively, insect captures soon after fumigation may also have been a failed treatment, where target concentrations and exposure times were not reached, but given the consistency of the rebound in insect captures this seems unlikely to be a major factor. Both
T. variabile and
P. interpunctella are susceptible to methyl bromide fumigation [
36,
37], but it is possible there is some resistance or repellency issues that might explain the rapid rebound. However, the high captures levels outside during treatments and the relationship between rebound and outside seasonal patterns suggests that patterns of recolonization most likely explain post-fumigation trends.
The outside or seasonal influence on insect captures is quite high and may even be more influential on interior population trends than internal environmental conditions and management tactics such as fumigation. Outside and inside insect captures also showed significant correlations and temperature was significantly correlated to insect capture, suggesting that it may be the driver of both inside and outside insect capture numbers. We do note that different traps are deployed inside and outside of the mill for these two species, but overall trends of insect captures vary consistently for both inside and outside traps. Thermal conditions have significant impacts on the reproductive capacity of insects as well as movement and flight [
42,
43] and so a strong influence on temperature is not surprising for these insects as well. Insects can easily migrate into the mill following fumigation, especially when doors and windows are opened for aeration [
6,
7]. Fumigations at the beginning of the cool season appeared to be more effective at decreasing insect captures; however, given the broader trends outside for populations to decrease this may just reflect reduced immigration. For
T. castaneum within this facility, populations were positively correlated before and after fumigation events but there was no impact of season on foundation populations [
6].
Tribolium castaneum in rice mills have indications of both resident populations and seasonal patterns of movement into and out of the facility influencing insect rebound following fumigations [
23]. Our data show that
P. interpunctella and
T. variabile activity at this flour mill is driven primarily by movement into the facility with limited established and resident populations, especially for
P. interpunctella. Understanding these dynamics is critical for selecting management tools and interpreting the results of treatments.


