Abstract
The sealing of shaft interfaces in machine housings against oil leakage is commonly realized by radial shaft seals, hence they are used millions of times in technical systems. However, with increasing speed they cause significant friction losses, which reduce the efficiency of the system significantly. In addition, the prevailing trend towards higher speed levels in electrified drive trains is already pushing sealing technology to its performance limits. Therefore, friction reduction offers a chance to extend the current performance limits and increase efficiency within existing applications. In this paper, a methodology for friction reduction is proposed, which is based on microstructuring and surface treatment of the seal sliding surface. Since experimental structural design is linked to high costs and time, a simulation-based method is proposed. Computational Fluid Dynamics (CFD) simulations are performed to analyze the influence of the structural geometry on local fluid flow. It is shown that for increasing sliding speeds, the analysis and the subsequent optimization of deterministic microstructures require the numerical solution of the complete Navier–Stokes equation in order to take inertial effects into account. Based on these results, an optimal geometric shape for the microstructure is found depending on the operating conditions.
1. Introduction
The task of sealing technology is to prevent the undesired leakage of liquids or gases from or the ingress of dirt into machines and technical systems or to reduce such leakage to a minimum. According to the relative movement between the components to be sealed, seals are divided into two groups: “static seals” and “dynamic seals”. Static seals include, for example, the frequently used O-ring, while dynamic seals include, for example, mechanical seals, piston rings, labyrinth seals, and radial shaft seals. While static sealing is mastered to a large extent, the sealing of dynamic contact surfaces continues to pose challenges. For sealing dynamic shaft interfaces without overpressure in machine housings (e.g., gearboxes), radial shaft seals are frequently used. Therefore, this type of seal is used millions of times in technical systems and is one of the seals dominating the market in terms of quantity and sales [1].
In order to comply with stricter legal CO2 emission limits, electrified powertrain concepts are increasingly being realized. The electric engines used in these systems are operated at very high speeds (20,000–50,000 min−1 [2]) to increase their efficiency and economy. However, these high speeds introduce new challenges in ensuring proper sealing at shaft interfaces.
With increasing circumferential speed, radial shaft seals cause significant friction losses, which on the one hand lead to a non-negligible reduction in efficiency. On the other hand, the friction losses result in high local heat generation. Due to the small contact area between the sealing lip and the shaft (contact width 100–300 µm) [1,3], the elastomer material is subjected to high thermal loads, which can lead to material changes, increased wear and consequently to significant leakage. During operation, the relative movement of the rough surfaces generates a hydrodynamic pressure in the sealing contact, which leads to a (partial) separation of the surfaces. The seals currently used develop a lubricant film thickness of an average 1 micrometer. The friction is dominated by the high shear of the oil [1]. Therefore, friction reduction offers a chance to extend the performance limits with regard to the current speed limitations and increase efficiency within existing applications.
Approaches for friction reduction are based on the manipulation of the tribological system “seal-oil-shaft”. One of the approaches aims at increasing the hydrodynamic pressure build-up in the sealing contact to increase the lubricant film thickness. In this case, a sufficient backflow of the fluid to be sealed must be provided to prevent the inherent increase in leakage. Since the lubricant is usually defined by the application, the increase in hydrodynamic pressure build-up must be induced by manipulating the shaft or the seal surface. For this purpose, microscopic deterministic or stochastic structures are applied to the surfaces.
The beneficial effect of a microstructured sliding surface on the macroscopic frictional behavior of tribologically stressed surfaces has long been experimentally proven in many applications. For axial plain bearings [4] and piston rings [5,6] as well as for mechanical seals [7,8] and metal to metal face seals [9], larger lubricant film thicknesses and thus reduced friction are achieved by a specific microstructuring of the sliding surfaces. Few studies have been conducted to examine the influence of microstructuring on elastomer lip seals. In [10,11], a structure is developed and investigated to provide a back-pumping capability for a PTFE lip seal. For this purpose, a deepening structure was applied to the side oriented opposite to the shaft. This structure affects the stiffness of the seal and deforms during assembly in such a way that an inhomogeneous contact pressure results, which deflects the fluid towards the fluid side and thus creates a pumping effect.
A methodology for friction reduction of radial shaft seals is considered in this paper, which was presented by the authors in [12,13] and is based on microstructuring and surface treatment of the elastomer sealing sliding surface. Figure 1 illustrates this methodology using the Stribeck curves of a conventional (grey line) and a friction-optimized (black line) radial shaft seal.
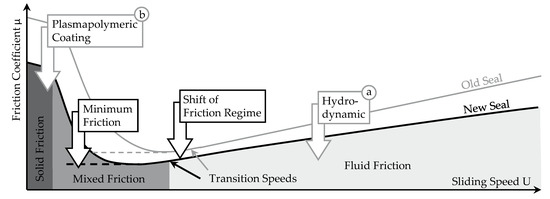
Figure 1.
Frictional behavior of a conventional (grey line) and a friction-optimized (black line) radial shaft seal based on microstructuring and surface treatment of the elastomer sliding surface.
Deterministic microstructures are applied to the sealing sliding surface (a) to increase the hydrodynamic pressure build-up and thus the film thickness. As a result, a load-bearing lubricant film is generated at lower sliding speeds. This leads to a shift in the friction regime from solid to mixed friction or from mixed to fluid friction, which leads to an overall friction reduction. However, since even slight wear leads to an impairment of the structural function due to the microscopic size of the structure, it is essential to protect the elastomer surface against wear. Therefore, a plasmapolymeric coating is applied to the structured sealing sliding surface (b). This coating additionally reduces friction in a solid friction regime.
The design and optimization of a low-friction radial shaft seal poses a major challenge when it comes to minimizing friction while ensuring no-leakage. In the scope of this paper, a simulation-based method is employed, since experimental optimization is linked to high costs and time. Within this method, the focus is put on the fluid mechanical optimization of the microstructure. It is shown that a computation of the fluid flow should be based on the complete Navier–Stokes equation and that cavitation phenomena have to be considered. Furthermore, flow simulations under varying structural geometry are performed and the results are used for structural optimization.
2. Simulation Setup
The optimization of the microstructure is carried out by investigating its influence on the local fluid flow using Computational Fluid Dynamics (CFD) simulations. For this purpose, a simulation model of a microstructure is derived from the radial shaft seal system, which is described in Section 2.1. The underlying simulation method is then presented in Section 2.2. A brief description of the mathematical principles required for the calculation of the fluid flow is given in Section 2.3. Finally, the derived simulation model is shown in detail in Section 2.4. In order to draw quantitative conclusions on the basis of this model, an estimation of the numerical error is given in Section 2.5.
2.1. Radial Shaft Seal
The design of radial shaft seals is specified in ISO 6194 [14], among others. Figure 2 shows a schematic assembly situation of a type A radial shaft seal. While the housing is at rest, the shaft performs a rotary motion with constant direction of rotation. The primary function is the dynamic sealing between the rotating shaft and the static sealing lip. The secondary function is the static sealing between the housing and the outer diameter of the seal.
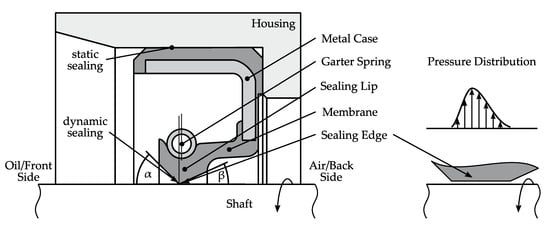
Figure 2.
Design of a type A radial shaft seal.
Static sealing is provided by fitting the seal into the housing, which is supported by a metal case. The outer diameter of the seal can be elastomer-coated (type A) or non-elastomer-coated (type B). The dynamic sealing is provided by the sealing edge, which is formed by two conical surfaces. During assembly, a radial force is caused by the difference in diameter between the shaft d and the seal, whereby the diameter of the seal is smaller than the diameter of the shaft. This difference ranges between 0.01–0.06 · d [15]. A garter spring is located on the sealing membrane above the sealing edge, which contributes to the radial force. The result is a circumference-related radial force of about 0.1–0.15 N/mm. The local contact pressure distribution is determined on the one hand by the distance between the center planes of the garter spring and the sealing edge and on the other hand by the front side lip angle α and the back side lip angle β. The distance between the center planes lies in the range 0.4–0.7 mm. The front side lip angle α is within a range of 40–60° and is therefore always greater than the back side lip angle β, which is within a range of 20–35° [1,15]. This results in an asymmetrical pressure distribution shown in Figure 2, which causes the backflow effect of a radial shaft seal [1]. The mean surface pressure pm is given on the basis of the circumference-related radial force and the width of the sealing edge, which is in the range of 100–300 µm, by a typical value of pm = 10,000 mBar (pm = 1 N/mm2) [3].
2.2. Methodology
The design and optimization of the low-friction radial shaft seal is based on a two-part simulation method, which is shown schematically in Figure 3.
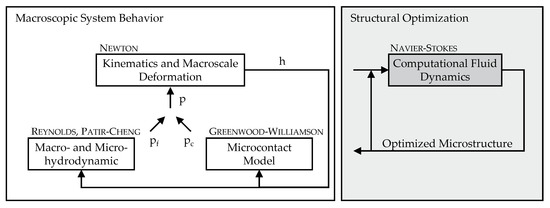
Figure 3.
Two-part simulation method. The optimized microstructure using CFD simulations is integrated into the simulation model of the macroscopic sealing system behavior.
In order to consider the macroscopic system behavior, the sealing system (shaft, seal, and housing) is modelled as a flexible multibody system (FMBS) taking into account micro-elastohydrodynamic lubrication (EHL). In this case, the local lubricant film thickness h is determined considering the kinematics of the system and the deformation of the elastomer material. The material deformation is caused by the local pressure p in the sealing gap, which can be divided into a fluid pressure pf and a solid contact pressure pc. For operating conditions at low circumferential speed or low lubricant viscosity, only a slight fluid pressure results, causing the seal to operate in mixed friction regime [1,16]. Therefore, the model takes into account both fluid pressure pf (considering surface roughness according to Patir–Cheng [17]) and solid contact pressure pc (microcontact model according to Greenwood–Williamson [18]). The detailed design and structural optimization is based on separate Computational Fluid Dynamic (CFD) simulations, on which this article focuses. The optimized structure is in turn integrated into the FMBS model.
2.3. Governing equations
To analyze the flow behavior of a fluid, e.g., in a microstructure, a mathematical description of the general behavior of a fluid is required. This description is based on the conservation laws for mass, momentum and energy. Assuming an isothermal flow, the conservation law for energy can be neglected. The two remaining conservation laws for the mass (Equation (1)) and the momentum (Equation (2)) form the system of equations for calculating the flow variables [19].
In these equations, t denotes the time, ρ the density, U the velocity, p the pressure, and τ the stress tensor.
In the case of fluid flow in microstructures, the pressure can drop below the saturation pressure of the lubricant in regions with an increasing film thickness. In such a case, the lubricant liquid changes into the gas phase (vapor cavitation). To account for this two-phase flow (liquid, vapor), the transient, compressible solver cavitatingFoam of the open source software package openFOAM [20] is used. The underlying cavitation model tries to maintain a constant pressure in cavitating regions (isobaric cavitation model). As pressure drops below saturation pressure, liquid is converted into vapor. If pressure rises again, vapor is converted into liquid [21]. The cavitatingFoam solver is based on the homogeneous equilibrium model (HEM). The HEM assumes that the liquid–vapour mixture is in a mechanical and thermodynamic equilibrium. Thus, the mixture can be described as a single fluid whose properties are determined based on the vapor fraction γ. The vapor fraction can be calculated from the density of the mixture ρ, the densities of the liquid ρl, and the vapor ρv at saturation pressure psat (Equation (3)). If only liquid is present, the value is γ = 0, if only vapor is present, the value is γ = 1.
In addition, it is assumed that the densities of the liquid and the vapor depend solely on pressure, such that both state variables can be linked by means of a barotropic equation of state (Equation (4)), where ψ denotes the compressibility of the mixture and ρl,0 denotes the density of the liquid at zero pressure.
Different models are available for calculating the compressibility of the mixture ψ. In this paper, the Chung model [22] is used due to its more stable behavior compared to the linear model [21]. The viscosity of the mixture μ is obtained by linear interpolation from the viscosity of the liquid μL and the vapor μv using the vapor fraction γ. The resulting system of equations for calculating the flow variables is solved numerically using the Pressure-Implicit with Splitting of Operators (PISO) algorithm [23].
2.4. Model
The calculation of the fluid flow within a microstructure is based on the conservation laws shown above. This requires a model of the region to be investigated and the definition of boundary conditions. The aim of the calculations is to investigate the effects of a structural variation on the resulting film thickness and thus on friction. In order to keep the calculation times low, a reduction of the flow region as well as a reduction of the geometric complexity are additionally required.
The structure considered in this paper is based on previously published experimental results [13]. In these experiments, not yet optimized, deepening paraboloidal structures were applied to elastomer samples by laser micromachining. In tribometer tests, a friction reduction up to 50% has been achieved compared to an unstructured and uncoated reference. The geometry derived from the experimental investigation is shown in Figure 4.
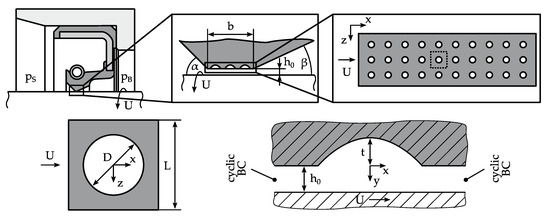
Figure 4.
Microstructured sealing sliding surface of a radial shaft seal and derivation of the simulation model of a unit reference cell with a paraboloidal height distribution.
Assuming a uniform flow behavior in the circumferential direction of the sealing lip, a simulation model of a single microstructure with cyclic boundary conditions (unit cell) is sufficient. The geometry of the model is defined by the diameter D, the structural depth t, the length of the unit cell L, and the lubricant film thickness h0. In order to identify similar geometries and thus reduce the amount of required simulations, the geometry can also be characterized by the dimensionless parameters structural density S = AStructure/ACell, relative structural depth α = t/h0, and the aspect ratio λ = D/t. Additional design parameters of the radial shaft seal such as the front side lip angle α, the back side lip angle β or the contact width b between the sealing lip and the shaft are not needed to characterize the geometry of the microstructure. However, these parameters are indirectly incorporated into the structural optimization in Section 3.3, as they influence the mean hydrodynamic pressure pm.
A two-dimensional fluid flow along the main flow direction in circumferential direction is assumed. The backflow effect of the radial shaft seal, causing an axial flow, is thus not considered in the simulations. Its influence on the hydrodynamic pressure build-up is negligible due to a low flow velocity as compared to the main flow. In addition, the fluid flow is assumed to be incompressible and isothermal. Solid contact between the sealing lip and the shaft is not considered. The fluid properties are based on PAO base oil used in [13] with a kinematic viscosity ν40 = 55.5 mm2/s and a density ρ15 = 0.834 g/cm3.
The boundary condition for the velocity is set to a no-slip condition for the surfaces of the moving shaft (sliding velocity U) and the stationary seal. For density and pressure, a zero-gradient condition applies to the shaft and the seal. A cyclic boundary condition is defined at the input and output for all flow variables. Both the seal and the shaft are modelled as solid bodies.
Since no closed solution of the system of equations comprising the conservation equations is available, a numerical approximate solution must be found. Therefore, the conservation equations need to be discretized, i.e., they have to be transferred from a continuous to a discontinuous description. In this work, the Finite Volume Method (FVM) is applied [24]. In this method, the flow region is divided into a limited number of finite volumes (cells) and the flow variables are calculated at a limited number of vertices (usually in the cell centers). The discretization is based on transferring the differential conservation equations, given in (1) and (2), into an integral formulation and approximating the resulting single terms [24,25]. The approximation of surface integrals requires the interpolation of values from cell centers to face centers. The Laplacian and the Gradient terms are discretized using a linear interpolation scheme that is second-order accurate. To ensure numerical stability, the velocity gradient is additionally limited such that the interpolated values at the face centers are limited by the values at the adjacent cell centers. The Divergence terms are discretized using an upwind scheme that sets the value of the face centers according to the value of upstream cell centers [26]. For spatial discretization, a parameterized, block-structured mesh with hexahedral cells only is used. An estimation of the discretization error caused by the spatial discretization is given in the next Section.
2.5. Error Estimation
The numerical fluid flow calculation based on the conservation laws represents an approximation to the real flow. The deviation between the real flow and the numerical approximation is referred to as the total error of the model εtot. In order to draw correct conclusions from the approximation, it is necessary to be aware of the total error, which can be described as the sum of a model error εmod and a numerical error εnum [27]. The model error εmod is defined as the difference between the real flow and the exact solution of the conservation laws. Since in most cases neither the real flow can be measured exactly nor the analytical solution of the conservation laws is known, the model error cannot be specified exactly. The numerical error εnum is defined as the difference between the exact solution of the conservation laws and the iteratively determined solution of the discretized equations. It is composed of the iteration error εit and the discretization error εh. Assuming a converged solution for each time step, the iteration error can be neglected and the numerical error can be estimated by the discretization error (εit << εh).
The discretization error εh can be quantified by examining the convergence behavior of the flow variables with increasing mesh resolution. In this paper, the Grid-Convergence-Index (GCI) method developed by Roache [28] is used. This method is also recommended for reporting uncertainty due to discretization by the fluids engineering division of the American Society of Mechanical Engineers (ASME) [29]. The resolution of the different meshes considered is increased by a uniform increase in the number of cells. Two exemplary meshes with a low and a medium resolution are shown in Figure 5.
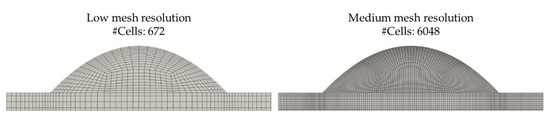
Figure 5.
Two of the meshes considered for the mesh study with a low and a medium resolution.
The simulations are performed without taking cavitation into account using the steady-state, incompressible solver simpleFoam available in openFOAM, which uses the SIMPLE algorithm [30]. Operating conditions critical to the discretization error are encountered at maximum Reynolds number Re = U h0 / ν. Therefore, operating conditions with maximum speed, lubricant film thickness and temperature (minimum viscosity) are selected. The simulations are based on a use case with a shaft diameter of d = 35 mm. The speed is set to n = 20,000 min−1 (see Introduction), which equals a circumferential speed of Umax = 40.8 m/s. As maximum temperature Tmax = 100 °C is set, the lubricant kinematic viscosity is νmin = 5.8 mm2/s. A constant film thickness of h0,max = 3 µm is applied and as deviating boundary conditions a value of 0 bar is set for the pressure at the inlet and outlet. Additional mesh studies were carried out for deviating operating conditions with lower Reynolds numbers. Only a small influence of the operating conditions is found, whereas the discretization error is consistently smaller (see Table A1).
The convergence behavior of the averaged hydrodynamic pressure pm on the seal surface is used to quantify the discretization error. A graphical overview of the simulation results is shown in Figure 6 together with the corresponding computing times t. The variable h denotes the discretization parameter, which can be interpreted as a mean cell edge length, such that h decreases with increasing mesh resolution, i.e., with an increasing number of cells.
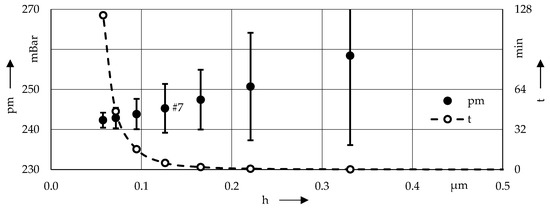
Figure 6.
Influence of mesh resolution on mean pressure pm and computing time t.
With an increasing mesh resolution, the pressure pm decreases and tends towards a finite value for h approaching 0 (number of cells → ∞). Using the GCI method, the results shown in Table A2 are obtained. The discretization error, expressed as GCI, decreases as expected with increasing mesh resolution and the computing time increases disproportionately. Since the numerical effort increases when cavitation is taken into account, a compromise between a solution that is as exact as possible and a reasonable computing time must be found. Thus, a discretization error of 2.49% for the computational mesh #7 with a number of 18522 cells is considered sufficiently accurate.
3. Results
The simulation model introduced in Section 2 is used to analyze the fluid flow within the microstructure. In Section 3.1 the influence of high circumferential speeds on the local fluid flow is examined. Subsequently, in Section 3.2, the necessity of taking cavitation into account is discussed. Considering these information, a variation of the geometric parameters of the microstructure is carried out in Section 3.3 and the influence on the resulting lubricant film thickness is considered.
3.1. Influence of Inertial Effects
The fluid mechanical analysis of microstructured surfaces is commonly based on solving the Reynolds equation, which can be derived from the conservation laws shown under certain assumptions [31]. One of the essential assumptions is the neglect of inertial forces. An investigation of their influence for microstructured surfaces is given in [32]. In this paper, the authors show that with an increasing influence of inertial effects, an additional hydrodynamic pressure build-up results, which leads to a gap-opening force. They conclude that a fluid mechanical analysis based on solving the Reynolds equation is unsuitable for Re > 1. In [33], this statement is extended by additionally including the aspect ratio of the microstructure λ. For a rectangular, two-dimensional microstructure, they derive a graphic from which the applicability of Reynolds equation can be assessed. In addition, the consideration of all physical effects influencing the fluid flow in the microstructure is of decisive importance in order to be able to predict the suitability of a microstructure, since it generally can also have a detrimental influence [34,35].
Considering the most critical operating conditions with regard to Reynolds number (see Section 2.5) with a sliding speed Umax = 40.8 m/s, a kinematic viscosity νmin = 5.8 mm2/s and a lubricant film thickness h0,max = 3 µm, a range of Re = 0…21.1 results. For these extreme values, the results of a simulation using the complete Navier–Stokes equation are shown in Figure 7. Figure 7a shows the resulting velocity field along with corresponding streamlines. Figure 7b shows the pressure field along with contour lines of constant pressure. In this simulation, no cavitation was considered.
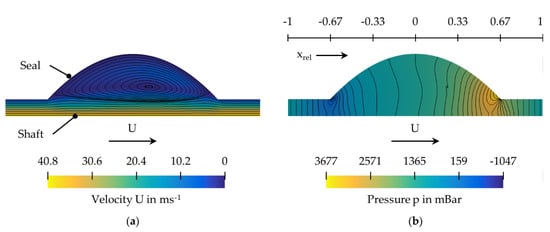
Figure 7.
Exemplary simulation results obtained for the following operating conditions: U = 40.8 m/s, ν = 5.8 mm2/s, h0 = 3µm. (a) Velocity field with corresponding streamlines; (b) Pressure field with contour lines of constant pressure.
Analyzing the local velocity field within the microstructure reveals the development of a vortex. The center of the vortex shifts downstream with increasing sliding speed, which effects the hydrodynamic pressure field. Based on the isobars shown, a variation of fluid pressure across the film thickness can be observed. This variation already occurs at low speeds and becomes more severe with increasing sliding speeds. Additional simulations were carried out under a variation of Reynolds number to examine the influence of inertial forces (see Table 1).

Table 1.
Simulation parameters for the analysis of the influence of inertial forces.
The results of the corresponding simulations are summarized in Figure 8 and Figure 9, which show the pressure distribution acting on the seal surface along the relative length of the unit cell xrel (see Figure 7).
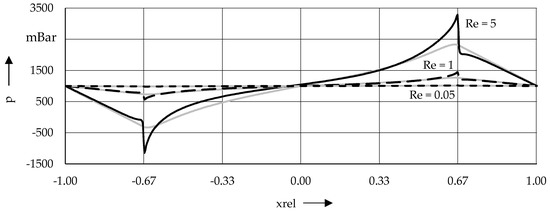
Figure 8.
Pressure distribution acting on the seal surface for different Reynolds numbers (Simulations 1–3). The grey curves represent the corresponding analytical solutions of the Reynolds equation.
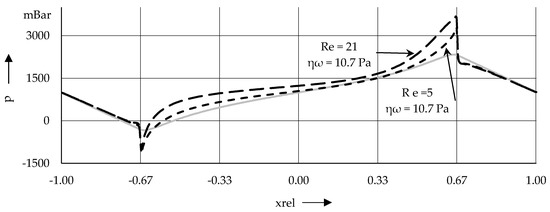
Figure 9.
Pressure distribution acting on the seal surface for different Reynolds numbers (Simulations 3–4). The grey curves represent the corresponding solutions of the Reynolds equation.
In Figure 8, the pressure curves for simulations 1–3 calculated with the complete Navier–Stokes equation (black lines) are compared with those based on the analytical solution of the Reynolds equation (grey lines). The calculation of the pressure distribution based on the solution of the Reynolds equation assumes a constant pressure across the film thickness. This assumption leads to a deviation between the calculated pressure distributions already for a Reynolds number Re = 1. The deviation increases with increasing Reynolds number. As shown in [36], even at moderate Reynolds numbers Re = 5, significant deviations between the pressure distributions of more than 20% occur when comparing the pressure acting on the shaft surface. At higher Reynolds numbers Re = 21, the influence of inertial forces increases, leading to more significant differences of more than 60%. The increasing deviation with rising Reynolds number is more clearly visible in Figure 9.
In the figure above, it can also be seen that the location of point p = 1000 mBar shifts upstream (towards negative xrel) and the pressure extrema increase with increasing Reynolds numbers. This leads to an asymmetrical pressure distribution, causing a force with a gap-opening effect. By solving the Reynolds equation, this force is not detectable, since it is caused by inertial effects neglected in that equation. By taking the inertia-induced pressure build-up into account, a fully load-bearing lubricant film is already predicted at lower sliding speeds. Thus, the beneficial effect of microstructuring for friction reduction is already apparent in applications with lower speeds. In addition, the pressure build-up enforces the positive effect with increasing sliding speeds. For these reasons, the further analysis of the fluid flow as well as the structural optimization is carried out by simulations based on the complete Navier–Stokes equation.
3.2. Cavitation
The investigation of the influence of inertial effects has shown that, depending on the operating conditions, the fluid pressure can drop below saturation pressure with increasing film thickness at the beginning of the microstructure. In the real fluid, a change from the liquid to the gas phase occurs under such conditions (cavitation). For structural optimization, this phenomena must be taken into account, hence the further simulations are carried out using cavitatingFoam solver described in Section 2.3.
Exemplary simulation results are shown in Figure 10 and Figure 11 for the operating conditions underlying Figure 7. The fluid parameters used can be taken from Table A3. As deviating boundary conditions, a value of 1 bar is set for the pressure at the inlet and outlet. In Figure 10a, the vapor fraction within the microstructure is shown. From that Figure, it can be seen that at the beginning of the microstructure, liquid is converted into vapor. Downstream, a phase change from vapor to liquid occurs with increasing fluid pressure, thus the cavitation zone is limited to the beginning of the microstructure. The size of the cavitation zone depends on the operating conditions as well as on the film thickness and the geometry of the microstructure. The cavitation zone directly influences the developing velocity field. The vortex shown in Figure 10b develops only in the area filled with liquid. Figure 11 illustrates both the pressure field in the microstructure (a) and the pressure distribution acting on the seal surface (b), both of which are also influenced by the cavitation zone.
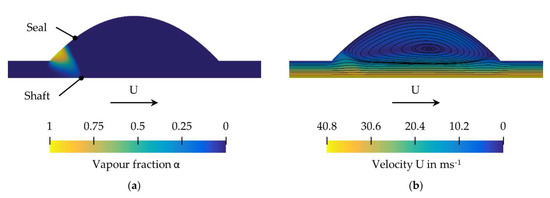
Figure 10.
Exemplary simulation results considering cavitation obtained for the following operating conditions: U = 40.8 m/s, ν = 5.8 mm2/s, h0 = 3µm. (a) Vapour fraction field; (b) Velocity field with corresponding streamlines.
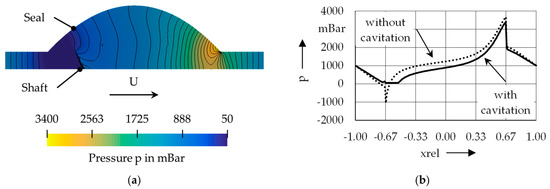
Figure 11.
Exemplary simulation results considering cavitation obtained for the following operating conditions: U = 40.8 m/s, ν = 5.8 mm2/s, h0 = 3µm. (a) Pressure field with contour lines of constant pressure; (b) Pressure distribution acting on the seal surface.
Within the cavitation zone, the pressure is limited to the defined saturation vapour pressure of psat = 50 mBar. Furthermore, a variation of the pressure across the film thickness remains visible. As a result of the cavitation zone, the point p = 1000 mBar shifts downstream. However, the asymmetry in the pressure distribution remains due to the saturation pressure, which represents a lower limit for the pressure.
3.3. Structural Optimization
In order to achieve maximum friction reduction for the radial shaft seal, an optimum geometric shape of the microstructure has to be found. The optimum shape is defined by a maximum hydrodynamic pressure build-up to increase the lubricant film thickness, thus reducing friction. To find an optimum structure, simulations are carried out by varying the structural depth t and the structural density S for a constant diameter of the microstructure D =30 µm, according to the experimental investigations shown in [13]. An isothermal fluid flow is assumed considering cavitation. The operating conditions and fluid parameters are summarized in Table 2.
Table 2.
Operating and fluid parameters for the structural optimization shown in Figure 12.
For the determination of the lubricant film thickness resulting from the hydrodynamic pressure build-up induced by the microstructure, a sequence of stationary simulations is run to reduce the computing time. Starting from two specified film thicknesses h0,1 and h0,2, the film thickness h0,i is determined in an iterative process according to Brent’s method [37] for which an equilibrium between a defined external load and the load-bearing capacity induced by the microstructure is reached. The external load is expressed as the mean pressure pm acting on the seal surface. An illustrative result obtained from the evaluation of these simulations is shown in Figure 12.
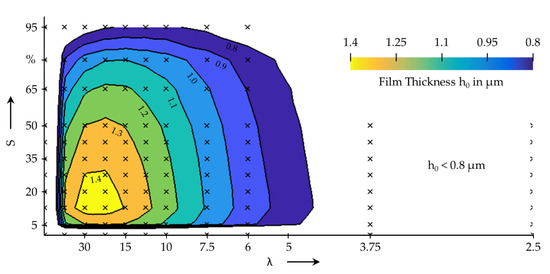
Figure 12.
Structural optimization of the 2D paraboloidal microstructure for constant operating conditions: U = 20.4 m/s, ν = 11.6 mm2/s (T = 80 °C).
The figure shows that both the structural density S and the aspect ratio λ of the microstructure have a considerable influence on the resulting film thickness h0. A reduction of the structural density up to a value of S ≈ 10% leads to an increase in the film thickness. For lower values, h0 decreases again. However, the increase in film thickness becomes smaller as the value of S decreases. For a constant structural density, an increasing aspect ratio leads to an increase of the film thickness. From a ratio dependent on the structural density, however, this behaviour reverses and the film thickness decreases again with a further increase in the aspect ratio. For the operating conditions mentioned, a microstructure with a structural density in the range S = 10–30% and an aspect ratio in the range λ = 15–30 (D = 30 µm → t = 1–2 µm) leads to a maximum film thickness of h0 ≈ 1.4 µm. The friction in the simulations underlying the optimization shown above results from fluid friction only, since solid contact between the seal and the shaft has not been modelled so far. An estimation of the friction regime using the specific lubricant film thickness hrel indicates that for the surface roughnesses measured in [13], pure fluid friction is present for h0,crit > 0.8 µm (hrel = 4). At these low film thicknesses, fluid friction is dominated by fluid shear outside the microstructure. The friction decreases disproportionately with increasing film thickness (FF ~ 1/h0), so that the structure leading to a maximum film thickness also leads to minimum friction.
4. Conclusions
In this article, a methodology for reducing the friction losses of radial shaft seals has been proposed, which is based on microstructuring and surface treatment of the elastomer sliding surface. The design and optimization of the structured sealing lip regarding minimum friction with no-leakage poses a major challenge. Since experimental optimization is linked to high costs and time, a simulation-based method has been proposed. A CFD simulation model of a microstructure has been developed to gain an understanding of the local fluid behavior considering cavitation. Using the simulation model, it has been shown that the analysis of the local fluid flow and the subsequent optimization of deterministic microstructures require the numerical solution of the complete Navier–Stokes equation in order to take inertial effects into account. Based on these results, an optimal geometric shape for the microstructure has been found depending on the operating conditions.
Author Contributions
Conceptualization, D.K.; methodology, D.K., G.J. and S.N.; formal analysis, D.K.; investigation, D.K.; resources, G.J.; writing—original draft preparation, D.K.; writing—review and editing, G.J. and S.N.; supervision, G.J. and S.N.; All authors have read and agreed to the published version of the manuscript.
Funding
This research was funded by the German Federal Ministry of Economics and Energy based on a resolution of the German Bundestag, grant number IGF research project EMAMiD (No. 19194 N).
Conflicts of Interest
The authors declare no conflict of interest.
Appendix A
Table A1.
Mesh study for operating conditions U = 20.4 m/s, ν = 11.6 mm2/s, h0= 3 µm (Re = 5). Simulation results and discretization errors of all examined meshes.
Table A1.
Mesh study for operating conditions U = 20.4 m/s, ν = 11.6 mm2/s, h0= 3 µm (Re = 5). Simulation results and discretization errors of all examined meshes.
| No. | #Cells | h | pm | GCI | t |
|---|---|---|---|---|---|
| 1 | 42 | 2.649 µm | 10,514 N/mm2 | --- | --- |
| 2 | 168 | 1.325 µm | 8383 N/mm2 | --- | --- |
| 3 | 672 | 0.662 µm | 7910 N/mm2 | --- | --- |
| 4 | 2688 | 0.331 µm | 6980 N/mm2 | 8.41% | 0.2 min |
| 5 | 6048 | 0.221 µm | 6765 N/mm2 | 5.21% | 0.9 min |
| 6 | 10752 | 0.166 µm | 6678 N/mm2 | 2.59% | 2.9 min |
| 7 | 18522 | 0.126 µm | 6621 N/mm2 | 2.37% | 9.0min |
| 8 | 32928 | 0.095 µm | 6586 N/mm2 | 1.27% | 23.2 min |
| 9 | 57498 | 0.072 µm | 6561 N/mm2 | 0.80% | 71.5 min |
| 10 | 88872 | 0.058 µm | 6549 N/mm2 | 0.56% | 108.9 min |
Table A2.
Mesh study for operating conditions U = 40.8 m/s, ν = 5.8 mm2/s, h0= 3 µm (Re = 21). Simulation results and discretization errors of all examined meshes.
Table A2.
Mesh study for operating conditions U = 40.8 m/s, ν = 5.8 mm2/s, h0= 3 µm (Re = 21). Simulation results and discretization errors of all examined meshes.
| No. | #Cells | h | pm | GCI | t |
|---|---|---|---|---|---|
| 1 | 42 | 2.649 µm | 28.551 N/mm2 | --- | --- |
| 2 | 168 | 1.325 µm | 27.869 N/mm2 | --- | --- |
| 3 | 672 | 0.662 µm | 28.732 N/mm2 | --- | --- |
| 4 | 2688 | 0.331 µm | 25.839 N/mm2 | 8.62% | 0.1 min |
| 5 | 6048 | 0.221 µm | 25.071 N/mm2 | 5.35% | 0.6 min |
| 6 | 10752 | 0.166 µm | 24.744 N/mm2 | 3.01% | 2.0 min |
| 7 | 18522 | 0.126 µm | 24.528 N/mm2 | 2.49% | 5.2 min |
| 8 | 32928 | 0.095 µm | 24.385 N/mm2 | 1.55% | 16.3 min |
| 9 | 57498 | 0.072 µm | 24.286 N/mm2 | 1.05% | 46.5 min |
| 10 | 88872 | 0.058 µm | 24.232 N/mm2 | 0.77% | 123.3 min |
Table A3.
Fluid parameters for the analysis of cavitation.
Table A3.
Fluid parameters for the analysis of cavitation.
| Parameter | Symbol | Value | Unit |
|---|---|---|---|
| Temperature | T | 110 | °C |
| Inlet/Outlet Pressure | pa | 1 × 10⁵ | Pa |
| Liquid | |||
| Viscosity | νLiq | 5.80 × 10⁻⁶ | m2 s−1 |
| Density | ρLiq | 793.4 | kg m−3 |
| Compressibility | ψLiq | 0.694 × 10⁻⁶ | s2 m−2 |
| Saturation Pressure | psat | 5 × 10³ | Pa |
| Vapour | |||
| Viscosity | νvap | 0.96 × 10⁻⁶ | m2 s−1 |
| Density | ρvap | 9.34 | kg m−3 |
| Compressibility | ψvap | 19.8 × 10⁻⁶ | s2 m−2 |
References
- Müller, H.K.; Nau, B.S. Fluid Sealing Technology; Routledge: New York, NY, USA, 1998; ISBN 978-082-479-969-4. [Google Scholar]
- Mileti, M.; Strobl, P.; Pflaum, H.; Stahl, K. Design of a Hyper-High-Speed Powertrain for EV to Achieve Maximum Ranges. In Proceedings of the CTI Symposium, Berlin, Germany, 3–5 December 2018; pp. 265–273. [Google Scholar] [CrossRef]
- Haas, W. Grundlehrgang Dichtungstechnik. Available online: www.ima.uni-stuttgart.de/dokumente/forschung/dichtungstechnik/skript_dichtungstechnik.pdf (accessed on 31 March 2020).
- Etsion, I.; Halperin, G.; Brizmer, V.; Kligerman, Y. Experimental Investigation of Laser Surface Textured Parallel Thrust Bearings. Tribol. Lett. 2004, 17, 295–300. [Google Scholar] [CrossRef]
- Ryk, G.; Kligerman, Y.; Etsion, I. Experimental Investigation of Laser Surface Texturing for Reciprocating Automotive Components. Tribol. Trans. 2002, 45, 444–449. [Google Scholar] [CrossRef]
- Kligerman, Y.; Etsion, I.; Shinkarenko, A. Improving Tribological Performance of Piston Rings by Partial Surface Texturing. J. Tribol. 2005, 127, 632–638. [Google Scholar] [CrossRef]
- Etsion, I.; Kligerman, Y.; Halperin, G. Analytical and Experimental Investigation of Laser-Textured Mechanical Seal Faces. Tribol. Trans. 1999, 42, 511–516. [Google Scholar] [CrossRef]
- Etsion, I.; Halperin, G. A Laser Surface Textured Hydrostatic Mechanical Seal. Tribol. Trans. 2002, 45, 430–434. [Google Scholar] [CrossRef]
- Neumann, S.; Jacobs, G.; Feldermann, A.; Straßburger, F. Reducing Friction and Leakage by Means of Microstructured Sealing Surfaces. In Proceedings of the 10th International Fluid Power, Dresden, Germany, 8–10 March 2016; pp. 493–506. Available online: Nbn-resolving.org/urn:nbn:de:bsz:14-qucosa-199867 (accessed on 31 March 2020).
- Stoll, M.; Dakov, N.; Hörl, L.; Bauer, F. Functional Behaviour of Different Back Structures for PTFE Shaft Seals. In Proceedings of the 20th International Sealing Conference, Stuttgart, Germany, 10–11 October 2018; pp. 105–118. [Google Scholar]
- Dakov, N.; Feldmeth, S.; Stoll, M.; Bauer, F. On the Estimation of the Dynamic Leak-Tightness of Shaft Seals with Hydrodynamic Sealing Aids through a Hydrodynamic Parameter. Tribol. Online 2019, 14, 359–366. [Google Scholar] [CrossRef]
- Neumann, S.; Jacobs, G.; Straßburger, F. Simulation einer mikrostrukturierten Laufwerkdichtung als flexibles Mehrkörpersystem mit Kopplung zur Elastohydrodynamik. In Proceedings of the 18th International Sealing Conference, Stuttgart, Germany, 8–9 October 2014; pp. 482–502. [Google Scholar]
- Keller, D.; Jacobs, G.; Kramer, A.; Neumann, S.; Paulkowski, D.; Eifel, S. Reibungsreduktion dynamischer Elastomerdichtungen durch Lasermikrostrukturierung und plasmapolymere Beschichtung. In Proceedings of the 6th ATZ Conference on Tribology, Esslingen am Neckar, Germany, 20–21 November 2017. [Google Scholar] [CrossRef]
- ISO 6194-1. Rotary Shaft Lip-Type Seals Incorporating Elastomeric Sealing Elements: Nominal Dimensions and Tolerances; Beuth Verlag GmbH: Berlin, Germany, 2007. [Google Scholar]
- Schmid, E. Handbuch der Dichtungstechnik; Expert Verlag: Grafenau, Germany, 1981; ISBN 3-88508-504-6. [Google Scholar]
- Klaiber, M. Betriebs- und Benetzungseigenschaften im Dichtsystem Radial-Wellendichtring am Beispiel von Additivierten Synthetischen Schmierölen. Ph.D. Thesis, University of Stuttgart, Stuttgart, Germany, 2013. [Google Scholar]
- Patir, N.; Cheng, H.S. An Average Flow Model for Determining Effects of Three-Dimensional Roughness on Partial Hydrodynamic Lubrication. J. Lubr. Technol. 1978, 100, 12–17. [Google Scholar] [CrossRef]
- Greenwood, J.A.; Williamson, J.B.P. Contact of Nominally Flat Surfaces. Proc. R. Soc. A: Math. Phys. Eng. Sci. 1966, 295, 300–319. [Google Scholar] [CrossRef]
- Truckenbrodt, E. Fluidmechanik, 4th ed.; Springer: Berlin/Heidelberg, Germany, 2008; ISBN 978-3-540-79018-1. [Google Scholar]
- OpenFOAM Foundation. Available online: www.openfoam.org/ (accessed on 31 March 2020).
- Hartinger, M. CFD Modelling of Elastohydrodynamic Lubrication. Ph.D. Thesis, University of London, London, UK, 2007. [Google Scholar]
- Chung, M.-S.; Park, S.-B.; Lee, H.-K. Sound Speed Criterion for Two-Phase Critical Flow. J. Sound Vib. 2004, 276, 13–26. [Google Scholar] [CrossRef]
- Greenshields, C.J. OpenFOAM Programmer’s Guide. Available online: Blogs.cuit.columbia.edu/zp2130/files/2018/05/ProgrammersGuide.pdf (accessed on 31 March 2020).
- Ferziger, J.H.; Perić, M. Numerische Strömungsmechanik; Springer: Berlin/Heidelberg, Germany, 2008; ISBN 978-3-540-67586-0. [Google Scholar]
- Laurien, E.; Oertel, H., Jr. Numerische Strömungsmechanik, 5th ed.; Springer: Wiesbaden, Germany, 2013; ISBN 978-3-658-03144-2. [Google Scholar]
- Spalding, D.B. A Novel Finite Difference Formulation for Differential Expressions Involving both First and Second Derivatives. Int. J. Numer. Methods Eng. 1972, 4, 551–559. [Google Scholar] [CrossRef]
- Schwarze, R. CFD-Modellierung; Springer: Berlin/Heidelberg, Germany, 2013; ISBN 978-3-642-24377-6. [Google Scholar]
- Roache, P.J. Perspective—A Method for Uniform Reporting of Grid Refinement Studies. J. Fluids Eng. 1994, 116, 405–413. [Google Scholar] [CrossRef]
- Celik, I.B.; Ghia, U.; Roache, P.J.; Freitas, C.J.; Coleman, H.; Raad, P.E.; Celik, Ì.; Freitas, C.; Coleman, H.P. Procedure for Estimation and Reporting of Uncertainty Due to Discretization in CFD Applications. J. Fluids Eng. 2008, 130, 780011–780014. [Google Scholar] [CrossRef]
- Patankar, S.V.; Spalding, D.B. A Calculation Procedure for Heat, Mass and Momentum Transfer in Three-Dimensional Parabolic Flows. Int. J. Heat Mass Transf. 1972, 15, 1787–1806. [Google Scholar] [CrossRef]
- Bartel, D. Simulation von Tribosystemen, 1st ed.; Vieweg + Teubner Research: Wiesbaden, Germany, 2010; ISBN 978-3-8348-1241-4. [Google Scholar]
- Arghir, M.; Roucou, N. Theoretical Analysis of the Incompressible Laminar Flow in a Macro-Roughness Cell. J. Tribol. 2003, 125, 309–318. [Google Scholar] [CrossRef]
- Dobrica, M.B.; Fillon, M. About the Validity of Reynolds Equation and Inertia Effects in Textured Sliders of Infinite Width. Proc. Inst. Mech. Eng. Part J J. Eng. Tribol. 2009, 223, 69–78. [Google Scholar] [CrossRef]
- Dobrica, M.B.; Fillon, M.; Pascovici, M.D.; Cicone, T. Optimizing Surface Texture for Hydrodynamic Lubricated Contacts using a Mass-Conserving Numerical Approach. Proc. Inst. Mech. Eng. Part J J. Eng. Tribol. 2010, 224, 737–750. [Google Scholar] [CrossRef]
- Fowell, M.T.; Medina, S.; Olver, A.V.; Spikes, H.A.; Pegg, I.G. Parametric Study of Texturing in Convergent Bearings. Tribol. Int. 2012, 52, 7–16. [Google Scholar] [CrossRef]
- Keller, D.; Jacobs, G.; Kramer, A.; Neumann, S. Reibungsreduzierung dynamischer Elastomerdichtungen durch die simulationsgestützte Optimierung der mikrostrukturierten Dichtfläche. In Proceedings of the 20th International Sealing Conference, Stuttgart, Germany, 10–11 October 2018; pp. 467–481. [Google Scholar]
- Brent, R.P. Algorithms for Minimization Without Derivatives; Dover Publications: Newburyport, MA, USA, 2013; ISBN 978-0-486-41998-5. [Google Scholar]
© 2020 by the authors. Licensee MDPI, Basel, Switzerland. This article is an open access article distributed under the terms and conditions of the Creative Commons Attribution (CC BY) license (http://creativecommons.org/licenses/by/4.0/).