Article

Avoiding Starvation in Tribocontact Through Active Lubricant Transport in Laser Textured Surfaces

by
Tobias Stark
1,
Thomas Kiedrowski
1,*,
Holger Marschall
2 and
Andrés Fabián Lasagni
3,4
1
Robert Bosch GmbH, Robert-Bosch-Campus 1, 71272 Renningen, Germany
2
Computational Multiphase Flow, Department of Mathematics, Technische Universität Darmstadt, Alarich-Weiss Straße 10, 64287 Darmstadt, Germany
3
Institut für Fertigungstechnik, Technische Universität Dresden, George-Bähr-Str. 3c, 01069 Dresden, Germany
4
Fraunhofer-Institut für Werkstoff- und Strahltechnik IWS, Winterbergstr. 28, 01277 Dresden, Germany
*
Author to whom correspondence should be addressed.
Lubricants 2019, 7(6), 54; https://doi.org/10.3390/lubricants7060054
Submission received: 11 April 2019 / Revised: 16 June 2019 / Accepted: 17 June 2019 / Published: 25 June 2019

Abstract

:
Laser texturing is a viable tool to enhance the tribological performance of surfaces. Especially textures created with Direct Laser Interference Patterning (DLIP) show outstanding improvement in terms of reduction of coefficient of friction (COF) as well as the extension of oil film lifetime. However, since DLIP textures have a limited depth, they can be quickly damaged, especially within the tribocontact area, where wear occurs. This study aims at elucidating the fluid dynamical behavior of the lubricant in the surroundings of the tribocontact where channel-like surface textures are left after the abrasion wear inside the tribocontact area. In a first step, numerical investigations of lubricant wetting phenomena are performed applying OpenFOAM®. The results show that narrow channels (width of 10 μ m ) allow higher spreading than wide channels (width of 30 μ m ). In a second step, fluid transport inside DLIP textures is investigated experimentally. The results show an anisotropic spreading with the spreading velocity dependent on the period and depth of the laser textures. A mechanism is introduced for how lubricant can be transported out of the channels into the tribocontact. The main conclusion of this study is that active lubricant transport in laser textured surfaces can avoid starvation in the tribocontact.

Graphical Abstract

1. Introduction

Tribology is a wide-spread field with various application fields including the automobile industry. For instance, in passenger cars, friction occurs in the engine, transmission, tires and brakes. According to Holmberg et al. [1], the direct frictional losses, with braking friction excluded, represent 28% of the fuel energy. In total, 21.5% of the fuel energy is used to move the car. Therefore, there is an enormous potential to reduce the global energy consumption by enhancing the tribological performance of engine parts. There are also other fields of application, e.g., bionic engineering where, for example, the sandfish’s skin, which is structured in a way that friction is reduced, serves as a model [2].
Laser surface texturing (LST) has shown to be a versatile tool to enhance surface functions. Especially in the field of tribology, it has been used to reduce the coefficient of friction (COF) as well as to extend the oil film lifetime (e.g., [3,4,5,6,7,8]). Several research studies in the field of LST and tribology deal with the fabrication of microholes or dimples forming closed surface structures. Important to mention is the pioneer work of Etsion [9], who has already given an overview in this field by outlining the variety in shape, size and textured density of dimples and the influence of these parameters on different tribological effects. In particular, three different working principles for dimples have been distinguished, denoting that they can serve as (i) micro-reservoirs for lubricant in cases of starved lubrication conditions; (ii) micro-traps for wear debris in either lubricated or dry sliding conditions and (iii) micro-hydrodynamic bearings in cases of full or mixed lubrication. For the last point, cavitation is an important factor because it is necessary to achieve a positive pressure build-up which permits to reduce friction. Therefore, an overall low pressure level is required to be able to reach cavitation pressure. Further information about the cavitation phenomenon has been described by Braun [10].
An important parameter that significantly affects the tribological properties of surfaces is related to the fact if the textures have an open or closed characteristic. For example, if a lubricant can be displaced through open surface textures, starvation in the tribocontact might occur which results in a higher COF. On the other hand, lubricant can also be transported actively in open surface textures which might act as a supply of lubricant. The following paragraph therefore outlines the tribological effect of open surface textures.
For example, Wahl [5] compared the behavior of dimples (close) and channel-like (open) structures with different orientation with regard to the sliding direction. For the channels, the width was varied from 60 to 300 μ m and the depths were 10 and 50 μ m . It was found that for high sliding velocities (> 0.5 m / s ), dimples (close morphology) could reduce the coefficient of friction whereas the cross-like channels (open morphology) show a significant increase of the coefficient of friction, both compared to a polished reference sample. Nonetheless, Stark et al. [11] found that channel-like structures in a cross-like pattern can also reduce the COF, when using smaller feature sizes. In that work, two different laser texturing methods were applied, namely Direct Laser Writing (DLW) and Direct Laser Interference Patterning (DLIP). For the DLW method, the widths of the channels were 12 and 30 μ m and the structure depth was varied between 3 and 24 μ m . It was found, that the overall reduction for the mixed lubrication regime can be up to 33%. Additionally, it was found that similar results can be obtained applying DLIP method when fabricating channels with a cross-like pattern geometry. With this method the period of the textures were 4 and 8 μ m and the depths around 1 μ m . DLIP allows higher throughput compared to DLW [12]. A drawback, however, is that, due to their limited depths, DLIP textures are erased quickly inside the tribocontact where wear occurs. During the testcycle for the tribological evaluation it could be shown that the DLIP textures were erased quickly after the start of the cycle but afterwards the COF stayed at a low level. This was the finding of a temporal investigation of the relation between wear picture and reduction of COF (not shown). Since the DLIP textures inside the tribocontact are erased they cannot be responsible for keeping the COF low. However, in the direct surrounding of the contact point the textures are still present. They form a seamless transition into the tribocontact. The motivation of this work is to investigate whether lubricant can be transported actively in the DLIP textures and how this transport can avoid starvation. Starvation may lead to increased friction, wear and could result in the total malfunction of a machine. Starvation in the tribocontact occurs if oil is displaced from the tribocontact due to various effects such as inertial or thermal phenomena. A solution is to guarantee oil presence in the tribocontact.

1.1. Solution Approach

Klima [13] followed the approach of active lubricant transport towards the tribocontact with the objective to avoid starvation. The driving force for the transport in the channel-like textures is the capillary effect. For this effect, Lucas [14] and Washburn [15] derived the so-called Lucas–Washburn equation which describes a square-root dependence of the fluid column length L u ( t ) from the time:
L u ( t ) = b γ cos ( θ ) 4 η t = W t ,
where W is a factor combining multiple parameters which essentially governs the speed of fluid advancement [13]. Equation (1) was verified experimentally for circular tubes [15]. However, there have also been investigations for microchannels with different cross-sections (e.g., [16,17]). They found a Washburn-like behavior with the same time law L u ( t ) t . Gruetzmacher et al. [18] investigated the flow behavior of a typical lubricant in DLIP textures and found an anisotropic spreading behavior with a higher spreading velocity parallel to the surface patterns compared to perpendicular to them. In the study of Klima [13], the textures ended at the transition region into the tribocontact in order to avoid fluid displacement. The difference in this study is that the textures are created throughout the entire sample, except for the last part, were selective structuring is applied. Since the DLIP textures have a low depth and therefore are erased quickly inside the tribocontact, the lubricant transport in the surrounding channel-like textures might be important. Since the DLIP textures are in the lower micrometer-range, microfluidics play an important role. Therefore, an important non dimensional number is introduced. Non dimensional numbers are of the utmost importance to compare the relative importance of different physical phenomena [19]. The Bond number compares the relative importance of gravity and surface tension:
Bo = ρ g l 2 γ ,
where l is a characteristical length, in our case the channel width. When the length l = l c , Bo = 1 . l c is the capillary length which is defined as
l c = γ ρ g ,
where γ is the surface tension between the liquid and an adjacent fluid, typically air, and g is the gravitational acceleration. For this study, l c is around 2 m m , which is much larger than our characteristic length for the DLIP textures which leads to a small Bond number. A small Bond number indicates that surface forces dominate gravity. This is typical for microfluidics and often allows the neglect of gravitational influence.
In order to better understand the microfluidic transport processes, a numerical model is applied. For this model, the open-source platform OpenFOAM® is applied. The two-phase wetting phenomena are described by the phase-field method. In this method, the Cahn-Hilliard equation describing the multiphase system is coupled with the Navier Stokes equations governing the flow phenomena. Due to the diffusive character of the Cahn-Hilliard equation, this method allows a motion of the contact line in combination with a no-slip boundary condition at the solid wall [20]. The first implementation of this method in OpenFOAM® was done by Cai et al. [21] who validated the numerical model for different test cases and investigated the wetting phenomena of a droplet on a flat substrate. Fink et al. [22] investigated the hydrophobicity of micro-textured surfaces and showed good agreement between the numerical model and experiments, at least for the advancing phase.

1.2. Outline of Article

This study aims at elucidating the underlying phenomena of oil transport in DLIP textures and oil transition into the tribocontact. To this end, first, a numerical model is introduced and applied. It allows the investigation of the spreading (advancing phase) of a fluid in channels of different sizes which are typical for the case of laser textured surfaces (widths down to 10 μ m ). The results of the numerical investigation convey the idea that the capillary effect inside the channels is the driving force for the oil transport in the channels towards the tribocontact (similar to the work from Klima [13]). In a second step, experiments for understanding the fluid transport in DLIP channels are conducted. These are twofold. On the one hand, the fluid transport inside the channel-like textures is examined and on the other hand one possible transition process of the oil out of the channels into the tribocontact is investigated.

2. Materials and Methods

2.1. Materials

For the texturing, the fluid transport evaluation and the tribological experiments, martensitic stainless steel X90CrMoV18 (1.4112) was used. The sheets were cut in rectangular shaped parts of 16   m m × 16   m m and 16   m m × 6   m m for the fluid transport and the tribological evaluation, respectively. All samples were polished by lapping in order to obtain a roughness of R z = 0.20   μ m . Before the experiments, the polished samples were treated with the laser except for the reference sample. All samples were cleaned using isopropanol in an ultrasonic bath for 10 min . Afterwards, the samples were dried and then rinsed with petrolether (boiling temperature 40 to 60 C ). This procedure was repeated before the laser process, before the fluid transport experiments and before the tribological evaluation.
As a lubricating oil, a Polyalphaolefin (PAO) with a viscosity of 39.5 m m / s at 25 C (operating condition) was used. It is the base oil of the commonly used grease Isoflex Topas L32. This oil has no additives in order to avoid side effects which are not induced by the surface structures. The properties of this oil were also used for the numerical model. There, it was assumed that the oil has the behavior of a Newtonian fluid.
As a tribological counterbody, a 100Cr6 ball with a diameter of 12.7 m m was used.

2.2. Numerical Methods

This section introduces the mathematical formulation of the diffuse interface model. In our method the Cahn-Hilliard phase-field equation and the Navier-Stokes equations are coupled.

2.2.1. Phase-Field Approach for Interface Evolution

In the phase-field method, the phase distribution of two phases, liquid (L) and gas (G), is described by an order parameter C. This parameter takes respective values C L = 1 and C G = 1 for the corresponding bulk phases and varies rapidly but smoothly in a transition layer, which is called the diffuse interface. The interface dynamics is governed by an evolution equation for C, the convective Cahn-Hilliard equation. It is important to note that it is the diffusion process of C that governs the motion of the contact line. The Cahn-Hilliard equation reads
C t + · u C = κ Δ Φ ,
where u is the velocity field, t is the time, κ the mobility and Φ the chemical potential, which is defined as
Φ = λ ε 2 C ( C 2 1 ) λ Δ C .
Here, ε is an interfacial thickness parameter and λ is the energy mixing parameter,
λ = 3 σ ϵ 2 2 .
As can be seen, it depends on the surface tension σ and ε . The Cahn number C n = ε / L ref relates the interfacial width to the macroscopic length scale.

2.2.2. Governing Equations for the Fluid Flow

In this study, two immiscible, incompressible, isothermal Newtonian fluids are considered. Hence, one can describe the two-phase flow by the Navier-Stokes equations in the following form:
· u = 0
( ρ u ) t + · ρ u u = p · μ ( u + ( u ) T ) + f σ + ρ g
The density and viscosity fields depend on the order parameter as
ρ = 1 + C 2 ρ L + 1 C 2 ρ G ,
μ = 1 + C 2 μ L + 1 C 2 μ G ,
where ρ L , G and μ L / G are the density and viscosity of the pure phases. In Equation (8), p denotes the pressure field and f σ the surface tension force which reads
f σ = C Φ .

2.2.3. Numerical Aspects

Simliar to the work from Cai et al. [21], OpenFOAM® was applied to solve the above system of equations numerically with a finite-volume method. Spatial derivatives are approximated by a high-resolution scheme (Gamma scheme) and time integration is performed by a second-order two time level backward scheme (Gear’s method). The time step is chosen such that the maximum Courant number is 0.1. For further details see [21]. As suggested by Zolper et al. [23], PAO is considered to behave as a Newtonian fluid. In OpenFOAM®, it is also possible to model fluids with non-Newtonian behavior. However, the multiphase character of the problem in this study makes this more challenging, see for example [24]. Nevertheless, Niethammer et al. [25] show a rigorous treatment of a gas–liquid system with a non-Newtonian liquid phase. In this study, focus is laid on the steady state solution which does not depend on the transient viscosity behavior.

2.3. Experimental Methods

2.3.1. Laser Surface Texturing

For the DLIP texturing process, an ultrashort pulsed laser (Trumpf Trumicro 5 × 50) was used, with a wavelength of 1030 n m and a pulse length of 6 ps. The base repetition rate was 400 k Hz . A DLIP optical head (Fraunhofer IWS, Dresden, Germany) is installed to automatically create the interference pattern. The setup of the optical head has been already published elsewhere [26]. In this study, the interference of two coherent laser beams was used, which leads to a line-like structure. The objective for the laser texturing is to obtain textures with a period of 4.0 μ m and 8.0 μ m with two depths for each period and the constraint that one depth should be comparable for both periods. The final period can be adjusted by fixing a pyramid position inside the optical head which influences the optical path. Since the optical head is installed in a fixed position the samples are moved on a linear axis system. They are moved with a speed of 25 m m / s in a meandering shape with an offset given by the hatch distance. This distance needs to be a multiple of the period in order to avoid destruction of the textures. In Table 1, the laser parameters applied to create the DLIP textures are outlined. The laser parameters need to be adapted for the different textures to guarantee good quality because they all influence each other. For example, S2 and S3 should have a period of 8.0 μ m and 4.0 μ m , respectively, but at the same time the depth should be the same. Therefore, if all other parameters stay the same, the pulse energy must be reduced if the hatch distance for the 4.0 μ m period is smaller. As a summary, the most uniform line-like textures can be produced for low pulse energies with small hatch distances and a comparably small pulse overlap. The reservoir and the scale on the fluid transport samples were also textured with an ultrashort pulsed laser (Trumpf Trumicro 5070 Femto Edition).

2.3.2. Fluid Transport Evaluation

The pictures and videos for the fluid transport evaluation were taken with a Keyence microscope using two different lenses (20×–200× magnification and 100×–1000× magnification). Figure 1a shows the experimental setup for the fluid transport experiments and Figure 1b shows the setup for the fluid transition experiments with the glass lens. 1 μ l of the oil was dispensed on the sample inside the textured reservoir with the help of an Eppendorf pipette. The glass lens used as a counterpart in the meniscus experiments was an uncoated plano-convex lens made of N-BK7 with the same radius of curvature as the original tribological counterpart.

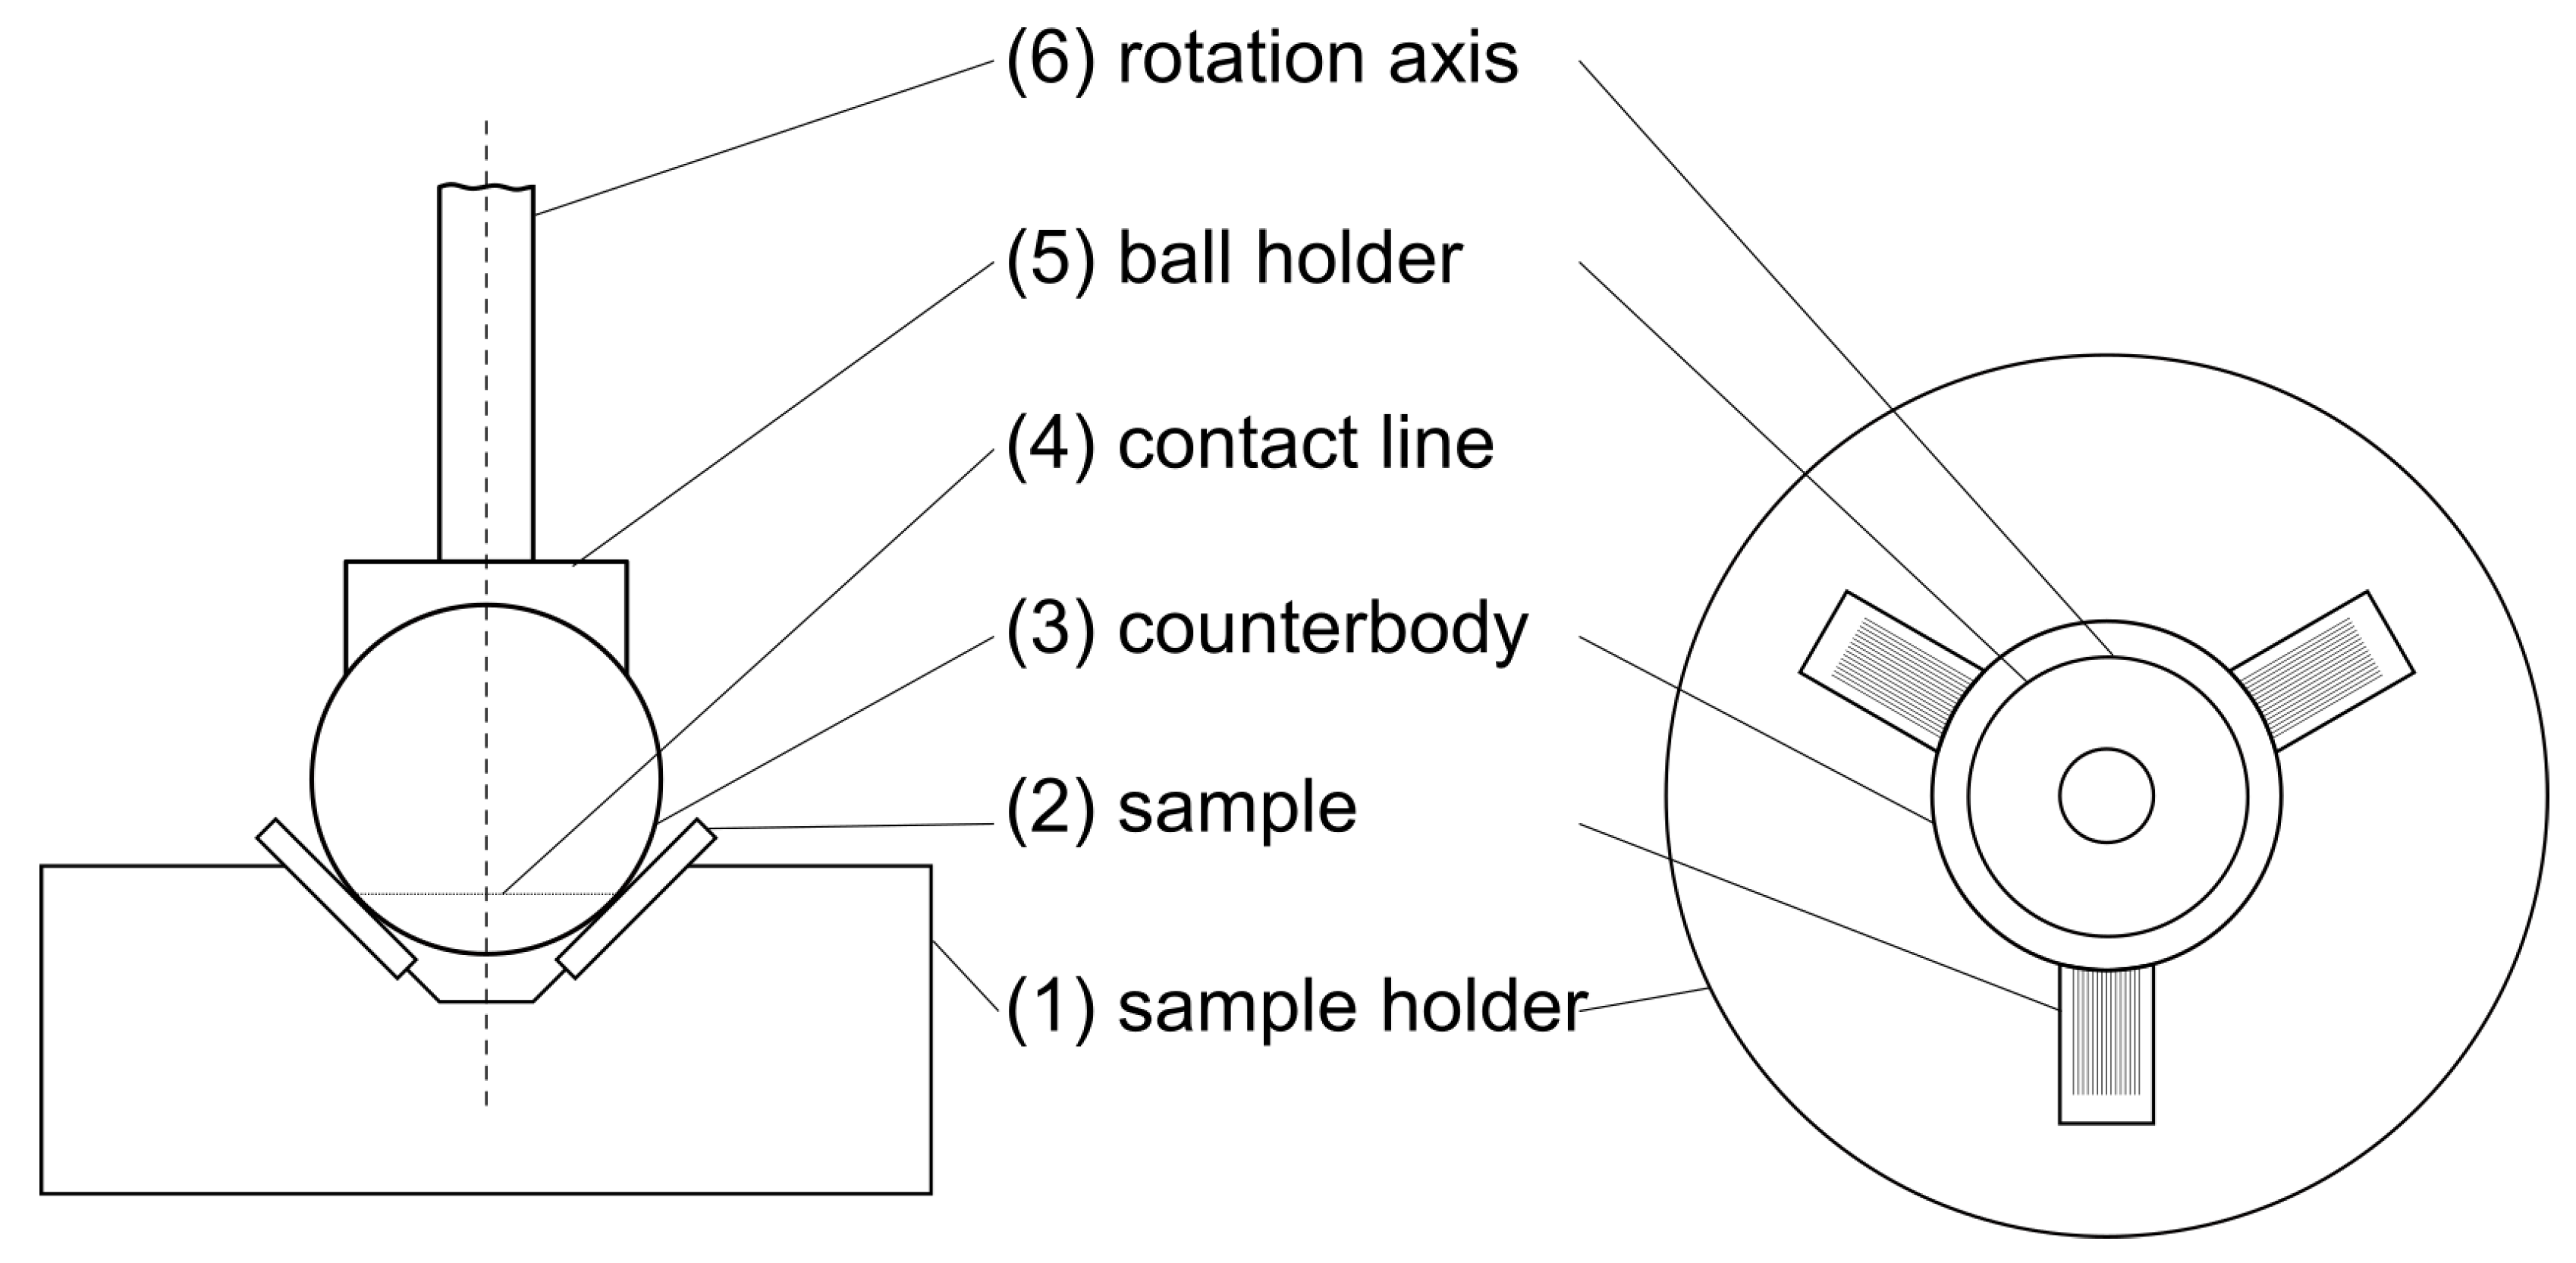
2.3.3. Characterization of Tribological Properties

For the tribological evaluation of the surface textures, an Anton Paar Tribometer (MCR301) was used. This device is a ball-on-three-plates tribometer. Figure 2 shows the experimental setup. As a first step, three samples were fixed in the sample holder with an angle of 45° regarding the horizontal plane. Secondly, 1 μ L of the PAO was put on each sample with a μ L-pipette (Eppendorf). Then, the sample holder was fixed on the device and the ball in the ball-holder was placed above the sample. The ballholder was approached to the sample which makes the oil ousted around the tribocontact. Finally, a normal force of 20 N was applied, which corresponds to 9.43 N per sample. When this force is reached, the ball started to rotate and the measurement cycle began. The measurement cycle consisted of 9 Stribeck curves, which were grouped in 3 sections. Furthermore, it consisted of three endurance parts at the beginning of the cycle and in between the Stribeck sections. Their purpose is to avoid run-in behavior. The total normal force always was 20 N and the rotation speed during the endurance parts was 20 rpm which corresponds to a sliding velocity of 0.009 m / s . The Stribeck curves were recorded using a logarithmic ramp. The normal force per sample of 9.43 N is kept constant while the ball starts to rotate and speeds up to a sliding velocity of 1.4 m / s . The COF is recorded during the entire ramp. Within the test cycle this procedure is repeated nine times such that in the end a mean value and the standard deviation of the COF versus the sliding velocity can be determined.

2.3.4. Surface Characterization

A Laser Confocal Microscope (Olympus LEXT OLS4000) was used to characterize the surface morphology of the laser treated samples. For postprocessing of the images the software MountainsMap was applied.

3. Results and Discussion

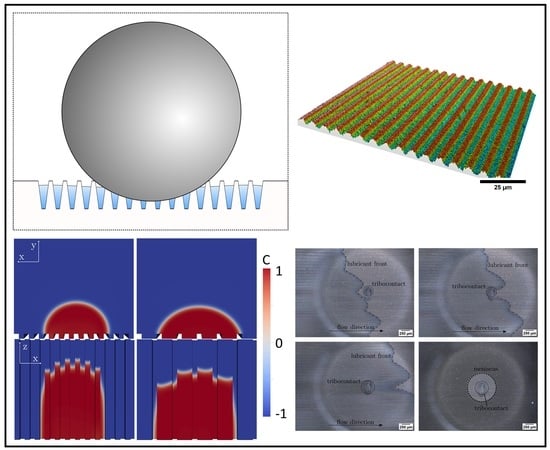
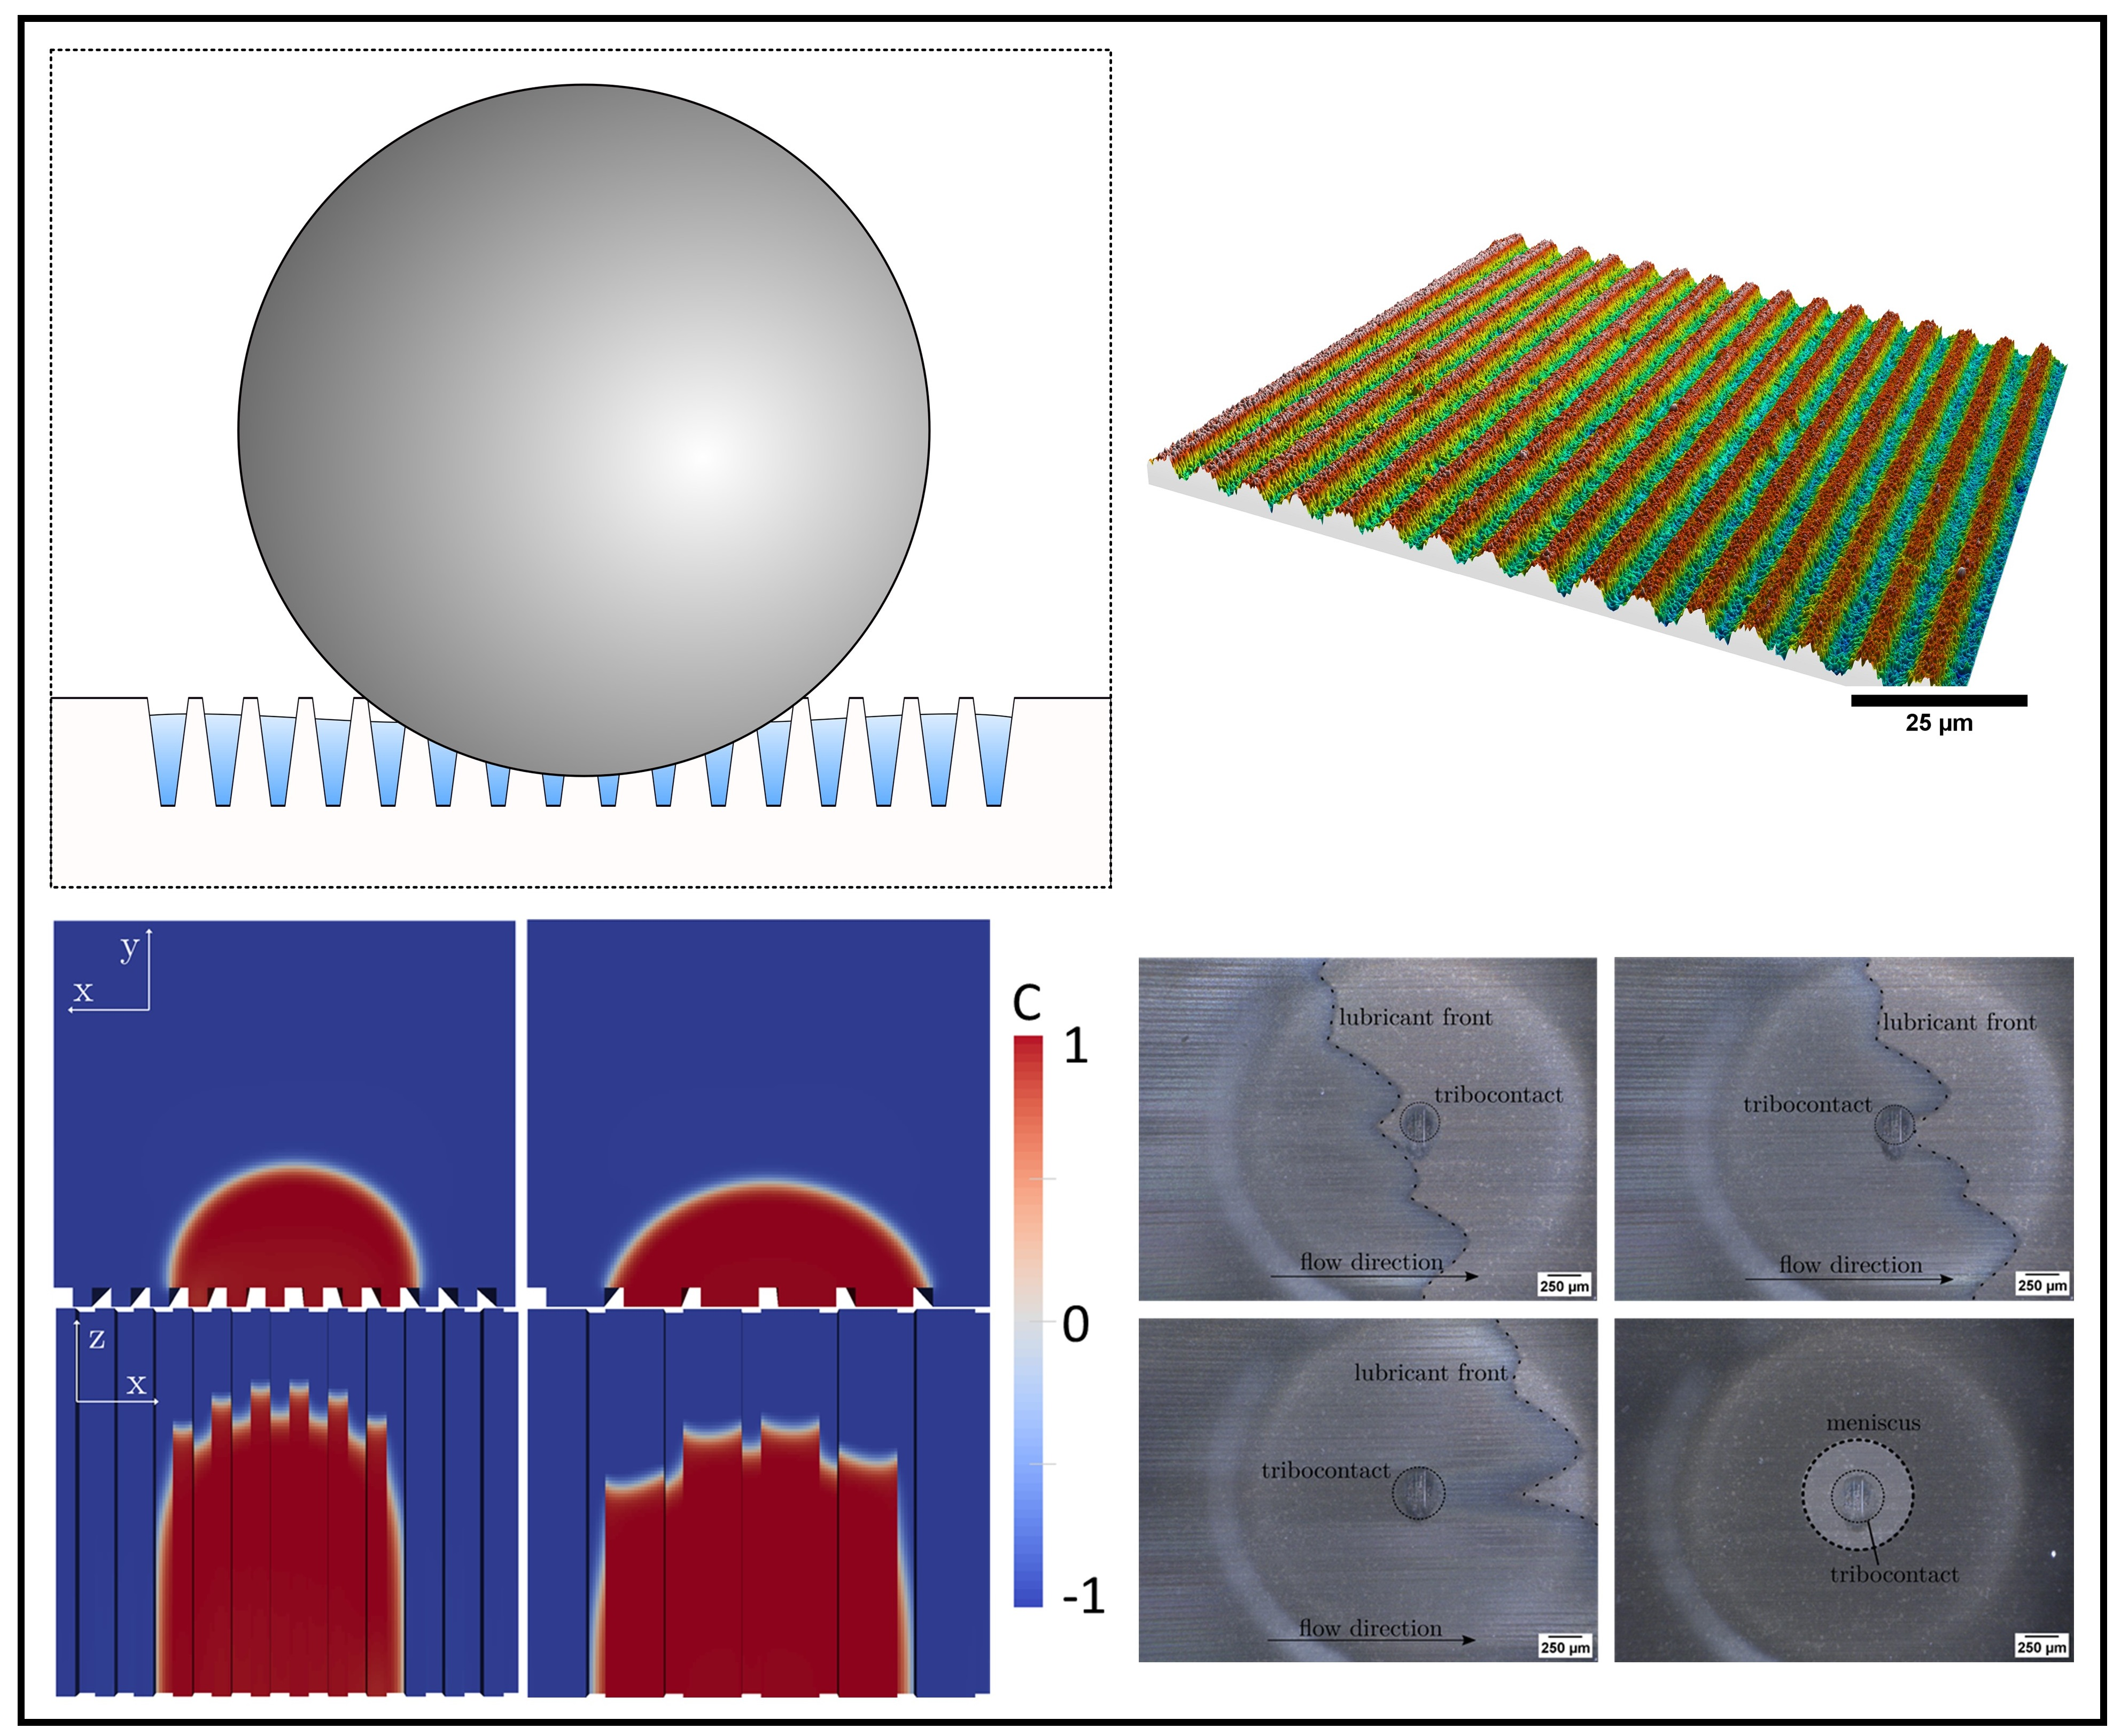
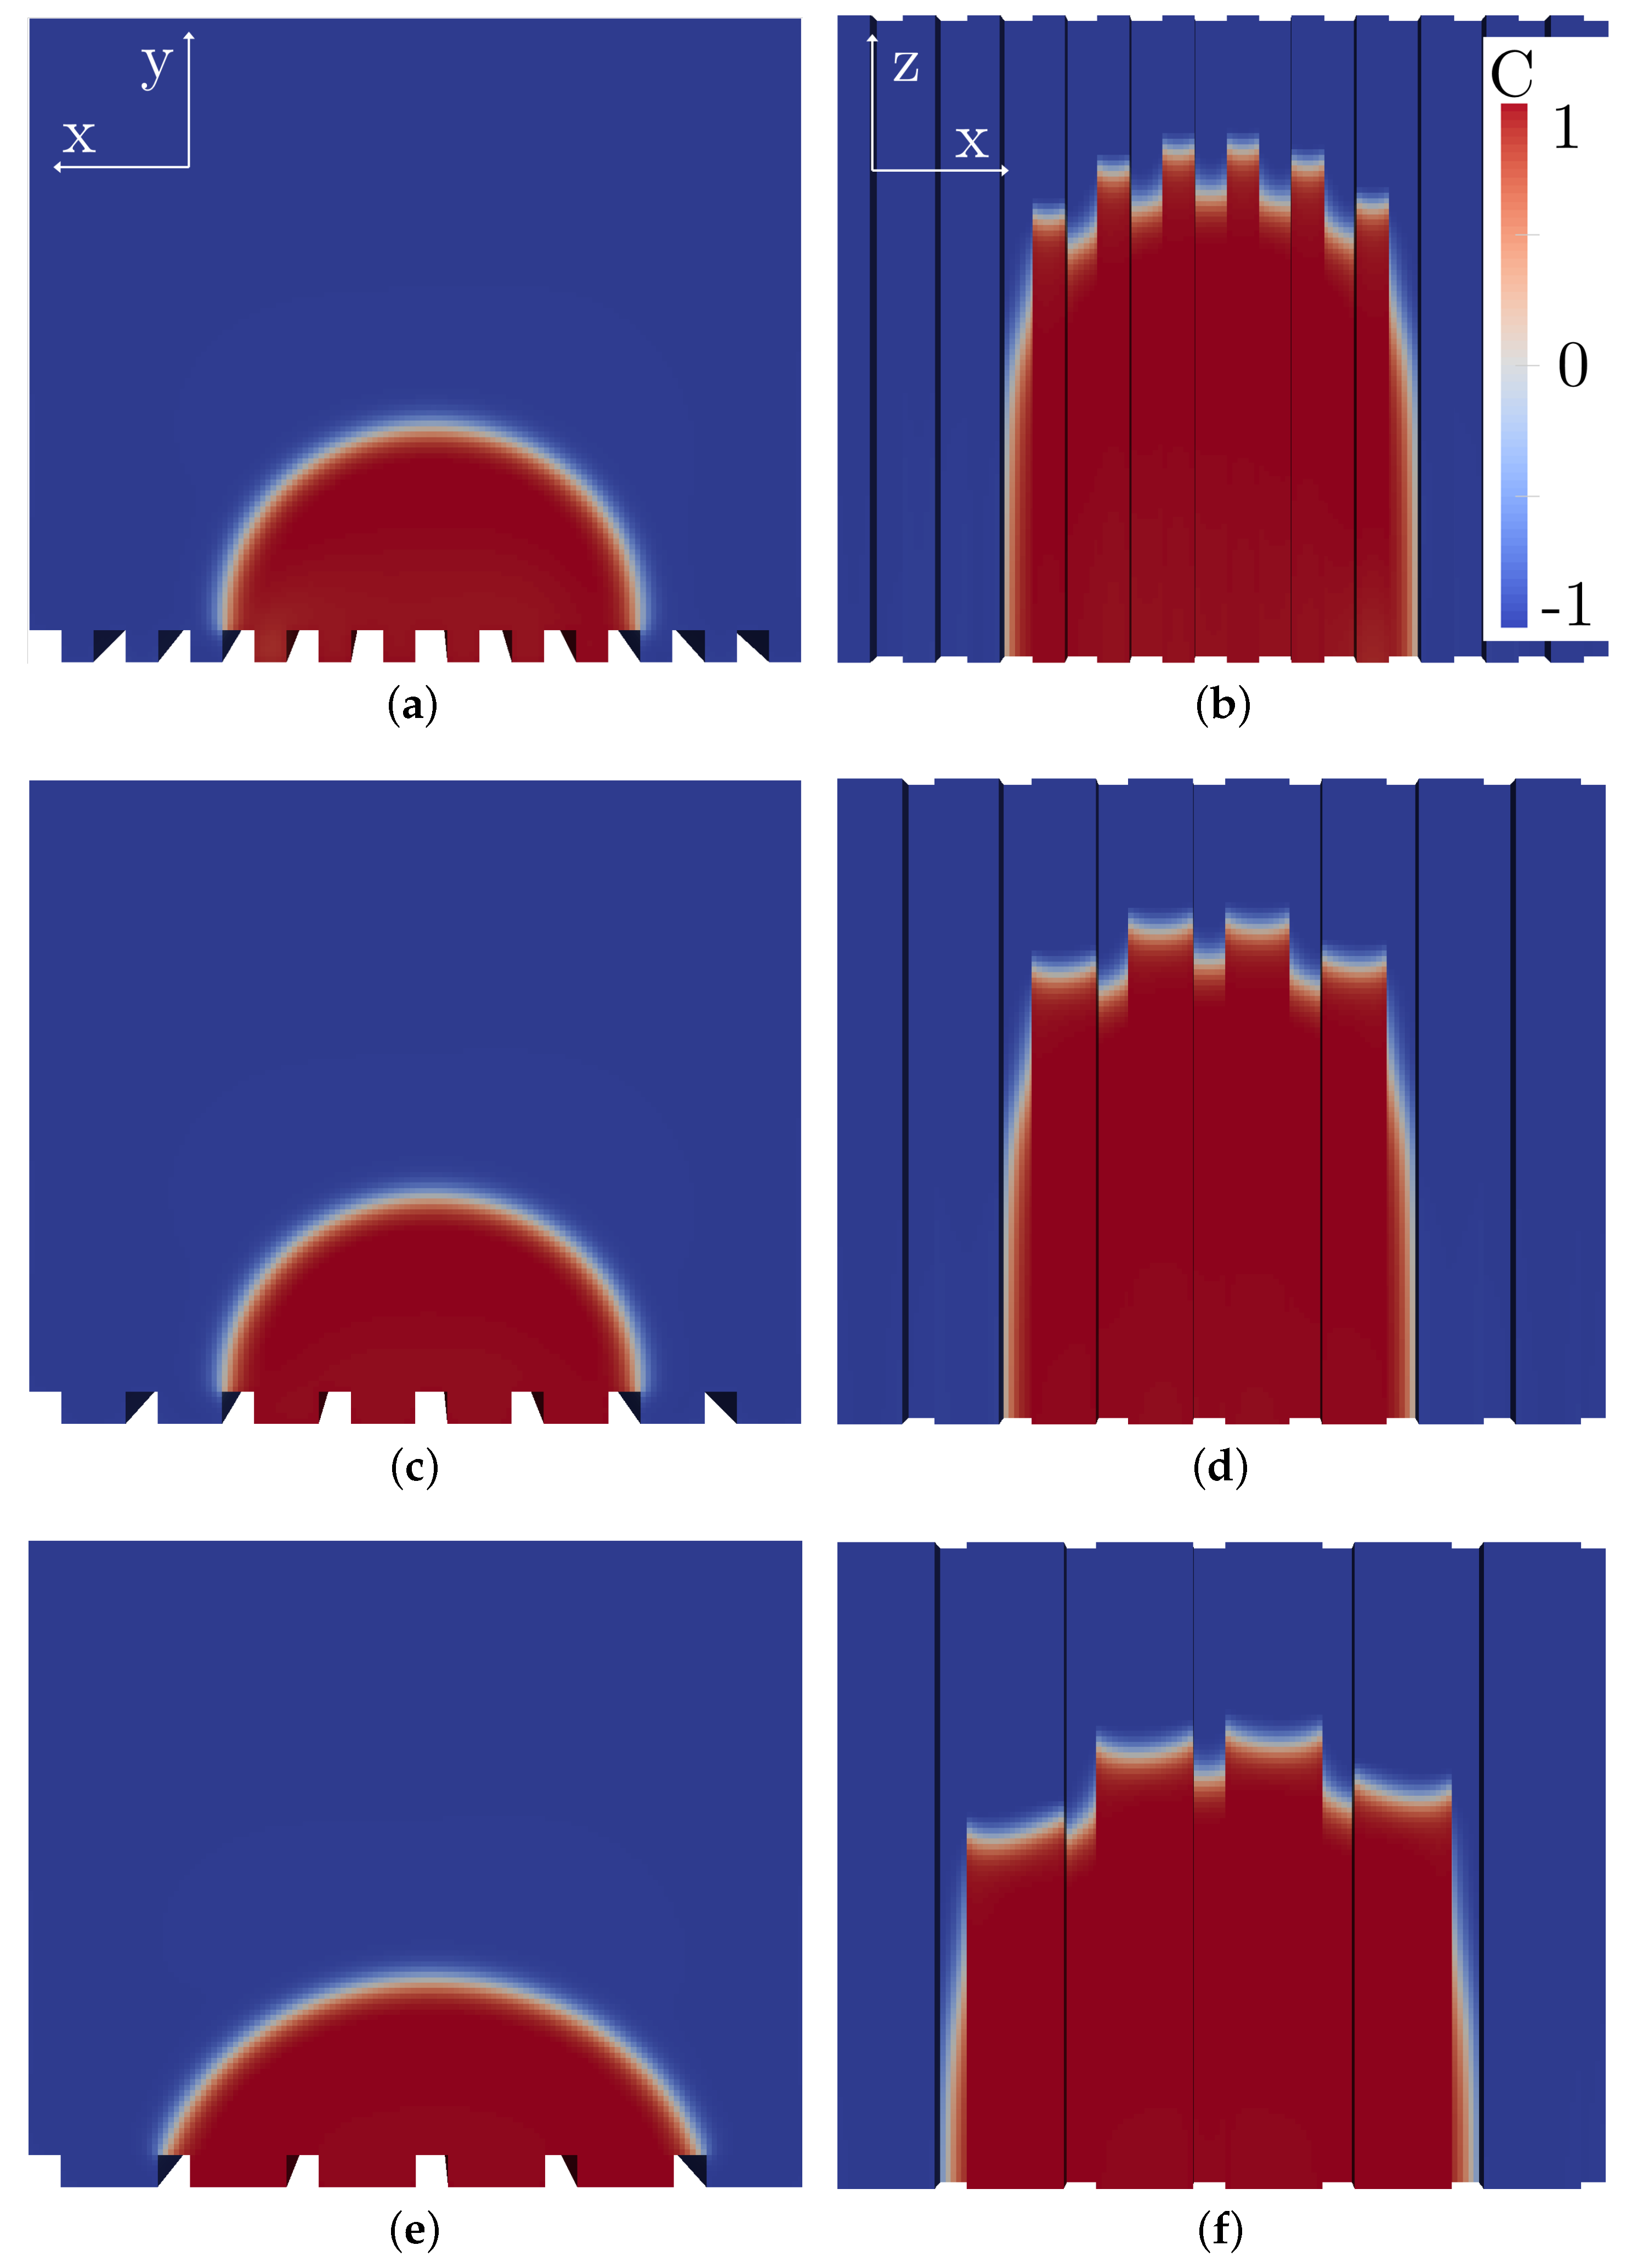
3.1. Numerical Results-Droplet Wetting on Line-Like Textures

In Figure 3, the numerical results for the case of droplet wetting on line-like textures are shown. The wetting process of a droplet with an initial diameter of 140 μ m and an impact velocity of 1 × 10 6 m / s is investigated for line-like textures with channel widths of 10 to 30 μ m . The depth of the channels is kept constant at 10 μ m . The equilibrium contact angle for all cases is 60°. The mesh resolution is the same independent of the channel width and corresponds to a cell length of 1.67 μ m in all directions. As a consequence, the minimum number of cells in a channel is 5. This is neccesary for a correct numerical resolution of the gas–liquid interface. In all simulations, the global Cahn number is C n = 0.02 . In Appendix A.2, a full overview of all numerical parameters and settings is given. Two different views are chosen in order to illustrate the spreading behavior along the line-like textures. The first view (left column in Figure 3) shows a cut through the domain at the geometrical center of the droplet. The second view (right column) shows one half of the spreaded droplet filling the channels from the bottom.
Figure 4 shows the quantitative results of the numerical investigations. For this, the spreading factor χ is defined as
χ = total   extension   of   spreaded   droplet   in   channel initial   droplet   diameter .
This quantity is plotted over a relative simulation time t * which is defined as t * = t / t total , where t total = 0.039   s for all simulations.
From Equation (12), it is possible to see that the smaller the channel width the higher the spreading factor. The minimal channel width in the simulation is 10 μ m . For smaller channels the cell size has to be reduced even further in order to ensure correct representation of the gas–liquid interface. However, smaller cells result in significant higher computational efforts which were not affordable for this study. However, already at a size of 10 μ m , the spreading factor reaches a value greater than 2. Since the driving force is the capillary force inside the channels and since this force increases for smaller widths, the demonstrated effect even increases for smaller channel widths.
This phenomenon illustrates the anisotropic flow behavior of line-like textures which can be applied to guide lubricant towards the tribocontact. Therefore, the numerical results can serve as a theoretical demonstration of the possibility for active lubricant transport in laser textures of small sizes and with a line-like pattern.

3.2. Experimental Results

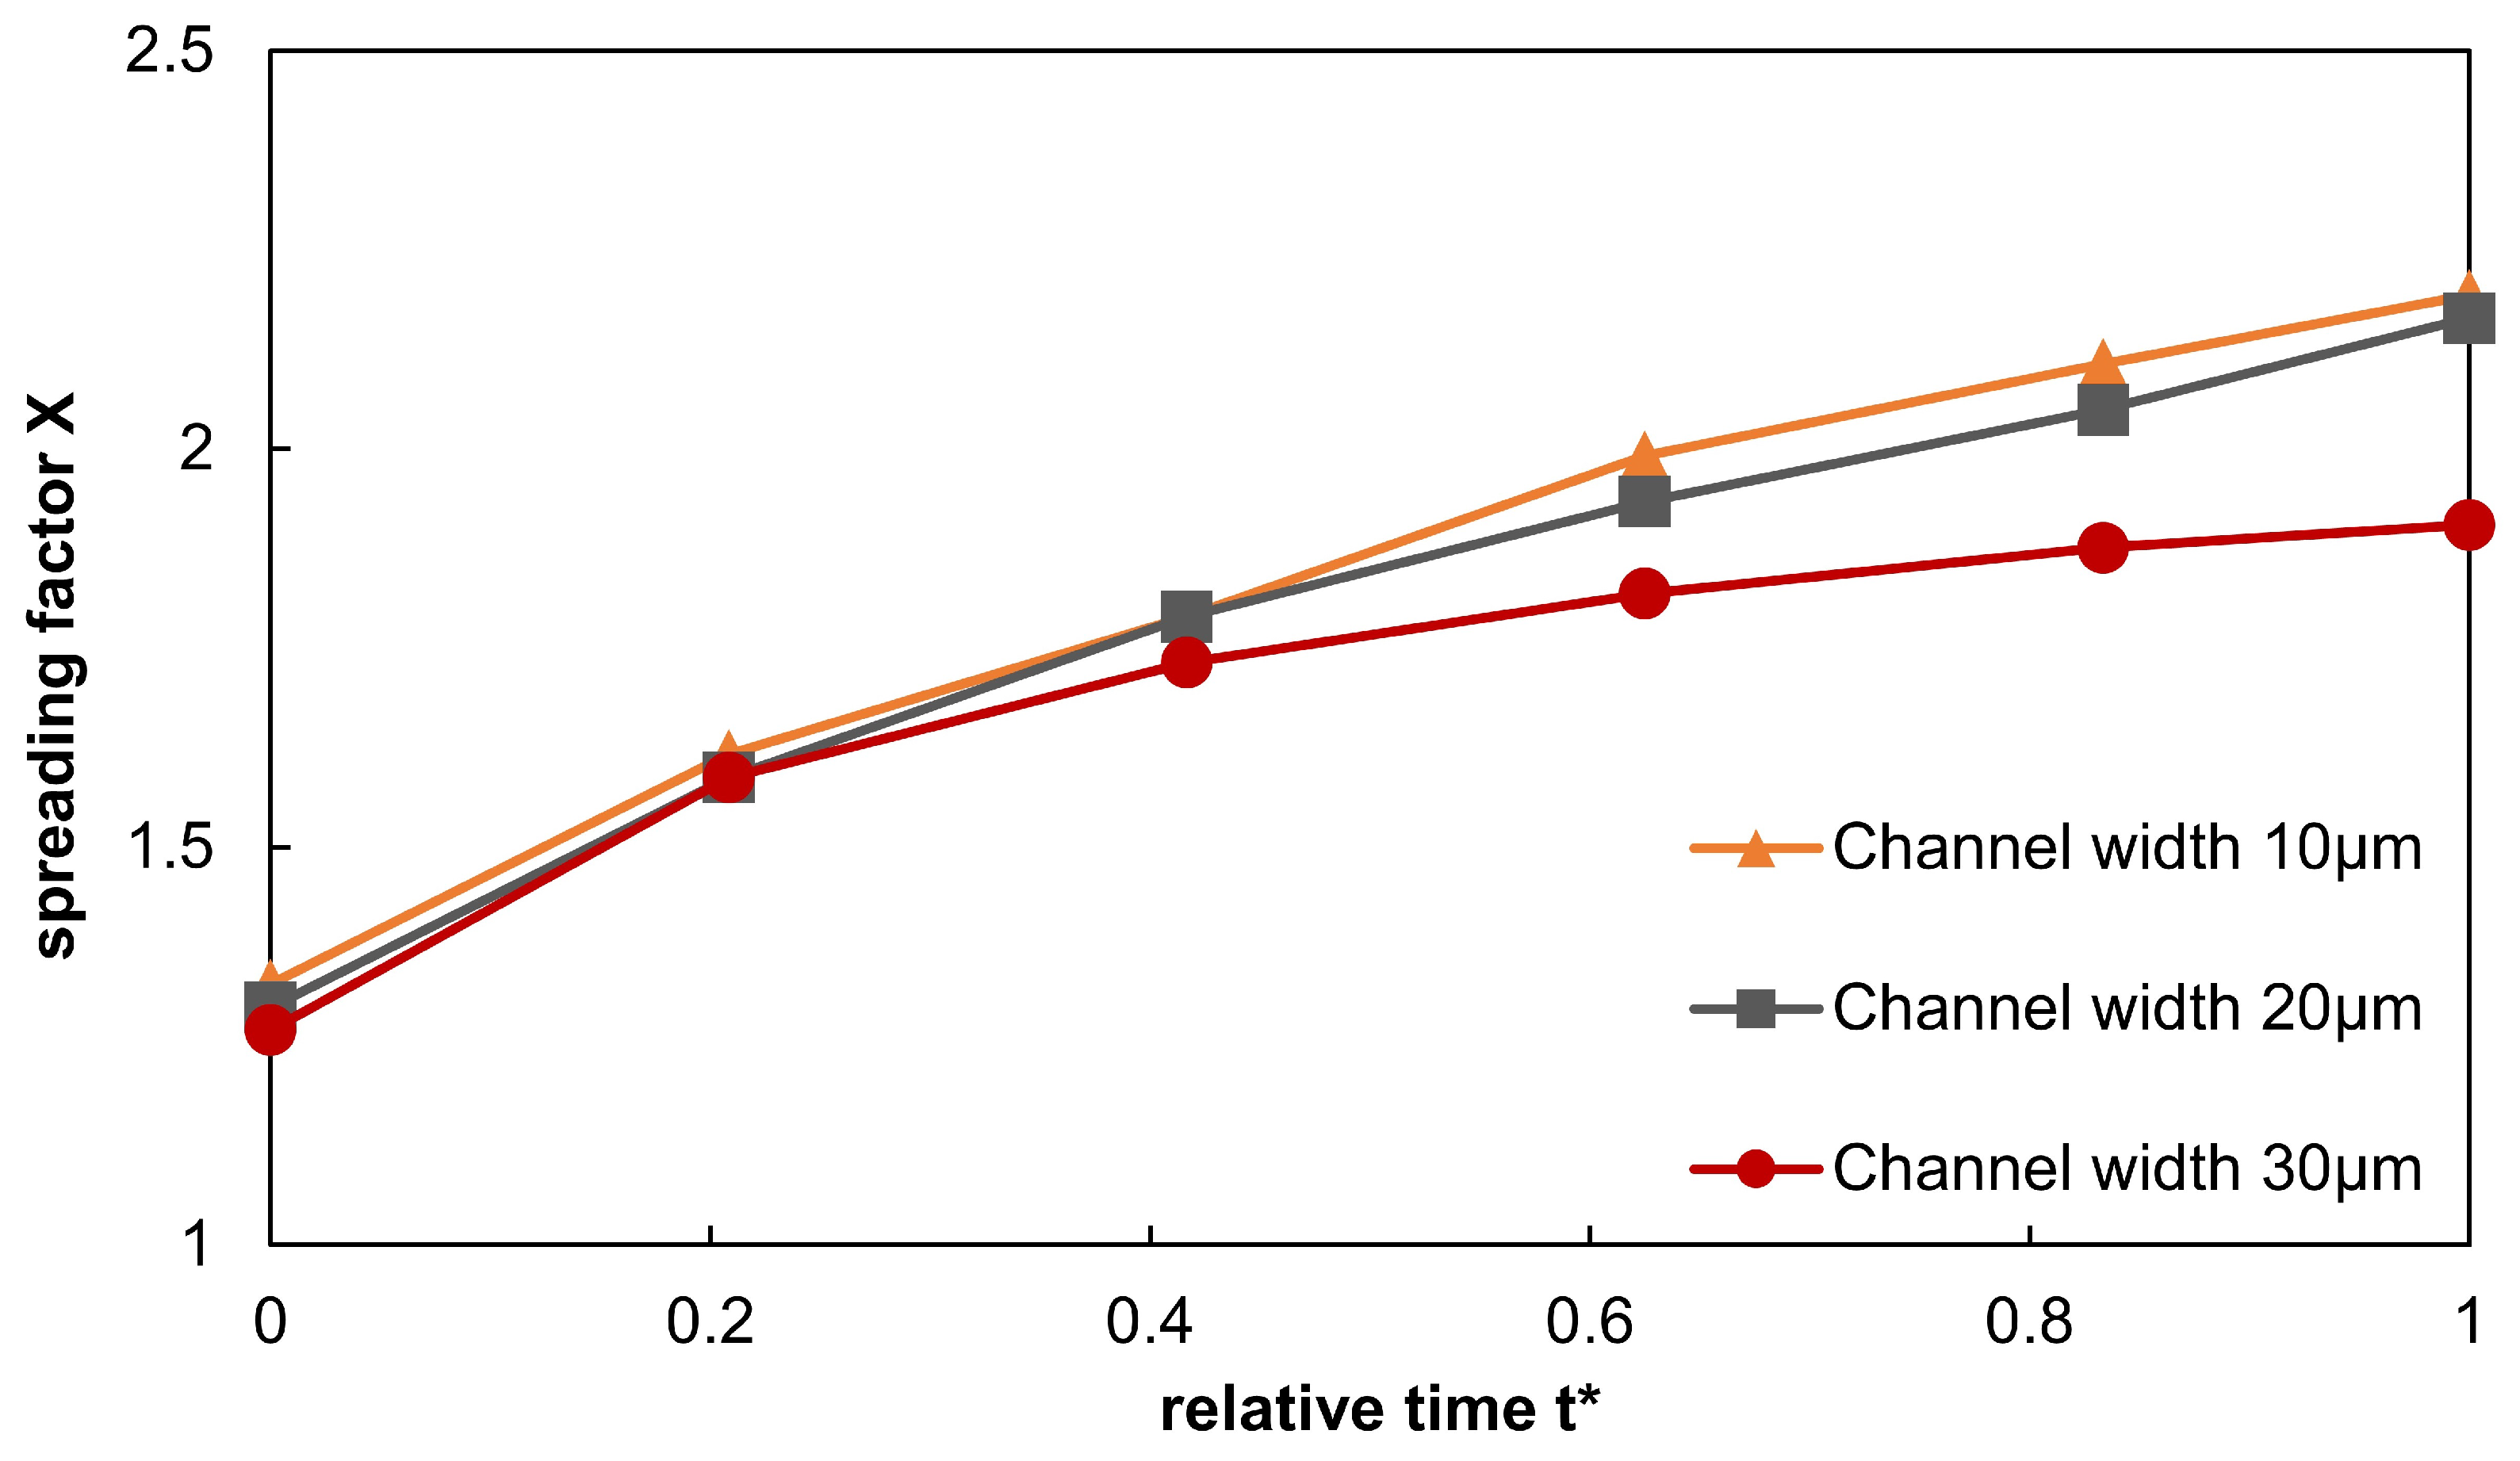
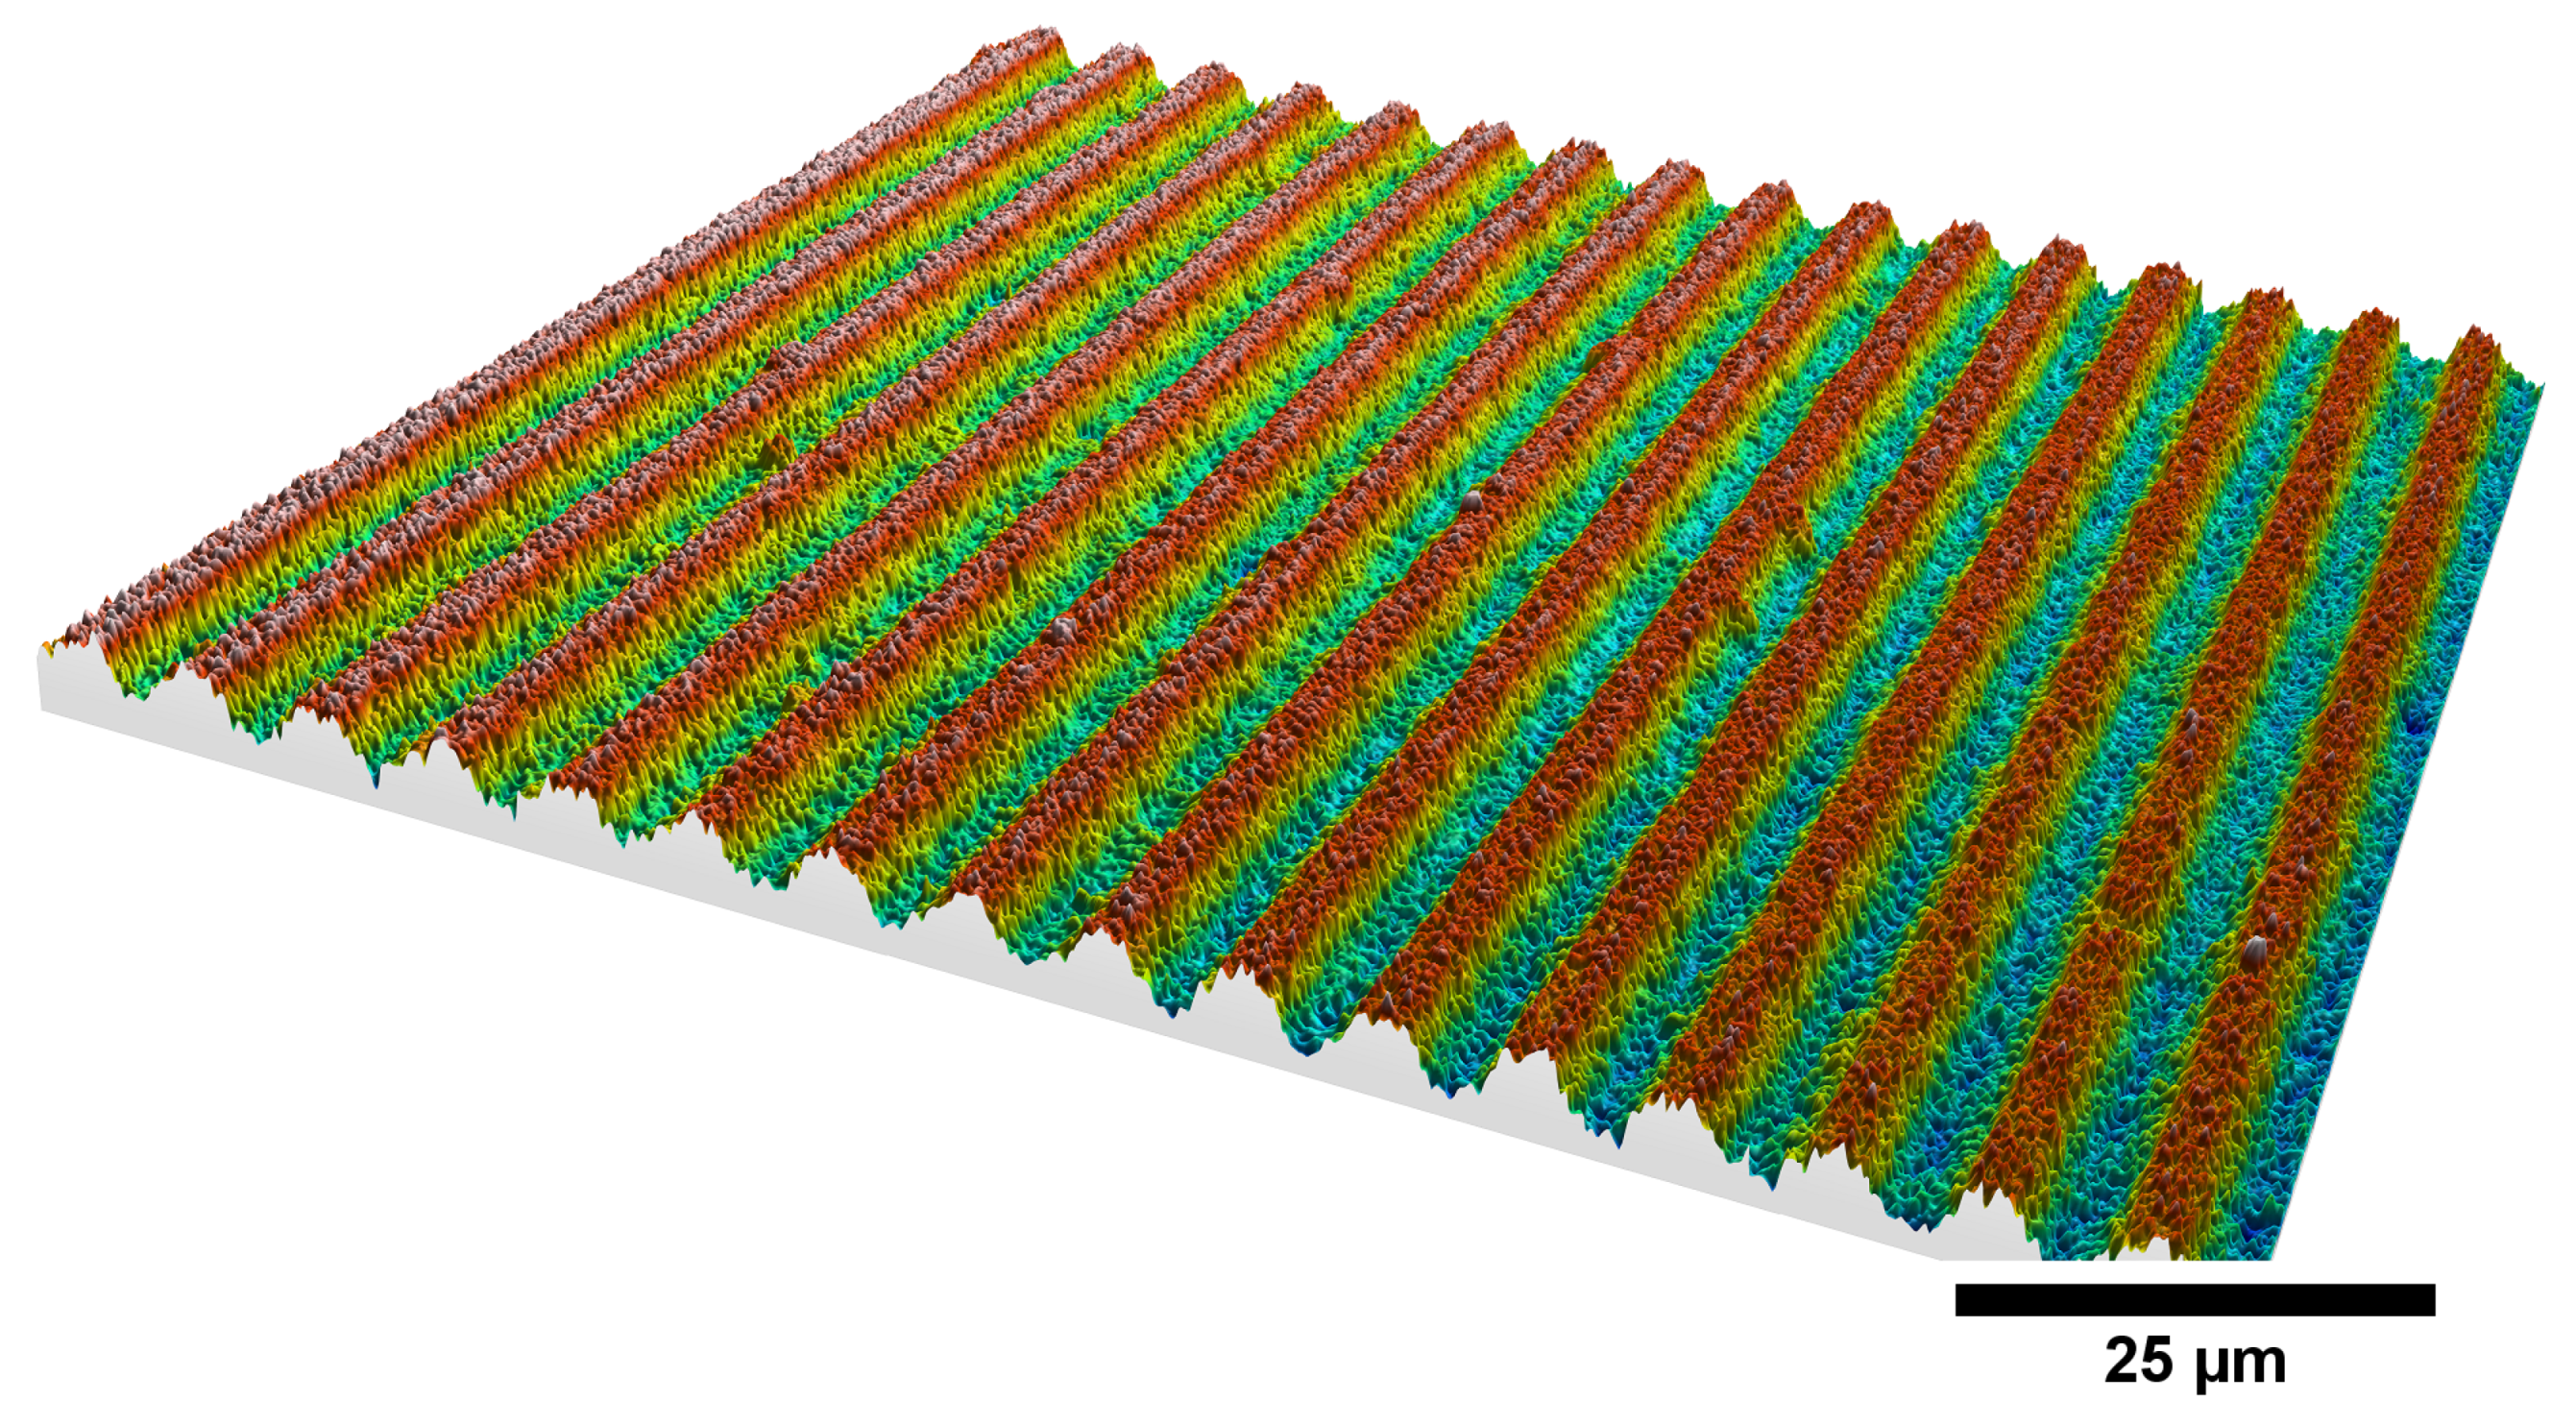
3.2.1. Fabrication of Line-Like Surface Textures Using DLIP

Four different laser textures were created as explained in Section 2.3.1 applying DLIP. For all textures a line-like pattern was chosen. Figure 5 illustrates microscope pictures of all textures which are evaluated in this study Figure 5a–d and the corresponding profiles for these textures Figure 5e–h. Structures S1 and S2 have a period of 8 μ m and S3 and S4 a period of 4 μ m . Table 2 shows the depths of the textures. The value is an averaged value for the entire surface. Figure 6 shows a side view of the channels for texture S1. This image shows exemplarily the integrity of the produced surface textures. For the fluid dynamical behavior it is of utmost importance that no defects of the channels occur because otherwise the fluid is not transported along the channels.

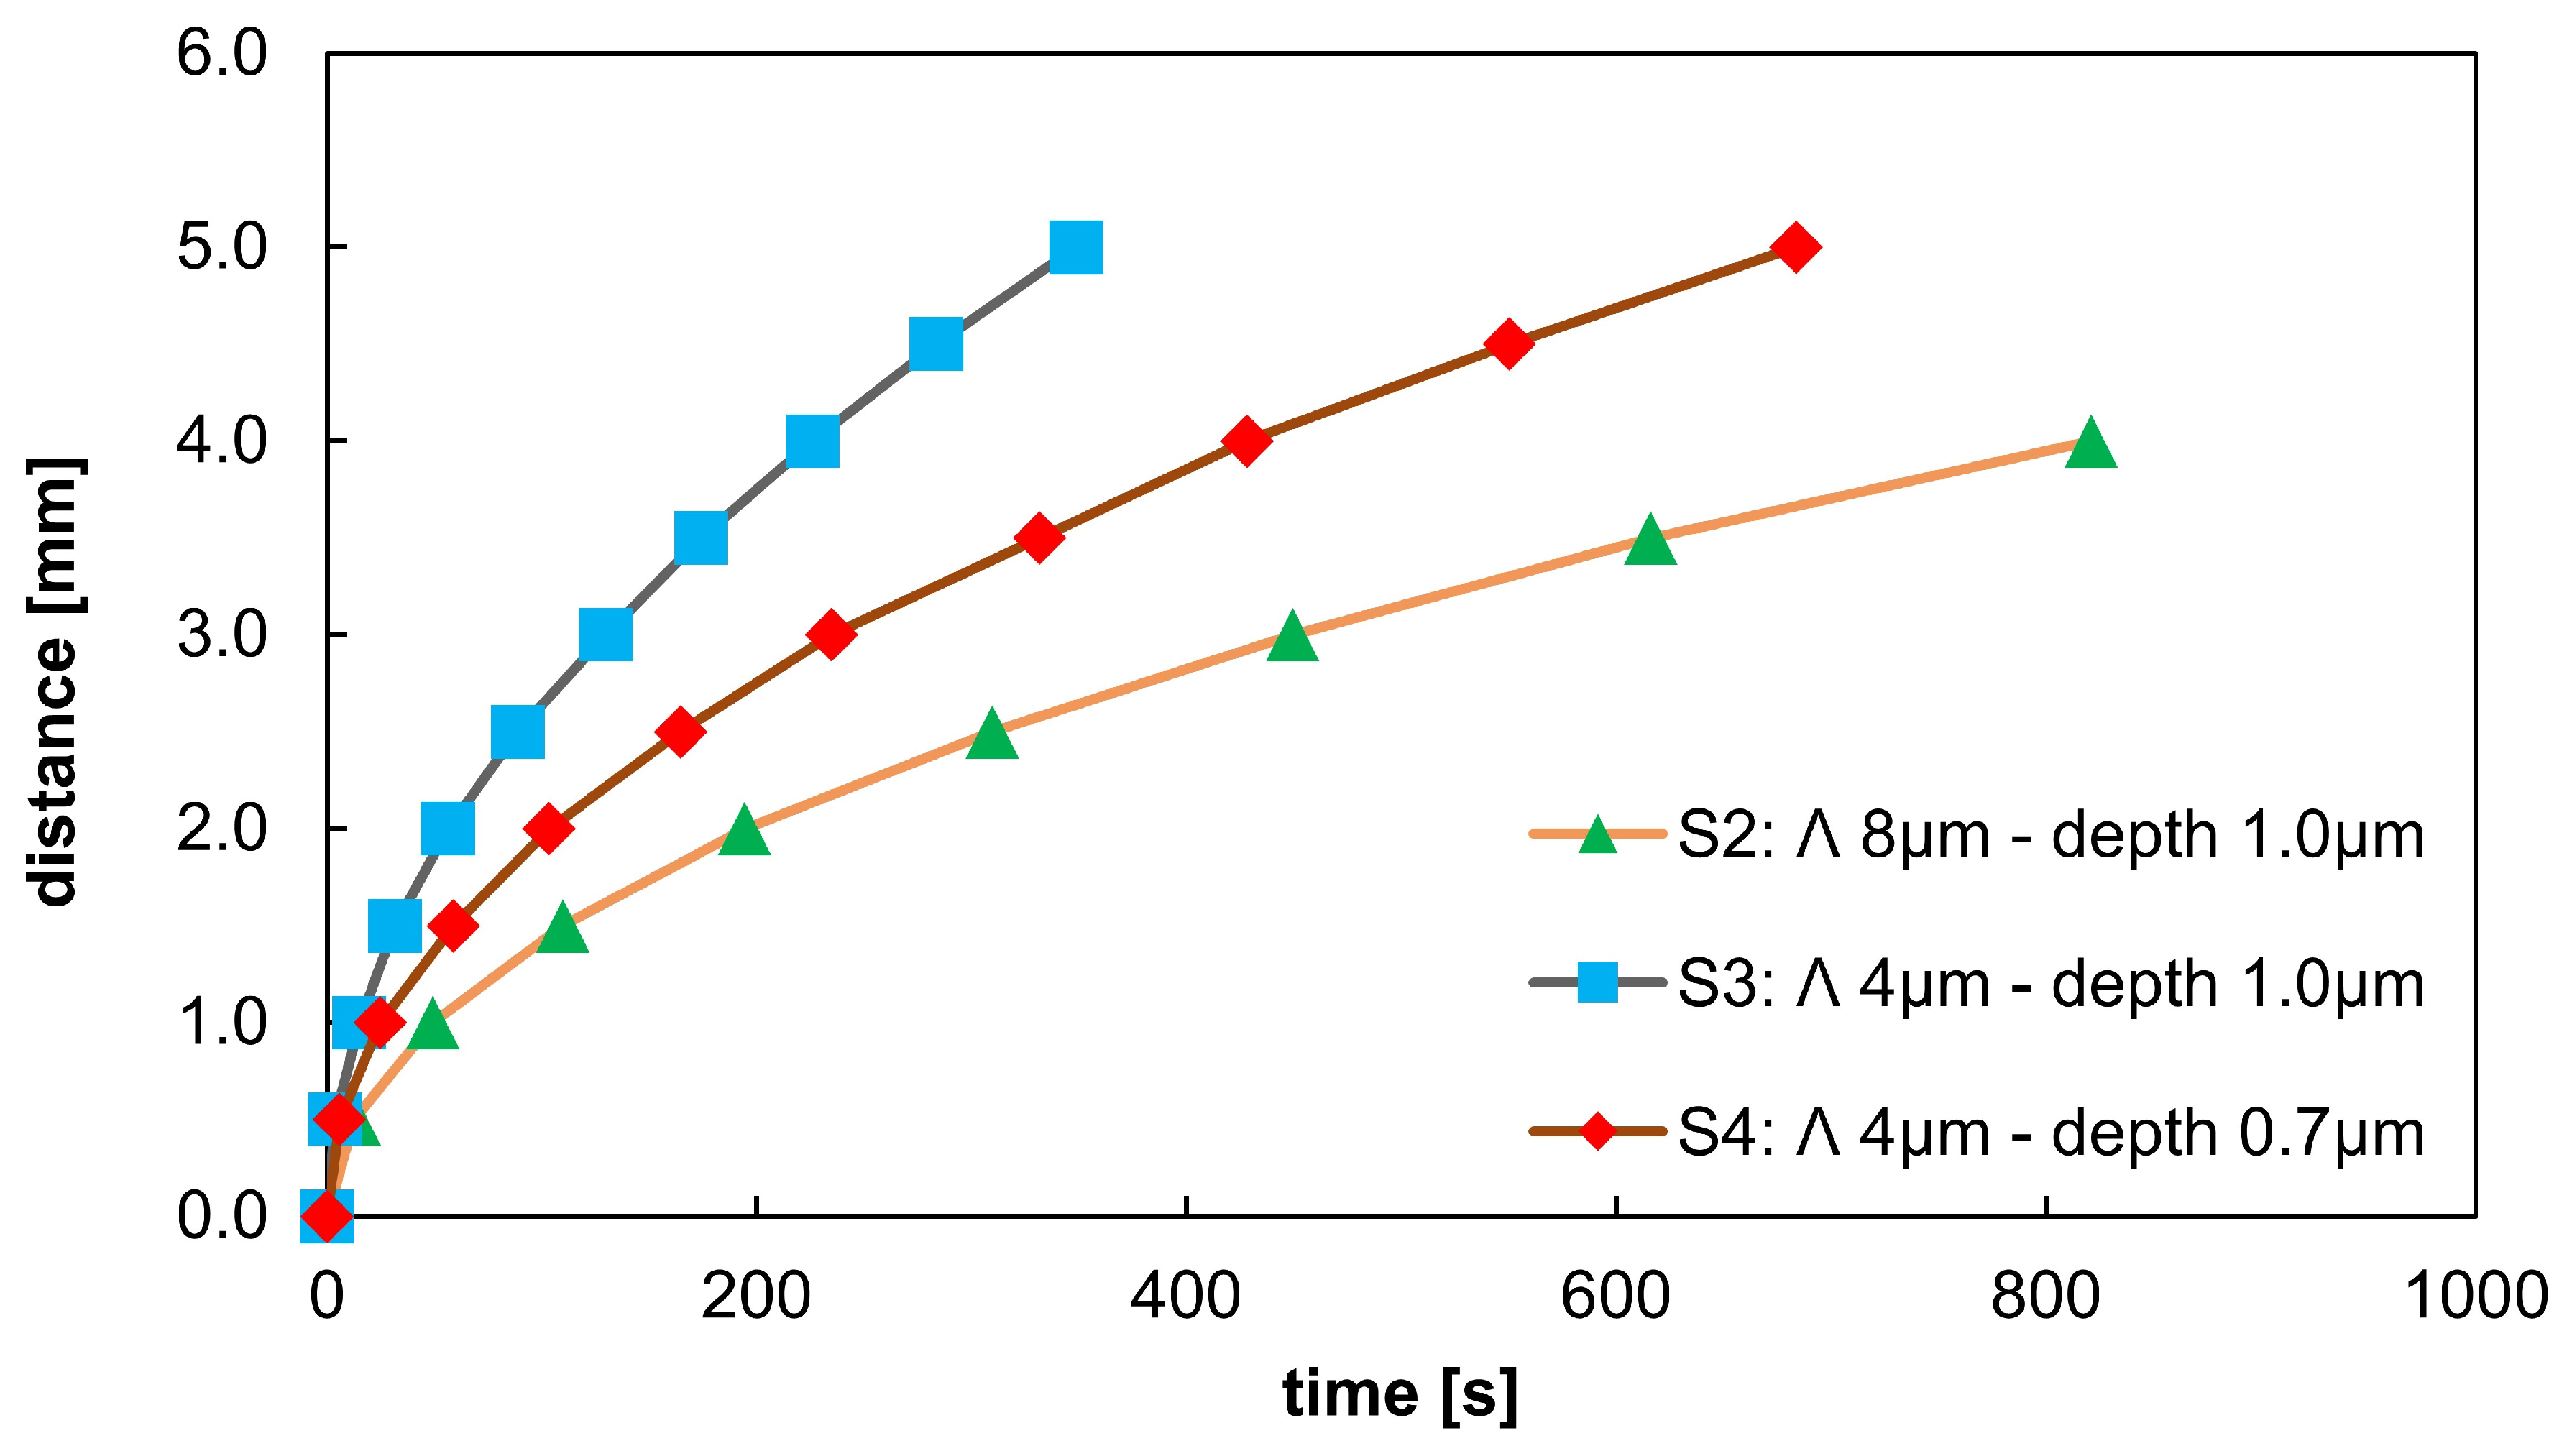
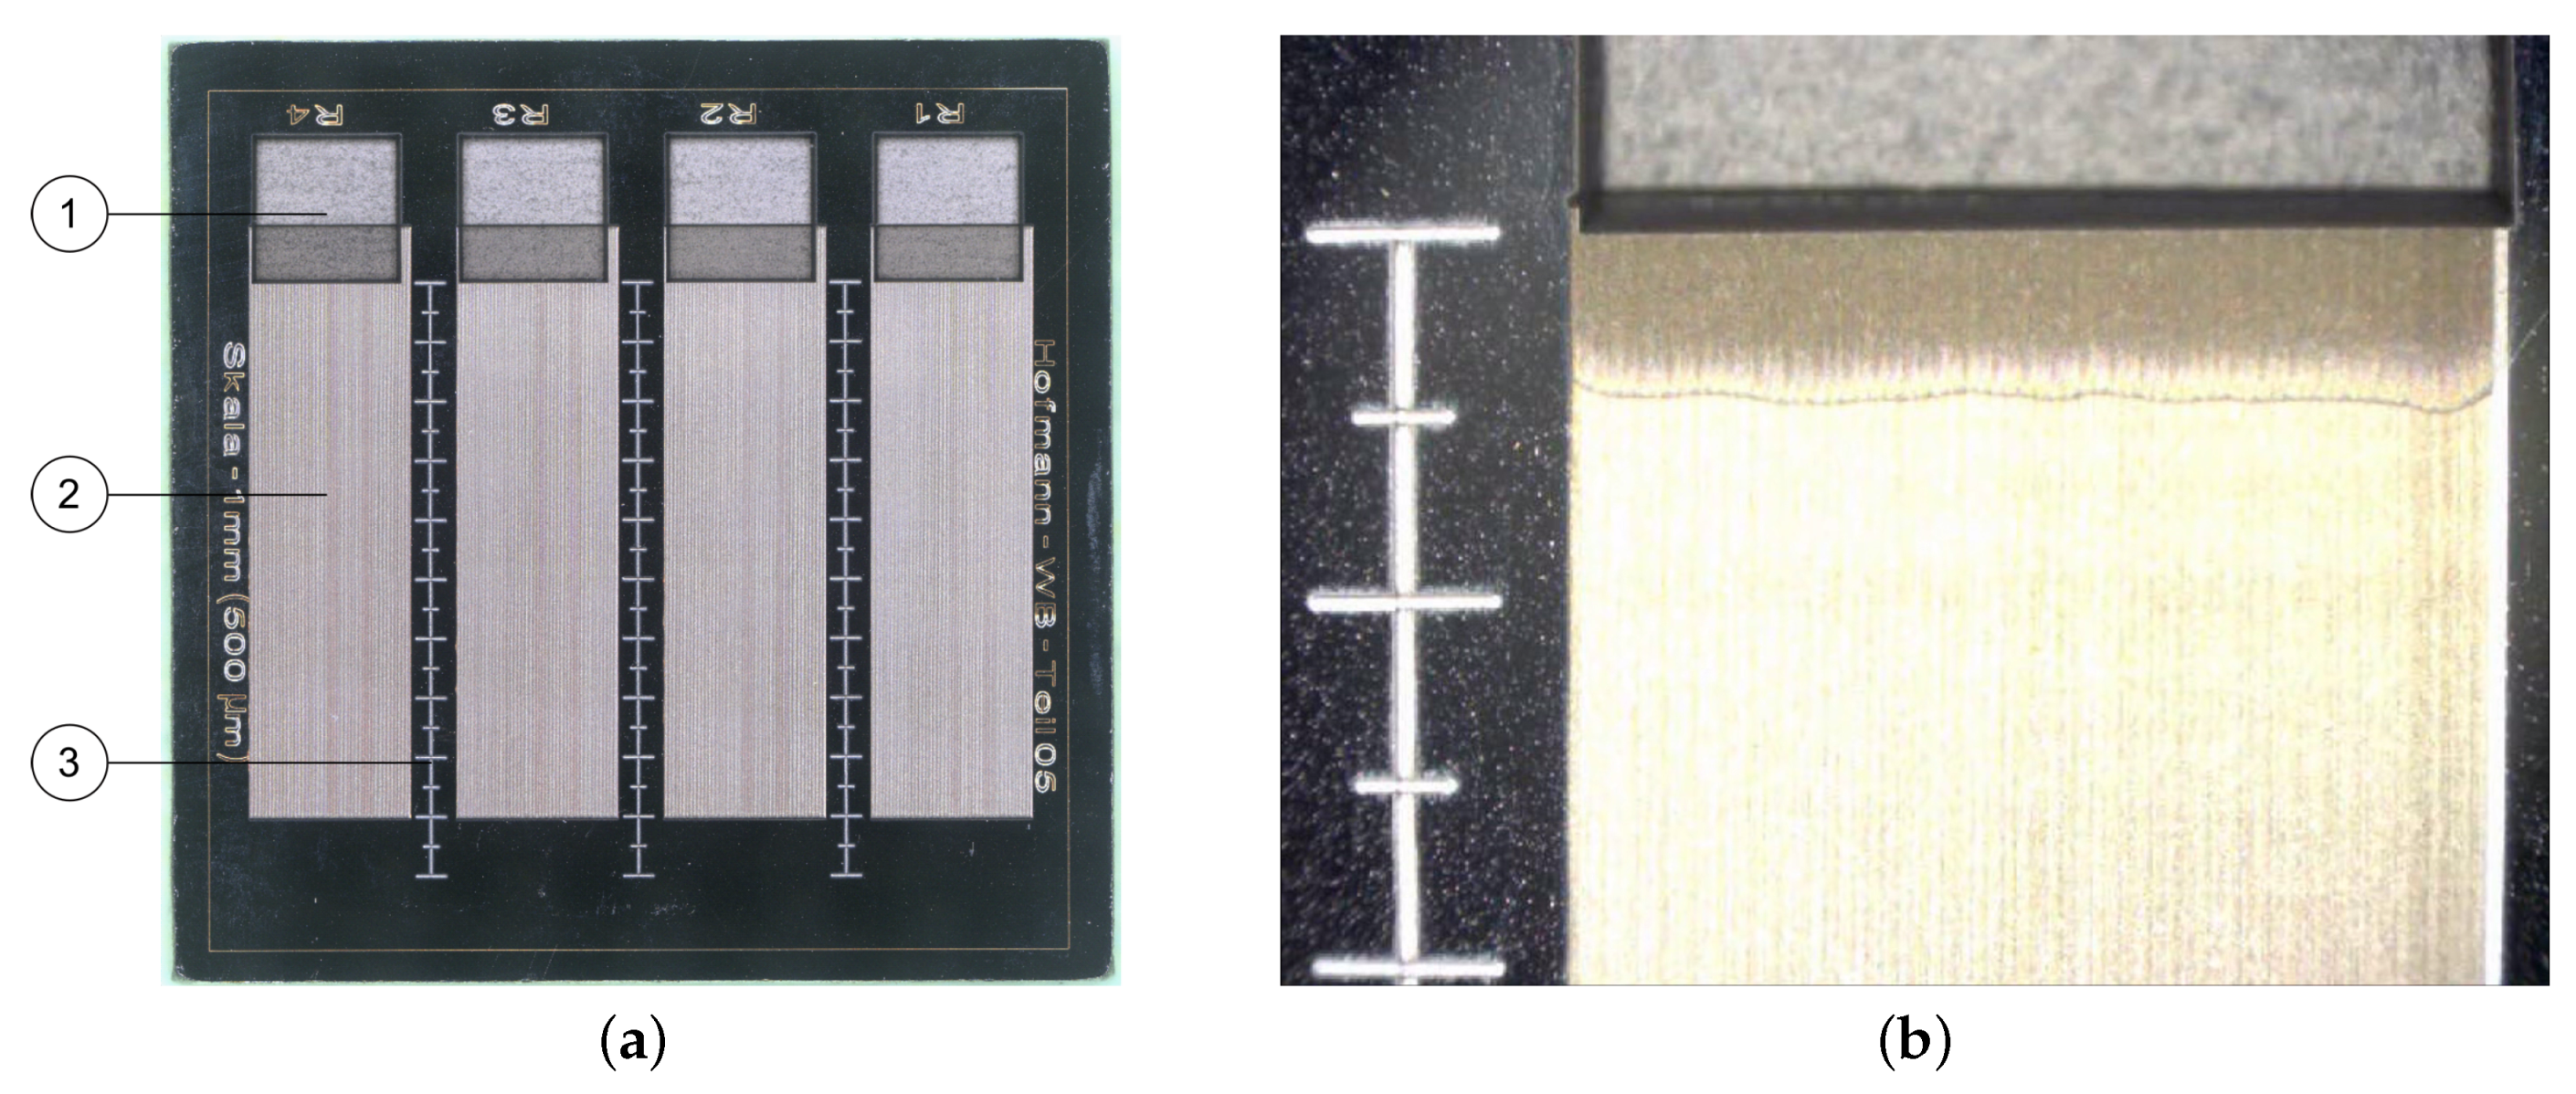
3.2.2. Fluid Transport Inside Laser Textured Surfaces

For evaluating the fluid transport inside the DLIP textures specially designed samples were used. As can be seen in Figure 7a, the sample has four reservoirs (1) with a capacity of around 1 μ l each. The DLIP textures (2) start inside the reservoir. Furthermore, next to the DLIP textures a millimeter-scale (3) is placed in order to measure the traveled distance of the fluid front. One bar at the scale corresponds to 500 μ m . This means that for each texture the experiment can be repeated four times. Figure 7b shows a zoom-in of the traveling fluid front at a distance of around 500 μ m . The fluid transport in three different DLIP textures was evaluated (S2–S4).
Figure 8 shows the results of the fluid transport experiments. On the vertical axis the traveled distance in millimeter and on the horizontal axis the time in seconds are plotted. All curves show a square-root behavior similar to the Washburn-behavior mentioned in Section 1. This is due to the increasing friction with increasing length of the wetted part of the textures. The texture with a period of 8 μ m allows slower transport than textures with a period of 4 μ m (smaller channel width). Comparing the depths of the 4 μ m textures, a higher depth ( 1 μ m ) leads to faster transport than a lower depth ( 0.7 μ m ).

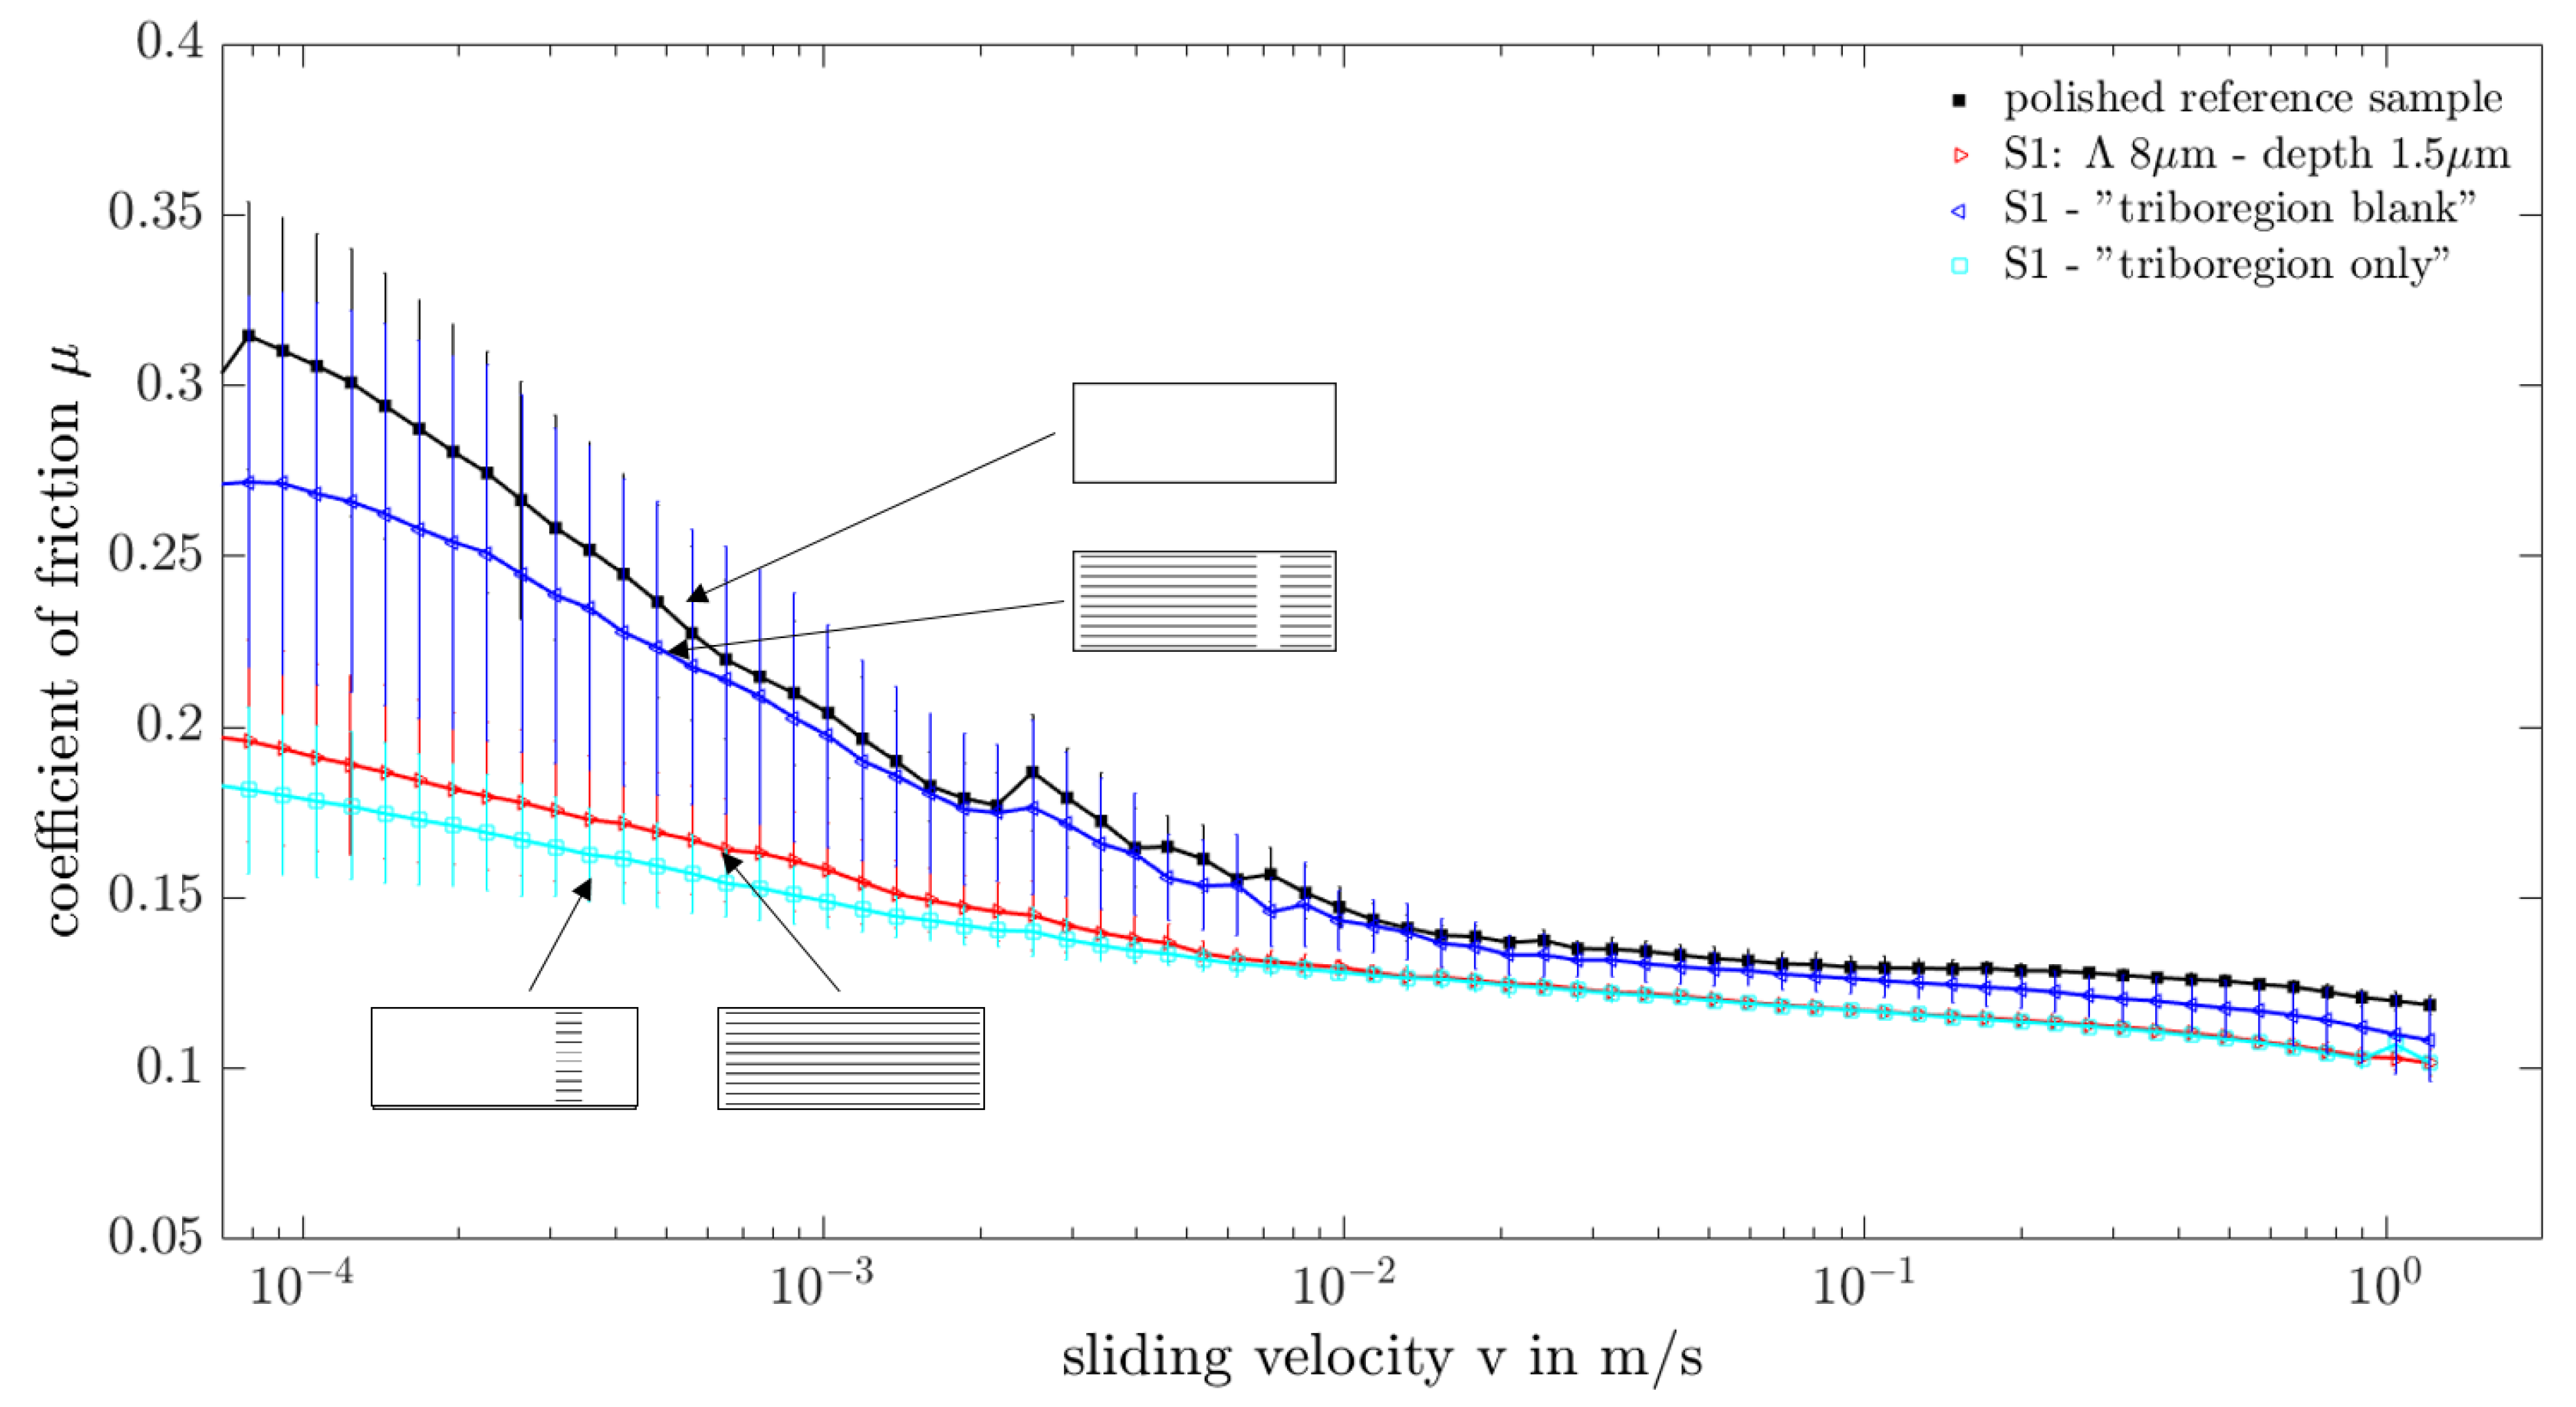
3.2.3. Evaluation of Tribological Performance

In this section, the results of the tribological evaluation are outlined. The comparison of the Stribeck curves for the different DLIP textures S1–S4 introduced in this study show no difference in terms of coefficient of friction (see Figure A1 in Appendix A.1). Therefore, texture S1 with a period of 8 μ m and a depth of around 1.5 μ m is chosen for further tribological evaluation. The idea is that three samples with the same parameters as for S1 but with differently structured regions are compared to each other and to an untextured, polished reference sample. The textured samples differ in the area which is textured. The objective of this experiment is to understand whether it makes a difference if the surface textures directly end at the tribocontact or at some distance away from it. As showed in Section 2.3.3, the setup of the tribometer is such that a ball rotates on the samples in a point contact. Therefore, the position of the tribocontact is known a priori. Hence, three differently structured samples are compared: a fully textured sample, a textured sample where only the region of the tribocontact is textured and the opposite case, namely a textured sample where the region of the tribocontact is blank but everything else is textured. The diameter of the tribocontact is around 250 μ m such that the region of the tribocontact is chosen to have a width of 500 μ m . The introduced textured samples are called “selectively textured samples”. One can distinguish between “fully textured”, “triboregion only” and “triboregion blank”.
Besides the four Stribeck curves, Figure 9 also shows schematics of the samples described and evaluated in this section. It shows typical Stribeck curves for the three cases compared to the one of a polished reference sample. The polished sample has the highest coefficient of friction for all lubricating regimes. The coefficient of friction for the case “triboregion blank” is smaller , especially for the mixed lubrication regime, but the difference is negligible. However, this is not the case for the samples where the region of the tribocontact is textured (“fully textured” or “triboregion only”). Their difference again is negligible but compared to the other two samples, the reduction of the COF, especially for the mixed lubrication regime, is significant. This result might be a bit surprising. In the following section an attempt is made to explain this behavior.

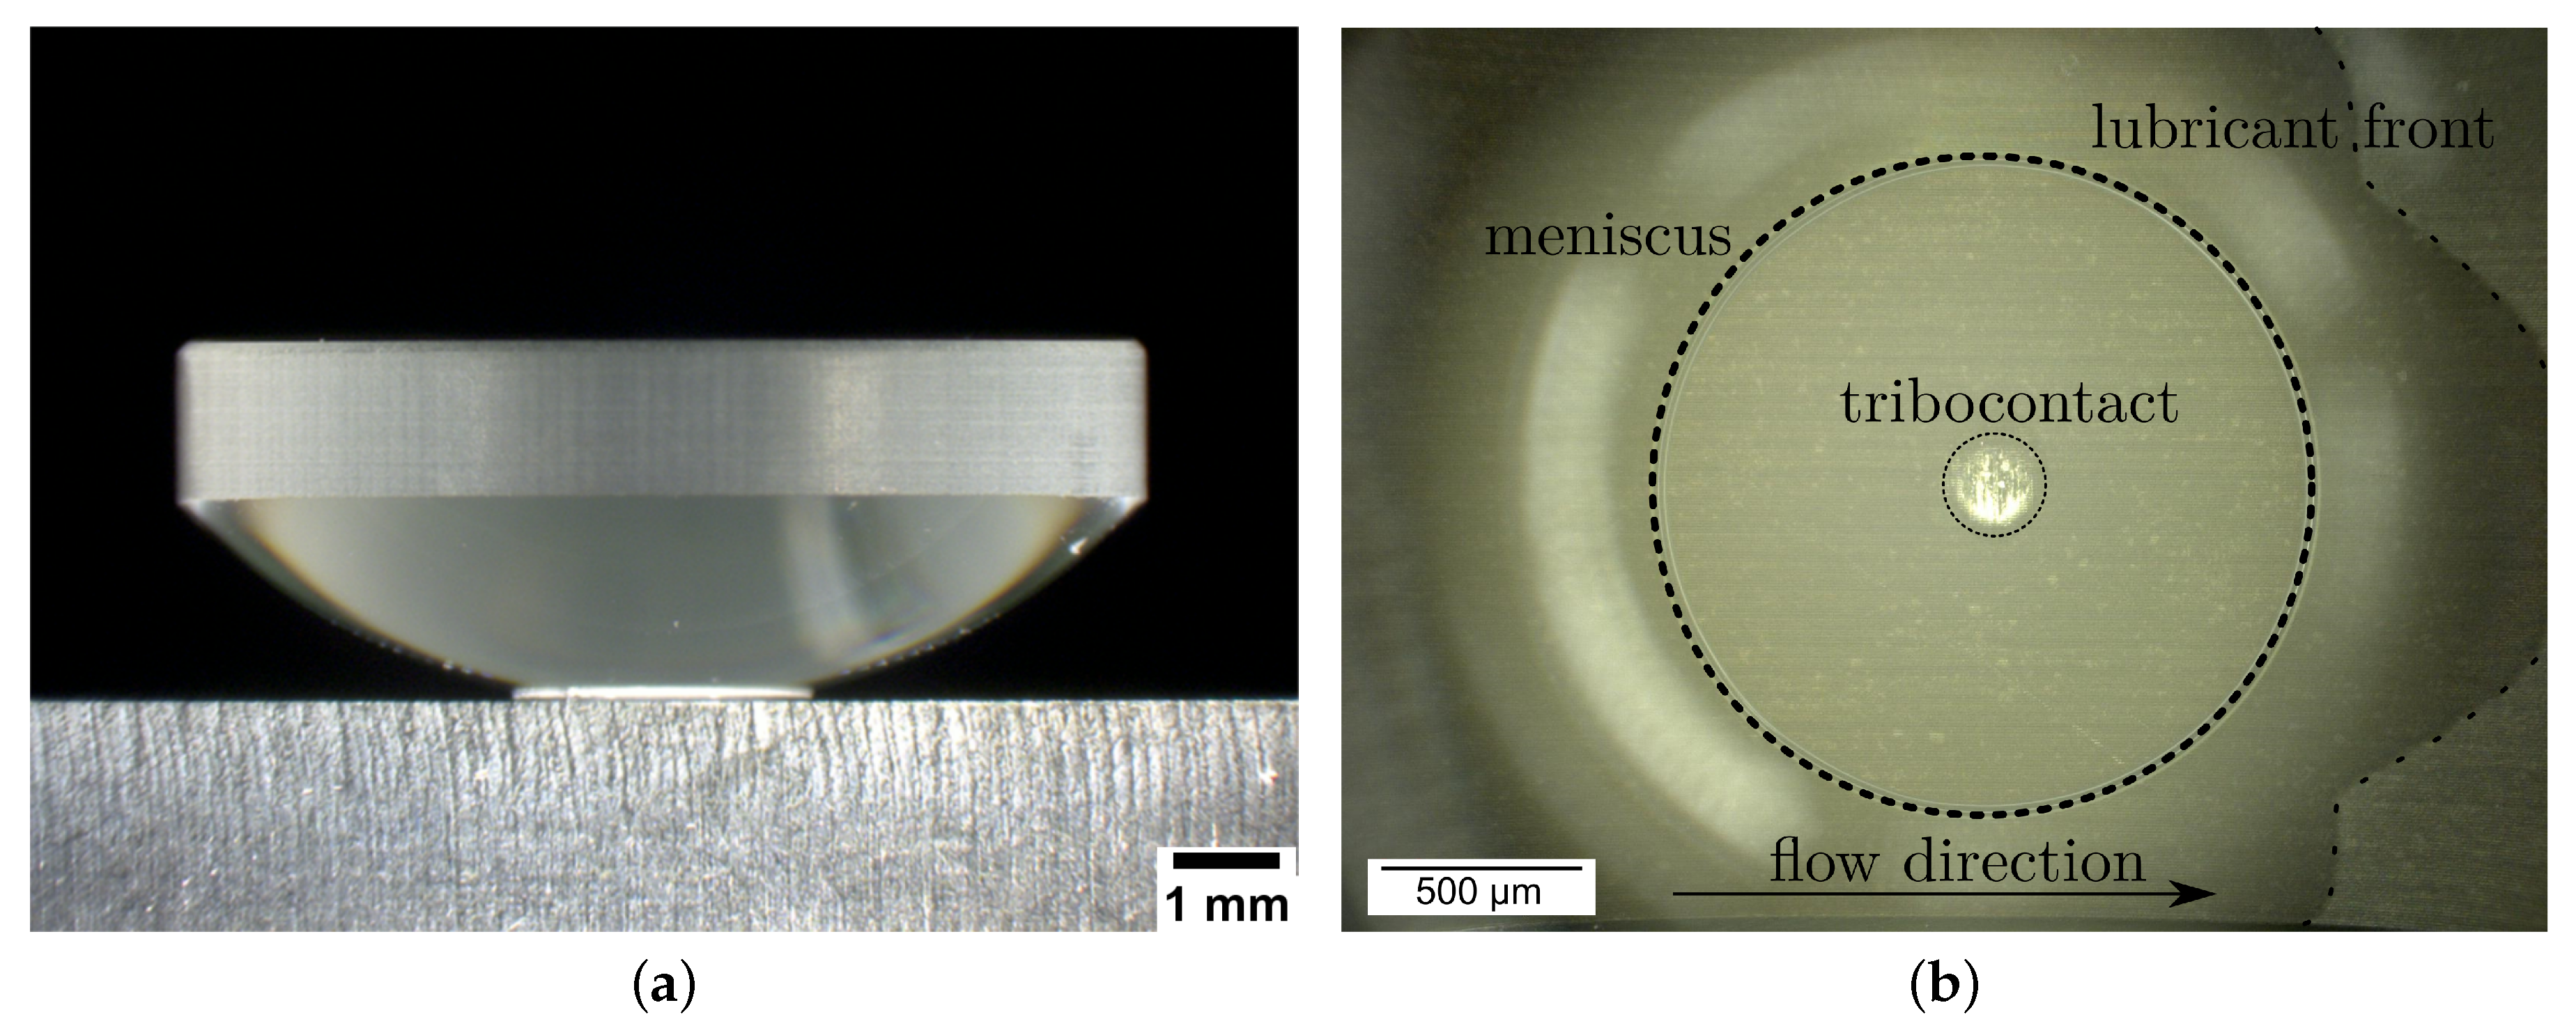
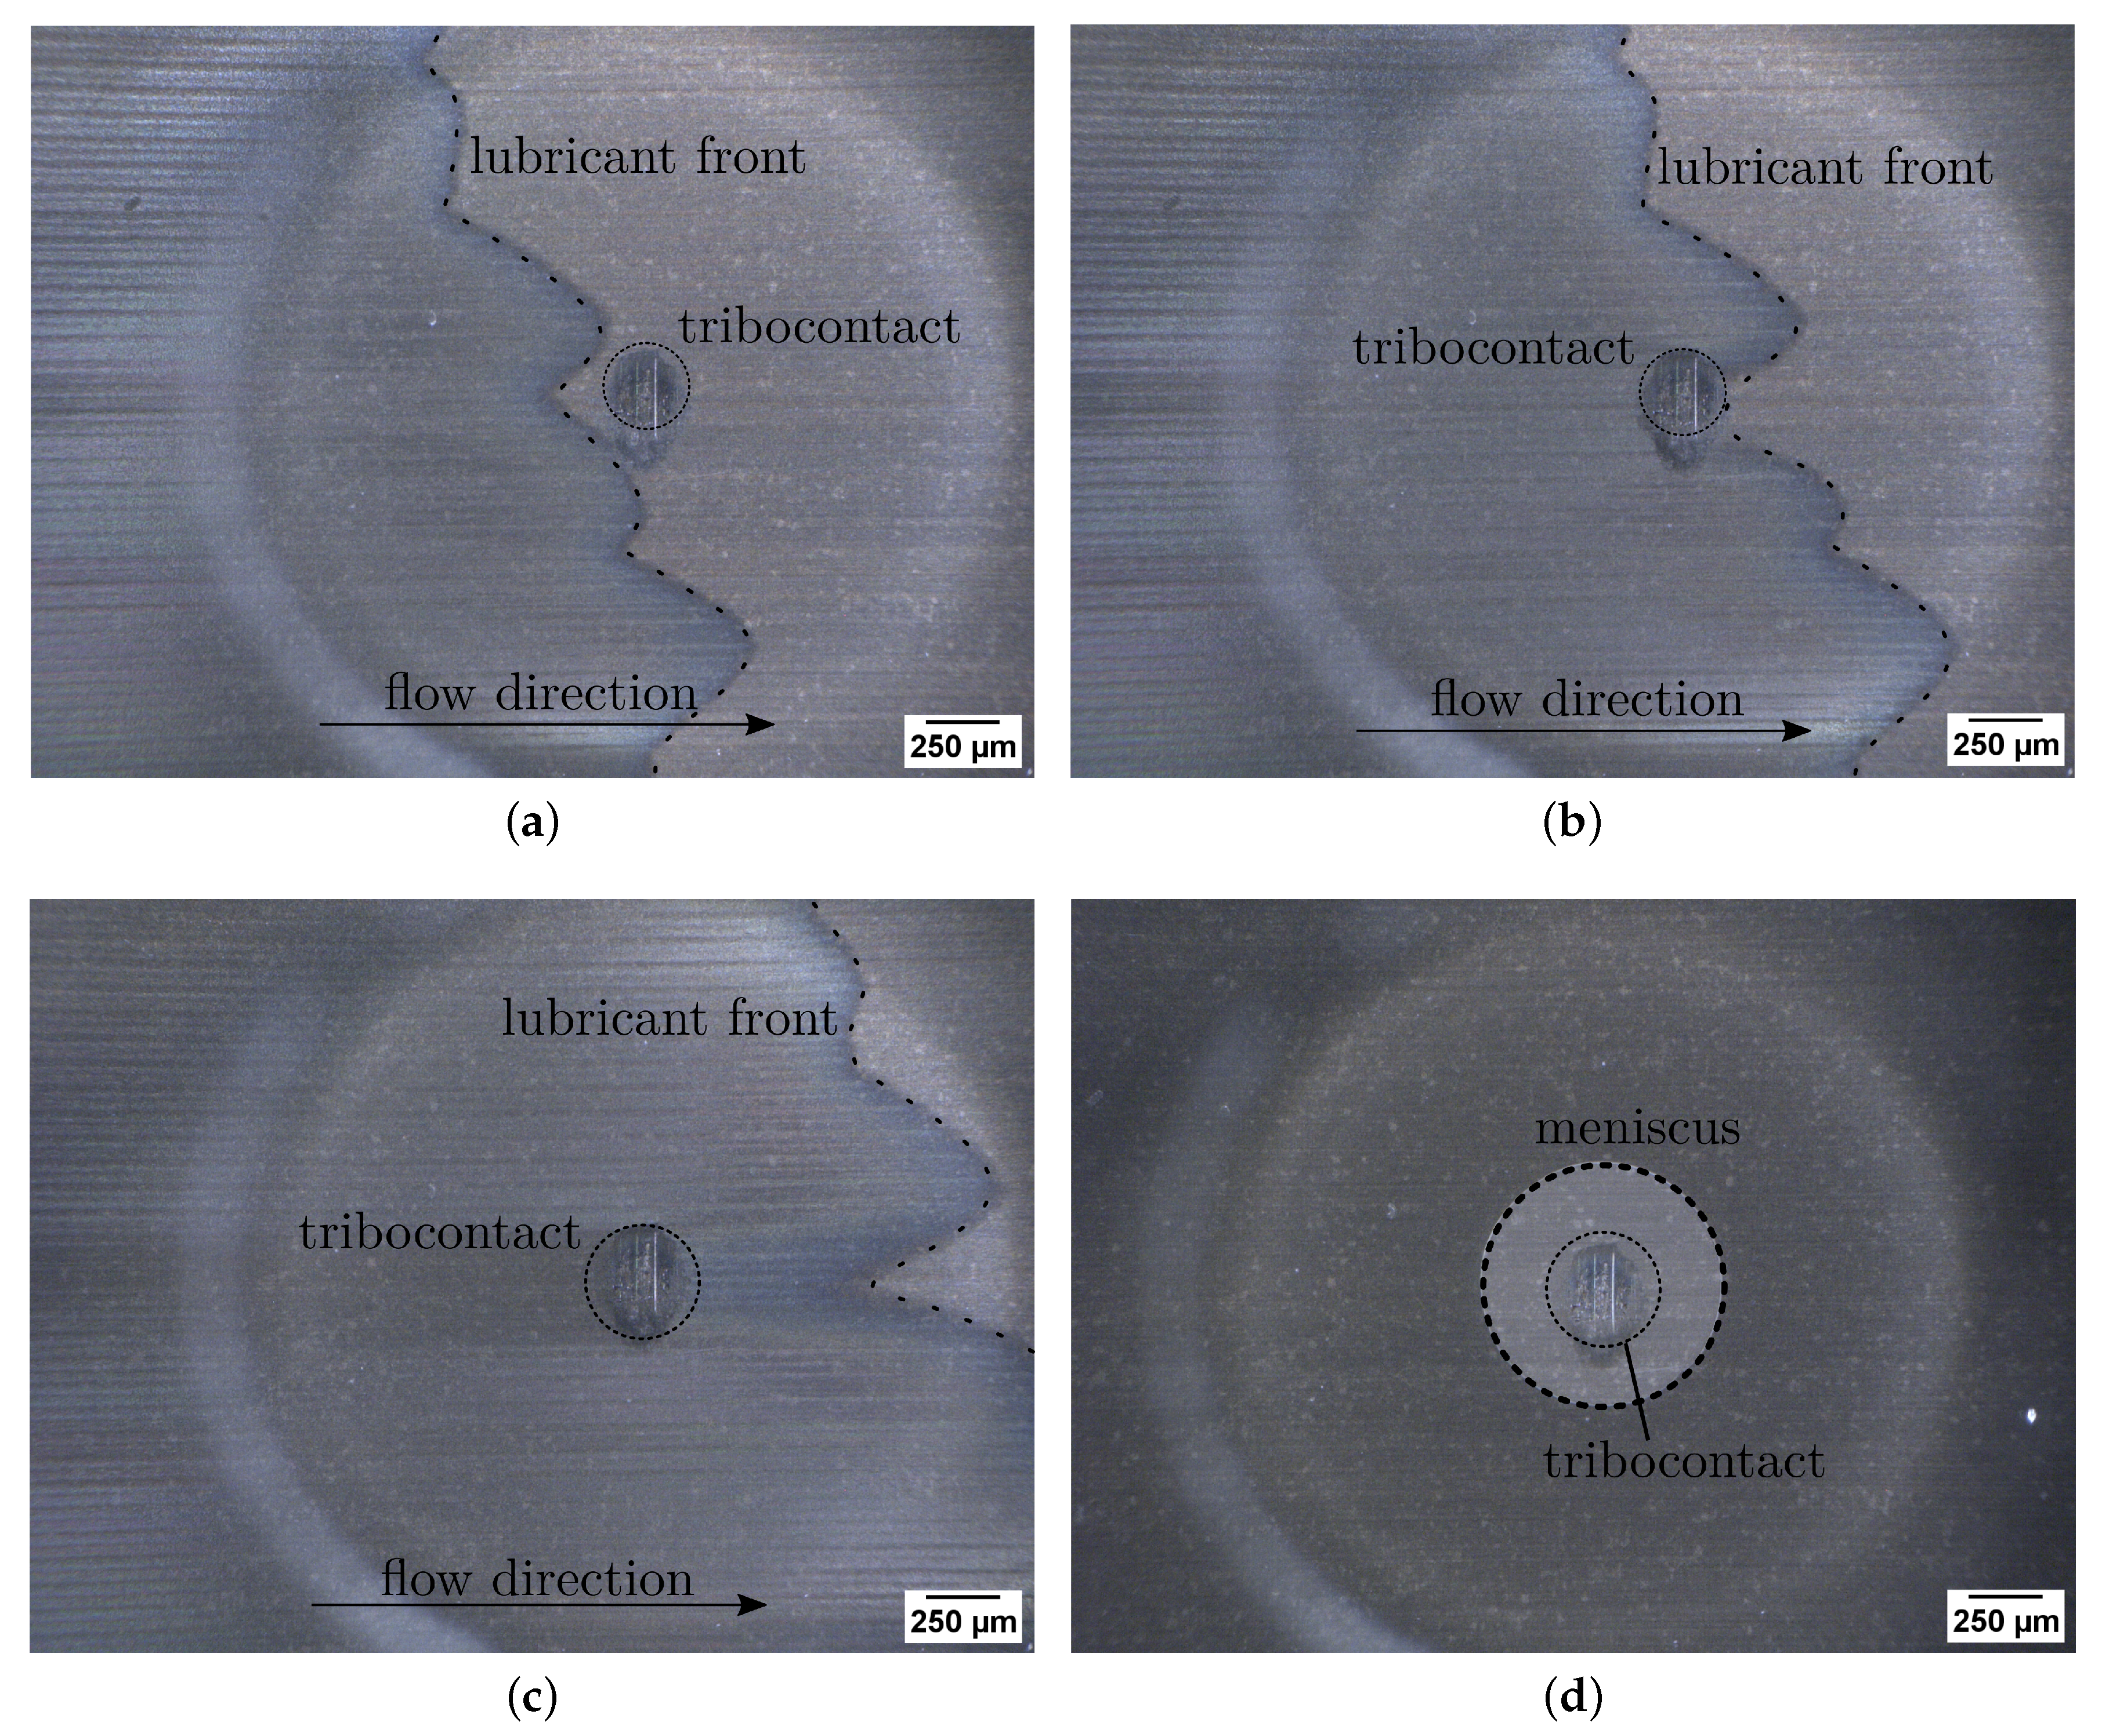
3.2.4. Transition of Fluid out of Laser Textured Surfaces into Tribocontact

In the previous section it was shown that it makes a difference whether the triboregion is textured or not (meaning that after wear textures end directly at the tribocontact). In this section, we outline one possible effect that explains this behavior. The focus of this section lies on the transition region out of the laser textures into the tribocontact. However, the setup of the tribometer does not allow a precise observation of the transition region and the oil flow in it. Therefore, a different setup is applied to elucidate the phenomena occurring in this transition region. Nonetheless, the alternative setup has certain limitations:
  • Due to a necessary amount of light for microscopy a glass lens is used instead of the 100Cr6 ball. The lens has the same radius of curvature and similar wetting properties.
  • The phenomena in the tribometer occur under dynamic conditions. In the alternative setup it is only possible to observe effects under static conditions.
  • The test samples first run in the tribometer and then the transition effects with the glass lens are observed. Therefore, the tribocontact exists on the sample and the glass lens is put manually into this contact.
Figure 10a shows a side view of a sample with the lens on top. Figure 10b corresponds to the setup explained in Section 2.3.4 and shows a top view of the textures through the glass lens. The picture illustrates the tribocontact, the lubrication front with the indicated flow direction and the final meniscus at the lens.
The temporal course of the fluid flow is shown in Figure 11. In Figure 11a–c it is possible to see the fluid front moving from left to right and the tribocontact. In Figure 11a, the front is approaching the tribocontact. In Figure 11b, it is possible to see that a lee-region is formed behind the contact point of the lens where initially no oil arrives. In Figure 11c, this region is also filled with oil. In Figure 11d, the fluid front has passed the field of view and a meniscus “climbing” the glass lens has formed. The driving force for this meniscus is the surface tension. It stops when an equilibrium state has been reached. This phenomenon can explain how oil is “pulled out” of the surface textures. As long as a continuous oil supply through the textures is guaranteed, the meniscus can grow until equilibrium state. Hence, it marks one possible explanation for the transition of the oil out of the textures into the tribocontact. This phenomenon can only occur when the textures are present exactly where the triboregion begins which explains why the case “triboregion blank” is worse in terms of reduction of COF than the case “triboregion only”.

4. Conclusions

In this study, the fluid transport in DLIP textures was evaluated. From the numerical investigations it was shown that the capillary force plays an important role in small channels and the spreading factor is higher in channels with a width of 10 μ m compared to channels with a width of 30 μ m . DLIP textures were created with two different periods ( 4 μ m and 8 μ m ) and three depths ( 1.5 μ m , 1.0 μ m and 0.7 μ m ). First, the fluid transport in these textures was evaluated. It was found that all textures show a Washburn-like behavior with the fastest transport in the texture with a period of 4 μ m and a depth of 1 μ m . In a second step, the tribological performance of four different DLIP textures was evaluated. It was shown that the level of COF could be reduced significantly compared to a polished reference but only negligible differences were found between the four textures. In a third step, the effect of differently structured zones was evaluated. For this test, one representative DLIP texture was chosen. In the evaluation, three samples with the same texture but with differently structured zones were compared to a polished reference sample. The samples differed as follows. One sample was fully textured (case “fully textured”), on one sample only the triboregion was textured (case “triboregion only”) and on the third sample the triboregion was blank and the rest was textured (case“triboregion blank”). The resulting Stribeck curves showed similar behavior for the polished sample and case“triboregion blank” and a much lower COF but also similar behavior for case “fully textured” and case “triboregion only”. The result shows the necessity of available textures directly at the position where the tribocontact ends. At this position the requirement for capillary forces breaks down if the channel is fully filled because then there is no meniscus at the gas–liquid interface. Therefore, in a last step, one possible explanation for this behavior was outlined. For this, a glass lens was chosen as a substitute for the tribological counterpart and was put manually into the tribocontact. Then, the fluid flow around the lens and the building meniscus could be observed. The prerequisite for the building meniscus is that the structures end in the tribocontact such that the fluid can flow until the contact point of the lens. For the abovementioned case “triboregion blank” this is not the case which might explain the higher COF. One limitation is that the lens experiments were conducted under static conditions but the effects in the tribometer are highly dynamic. However, the principle of this hypothesis also holds for the dynamic case.

Author Contributions

Conceptualization, all authors; Methodology, T.S. and H.M; Software, H.M. and T.S.; Validation, T.S. and H.M.; Formal Analysis, T.S. and H.M.; Investigation, T.S. and H.M.; Resources, all authors; Data Curation, T.S.; Writing—Original Draft Preparation, T.S.; Writing—Review and Editing, all authors; Visualization, T.S.; Supervision, T.K., H.M. and A.F.L; Project Administration, T.K. and A.F.L.; Funding Acquisition, T.K., H.M. and A.F.L.

Funding

This research was funded by the European Union’s Horizon 2020 Research and Innovation Programme under the Marie Skłodowska-Curie grant agreement No. 675063. The work of A.F.L. is also supported by the German Research Foundation (DFG) under Excellence Initiative program by the German federal and state governments to promote top-level research at German universities.

Acknowledgments

The author H.M. thanks the Collaborative Research Center CRC 1194 “Interaction between Transport and Wetting Processes” by the German Research Foundation (DFG). The authors also thank Gerd Dornhöfer, Joachim Klima and Sarona Frank from the Robert Bosch GmbH for the fruitful discussions. Furthemore, they thank Marius Hofmann for his contribution in this study.

Conflicts of Interest

The authors declare no conflict of interest. The funders had no role in the design of the study; in the collection, analyses, or interpretation of data; in the writing of the manuscript, or in the decision to publish the results.

Abbreviations

The following abbreviations are used in this manuscript:
LSTlaser surface texturing
COFcoefficient of friction
DLWDirect Laser Writing
DLIPDirect Laser Interference Patterning

Appendix A

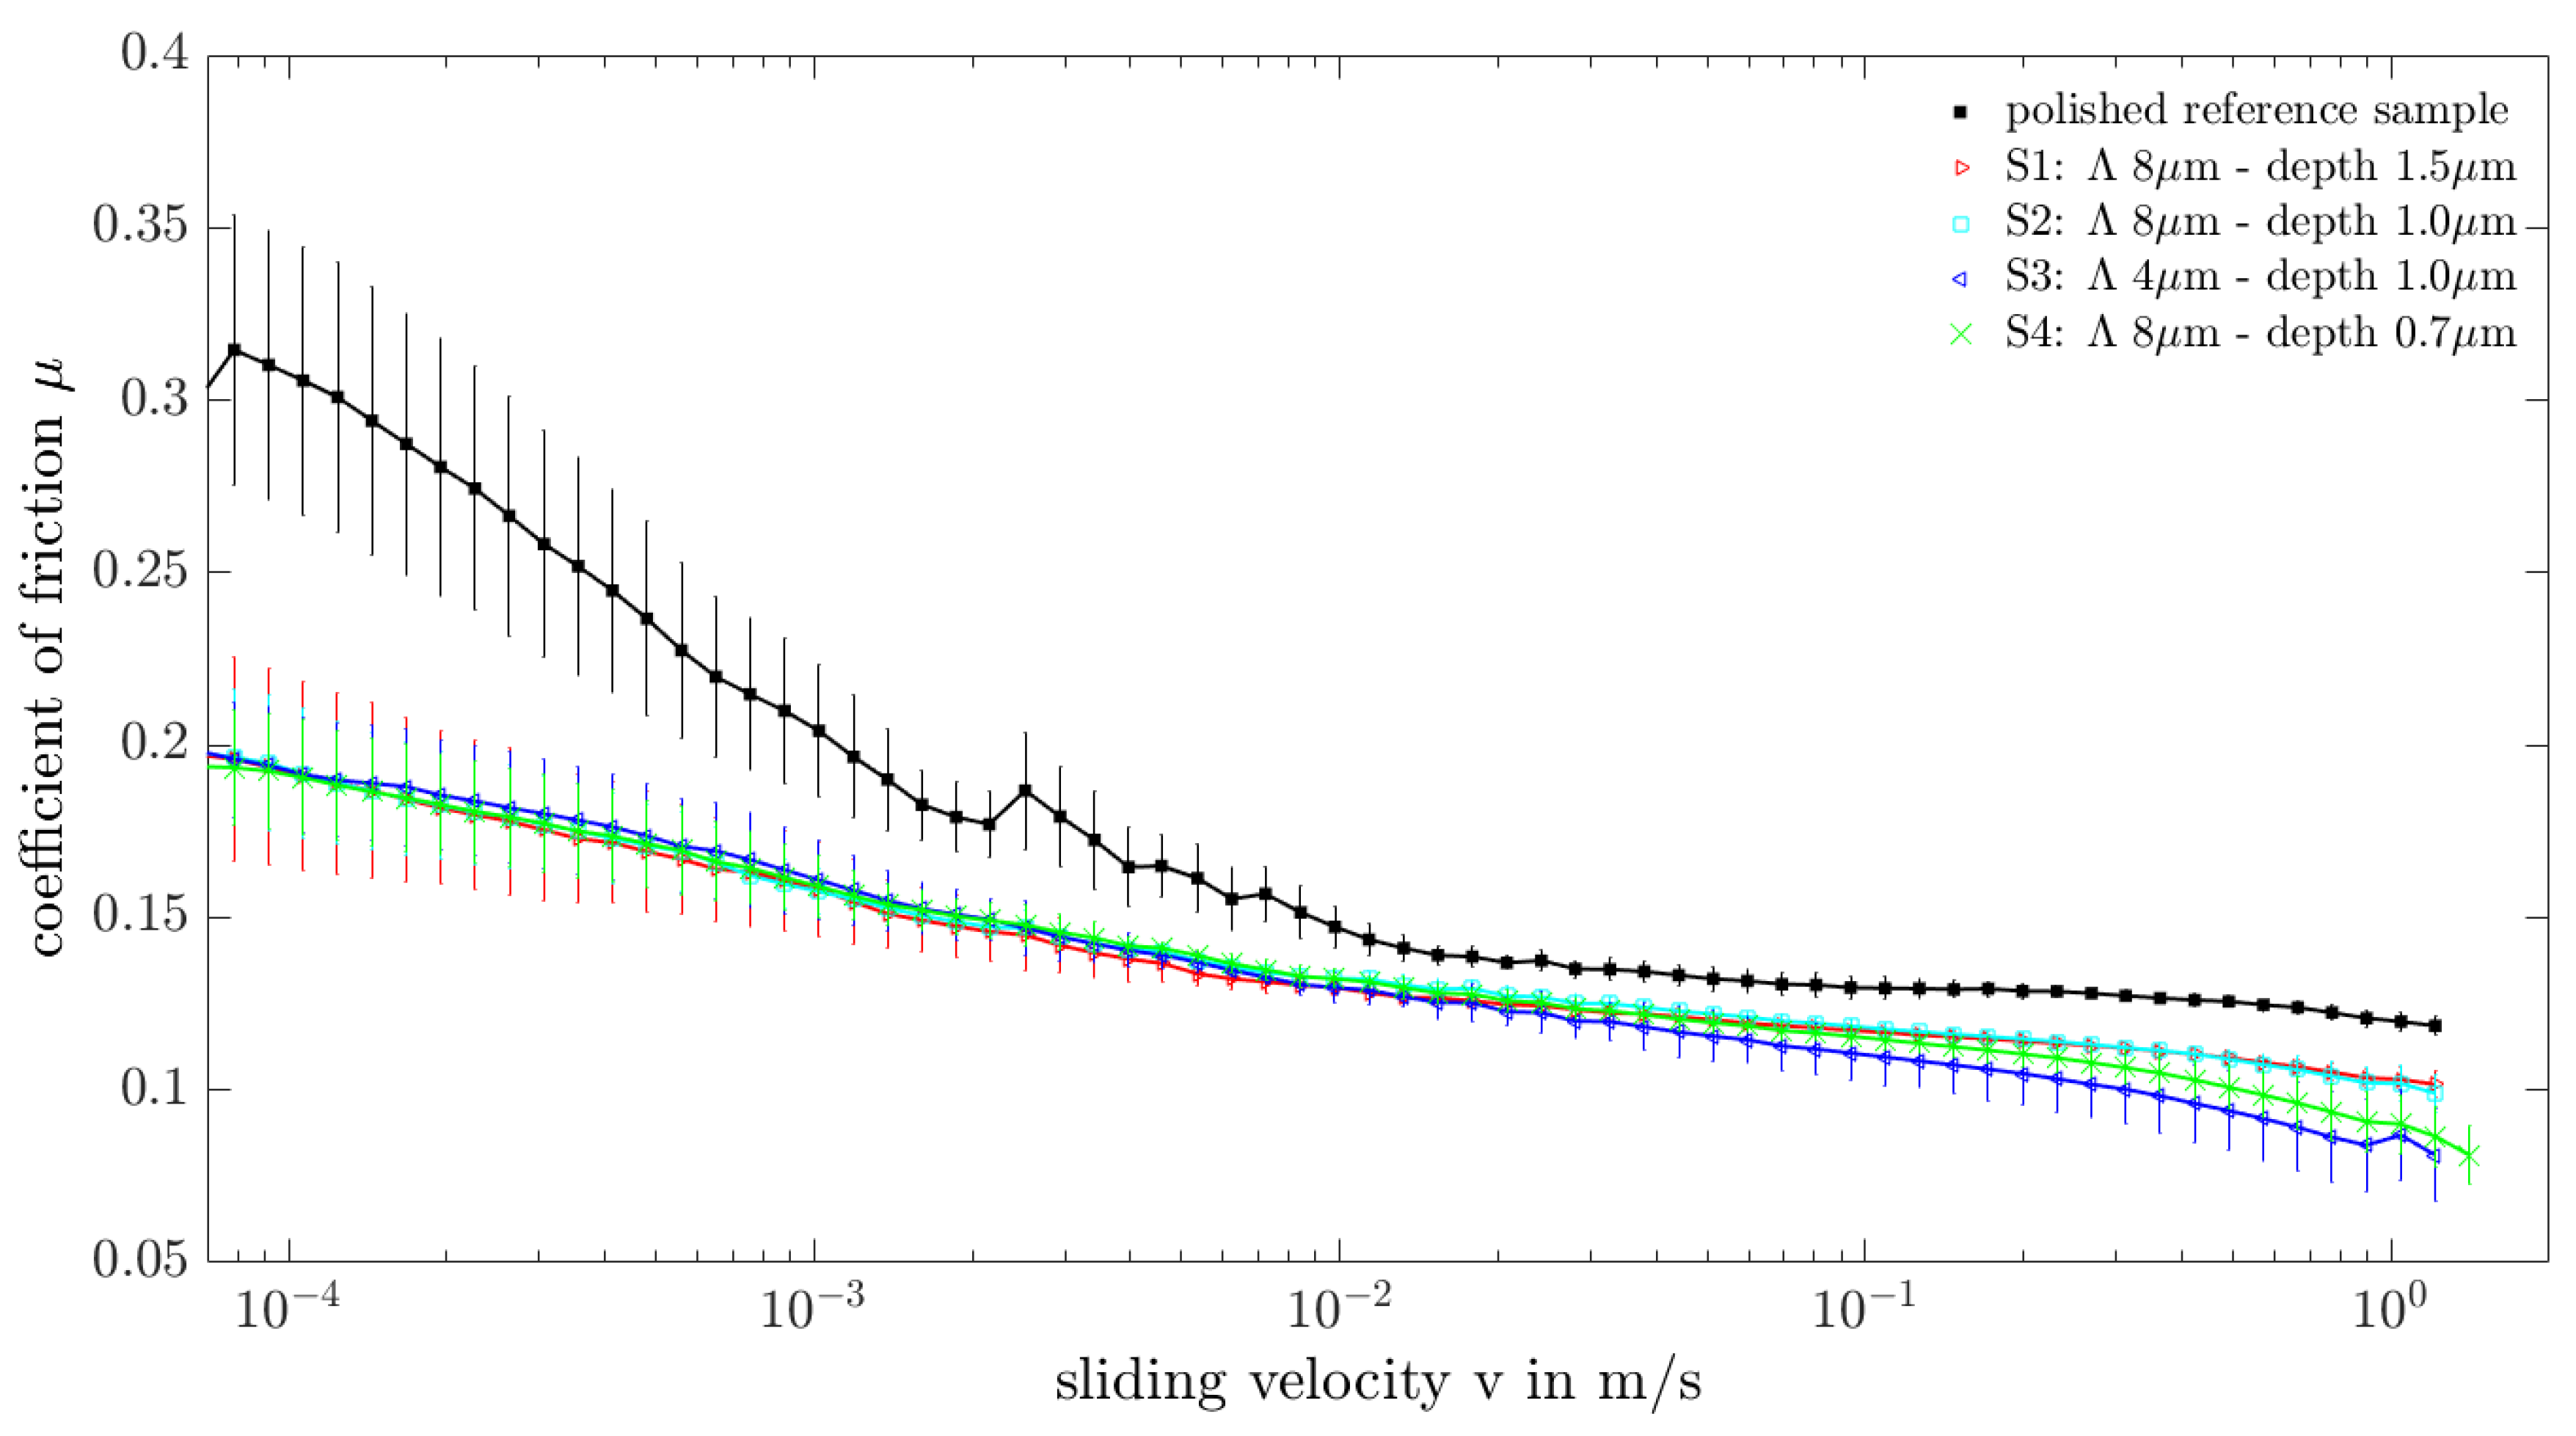
Appendix A.1. Tribological comparison of all DLIP textures introduced in this study

Figure A1. Tribological comparison of Stribeck curves for all DLIP textures introduced in this study and a polished reference sample.
Lubricants 07 00054 g0a1

Appendix A.2. Numerical Parameters and Solver Settings

In OpenFOAM further specification can be made with respect to the algorithms used to solve equations and matrices numerically. Table A1 and Table A2 show the specifications in fvSolution and fvSchemes, respectively.
Table A1. Specifications fvSolution.
FieldSolverPreconditionerSmoother
pdPCGDICGaussSeidel
UBiCGStabDILUnone
CPBiCGDILUnone
CcoupledGMRESCholeskynone
Table A2. Specifications fvSchemes.
OperationOpenFOAMScheme
Time derivativeddtEuler
GradientgradGauss linear
DivergencedivGauss Gamma
LaplacianlaplacianGauss linear uncorrected
Interpolationinterpolationlinear

References

  1. Holmberg, K.; Andersson, P.; Erdemir, A. Global energy consumption due to friction in passenger cars. Tribol. Int. 2012, 47, 221–234. [Google Scholar] [CrossRef]
  2. Baumgartner, W.; Saxe, F.; Weth, A.; Hajas, D.; Sigumonrong, D.; Emmerlich, J.; Singheiser, M.; Böhme, W.; Schneider, J.M. The sandfish’s skin: Morphology, chemistry and reconstruction. J. Bionic Eng. 2007, 4, 1–9. [Google Scholar] [CrossRef]
  3. Kovalchenko, A.; Ajayi, O.; Erdemir, A.; Fenske, G. Friction and wear behavior of laser textured surface under lubricated initial point contact. Wear 2011, 271, 1719–1725. [Google Scholar] [CrossRef]
  4. Borghi, A.; Gualtieri, E.; Marchetto, D.; Moretti, L.; Valeri, S. Tribological effects of surface texturing on nitriding steel for high-performance engine applications. Wear 2008, 265, 1046–1051. [Google Scholar] [CrossRef]
  5. Blatter, A.; Maillat, M.; Pimenov, S.; Shafeev, G.; Simakin, A.; Loubnin, E. Lubricated sliding performance of laser-patterned sapphire. Wear 1999, 232, 226–230. [Google Scholar] [CrossRef]
  6. Andersson, P.; Koskinen, J.; Varjus, S.E.; Gerbig, Y.; Haefke, H.; Georgiou, S.; Zhmud, B.; Buss, W. Microlubrication effect by laser-textured steel surfaces. Wear 2007, 262, 369–379. [Google Scholar] [CrossRef]
  7. Duarte, M.; Lasagni, A.; Giovanelli, R.; Narciso, J.; Louis, E.; Mücklich, F. Increasing lubricant film lifetime by grooving periodical patterns using laser interference metallurgy. Adv. Eng. Mater. 2008, 10, 554–558. [Google Scholar] [CrossRef]
  8. Rosenkranz, A.; Martin, B.; Bettscheider, S.; Gachot, C.; Kliem, H.; Mücklich, F. Correlation between solid–solid contact ratios and lubrication regimes measured by a refined electrical resistivity circuit. Wear 2014, 320, 51–61. [Google Scholar] [CrossRef]
  9. Etsion, I. State of the art in laser surface texturing. J. Tribol. 2005, 127, 248–253. [Google Scholar] [CrossRef]
  10. Braun, D. Größeneffekte bei strukturierten tribologischen Wirkflächen. Ph.D. Thesis, KIT, Karlsruhe, Germany, 2015. [Google Scholar]
  11. Stark, T.; Alamri, S.; Aguilar-Morales, A.I.; Kiedrowski, T.; Lasagni, A.F. Positive effect of laser structured surfaces on tribological performance. J. Laser Micro Nanoeng. 2019, 14, 13–18. [Google Scholar]
  12. Lasagni, A.F. Laser interference patterning methods: Possibilities for high-throughput fabrication of periodic surface patterns. Adv. Opt. Technol. 2017, 6, 265–275. [Google Scholar] [CrossRef]
  13. Klima, J. Lubricant Transport Towards Tribocontact in Capillary Surface Structures; KIT Scientific Publishing: Karlsruhe, Germany, 2018; ISBN 978-3-7315-0814-4. [Google Scholar]
  14. Lucas, R. Ueber das Zeitgesetz des kapillaren Aufstiegs von Flüssigkeiten. Kolloid Zeitschrift 1918, 23, 15–22. [Google Scholar] [CrossRef]
  15. Washburn, E.W. The dynamics of capillary flow. Phys. Rev. 1921, 17, 273. [Google Scholar] [CrossRef]
  16. Yang, D.; Krasowska, M.; Priest, C.; Popescu, M.N.; Ralston, J. Dynamics of capillary-driven flow in open microchannels. J. Phys. Chem. 2011, 115, 18761–18769. [Google Scholar] [CrossRef]
  17. Chen, T. Capillary Force-Driven Fluid Flow in Open Grooves with Different Sizes. J. Thermophys. Heat Transf. 2015, 29, 594–601. [Google Scholar] [CrossRef]
  18. Grützmacher, P.G.; Rosenkranz, A.; Gachot, C. How to guide lubricants–Tailored laser surface patterns on stainless steel. Appl. Surf. Sci. 2016, 370, 59–66. [Google Scholar] [CrossRef]
  19. Lambert, P. Surface Tension in Microsystems; Springer: Berlin/Heidelberg, Germany, 2013. [Google Scholar]
  20. Jacqmin, D. Contact-line dynamics of a diffuse fluid interface. J. Fluid Mech. 2000, 402, 57–88. [Google Scholar] [CrossRef]
  21. Cai, X.; Marschall, H.; Wörner, M.; Deutschmann, O. Numerical Simulation of Wetting Phenomena with a Phase-Field Method Using OpenFOAM®. Chem. Eng. Technol. 2015, 38, 1985–1992. [Google Scholar] [CrossRef]
  22. Fink, V.; Cai, X.; Stroh, A.; Bernard, R.; Kriegseis, J.; Frohnapfel, B.; Marschall, H.; Wörner, M. Drop bouncing by micro-grooves. Int. J. Heat Fluid Flow 2018, 70, 271–278. [Google Scholar] [CrossRef]
  23. Zolper, T.; Li, Z.; Chen, C.; Jungk, M.; Marks, T.; Chung, Y.W.; Wang, Q. Lubrication Properties of Polyalphaolefin and Polysiloxane Lubricants: Molecular Structure—Tribology Relationships. Tribol. Lett. 2012, 48, 355–365. [Google Scholar] [CrossRef]
  24. Deubelbeiss, Y.; Kaus, B. Comparison of Eulerian and Lagrangian numerical techniques for the Stokes equations in the presence of strongly varying viscosity. Phys. Earth Planet. Int. 2008, 171, 92–111. [Google Scholar] [CrossRef]
  25. Niethammer, M.; Marschall, H.; Kunkelmann, C.; Bothe, D. A numerical stabilization framework for viscoelastic fluid flow using the finite volume method on general unstructured meshes. Int. J. Numer. Methods Fluids 2018, 86, 131–166. [Google Scholar] [CrossRef]
  26. Lasagni, A.; Roch, T.; Berger, J.; Kunze, T.; Lang, V.; Beyer, E. To use or not to use (direct laser interference patterning), that is the question. In Proceedings of the Laser-Based Micro-and Nanoprocessing IX, San Francisco, CA, USA, 10–12 February 2015; International Society for Optics and Photonics: Bellingham, WA, USA, 2015; Volume 9351, p. 935115. [Google Scholar]
Figure 1. Experimental setup for fluid transport evaluation. In (a) the setup for the fluid transport evaluation inside the laser textures is shown. The fluid propagation in the channel-like textures is observed via a microscope from the top. In (b) the setup for the lens experiments is illustrated. The transparent glass lens is a substitute for the tribological counterpart and allows fluid flow analysis at the transition region between channels and tribocontact.
Lubricants 07 00054 g001
Figure 2. Experimental setup for tribological evaluation. A side view on the left-hand side and a top view on the right-hand side shows the important components of the setup and the contact line (4) on the rotating ball (3).
Lubricants 07 00054 g002
Figure 3. Simulation of oil in channels of different widths at t = 0.039 s . The left column (a,c,e) illustrates a cut through the domain at the geometrical center of the droplet. The right column (b,d,f) shows one half of the spreaded droplet filling the channels from the bottom.
Lubricants 07 00054 g003
Figure 4. Quantitative evaluation of the numerical results comparing the spreading factor χ for the different channels widths as a function of the relative time t * .
Lubricants 07 00054 g004
Figure 5. Microscope pictures and profiles of laser textures evaluated in this study. Textures and profiles of S1 (a) and (e), S2 (b) and (f), S3 (c) and (g) and S4 (d) and (h).
Lubricants 07 00054 g005
Figure 6. Side view of channels from texture S1. This microscopic image demonstrates in an exemplary manner the integrity of the laser produced textures. It can be seen that there are no discontinuities which lead to open structures.
Lubricants 07 00054 g006
Figure 7. Experimental investigation of fluid transport in laser textured surfaces. (a) Specially designed sample with different regions. 1: Reservoir, 2: Laser surface textures, 3: mm-scale (500 μ m per bar); (b) fluid front propagating in laser textures at a distance of 500 μ m .
Lubricants 07 00054 g007
Figure 8. Quantitative results of flow behavior in different Direct Laser Interference Patterning (DLIP) textures (S2–S4). The sample introduced in Figure 7 was used to measure the distance of the fluid column in different channel-like textures as a function of time. The curves show Washburn-like behavior with the fastest transport in channels with smaller period and higher depth.
Lubricants 07 00054 g008
Figure 9. Experimental results from tribological evaluation of selectively structured samples. The Stribeck curves of three different samples with the same laser texture S1 ( λ = 8   μ m , depth = 1.5   μ m ) but with differently structured regions (“fully textured”, “triboregion blank” or “triboregion only”) are compared to the Stribeck curve of a polished reference sample.
Lubricants 07 00054 g009
Figure 10. In order to elucidate the flow behavior in the transition region between channels and tribocontact a transparent glass lense made of N-BK7 is used as a substitute for the counterbody. (a) A side view of the glass lens on top of a textured sample; in (b) the lens is manually put into the tribocontact and the flow around the lens is observed through the lens with a microscope.
Lubricants 07 00054 g010
Figure 11. Temporal course of fluid flow around glass lens in tribocontact and building of meniscus. (a) Fluid front approaching the tribocontact; (b) fluid front passing by the tribocontact; (c) fluid filling the channels behind the tribocontact and (d) building meniscus started at the contact of the lens with the sample.
Lubricants 07 00054 g011
Table 1. Laser parameters for the structures evaluated in this study (S1–S4).
PeriodHatch DistanceFrequencyPulse EnergyFluencePulse Overlap
S1 8.0 μ m 16.0 μ m 20 k Hz 10.3 μ J 0.82 J / c m 96.88%
S2 8.0 μ m 8.0 μ m 10 k Hz 3.5 μ J 0.55 J / c m 93.75%
S3 4.0 μ m 4.0 μ m 10 k Hz 2.6 μ J 0.41 J / c m 93.75%
S4 4.0 μ m 4.0 μ m 6.7 k Hz 3.5 μ J 0.55 J / c m 90.63%
Table 2. Depths of the laser textures S1–S4.
S1S2S3S4
period 8.0 μ m 8.0 μ m 4.0 μ m 4.0 μ m
depth 1.5 μ m 1.0 μ m 1.0 μ m 0.7 μ m

