Article

Tribological Performance Evolution of Circular-Textured Surface Embedded with Paraffin Regulated by Texture Geometric Dimensions


1
College of Mechanical and Electrical Engineering, Nanjing University of Aeronautics and Astronautics, Nanjing 210016, China
2
National Key Laboratory of Helicopter Aeromechanics, Nanjing University of Aeronautics and Astronautics, Nanjing 210016, China
3
Hong Kong Branch of National Precious Metals Material Engineering Research Center (NPMM), City University of Hong Kong, Hong Kong, China
*
Author to whom correspondence should be addressed.
Lubricants 2026, 14(7), 282; https://doi.org/10.3390/lubricants14070282
Submission received: 17 June 2026 / Revised: 13 July 2026 / Accepted: 20 July 2026 / Published: 21 July 2026
(This article belongs to the Special Issue Phase-Change-Induced Improvements in Friction Interface Lubrication)

Abstract

The positive effect of paraffin on lowering the temperature, friction coefficient, and wear mass of a circular-textured surface has been proved. On this basis, this study is meant to reveal the influence of surface density and diameter of circular texture on the lubricating effect. It was found that the friction coefficient and wear kept decreasing as surface density increased from 6.8% to 24.2% due to increasing dynamic pressure up to 285 Pa. However, as surface density further increased to 40.1%, the tribological properties were weakened due to high contact stress from a smaller contact area. On the basis of the optimized surface density of 24.2%, the friction coefficient and wear kept decreasing due to increasing dynamic pressure up to 326 Pa as the diameter of the circular texture increased from 400 μm to 550 μm. When the diameter of the circular texture increased to 650 μm, the tribological properties of the textured surface were weakened. Compared with a depth of 500 μm, a depth of 1000 μm could store more paraffin, providing better temperature-reducing and lubricating effects. Ultimately, the minimum temperature of 40.78 °C, minimum friction coefficient of 0.063 ± 0.003, and minimum wear loss of 0.70 ± 0.10 mg were obtained under the optimal texture surface density, diameter, and depth of 24.2%, 550 μm, and 1000 μm, respectively.

1. Introduction

Dry friction could avoid the usage of oil lubricants, but approximately 95% of mechanical energy is converted into thermal energy in various ways, including heat dissipation induced by slip and compressive deformation of rubbing surfaces [1], heat generation from interfacial chemical reactions between mating materials, and energy loss via phonon-electron coupling [2]. When the accumulated heat at the friction interface cannot be dissipated in a timely manner, the temperature on material surfaces rises sharply, forming an inhomogeneous temperature field and a steep temperature gradient [3,4,5,6]. This unstable thermal field further triggers thermoelastic deformation of contact surfaces [7,8,9], contact damage [10], tribochemical reactions [11,12], localized melting or scuffing [13,14], plastic deformation, and surface cracking [15,16,17]. These structural responses would accelerate material wear, deteriorate the stability of the friction system, and eventually lead to premature failure of relevant components [18]. To suppress interface temperature rise and stabilize thermal status under dry friction, it is therefore essential to develop novel antifriction surfaces with superior capacity for frictional heat conduction, dissipation, and even absorption.
In recent years, numerous researchers have mitigated the adverse effects of frictional heat by designing coatings with low friction coefficients, such as MoS2 [19], Ti/MoS2 [20], and AT13/WS2 [21] coatings. Among them, the MoS2 solid lubricant coating reduced the temperature of cubic boron nitride (cBN) grinding wheels by 64 °C, alleviated the wear, and improved the ground surface quality of titanium alloy workpieces [19]. Similarly, the friction coefficient of the AT13/WS2 coating (approximately 0.2) is markedly lower than that of the AT13 coating (approximately 0.7) under dry friction test conditions [21]. On the other hand, the coatings with excellent heat-transfer capacity, such as Gr-MoS2/Cu and graphene oxide-incorporated coatings, could mitigate the adverse effects of frictional heat as well. When the content of MoS2 was 1.5%, the heat dissipation performance of Gr-MoS2/Cu coatings was increased by 1.27 times compared with the case at room temperature, while the friction coefficient was reduced by 11.2%. Meanwhile, the wear amount decreased by 76.2% compared with room temperature [22]. Similarly, the excellent thermal conductivity of GO effectively reduced temperature accumulation during friction. Under an external load of 8 N, the surface temperature of GO–Nylon decreased by 14% compared to the Nylon surface, and the coefficient of friction (COF) decreased by 21% [23]. In addition, the fabrication of surface textures with excellent heat-dissipation performance has been proven to be an effective way to lower friction temperature [24,25]. By contrast, the actively heat-absorbing surface design is a wise choice. For instance, Ma et al. [26] fabricated a circular texture on 65 Mn steel blades by laser processing. Owing to the lubrication effect as well as wear debris capturing ability, the wear loss was reduced by approximately 36.22% under a load of 100 N. Zhang et al. [27] pointed out that, as compared with the untextured surface, the wear loss of the textured surface with 1.2 mm spacing and 34.8% area occupancy is reduced by more than 80%. Moreover, the wear resistance of laser-textured surfaces with micro-dimples is better than that of micro-grooves and reticular grooves. Similarly, designs with circular and fish-scale textures reduced the surface temperature of SiC by 17.7% and 26.8%, respectively. Combined with the texture’s ability to retain abrasive particles, surface wear of SiC is alleviated [28]. It is worth noting that the above methods belong to passive heat dissipation. By contrast, the actively heat-absorbing surface design is a wise choice. For instance, the solid lubricants embedded in the micropores of cermet could be softened by absorbing frictional heat. Consequently, the softened lubricants migrate along micropore channels toward the frictional interface driven by contact stress, and form a self-replenishing lubricating film [29,30], thus leading to a reduction in the friction coefficient and wear by 57% and 66% [31]. It is noteworthy that paraffin, as a good solid lubricant, has attracted researchers’ attention. Although Wang et al. [32] deposited a layer of phase change material (PCM) with a melting point of 80 °C on AlN foils, the frictional temperature was too low to trigger the phase transition of the material, resulting in only a weak lubricating effect. By contrast, Polycarpou et al. [33] incorporated paraffin microcapsules into aromatic thermosetting copolyesters and found that paraffin could absorb frictional heat, lowering the temperature of the frictional contact zone to approximately 50 °C. Meanwhile, the paraffin released after microcapsule rupture exerted a lubricating effect.
Recently, our group’s research has found that the combination of surface texture and paraffin could effectively reduce friction temperature, friction coefficient, and wear by the degrees of 11.2%, 69.1%, and 79.5%, respectively, due to phase change [34,35]. Our further study [36] revealed that the circular texture was the optimal texture shape matching with paraffin. On one hand, our recently published work only verified the friction-reducing and cooling effect of paraffin-filled circular textures, but ignored the coupling influence of texture geometric dimensions (surface density, diameter, depth) on phase-change lubrication performance. Thus, one key novelty of this study is to determine the optimal geometric parameters of circular textures matched with paraffin phase-change lubrication. On the other hand, the other recently published work about surface texture embedded with lubricants only investigates the lubricants without any phase change. Therefore, they only focus on the friction coefficient and wear loss. By contrast, the paraffin used in this study could undergo phase change, which could absorb an amount of friction heat. Thus, the novelty of this study is to systematically investigate the independent and synergistic effects of surface density, diameter, and depth on the tribological and thermal regulation performance of a circular-textured surface embedded with paraffin.

2. Materials and Methodology

2.1. Fabrication of the Composite Surface

A high-strength aeronautical alloy, 7075 aluminum alloy, is widely applied in helicopters, aerospace transmission bearings, and friction-pair components. It suffers severe temperature rise and intensive wear under dry-friction conditions. Thus, the 7075 aluminum alloy, with the chemical composition as listed in Table 1, is used as a substrate in this study. The heat-treatment conditions for 7075 aluminum alloy are solution heat treatment, quenching, and aging in succession.
In comparison with conventional industrial oils, the phase-change transition of paraffin can absorb massive frictional heat due to the great latent heat of phase change (262,370 J/kg). Moreover, paraffin can be pre-stored inside micro-textures, while traditional oil needs a continuous oil-supply circulation system. Thus, paraffin rather than oil is chosen as a lubricant in this study. The composite surface of the circular texture embedded with paraffin is prepared as follows. First, the disk sample of aluminum alloy 7075 is polished by a precision polishing machine (UNIPOL 802, Kejing Co., Ltd., Hefei, China) to a surface roughness Rq = 0.297 μm. To reveal the influence of texture dimension, five surface densities, five diameters, and two depths are chosen, as listed in Table 2. A picosecond laser (Amber NX IR-50S1, Bellin Lasers, Suzhou, China) is used to fabricate a circular texture as the second step. The wavelength, pulse duration, and repetition frequency of the laser are 1064 nm, 10 ps, and 200 kHz. The laser scanning speed, pulse energy, hatch spacing, and number of passes are 400 mm/s, 30 μJ, 10 μm, and 500 passes for a depth of 1000 μm. Afterwards, a laser scanning confocal microscope (LSCM, VK-X150, Keyence, Osaka, Japan) is used to characterize the 3D morphology and cross-sectional contours of surface texture. At the third step, the surface-textured 7075 disk samples are immersed in the melted paraffin with the molecular formula of C20H42 (RT35HC, Rubitherm Technologies GmbH, Berlin, Germany). The phase transition temperature of this paraffin is 36.09 °C [36]. Their thermo-physical properties are listed in Table 3 (provided by the supplier Lidy Energy Technology Co., Ltd., Ningbo, China). Lastly, the immersed 7075 disks are taken out for paraffin solidification, and the residual paraffin on the untextured surface is removed by polishing. After the above steps, the composite surface is obtained, which is denoted as S1–S6 for different surface densities and D1–D6 for different diameters.

2.2. Characterization of Tribological Properties

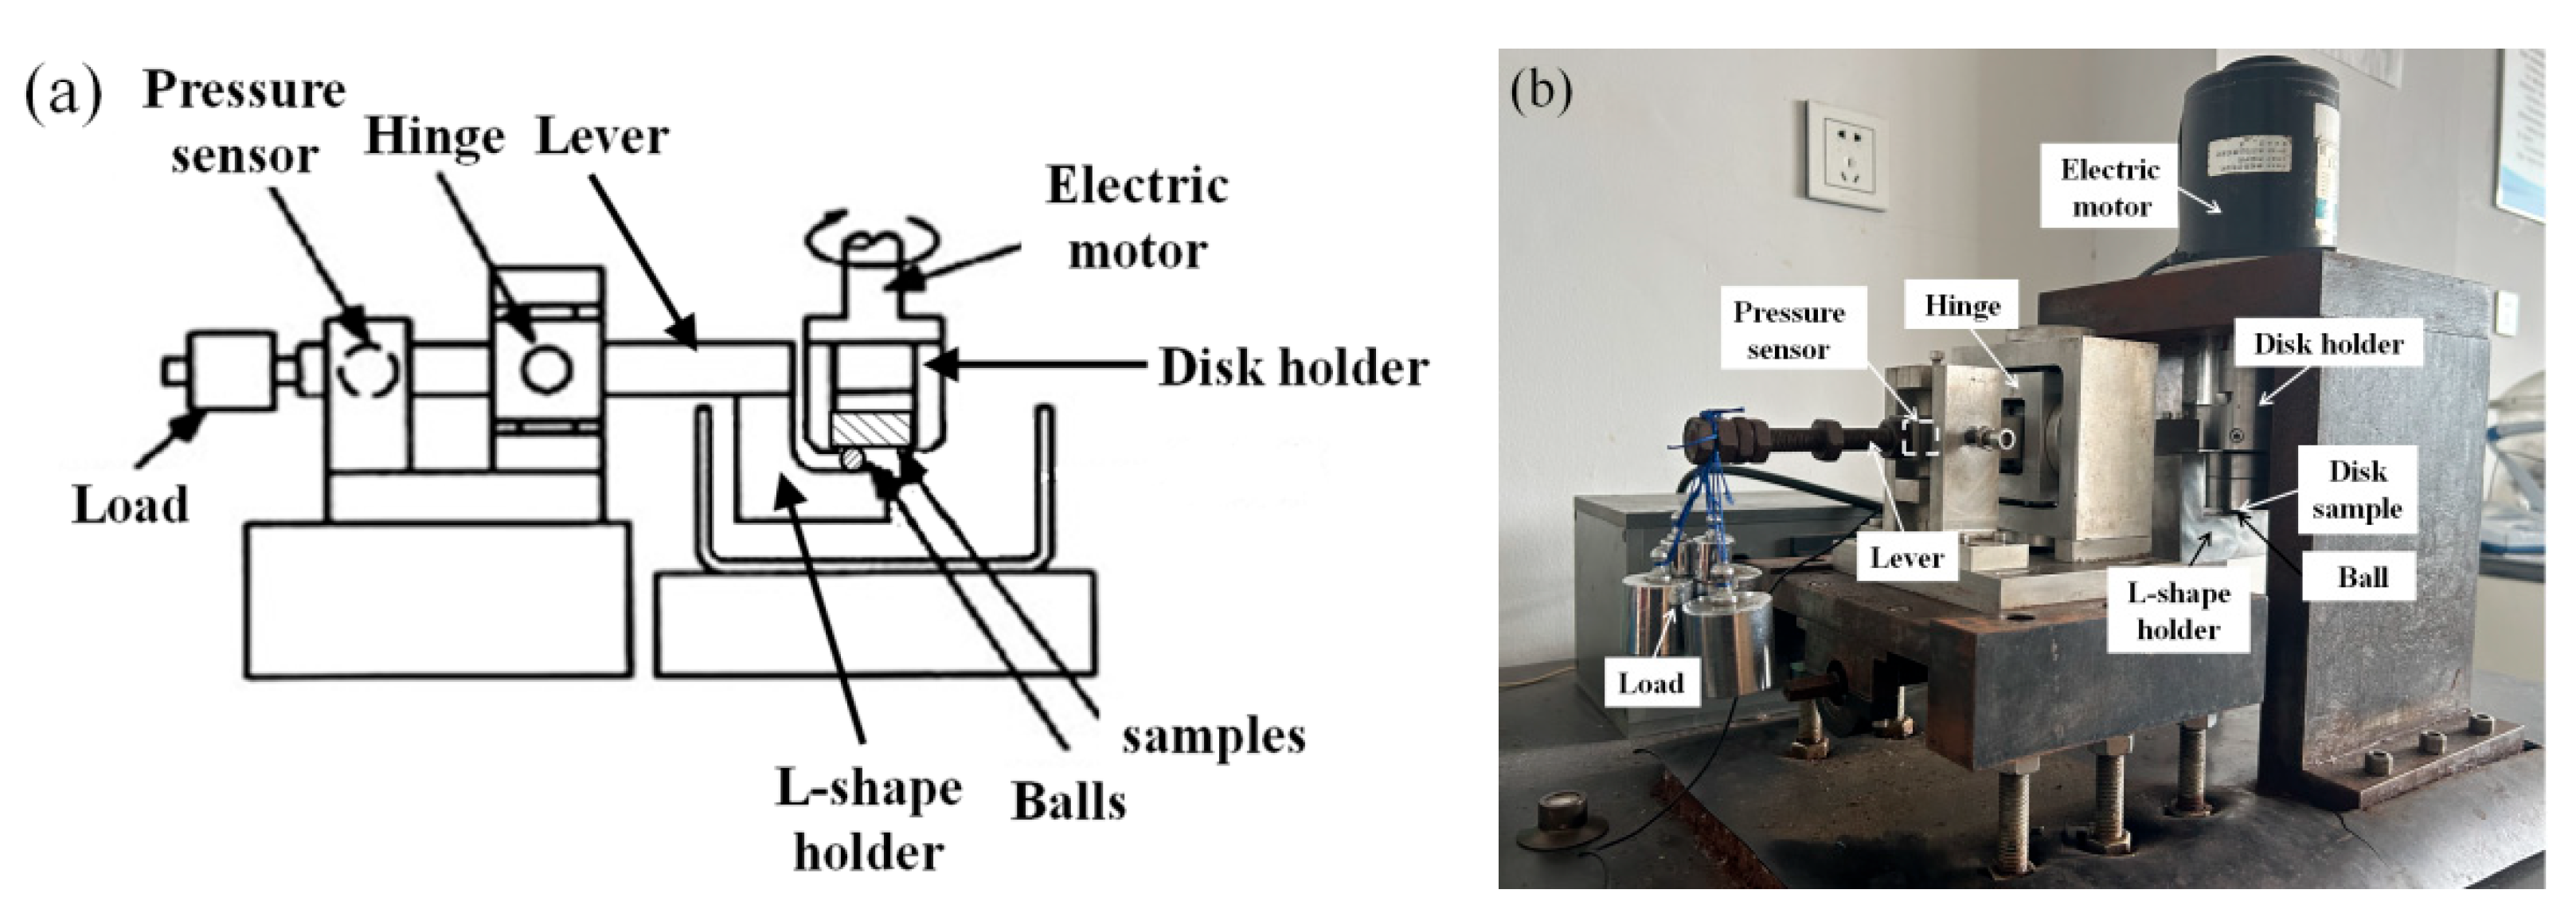
The tribological properties of the composite surface are characterized by a homemade tribometer. The schematic diagram and optical photo are illustrated in Figure 1. As shown in Figure 1b, the electric motor on the top is used to drive the rotation of the 7075 disk samples at a constant velocity of 0.4 m/s. The L-shape link is used to hold the counterpart SUS440C ball. Based on the lever principle, a constant load of 9 N is applied. The friction force is detected by a pressure sensor. To ensure the occurrence of phase change, a sliding distance of 1000 m and an environmental temperature of 32 °C are used. To ensure data repeatability, the tribotest for each sample is repeated twice. The average values from two tribotests are used.
The weight loss of disk samples before and after the tribotest is measured by an electronic balance (AL104-IC, METTLER TOLEDO, Shanghai, China), which is adopted as an indicator for evaluating wear resistance. Moreover, the surface morphologies of wear tracks after the tribotest are observed using a scanning electron microscope (SEM) (FEI Quanta 200 FEG, Waltham, MA, USA) to reveal the details of the wear mechanism.

2.3. Measurement of Temperature at Friction Interface

As stated in the introduction, one aim of the textured surface embedded with paraffin is to lower the temperature at the friction interface. Thus, the temperature during the tribotest is measured by a handheld thermographic camera (HM-TPH21Pro-3AQF, Hangzhou Hikmicro Software Co., Ltd., Hangzhou, China). The measurement range and accuracy are −20–350 °C and ±2%, respectively. The temperature at the friction interface is recorded every 2 min, and the total temperature data for each tribotest is 21 points. The picture-in-picture mode is used to record temperature with an emissivity of 0.89. The measurement accuracy of temperature is ±2%, which is high. Thus, the temperature at the friction interface is recorded once. Nevertheless, in order to ensure statistical insignificance, the average value and standard deviation during steady state are calculated for comparison.

2.4. Simulation of Pressure and Flow Velocity

In order to investigate the influence of texture dimensions on the lubricating effect, the pressure distribution on the composite surface is simulated by using the software Fluent (Version 2022 R1). The completed 3D geometric model is saved in STP format and imported into the Ansys Workbench simulation platform for subsequent processing. Mesh generation is performed on the model within the Mesh module with hexahedral element types adopted, and the global mesh size is set to 0.02 mm. The paraffin wax has a density of 880 kg/m3 and a dynamic viscosity of 0.0044 Pa·s. To balance solution accuracy and computational resources, specific assumptions are proposed for the physical scenario of the model as follows: the lubricating medium is an incompressible Newtonian fluid with laminar flow behavior; body forces are neglected; the flow is steady and isothermal, and no-slip boundary conditions are applied to all walls.
The model is configured in accordance with actual working condition parameters: the upper wall moves at a consistent velocity of 0.4 m/s, identical to that in experiments, while the lower wall is fixed; both walls are assigned rigid no-slip boundary conditions. Considering the periodic arrangement characteristics of textures, symmetric boundary conditions are imposed along the flow velocity direction, and periodic boundary conditions paired with zero-pressure inlet/outlet boundaries are set perpendicular to the flow velocity direction. The left and right walls are connected via periodic boundary conditions, ensuring all physical variables possess identical values on the two walls. A pressure-based steady-state solver is selected, and the SIMPLE algorithm is utilized for pressure–velocity coupling. The second-order upwind scheme is adopted to discretize the momentum equation for enhanced computational accuracy. The convergence criterion is defined such that all residuals fall below 10−6.

3. Results

3.1. Morphologies of the Textured and Composite Surfaces

The surface morphologies of circular textures with different surface densities are illustrated in Figure 2. It can be clearly observed from Figure 2a–f that all textures exhibit regular circular geometric features and uniform distribution. This indicates that the picosecond laser machining process possesses good controllability and repeatability.
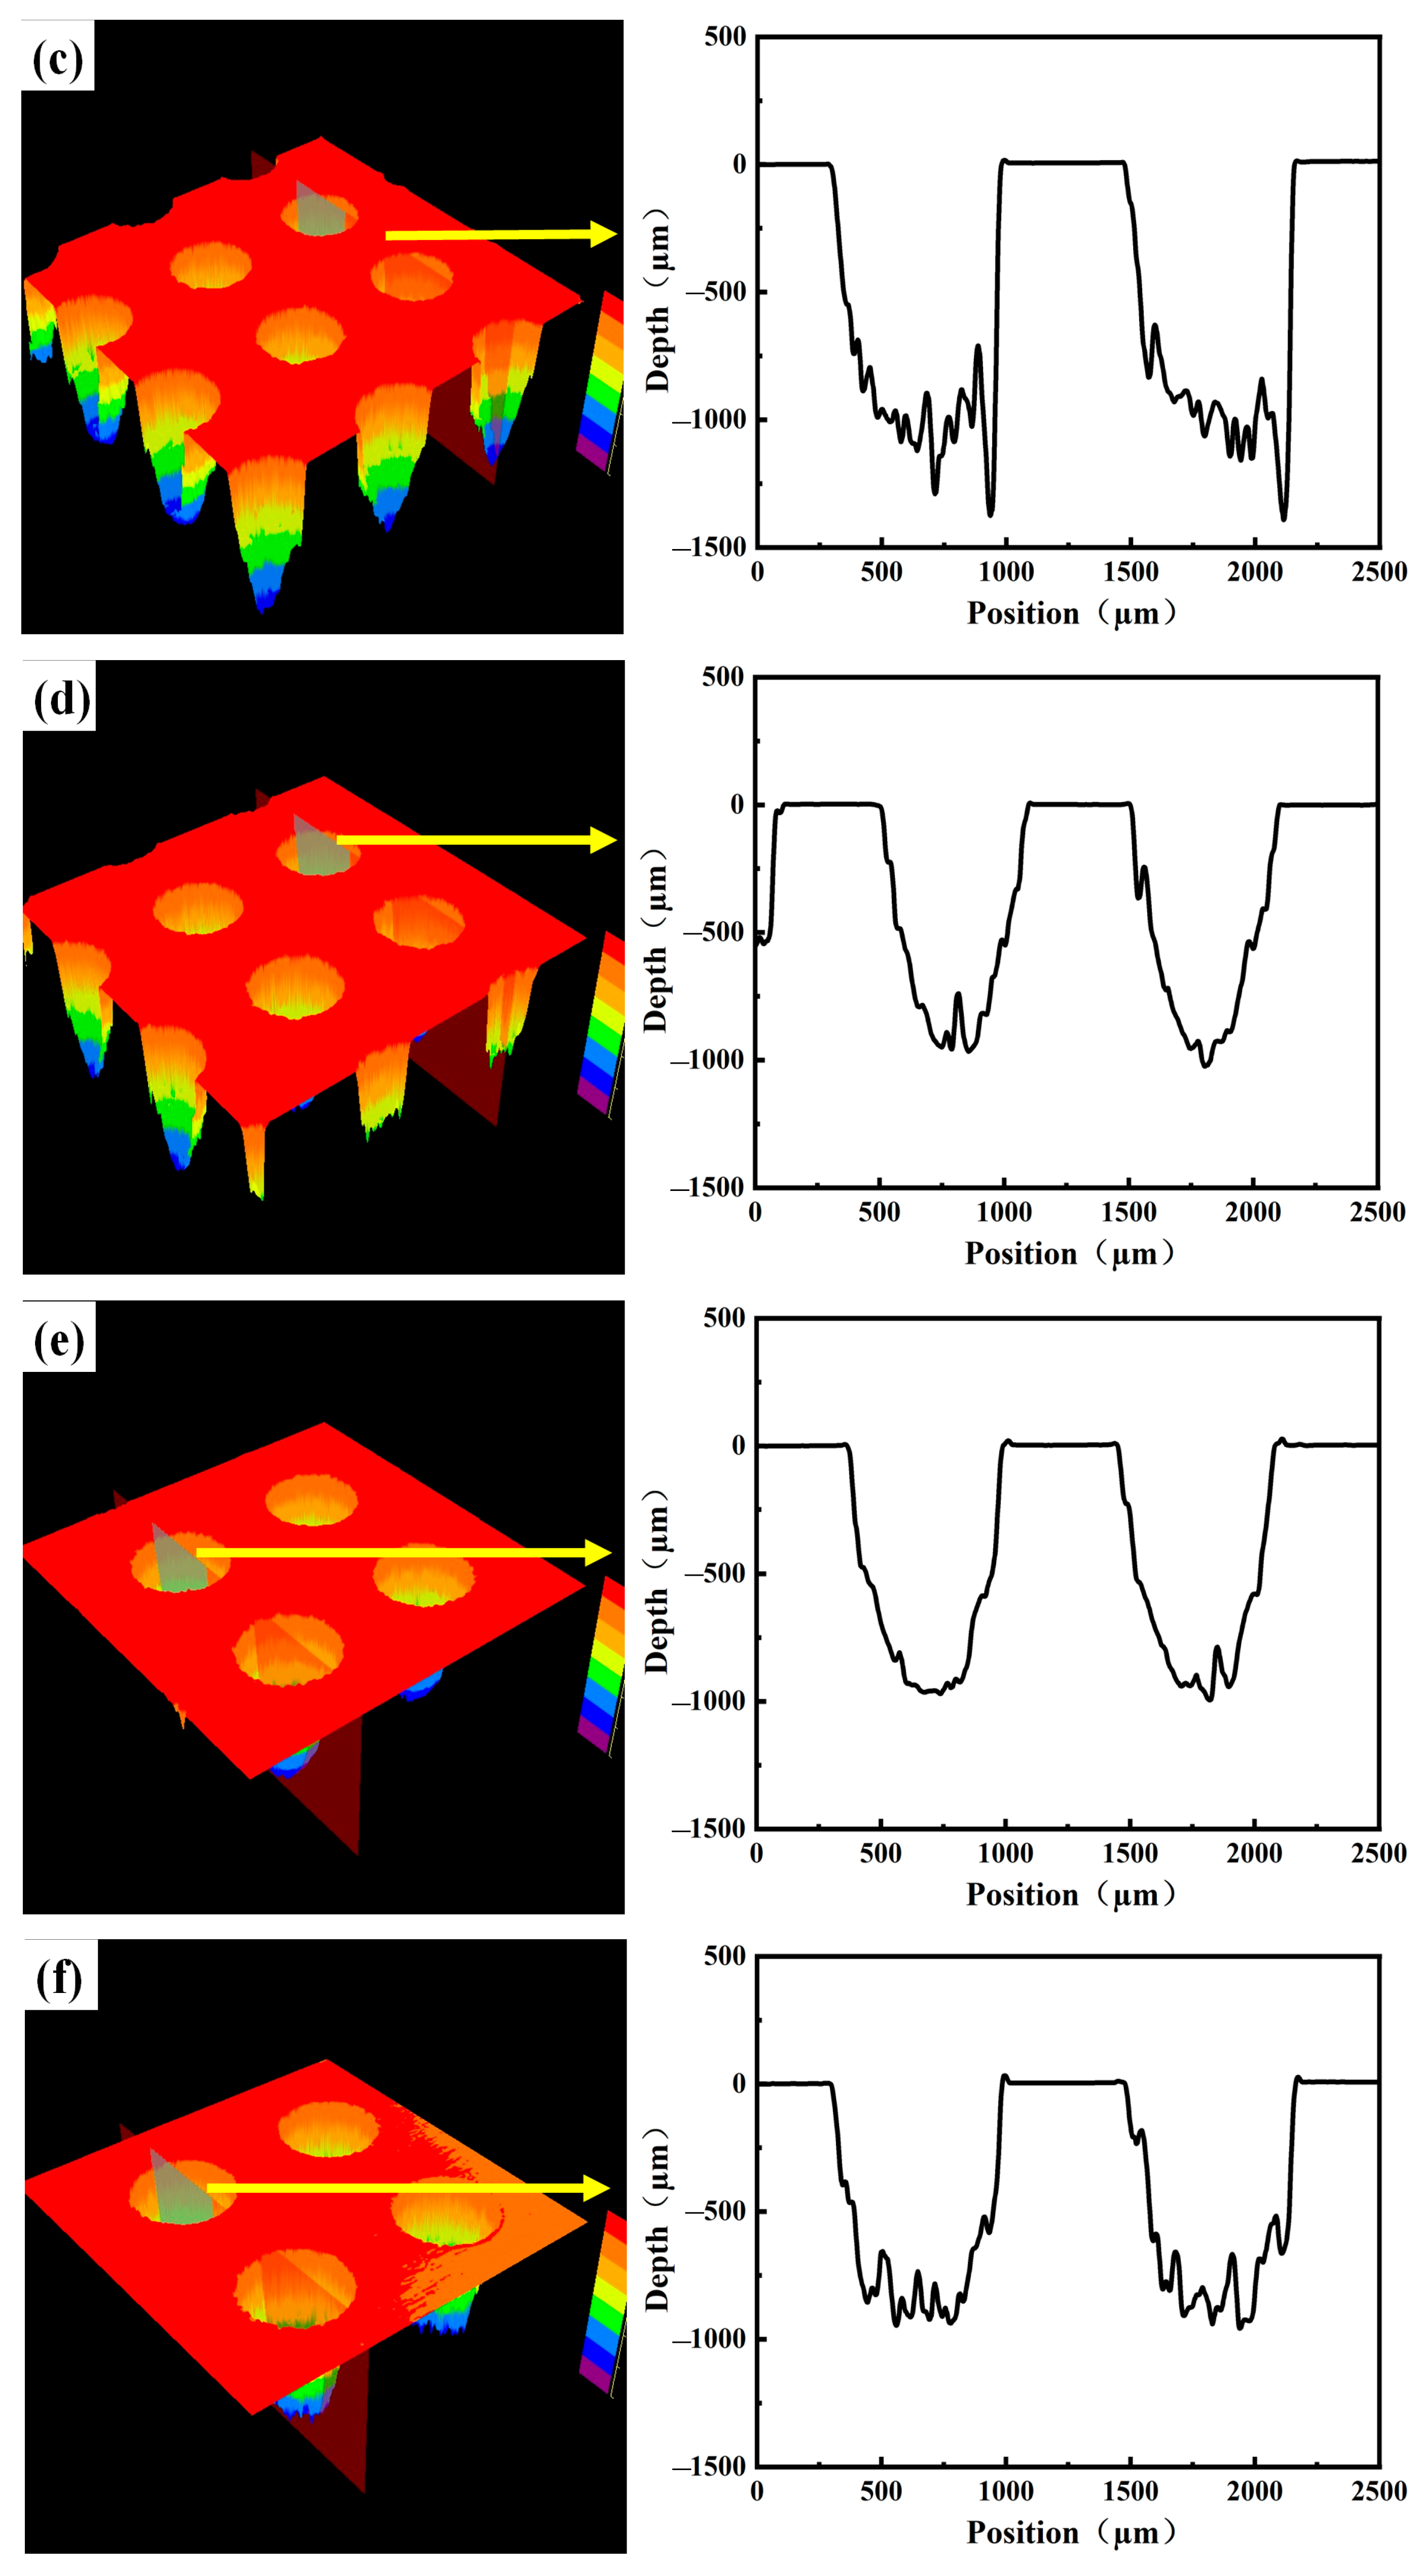
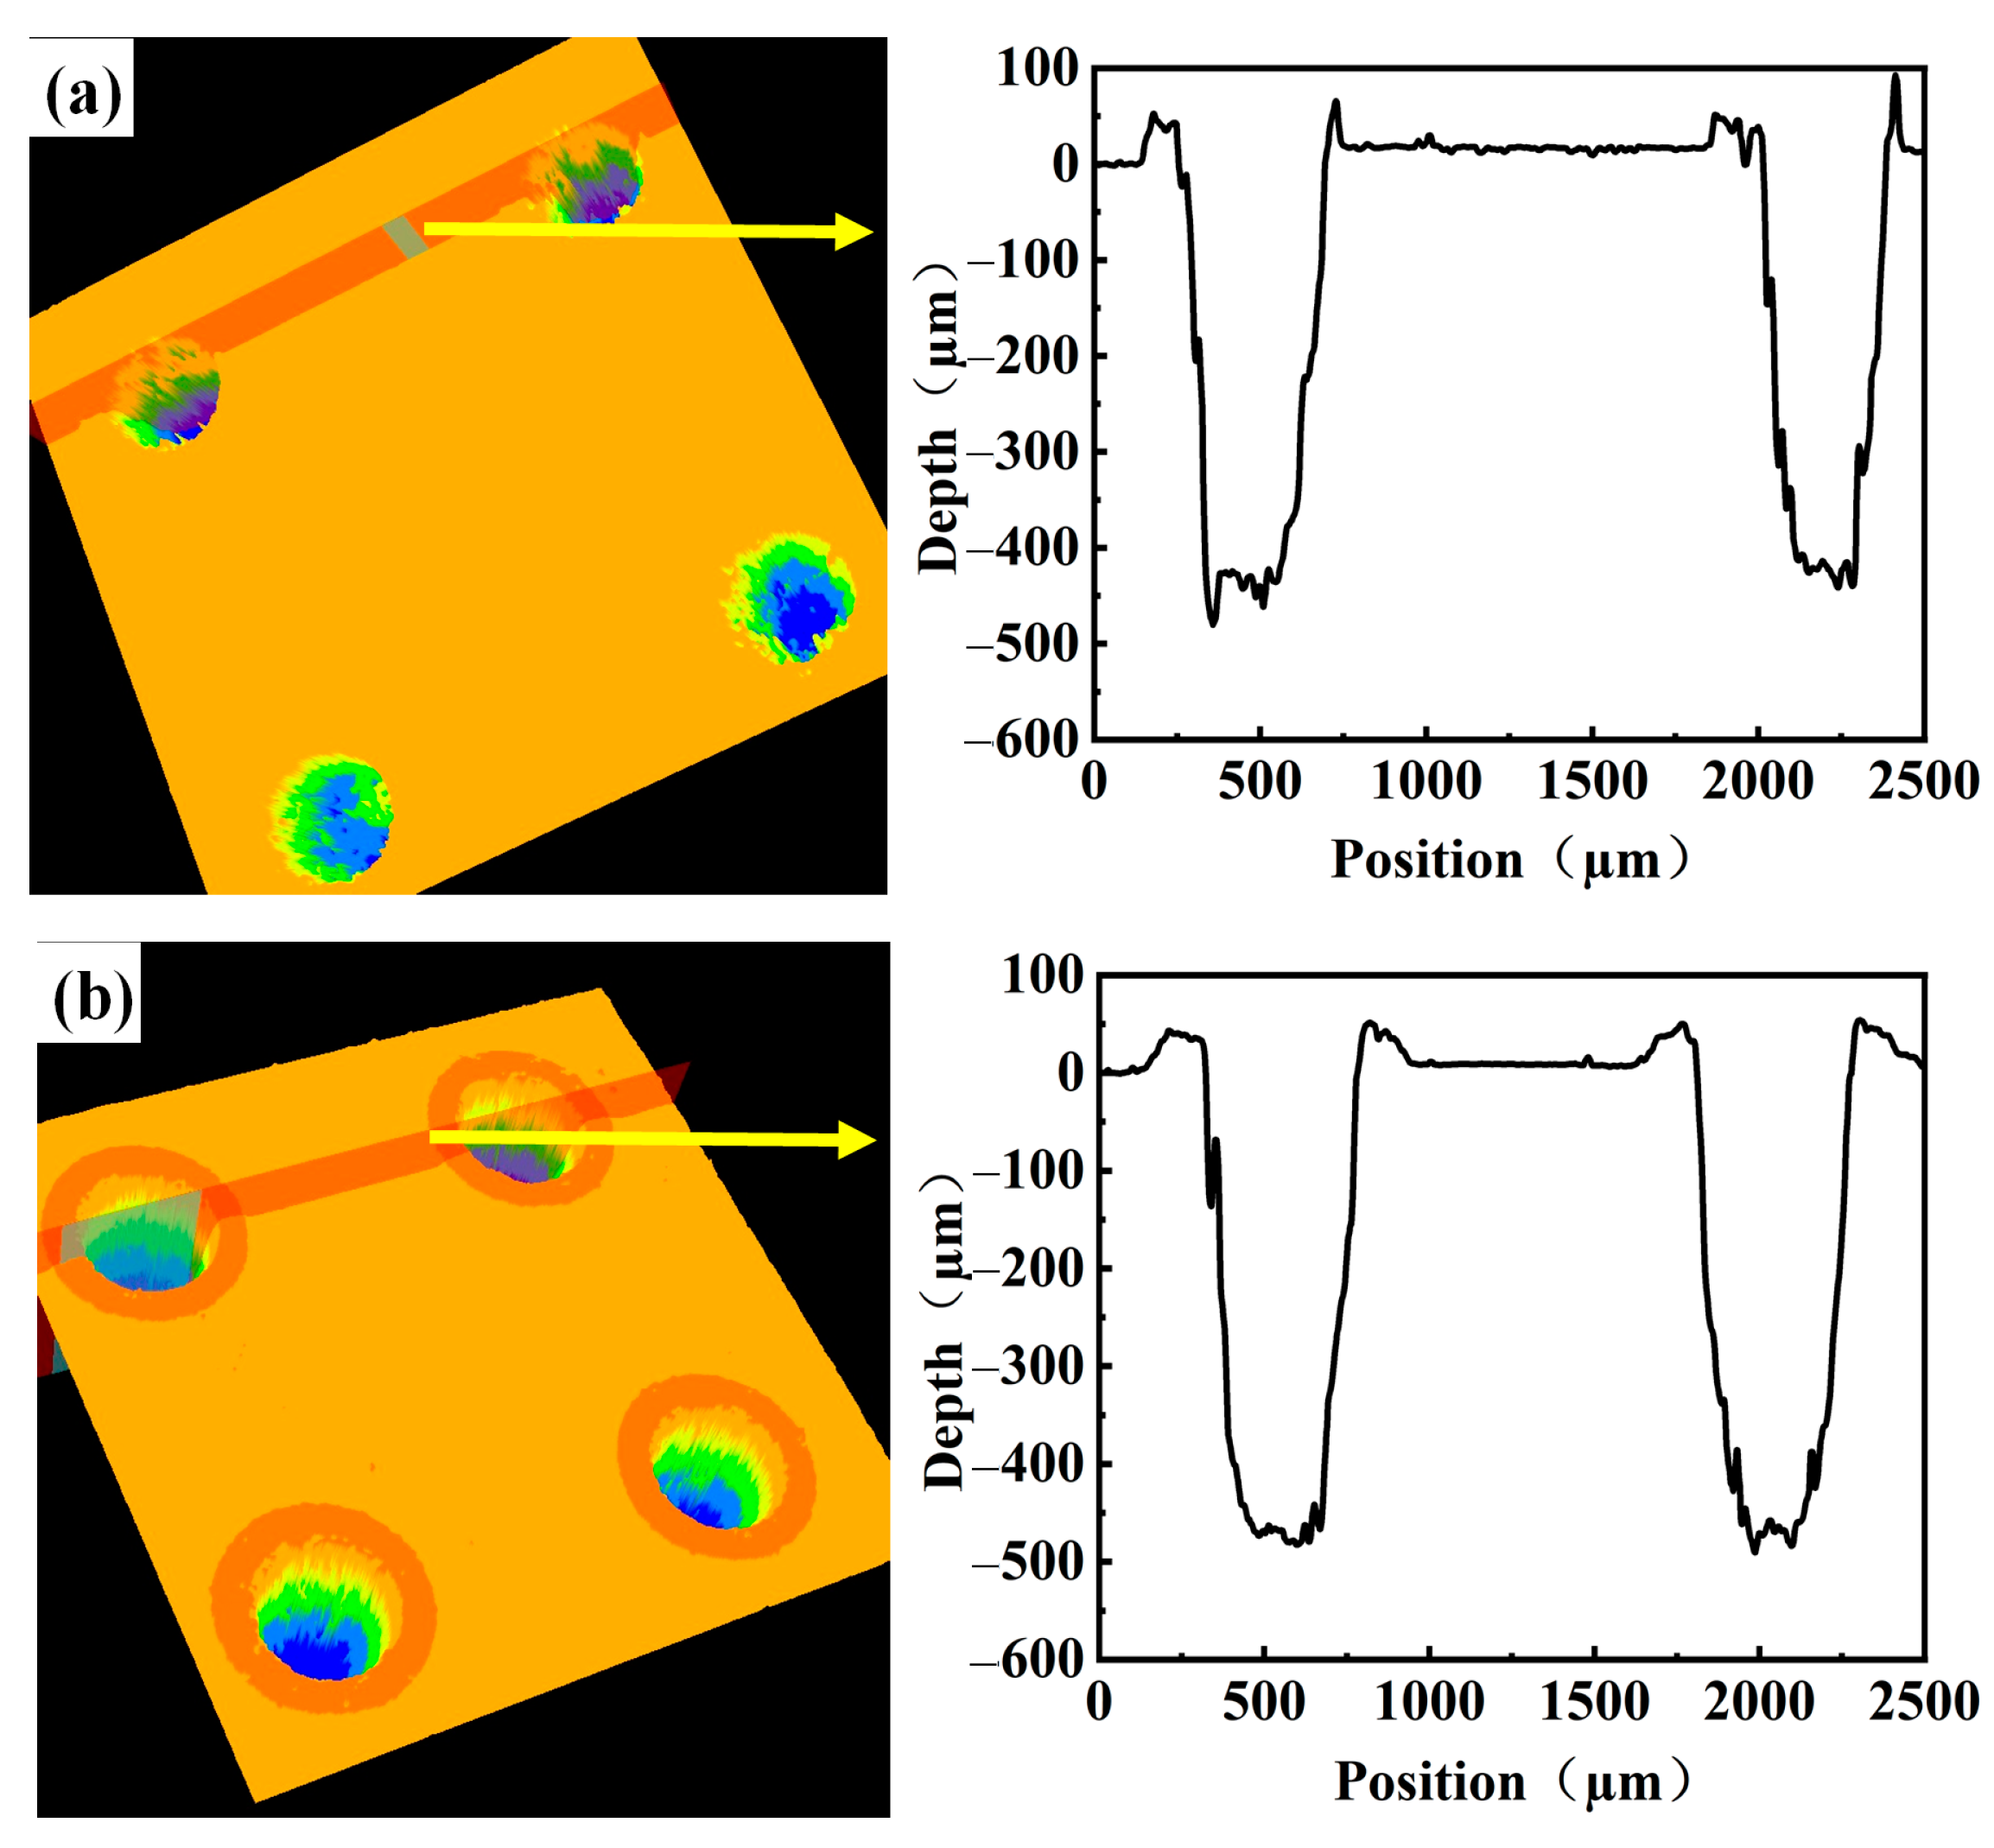
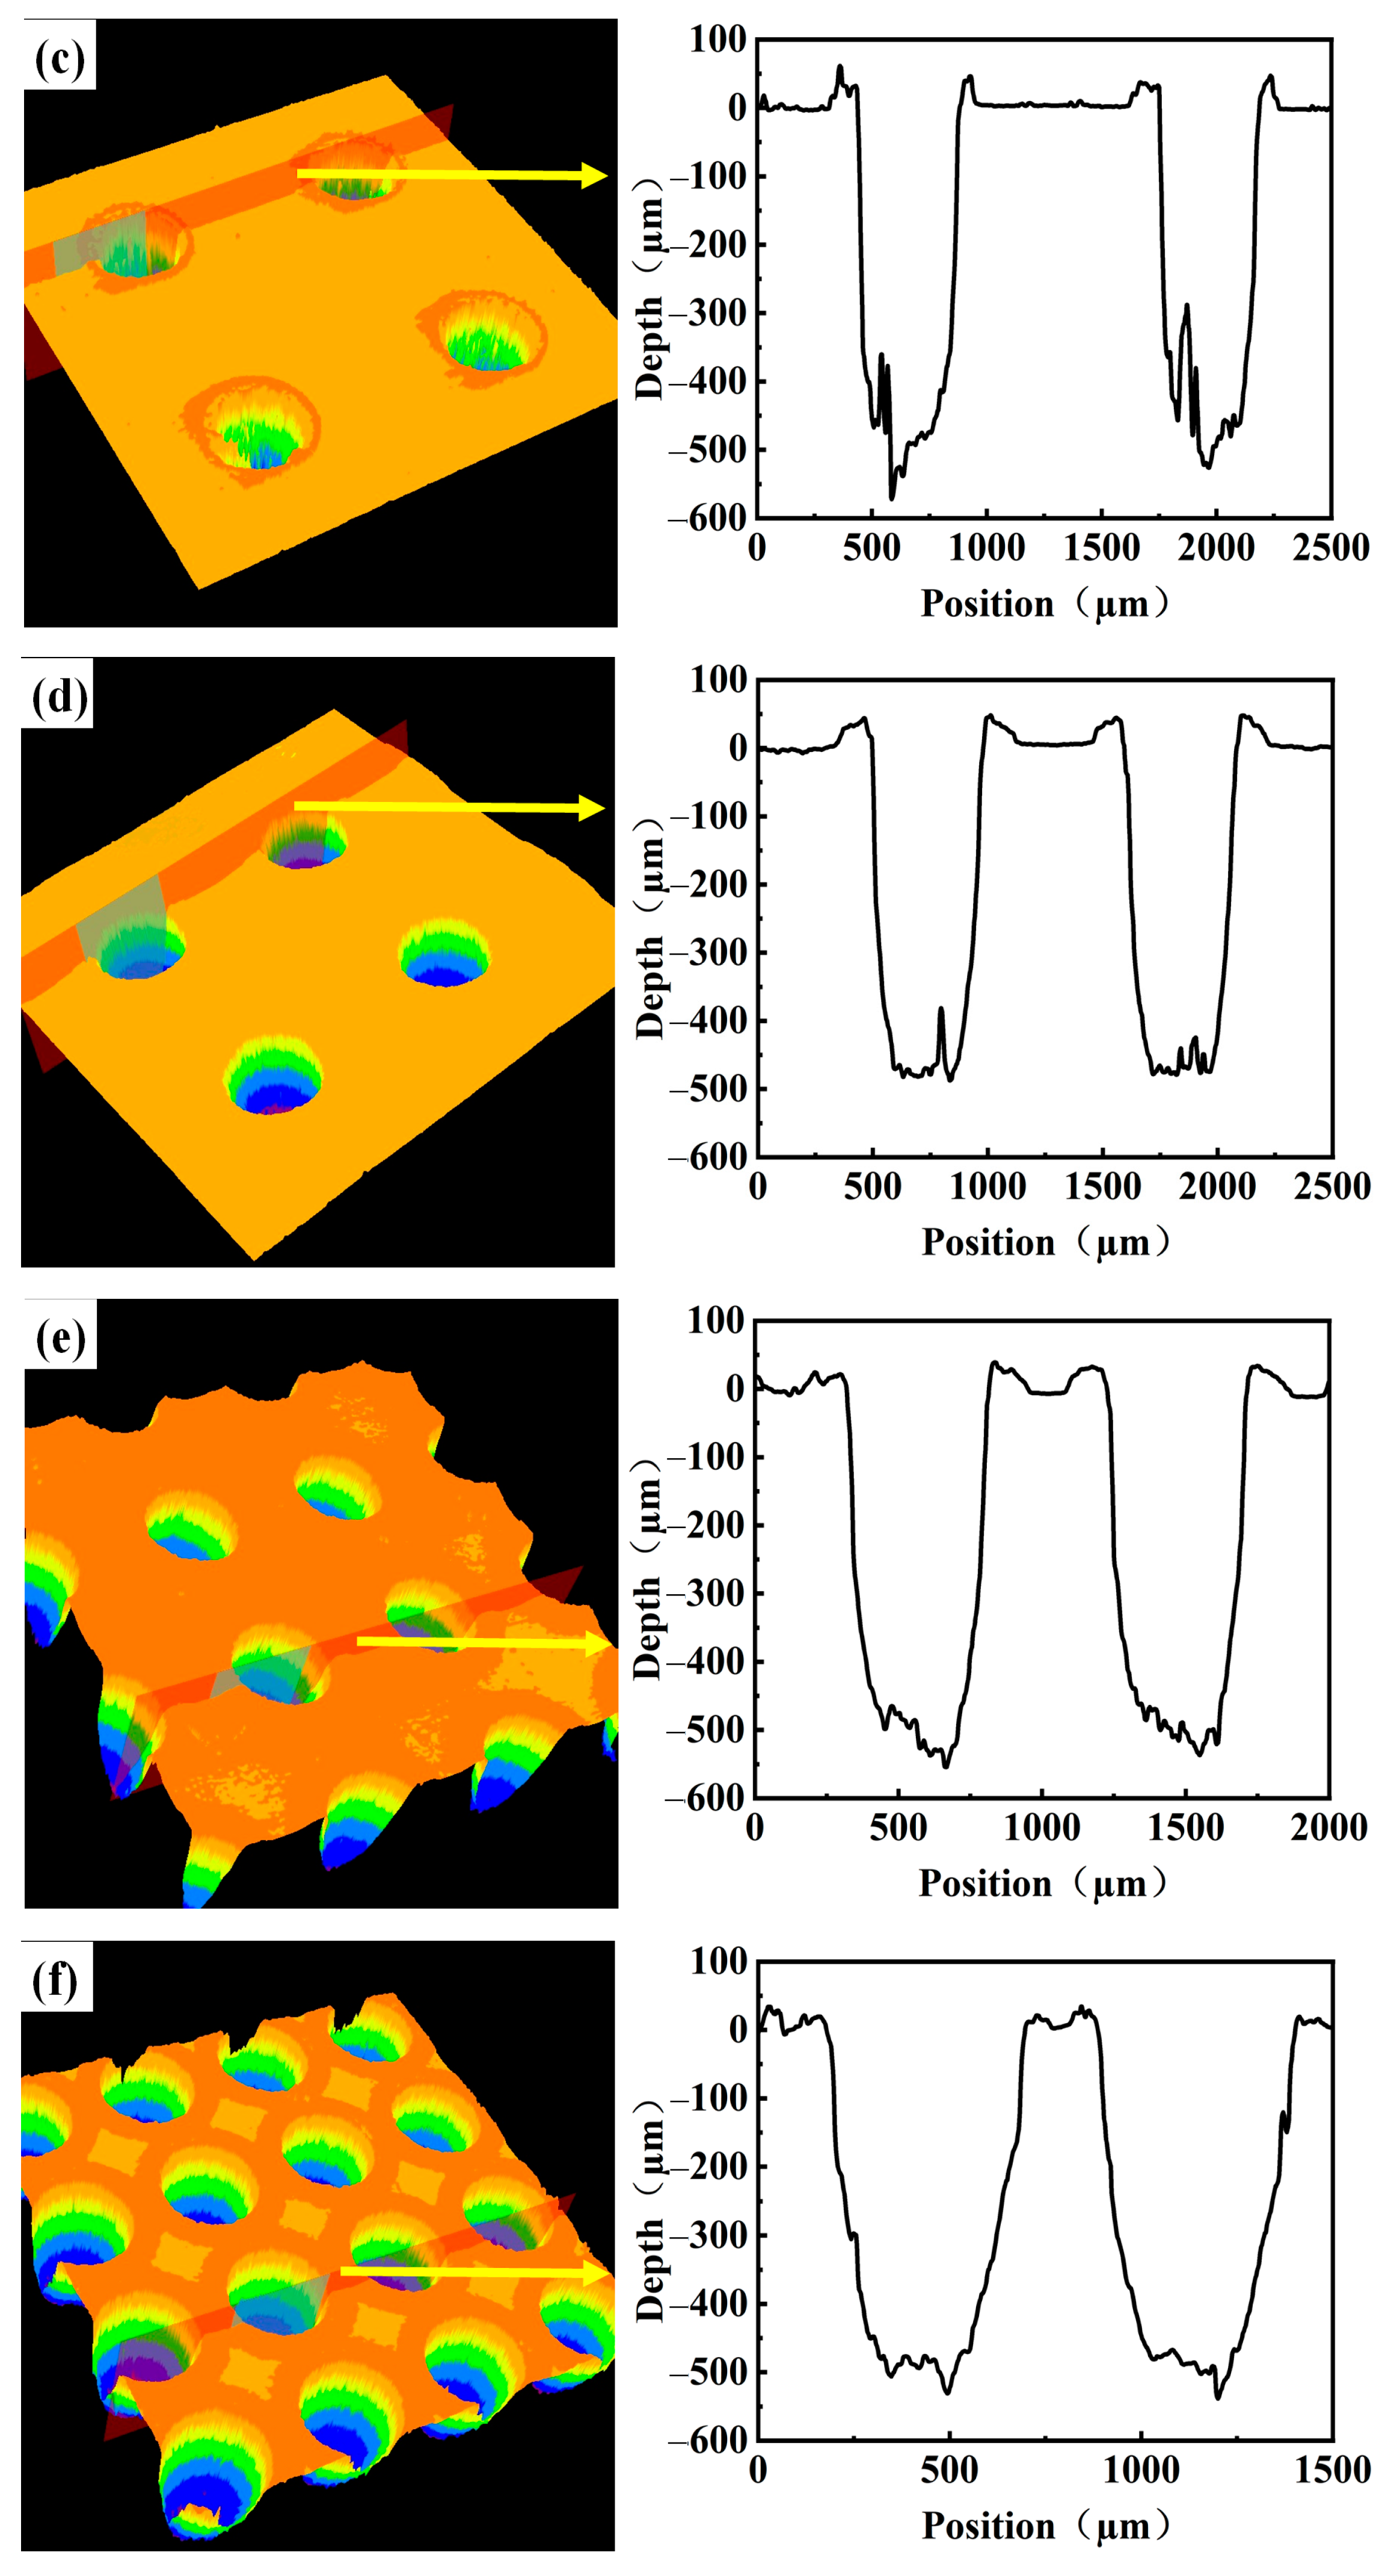
The three-dimensional profile characteristics of circular textures with different surface densities are illustrated in Figure 3. The three-dimensional morphologies from Figure 3a–f further reveal no obvious accumulation of molten slag or heat-affected zones on the surface due to the advantage of low thermal damage in picosecond laser machining. The cross-sectional profile images from Figure 3a–f display that all the depths are at approximately 500 μm, which is highly consistent with the designed value. However, a certain taper can be observed on the side walls, which is a typical phenomenon caused by the energy gradient distribution during laser machining.
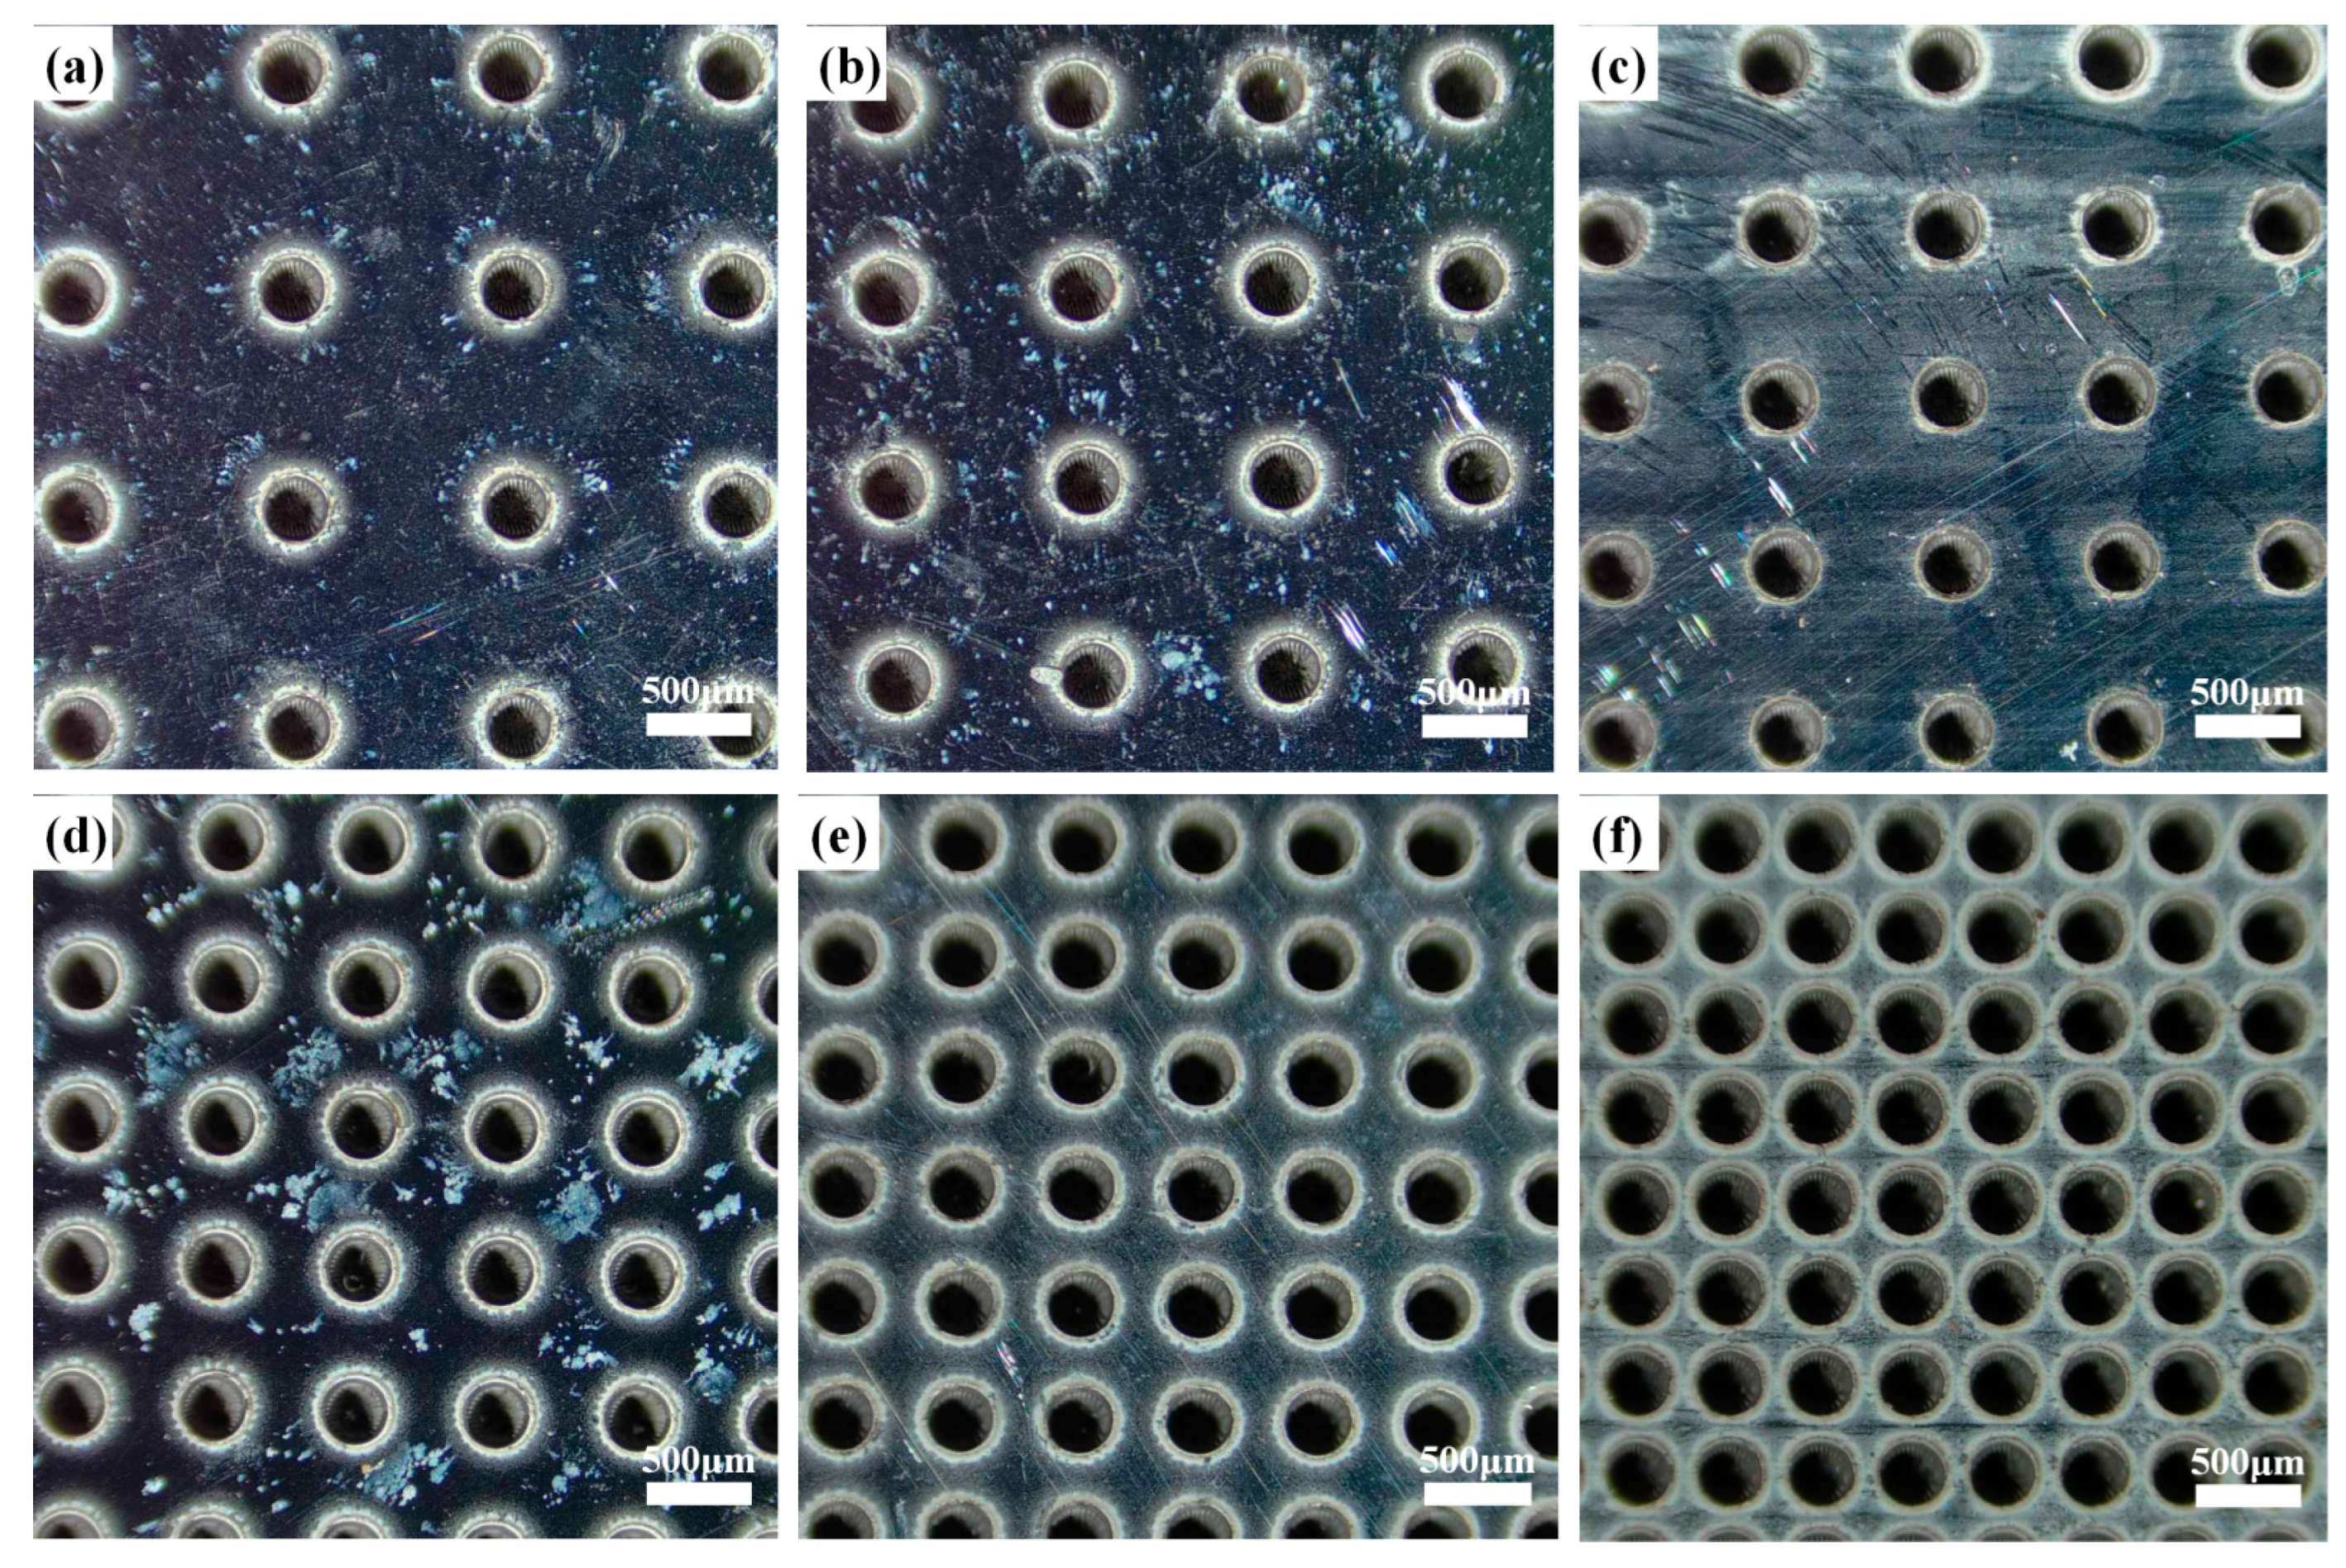
Figure 4 shows the surface morphologies of circular textures with different diameters. In order to carry more paraffin for superior cooling and lubricating effect, the texture depth was uniformly increased to 1000 μm. It is clear that the geometric features and uniformity of circular textures at different diameters are regular.
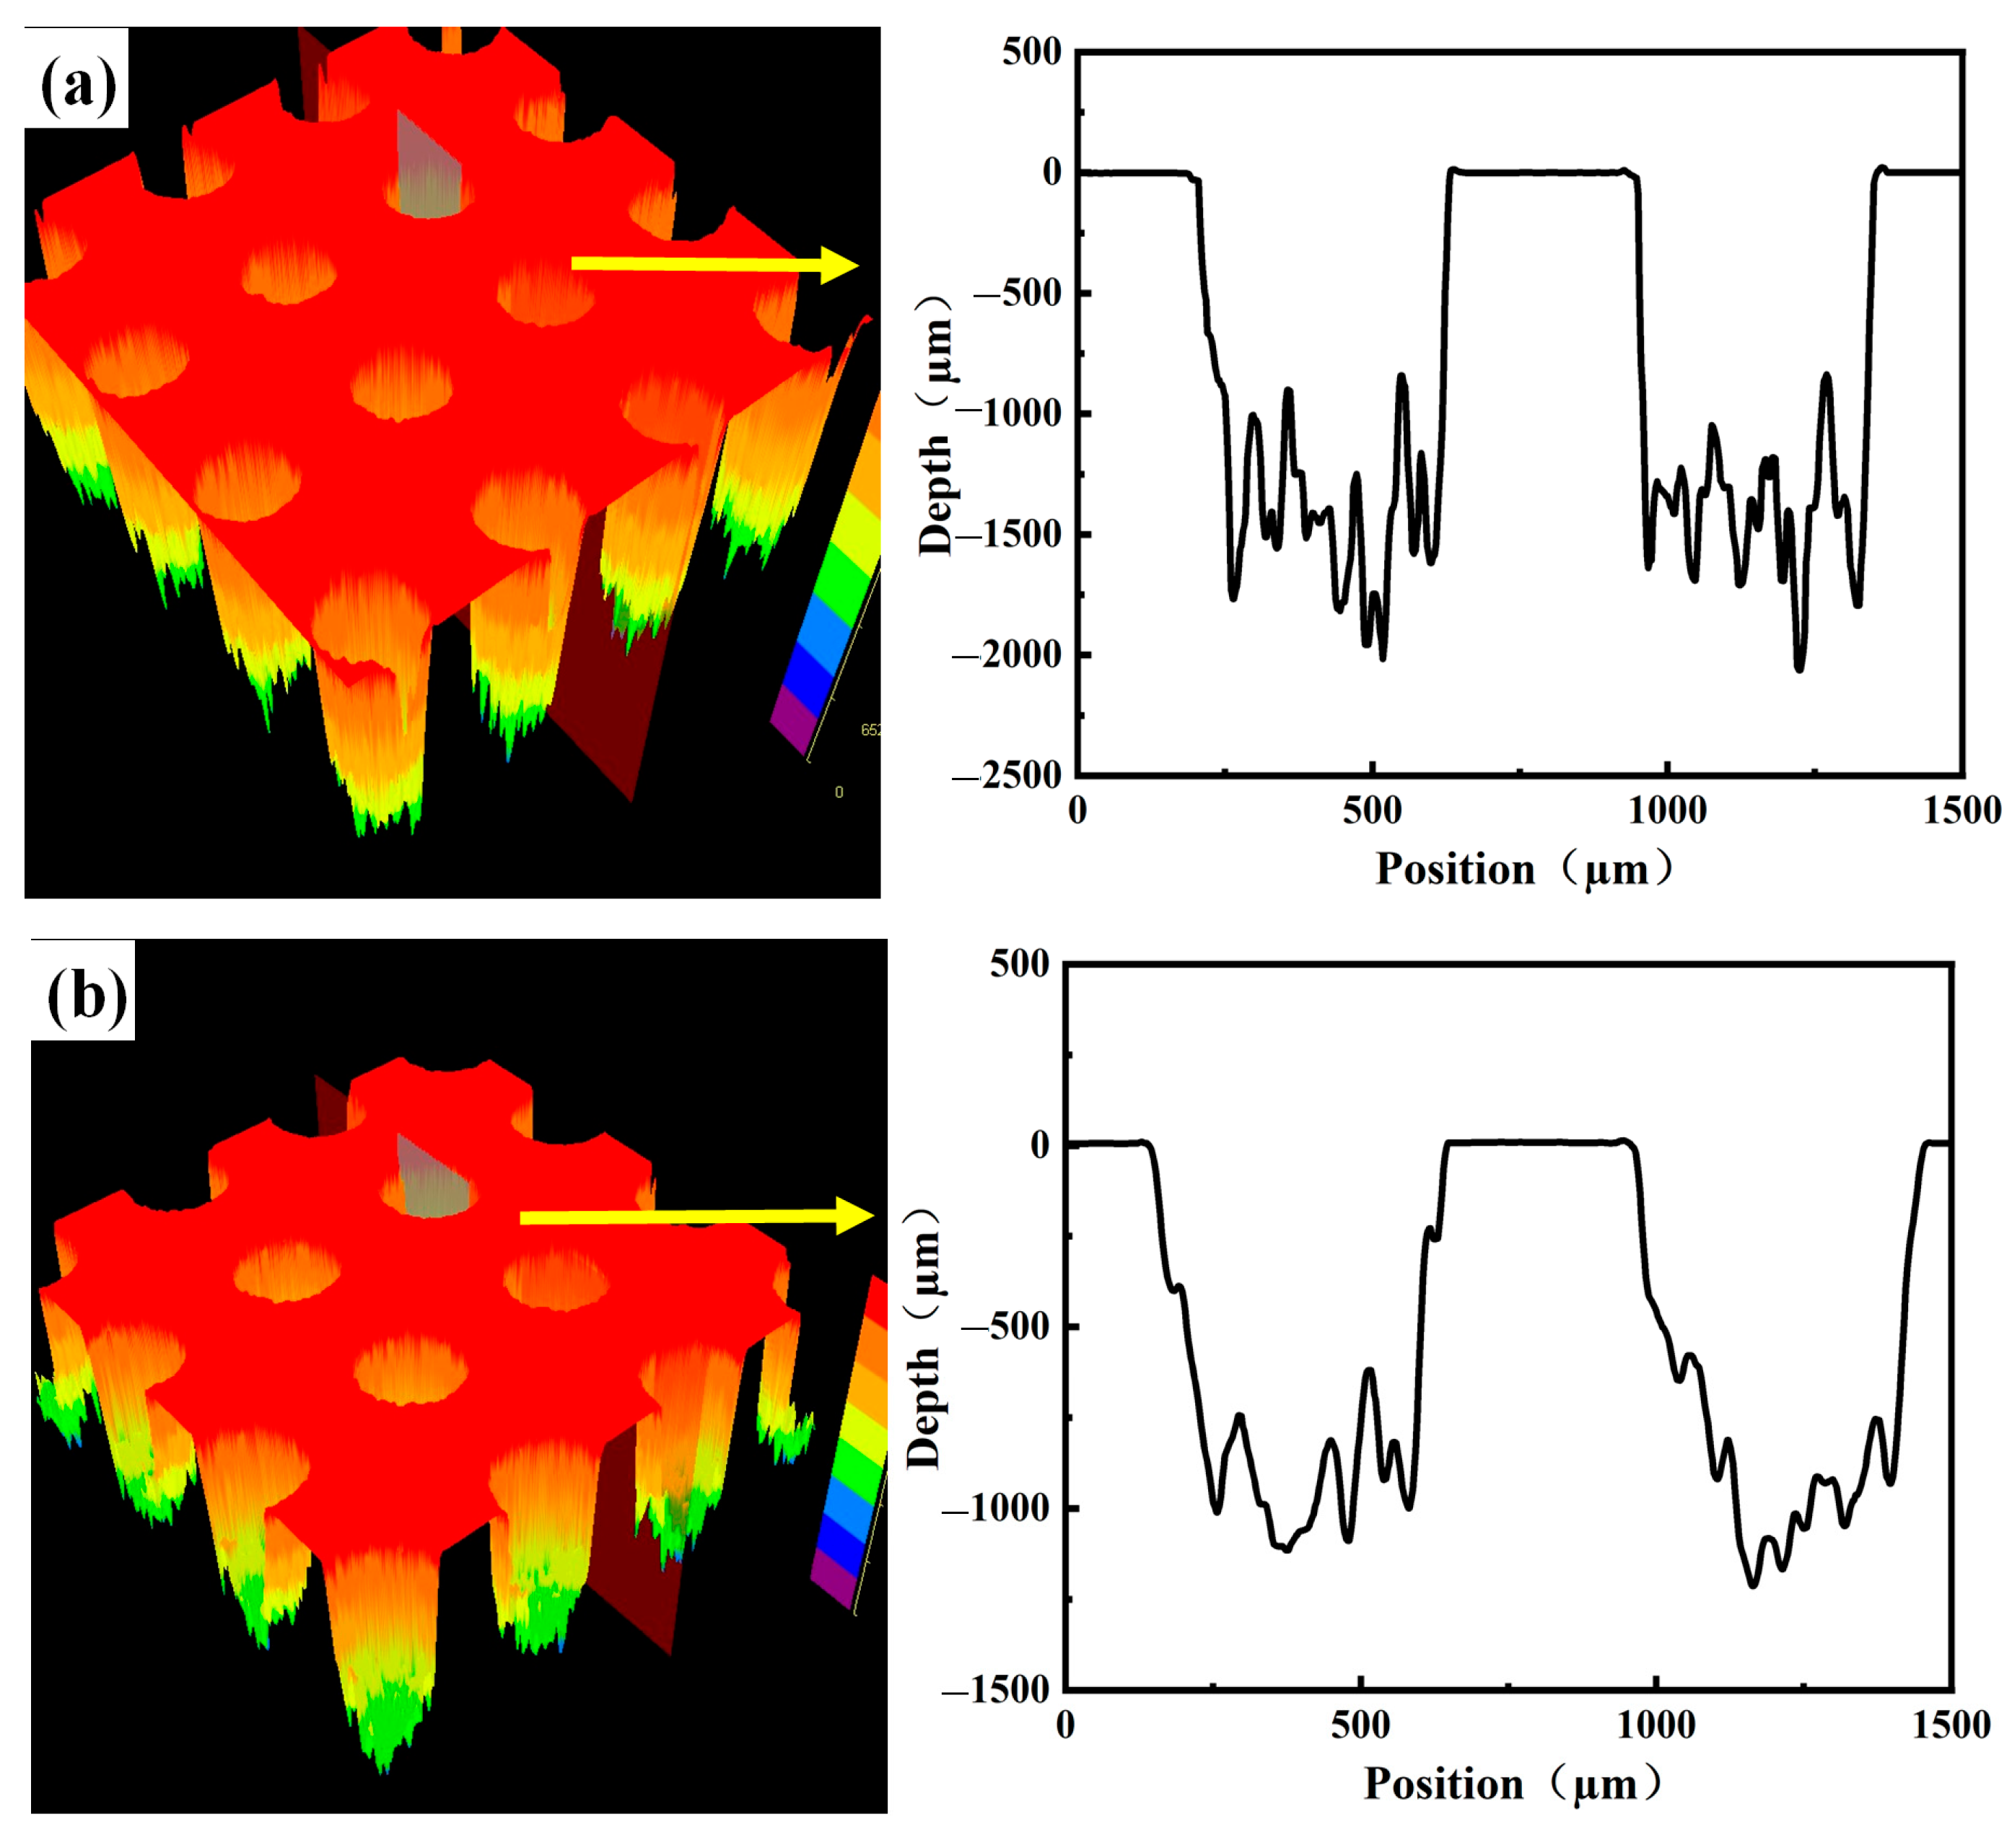
Figure 5 shows the three-dimensional profile characteristics of circular textures with different diameters. However, due to the increased depth from 500 μm to 1000 μm, the taper effect in Figure 5a–f is more significant compared with that in Figure 5a–f, which is related to the energy attenuation and the variation in material removal efficiency during laser deep-hole machining.
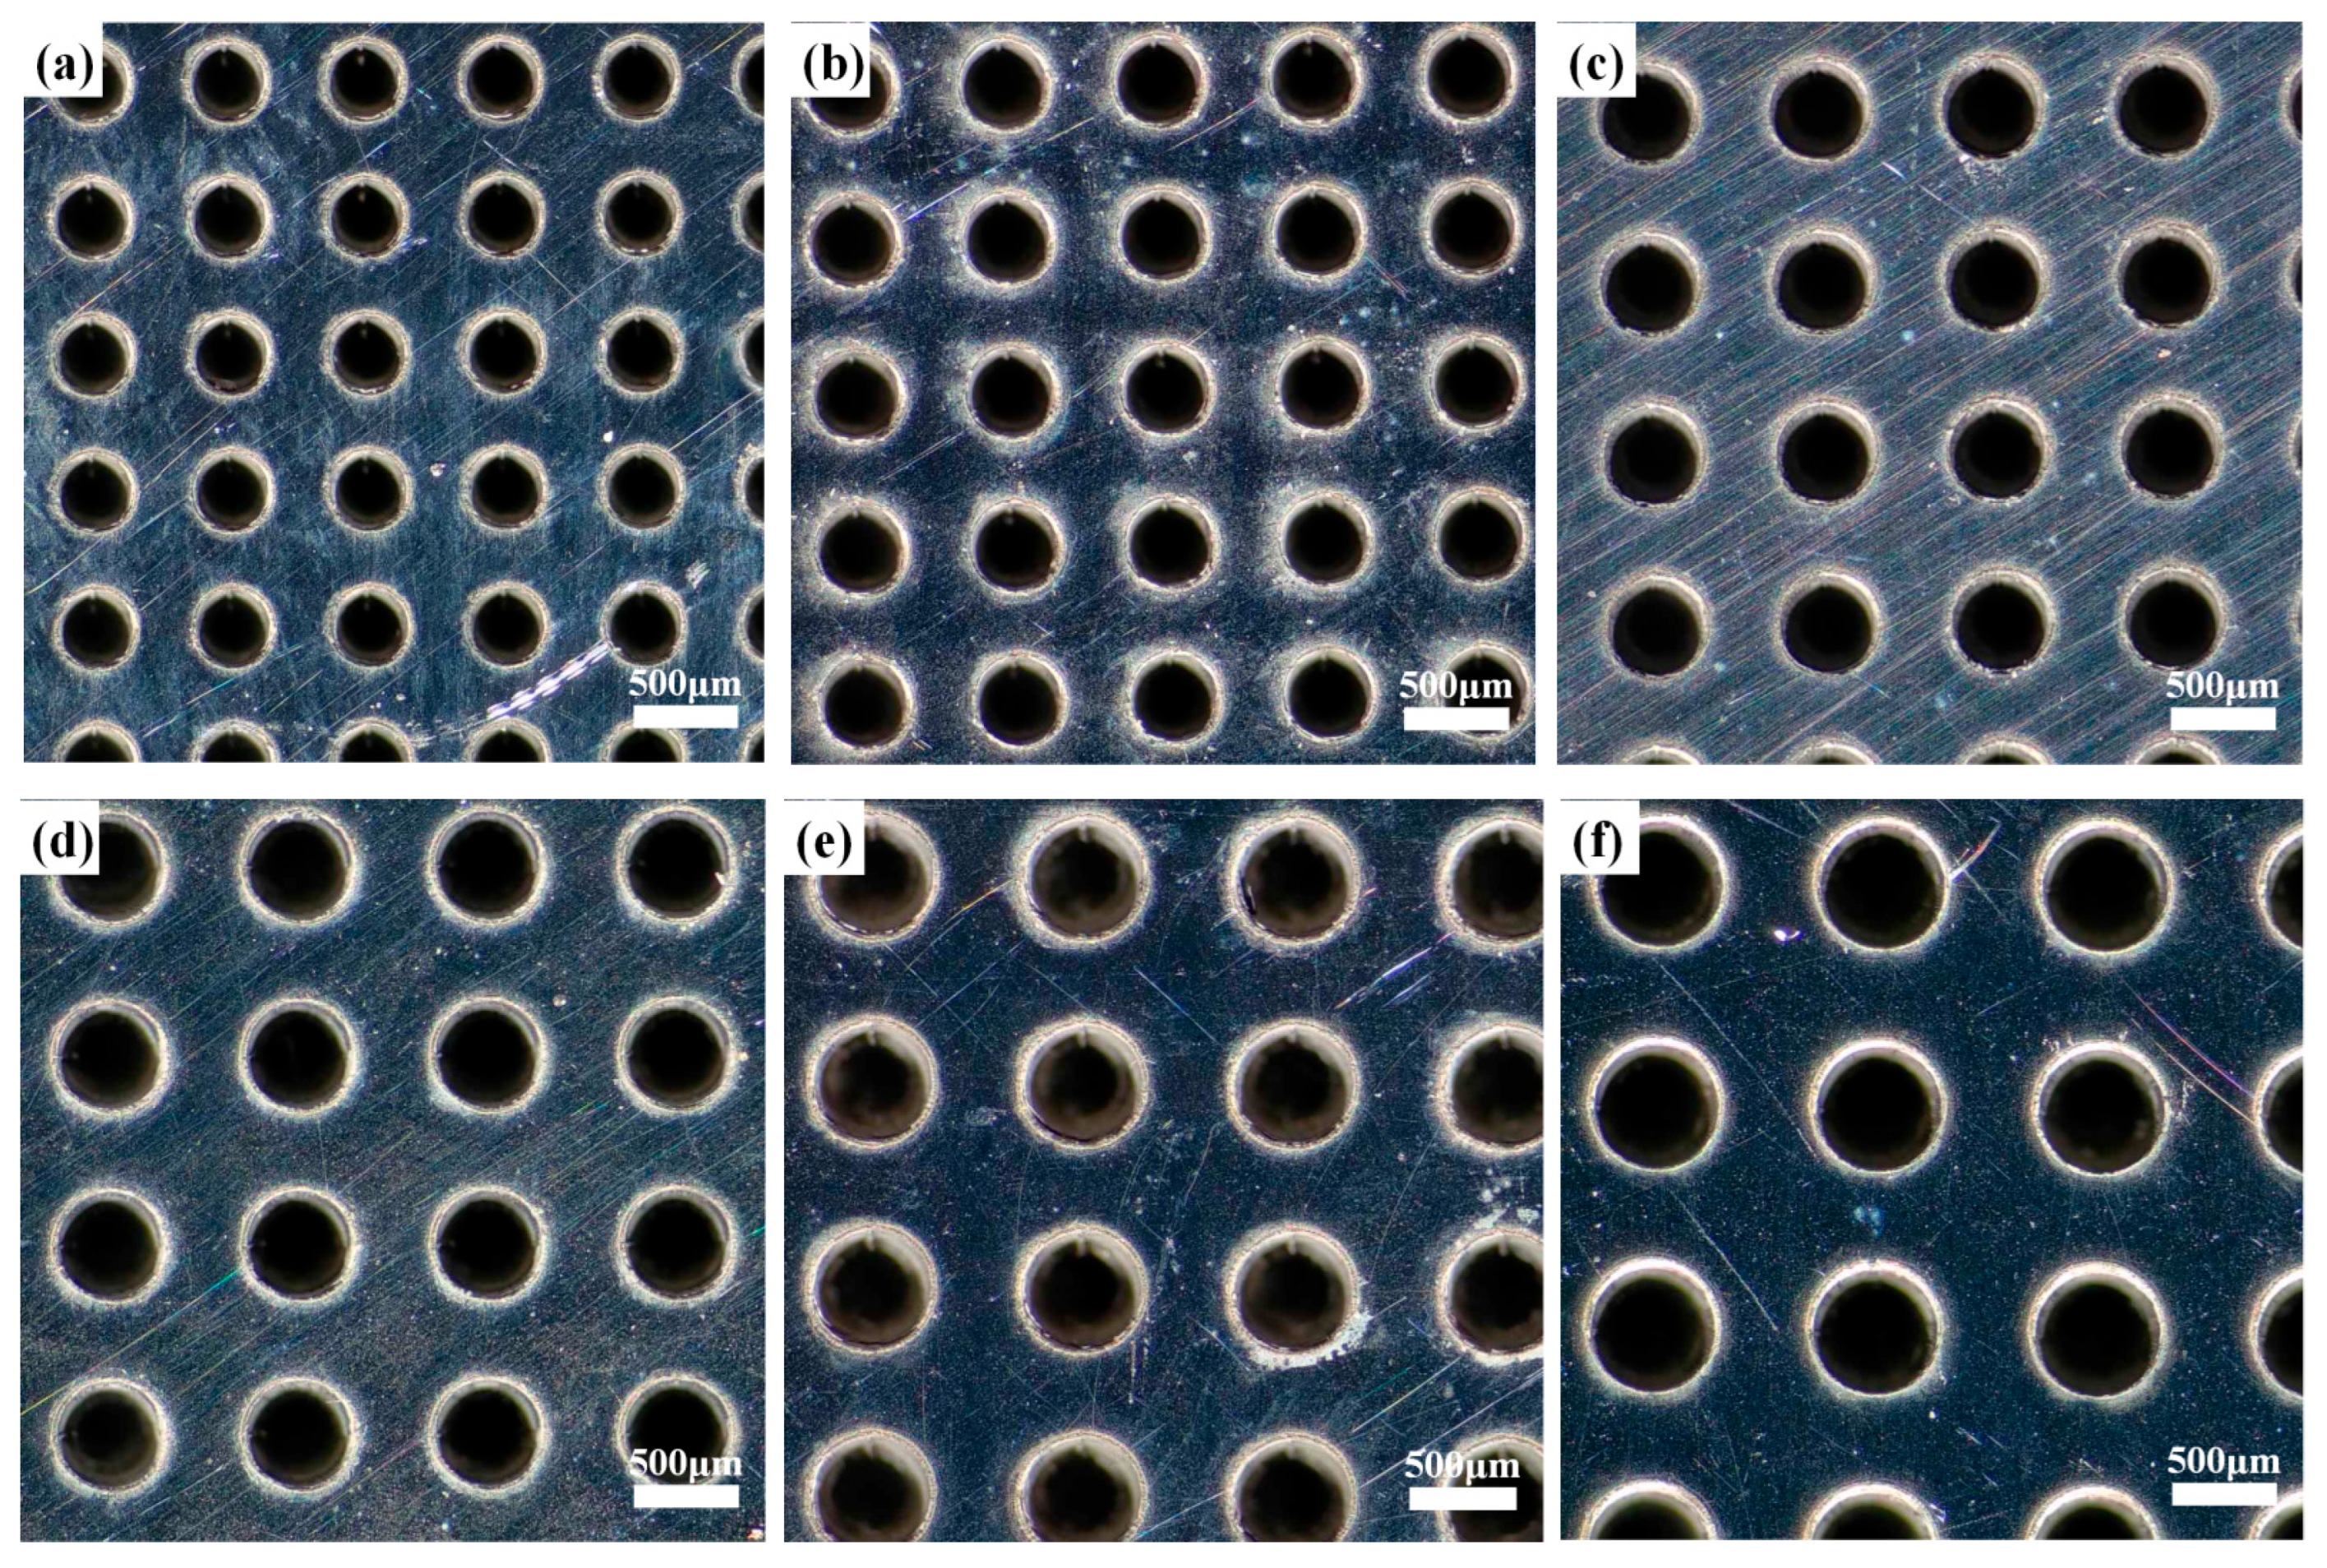
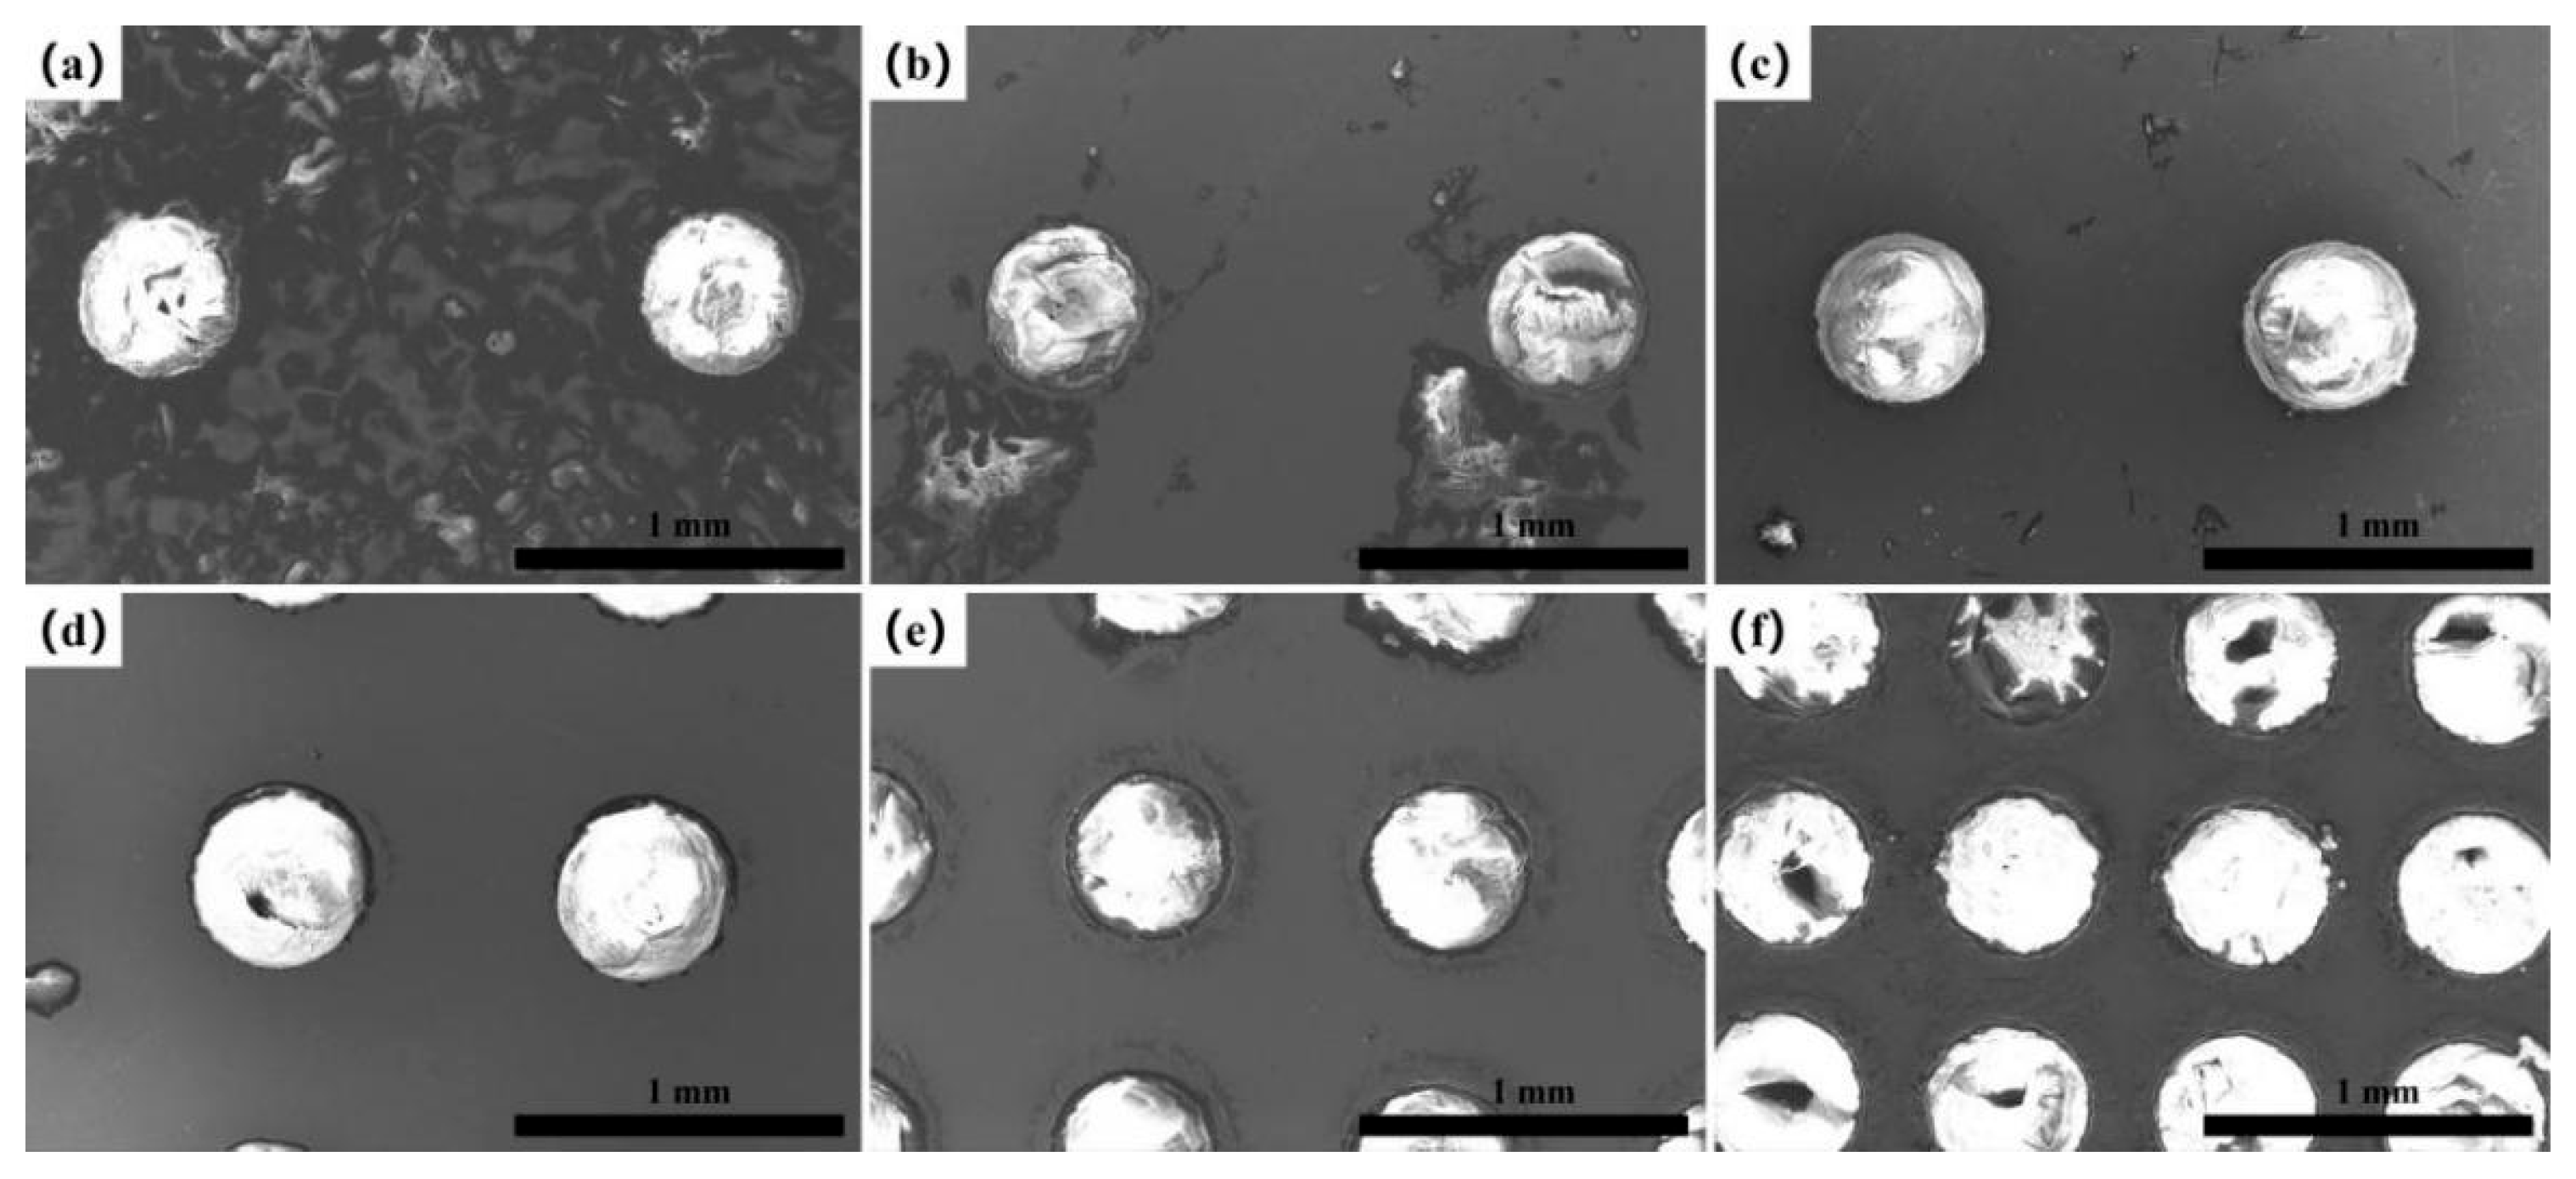
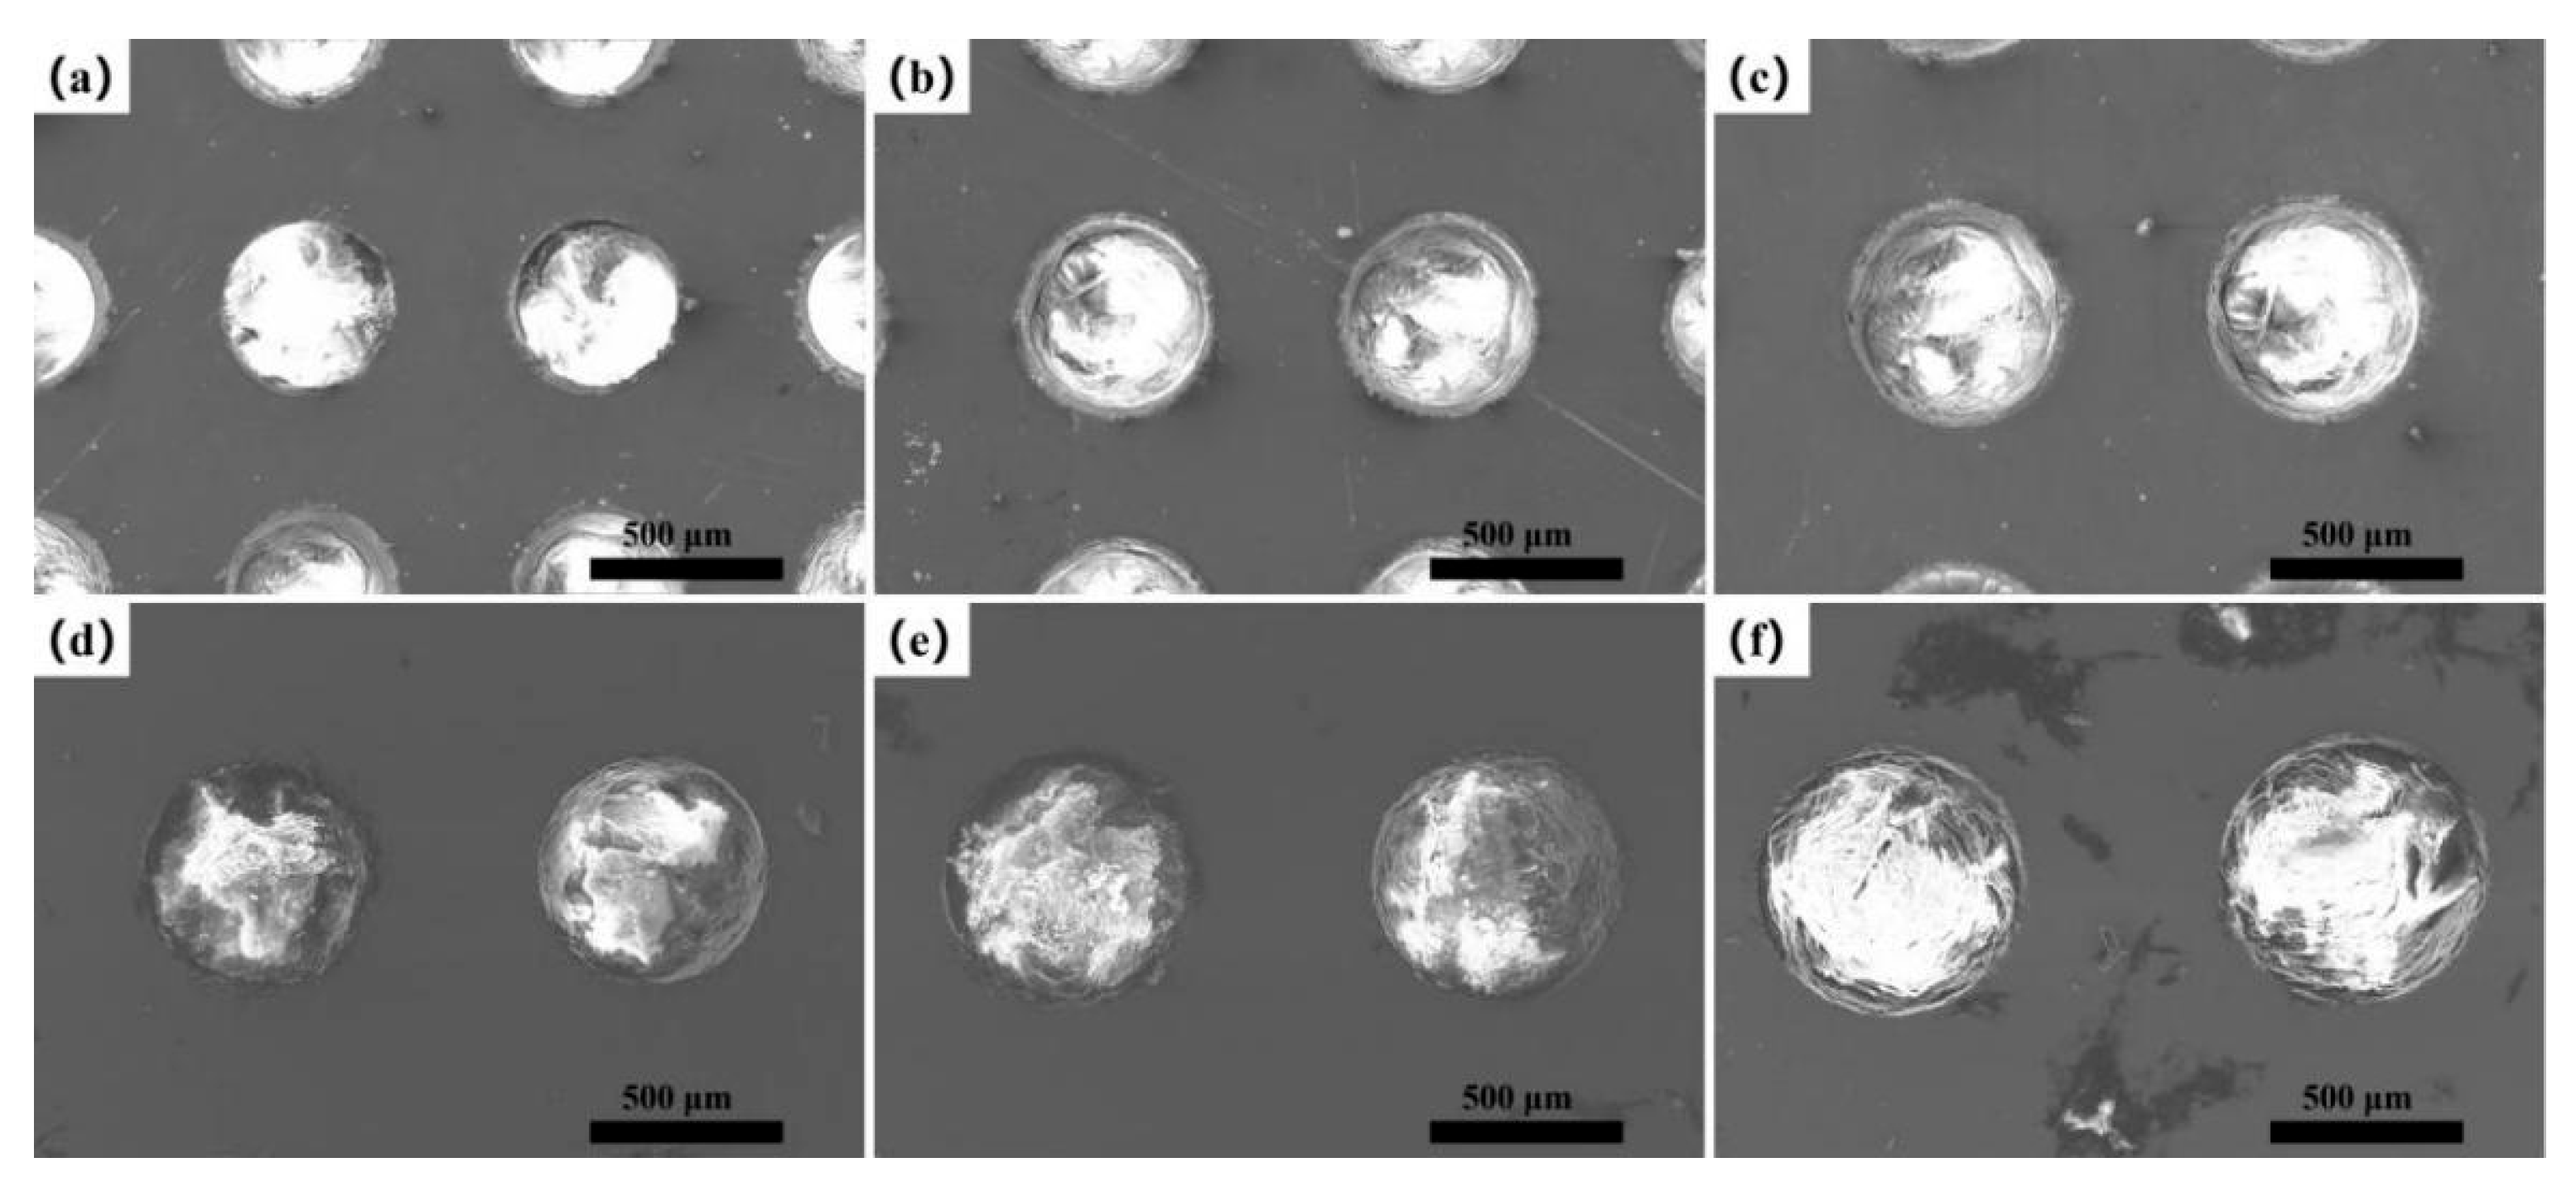
After paraffin filling, the surface morphologies of circular textures with different surface densities and diameters are illustrated in Figure 6 and Figure 7. It can be clearly observed that the molten paraffin is completely filled into circular textures and forms a smooth surface. It is worth noting that the untextured surface remains clean, which indicates almost no residual paraffin left after subsequent polishing. To confirm the filling condition of paraffin, the calculation method was used. Here, D4 is taken as an example. Based on the diameter of the disk sample (30 mm), as well as the surface density (24.2%) and the depth of circular texture (1000 μm), the theoretical volume is calculated, which is 171.06 mm3. However, the actual shape of the circular texture approximates a cone shape rather than a cylinder, based on the cross-sectional area of the circular texture shown in Figure 5d. Thus, the actual volume should be one-third of the theoretical volume of 171.06 mm3, which is 57.02 mm3. According to the density of RT35HC, the paraffin mass filled in circular textures should be 50.18 mg, while the actual weighing result is 48.30 mg. By comparison, the relative error between the calculated and measured mass is as low as 3.75%. This small difference proves that the inner space of the texture is almost fully filled with paraffin.

3.2. Temperatures of the Composite Surfaces with Different Surface Densities

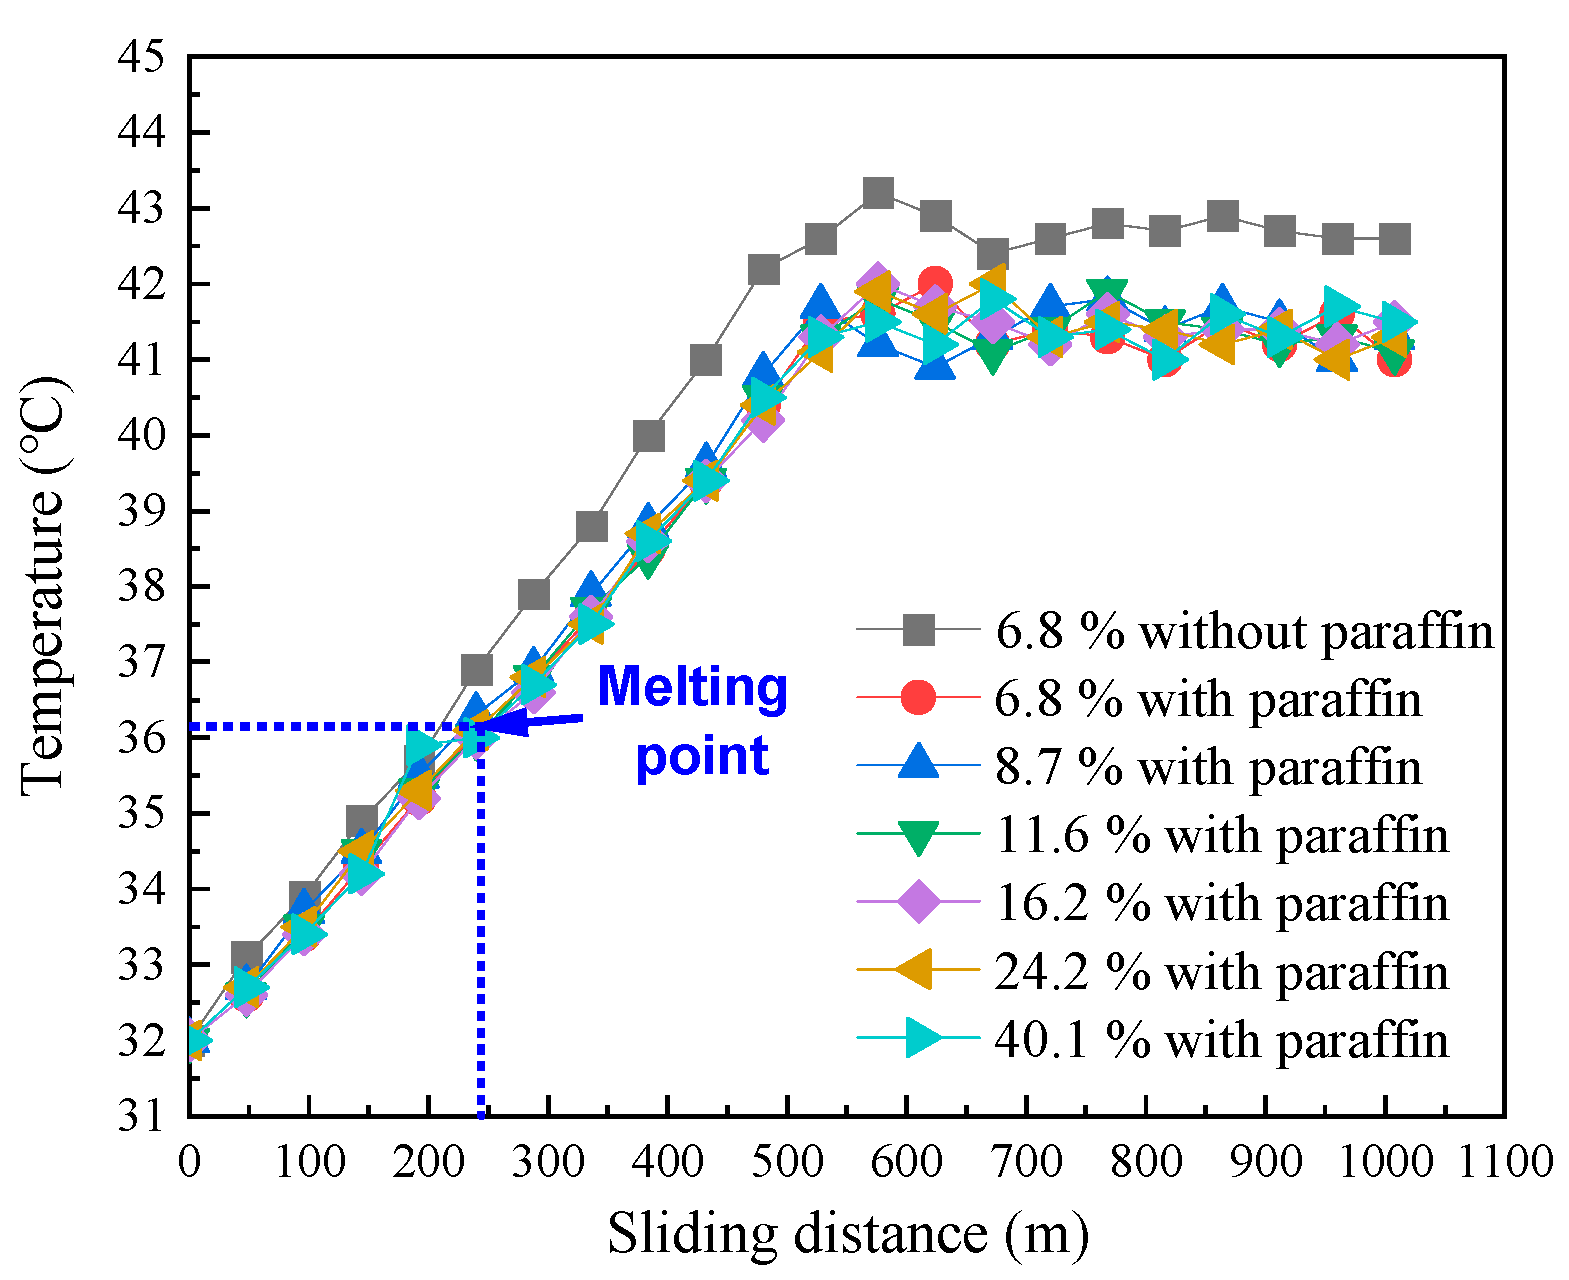
Figure 8 shows the variation in surface temperature as a function of sliding distance for textured surfaces with different surface densities. For comparison, the temperature of the textured surface at a surface density of 6.8% without paraffin is illustrated. It is clear that the textured surface without paraffin exhibits the highest temperature, around 43 °C. By contrast, the temperatures of the textured surface with paraffin are around 41.5 °C. On the other hand, during the first sliding distance of 240 m, the variation curves of temperature for all samples are almost overlapped. However, at the sliding distance of 240 m, the variation curves of temperature between the samples without and with paraffin are separated. The reason for this separation is that the temperature at the friction interface reaches the melting point of paraffin around 36.09 °C. At this temperature, the phase change in paraffin occurs, which can absorb some of the friction heat. As a consequence, the temperature rising rate is different from that of samples without paraffin. Thus, an obvious gap between the temperature curves of samples with and without paraffin can be clearly observed. After the sliding distance of 240 m, the temperature at the friction interface is still increasing with sliding distance since the heat generated is greater than the heat consumption. The balance of heat generation and heat consumption is reached at a sliding distance of around 550 m. In order to reveal the influence of surface density on the cooling effect, the average temperature during the sliding distance from 550 m to 1000 m is used as an indicator. By calculating the temperatures during the steady stage, the average temperatures of S1 to S6 samples are 41.31 ± 0.29 °C, 41.36 ± 0.30 °C, 41.33 ± 0.25 °C, 41.36 ± 0.23 °C, 41.34 ± 0.31 °C, and 41.24 ± 0.23 °C, respectively, all of which are lower than the corresponding value of 42.68 ± 0.21 °C for the textured surfaces without paraffin. Moreover, the temperatures keep decreasing with increasing surface density, but the decrease is only 0.12 °C, which is tiny.

3.3. Tribological Properties of the Composite Surface with Different Surface Densities

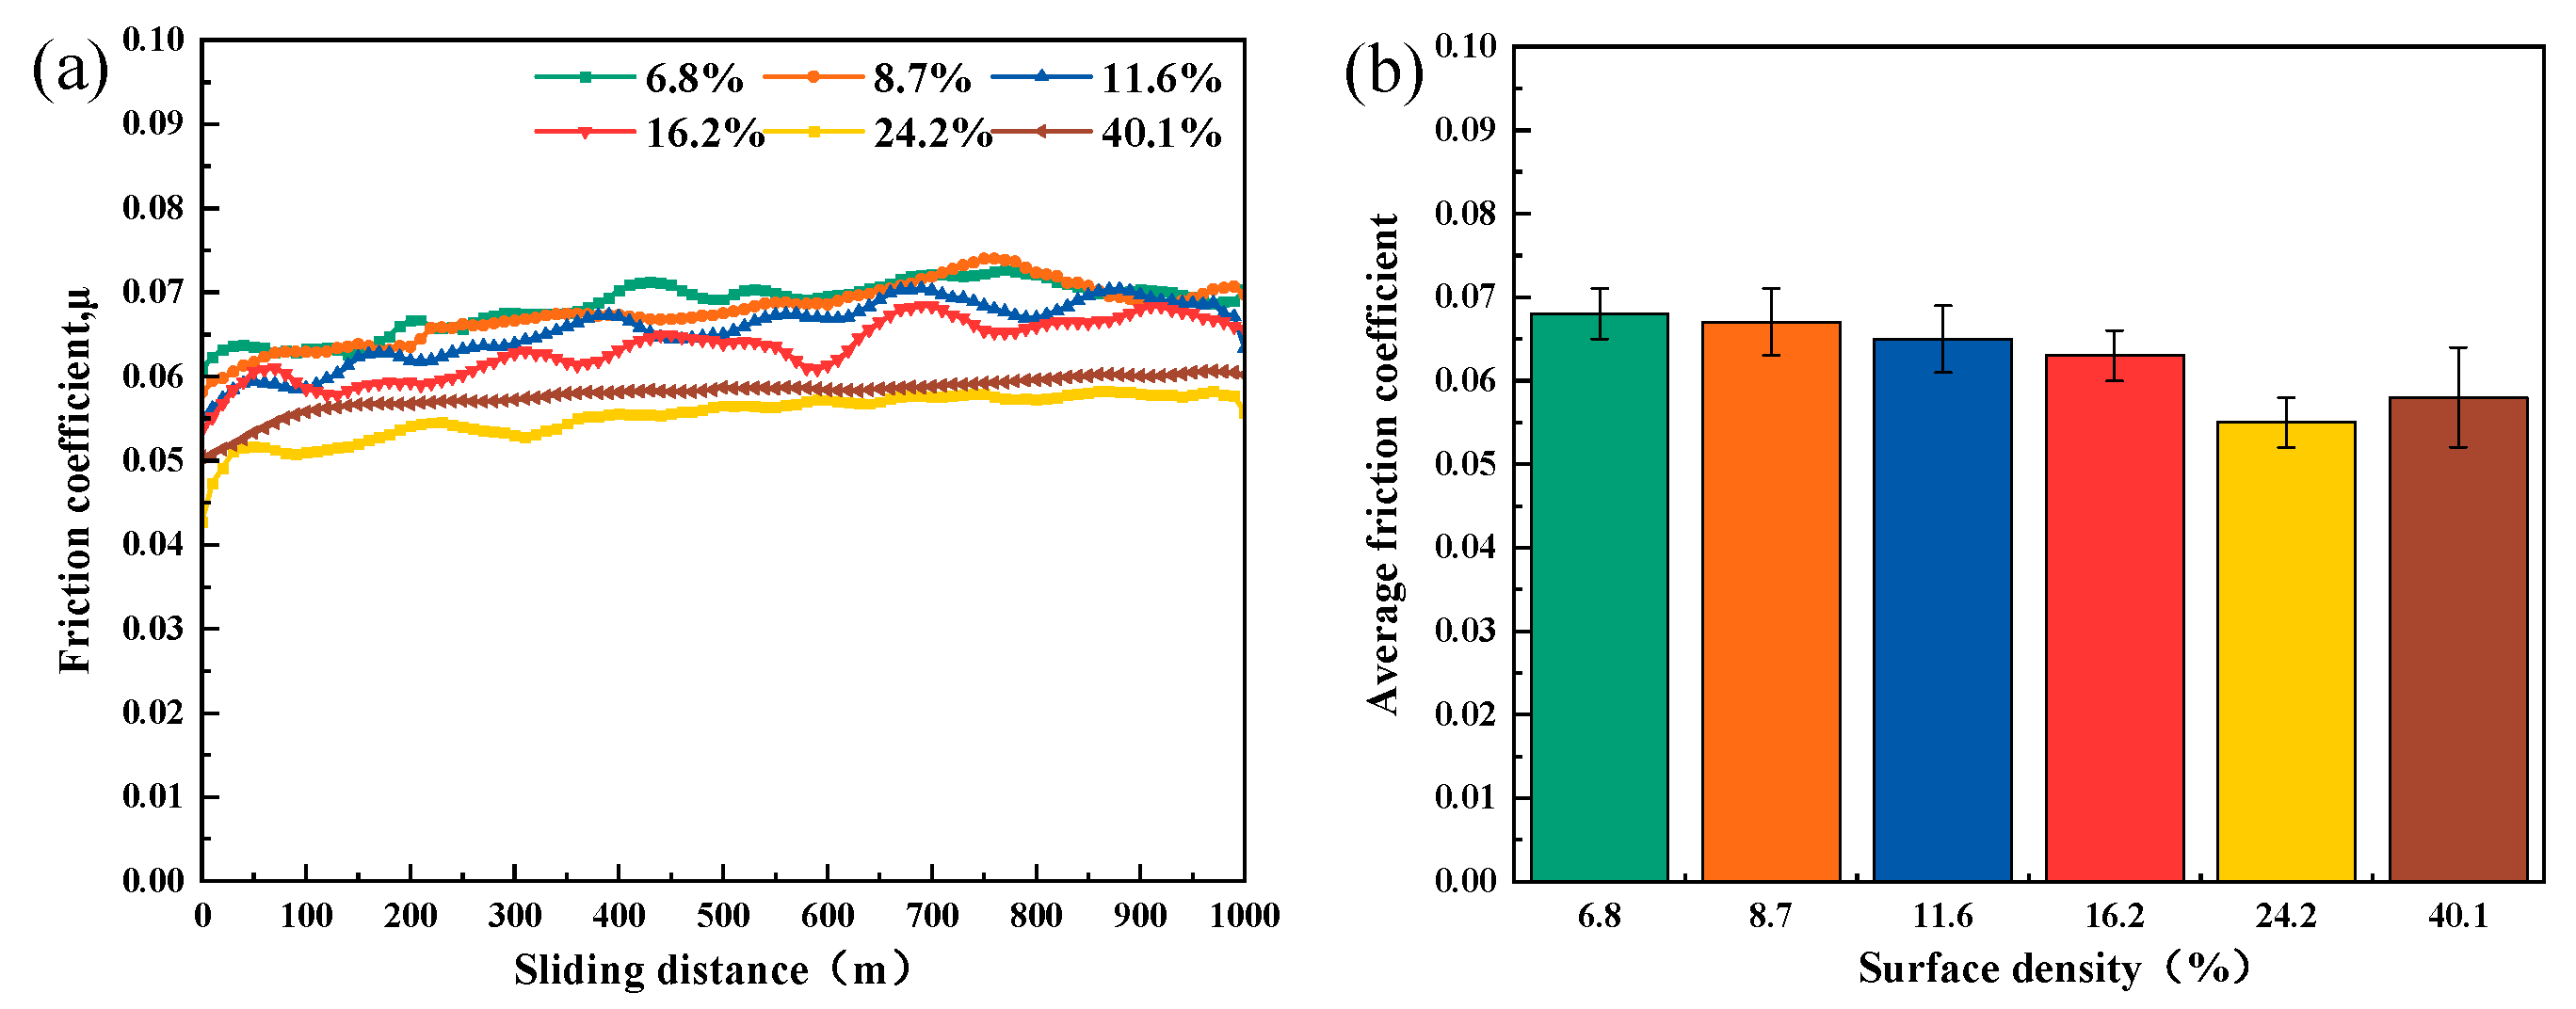
Figure 9a presents the variation in the friction coefficient as a function of sliding distance for the composite surfaces with different surface densities. It can be observed that all composite surfaces exhibit outstanding tribological properties. Their friction coefficients remain at a low level of 0.043–0.075 throughout the entire sliding distance of 1000 m, and the curves show slight fluctuation, indicating favorable lubrication stability. The S1 sample exhibits the longest running-in period, around 380 m. With increasing surface density from 6.8% to 40.1%, the running-in period is gradually shortened to 100 m. After the running-in period, all samples enter the steady wear stage. By averaging the friction coefficient during the steady wear stage, the average friction coefficient is obtained, as illustrated in Figure 9b. When the surface density increases gradually from 6.8% to 24.2%, the average friction coefficient of S1 decreases significantly from 0.068 to the minimum value of 0.055 for S5. When the surface density reaches 40.1%, the average friction coefficient rebounds to 0.058.
This non-monotonic variation law demonstrates that there exists an optimal range of surface density in the design of composite surfaces, which can maximize the lubrication potential of paraffin. Among all samples, the composite surface with a surface density of 24.2% achieves the lowest average friction coefficient of 0.055 ± 0.003.
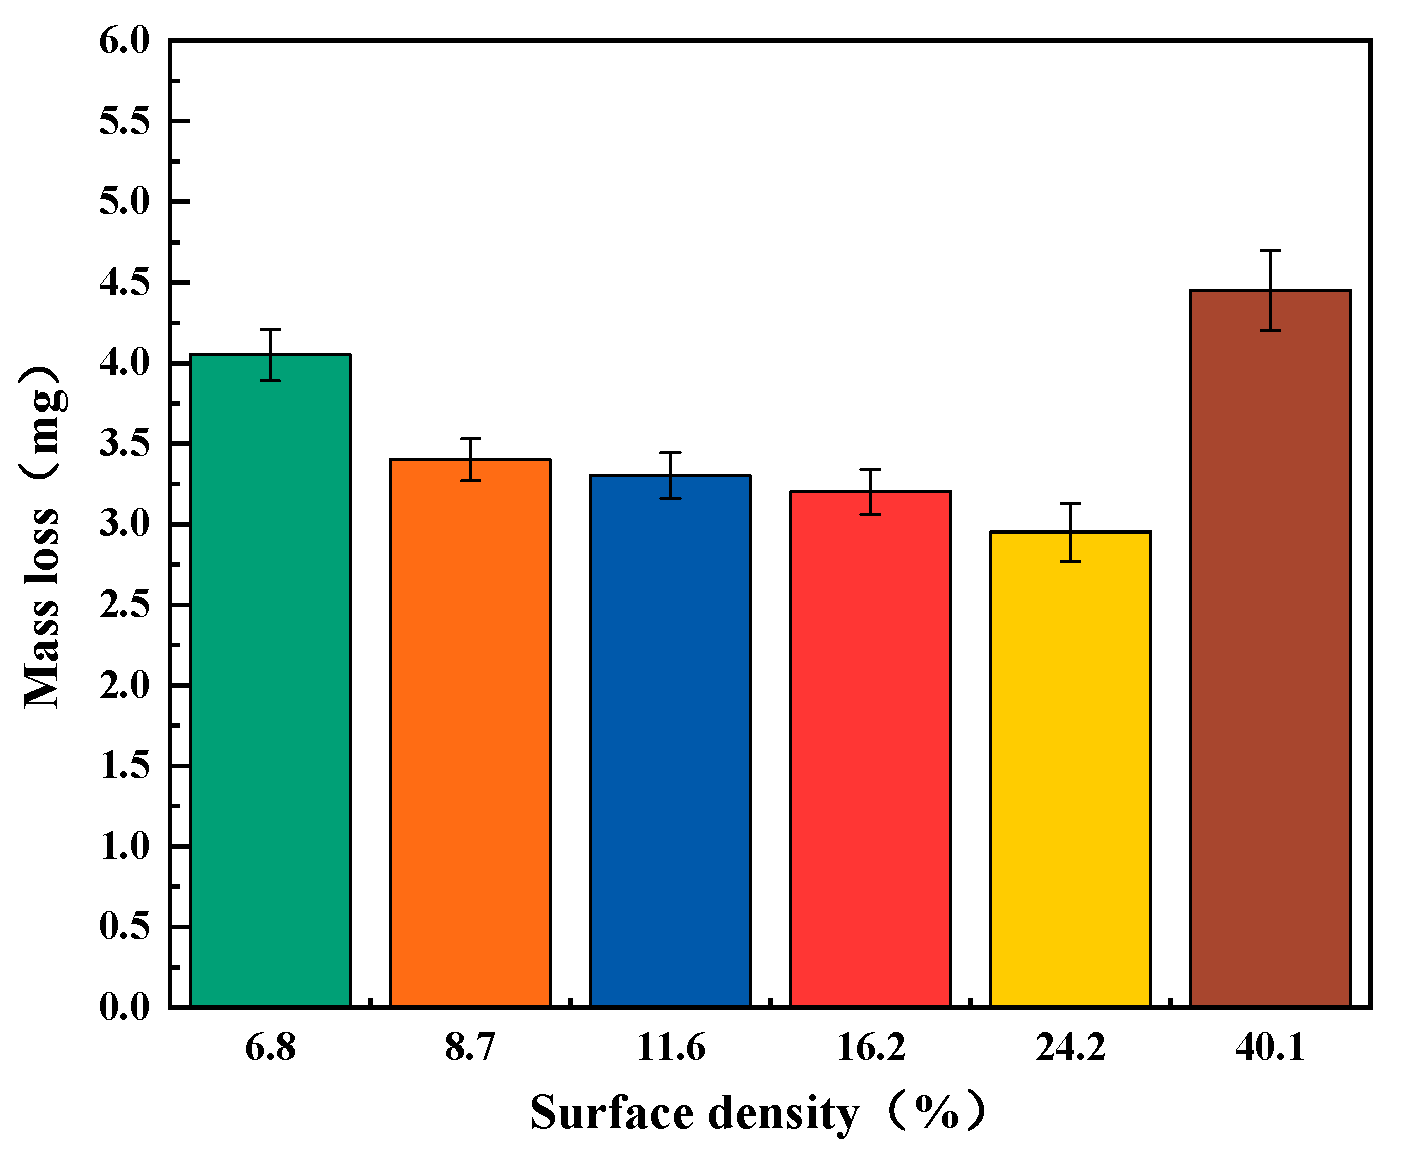
Based on the weight loss method, the wear loss of composite surfaces with different surface densities is illustrated in Figure 10. As the same trend as the friction coefficient shown in Figure 9b, the wear loss presents a non-monotonic trend of first decreasing and then increasing as the surface density increases from 6.8% to 40.1%. To be specific, the wear losses for samples are 4.05 ± 0.16 mg for S1, 3.40 ± 0.13 mg for S2, 3.30 ± 0.14 mg for S3, 3.20 ± 0.14 mg for S4, 2.95 ± 0.18 mg for S5, and 4.45 ± 0.25 mg for S6. By combining the results of the friction coefficient and wear loss, increasing the surface density from 6.8% to 24.2% could effectively improve the tribological performance, accompanied by gradual reductions in the average friction coefficient and wear loss. Notably, the S5 with a surface density of 24.2% exhibits the minimum friction coefficient of 0.055 and the minimum wear loss of 2.95 mg. Thus, the surface density of 24.2% is selected as the optimal parameter for the study on the influence of circular diameter.

3.4. Temperatures of the Composite Surfaces with Different Circular Diameters

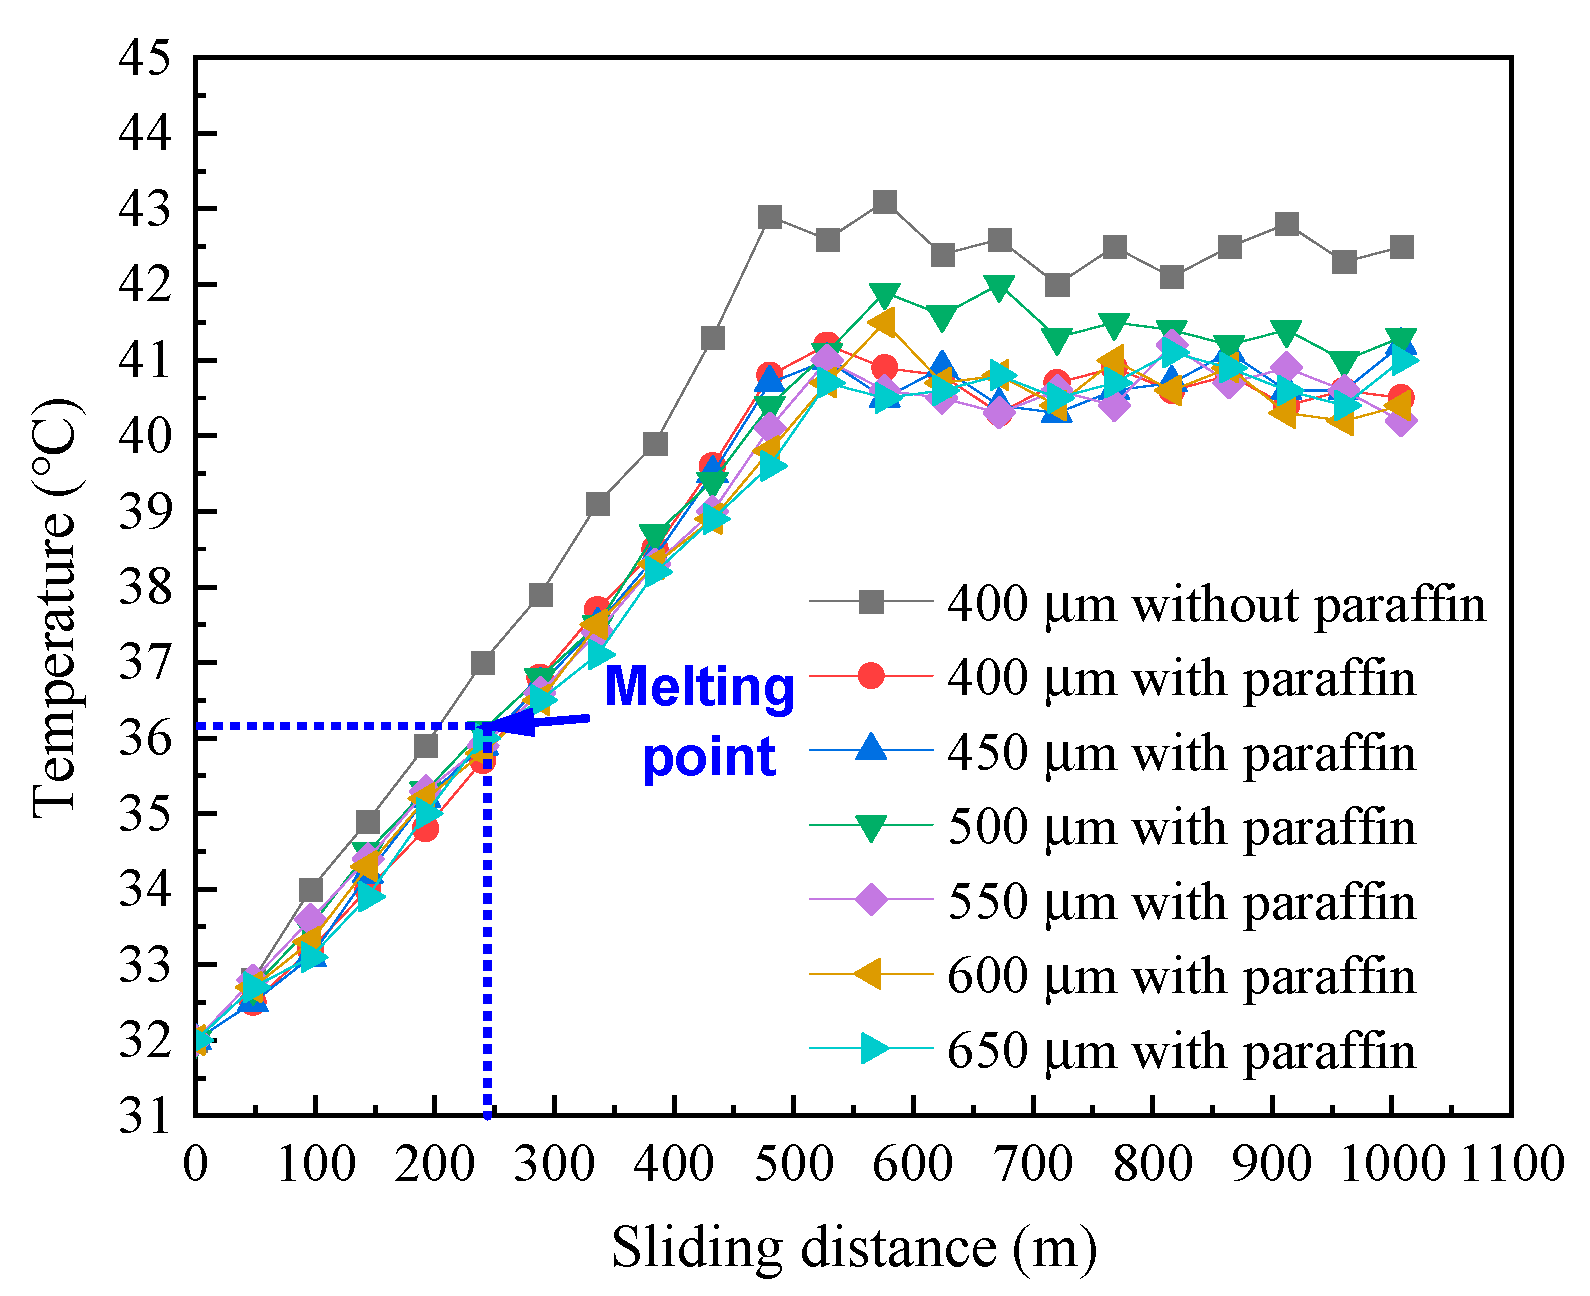
Based on the temperature results from Figure 8, the maximum paraffin temperature reduction is 1.44 °C. In order to enhance the cooling effect, the texture depth is set to 1000 μm for more paraffin carriage to enhance the regulation effect on frictional heat, and the corresponding curves are illustrated in Figure 11. As in Figure 8, the temperature curves of all composite surfaces reach the melting point of paraffin at a sliding distance of 240 m and reach the balance at the sliding distance of 550 m. By calculating the temperatures during steady stage, the average temperatures of the composite surfaces with texture diameters of 400 μm, 450 μm, 500 μm, 550 μm, 600 μm and 650 μm are 40.71 ± 0.26 °C, 40.72 ± 0.29 °C, 40.78 ± 0.31 °C, 40.59 ± 0.30 °C, 40.55 ± 0.37 °C and 40.62 ± 0.22 °C, respectively, all of which are lower than the corresponding value of 42.63 ± 0.30 °C, for the textured surfaces without paraffin. It is clear that by increasing the depth, the cooling effect is enhanced, with the maximum temperature reduction of 2.08 °C. Owing to the same surface density, the total amount of paraffin is the same. Thus, the difference in temperature between samples with different diameters is tiny.

3.5. Tribological Properties of the Composite Surface with Different Circular Diameters

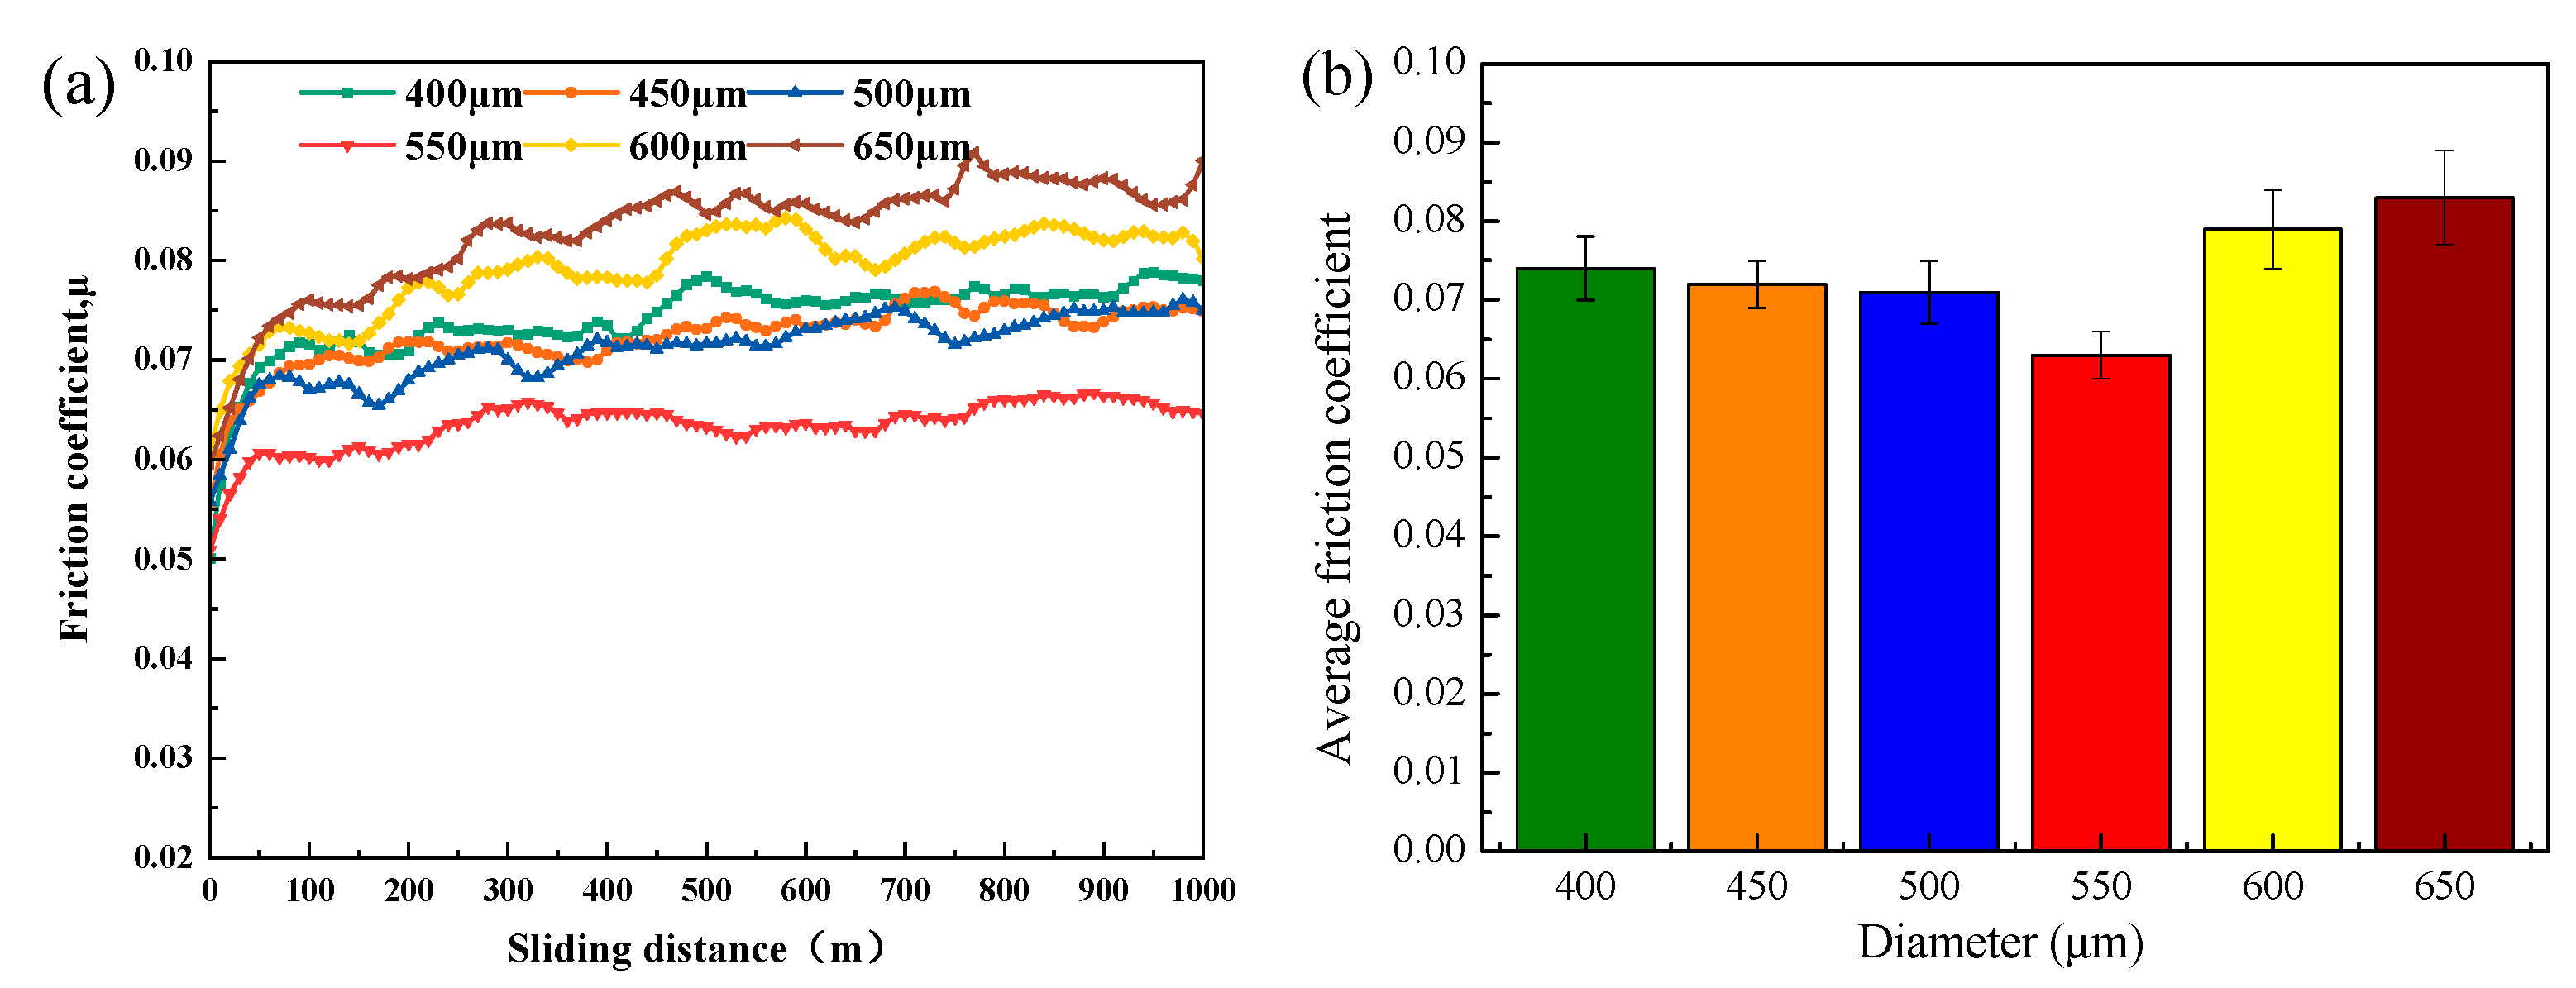
Figure 12a shows the variation in the friction coefficient as a function of sliding distance for the composite surfaces with different diameters. Overall, all composite surfaces achieve favorable tribological performance. Their friction coefficients stay in the low range of 0.044–0.091 within the entire sliding distance of 1000 m with minor curve fluctuations. With the increase in sliding distance, all curves follow a typical trend of initial rise and subsequent stabilization. This variation characteristic reflects that paraffin undergoes phase transformation and releases gradually, driven by frictional heat, thereby forming a lubricating film at the friction interface.
In the initial stage of 0–240 m, the friction coefficient rises slightly, which is attributed to the contact of surface asperities and the incomplete melting of paraffin. As the friction proceeds continuously, the interfacial temperature rises to the phase-transition point of paraffin. Paraffin changes from a solid to a liquid state, leading to a decrease in the friction coefficient, which eventually tends to be stable.
Figure 12b further compares the average friction coefficients of textured composite surfaces with different diameters. Notably, the friction coefficient presents an obvious nonlinear variation trend. When the diameter increases from 400 μm to 550 μm, the average friction coefficient gradually decreases from 0.074 to the minimum value of 0.063, indicating that an appropriate texture diameter facilitates the storage and sustained release of paraffin and contributes to the formation of a more stable lubricating film. Nevertheless, when the diameter is further increased to 650 μm, the friction coefficient rises to 0.083.
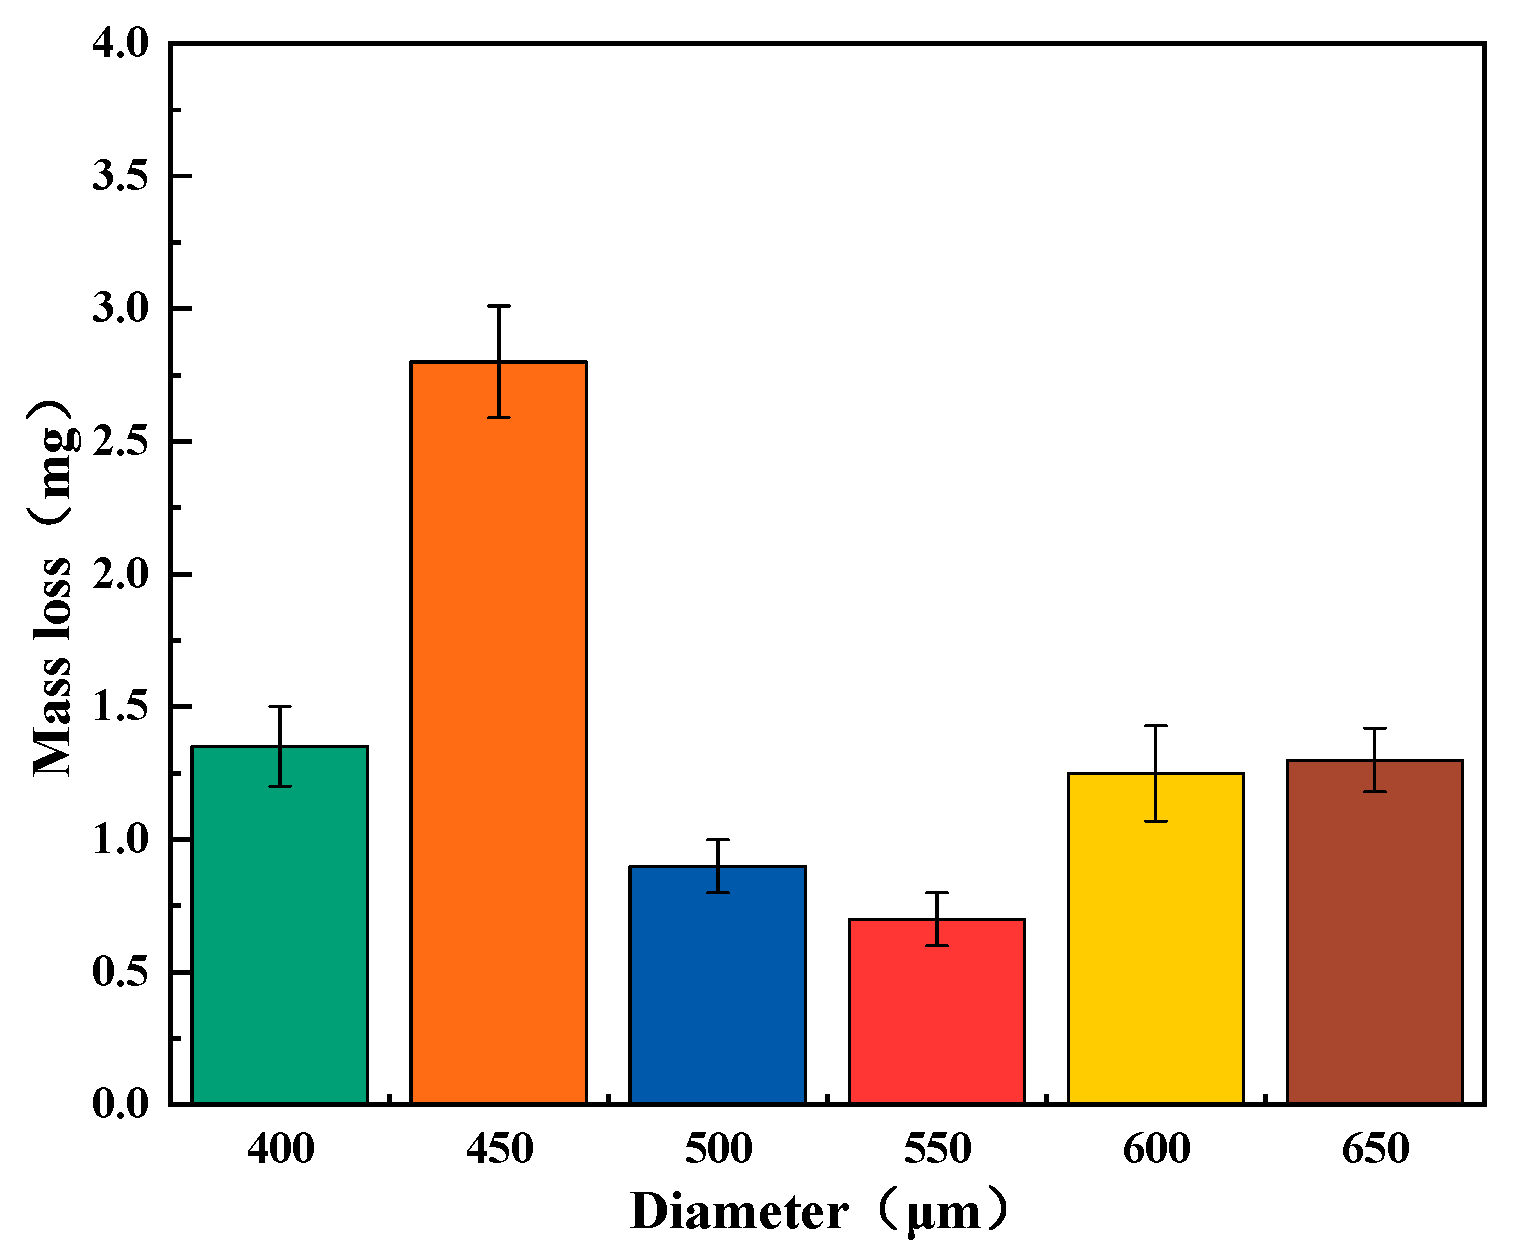
According to the weight-loss method, Figure 13 displays the wear loss of textured composite surfaces with different diameters. It can be seen that with increasing circular diameter from 400 μm to 650 μm, the wear losses for samples are 1.35 ± 0.15 mg, 2.80 ± 0.21 mg, 0.90 ± 0.10 mg, 0.70 ± 0.10 mg, 1.25 ± 0.18 mg, and 1.30 ± 0.12 mg, respectively. Namely, the wear loss exhibits a variation trend of first decreasing and then increasing, except for that of the D2 sample. The circular texture with a moderate diameter of 550 μm exhibits the minimum wear loss of 0.70 ± 0.10 mg.
Based on the comprehensive analysis of average friction coefficient and wear loss, the diameter of 550 μm delivers the optimal tribological performance and is thus determined as the constant parameter in the texture diameter optimization investigation.

4. Discussion

4.1. Effect of Surface Density on Tribological Properties

To investigate the influence of surface density on tribological properties, the flow field pressure distribution was analyzed. Figure 14 presents the pressure distribution nephograms of the oil film under various surface densities. On the one hand, regardless of surface density, an obvious asymmetric pressure distribution can be observed. On the other hand, the textured area can be distinctly divided into a positive-pressure zone indicated by red color and a negative-pressure zone indicated by blue color. This phenomenon can be explained as follows: when the lubricating medium flows through surface textures with the relative motion of friction pairs, the sudden expansion of the flow channel at the texture inlet forms divergent gaps, which reduce fluid pressure and generate the negative-pressure zone. By contrast, the flow channel convergence at the texture outlet leads to pressure recovery and forms the positive-pressure zone. At the positive-pressure zone, the hydrodynamic lifting force would be generated so as to reduce the contact stress.
To highlight the influence of surface density, the specific values of maximum pressure were extracted from Figure 14 and are listed in Table 4. The results reveal that the maximum positive pressure values are 245 Pa, 252 Pa, 263 Pa, 266 Pa, 285 Pa, and 266 Pa with increasing surface densities from 6.8% to 40.1%. It can be seen that the maximum positive pressure rises first and then declines, which is consistent with the variation trends of the average friction coefficient in Figure 9b and wear loss in Figure 10.
When the surface density increases from 6.8% to 16.2%, the calculated area corresponding to a single texture is still big, so that the distance between adjacent textures is in the range of 0.567 mm to 1.216 mm. Under this condition, the big spacing between the positive-pressure and negative-pressure zones of adjacent textures makes it hard to provide sufficient load-bearing capacity of the whole composite surface, even when the maximum pressure generated by an individual texture rises from 245 Pa to 266 Pa. In other words, it indicates that circular texture arrays with low surface density fail to achieve an effective synergistic lubrication effect [37]. On the contrary, when the surface density reaches 40.1%, the spacing between the positive-pressure and negative-pressure zones of adjacent textures is narrowed. As a result, it could provide a greater lubrication effect than the composite surface with low surface density. However, although the maximum pressure is still maintained at the high level of 266 Pa, the excessive texture units due to the high surface density of 40.1% increase the load borne for non-textured regions and reduce the overall surface mechanical strength, which accelerates material wear during friction and leads to the highest wear loss [38,39]. By combining the balance between hydrodynamic pressure and surface integrity, the S5 sample with a surface density of 24.2% can generate the maximum value of 285 Pa as well as sufficient surface strength. Thus, the S5 sample presents the lowest friction coefficient and mass loss.
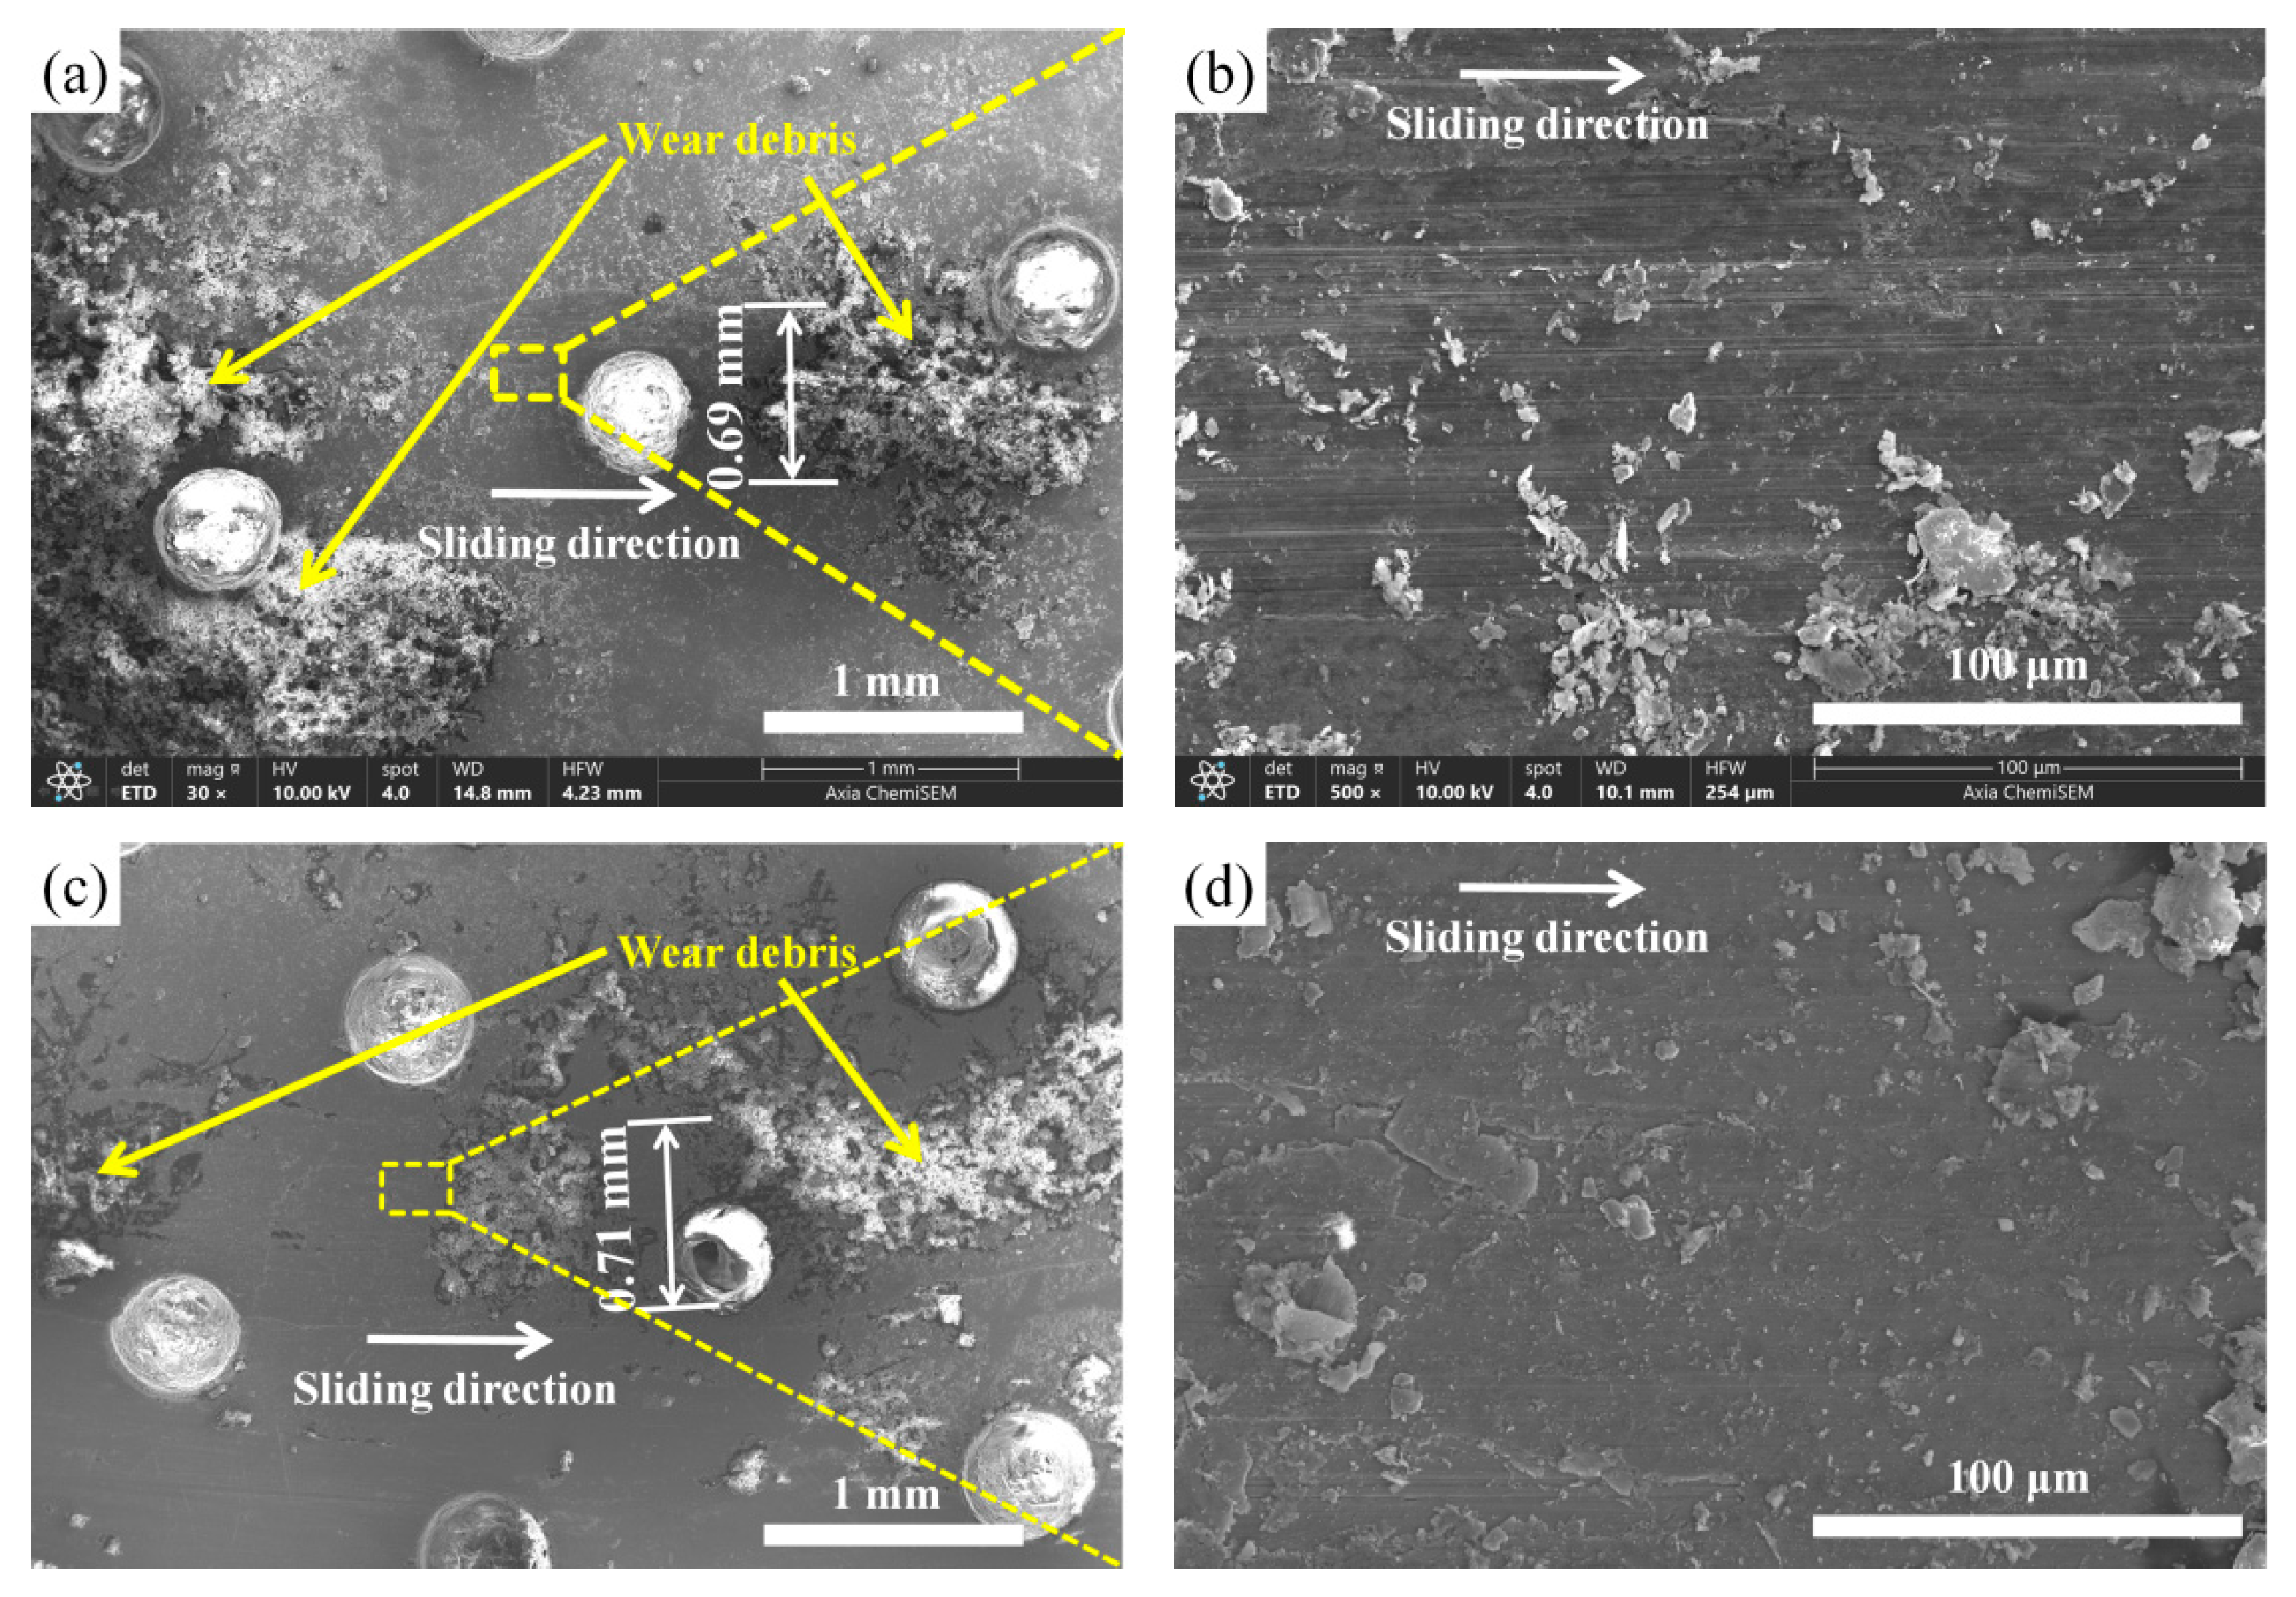
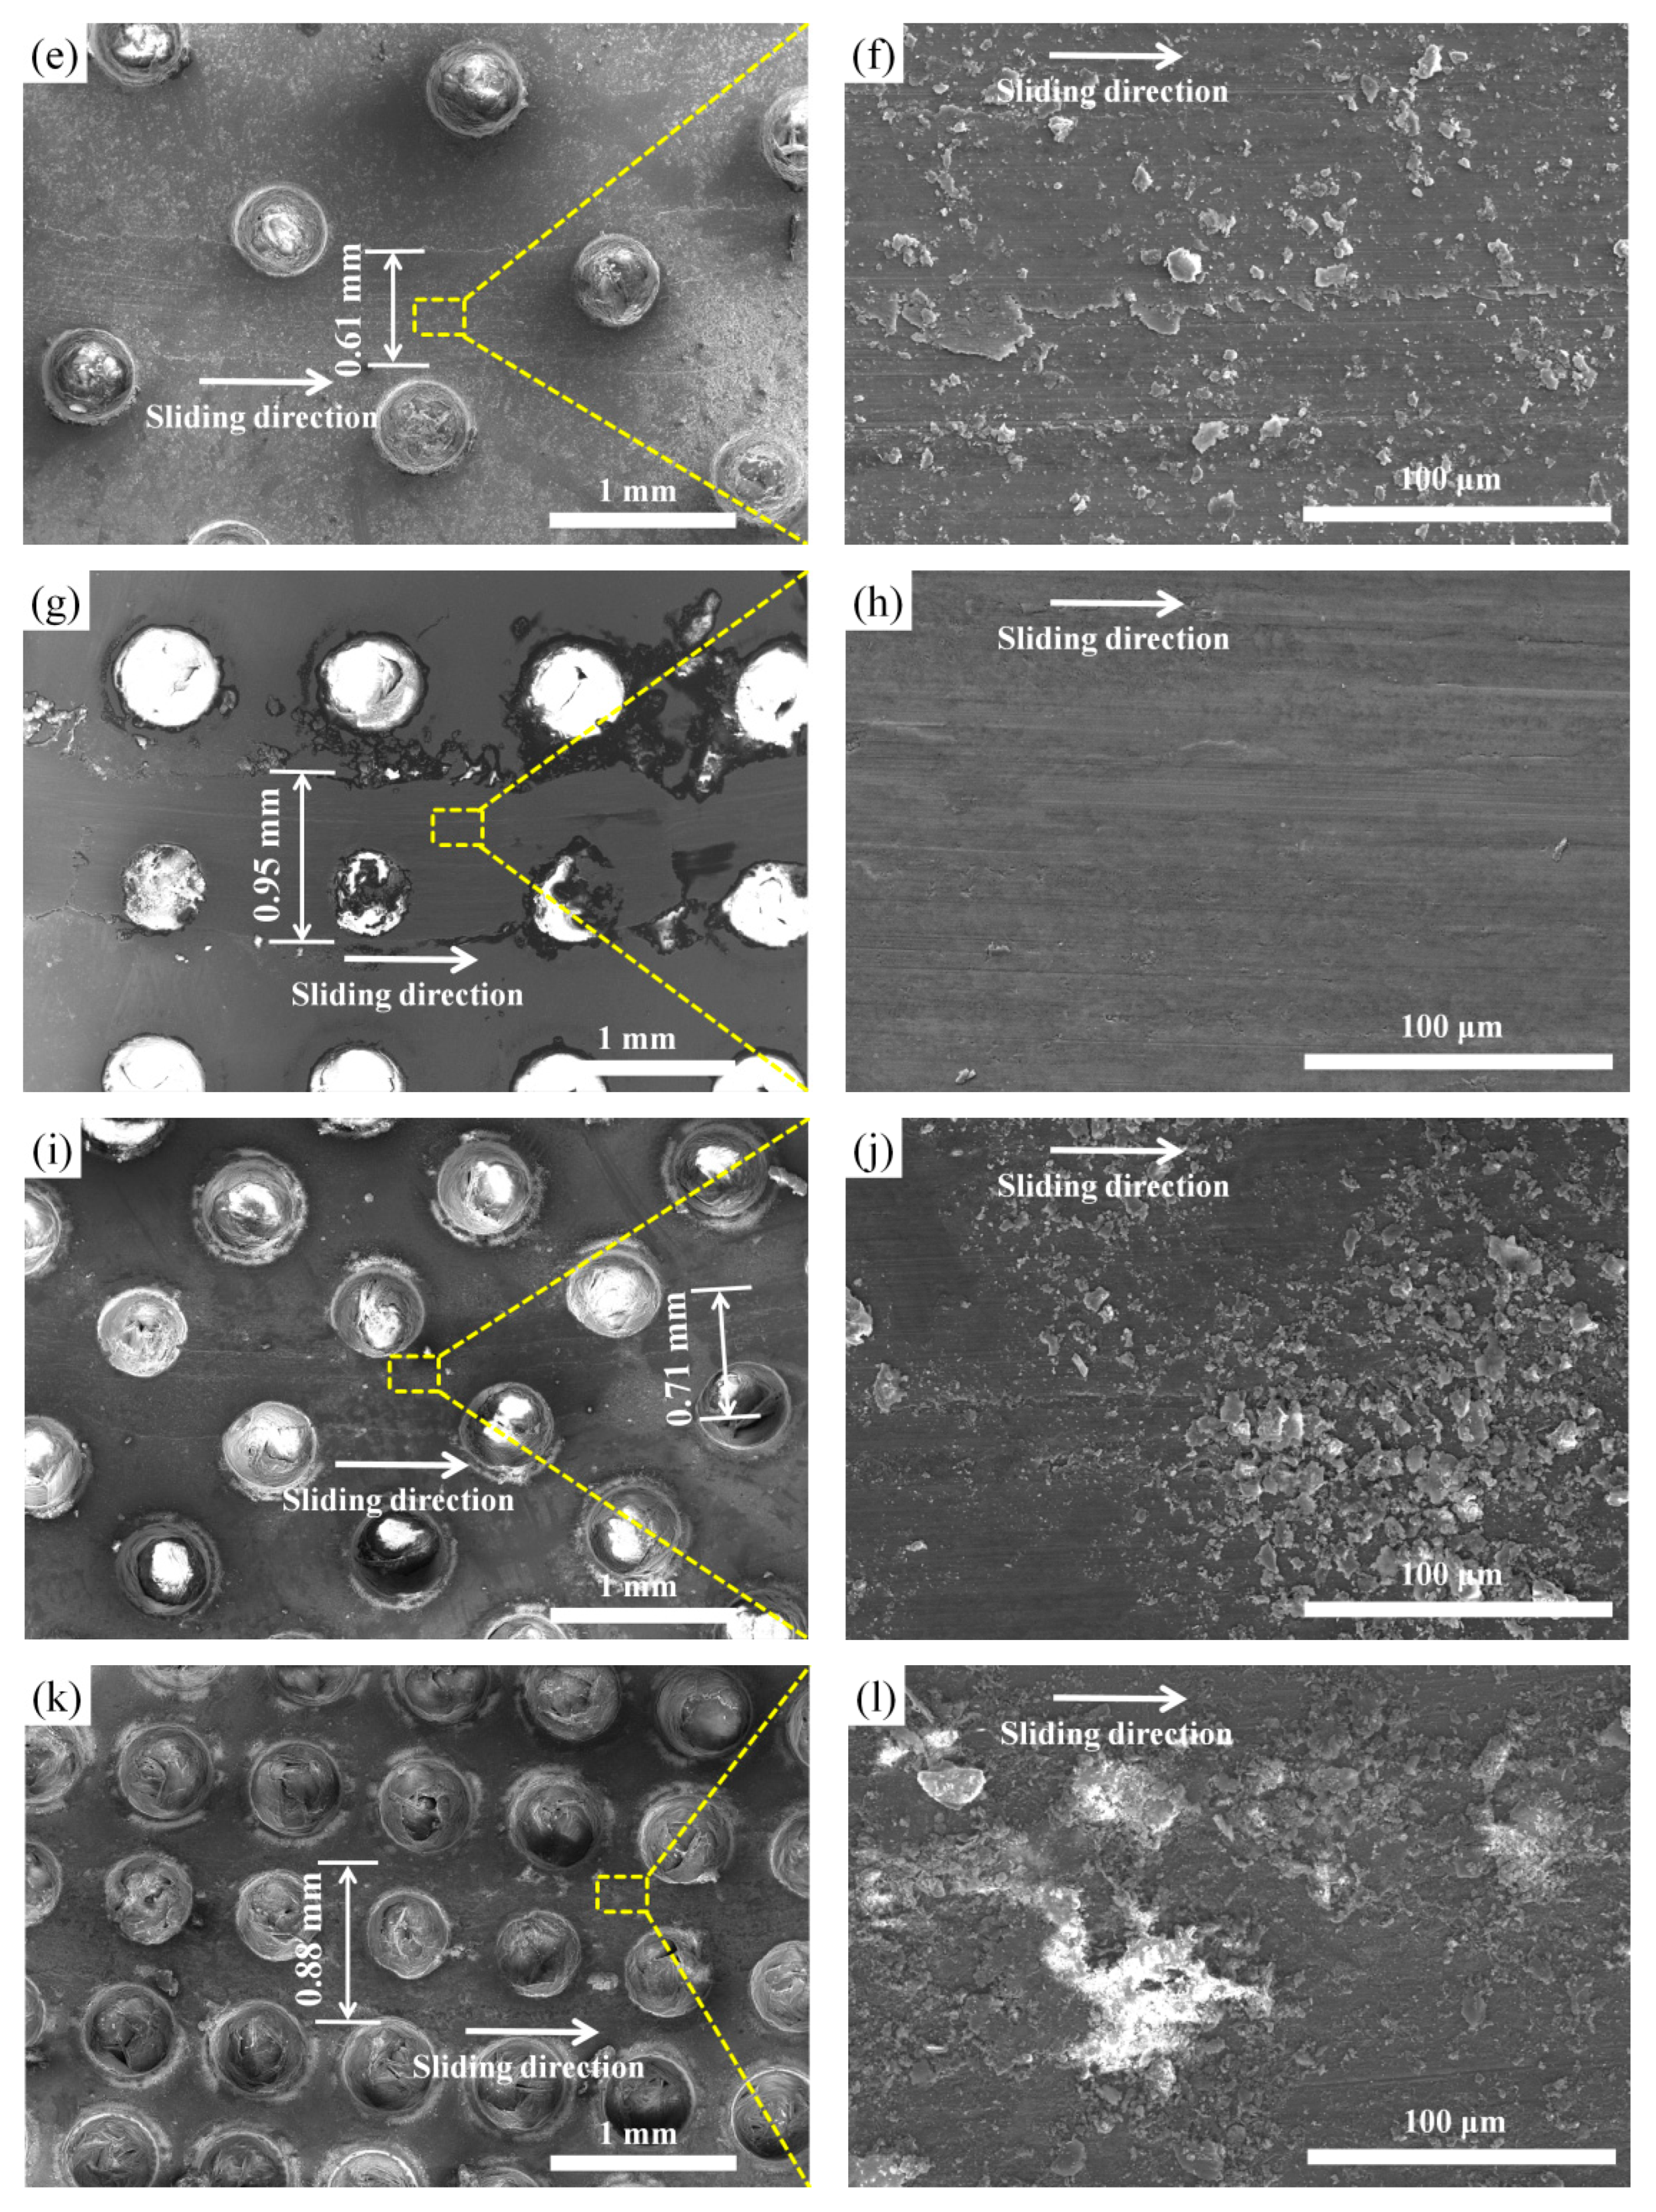
Figure 15 presents the SEM micrographs of wear morphologies for composite surfaces with different surface densities. According to measurement and calculation, the wear track widths of textured surfaces with different surface densities range from 0.61 mm to 0.95 mm. During the friction process, paraffin is continuously squeezed out from the textures and replenished at the friction interface, forming an effective lubricating film. This film can effectively fill micro-pores and microscopic asperities on textured surfaces, reduce the actual contact area, lower the friction coefficient, and improve lubrication performance and thermal stability. In the meantime, the textures could store the wear debris and minimize the abrasive wear. Thus, only shallow and fine plow grooves rather than large-scale flaking pits appear on the composite surfaces, showing typical mild abrasive wear features in Figure 15. The wear debris storage and secondary lubrication functions of surface textures have been widely reported in the literature [40]. Thus, the composite’s surface presents a low-level friction coefficient of 0.043–0.075.
Moreover, some wear debris can be clearly observed on the wear tracks in Figure 15a,c. On the contrary, less wear debris can be observed in Figure 15e–k. This is because of the better storage effect of more textures due to increasing surface density. The less wear debris left on the friction interface would reduce the friction coefficient and three-body abrasive wear. For the S6 sample, although the storage effect is the greatest, the load-bearing capacity is weakened due to more textures. Thus, it suffers from a high friction coefficient and wear loss.

4.2. Effect of Circular Diameter on Tribological Properties

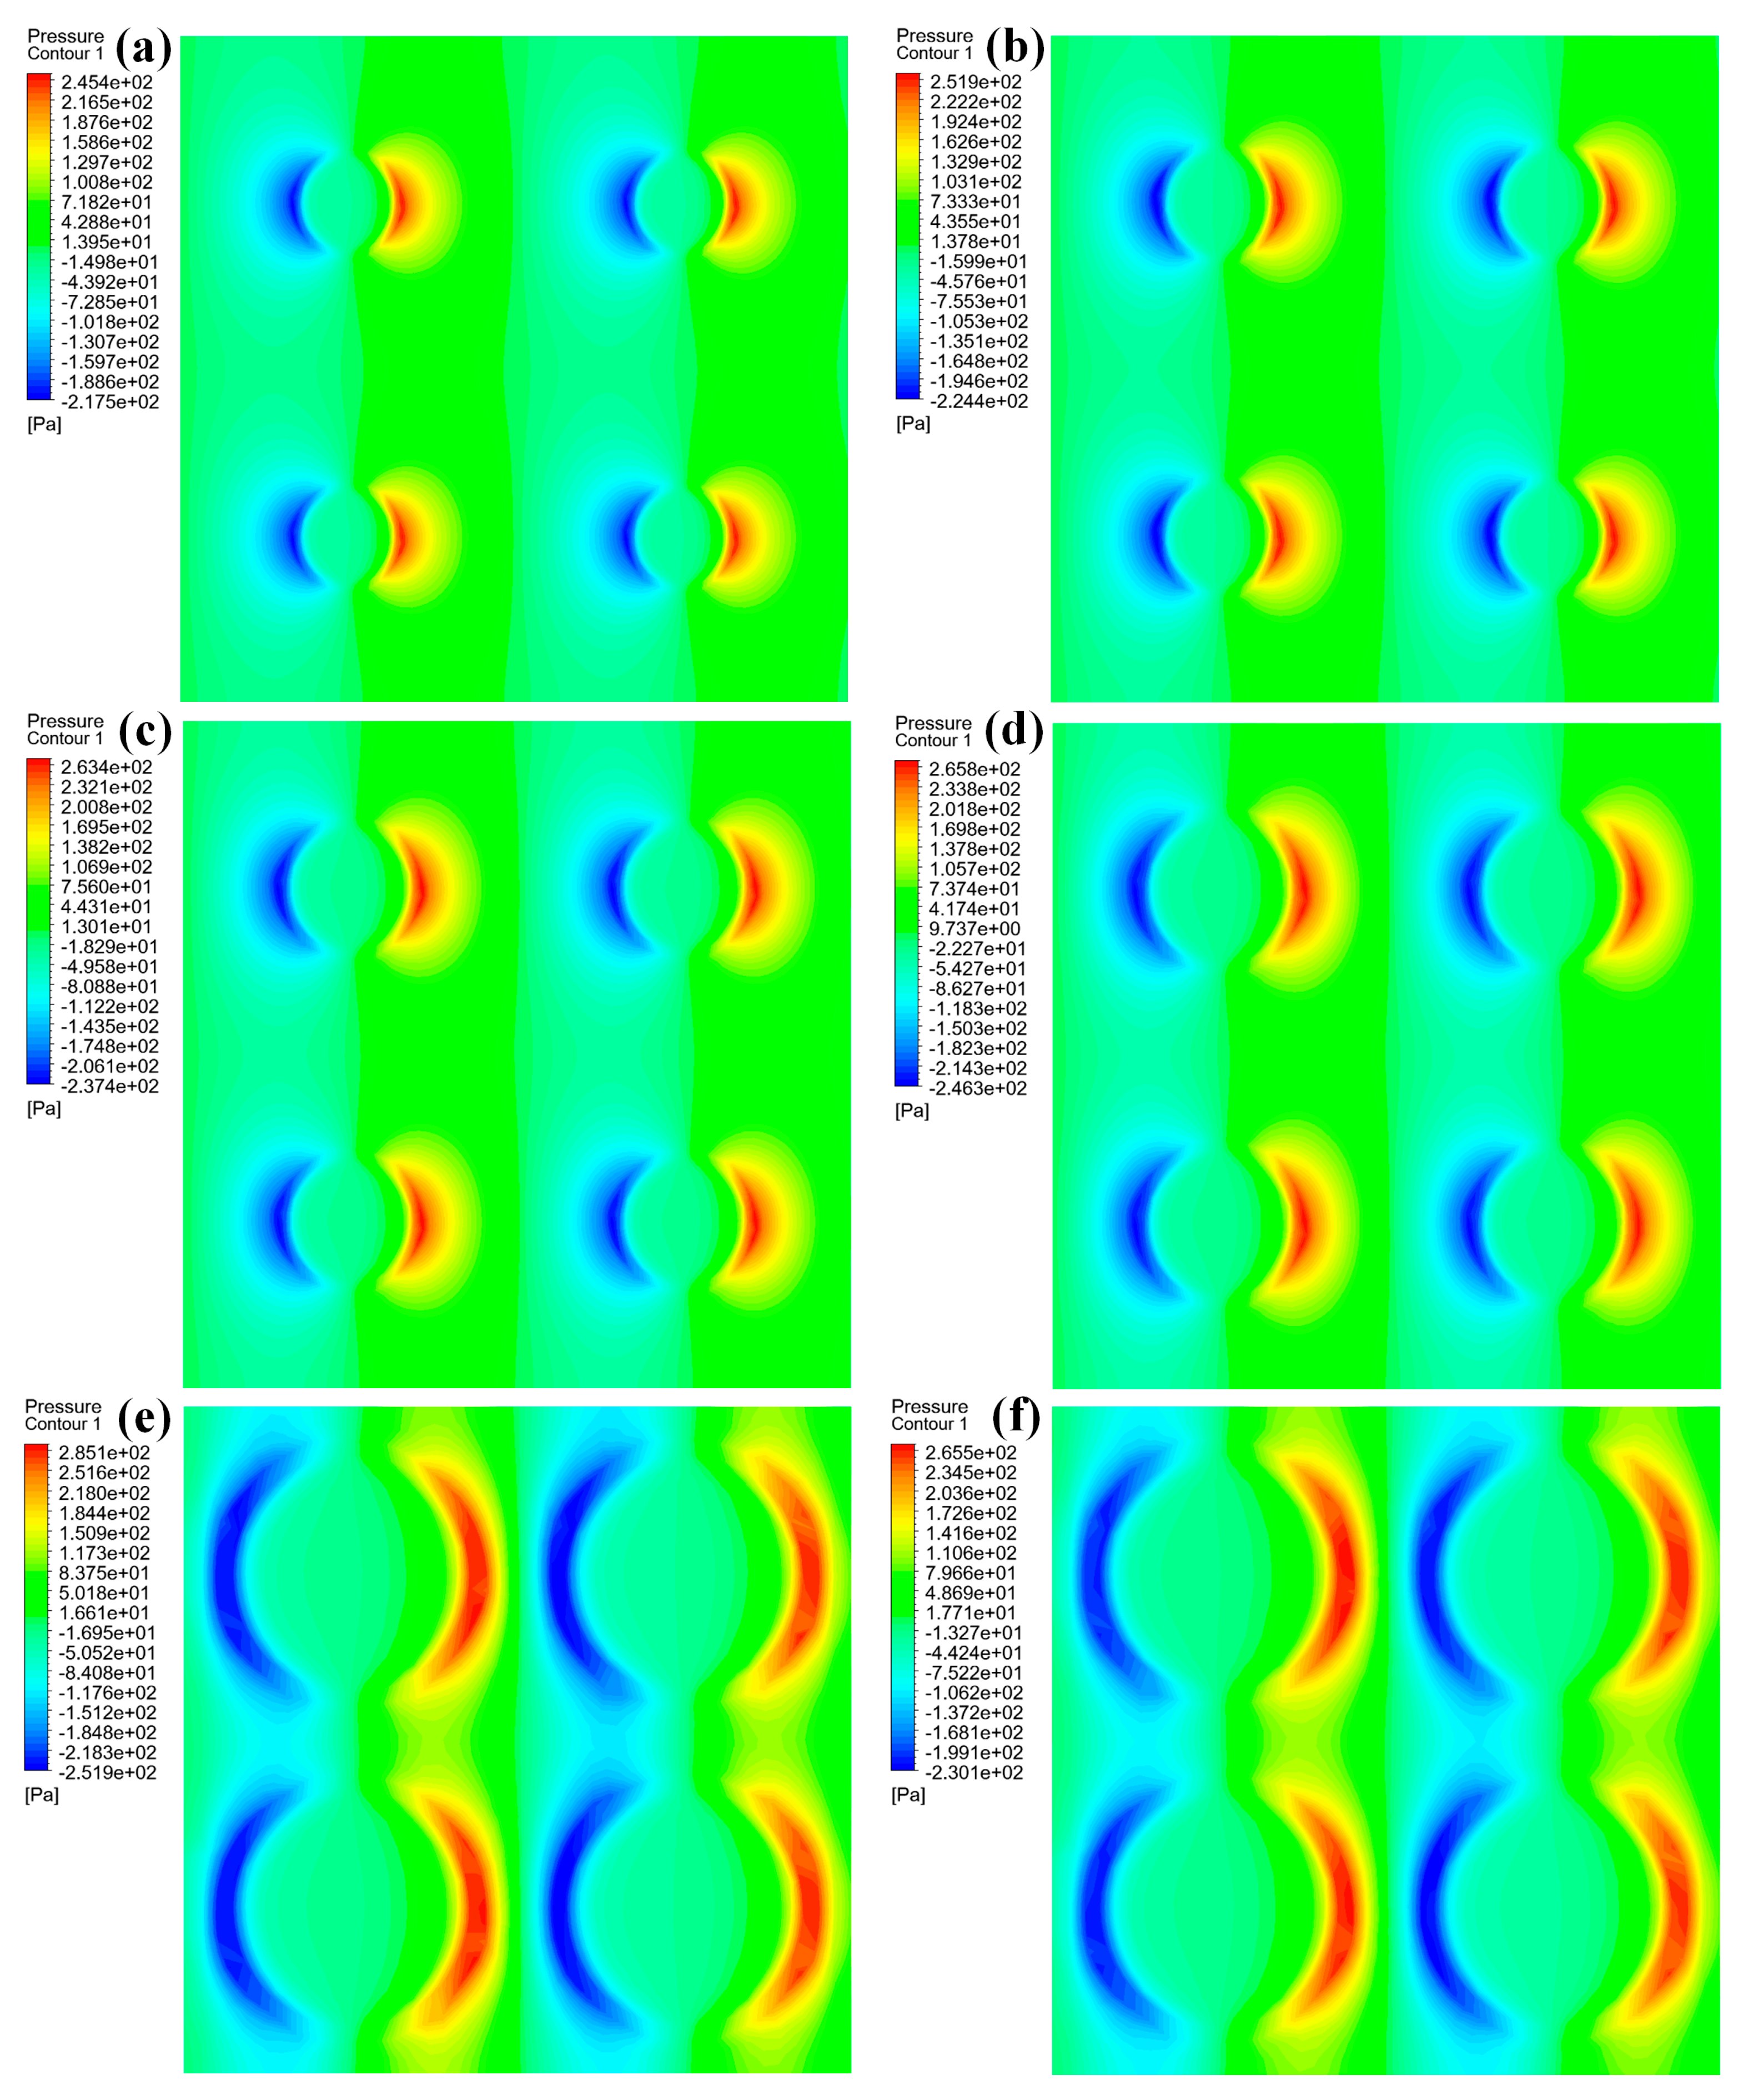
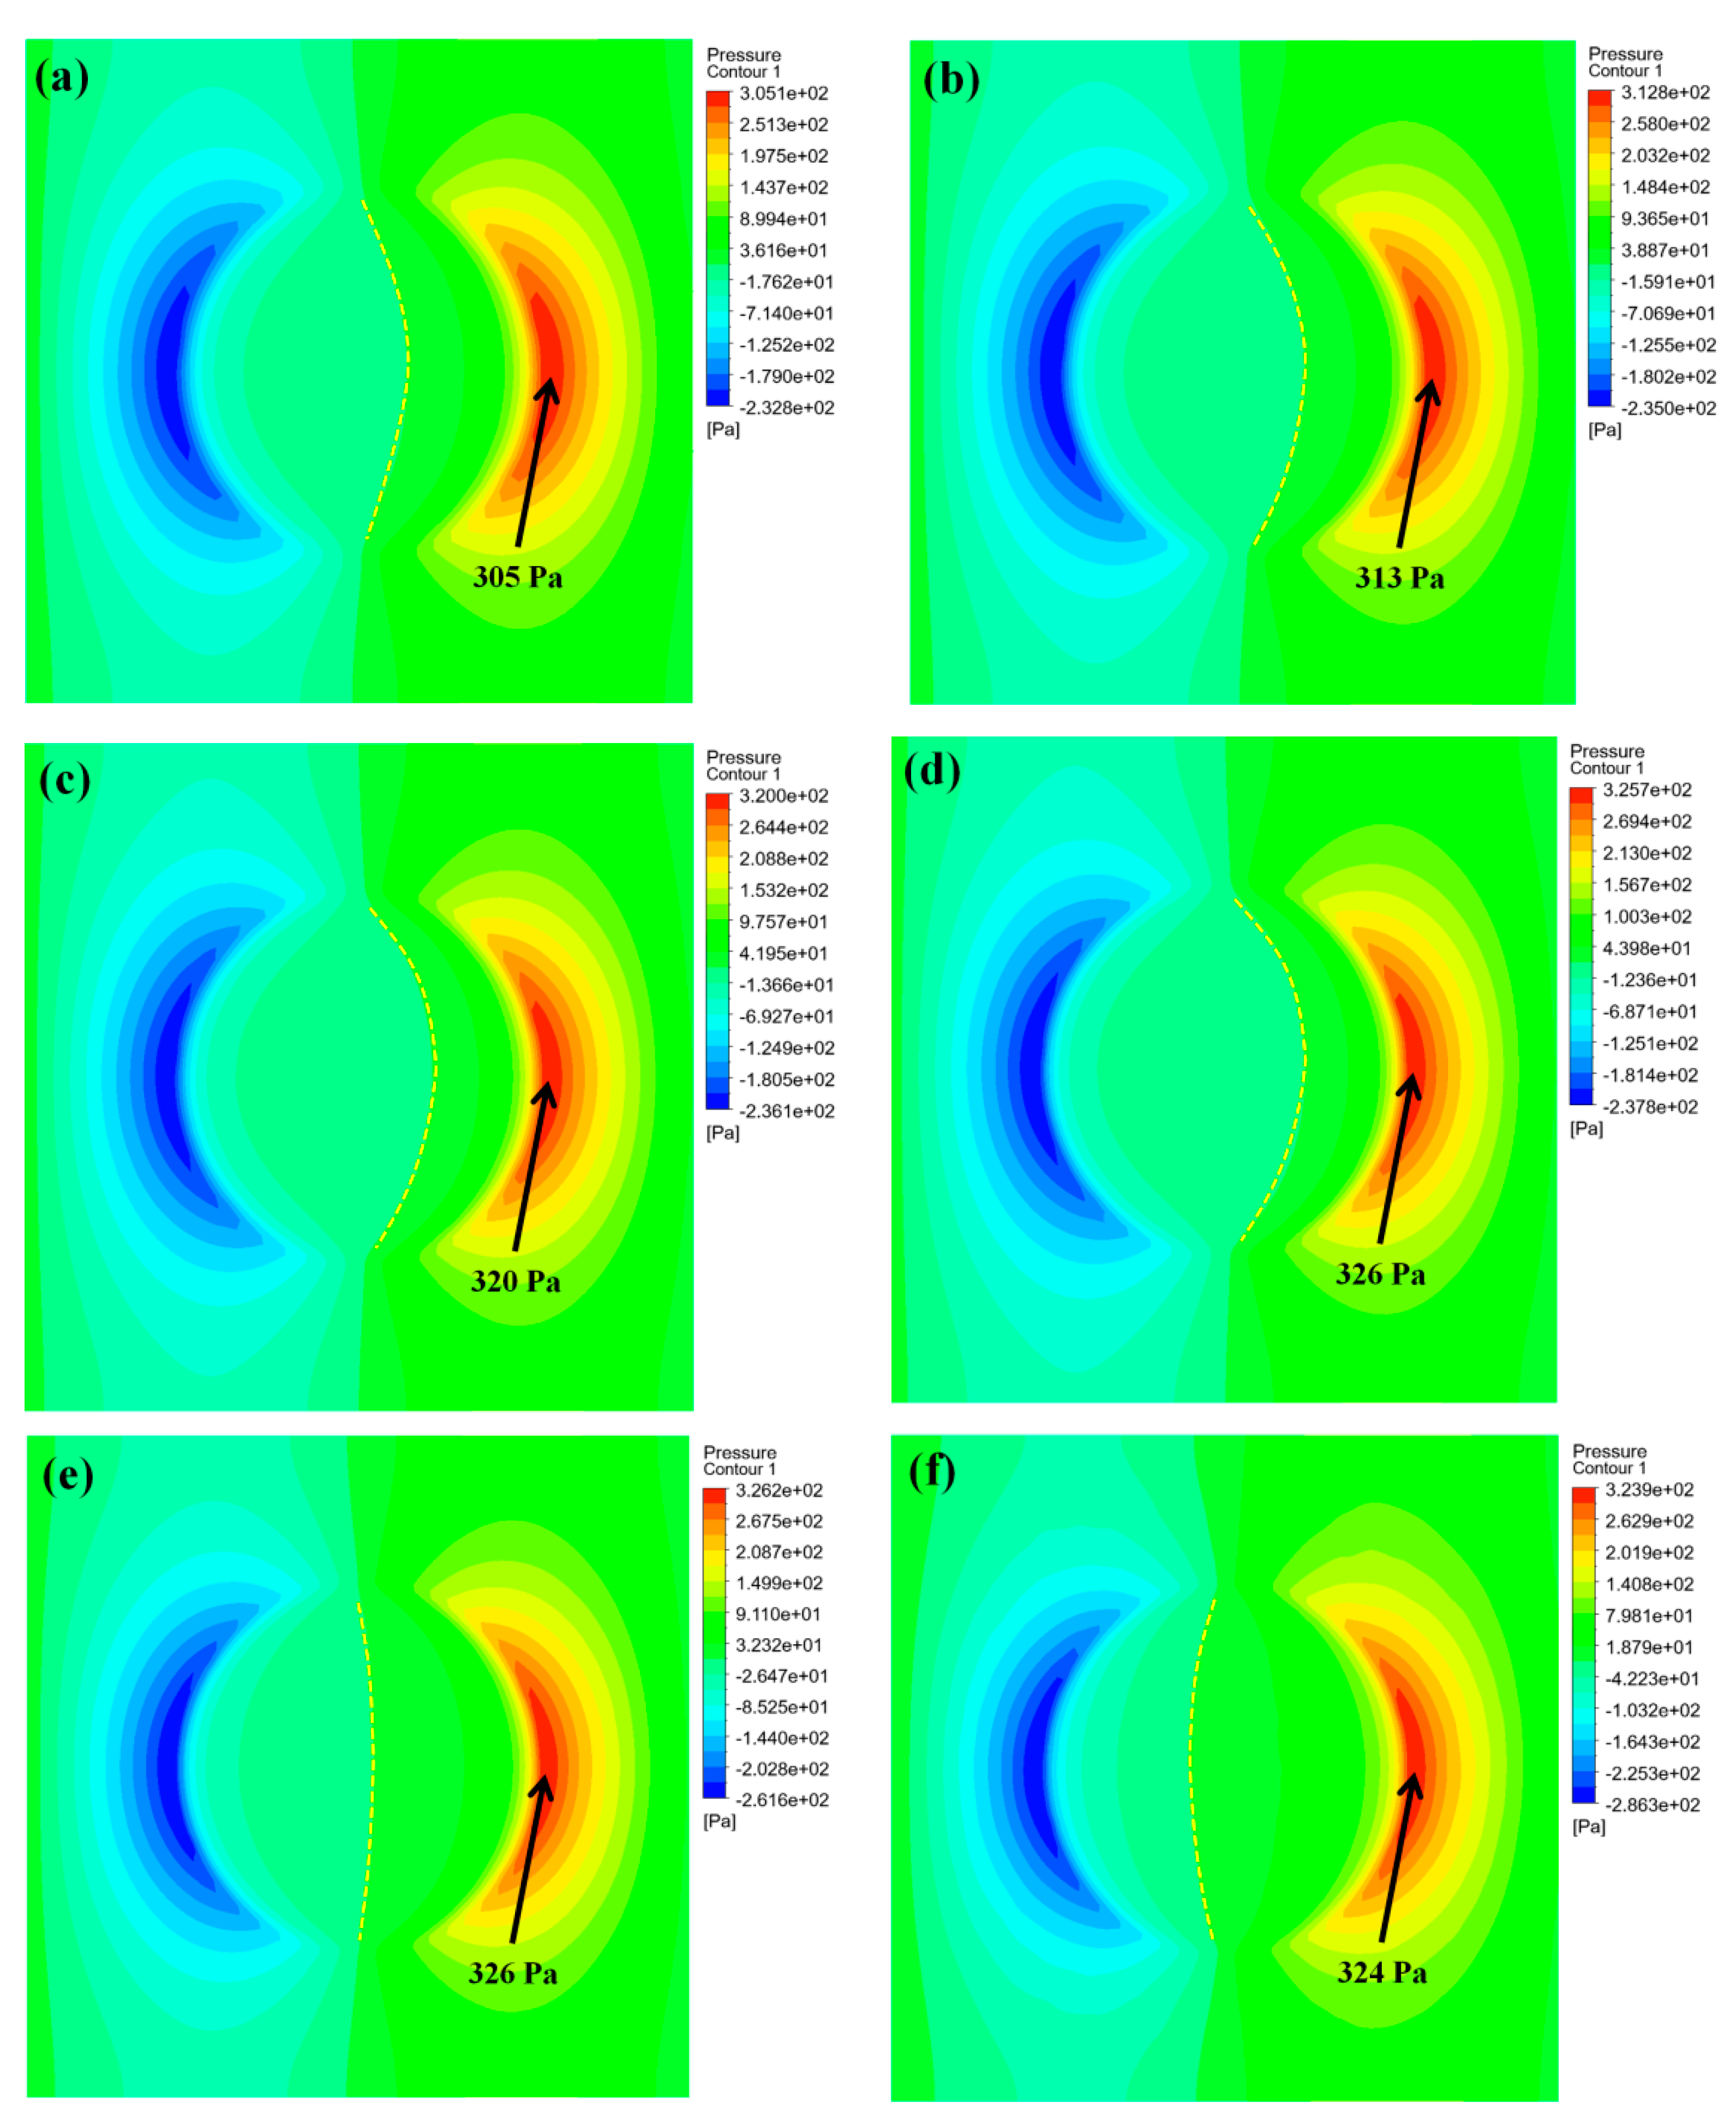
To reveal the effect of circular diameter on tribological properties, Figure 16 presents the nephograms of oil film pressure distribution of circular textures with different diameters. It is clear that with the increase in circular texture diameter from 400 μm to 550 μm, the area of the positive-pressure zone as well as the negative-pressure zone remains almost steady. Nevertheless, it can be observed from pressure distribution nephograms that once the texture diameter reaches 600 μm, the area proportion of the positive-pressure zone becomes bigger and surpasses the area of the negative-pressure zone as the texture diameter reaches 650 μm. This phenomenon is mainly attributed to the enhancement effect from the convergent wedge of the oil film, leading to a continuous expansion of the positive-pressure region. To highlight the influence of circular diameter, the specific values of maximum pressure were extracted from Figure 16 and are listed in Table 4. The results reveal that the maximum positive pressure values are 305 Pa, 313 Pa, 320 Pa, 326 Pa, 326 Pa, and 324 Pa with increasing surface densities from 400 μm to 650 μm. The reason for this phenomenon is that when the texture diameter is small, the divergent and convergent gap effects formed by the flow of lubricating medium inside textures are weak, resulting in limited additional bearing capacity and insignificant hydrodynamic effect. As the texture diameter increases, the divergence and convergence effects of lubricant in characteristic regions are strengthened, which enhances the hydrodynamic effect. It could be seen that the composite surface with circular diameters of 550 μm and 600 μm presents the highest pressure of 326 Pa. Under this condition, the D4 and D5 samples suffer the lowest contact stress. Although the maximum hydrodynamic pressure of D4 and D5 is identical, the minimum pressure is different. To be specific, the minimum pressures of D4 and D5 are −238 Pa and −262 Pa. It means that D4 forms a pressure zone with a narrow range across the contact interface, while D5 forms a pressure zone with a wide range. This would cause uneven pressure distribution for D5, thus leading to low average pressure from the hydrodynamic effect. As a consequence, the tribological performance of D5 is inferior to that of D4.
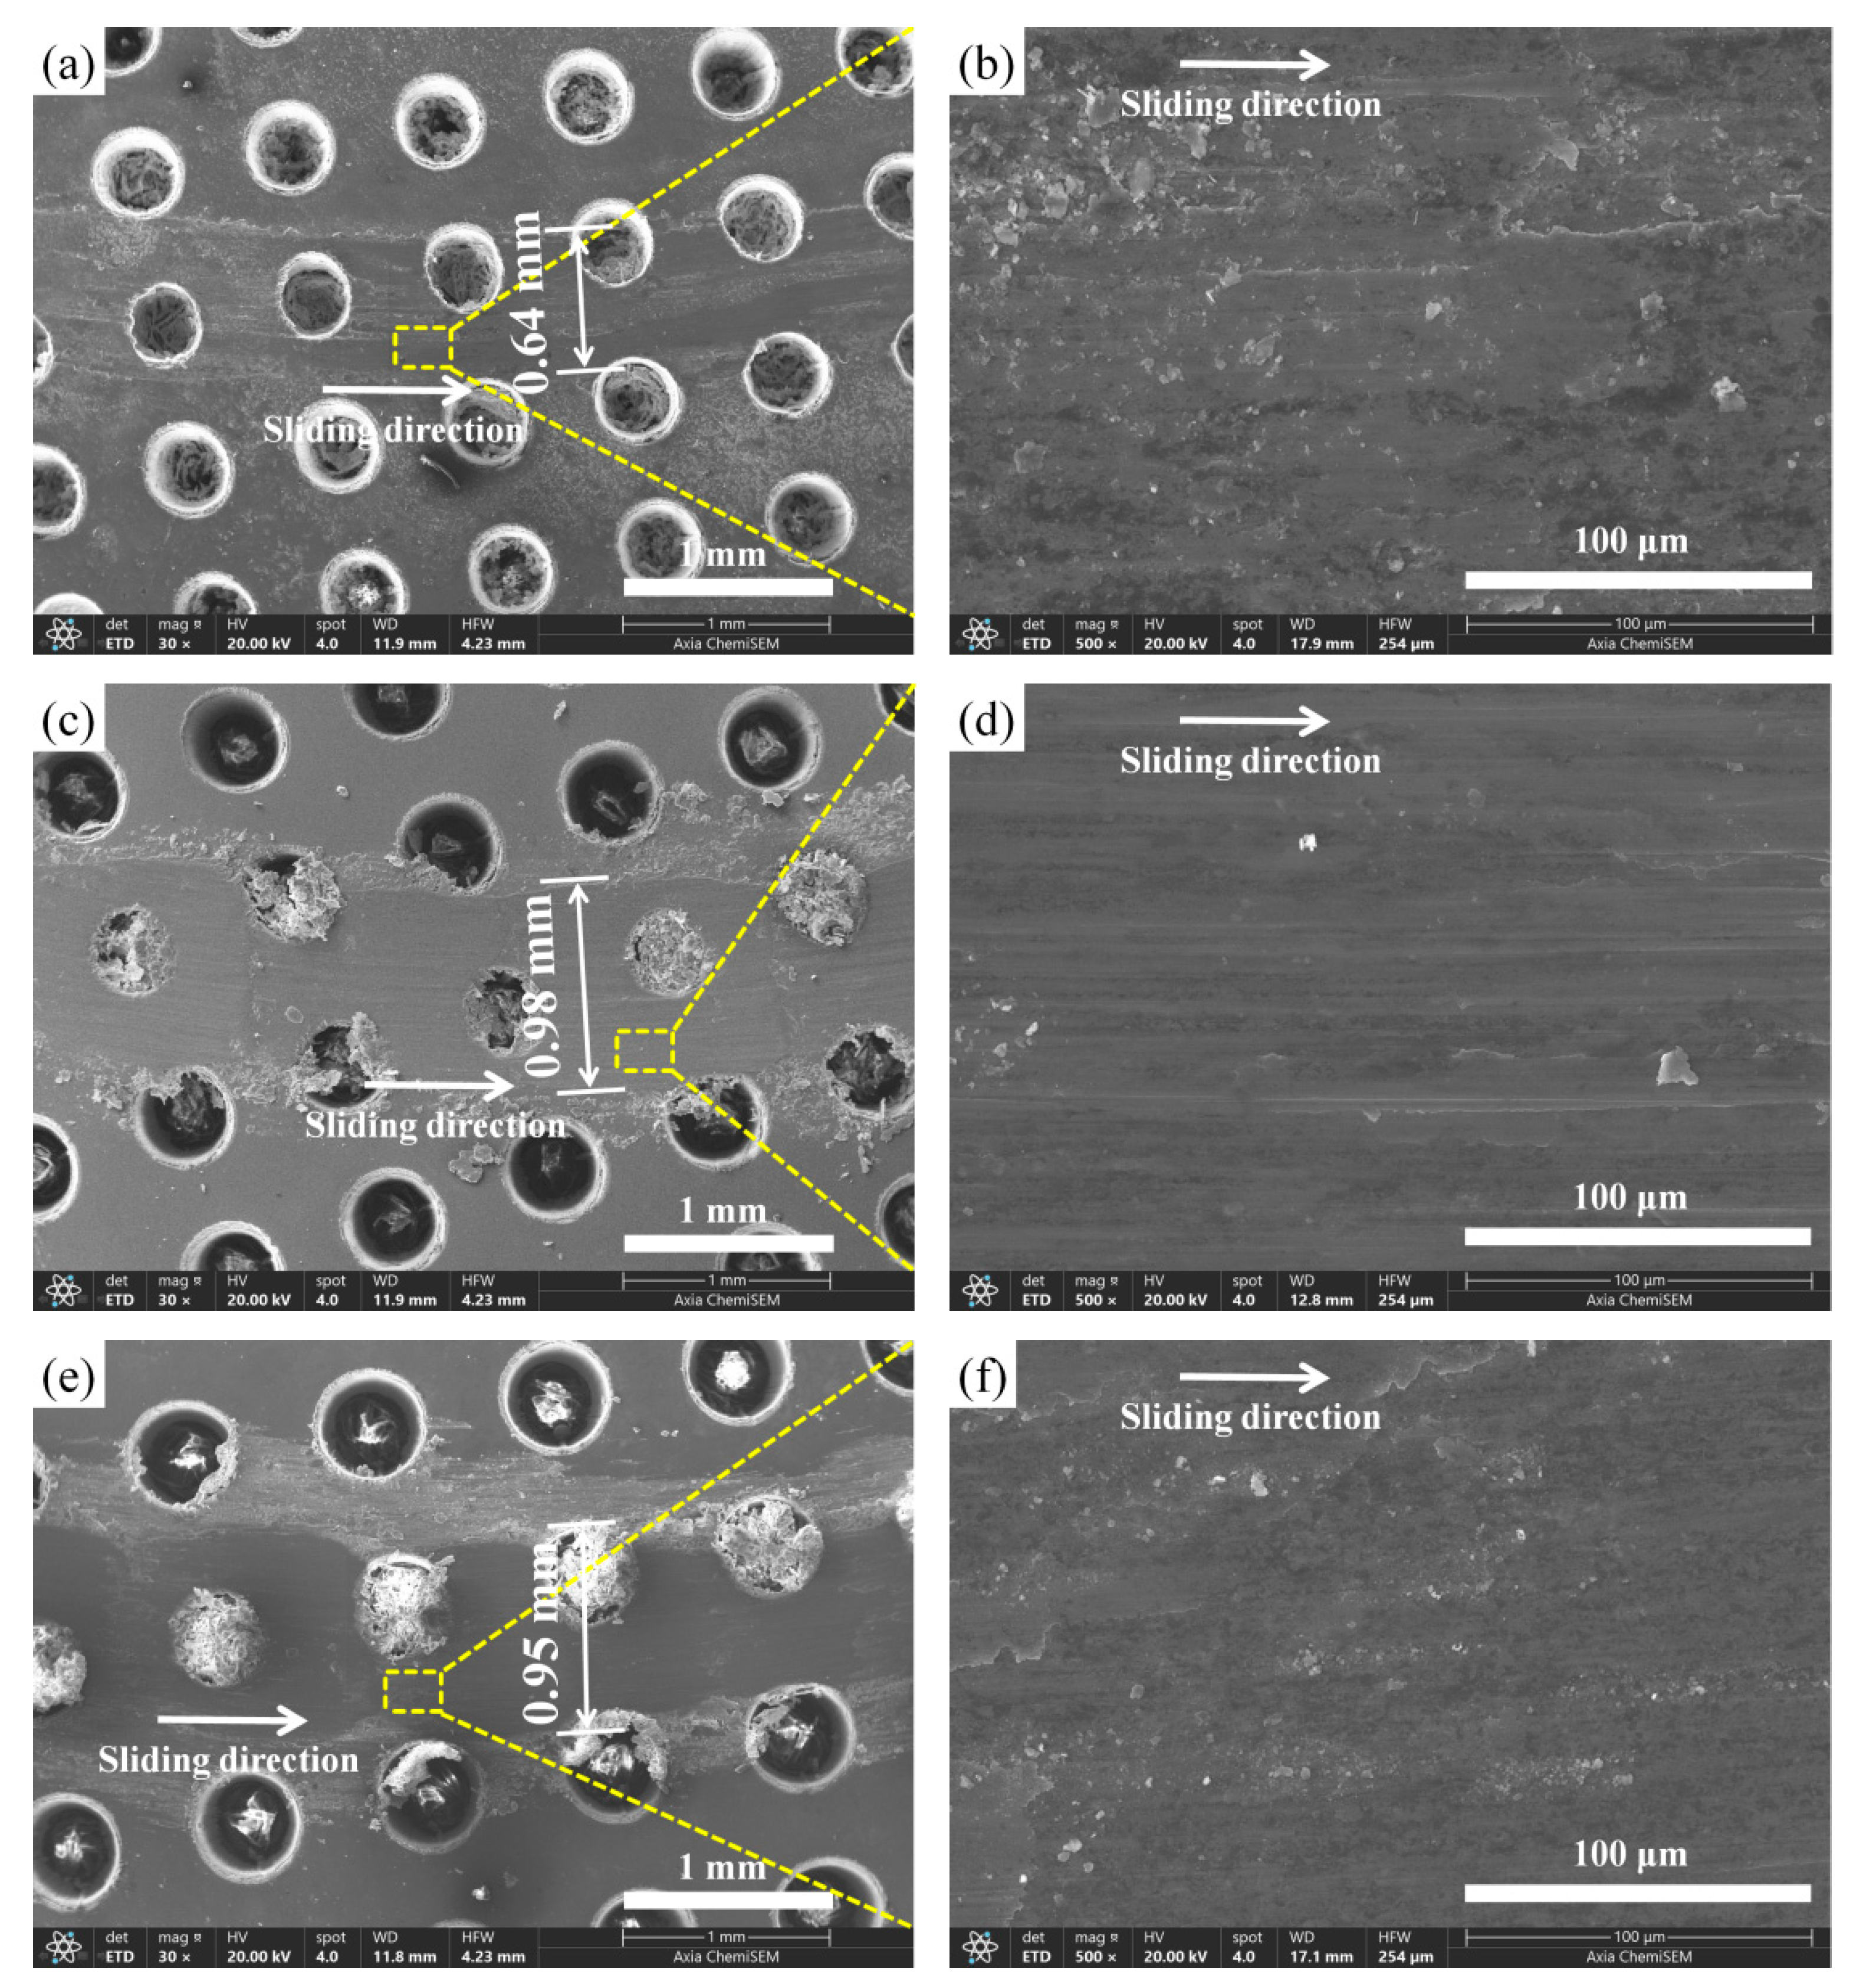
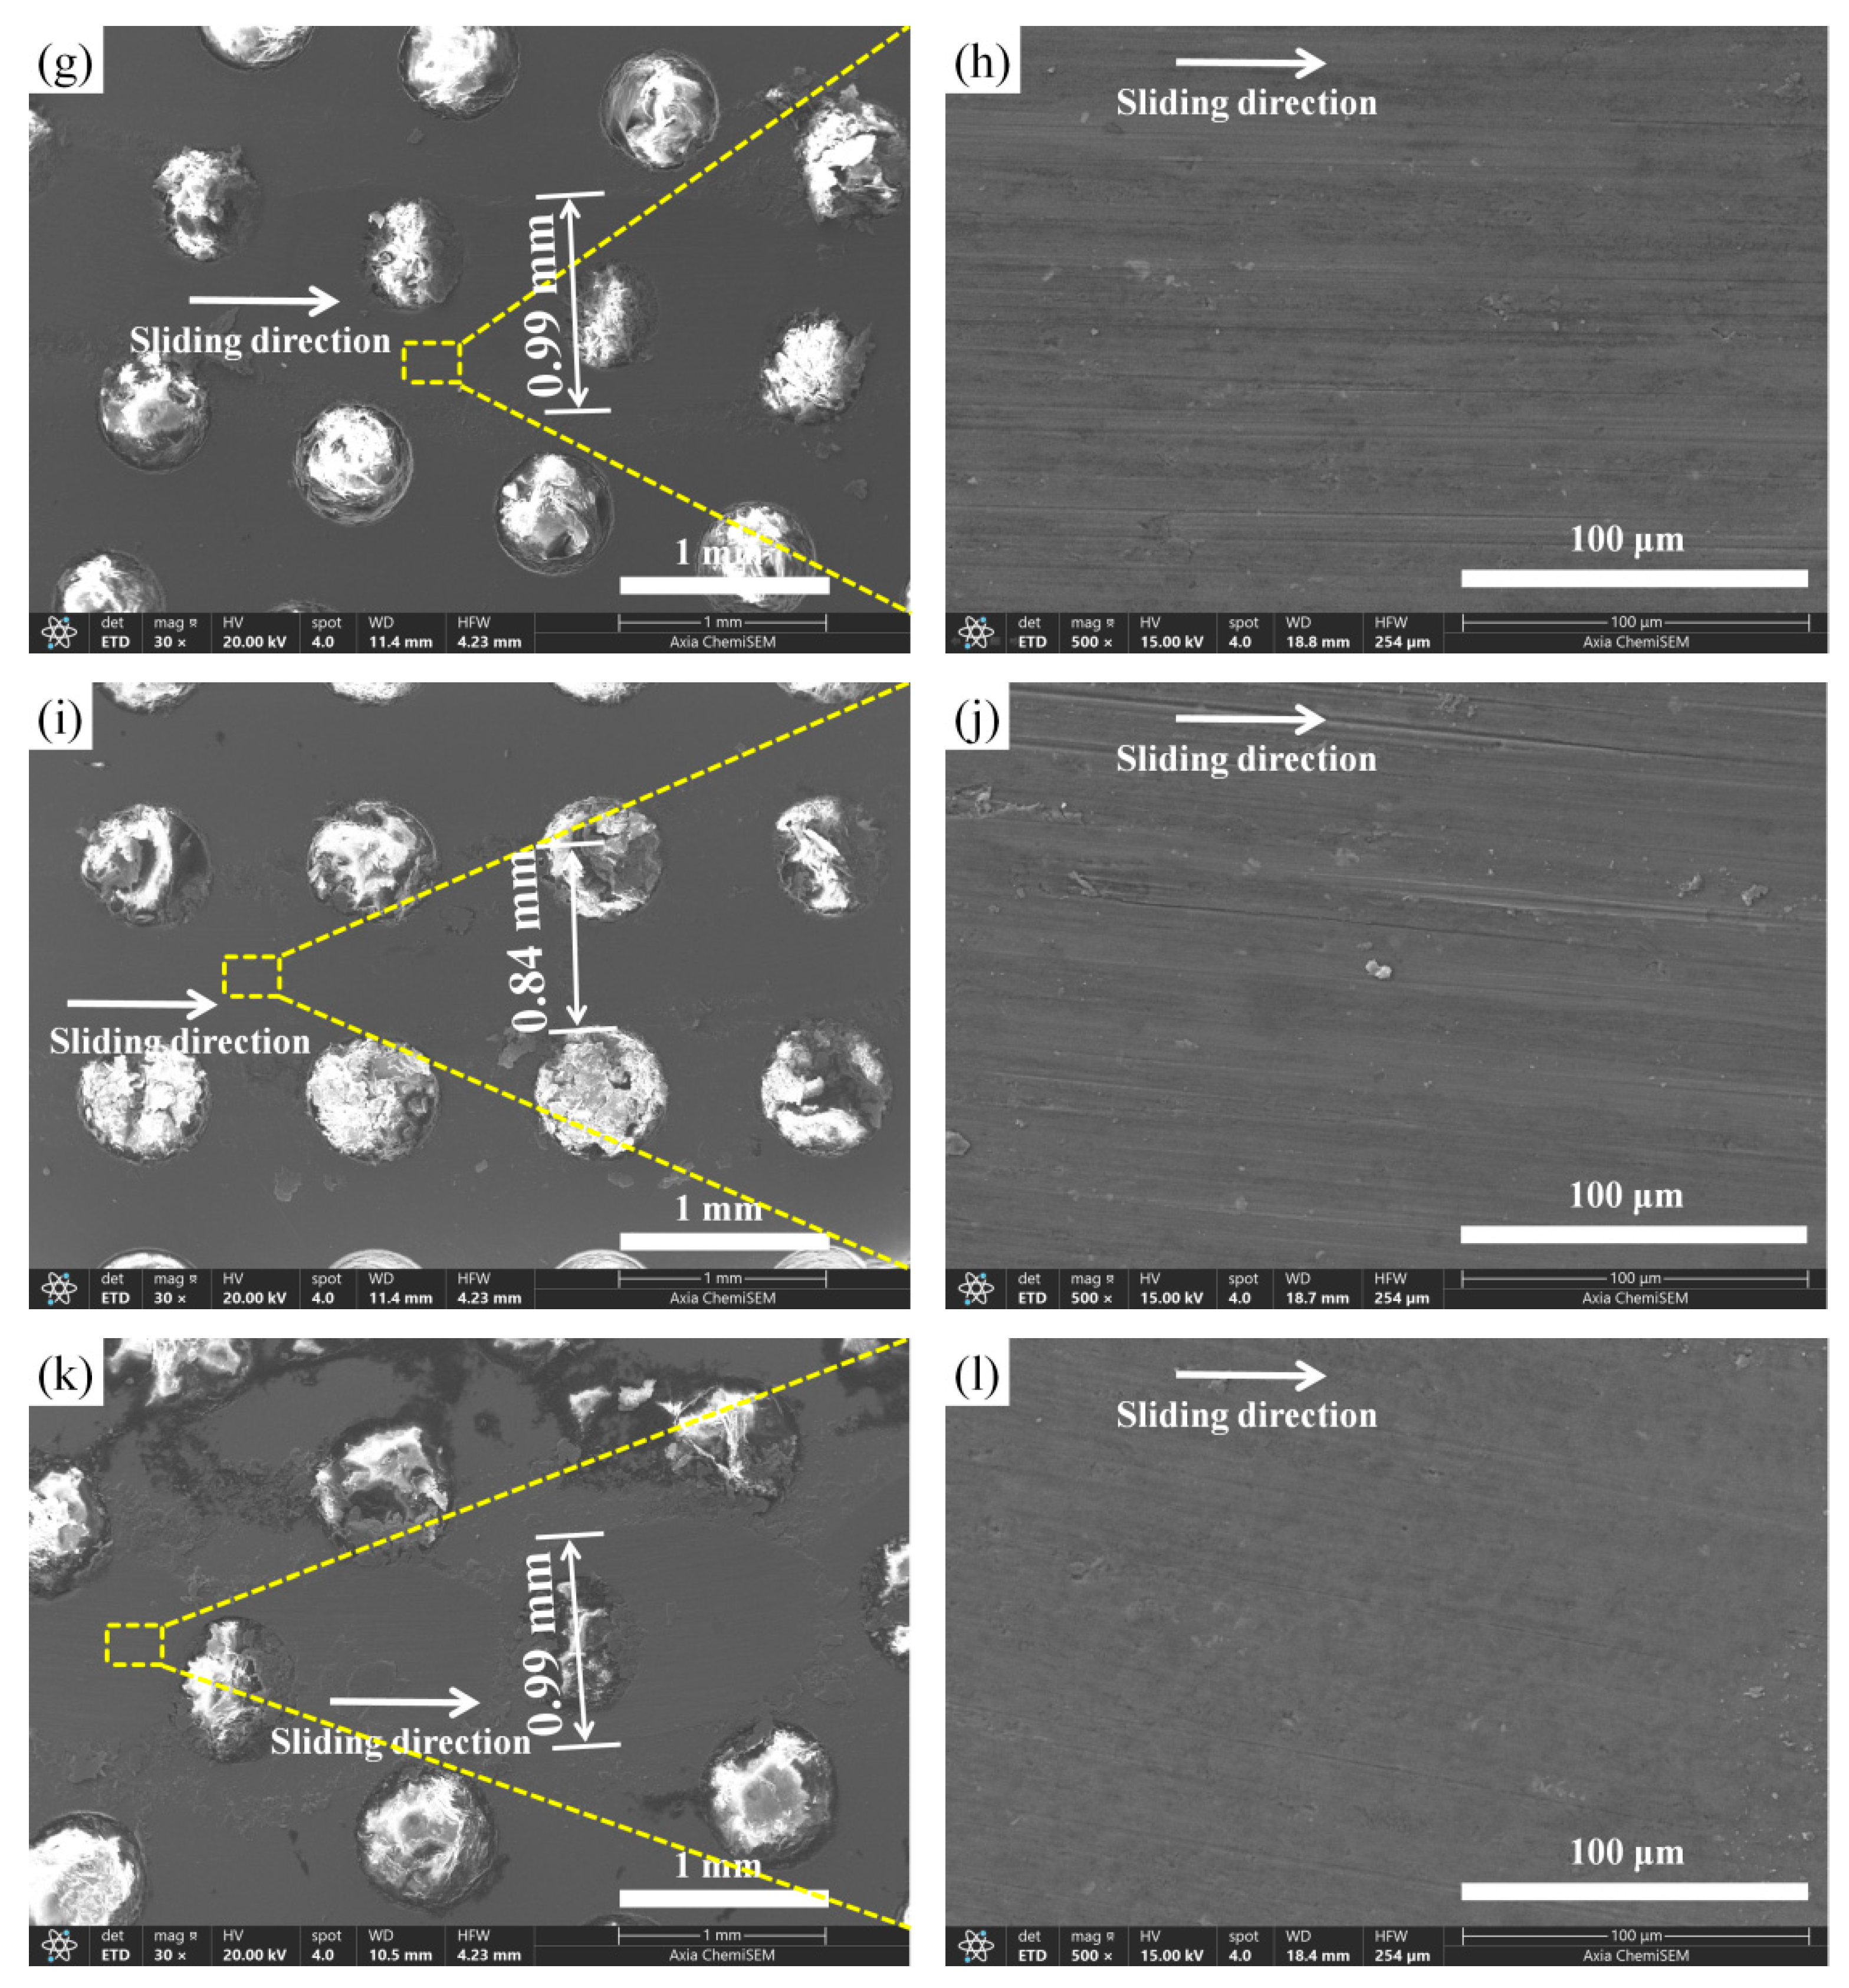
Figure 17 presents the SEM micrographs of wear morphologies for composite surfaces with different diameters. According to measurement and calculation, the wear track widths of textured surfaces with different diameters vary from 0.64 mm to 0.99 mm. As in Figure 15, only shallow and fine plow grooves appear on the composite surfaces, showing typical mild abrasive wear features. Thus, the composite’s surface presents the low-level friction coefficients of 0.044–0.091, which are almost the same as those for the composite surface with different surface densities in Figure 9b. However, owing to a higher pressure range of 305–326 Pa and the more stored paraffin due to a significant depth of 1000 μm, the range of mass loss varied in the range of 0.7–2.8 mg, which is less than that in Figure 10.
As shown in Figure 17a,c, some accumulated wear debris can be observed on the wear track. Especially in Figure 17c, it can be observed that circular textures trap certain wear debris. Nevertheless, due to their small individual area of 450 μm, some debris cannot be fully accommodated inside the textures. This readily induces three-body abrasion, resulting in the maximum wear loss of 2.8 mg for the D2 sample. On the contrary, when the diameter of circular textures increases to 500–650 μm, the textures possess sufficient volume to contain the generated wear debris. Almost all debris is retained within the circular dimples and barely observed on the wear track in Figure 17e–k, which reduces the wear loss to the range of 0.70–1.30 mg.
Based on the combined effect of hydrodynamic pressure and debris storage capacity, the D4 sample showed the best tribological properties due to the greatest hydrodynamic pressure of 326 Pa and an adequate circular diameter of 550 μm.
Although the optimal geometric dimensions of circular texture embedded with paraffin are determined, its applications are limited since the friction operating conditions in this study are fixed at 9 N, 0.4 m/s, and 32 °C sliding against a SUS440C ball. Once the friction operating conditions change, the corresponding optimal circular textures will also vary accordingly. Thus, the conclusions presented in this paper only provide guidelines for the dimensional selection of circular textures.

5. Conclusions

For the purpose of further enhancing the positive effects of paraffin on lowering temperature, friction, and wear, this study compared the tribological properties of the circular-textured surface with different dimensions.
(1)
It was found that increasing the surface density could enhance the hydrodynamic pressure from 245 Pa to 285 Pa, but reduce the contact area so as to lower the load-bearing capacity. As a result, the friction coefficient and wear loss exhibit first a decreasing and then an increasing variation trend. The composite surface with a surface density of 24.2% presents the lowest friction coefficient and wear loss of 0.055 and 2.95 mg.
(2)
The increasing circular diameter could enhance the hydrodynamic pressure from 305 Pa to 326 Pa and the debris storage function, but lower the minimum pressure, thus leading to a low average pressure from the hydrodynamic effect. The composite surface with a circular diameter of 550 μm presents the lowest friction coefficient and wear loss of 0.063 and 0.70 mg.
(3)
The greater depth of 1000 μm for circular texture could store more paraffin to enhance the cooling effect. The maximum temperature reduction reaches 2.08 °C.
The above findings indicate that the optimized textured paraffin composite surface can be applied to dry friction working conditions of helicopter bearing raceways to suppress thermal accumulation and reduce premature wear failure.

Author Contributions

Conceptualization, Q.W.; methodology, Q.W. and H.Y.; software, Q.W. and Z.Z.; validation, Q.W. and H.Y.; formal analysis, Q.W. and H.Y.; investigation, Q.W. and H.Y.; resources, Q.W. and Z.Z.; data curation, H.Y.; writing—original draft preparation, Q.W.; writing—review and editing, Z.Z.; visualization, Q.W. and H.Y.; supervision, Q.W. and Z.Z.; project administration, Q.W.; funding acquisition, Q.W. All authors have read and agreed to the published version of the manuscript.

Funding

This research was funded by the Fundamental Research Funds for the Central Universities (No. NS2024029).

Data Availability Statement

The data presented in this study are available on request from the corresponding author. The data are not publicly available due to privacy or ethical restrictions.

Acknowledgments

This work has been supported by the Fundamental Research Funds for the Central Universities (No. NS2024029). We would like to acknowledge them for their financial support.

Conflicts of Interest

The authors declare no conflicts of interest.

References

  1. Diyoke, G.; Rath, L.; Chafle, R.; Ben, K.; Semann, B. Numerical Simulation of Friction Extrusion: Process Characteristics and Material Deformation due to Friction. Int. J. Mater. Form. 2024, 17, 26. [Google Scholar] [CrossRef] [Scilit]
  2. Tong, Z.; Li, S.; Ruan, X.; Bao, H. Comprehensive First-Principles Analysis of Phonon Thermal Conductivity and Electron-Phonon Coupling in Different Metals. Phys. Rev. B 2019, 100, 144306. [Google Scholar] [CrossRef] [Scilit]
  3. Fernandes, C.; Rocha, D.; Martins, R.; Magalhaes, L.; Seabra, J. Finite Element Method Model to Predict Bulk and Flash Temperatures on Polymer gears. Tribol. Int. 2018, 120, 255–268. [Google Scholar] [CrossRef] [Scilit]
  4. Yu, J.; Zhu, S.; Yuan, W.; Chen, X.; He, L.; Guo, Q. Investigation on the Friction Heat Generation Rate of Ball Bearings at Ultra-high Rotation Speed. Int. J. Adv. Manuf. Technol. 2023, 128, 57–79. [Google Scholar] [CrossRef] [Scilit]
  5. Gunda, K.; Narala, R. Evaluation of Friction and Wear Characteristics of Electrostatic Solid Lubricant at Different Sliding Conditions. Surf. Coat. Technol. 2017, 332, 341–350. [Google Scholar] [CrossRef] [Scilit]
  6. Gao, S.; Xue, W.; Duan, D.; Li, S. Tribological Behaviors of Turbofan Seal Couples from Friction Heat Perspective Under High-Speed Rubbing Condition. Friction 2016, 4, 176–190. [Google Scholar] [CrossRef] [Scilit]
  7. Tian, H.; Wang, D.; Li, G. Influence of Frictional Power Loss on the Thermo-Mechanical Behavior of a High-Speed Ultra-Precision Machine Tool Spindle Bearing. Lubricants 2026, 14, 182. [Google Scholar] [CrossRef] [Scilit]
  8. Awwad, K.; Yousif, B.; Fallahnezhad, K.; Saleh, K.; Zeng, X. Influence of Graphene Nanoplatelets on Mechanical Properties and Adhesive Wear Performance of Epoxy-Based Composites. Friction 2021, 9, 856–875. [Google Scholar] [CrossRef] [Scilit]
  9. Chen, C.; Xie, Y.; Xie, X.; Yan, X.; Huang, R.; Wang, J.; Ren, Z.; Deng, S.; Liao, H. Effects of Substrate Heat Accumulation on the Cold Sprayed Ni Coating Quality: Microstructure Evolution and Tribological Performance. Surf. Coat. Technol. 2019, 371, 185–193. [Google Scholar] [CrossRef] [Scilit]
  10. Li, D.; Ye, J.; Chen, G.; Hu, L.; Wang, Z.; Qian, T.; Zhang, J.; Zi, M.; Liang, C. Performance Evaluation of a Halbach Permanent Magnet Axial Protection Bearing Under Vertical Magnetic Levitation Flywheel Rotor Drop. Lubricants 2026, 14, 40. [Google Scholar] [CrossRef] [Scilit]
  11. Wang, Q.; Jin, X.; Zhou, F. Comparison of Mechanical and Tribological Properties of CrBN Coatings Modified by Ni or Cu Incorporation. Friction 2022, 10, 516–529. [Google Scholar] [CrossRef] [Scilit]
  12. Cong, S.; Li, N.; Zhu, Z.; Wu, L.; Xue, P.; Wang, Z.; Ni, D.; Xiao, B.; Ma, Z. A Comparative Study of Conventional, Dynamic Rotation and Heat-Assisted Friction Stir Welding of Ti-6Al-4V Plates to Reduce Welding Defects. J. Mater. Process. Technol. 2024, 323, 118217. [Google Scholar] [CrossRef] [Scilit]
  13. Gou, X.; Qi, C.; Chen, D. Nonlinear Dynamic Modelling and Analysis of Gear System with Tooth Contact Temperature. J. Mech. Eng. 2015, 51, 71–77. [Google Scholar] [CrossRef] [Scilit]
  14. Gao, Q.; Fan, Y.; Wu, Y.; Li, L. A Harmonic Balance-Based Method to Predict Nonlinear Forced Response and Temperature Rise of Dry Friction Systems Including Frictional Heat Transfer. Nonlinear Dyn. 2023, 111, 14263–14291. [Google Scholar] [CrossRef] [Scilit]
  15. Yang, Y.; Yang, W.; Zhang, B.; Song, Z.; Mi, Z. Influence of Friction Temperature on Radial Crack Formation Inturbine Blade Crown Fins. Acta Aeronaut. Astronaut. Sin. 2025, 46, 292–302. [Google Scholar] [CrossRef]
  16. Abdullah, O.; Schlattmann, J. Thermal Behavior of Friction Clutch Disc Based on Uniform Pressure and Uniform Wear Assumptions. Friction 2016, 4, 228–237. [Google Scholar] [CrossRef] [Scilit]
  17. Zhang, Z.; Feng, W.; Lu, W.; Du, X. Preparation and Tribological Properties of Micro-Textured Diamond/WSx Coatings. Surf. Coat. Technol. 2020, 403, 126369. [Google Scholar] [CrossRef] [Scilit]
  18. Inoue, H.; Kamada, T. Structural Instability of Friction-Induced Vibration by Characteristic Polynomial Plane Applied to Brake Squeal. J. Adv. Mech. Des. Syst. Manuf. 2020, 14, JAMDSM0014. [Google Scholar] [CrossRef] [Scilit]
  19. Zhao, J.; Zhao, B.; Ding, W.; Wu, B.; Han, M.; Xu, J.; Liu, G. Grinding Characteristics of MoS2-Coated Brazed CBN Grinding Wheels in Dry Grinding of Titanium Alloy. Chin. J. Mech. Eng. 2023, 36, 109. [Google Scholar] [CrossRef] [Scilit]
  20. Zheng, Y.; Gou, S.; Feng, X.; Wang, K.; Zhao, M.; Zhang, K.; Zhou, H.; Li, L. Microstructure and Vacuum Tribological Properties of Metal Doped MoS2 Composite Films. Mater. Rep. 2025, 39, 46–52. [Google Scholar] [CrossRef]
  21. Luo, Z.; Liu, T. Preparation and Tribological Properties of AT13/WS2 Composite Coating. J. Anhui Univ. Technol. (Nat. Sci.) 2023, 40, 388–393. [Google Scholar] [CrossRef]
  22. Tang, Z.; Wang, Z.; Xu, L.; Zhang, L.; Han, Z.; Liu, J. Thermal and Tribological Properties of MoS2 Doped Graphite/Copper Composites by Microwave Sintering. J. Mater. Res. Technol. 2021, 15, 6001–6010. [Google Scholar] [CrossRef] [Scilit]
  23. Chen, H.; Meng, Z.; Yi, S. Tribological and Heat Transfer Investigation of Graphene Oxide Coatings on Nylon Rotating Bands in an Artillery System. Nanomaterials 2024, 14, 1943. [Google Scholar] [CrossRef] [Scilit] [PubMed]
  24. Rosenkranz, A.; Marian, M. Combining Surface Textures and MXene Coatings-Towards Enhanced Wear-Resistance and Durability. Surf. Topogr. Metrol. Prop. 2022, 10, 033001. [Google Scholar] [CrossRef] [Scilit]
  25. Marian, M.; Zambrano, D.; Rothammer, B.; Waltenberger, V.; Boidi, G.; Krapf, A.; Merle, B.; Stampfl, J.; Rosenkranz, A.; Gachot, C. Combining Multi-Scale Surface Texturing and DLC Coatings for Improved Tribological Performance of 3D Printed Polymers. Surf. Coat. Technol. 2023, 466, 129682. [Google Scholar] [CrossRef] [Scilit]
  26. Xiao, H.; Yang, D.; Ou, Y.; Zhang, J.; Hu, Y.; Ma, L. Laser Texturing to Improve Wear Resistance of 65Mn Steel Rotary Tiller Blades: Effects of Scanning Speed. Lubricants 2005, 13, 224. [Google Scholar] [CrossRef] [Scilit]
  27. Zhang, H.; Pei, X.; Jiang, X. Anti-Wear Property of Laser Textured 42CrMo Steel Surface. Lubricants 2023, 11, 353. [Google Scholar] [CrossRef] [Scilit]
  28. Zhang, N.; Li, Z.; Hao, M.; Liu, Y.; Ren, B.; Wang, Z. Numerical Simulation and Experimental Investigation on Tribological Performance of SiC Surface with Squamous Groove Micro Texture. Lubr. Sci. 2022, 34, 547–562. [Google Scholar] [CrossRef] [Scilit]
  29. Wang, Y.; Liu, Z. Tribological Properties of High Temperature Self-Lubrication Metal Ceramics with an Interpenetrating Network. Wear 2008, 265, 1720–1726. [Google Scholar] [CrossRef] [Scilit]
  30. Wang, Y.; Yang, Z.; Han, L.; Yang, T.; Wang, S. Wear Behavior and Self Tribofilm Formation of Infiltration-Type TiC/FeCrWMoV Metal Ceramics Under Dry Sliding Conditions. Tribol. Online 2015, 10, 121–126. [Google Scholar] [CrossRef] [Scilit]
  31. Zhang, Y.; Xing, D.; Liu, Z. The Study of High-Temperature Self-lubricating Materials Pore Structure and Lubricants Driven. Lubr. Eng. 2009, 34, 5–8. [Google Scholar] [CrossRef]
  32. Wang, J.; Chang, Y.; Chou, H.; Chu, L. A Study on the Properties of Heat Conduction and Tribology for the Pair of Copper and AlN Film with Phase Change Materials. In Proceedings of the 2017 International Conference on Applied System Innovation; IEEE: New York, NY, USA, 2017; pp. 1587–1590. [Google Scholar] [CrossRef] [Scilit]
  33. Gheisari, R.; Vazquez, M.; Tsigkis, V.; Erdemir, A.; Wooley, K.; Polycarpou, A. Microencapsulated Paraffin as a Tribological Additive for Advanced Polymeric Coatings. Friction 2023, 11, 1939–1952. [Google Scholar] [CrossRef] [Scilit]
  34. Yin, H.; Wang, Q.; Weng, Z.Y.; Wang, Z.; Zhou, Z. Synergistic Lubrication Mechanism of Friction-Induced Melting of Paraffin on the Textured Surface. J. Tribol. 2025, 148, 024604. [Google Scholar] [CrossRef] [Scilit]
  35. Yin, H.; Wang, Q.; Wang, C.; Wu, X. Lubrication of Phase Change of Paraffin Driven by Friction Heat and Its Tribological Properties on Texture Surface. Surf. Technol. 2025, 54, 251–262. [Google Scholar] [CrossRef]
  36. Wang, Q.; Wu, X.; Yin, H.; Zhou, F.; Zhou, Z. Tribology Dependence of Circular Textured Surface on Paraffin and Thermal Conductive Particle Types. Tribol. Int. 2026, 221, 112002. [Google Scholar] [CrossRef] [Scilit]
  37. Tang, J.; Huang, R.; Huang, S.; Qin, Y.; Fan, H. Analysis and Optimization of Thermoelastohydrodynamic Lubrication Characteristics of Tooth Surfaces with Different Micro-Texture Configurations. Lubricants 2026, 14, 159. [Google Scholar] [CrossRef] [Scilit]
  38. Amanov, A.; Watabe, T.; Tsuboi, R.; Sasaki, S. Improvement in the Tribological Characteristics of Si-DLC coating by Laser Surface Texturing Under Oil-Lubricated Point Contacts at Various Temperatures. Surf. Coat. Technol. 2013, 232, 549–560. [Google Scholar] [CrossRef] [Scilit]
  39. Wang, D.; Zhang, W.; Dong, H.; Wei, X.; Hao, W.; Yao, X. Influence of Alumina Abrasive Particles on Wear Behavior of Textured Surfaces Under Heavy-Load Conditions. Lubricants 2025, 13, 553. [Google Scholar] [CrossRef] [Scilit]
  40. Siddaiah, A.; Kasar, A.; Manoj, A.; Menezes, P. Influence of Environmental Friendly Multiphase Lubricants on the Friction and Transfer Layer Formation During Sliding Against Textured Surfaces. J. Clean. Prod. 2019, 209, 1245–1251. [Google Scholar] [CrossRef] [Scilit]
Figure 1. (a) The schematic diagram and (b) optical photo of the tribometer setup.
Lubricants 14 00282 g001
Figure 2. The surface morphology of circle texture with surface densities of (a) 6.8%, (b) 8.7%, (c) 11.6%, (d) 16.2%, (e) 24.2%, and (f) 40.1%.
Lubricants 14 00282 g002
Figure 3. The 3D morphology and the corresponding contours of circle texture with surface densities of (a) 6.8%, (b) 8.7%, (c) 11.6%, (d) 16.2%, (e) 24.2%, and (f) 40.1%.
Lubricants 14 00282 g003aLubricants 14 00282 g003b
Figure 4. The surface morphology of circle texture with diameters of (a) 400 μm, (b) 450 μm, (c) 500 μm, (d) 550 μm, (e) 600 μm, and (f) 650 μm.
Lubricants 14 00282 g004
Figure 5. The 3D morphology and the corresponding contours of circle texture with diameters of (a) 400 μm, (b) 450 μm, (c) 500 μm, (d) 550 μm, (e) 600 μm, and (f) 650 μm.
Lubricants 14 00282 g005aLubricants 14 00282 g005b
Figure 6. The SEM images of circle textures after paraffin filling at different surface densities of (a) 6.8%, (b) 8.7%, (c) 11.6%, (d) 16.2%, (e) 24.2%, and (f) 40.1%.
Lubricants 14 00282 g006
Figure 7. The SEM images of circle textures after paraffin filling at different diameters of (a) 400 μm, (b) 450 μm, (c) 500 μm, (d) 550 μm, (e) 600 μm, and (f) 650 μm.
Lubricants 14 00282 g007
Figure 8. The variation in temperature at the friction interface as a function of sliding distance for circular texture with different surface densities.
Lubricants 14 00282 g008
Figure 9. (a) The variation in the friction coefficient as a function of sliding distance. (b) The average friction coefficient for the composite surface with different surface densities.
Lubricants 14 00282 g009
Figure 10. The mass loss of circular texture with different surface densities.
Lubricants 14 00282 g010
Figure 11. The variation in temperature at the friction interface as a function of sliding distance for circle texture with different diameters.
Lubricants 14 00282 g011
Figure 12. (a) The variations in the friction coefficient as a function of sliding distance. (b) The average friction coefficient for composite surfaces with different circular diameters.
Lubricants 14 00282 g012
Figure 13. The mass loss for composite surfaces with different circular diameters.
Lubricants 14 00282 g013
Figure 14. The pressure distribution nephograms of (a) S1, (b) S2, (c) S3, (d) S4, (e) S5, and (f) S6 composite surfaces.
Lubricants 14 00282 g014
Figure 15. The SEM images of wear track morphologies for (a,b) S1, (c,d) S2, (e,f) S3, (g,h) S4, (i,j) S5, and (k,l) S6 composite surfaces.
Lubricants 14 00282 g015aLubricants 14 00282 g015b
Figure 16. The pressure distribution nephograms for (a) D1, (b) D2, (c) D3, (d) D4, (e) D5, and (f) D6 composite surfaces.
Lubricants 14 00282 g016
Figure 17. The SEM images of wear track morphologies for (a,b) D1, (c,d) D2, (e,f) D3, (g,h) D4, (i,j) D5, and (k,l) D6 composite surfaces.
Lubricants 14 00282 g017aLubricants 14 00282 g017b
Table 1. The chemical composition of 7075 aluminum alloy.
ElementAlZnMgCuFeSiCrMnTi
wt%89.095.612.601.740.300.290.210.110.05
Table 2. Textural dimensions on 7075 aluminum alloy disks.
Samples CodeSurface Density/%Diameter/μmDepth/μm
S16.8500500
S28.7500500
S311.6500500
S416.2500500
S524.2500500
S640.1500500
D124.24001000
D224.24501000
D324.25001000
D424.25501000
D524.26001000
D624.26501000
Table 3. Thermo-physical properties of paraffin.
CharacteristicValue
Density/kg·m−3 (at 293.15 K)880
Specific heat/J·kg−1·K−12000
Thermal conductivity/W·m−1·K−10.2
Dynamic viscosity/Pa·s (at 310.15 K)0.0044
Kinematic viscosity/cSt0.571
Thermal expansion coefficient/K−10.00583
Latent heat of dissolution/J·kg−1262,370
Melting temperature/K309.24
Table 4. The maximum pressure of composite surfaces with different surface densities and circular diameters.
Samples CodeS1S2S3S4S5S6D1D2D3D4D5D6
Maximum pressure (Pa)245252263266285266305313320326326324
Disclaimer/Publisher’s Note: The statements, opinions and data contained in all publications are solely those of the individual author(s) and contributor(s) and not of MDPI and/or the editor(s). MDPI and/or the editor(s) disclaim responsibility for any injury to people or property resulting from any ideas, methods, instructions or products referred to in the content.