Article

EEMD-TFMST-Based Vibration Feature Identification and Performance Analysis of Water-Lubricated Stern Bearings Under Long-Term Service Conditions

School of Transportation and Logistics Engineering, Wuhan University of Technology, Wuhan 430063, China
*
Authors to whom correspondence should be addressed.
Lubricants 2026, 14(6), 217; https://doi.org/10.3390/lubricants14060217
Submission received: 6 May 2026 / Revised: 23 May 2026 / Accepted: 24 May 2026 / Published: 27 May 2026
(This article belongs to the Special Issue Friction–Vibration Interactions, 2nd Edition)

Abstract

Under long-term service conditions, vibration signals of water-lubricated stern bearings exhibit strong nonlinearity, nonstationarity, and multicomponent coupling, which makes accurate feature extraction challenging. To address this issue, this study proposes a progressive EEMD-TFMST-based analysis framework that combines spectral localization, adaptive signal decomposition, noise suppression, and high-resolution time–frequency characterization. Rotational-speed tests and long-duration wear tests were conducted using an SSB-100 test rig, and the lubrication regimes were identified based on friction coefficient variations. The results show that the dominant vibration features are strongly dependent on the lubrication regime and wear stage. With increasing rotational speed, the vibration response evolves from isolated peaks near 400 and 600 Hz under boundary lubrication to enhanced 300–400 Hz components under mixed lubrication, and further to broadband responses within 0–1000 Hz under hydrodynamic lubrication, with dominant peaks mainly concentrated in the 300–500 Hz range. With increasing rotational speed, the lubrication regime gradually changes from boundary lubrication to hydrodynamic lubrication, accompanied by a transition of vibration energy from single-IMF concentration to broadband distribution across multiple IMF components. Long-term operation induces stage-dependent changes in lubrication and vibration behavior: moderate wear improves vibration stability, whereas excessive wear deteriorates lubrication, increases the proportion of mixed lubrication, and promotes energy migration toward lower frequencies with additional high-frequency excitation. Under prolonged high-speed operation, lubrication degradation further induces broadband vibration. The proposed method enables accurate quantification of vibration features and provides a useful basis for service-performance evaluation and early fault warning of water-lubricated stern bearings.

1. Introduction

Vibration response is a direct indicator of the service condition of water-lubricated stern bearings, and its accurate identification provides an important basis for performance evaluation and early fault warning during long-term operation [1]. Owing to their low friction, environmental compatibility, and high-temperature resistance, water-lubricated bearings are widely used in marine propulsion systems and hydropower units. Compared with oil-lubricated bearings, they operate with a lower-viscosity lubricant and a thinner water film, and their lubrication behavior is strongly affected by temperature, load, and medium impurities. These coupled factors induce nonlinear hydrodynamic behavior of the water film, leading to vibration signals with pronounced nonlinearity, nonstationarity, and multicomponent coupling. Therefore, extracting effective bearing-related features from such signals is essential for evaluating the service performance of water-lubricated stern bearings.
Various methods have been developed for nonlinear and nonstationary mechanical vibration analysis, including time-domain statistics, frequency-domain analysis, modal decomposition, time-frequency analysis, and deep learning [2,3]. Conventional approaches, such as statistical indicators and Fourier spectral analysis, use peak value, kurtosis, root mean square, and spectral amplitude distribution to characterize overall signal energy and frequency-band variations [4,5]. Although simple and efficient, these methods rely on the assumption of signal stationarity and are therefore unsuitable for vibration signals generated by water-lubricated stern bearings under fluid lubrication, cavitation erosion, and variable loads. As a result, they have limited ability to extract specific bearing-related characteristic frequencies.
To overcome these limitations, empirical mode decomposition (EMD), ensemble empirical mode decomposition (EEMD), complete ensemble empirical mode decomposition with adaptive noise (CEEMDAN), and related methods have attracted increasing attention [6,7,8]. These methods adaptively decompose complex signals into intrinsic mode functions (IMFs), enabling preliminary extraction of hidden fault features without the stationarity assumption [9,10,11]. However, conventional EMD suffers from severe mode mixing [12,13]. Although improved algorithms can partly alleviate this problem, decomposition accuracy remains insufficient for multicomponent coupled vibration signals from water-lubricated stern bearings [14,15,16].
Variational mode decomposition (VMD) was later proposed to address the inherent limitations of EMD from a theoretical perspective [17,18]. By constructing a variational model, VMD enables adaptive frequency-domain segmentation and improves decomposition accuracy and stability. Nevertheless, VMD is sensitive to initial parameter settings, and its adaptive feature extraction capability under variable operating conditions of water-lubricated bearings still requires improvement [17,18,19].
Time-frequency analysis and deep learning have also provided new tools for weak bearing-fault feature extraction [19,20,21]. Advanced time-frequency methods, such as time-frequency reassignment and time-frequency multi-synchrosqueezing transform (TFMST), improve resolution and energy concentration by reconstructing time-frequency distributions, thereby facilitating the identification of weak transient features [22,23,24]. Deep learning models, including convolutional neural networks and long short-term memory networks, have promoted end-to-end fault diagnosis under complex operating conditions [25,26]. However, time-frequency methods are susceptible to cross-term interference, whereas deep learning methods depend strongly on sample availability [27,28,29]. Used independently, neither approach fully satisfies the requirements for vibration feature analysis of water-lubricated stern bearings.
Recent research on vibration signal analysis of water-lubricated bearings has increasingly emphasized multi-method fusion, typically combining modal decomposition, time-frequency analysis, and deep learning. However, most studies focus on multiscale extensions of a single method or simple concatenation of different algorithms. A systematic multistage framework tailored to vibration feature analysis of water-lubricated bearings is still lacking. In particular, a complete procedure from coarse frequency-domain inspection to refined feature characterization has not been established, limiting the ability to reveal long-term vibration evolution and to support early fault localization and quantitative service-performance evaluation.
To address these issues, this study proposes an EEMD-TFMST-based vibration feature extraction method and establishes a progressive framework from coarse inspection to refined characterization. Spectral analysis is first used to identify and localize abnormal frequency bands. EEMD is then applied for adaptive decomposition and noise suppression within the target bands. Finally, TFMST is used for high-resolution time-frequency analysis and quantitative extraction of fault-related features. Based on rotational-speed and wear tests conducted on a marine water-lubricated stern bearing test rig, the effects of rotational speed and operating duration on bearing vibration characteristics are investigated, providing technical support for vibration control, fault diagnosis, and service-performance evaluation.

2. Frequency-Spectrum Feature Identification of Water-Lubricated Stern Bearings

An EEMD-TFMST-based vibration feature identification model is proposed for water-lubricated stern bearings. The novelty of the proposed model does not lie in developing a new mathematical form of EEMD or TFMST, but in establishing a progressive vibration feature identification framework specifically for water-lubricated stern bearings under long-term service conditions. Compared with conventional single-method approaches or simple algorithm combinations, the proposed framework first uses FFT to perform coarse frequency-domain localization and identify operating-condition-related frequency bands. EEMD is then used to suppress mode mixing and adaptively decompose the nonlinear and nonstationary vibration signal, after which the core IMF components with dominant energy contributions are selected. Finally, TFMST is applied to the selected IMF components to obtain high-resolution time–frequency energy ridges and frequency-band features. By associating these extracted features with lubrication-regime transition and wear-stage evolution, the proposed model provides a more interpretable basis for vibration feature identification, service-performance evaluation, and early fault warning of water-lubricated stern bearings.

2.1. Ensemble Empirical Mode Decomposition

EEMD is an adaptive signal decomposition technique based on a noise-assisted mechanism and represents an improvement and optimization of conventional EMD. EMD can adaptively decompose a complex signal into several IMFs; however, it suffers from mode mixing. The fundamental cause of this limitation lies in the inadequacy of the extrema detection mechanism. When the signal contains components with close frequencies or intermittent components, envelope fitting may lead to inaccurate extrema distribution, thereby weakening the physical significance of the IMFs and hindering their application in practical engineering.
The key innovation of EEMD is the introduction of a noise-assisted ensemble averaging mechanism. Its theoretical basis can be summarized in two aspects. First, white noise has a uniformly distributed spectrum, which provides a uniform reference scale over the entire frequency domain. Second, by repeatedly adding different white-noise sequences and performing ensemble averaging, noise interference can be statistically canceled while the essential features of the original signal are retained. The procedure of the EEMD algorithm is as follows:
Step 1: Set the noise amplitude coefficientα, with a typical range of 0.1~0.4. Calculate the standard deviation σ of the original vibration signal, and define the noise intensity as ε = α × σ.
Step 2: Generate N Gaussian white-noise sequences with zero mean and variance ε2. Each noise sequence is separately added to the original signal to obtain N noise-assisted signals.
Step 3: Perform EMD decomposition on each noise-assisted signal. Specifically, the local maxima and minima of the signal are first identified, and the upper and lower envelopes are constructed using cubic spline interpolation. The local mean is then calculated, and the detail component is extracted. This sifting process is repeated until the detail component satisfies the IMF conditions, yielding one IMF component. After subtracting this IMF component from the signal, the above process is repeated until the residual signal becomes a monotonic function or its amplitude is smaller than a preset threshold. Finally, a set of IMF components and one residual term are obtained.
Step 4: Repeat Steps 2 and 3 until all N trials are completed.
Step 5: Average the IMF components of the same order obtained from all trials. The averaged IMF components and the averaged residual term are taken as the final EEMD decomposition results.
The stopping criterion for the sifting process is usually defined using the standardized standard deviation SD [8]:
S D = t | h prev ( t ) h ( t ) | 2 h prev 2 ( t ) < δ
where δ is a preset threshold (typically ranging from 0.2~0.3). Through the above iterative process, the j-th IMF component cᵢⱼ(t) is obtained. The residual component, rⱼ(t) = rj−1(t) − cᵢⱼ(t), is then further decomposed until the residual term becomes a monotonic function or a constant. After EMD decomposition is completed for each xi(t), a set of corresponding IMF components cᵢⱼ(t) is obtained. The j-th IMF components are then subjected to ensemble averaging, which can be mathematically expressed as [2]:
c ¯ j ( t ) = 1 N i = 1 N c i j ( t )
where N denotes the total number of ensemble trials, namely the total number of times that white noise is added and EMD decomposition is performed. According to the law of large numbers, when the number of ensemble trials N approaches infinity (N → ∞), the EEMD decomposition result statistically converges to the true decomposition state of the original signal, lim N c ¯ j ( t ) = c j ( t ) (convergence in probability). In addition, to quantitatively evaluate the importance of each IMF component, the energy proportion of each IMF can be calculated. The energy of the j-th IMF is defined as E j = Σ | c ¯ j ( t ) | 2 and its energy proportion is given by [4]:
P j = E j k = 1 M E k × 100 %
where M is the total number of IMF components. An IMF component with a higher energy proportion carries more dominant vibration energy from the original signal. Therefore, in this study, the core IMF with the highest energy proportion is selected as the input for subsequent analysis.
In the multistage vibration feature extraction framework constructed in this study, EEMD serves as a key step. Constrained by the operating-condition-related frequency band determined using the FFT, EEMD is responsible for signal denoising and preliminary feature extraction. Specifically, Gaussian white noise is first added to the original signal to suppress mode mixing. The noise-added signals are then decomposed repeatedly using EEMD, and the added noise is eliminated through ensemble averaging, yielding a stable set of IMF components. Subsequently, the energy proportions of all IMF components are calculated and ranked, and the core IMF with the highest energy proportion is extracted. This core IMF provides a high-quality feature carrier for the subsequent high-resolution time–frequency analysis based on the TFMST.

2.2. TFMST Feature Extraction Algorithm

TFMST is an advanced high-resolution time–frequency analysis method. Its core principle is to integrate the multiscale analysis capability of wavelet transform with time–frequency synchrosqueezing-based reassignment. Conventional time–frequency analysis methods, such as the short-time Fourier transform (STFT) and wavelet transform, are constrained by the Heisenberg uncertainty principle and therefore cannot simultaneously achieve optimal time and frequency resolutions. The synchrosqueezing transform alleviates this limitation by reassigning time–frequency energy to more accurate frequency locations, thereby improving analytical accuracy and reliability. The specific implementation procedure of TFMST mainly includes the following steps:
Step 1: The target signal is processed using the continuous wavelet transform (CWT) to obtain its wavelet coefficient representation Wₓ(a,b) in the scale–time plane. The complete definition is given as follows [20]:
W x ( a , b ) = + x ( t ) ψ a , b * ( t ) d t = 1 a + x ( t ) ψ * t b a d t
where a > 0 is the scale factor, b is the translation factor, and ψ(t) denotes the mother wavelet. Subsequently, the instantaneous frequency corresponding to each time–scale point is calculated as [20]:
ω x ( a , b ) = 1 2 π b arg W x ( a , b )
Accurate calculation of the instantaneous frequency is a key prerequisite for time–frequency synchrosqueezing. Physically, it represents the true frequency component of the signal at a specific time and scale.
Step 2: Based on the calculated instantaneous frequency, the wavelet coefficients are reassigned from the scale–time plane to the frequency–time plane, thereby completing the first-order synchrosqueezing transform. Its mathematical expression is given by [24]:
T x ( 1 ) ( ω , b ) = 0 W x ( a , b ) δ ω ω x ( a , b ) d a a 3
Step 3: To further improve the resolution and accuracy of time–frequency analysis, the TFMST method performs a second-order synchrosqueezing transform through second-order and higher-order iterative reassignment. First, the second-order instantaneous frequency is defined as [21]:
ω ~ x ( 2 ) ( a , b ) = ω x ( a , b ) + ω x ( a , b ) a ( a a ^ )
where â denotes the reference scale. The first-order synchrosqueezed result is then reassigned again as follows [21]:
T x ( 2 ) ( ω , b ) = 0 T x ( 1 ) ( ω , b ) δ ω ω ~ x ( 2 ) ( ω , b ) d ω
The second-order synchrosqueezing transform fully accounts for the first-order derivative information of the instantaneous frequency, enabling more accurate localization of the true distribution characteristics of time–frequency energy.
In this study, TFMST is adopted as the core method for high-resolution time–frequency analysis. Based on the key IMF components selected by EEMD, time–frequency feature extraction is performed from two perspectives. First, according to the distribution characteristics of the time–frequency matrix along the frequency axis, the vibration frequency band corresponding to each IMF component is determined, thereby defining the effective frequency intervals of vibration signals under different operating conditions. Second, the continuous high-energy frequency trajectories in the time–frequency plane, namely energy ridges, are identified to visually reveal the concentration and distribution patterns of vibration energy. The energy ridge (R(b)) can be defined as the frequency trajectory that maximizes the time–frequency energy at each time instant b [22]:
R ( b ) = arg max ω T x ( 2 ) ( ω , b ) 2
By extracting two key types of features, namely the frequency-band range and the energy ridge, core evaluation indicators for comparative analysis under different operating conditions are established. These indicators provide accurate and reliable time–frequency data support for investigating the mechanisms by which rotational speed, operating duration, and other factors affect the vibration characteristics of water-lubricated stern bearings.

2.3. Vibration Feature Identification Workflow

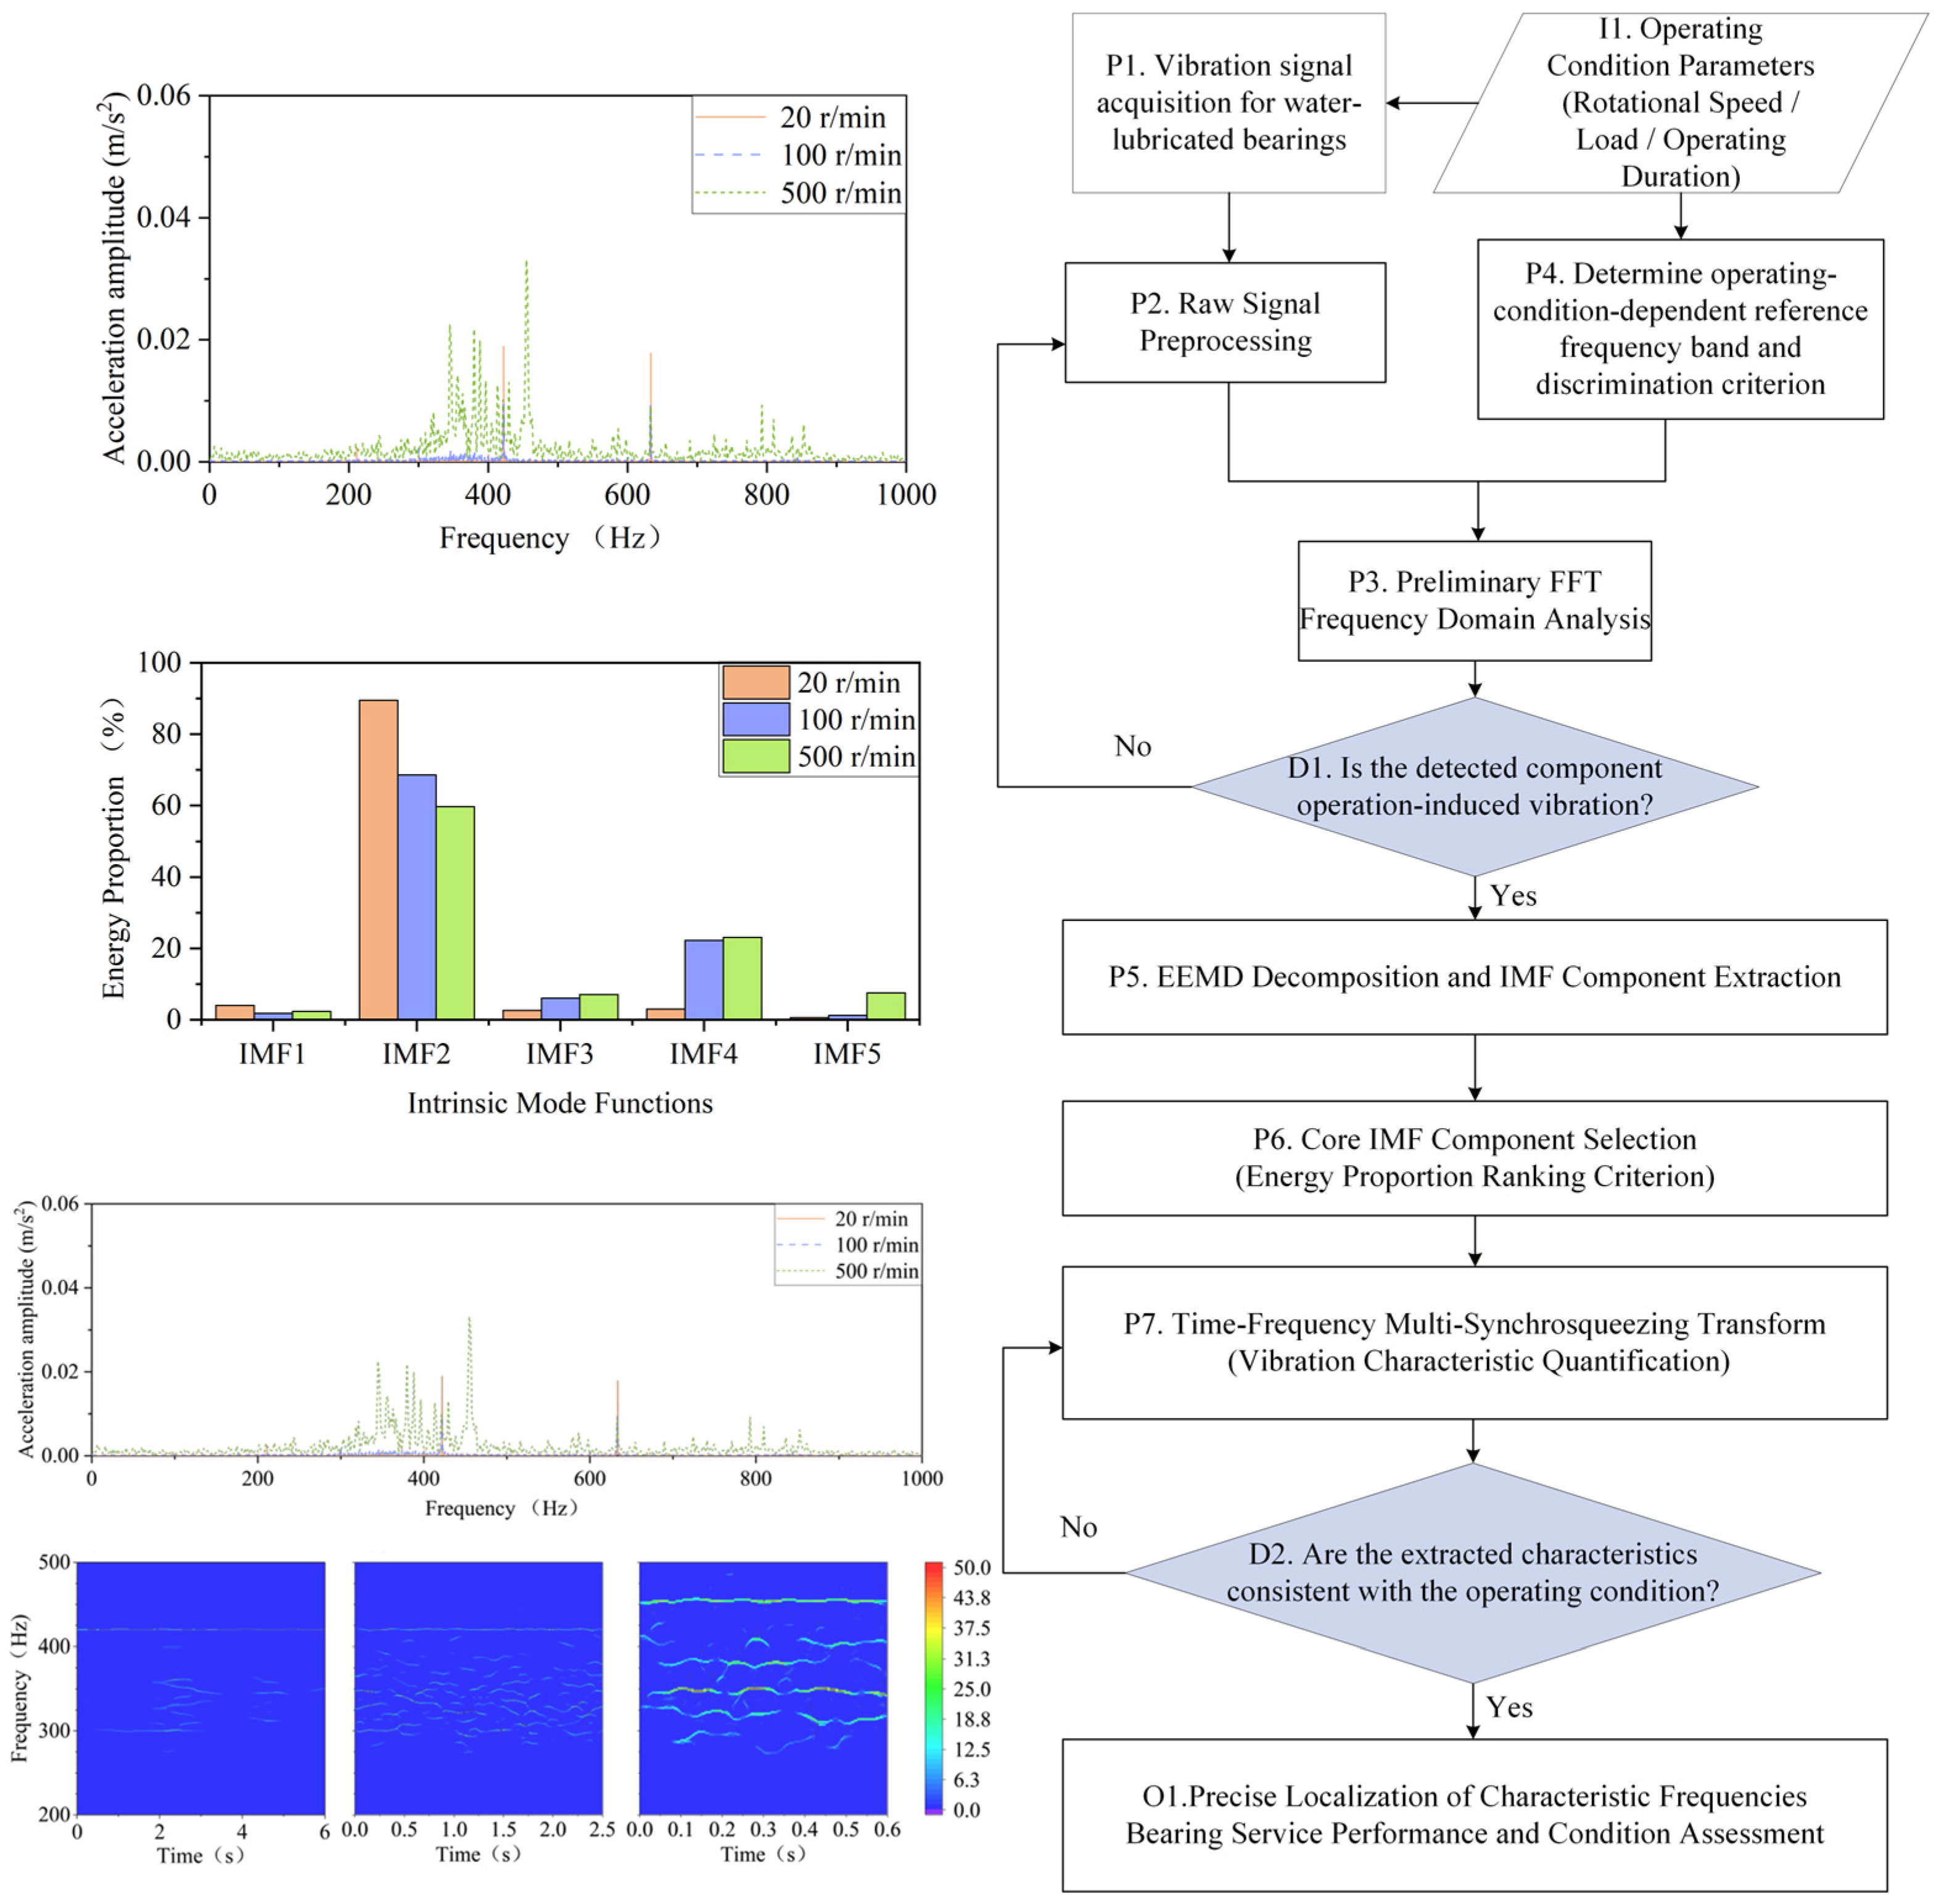
This study proposes an EEMD-TFMST-based method for vibration feature identification of water-lubricated stern bearings, as illustrated in Figure 1. Considering the critical role of water-lubricated stern bearings in marine propulsion systems and the nonstationary and nonlinear characteristics of their vibration signals, a progressive analytical framework is established, spanning from preliminary frequency-domain detection to refined feature quantification, with the aim of improving the accuracy and efficiency of fault diagnosis. Specifically, the acquired time-domain vibration signals are first transformed into the frequency domain by means of the FFT, so that the distribution range of abnormal frequency components can be rapidly identified. Based on the energy distribution across different frequency bands, interference bands can be clearly separated from operating-condition-related bands, thereby enabling coarse-grained frequency-domain inspection and determining the target frequency bands for EEMD decomposition, which lays the foundation for subsequent analysis. Subsequently, the adaptive decomposition capability of EEMD is employed to perform multiscale signal decomposition, noise filtering, and feature screening within the target frequency bands. By calculating the energy entropy or correlation coefficient of each IMF component, the core IMF component with the most concentrated energy and the strongest correlation with fault features is extracted, thus providing TFMST with a high-purity and highly relevant feature carrier. Finally, by taking advantage of the high-resolution time–frequency analysis capability of the TFMST, the core IMF component selected by EEMD is subjected to time–frequency reconstruction and feature extraction. Through the resulting time–frequency representation, the time-varying behavior of fault features and their energy concentration regions can be characterized accurately, ultimately enabling precise identification of fault features and analysis of energy concentration. This method therefore provides a reliable technical approach for condition monitoring and fault diagnosis of water-lubricated stern bearings.

3. Test Rig and Experimental Scheme

3.1. Experimental Equipment

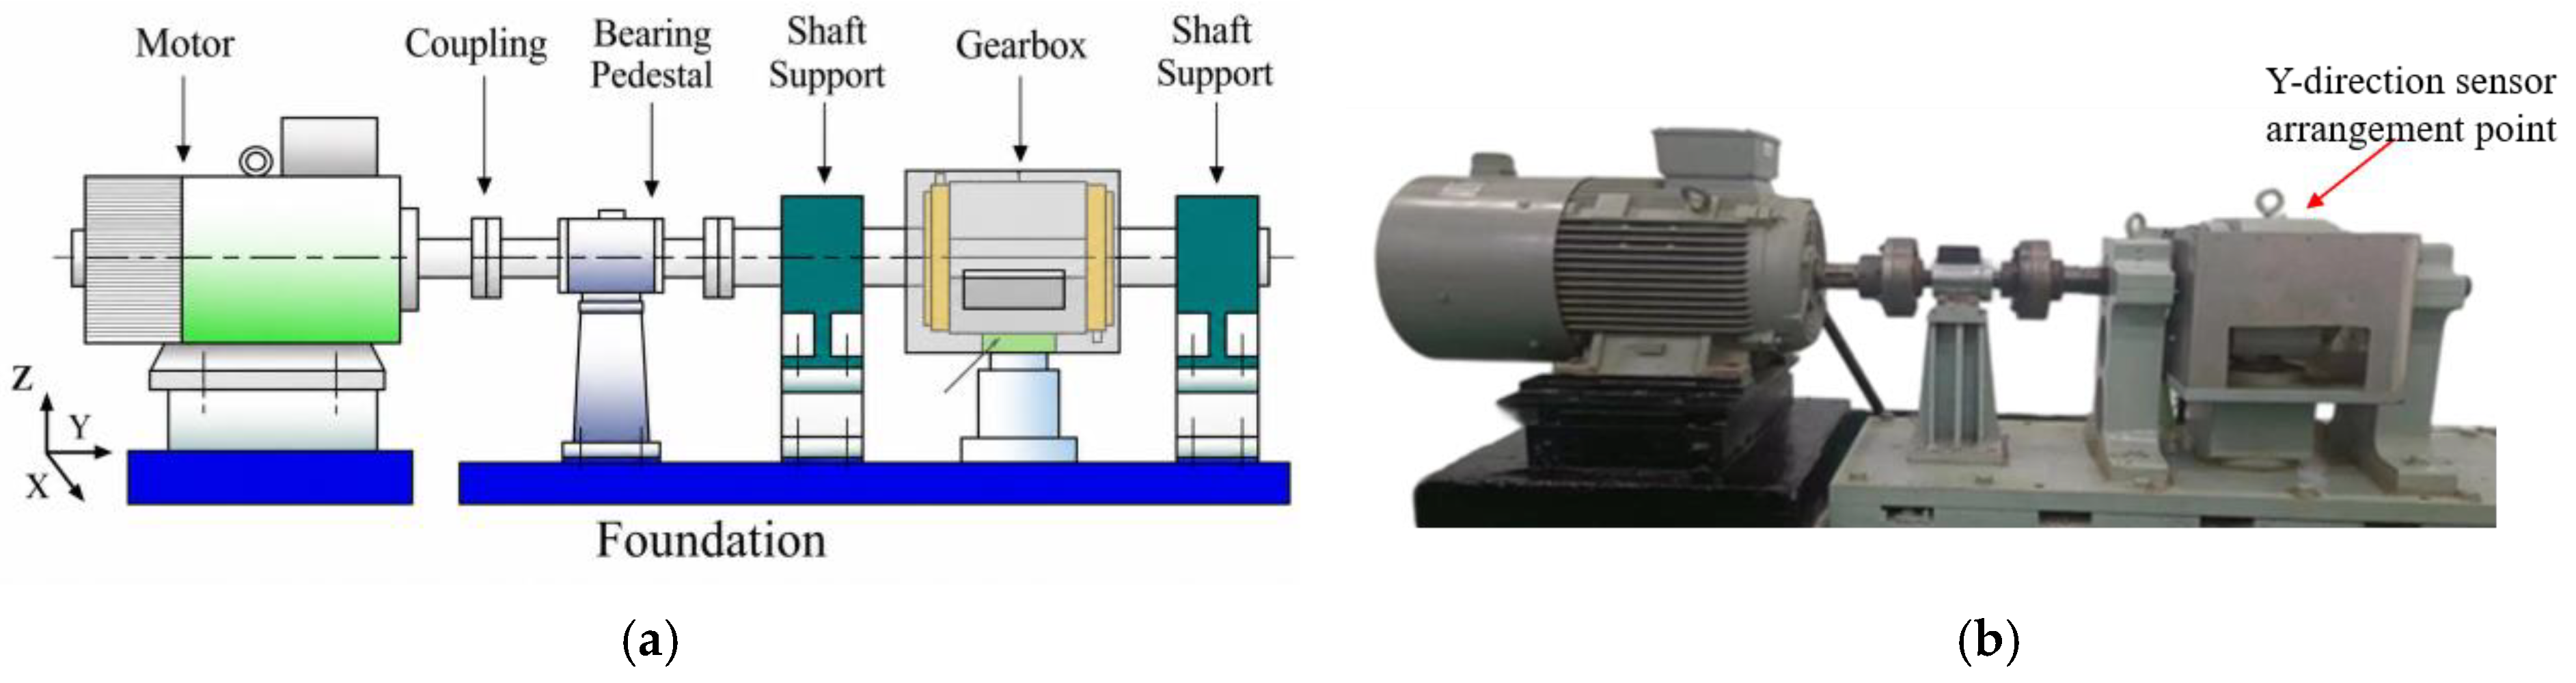
The tribological performance tests of the water-lubricated bearing were conducted on an SSB-100 marine water-lubricated stern-shaft test rig. As shown in Figure 2, the test rig mainly consists of five modules: a driving module, a test module, a loading module, a lubrication module, and a measurement module. The test shaft was made of 45 steel, and the journal was fitted with a ZQSn10-2 bushing. The bushing had a length of 140 mm and an outer diameter of approximately 100 mm. The coordinated operation of these modules provided a stable mechanical platform for the subsequent rotational-speed characteristic and wear-resistance tests.
The driving module served as the power unit of the test rig and was used to accurately control different rotational-speed conditions. In this study, a Siemens 1LE0001-2BC23-3AA4 three-phase asynchronous motor was employed as the power source. Under the 50 Hz power-frequency condition, the motor had a rated power of 30 kW and a rated speed of 980 r/min. Under the 60 Hz variable-frequency condition, its rated power and rated speed were 33.5 kW and 1175 r/min, respectively. Therefore, the motor could stably cover a speed output range of 980–1175 r/min, fully satisfying the power requirements of the test system under variable-speed and variable-load operating conditions.
With the driving module in operation, the measurement module was used to acquire the vibration and torque signals of the bearing, thereby providing data support for the subsequent feature analysis. The vibration acceleration signal was measured using a Donghua 1A116E sensor with a sensitivity of 1.011 mV/(m·s−2). As shown in Figure 2b, the sensor was installed along the main load-bearing direction of the bearing, namely the Y direction, to accurately capture the dynamic response of the bearing.
The vibration and torque signals were synchronously acquired using a Donghua DH5922 dynamic signal acquisition and analysis system. The sampling frequency was set to 25.6 kHz to ensure that the broadband vibration characteristics of the bearing could be fully captured. The torque sensor was a GB-DTS-500 model, with a measurement range of 500 N·m, an accuracy of 0.5% F.S., and a supply voltage of 24 VDC. The sampling frequency of the torque signal was also set to 25.6 kHz. To reduce experimental errors, data acquisition was repeated three times under each test condition, and the average value was used as the final test result.

3.2. Experimental Scheme

Throughout the tests, a constant specific pressure of Pₘ = 0.50 MPa and room-temperature conditions were maintained. The lubrication system adopted water lubrication with a flow rate of Q = 23 L/min, and water was used as the lubricating medium. This configuration was intended to simulate the lubrication environment of a ship during actual navigation, thereby ensuring, to the greatest extent possible, a high degree of consistency between the experimental conditions and practical engineering conditions.
The tests consisted of two stages: rotational-speed characteristic tests and wear-resistance tests. The rotational-speed characteristic tests were conducted, on the one hand, to improve the running-in condition of the friction pair and, on the other hand, to investigate the influence of different rotational speeds on the vibration characteristics of the water-lubricated stern bearing. These tests were also used to clarify the differences in the vibration responses of the bearing under different lubrication states, thereby providing a scientific basis for selecting representative operating conditions for the subsequent wear-resistance tests.
The wear-resistance tests aimed to investigate the influence of bearing-liner wear on the vibration characteristics and service performance of the bearing during long-term operation. They were also designed to quantify the degradation process of the bearing service performance and ultimately provide reliable data support for fault early warning and life assessment of water-lubricated stern bearings.
The specific test conditions are listed in Table 1. The rotational-speed characteristic tests covered the full speed range of 10–600 r/min, with ten rotational-speed conditions in total. The speed was adjusted in descending order from 600 r/min to 10 r/min. At each speed, the system was operated steadily for 30 min until the system parameters reached a stable state, after which data acquisition was initiated and the test was completed.
For the wear-resistance tests, ten operating conditions were also set within the same speed range. The test process was divided into five continuous cycles, with a total duration of 1000 h. In each cycle, the speed was first increased to 600 r/min and then decreased to 10 r/min. Each operating condition was maintained for 10 h. The load and lubrication conditions were kept consistent with those used in the rotational-speed characteristic tests throughout the entire process. Vibration data were collected at three key time points, namely 100 h, 500 h, and 1000 h, to capture the performance changes at different wear stages.

4. Results and Discussion

4.1. Effect of Rotational Speed on Vibration Characteristics

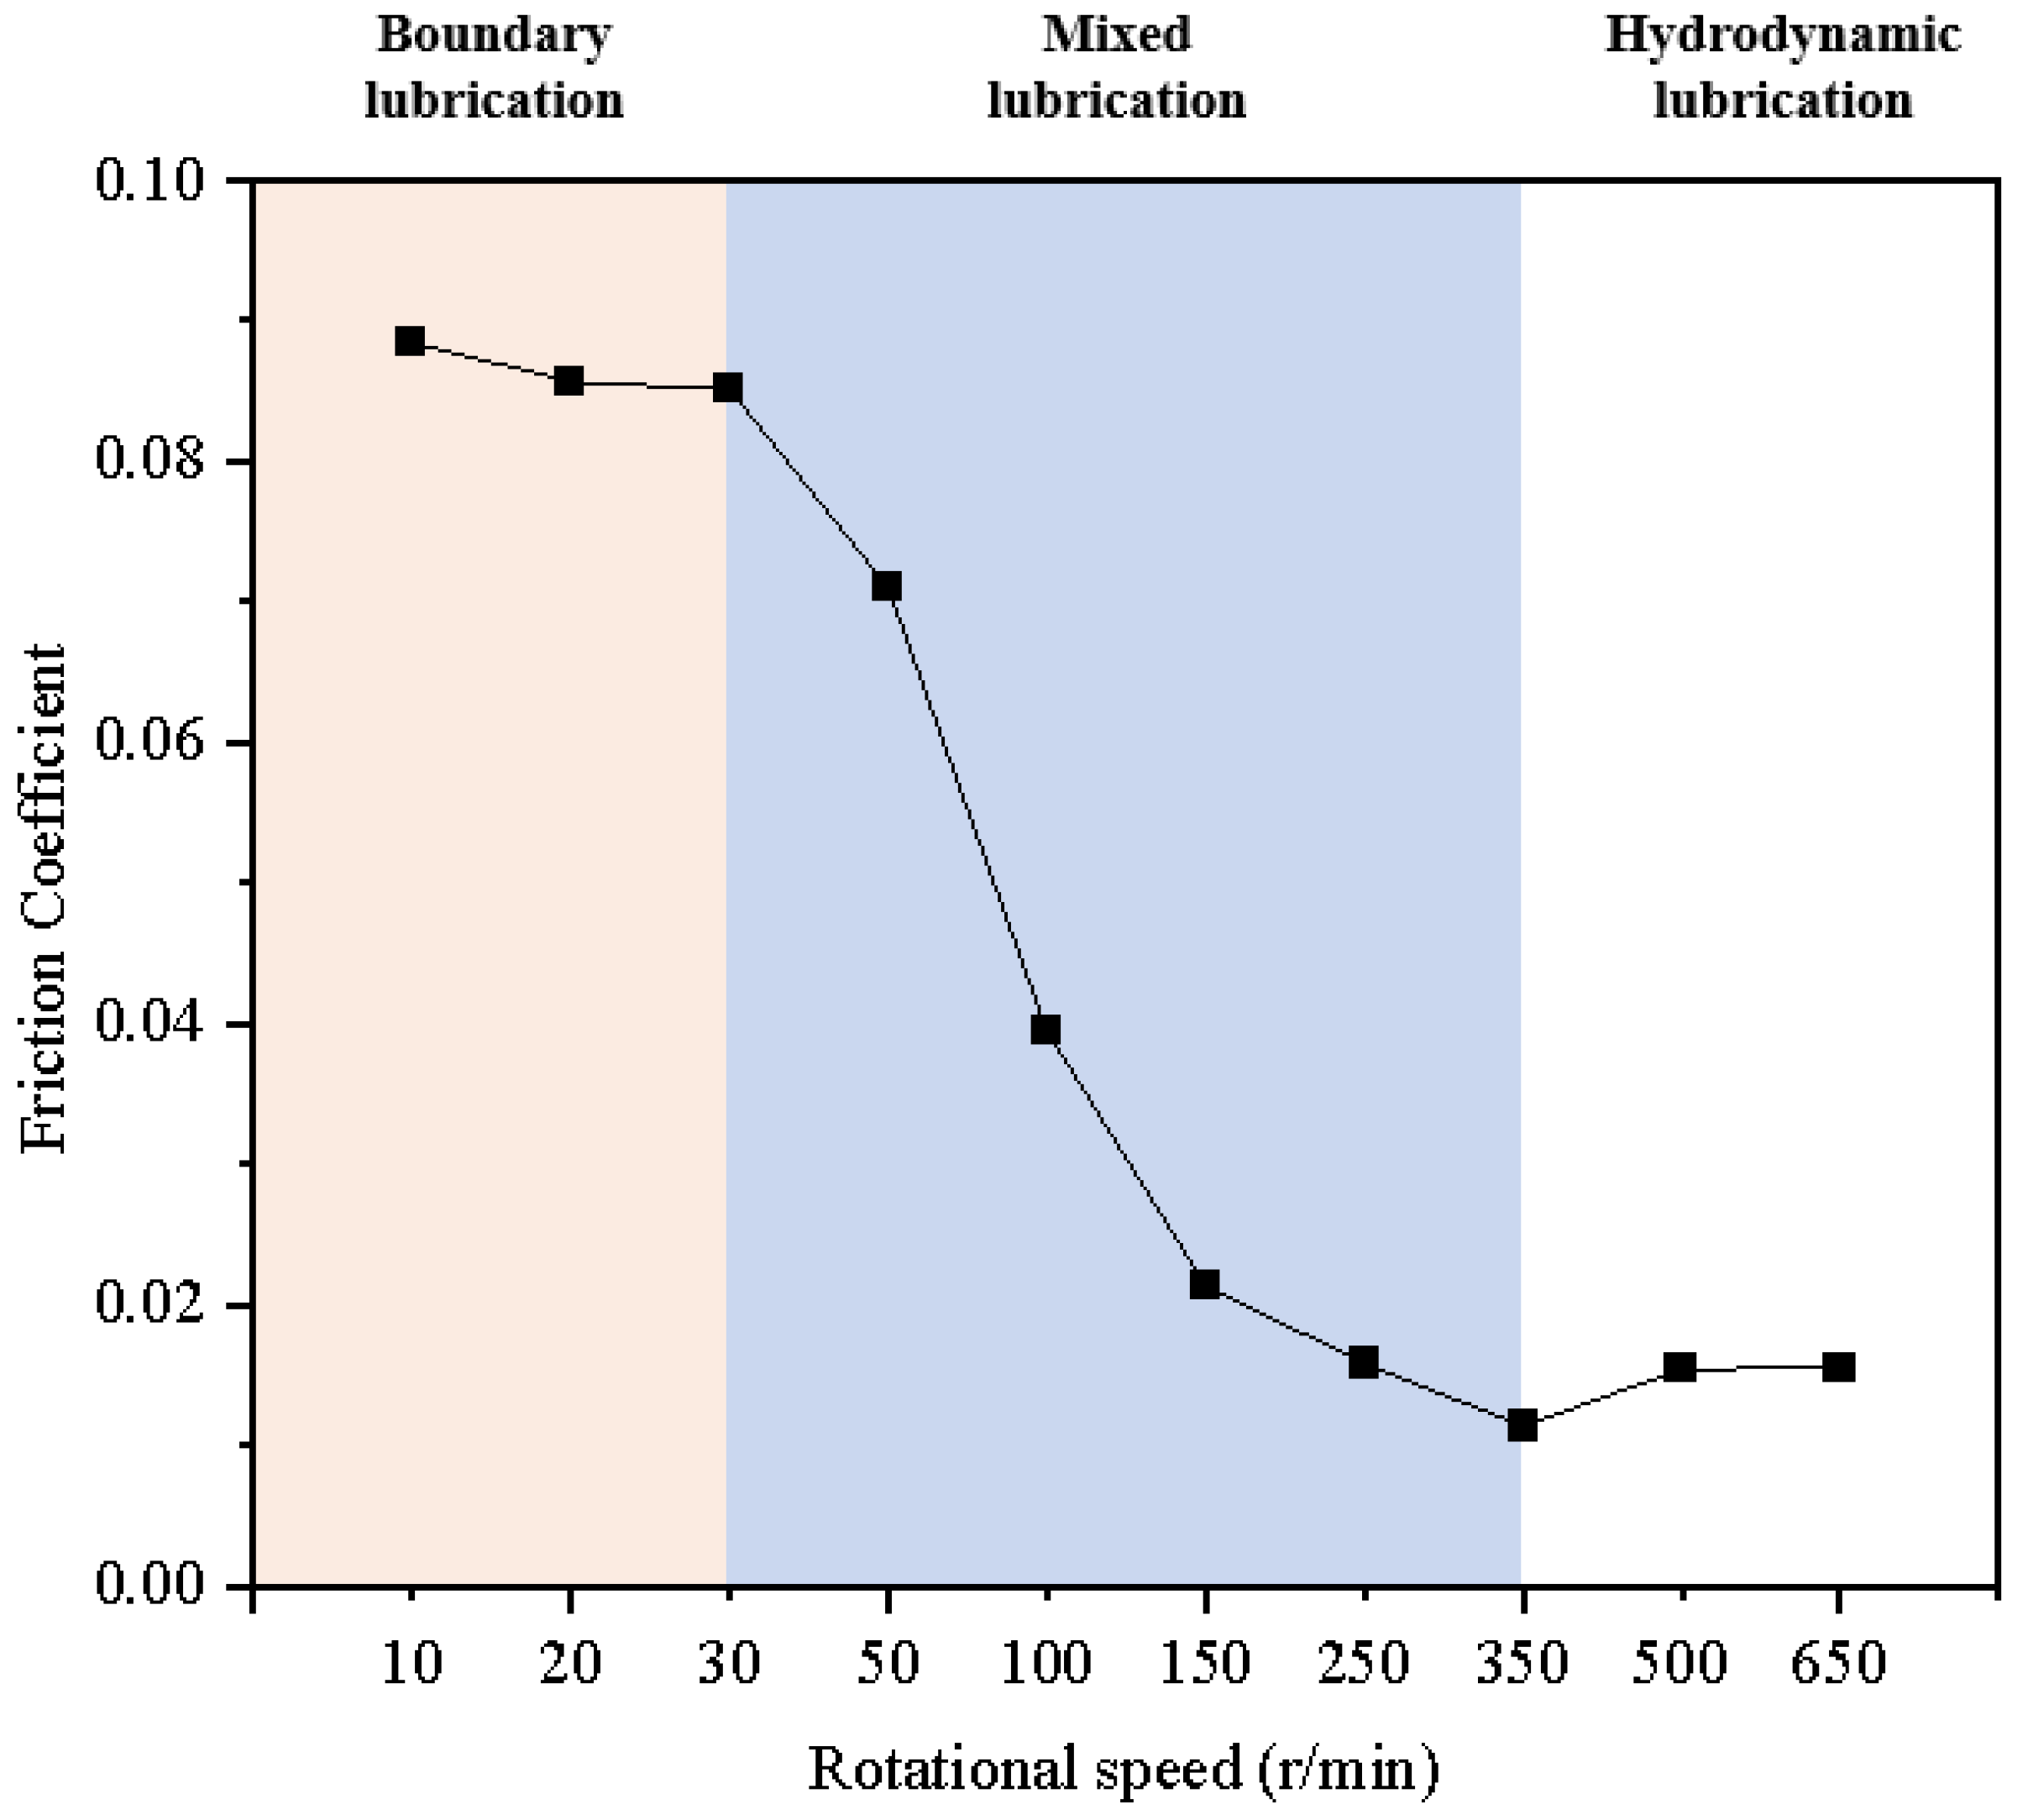
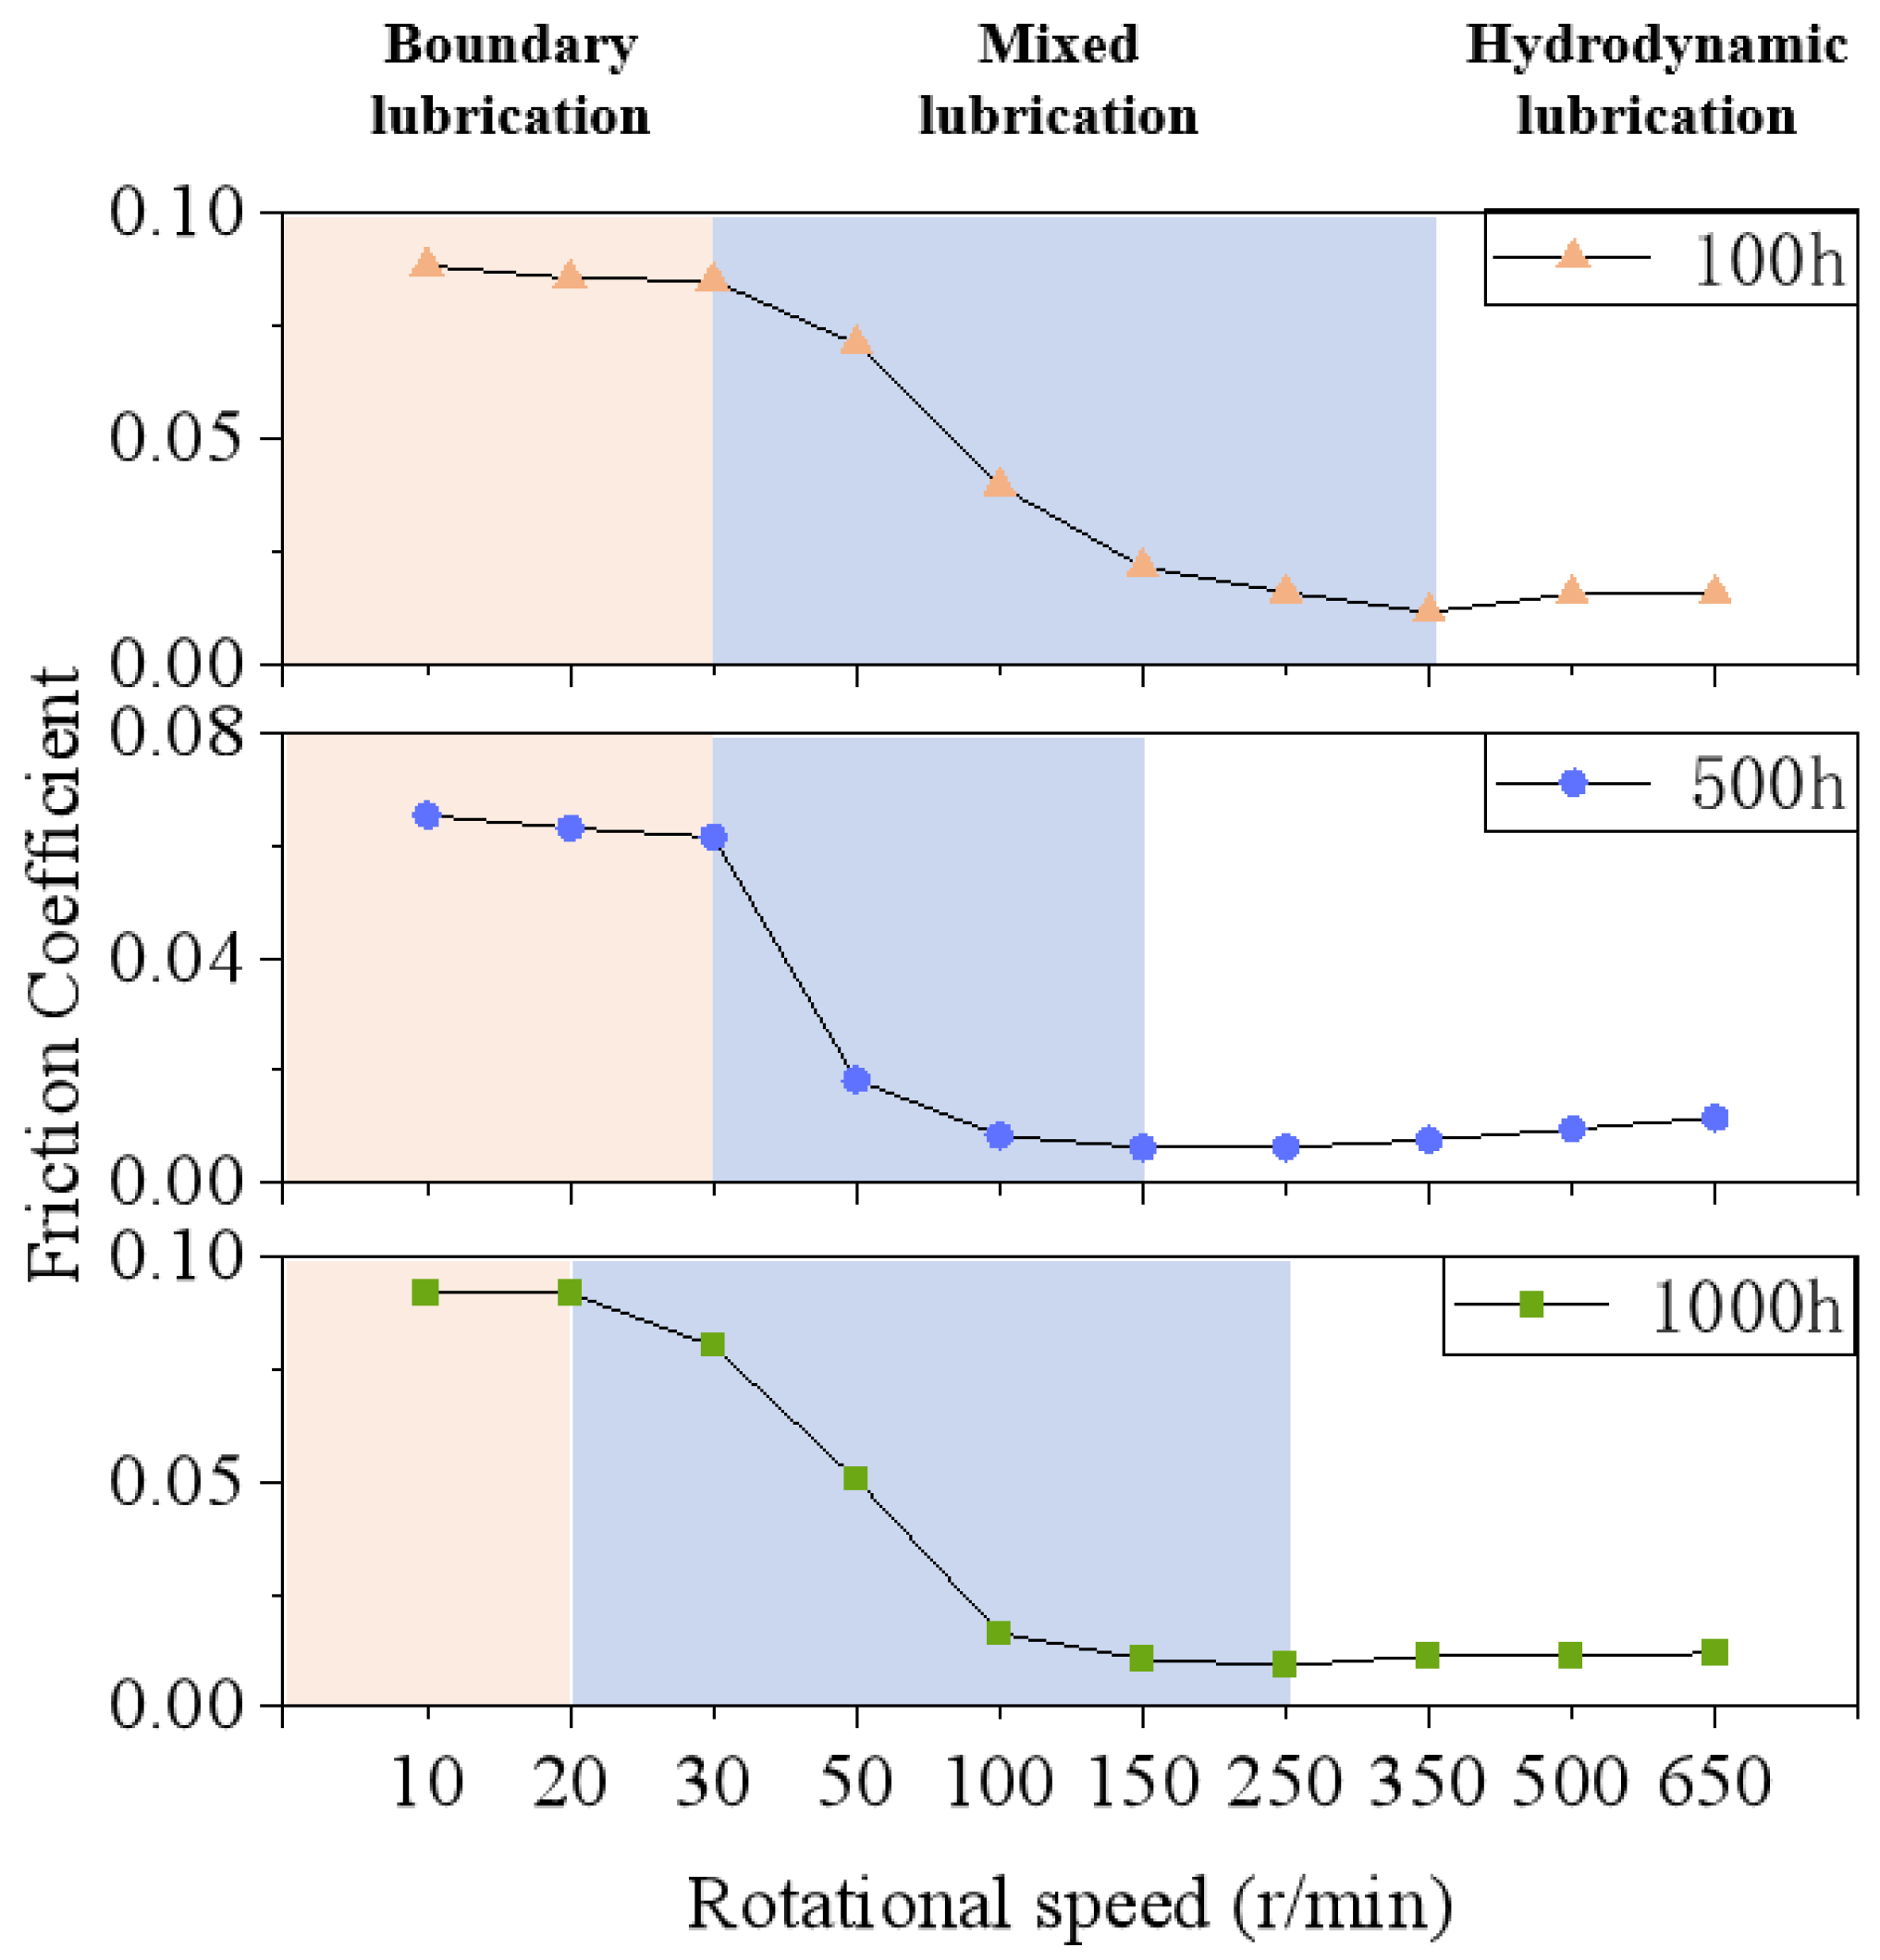
To identify representative operating conditions for vibration analysis of the water-lubricated stern bearing, the lubrication-state evolution with rotational speed was first examined using torque–speed data obtained from the SSB-100 marine water-lubricated stern shaft test rig. As shown in Figure 3, the friction curve divides the lubrication process into three regimes: boundary lubrication at 0–30 r/min, mixed lubrication at 30–350 r/min, and hydrodynamic lubrication at 350–600 r/min. Accordingly, 20, 100, and 500 r/min were selected as representative speeds for the subsequent analysis of vibration characteristics under these three lubrication regimes.
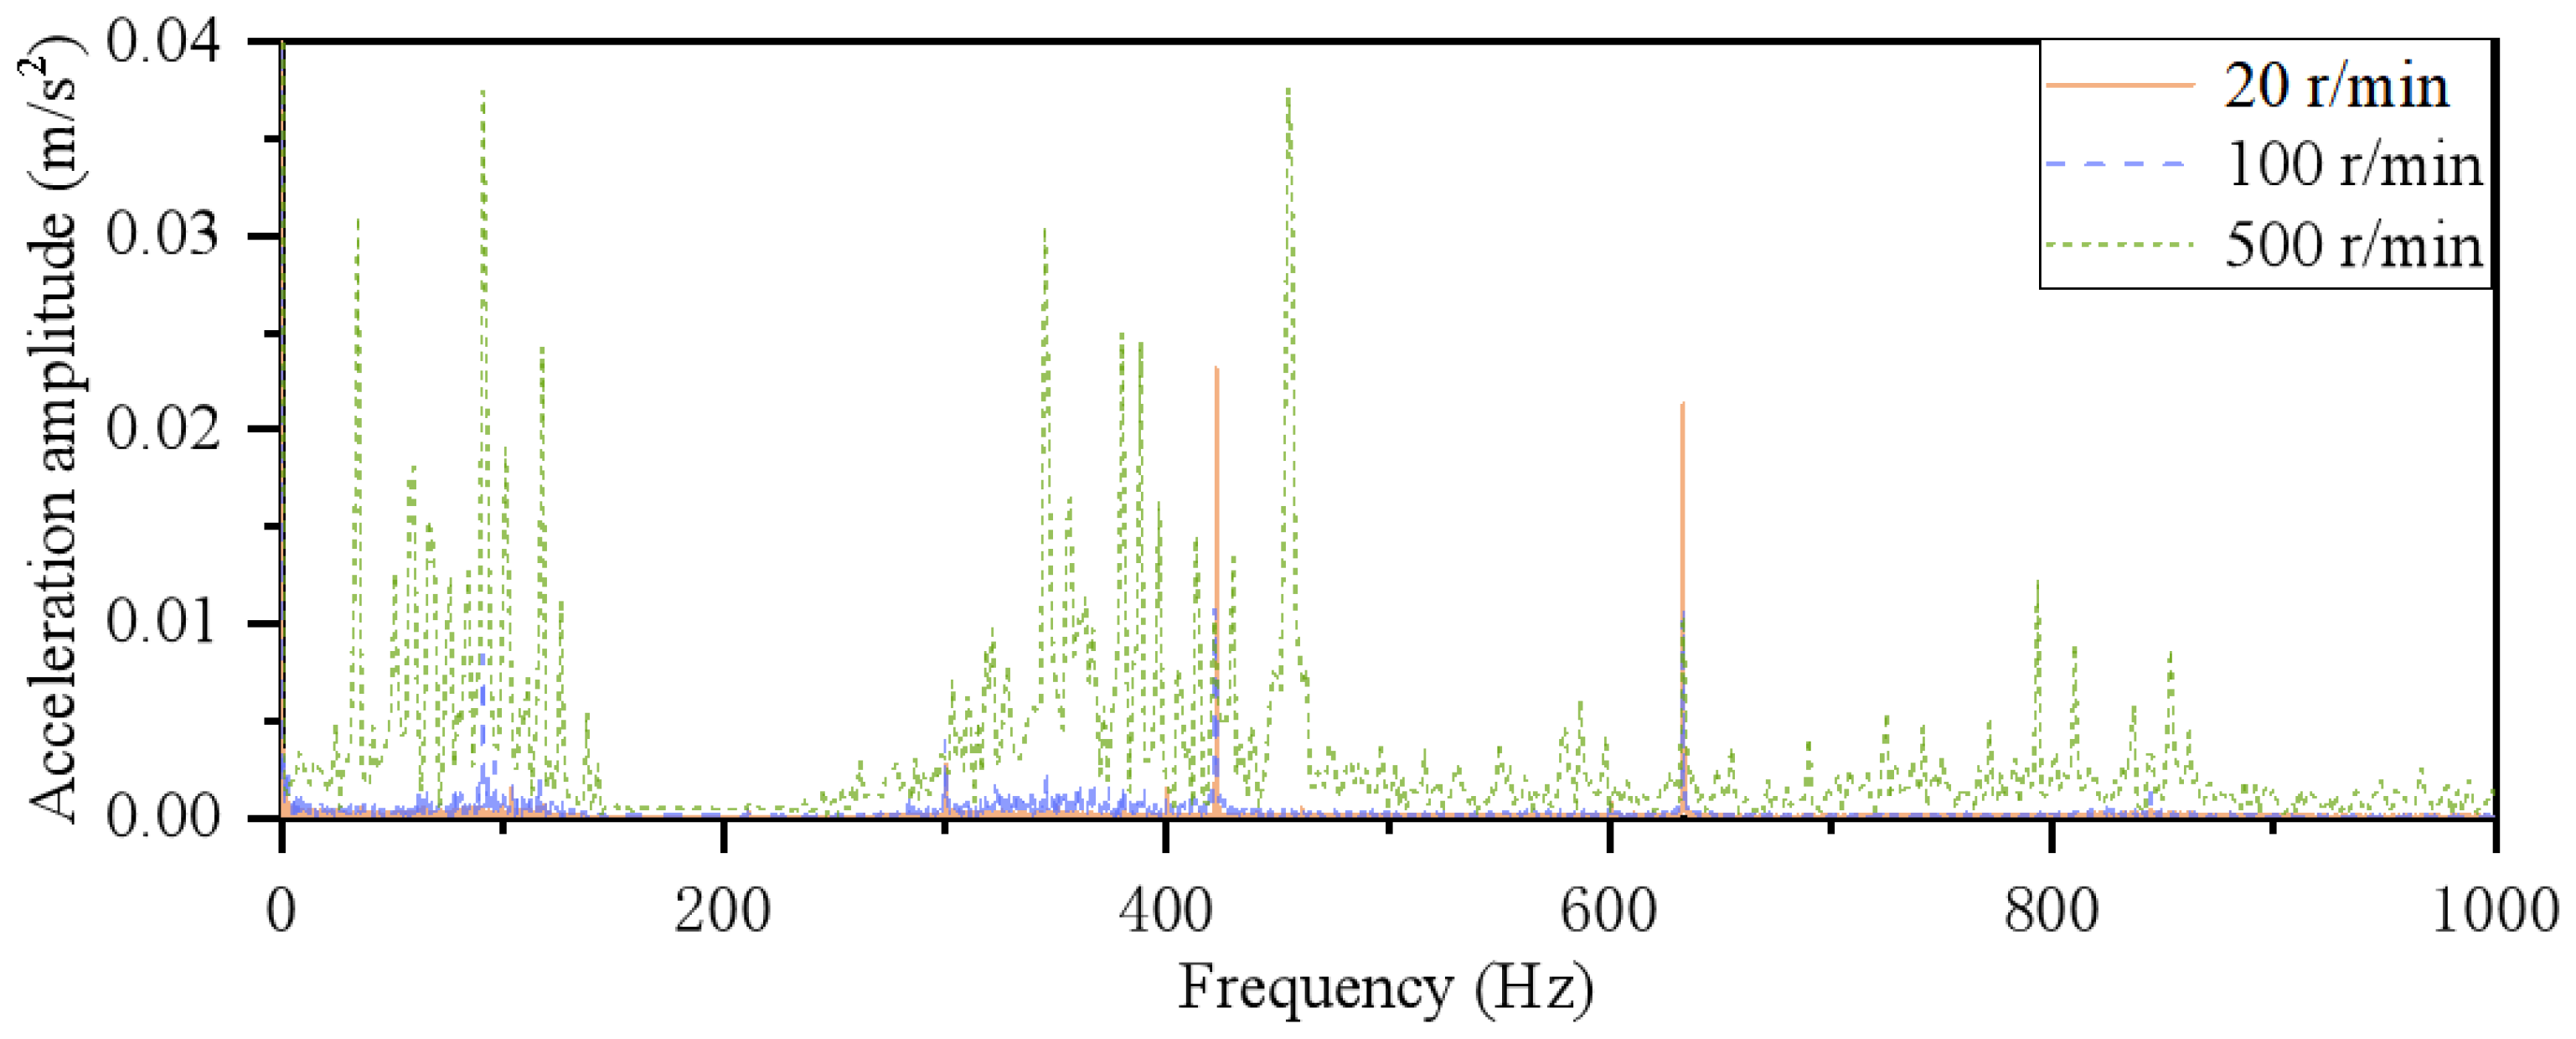
As shown in Figure 4, the vibration frequency band of the water-lubricated stern bearing gradually broadens with increasing rotational speed, while the vibration amplitude exhibits distinct stage-dependent variations. Based on the lubrication-regime classification derived from the friction coefficient curve in Figure 3, the bearing operates under boundary lubrication at 20 r/min, where the water film has insufficient load-carrying capacity and friction is mainly governed by direct asperity contact. Accordingly, the vibration response is characterized by narrow-band random excitation, with prominent signals only near 400 Hz and 600 Hz, and the remaining components mainly distributed in the 0–200 Hz and 300–400 Hz ranges with relatively low amplitudes. At 100 r/min, the bearing enters the mixed lubrication regime, in which the water film carries part of the load while local solid contact still exists. Although the vibration frequency range does not expand significantly, the overall amplitude increases, whereas the characteristic peaks near 400 Hz and 600 Hz decrease markedly due to the reduced asperity contact. As the speed further increases to 500 r/min, hydrodynamic lubrication is established with the gradual formation of a continuous water film and enhanced hydrodynamic effect. The vibration frequency band then expands to 0–1000 Hz, accompanied by increased low- and mid-frequency amplitudes and the emergence of high-frequency components. This can be attributed to the intensified nonlinear and weak-damping characteristics of the water film under hydrodynamic lubrication, which amplify the vibration response induced by shaft-system misalignment.
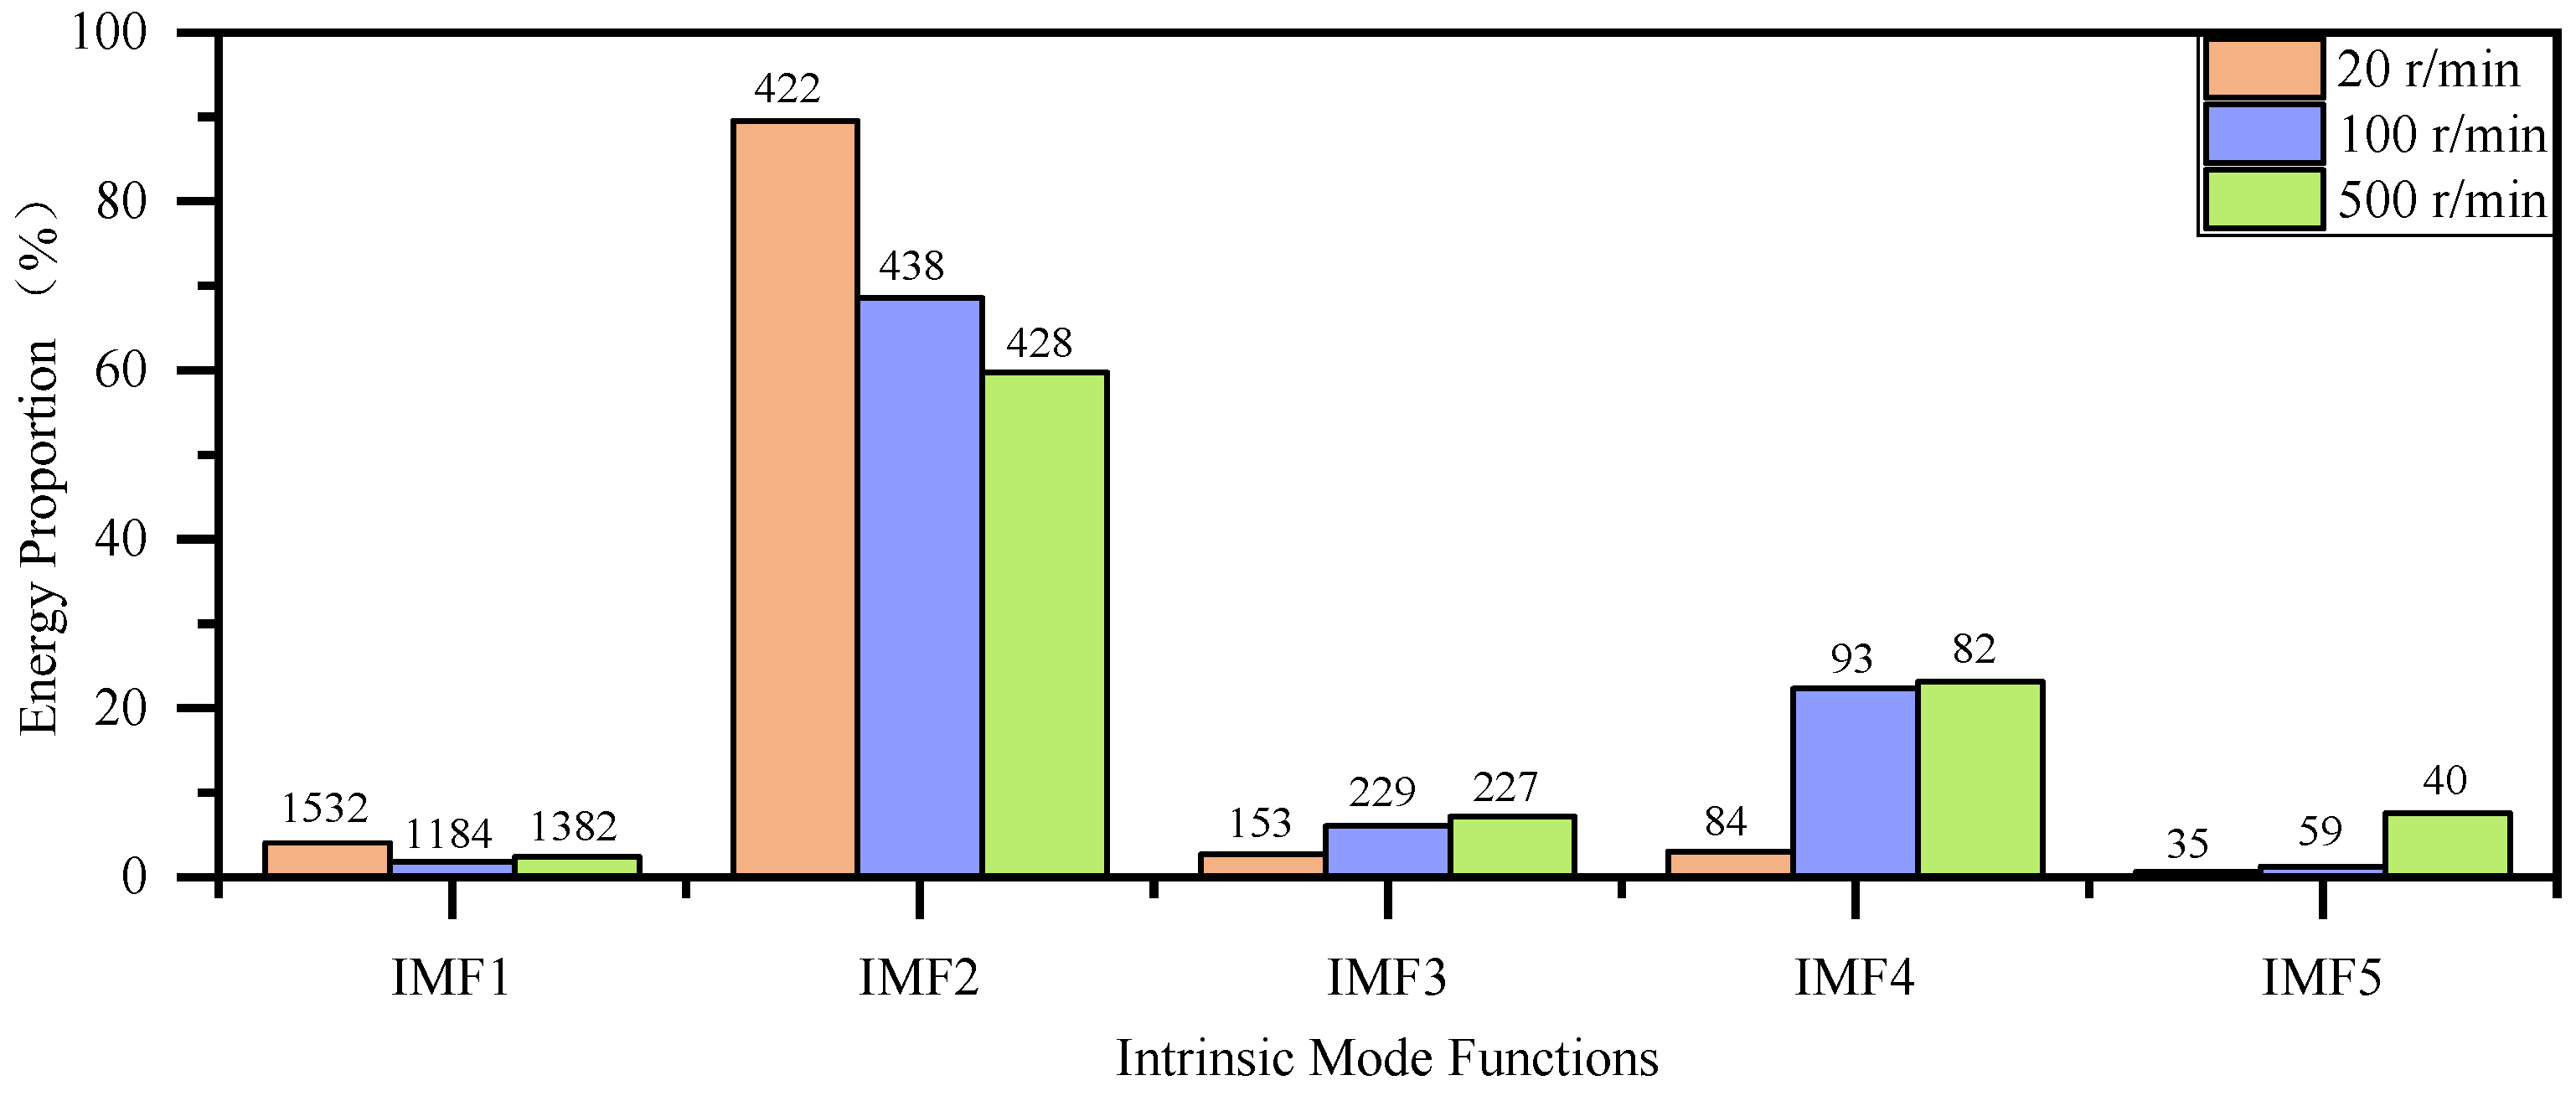
After EEMD decomposition, five IMF components and their centroid frequencies were obtained for signals at different rotational speeds. As shown in Figure 5, under boundary lubrication, vibration induced by solid-contact friction is dominated by a primary frequency component, causing more than 90% of the energy to concentrate in IMF2, with a centroid frequency of 422 Hz. As the bearing enters mixed lubrication, the coupled effects of water film and local solid contact make the vibration response more complex, reducing the energy proportion of IMF2 while markedly increasing that of IMF4. Except for IMF1, the centroid frequencies of IMF2–IMF5 also increase to varying degrees. Under hydrodynamic lubrication, broadband whirling and oscillation associated with the fully developed water film further redistribute the vibration energy across multiple IMF components, resulting in a more uniform and dispersed energy distribution. Overall, the transition from boundary to mixed and then to hydrodynamic lubrication broadens the vibration frequency band and shifts the IMF energy distribution from high concentration to greater dispersion, while the dominant vibration energy remains centered around approximately 400 Hz.
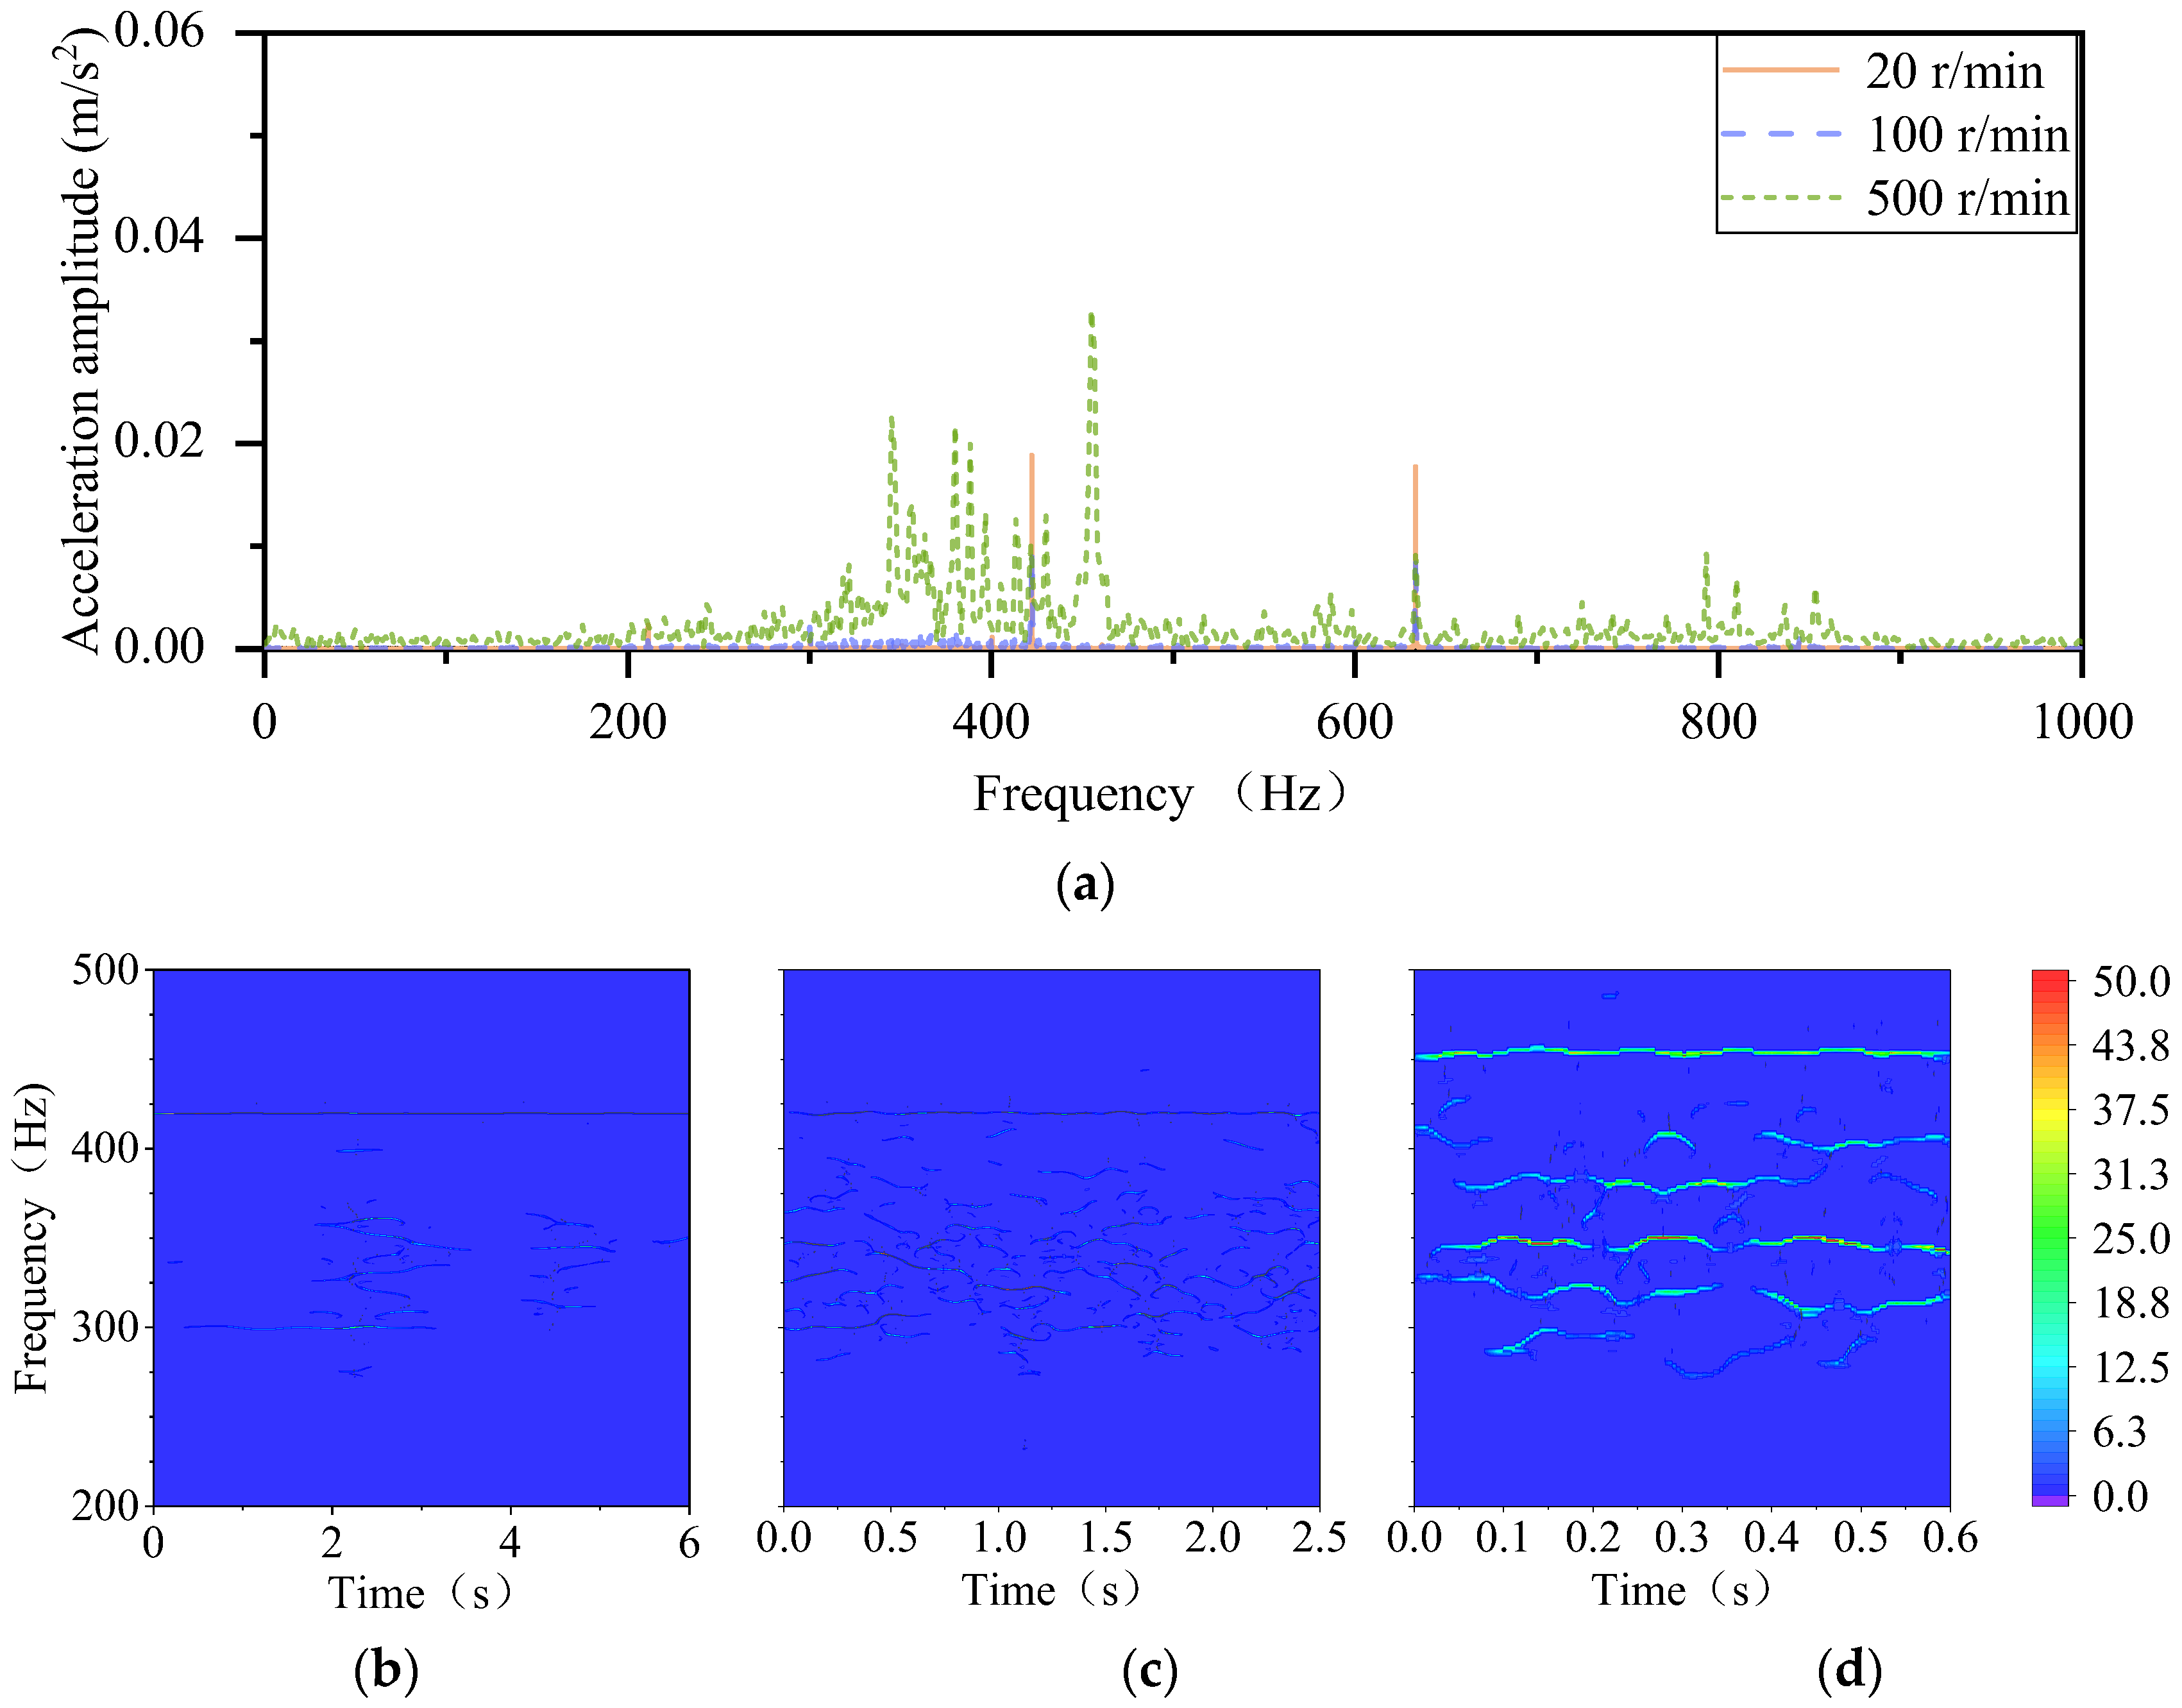
Figure 6 shows the frequency spectra of the IMF component with the highest energy contribution at different rotational speeds, along with the corresponding TFMST results. The evolution of the time–frequency energy ridges is closely associated with the lubrication regime. Under boundary lubrication, solid-contact friction dominates, producing isolated spectral peaks at 400 and 600 Hz and weak components in the 300–400 Hz range. The TFMST result shows a pronounced energy ridge near 400 Hz, with only intermittent weak ridges at 300–400 Hz, indicating that the vibration energy is mainly concentrated along a single frequency trajectory. As the bearing enters mixed lubrication, the coexistence of water film and local solid contact increases the complexity of the vibration response. The peaks at 400 and 600 Hz remain but decrease in amplitude, whereas the 300–400 Hz components increase markedly. Correspondingly, a continuous fluctuating energy band appears in the TFMST result within 300–400 Hz, suggesting energy diffusion toward adjacent frequency bands. Under hydrodynamic lubrication, the fully developed water film dominates the vibration response through enhanced hydrodynamic and whirl effects. The spectrum exhibits broadband, high-amplitude, multi-order peaks mainly within 300–500 Hz, together with newly emerging components near 800 Hz. This is reflected in the TFMST result by multiple continuous high-intensity ridges. Overall, the transition from boundary to mixed and hydrodynamic lubrication progressively broadens the vibration frequency range and changes the energy distribution from a single dominant ridge to broadband, multi-ridge features.

4.2. Analysis of Vibration Characteristics Under Liner Wear

As shown in Figure 7, the friction coefficient curves at different operating durations reveal the influence of wear progression on the transition of lubrication regimes. As the operating duration increases from 100 to 1000 h, progressive surface wear alters the bearing clearance and surface morphology between the journal and bearing bush, leading to a noticeable shift in the lubrication transition process. At 100 h, the lubrication regime follows a typical transition from boundary lubrication to mixed lubrication and then to hydrodynamic lubrication, characterized by a nearly stable friction coefficient in the boundary regime, a rapid decrease in the mixed regime, and a slight increase in the hydrodynamic regime. With further operation to 500 and 1000 h, intensified surface wear shifts the transition points toward lower rotational speeds: the onset of mixed lubrication occurs earlier, and the transition to hydrodynamic lubrication is accelerated. This is reflected by a faster decline in the friction coefficient in the low- and medium-speed ranges. Meanwhile, the stable friction coefficient in the hydrodynamic regime increases slightly with operating duration, indicating that long-term wear not only changes the boundaries of lubrication regimes but also affects water-film formation and load-carrying performance.
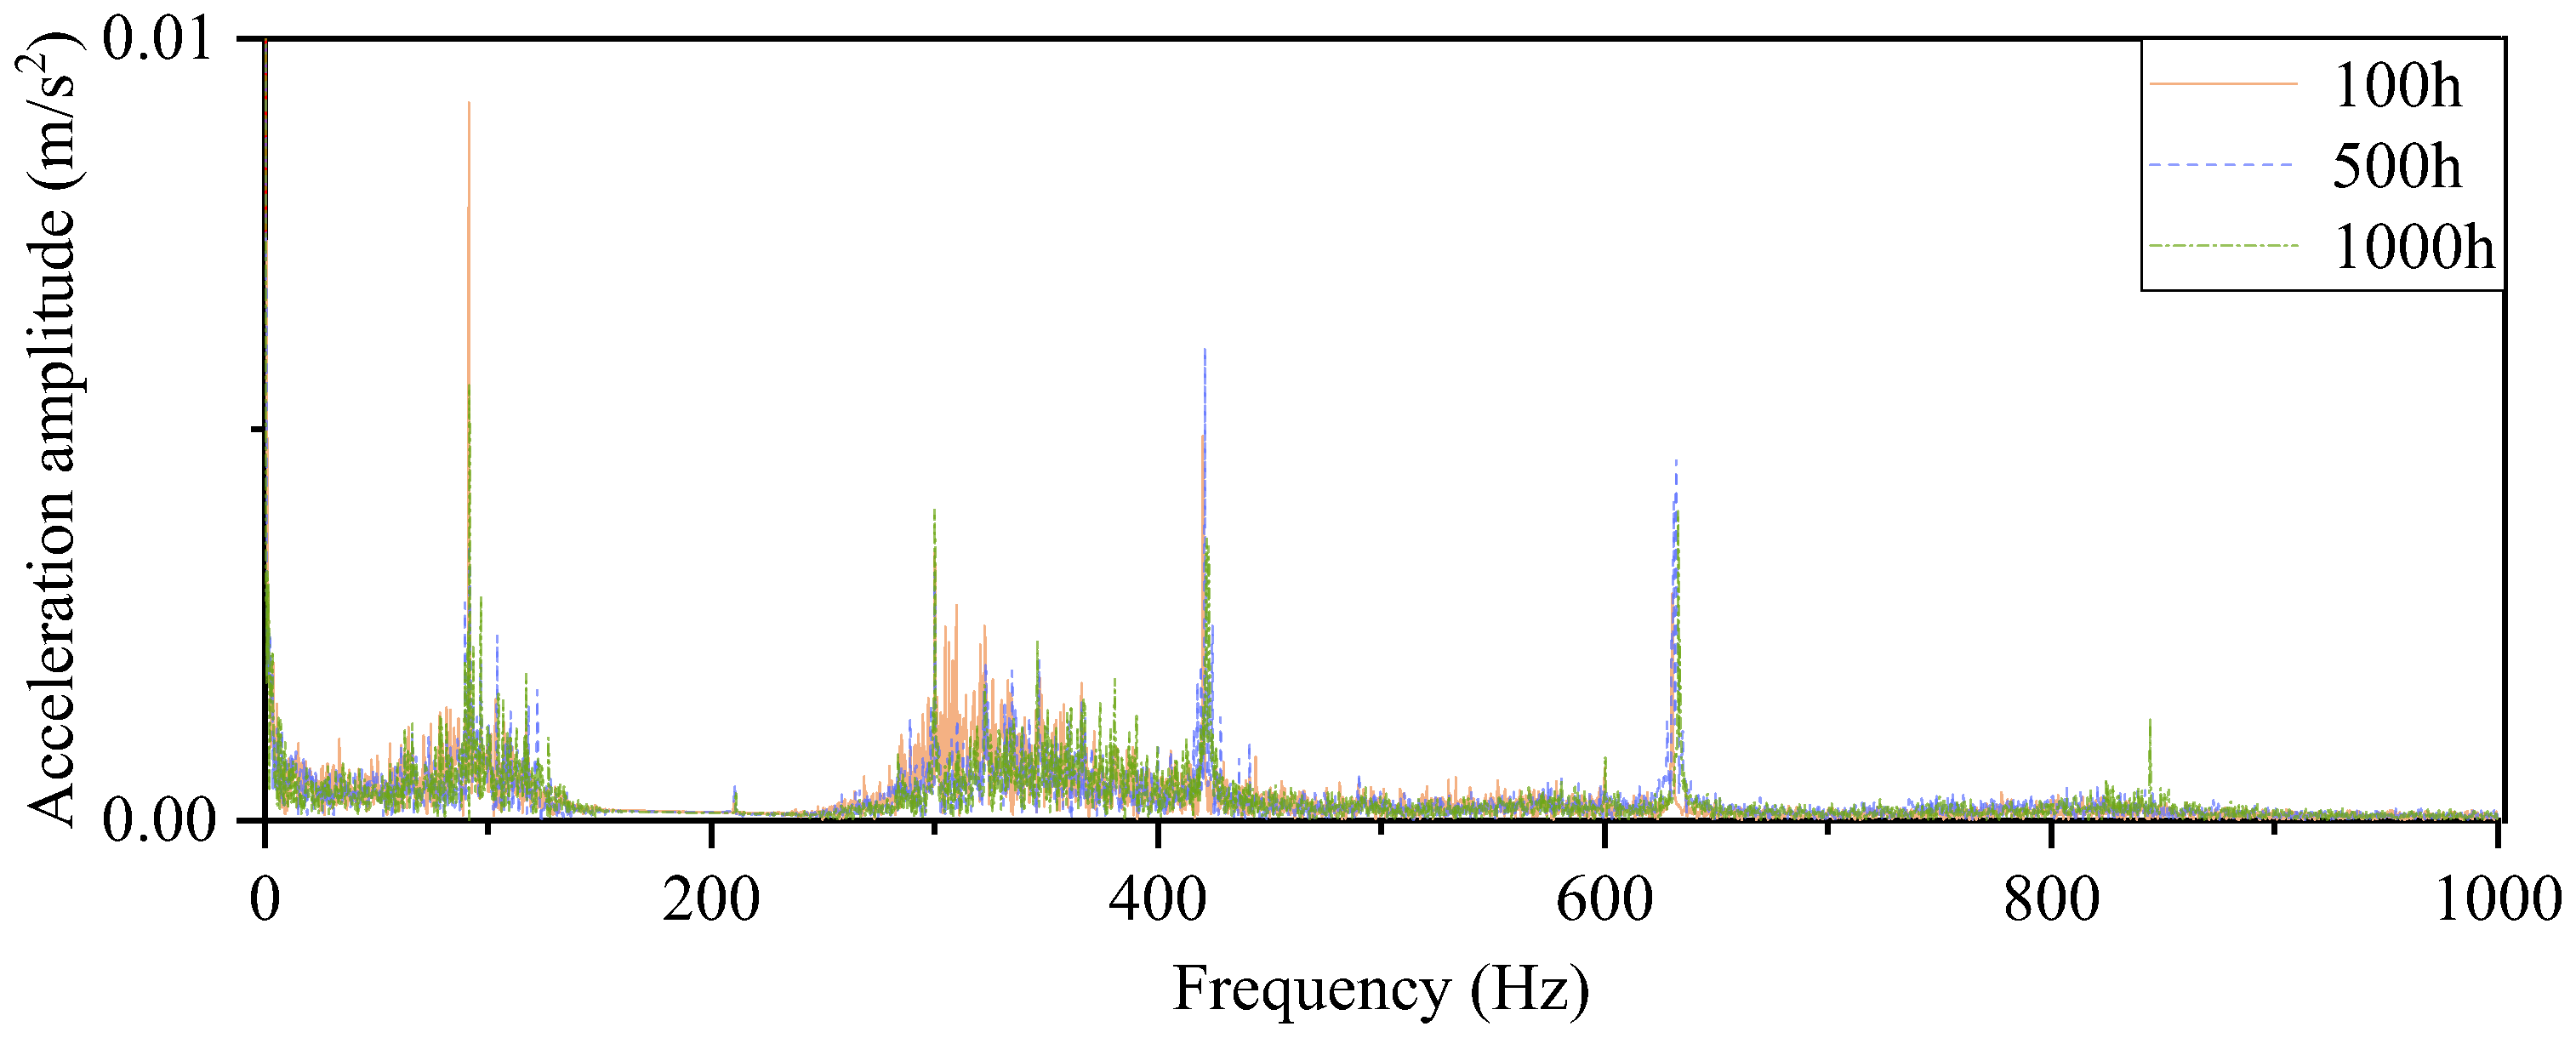
As shown in Figure 8, the evolution of the vibration spectra under different operating durations is mainly governed by wear-induced shifts in the lubrication regime. With prolonged operation, progressive surface wear alters the bearing surface morphology and clearance, making water-film formation more difficult and allowing mixed lubrication to persist, or even dominate, over a wider speed range. When the operating duration increases from 100 to 500 h, the initial running-in effect reduces surface roughness and promotes the transition to mixed or hydrodynamic lubrication at lower speeds, leading to more concentrated vibration amplitudes in certain frequency bands. However, after 1000 h of operation, excessive wear deteriorates the bearing clearance and weakens water-film stability, causing mixed lubrication to persist over a broader speed range. Consequently, the vibration frequency band further broadens, accompanied by a marked increase in high-frequency components.
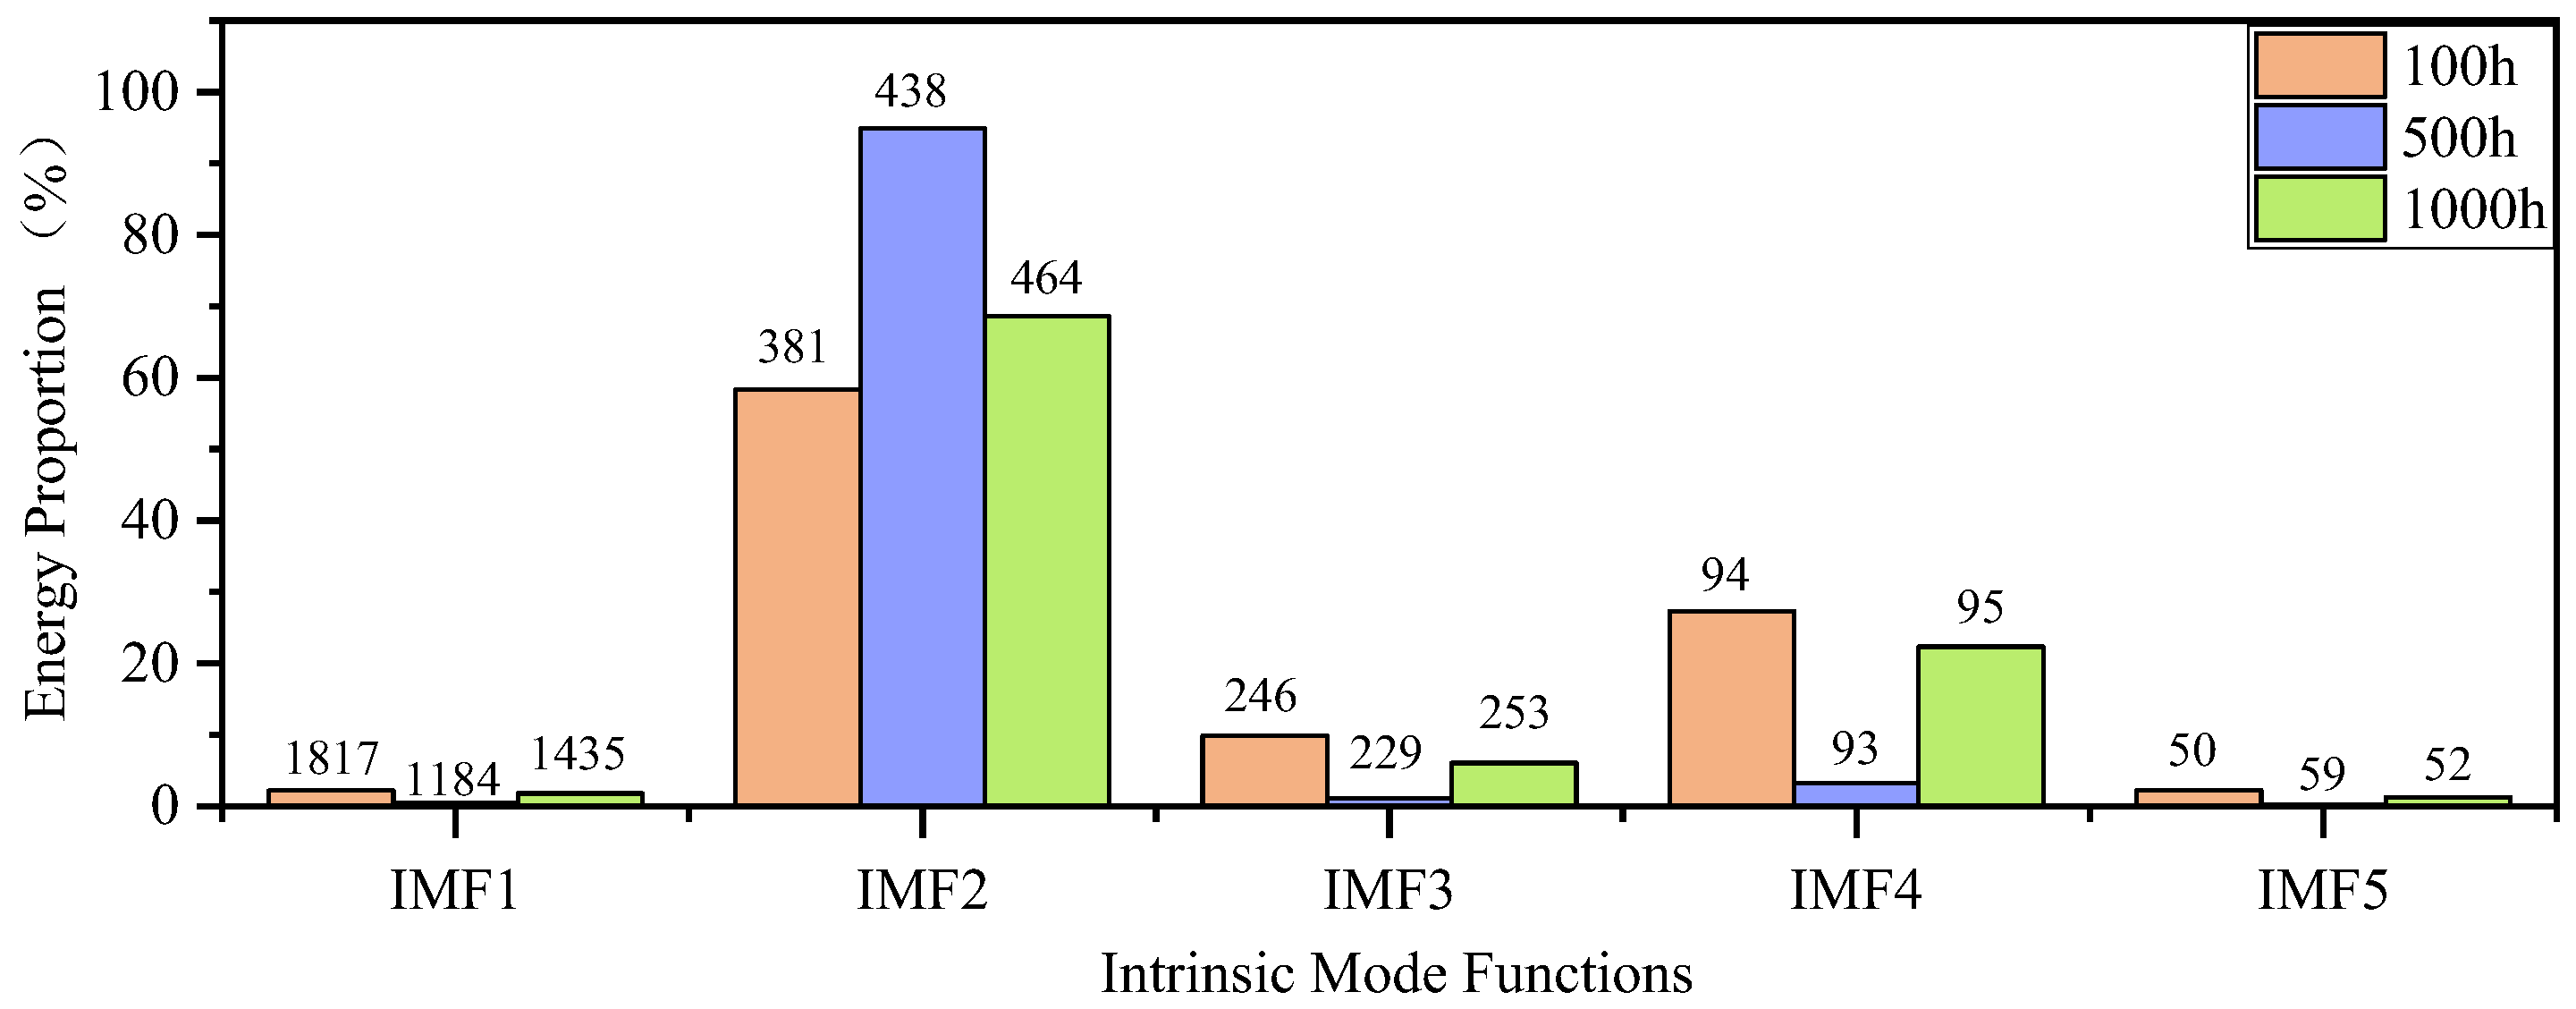
After EEMD decomposition of the signals at different operating durations, the energy contribution of each IMF component was obtained, as shown in Figure 9. Increasing operating duration alters the lubrication regime at different rotational speeds and thereby changes the vibration characteristics, including centroid frequency and energy distribution. As the operating duration increases from 100 to 1000 h, progressive wear shifts the transition process from boundary to mixed and hydrodynamic lubrication. The centroid frequency of the high-frequency IMF1 component decreases markedly, mainly because severe wear reduces the water-film load-carrying capacity and increases the contribution of mixed lubrication, causing high-frequency whirl components to shift toward lower frequencies. In contrast, the centroid frequencies of the mid-frequency IMF2 and IMF3 components increase slightly, while the energy contribution of IMF2 first increases and then stabilizes, indicating enhanced mid-frequency vibration associated with the improved surface morphology during the running-in stage. The energy contribution of IMF4 also shows a clear response to the staged transition of lubrication regimes. These results suggest that lubrication-regime evolution governs the redistribution of vibration energy and the migration of frequency characteristics, with mid-frequency components being more sensitive to wear progression, whereas low-frequency rigid-body vibration is less affected.
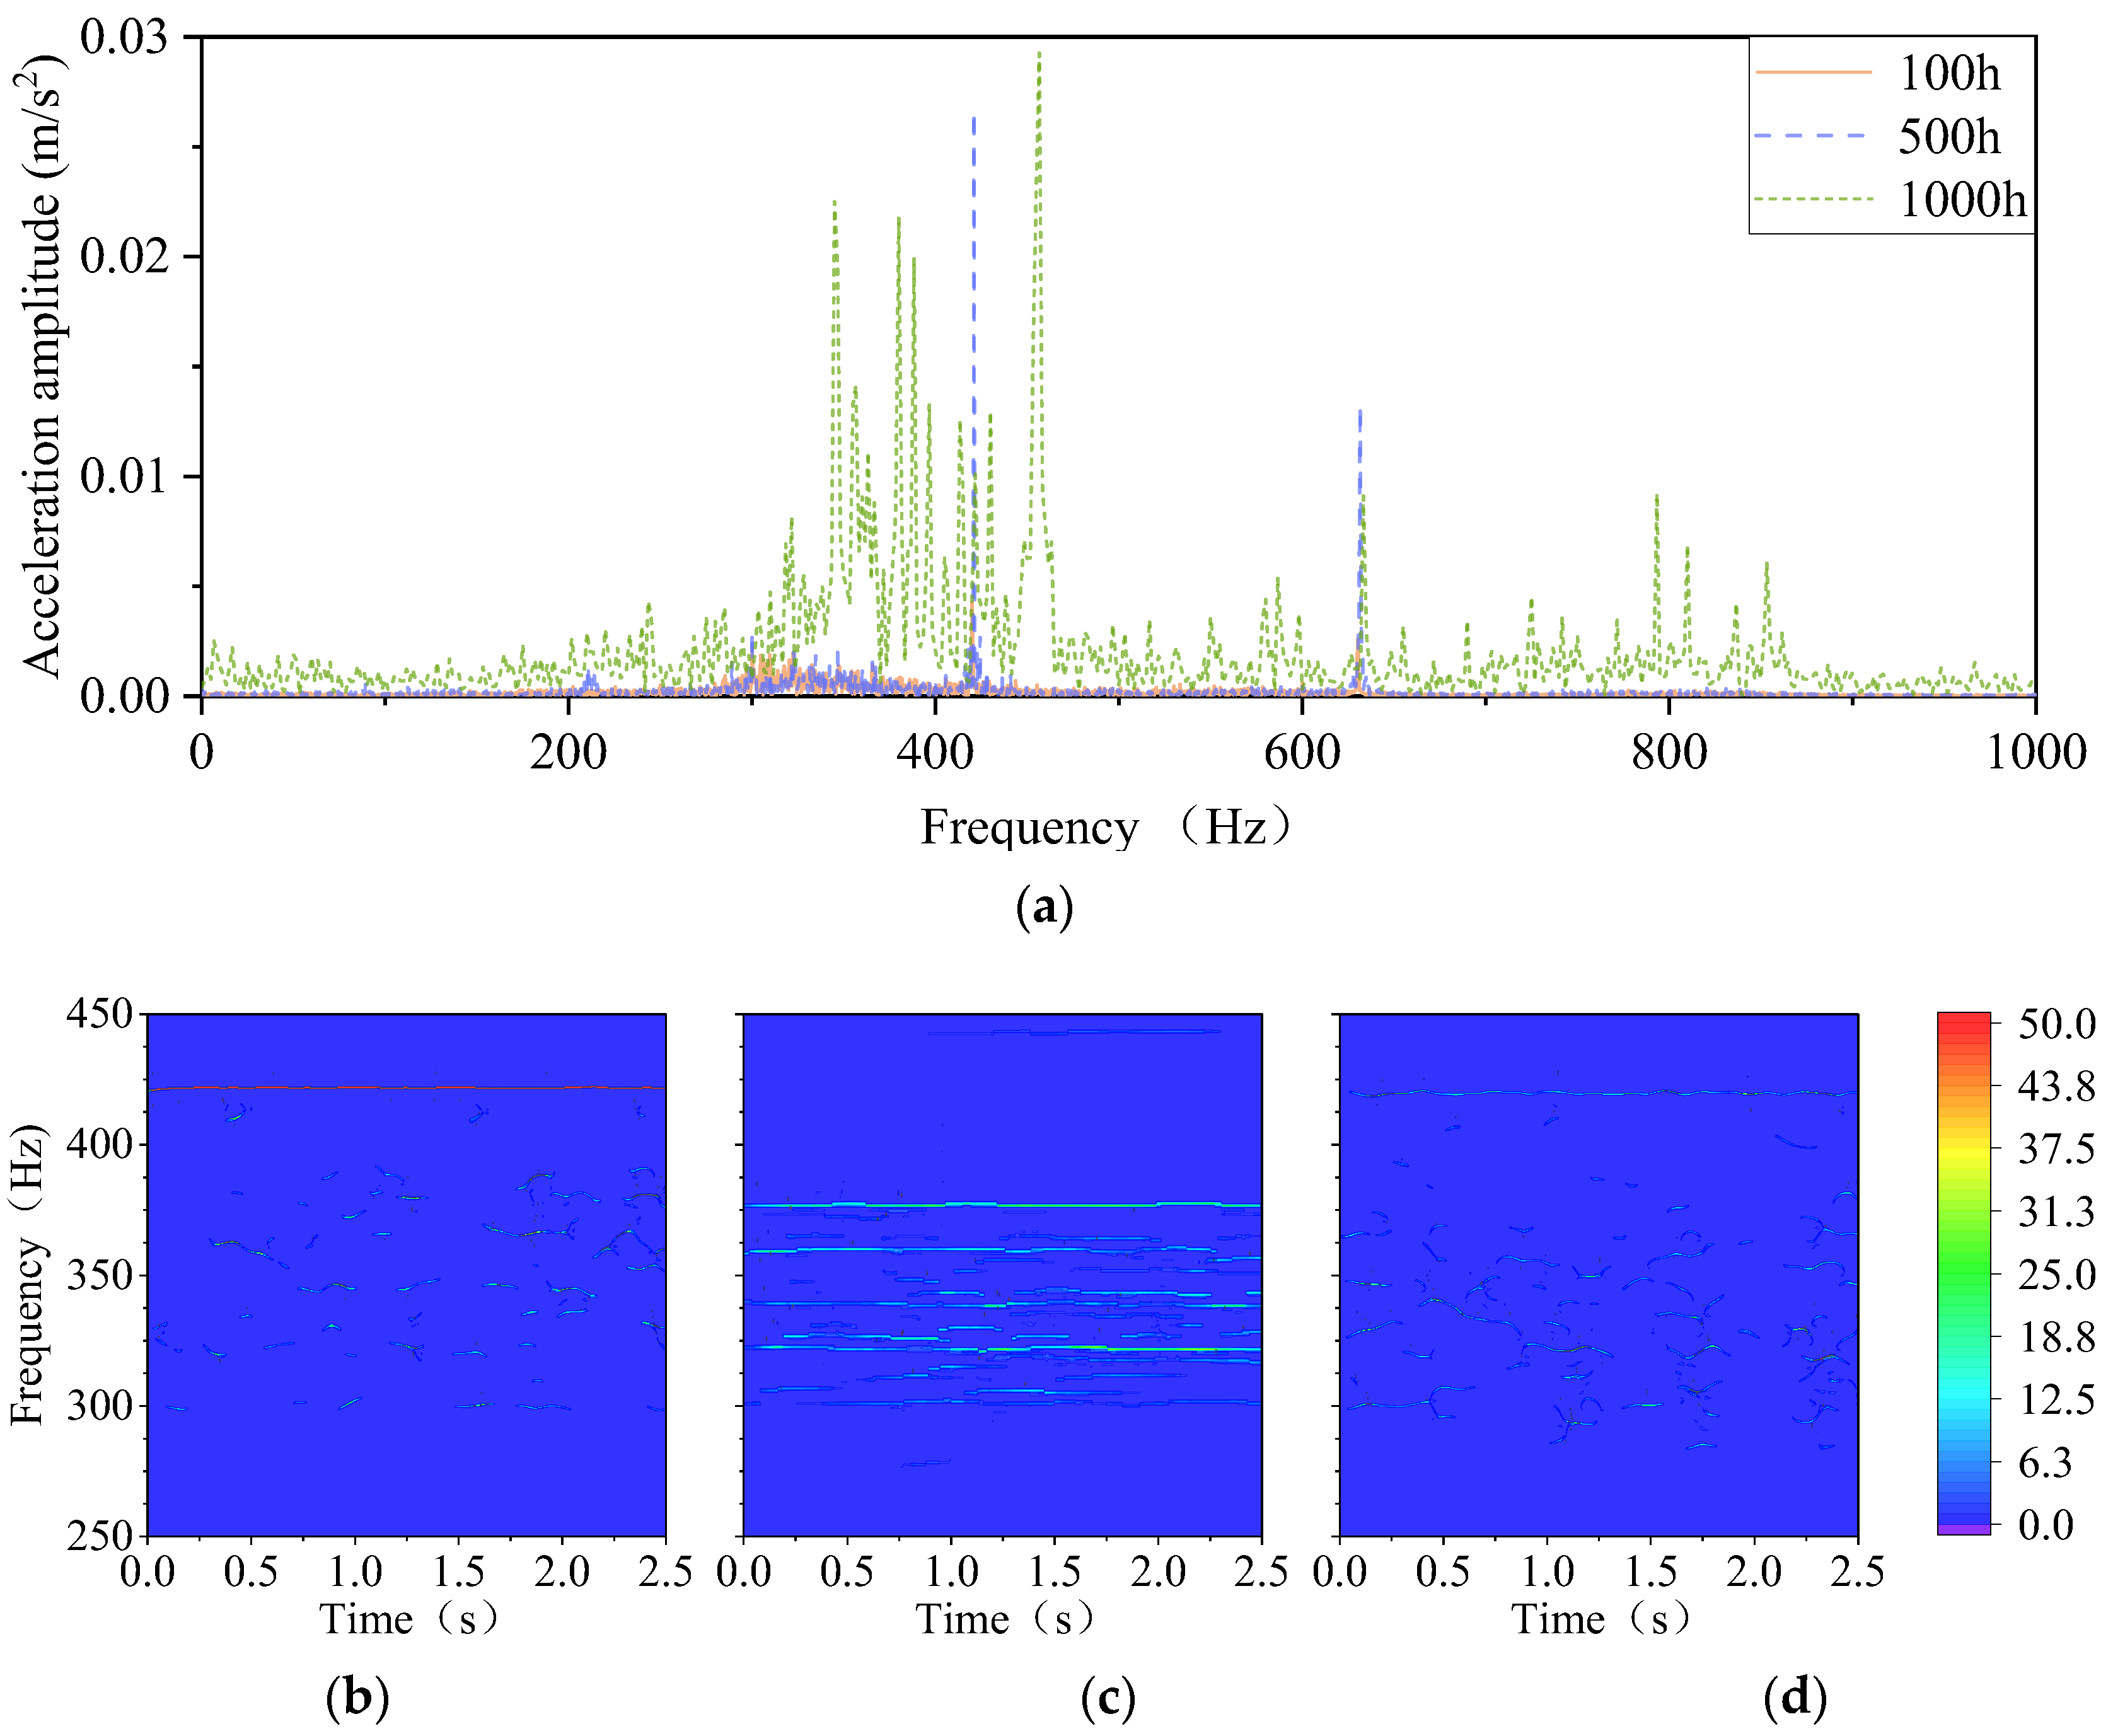
Figure 10 presents the frequency spectra of the IMF component with the highest energy contribution under different operating durations, together with the corresponding TFMST results. Combined with the lubrication-state evolution shown in Figure 7, the results indicate that operating duration affects vibration characteristics primarily through wear-induced changes in lubrication behavior. At 100 h, corresponding to the early service stage, the spectrum exhibits only weak amplitudes in the 300–400 Hz range without distinct peaks, and the TFMST result shows a single pronounced energy ridge near 400 Hz with sparse and discontinuous ridges in the 300–400 Hz band, indicating a generally low-energy response. At 500 h, the observed surface morphology shows that the wear marks and local surface irregularities become less pronounced, suggesting a relatively smoother and more uniform contact surface. This qualitative morphology change may promote more stable mixed or hydrodynamic lubrication over a wider speed range. As a result, the vibration energy becomes more concentrated, and the TFMST result exhibits multiple clear and continuous energy ridges in the 300–400 Hz range. At 1000 h, excessive wear increases the bearing clearance and impairs water-film formation, causing mixed lubrication to persist or dominate over a wider speed range. This deterioration leads to dense broadband peaks with high amplitudes in the 300–500 Hz range, together with a marked increase in amplitudes across other bands. In the TFMST result, numerous disordered energy ridges appear in the 300–400 Hz range, indicating more complex multimodal vibration. Overall, moderate wear tends to improve lubrication and stabilize the vibration response, whereas excessive long-term wear degrades lubrication and promotes broadband vibration dispersion and high-frequency excitation.

5. Conclusions

Under boundary lubrication, solid-contact friction dominates the vibration response, producing narrow-band excitation with isolated peaks near 400 and 600 Hz, while weak components are mainly distributed in the 0–200 Hz and 300–400 Hz ranges. Under mixed lubrication, the peaks near 400 and 600 Hz decrease, whereas the 300–400 Hz components increase and diffuse to adjacent frequency bands. Under hydrodynamic lubrication, the response expands to 0–1000 Hz, with dominant multi-order peaks mainly within 300–500 Hz and additional components near 800 Hz. Thus, the vibration response evolves from narrow-band, single-peak behavior to broadband, multi-peak characteristics, while the IMF energy distribution shifts from strong concentration in a single component to dispersion among multiple components.
During long-term service, accumulated wear induces staged shifts in the lubrication regime, resulting in non-monotonic vibration evolution. At 100 h, the spectrum exhibits weak amplitudes mainly in the 300–400 Hz range, and the TFMST result shows a single pronounced ridge near 400 Hz with sparse and discontinuous ridges in the 300–400 Hz band. At 500 h, moderate wear improves the bearing surface morphology and promotes more stable mixed or hydrodynamic lubrication, resulting in more concentrated vibration energy and multiple continuous ridges mainly within 300–400 Hz. At 1000 h, excessive wear increases bearing clearance and weakens water-film stability, leading to dense broadband peaks mainly within 300–500 Hz and enhanced amplitudes in other frequency bands.
Across the tested conditions, the dominant vibration features are mainly centered around approximately 400 Hz, while broadband energy becomes more evident within 300–500 Hz under hydrodynamic lubrication and severe wear conditions. The transition from boundary to hydrodynamic lubrication increases the uniformity and dispersion of IMF energy distribution, changing the frequency-domain response from single-peak concentration to broadband multi-peak distribution. Wear-induced lubrication shifts further drive the energy distribution from narrow-band concentration toward broadband dispersion, while lubrication deterioration during long-term service intensifies high-frequency excitation.
The transition from boundary to hydrodynamic lubrication increases the amplitude and bandwidth of the energy ridges, which evolve from a single ridge near 400 Hz to multiple continuous broadband ridges. Wear-induced lubrication shifts first concentrate the ridges mainly within 300–400 Hz at the middle service stage and then broaden them toward 300–500 Hz as lubrication deteriorates during long-term operation. These multi-band ridge features can serve as key indicators for assessing the service condition of water-lubricated stern bearings.

Author Contributions

Conceptualization, X.L. and Q.L.; methodology, Q.L.; software, X.L.; validation, X.L., Q.L. and Y.J.; formal analysis, X.L.; investigation, Q.L.; resources, Y.J.; data curation, X.L.; writing—original draft preparation, X.L.; writing—review and editing, Q.L. and Y.J.; visualization, X.L.; supervision, Q.L.; project administration, G.W.; funding acquisition, W.O. All authors have read and agreed to the published version of the manuscript.

Funding

This research was financially supported by the National Key R&D Program of China under grant no. 2024YFB4303000.

Data Availability Statement

The data are available from the corresponding author on reasonable request.

Conflicts of Interest

The authors declare no conflicts of interest.

Nomenclature

EMDEmpirical Mode Decomposition
EEMDEnsemble Empirical Mode Decomposition
CEEMDANComplete Ensemble Empirical Mode Decomposition with Adaptive Noise
IMFIntrinsic Mode Functions
VMDVariational Mode Decomposition
TFMSTTime-Frequency Multi-Synchrosqueezing Transform

References

  1. Kumar, A.K.M.; Manjunath, T.C. Vibration signal analysis using time and time-frequency domain: Review. In Proceedings of the 2017 IEEE International Conference on Power, Control, Signals and Instrumentation Engineering (ICPCSI), Chennai, India, 21–22 September 2017. [Google Scholar] [CrossRef]
  2. Yang, H.; Ning, T.; Zhang, B.; Yin, X.; Gao, Z. An adaptive denoising fault feature extraction method based on ensemble empirical mode decomposition and the correlation coefficient. Adv. Mech. Eng. 2017, 9, 1–9. [Google Scholar] [CrossRef]
  3. Wang, F.; Chen, H. Degradation feature extraction of rolling bearings based on optimal ensemble empirical mode decomposition and improved composite spectrum analysis. In Proceedings of the ASME Turbo Expo 2018: Turbomachinery Technical Conference and Exposition, Oslo, Norway, 11–15 June 2018. [Google Scholar] [CrossRef]
  4. Jiang, F.; Zhu, Z.C.; Li, W.; Ren, Y.B.; Zhou, G.B.; Chang, Y.G. A fusion feature extraction method using EEMD and correlation coefficient analysis for bearing fault diagnosis. Appl. Sci. 2018, 8, 1621. [Google Scholar] [CrossRef]
  5. Yin, C.; Wang, Y.; Ma, G.; Wang, Y.; Sun, Y.; He, Y. Weak fault feature extraction of rolling bearings based on improved ensemble noise-reconstructed EMD and adaptive threshold denoising. Mech. Syst. Signal Process. 2022, 171, 108834. [Google Scholar] [CrossRef]
  6. Zhao, J.; Jia, R.; Wu, H.; Dong, K.; Dang, J. Extraction of vibration signal features based on FastICA-EEMD. J. Hydroelectr. Eng. 2017, 36, 63–70. [Google Scholar] [CrossRef]
  7. Zhao, L.; Zhou, Z.; Yin, Y.; Chen, R.; Liu, Q.; Wei, Q. Feature extraction of rolling bearing fault based on ensemble empirical mode decomposition and correlation dimension. In Proceedings of the ASME 2014 International Manufacturing Science and Engineering Conference, Detroit, MI, USA, 9–13 June 2014. [Google Scholar] [CrossRef]
  8. Dou, C.H. Fault feature extraction for gearboxes using empirical mode decomposition. Adv. Mater. Res. 2011, 383–390, 1376–1380. [Google Scholar] [CrossRef]
  9. Zhang, T.; Yang, X.; Li, Y.M.; Guo, H.; Shi, G.Y.; Chen, X.Y. Motor bearing fault diagnosis based on EEMD-IGWO-SVM. Mach. Tool Hydraul. 2024, 52, 174–181. [Google Scholar] [CrossRef]
  10. Song, L.Y.; Sun, L. Research on rolling bearing fault diagnosis based on EEMD-GSSA-SVM. Transducer Microsyst. Technol. 2022, 41, 56–59. [Google Scholar] [CrossRef]
  11. Li, S.Q.; Jiang, Z.J. Fault diagnosis method of rolling bearing based on EEMD-CNN. J. Mech. Strength 2020, 42, 1033–1038. [Google Scholar] [CrossRef]
  12. Chen, Q.Q.; Dai, S.W.; Bi, X.L. Rolling bearing fault diagnosis based on EEMD. Comput. Simul. 2021, 38, 361–364, 369. [Google Scholar] [CrossRef]
  13. Wang, Z.J.; Han, Z.N.; Liu, Q.Z.; Ning, S.H. Weak fault diagnosis for rolling element bearing based on MED-EEMD. Trans. Chin. Soc. Agric. Eng. 2014, 30, 70–78. [Google Scholar] [CrossRef]
  14. Zhu, J.; Li, O.; Chen, M.; Miao, L. Fault diagnosis of wind turbine rolling bearings based on DCS-EEMD-SSA. J. Fail. Anal. Prev. 2024, 24, 2495–2508. [Google Scholar] [CrossRef]
  15. Xiao, M.; Zhang, C.; Wen, K.; Xiong, L.; Geng, G.; Wu, D. Bearing fault feature extraction method based on complete ensemble empirical mode decomposition with adaptive noise. J. Vibroeng. 2018, 20, 2622–2631. [Google Scholar] [CrossRef]
  16. Huang, C.; Song, H. Fault feature extraction method for rolling bearing based on MVMD and complex Fourier transform. J. Vibroeng. 2022, 25, 269–289. [Google Scholar] [CrossRef]
  17. Huang, S.; Li, J.; Wang, Y.; Qin, Z. A two-step bearing fault diagnosis strategy under variable speed based on symplectic geometry modal decomposition and practical fault feature extraction framework. Meas. Sci. Technol. 2024, 35, 116121. [Google Scholar] [CrossRef]
  18. Cai, C.; Ren, Y.; Xue, Y.; Ren, J. Rolling bearing fault diagnosis method based on FFT-VMD multiscale information fusion and SE-TCN model. Struct. Durab. Health Monit. 2025, 19, 665–682. [Google Scholar] [CrossRef]
  19. Deng, W.; Guan, H.; Zhao, H. Parameterized iterative time-frequency-multisqueezing transform for bearing fault diagnosis. IEEE Trans. Instrum. Meas. 2025, 74, 1–10. [Google Scholar] [CrossRef]
  20. Yu, G.; Lin, T.; Wang, Z.; Li, Y. Time-reassigned multisynchrosqueezing transform for bearing fault diagnosis of rotating machinery. IEEE Trans. Ind. Electron. 2021, 68, 1486–1496. [Google Scholar] [CrossRef]
  21. Yu, J.; Wang, L.; Zhao, X.; Xiong, Y.; Huang, Y.; Fang, H. Second-order time-frequency-multisqueezing transform and its applications in rotating machinery fault diagnosis. In Proceedings of the 2024 Global Reliability and Prognostics and Health Management Conference (PHM-Beijing), Beijing, China, 18–20 October 2024. [Google Scholar] [CrossRef]
  22. Yu, Y.; Zhao, X. Time-frequency-ridges-based synchrosqueezing transform for flexible thin-wall bearing fault diagnosis. J. Sound Vib. 2025, 611, 119128. [Google Scholar] [CrossRef]
  23. Yan, J.; Peng, Y.; Li, Q.; Shao, H.; Bin, G.; Zheng, J.; Pan, H.; Shen, Y.; Guo, Y.; Zhou, J. Riesz time-frequency spectrum transform and its application in rolling bearing fault diagnosis. IEEE Sens. J. 2025, 25, 16764–16774. [Google Scholar] [CrossRef]
  24. He, Z.; Tu, X.; Wang, K.; Li, F.; Bao, W.; Bao, J. Comparison and application of frequency-reassigned synchrosqueezing transform and time-reassigned synchrosqueezing transform. J. Vib. Meas. Diagn. 2021, 41, 354–361. [Google Scholar] [CrossRef]
  25. Buchaiah, S.; Shakya, P. Bearing fault diagnosis and prognosis using data fusion based feature extraction and feature selection. Measurement 2022, 188, 110506. [Google Scholar] [CrossRef]
  26. Li, C.; Dong, C.; Fang, T. Bearing fault diagnosis based on FFT-CNN-BiGRU-attention. In Proceedings of the 4th International Conference on Computer, Artificial Intelligence and Control Engineering (CAICE 2025), Hangzhou, China, 23–25 May 2025. [Google Scholar] [CrossRef]
  27. Meng, Z.; Wang, Z.; Wang, Y.; Liu, J.; Fan, F. Adaptive multisynchrosqueezing transform for vibration signal analysis of rotating machinery. IEEE Trans. Instrum. Meas. 2025, 74, 1–10. [Google Scholar] [CrossRef]
  28. Zhu, K.; Sun, Z.; Wang, C.; Zhang, X.; Hu, X. An open-set diagnosis method for compound faults of rolling bearing based on TFMST and difficulty-aware simulator. IEEE Trans. Instrum. Meas. 2025, 74, 1–14. [Google Scholar] [CrossRef]
  29. Xu, M.; Yu, Q.; Chen, S.; Lin, J. Rolling bearing fault diagnosis based on CNN-LSTM with FFT and SVD. Information 2024, 15, 399. [Google Scholar] [CrossRef]
Figure 1. Flowchart of the proposed vibration feature identification method.
Lubricants 14 00217 g001
Figure 2. SSB-100 marine water-lubricated stern bearing test rig: (a) schematic diagram of the test rig structure; (b) photograph of the test rig.
Lubricants 14 00217 g002
Figure 3. Friction coefficient curve of the water-lubricated stern bearing.
Lubricants 14 00217 g003
Figure 4. Frequency-domain comparison of vibration signals at different rotational speeds.
Lubricants 14 00217 g004
Figure 5. Ranked energy proportions of IMF components (The numerical values above the bars represent the center frequencies of the corresponding IMF components.).
Lubricants 14 00217 g005
Figure 6. Frequency-domain spectra at different rotational speeds and corresponding TFMST results: (a) frequency-domain spectra at different rotational speeds; (b) TFMST result at 20 r/min; (c) TFMST result at 100 r/min; (d) TFMST result at 500 r/min.
Lubricants 14 00217 g006
Figure 7. Friction coefficient curves under different operating durations.
Lubricants 14 00217 g007
Figure 8. Frequency-domain comparison of vibration signals under different wear conditions.
Lubricants 14 00217 g008
Figure 9. Ranked energy contributions of IMF components (The numerical values above the bars represent the center frequencies of the corresponding IMF components.).
Lubricants 14 00217 g009
Figure 10. Frequency-domain spectra under different operating durations and corresponding TFMST results: (a) frequency-domain spectra under different operating durations; (b) TFMST result at 100 h; (c) TFMST result at 500 h; (d) TFMST result at 1000 h.
Lubricants 14 00217 g010
Table 1. Testing procedures.
Test ProjectFlow Rate
(L/min)
Specific Pressure
(MPa)
Cumulative Operation Time
(h)
Rotational Speed
(r/min)
Speed Characteristic test230.55600~10
Wear resistance test100010~600~10
Disclaimer/Publisher’s Note: The statements, opinions and data contained in all publications are solely those of the individual author(s) and contributor(s) and not of MDPI and/or the editor(s). MDPI and/or the editor(s) disclaim responsibility for any injury to people or property resulting from any ideas, methods, instructions or products referred to in the content.