Article

The Influence of Lubricant and Sheet Thickness of 1.4376 During Deep Drawing


Faculty of Technology, Tomas Bata University in Zlin, Vavreckova 5669, 760 01 Zlin, Czech Republic
*
Author to whom correspondence should be addressed.
Lubricants 2026, 14(6), 218; https://doi.org/10.3390/lubricants14060218
Submission received: 29 April 2026 / Revised: 25 May 2026 / Accepted: 26 May 2026 / Published: 27 May 2026

Abstract

This work is concerned with the influence of lubricant, sheet thickness, position of production during sheet metal forming (deep drawing) on mechanical properties. The deep drawing process was carried out on a BUP-600 instrument using the Erichsen method, which uses a 20 mm diameter ball draw bar. The individual forming tests were carried out on 1.4376 plate with thicknesses of 1.5 mm and 1 mm. The drawing of the sheets was carried out with and without lubricant to assess the effect of the lubricant on the resulting properties. The actual forming results of the plates were verified by FEM analysis in AutoForm software, which pointed out the critical areas on the part. These specified locations were further subjected to mechanical property measurements. As shown in this work, the areas of sheet metal forming showed significant strengthening, which was reflected by an increase in mechanical properties at each location. The difference in mechanical properties between the unformed area of the sheet metal and the area on the sheet metal that was formed by deep drawing was up to 63% (Vickers hardness, indentation modulus). The lubricant had a significant impact on the drawing process; when applied, both the drawing distance and the force increased by approximately 25%. This can result in additional cracking of the sheet metal parts. This research has significant implications for the deep drawing of sheet metal in practice, pointing out the issue of critical points that need to be further accounted for and possibly eliminated or at least minimized. Plastic deformation occurring during deep drawing leads to an increase in material hardness and tensile strength. As a result, the formed parts achieve improved stiffness and load-bearing capability. The study contributes to a better understanding of how strain hardening can be maximized in critical regions of the drawn part without inducing fracture. Furthermore, the research describes the influence of sheet thickness variation during the drawing process, which is essential for maintaining the structural integrity of the component. The study further emphasizes the significance of lubrication and friction conditions in reducing the forces required for drawing, thereby preventing crack initiation and surface defects on the drawpiece.

1. Introduction

Deep drawing technology can be considered very widespread in all areas of production, and a large number of products are manufactured using this technology. Deep drawing can be used to produce a wide range of parts of various shapes and sizes. The main advantages of the drawing process and associated procedures are reduced production time, optimized waste, and fewer individual production operations. Complex presses and forming equipment allow multiple operations to be performed in succession, so that a finished part can be produced on a single type of equipment without having to interfere with the production process. Another advantage of the technology is the elimination of finishing operations, mainly due to the high quality of the drawing tools. The surface of the product reflects the quality of the tools themselves. However, the drawing process is influenced by a number of factors that must be monitored in order to produce a defect-free product. This is aided by the development of new types of materials, the development of stronger and more durable tools, the possibility of producing more precise drawing tools thanks to the development of machining, and the use of auxiliary elements such as braking elements and profiled retainers [1,2].
One of the important parameters of formability is the crystal structure of metals. The metal forming process affects the arrangement of individual atoms in the crystal lattice, the shape of the crystals, and their composition. The forming process is influenced by imperfections in the crystal lattice, which are called dislocations (edge or screw). During cold forming, lattice defects (dislocations) are created and grow. The individual defects interact with each other, causing an accumulation of dislocations and hard particles at the grain boundaries, which leads to strain hardening of the material. Strengthening leads to the exhaustion of the material’s plasticity and the inability to further form it. Excessive strengthening causes stress peaks and microcracks to form, which spread and cause metal failure. Dislocations move under load and cause permanent (plastic) deformation. Shape change (deformation) occurs due to the action of external or internal forces, but the material must not be damaged. Deformation is divided into elastic (flexible) and plastic [1,2].
Elastic deformation returns after the load is removed, and only plastic (permanent) deformation remains, which is irreversible [3]. In order to shape the material, it is necessary to reach the yield point (the stress at which plastic deformation occurs), but the strength limit must not be exceeded, as this would cause permanent damage to the material. During plastic deformation, there is significant movement of the atoms of the crystal lattice due to the higher stress value. After the stress is removed, the atoms remain in a displaced position. Plastic deformations are achieved by the movement of dislocations (crystal lattice defects) in the slip crystallographic plane. The mechanism of plastic deformation is slip [4,5].
Sheet drawing is a process in which a drawing die is used to shape a flat sheet by flowing material between the surface of the drawing die and the drawing mandrel. The blank is formed into a cylindrical, conical, rectangular, or other general shape. This technology makes it possible to produce final blanks with a minimum number of operations, minimal waste, and usually without additional operations [6,7,8].
Deep drawing is mainly used in the automotive industry, but products can also be found in aircraft, ships, and heavy machinery. Other areas include the electrical engineering industry, the production of sinks, sheet metal covers, etc. Ever-increasing costs are driving deep drawing technology forward, making it possible to produce in small and series production without compromising the quality of the parts [9,10,11].
The sheets for deep drawing technology are a very important group of materials, primarily in the automotive industry. Drawing can be used to produce car body panels, fenders, roofs, door panels, etc. Depending on the application, steels provide different mechanical properties. They excel in terms of high yield strength, tensile strength, or high fracture toughness. Thanks to the large local deformation during deep drawing, the part excels in its mechanical properties, which is used during car accidents, when deformation energy is absorbed, thus protecting the car’s occupants [12].
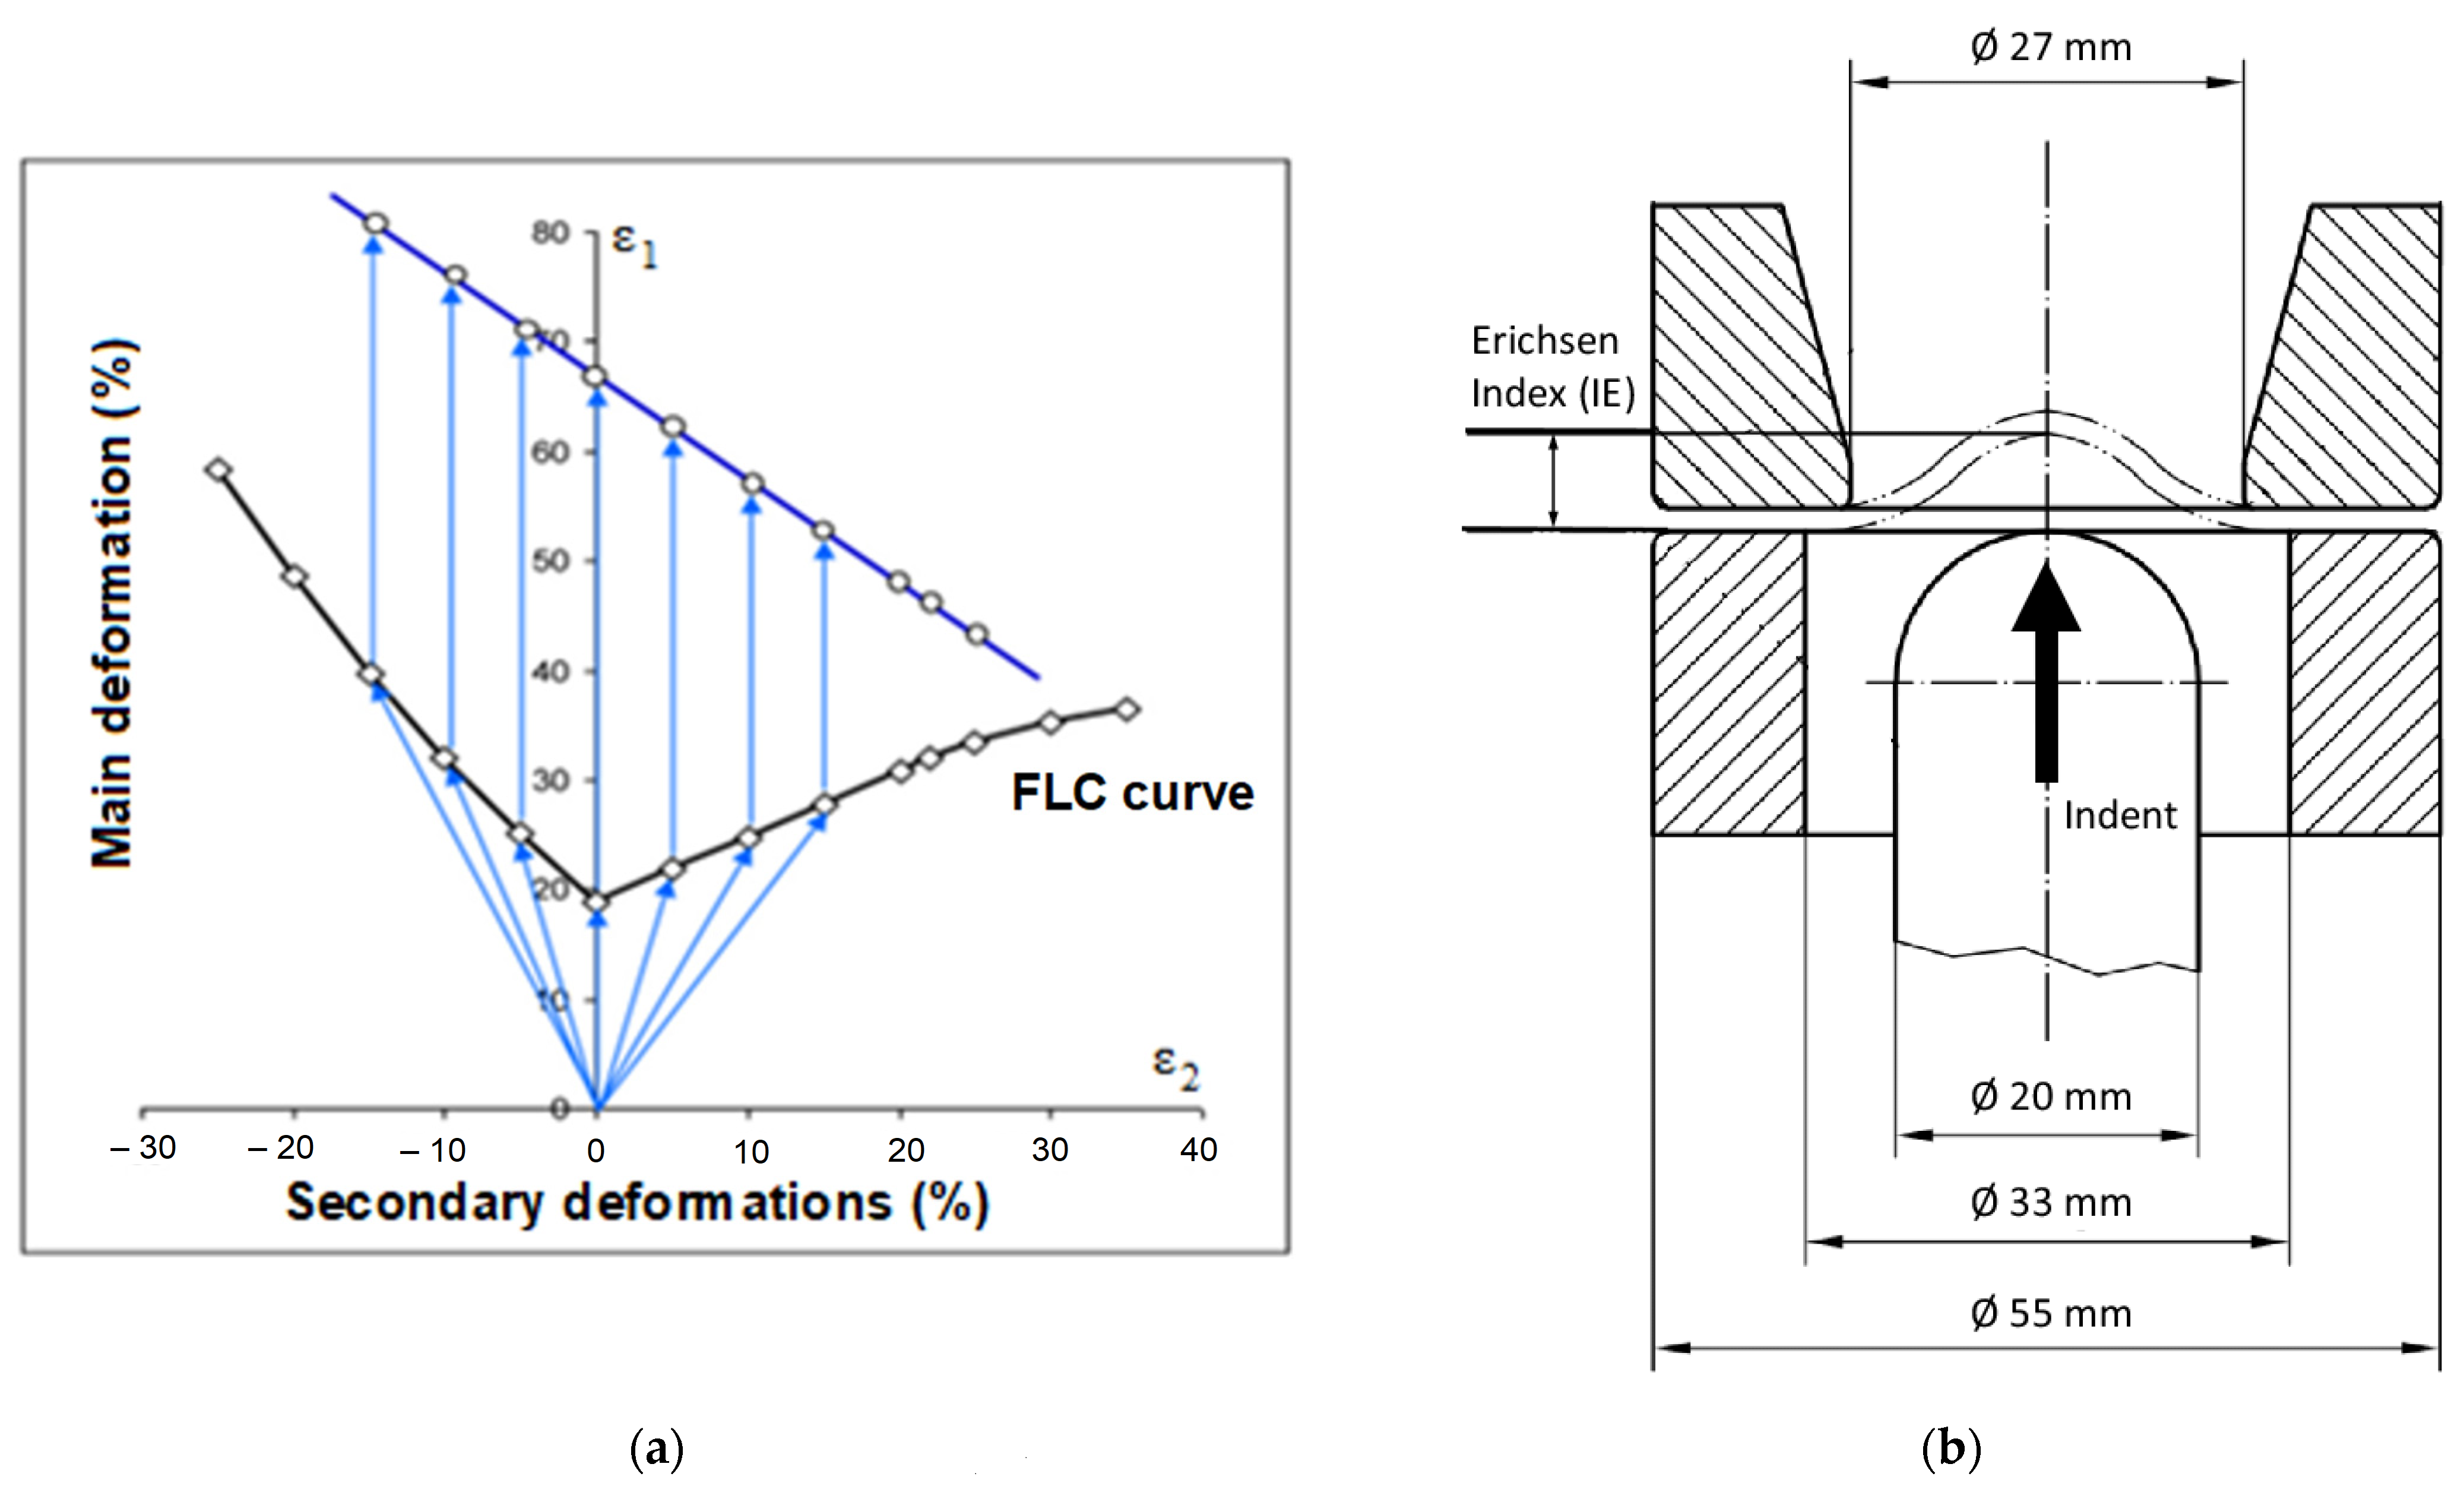
To assess the deep drawability of sheet metal, technological tests are performed that approximate the behavior of the sheet metal in a real forming process. Basic technological tests of deep drawability include, for example, Erichsen, Nakajima, LDH, etc. The basic parameter describing the formability of sheet metal is shown in the FLD, which contains the measured values of material deformation. The Forming Limit Diagram (FLD) is a comprehensive graphical representation integrating the material forming limit curve (FLC) with the real strain values obtained from the tested drawn component. The FLC is a material-dependent characteristic defining the limiting strain conditions under sheet metal forming processes. The forming limit curve (FLC) is used to assess the forming limit of sheet metal parts, indicating the transition from safe values to sheet metal failure values. The FLC represents the almost real deformation of the material (cracking or localized thinning) (Figure 1a) [13,14,15].
The most widely used test for assessing the deep drawability of thin sheets was the Erichsen deep drawing test. The test consists of pressing a ball-shaped punch with a diameter of 20 mm into the center of the sheet, creating a depression in the sheet. The force is transmitted hydraulically or mechanically. The sheet is held in place by a holder and the forming of the sheet is linked to the shape of the block. The test is defined by ISO 20482 [16] and allows the formability of different types of sheets to be verified. The result is the Erichsen number EI, which indicates the depth of sheet metal stretching until the first crack appears (Figure 1b) [14,15,17].
The advantage of the test is its simplicity, easy sample preparation, and time efficiency. The evaluation of the suitability of sheet metal for deep drawing considers the shape of the crack formation. The disadvantage of the test with manual movement of the punch is the distortion of the results, which depend on the speed and smoothness of the punch pressing. The test does not capture the anisotropy of the mechanical properties of the sheet metal and may distort the results for one type of sheet metal within a single test [17,18].
According to previously published studies, an increase in sheet thickness generally reduces formability when the tool geometry and material remain unchanged; however, the magnitude of this effect is strongly influenced by the microstructure, temperature, strain-hardening behavior, and other processing conditions. It has been shown that sheet thickness significantly affects formability in the Erichsen cupping test, where thinner sheets commonly achieve higher Erichsen index (IE) values and larger cup heights under equivalent testing conditions. In addition, several studies have described that thickness variations, together with microstructural characteristics and related deformation effects, influence the evaluation results obtained from ECT and LDR/FLC analyses [19,20,21].
Lubricants reduce friction coefficients compared to dry contact in formability-relevant tests. For Nb-stabilized AISI 430 ferritic stainless steel in deep drawing quality, lubrication reduced COF relative to dry contact in formability tests, with observations tied to surface texture and relative elongation; this demonstrates the lubricant’s role in reducing resistance to sheet sliding and delaying onset of high-pressure contact regions during forming. The implication is that lubrication can provide differential benefits across the forming path, which translates to higher EI or greater cup depth before fracture in Erichsen-type tests under lubricated conditions. Surface texture and lubricant interactions influence friction and formability. For AISI 430 Nb-stabilized stainless steel, the study found that the coefficients of friction and wear resistance depend on surface roughness and the specific friction test, with lubricants capable of reducing COF under the tested conditions. This implies potential EI gains in Erichsen cupping when suitable lubricants are employed, especially for textured tool/strip surfaces representative of die radii and blankholder interfaces in cupping [22,23,24]. Because the Erichsen test probes biaxial stretch behavior, it is particularly valuable for materials or processing conditions where uniaxial tensile properties do not fully capture forming performance, such as in ultrafine-grained (UFG) or heavily processed microstructures where strain localization can dominate biaxial stretch behavior [25,26].
Friction between the sheet and tooling significantly affects Erichsen test results. Lubrication reduces frictional resistance, affects the punch load–displacement curve, and can alter the apex thinning and the distance to the thinnest region on the blank surface. Experimental work shows that friction conditions modify the load–displacement response and, in turn, can influence the measured IE and related metrics in Erichsen tests on aluminum alloys. Some investigations emphasize the influence of friction on the apparent formability and the shape of the dome during cupping. The standard punch diameter and die geometry are important for consistency and comparability. The common 20 mm punch diameter is referenced as a standard in Erichsen cupping research, enabling comparison across materials and welding states, and ensuring that the region around the weld or grain boundary is evaluable with adequate resolution [23,27,28].
The issue of deep drawing of sheet metal is addressed in a number of studies [29,30,31,32,33,34,35,36,37,38,39], which focus on the possibilities of deep drawing, but none of them address the effect of sheet metal drawing on the mechanical properties at individual points of the draw.
The innovative aspect of this study stems from the detailed characterization of the tribological system, encompassing the deformation response of 1.4376 steel, the effect of sheet thickness on contact mechanics, and above all the influence of lubricants operating under boundary lubrication regimes. As the sheet thickness decreases, the contribution of surface roughness to the overall friction behavior becomes increasingly significant. In addition, thinner sheets display altered kinetics of strain-induced martensitic transformation during cold forming (TRIP effect), thereby modifying the contact pressure distribution and the lubrication requirements during forming. Moreover, compared with conventional stainless steels, 1.4376 steel is more susceptible to localized thermal accumulation.
This study builds upon previous research [38], which examined the properties and deformation characteristics of sheet metal during Nakajima testing. In contrast, the Erichsen cupping test employs a relatively small punch diameter of 20 mm, making the forming response highly sensitive to local thickness variations, friction conditions, and punch radius geometry. Addressing these parameters constitutes the main objective of the present study and significantly broadens the understanding of the deep drawing behavior of 1.4376 stainless steel, particularly in the forming of small drawn components.
The aim of this work is to assess the effect of forming (deep drawing) using the Erichsen method on sheet metal parts of various thicknesses on mechanical properties. The mechanical properties were measured at pre-specified locations of the drawn sheet metal, and the effect on strengthening and the possibility of crack formation were assessed. Furthermore, the work deals with a comparison of sheet metal drawing with and without lubricant.

2. Materials and Methods

The main objective of this work is to investigate the influence of deep drawing, lubricant, sheet thickness, and individual forming areas on mechanical properties. Measurements were performed ten times on each sample and then statistically evaluated.

2.1. Sample Material

With regard to the requirements placed on the forming process, stainless steel was chosen, which is used in the automotive industry for its high strength, ductility, and low weight and corrosion resistance. Another advantage of stainless steel is the material’s ability to absorb deformation energy. For this work, an austenitic steel sheet with the designation ČSN EN 1.4376 (X8CrMnNi19-6-3) according to the ČSN EN 10088 standard [40] was selected. The material was supplied by Zapp Precision Metals GmbH (Unna, Germany). The chemical composition of the material is shown in Table 1 and mechanical properties in Table 2. Sheet thicknesses of 1 mm and 1.5 mm were selected. For the selected 1.4376 sheets, a piece approximately 150 mm wide and 600 mm long was cut.

2.2. Deep Drawing Process Simulation

Deep drawing simulation was set up in AutoForm R8, developed by AutoForm (Zurich, Switzerland). This program enables the simulation of the entire deep drawing process together with shape cutting and following shaping. Due to the simplicity of the part shape, the process settings were considered only for deep drawing without trimming. The simulation results compare the formability according to the Formability Limit Curve (FLC) of a specific material (evaluation of the safe zone and tear condition), the amount of sheet thinning at individual points, and the amount of corrugation.
The simulation was also set up to compare drawing sheets with and without lubricant. Oil with a friction coefficient of 0.07 from the database software was used to lubricate the drawing operation. In the case of the unlubricated variant (dry contact), a friction coefficient of 0.4 was applied in the numerical simulation. Austenitic stainless steels alloyed with manganese are highly prone to adhesive wear. Under direct metal-to-metal contact, the immediate formation of micro-welds occurs, resulting in galling. Accordingly, both dry and lubricated conditions were considered in the present study.
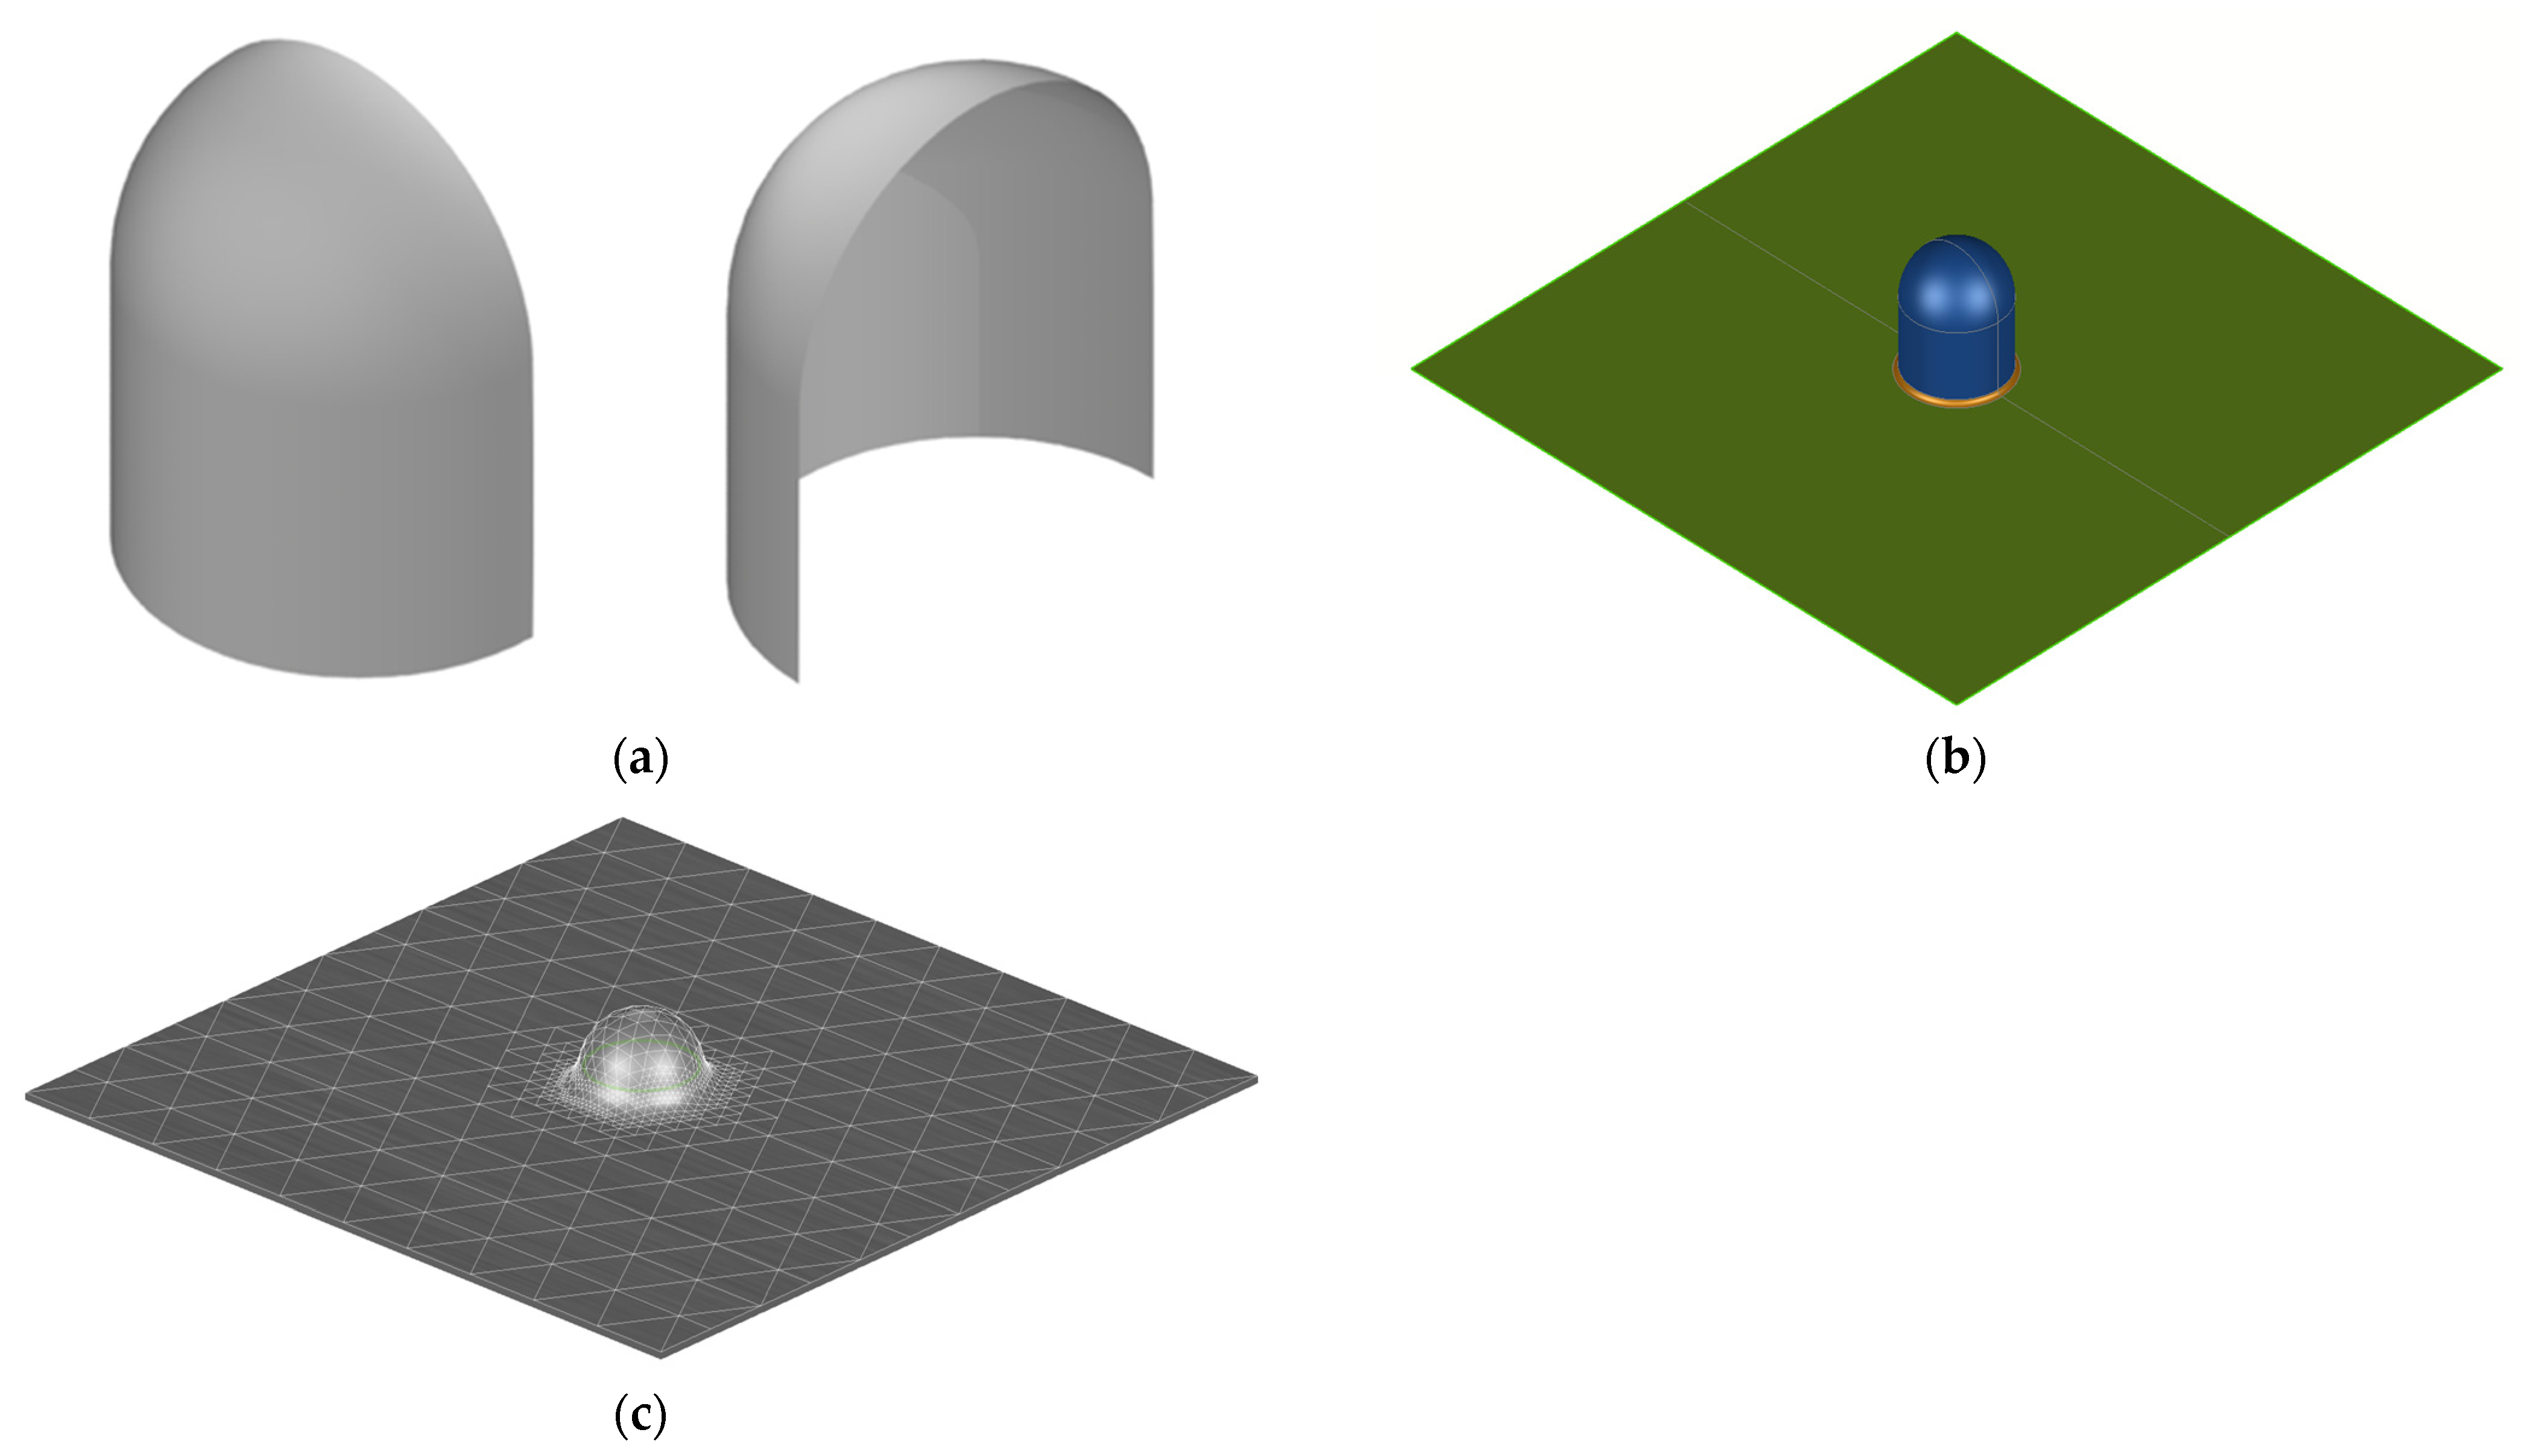
The drawing process was performed according to the Erichsen method. In the Erichsen method, a spherical mandrel with a diameter of 20 mm is pressed in. In order to perform the simulation, it is necessary to model domes that correspond in size to the spherical mandrels (Figure 2a,b).
The model was meshed using an adaptive mesh (Figure 2c); the main mesh settings were a meshing tolerance of 0.05 mm and a maximum side length of 20 mm.
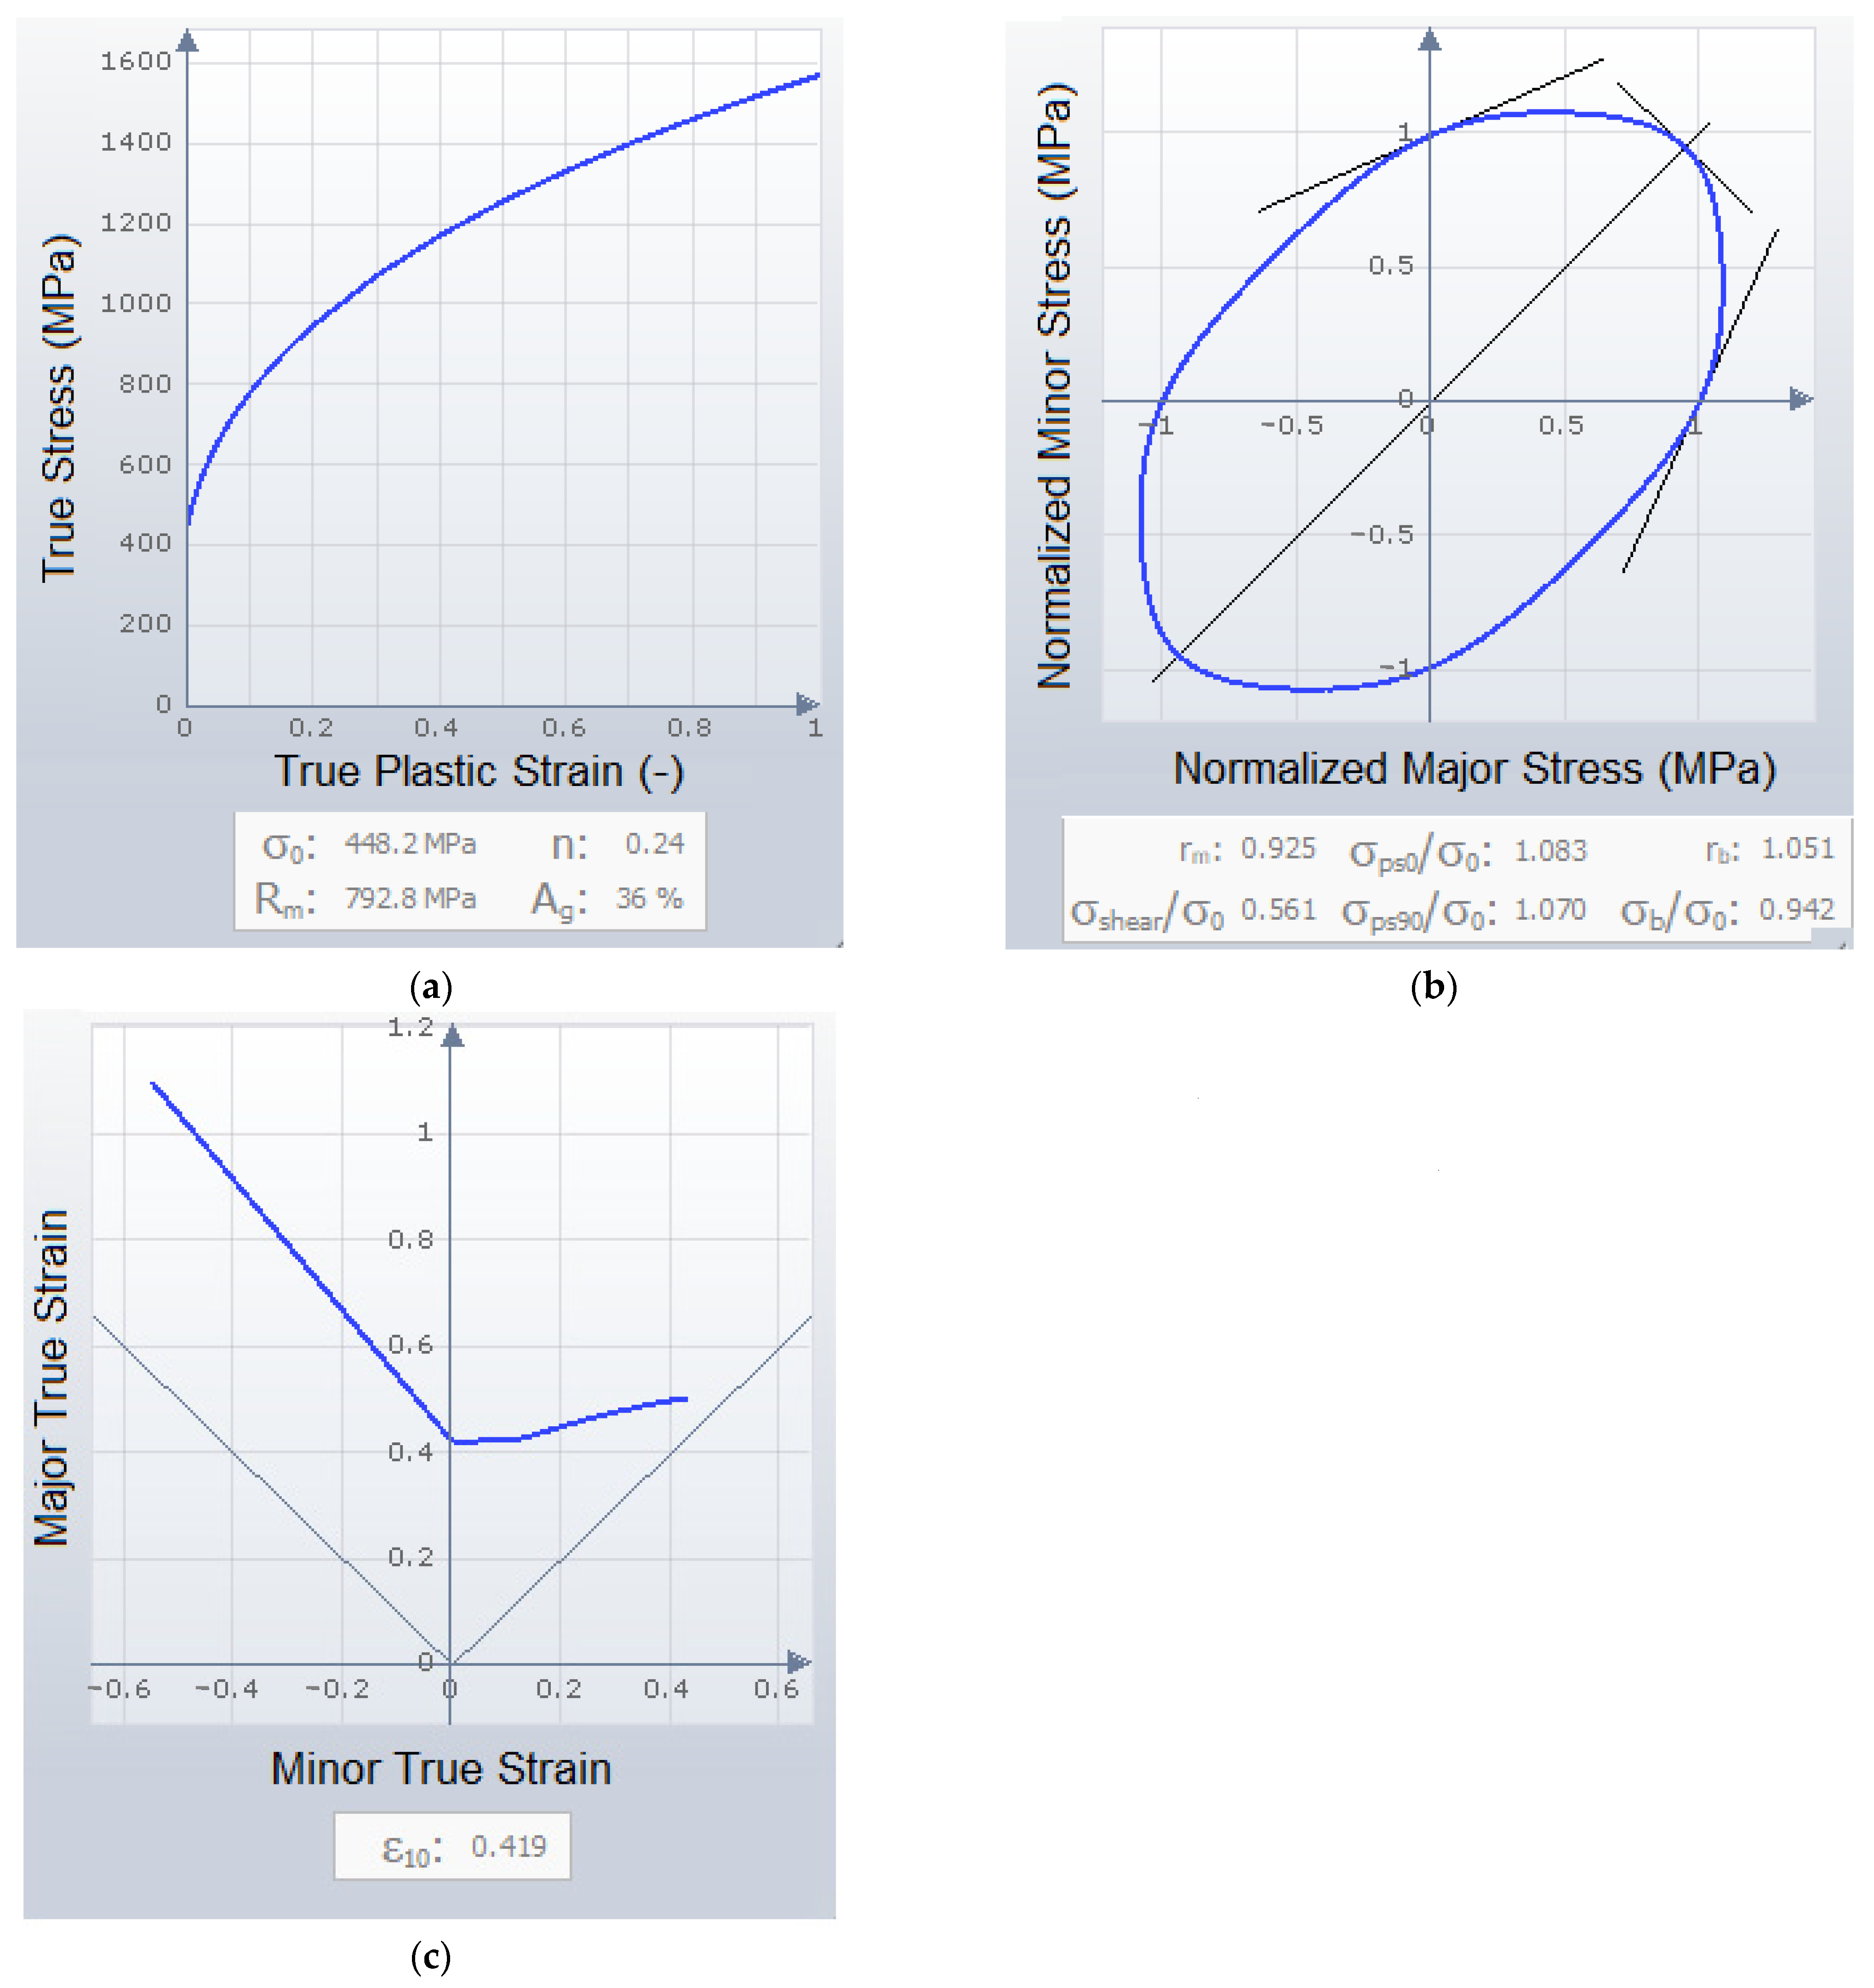
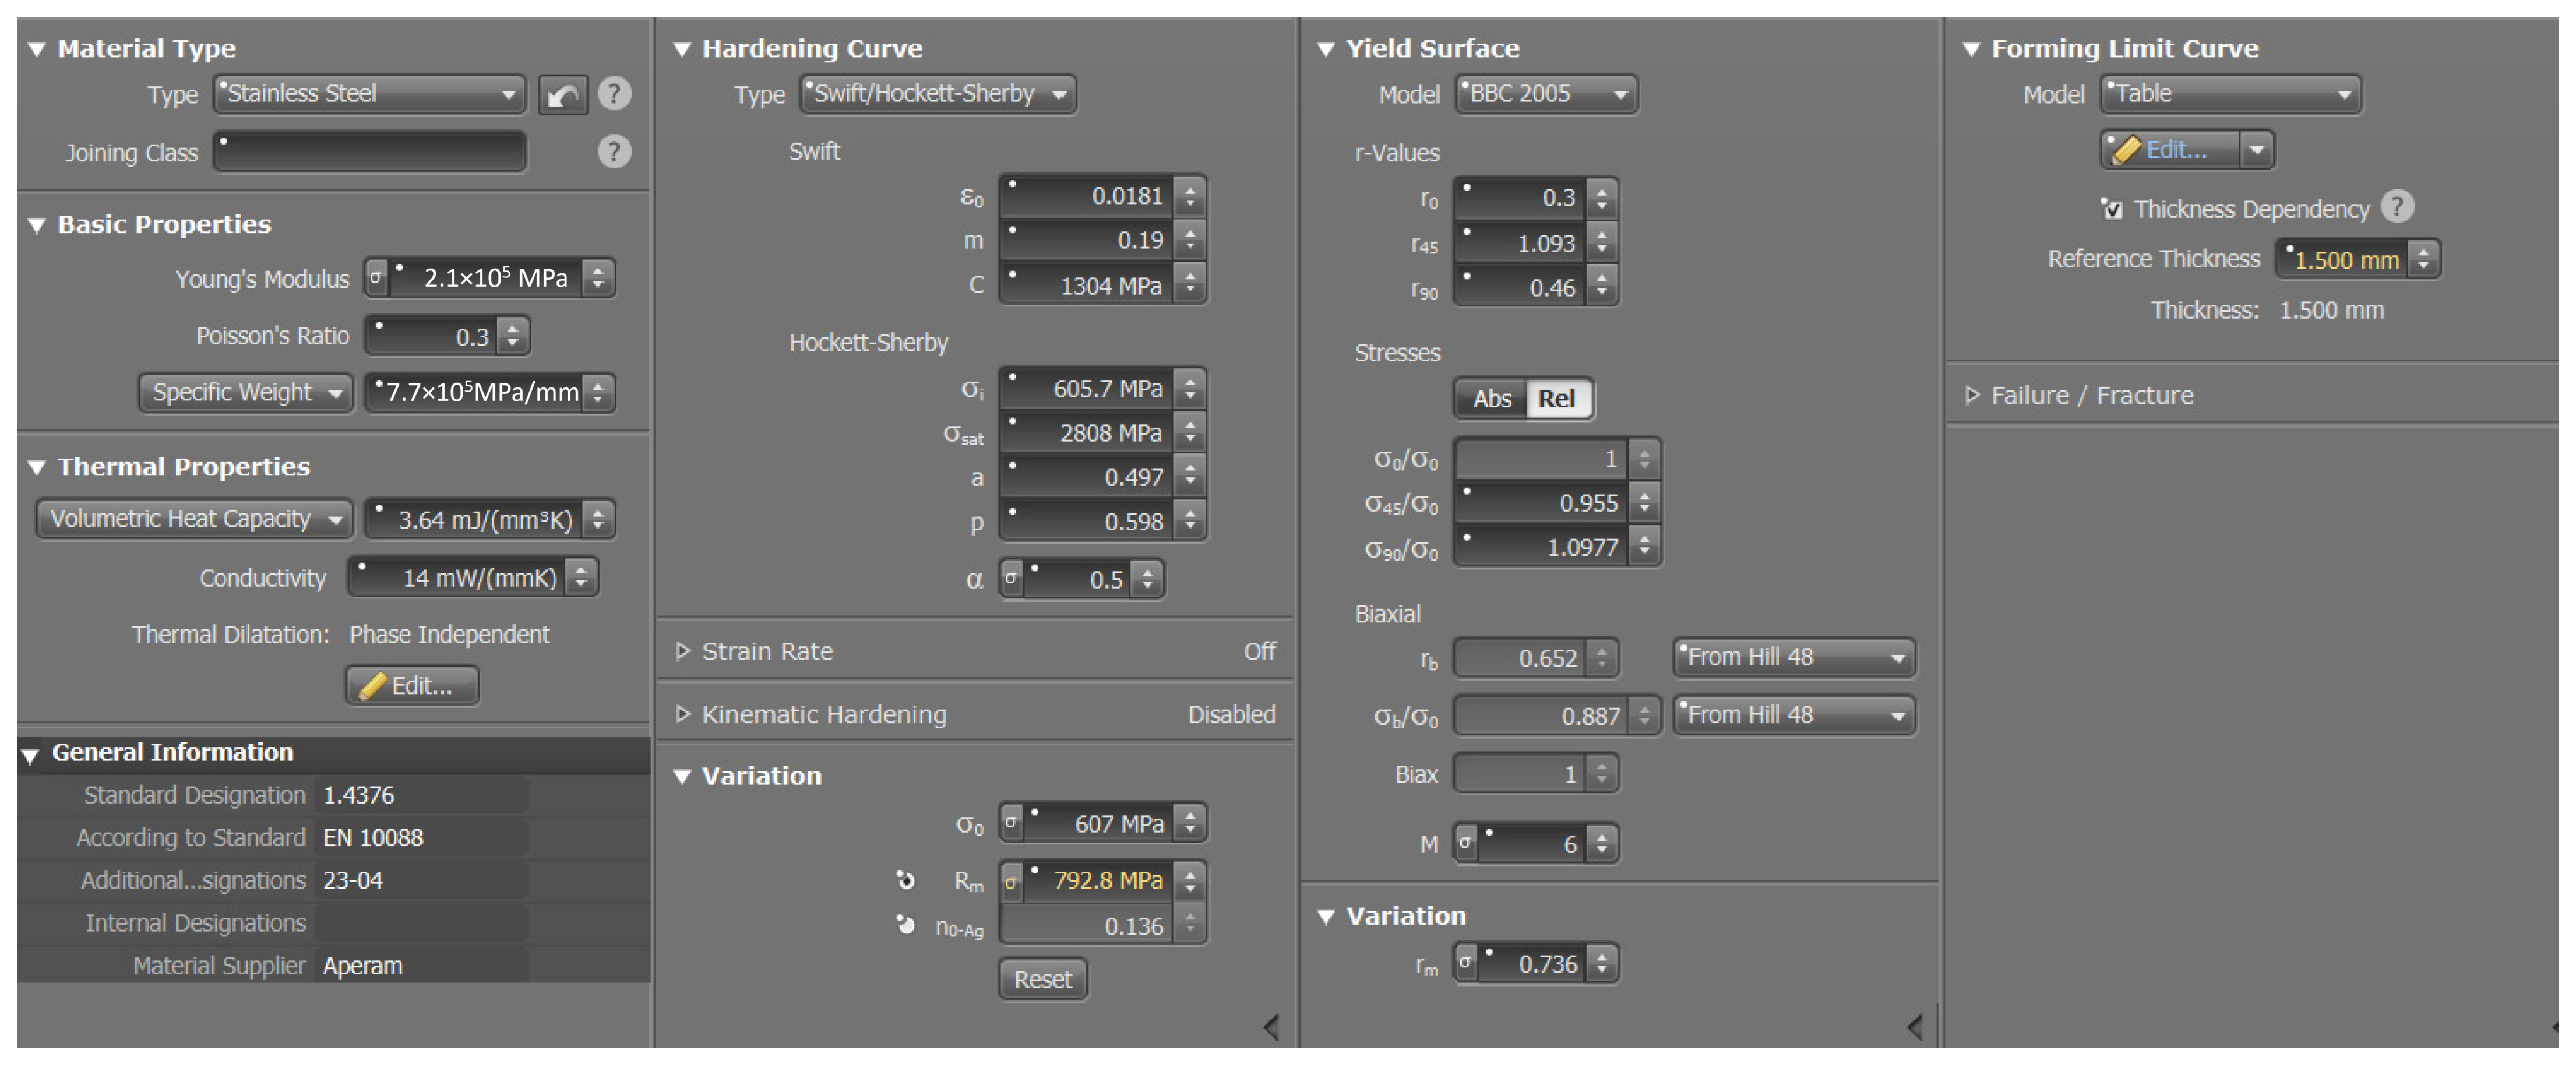
An Autoform material card for stainless steel ČSN EN 1.4376 (X8CrMnNi19-6-3) was selected for the simulation, with the following properties: Young’s modulus 210 GPa, Poisson’s ratio 0.3, and tensile strength 792.8 MPa. Figure 3 shows the material card (hardening curve—Figure 3a; yield surface—Figure 3b Formability Limit Curve—Figure 3c). The material models were adopted from the AutoForm R8 database. The material characteristics used in the simulations corresponded to the experimentally tested material.
Stainless steels alloyed with manganese and nitrogen (1.4376) are characterized by a pronounced strain-hardening response. At elevated strain levels, the hardening behavior no longer follows a linear trend and approaches the saturation stress. Accordingly, the Hockett–Sherby hardening law was employed owing to its suitability for describing the flow behavior of stainless steels.
Figure 3a also shows the hardening curve, which was gained by the Swift/Hockett-Sherby method. AutoForm requires true stress as a function of true plastic deformation measured in the direction of rolling. In this image, the values of the uniform elongation (Ag), yield stress (σ0), tensile strength (Rm), and strain-hardening exponent (n) are highlighted.
Figure 3b shows the yield surface defined by method BBC 2005 criteria with consideration of material anisotropy. The figure demonstrates the main values of this model. rm is the average ratio of plastic deformation in the 0°, 45°, and 90° directions of the sheet rolling; rb is the ratio of plastic deformation for dual-axis yielding, which is defined as the ratio of deformation ε2 and ε1; σb0 is the ratio between the beginning of yield and yield strength for uniform dual-axis yielding; σps00 is the ratio between planar deformation stress in the 0° direction of rolling and yield strength; σps900 is the ratio between planar deformation stress in the 90° direction of rolling and yield strength; and σshear0 is the ratio between shear stress and yield strength. Since the BBC2005 yield criterion was used, the key anisotropy parameters (r-values) are listed here: r0 = 0.3, r45 = 1.093, r90 = 0.46, and the yield stress values: σ0 = 607.0 MPa, σ45 = 579.7 MPa, and σ90 = 666.3 MPa.
The formability assessment was carried out using the Forming Limit Diagram (FLD) approach. The effect of sheet thickness was incorporated into the material card definition. As the sheet thickness increases, the Forming Limit Curve (FLC) shifts towards higher strain values, indicating improved resistance to fracture during forming. AutoForm employs shell-type finite elements. The thickness parameter defined in the material card determines both the structural stiffness of the sheet and the distribution of numerical integration points, where the stress state is evaluated through multiple through-thickness layers (typically 5–11), allowing the stress gradient between the inner and outer sheet surfaces to be accurately represented. In addition, sheet thickness directly influences the contact pressure within the material model. Increasing sheet thickness results in higher forming loads and consequently in greater pressure acting on the lubricant film. When an advanced lubrication model is applied in the simulation, sheet thickness indirectly affects the potential breakdown of the lubricant film and the onset of galling.
Figure 3c shows the Formability Limit Curve (FLC). The curve demonstrates the maximum value of the main deformation stresses ε1 and ε2 measured at the initial creation of fracture in the material. For austenitic stainless steel 1.4376, the TABLE model (experimental data) is strongly recommended. In AutoForm, the TABLE model means that the software uses precisely defined curve points obtained experimentally from a Nakajima test. The TABLE model was used for the FLC; this model works with real, experimentally measured data entered into a data table. The TABLE model accounts for the effect of sheet thickness.
Figure 4 shows information regarding the material data sheet (stainless steel 1.4376) used to calculate the simulations of the individual variants in AutoForm software.
Table 3 shows a comparison of the Erichsen index with and without lubricant. The comparison of Erichsen index (IE) values as a function of sheet thickness and lubrication condition provides an essential tribological characterization of 1.4376 stainless steel. Effective lubrication reduces frictional resistance and simultaneously limits localized heat generation during the forming process. The resulting lower temperature may promote the formation of deformation-induced martensite, thereby increasing the strength of the dome region and potentially affecting the final IE value in a counterintuitive manner. To validate the material model in AutoForm, experimentally determined IE values for at least two sheet thicknesses and two lubrication conditions are required (Table 3), enabling calibration of both the friction coefficient and the Forming Limit Curve (FLC).
The simulation in AutoForm software for all variants was set up to correspond to the actual formability test on the BUP 600 device manufactured by Zwick (Ulm, Germany). The formability test was terminated when the sample broke at a certain draw depth (travel). Based on these conditions, the simulation was set up to compare the actual draw with the simulation.

2.3. Deep Drawing of Sheet Metals

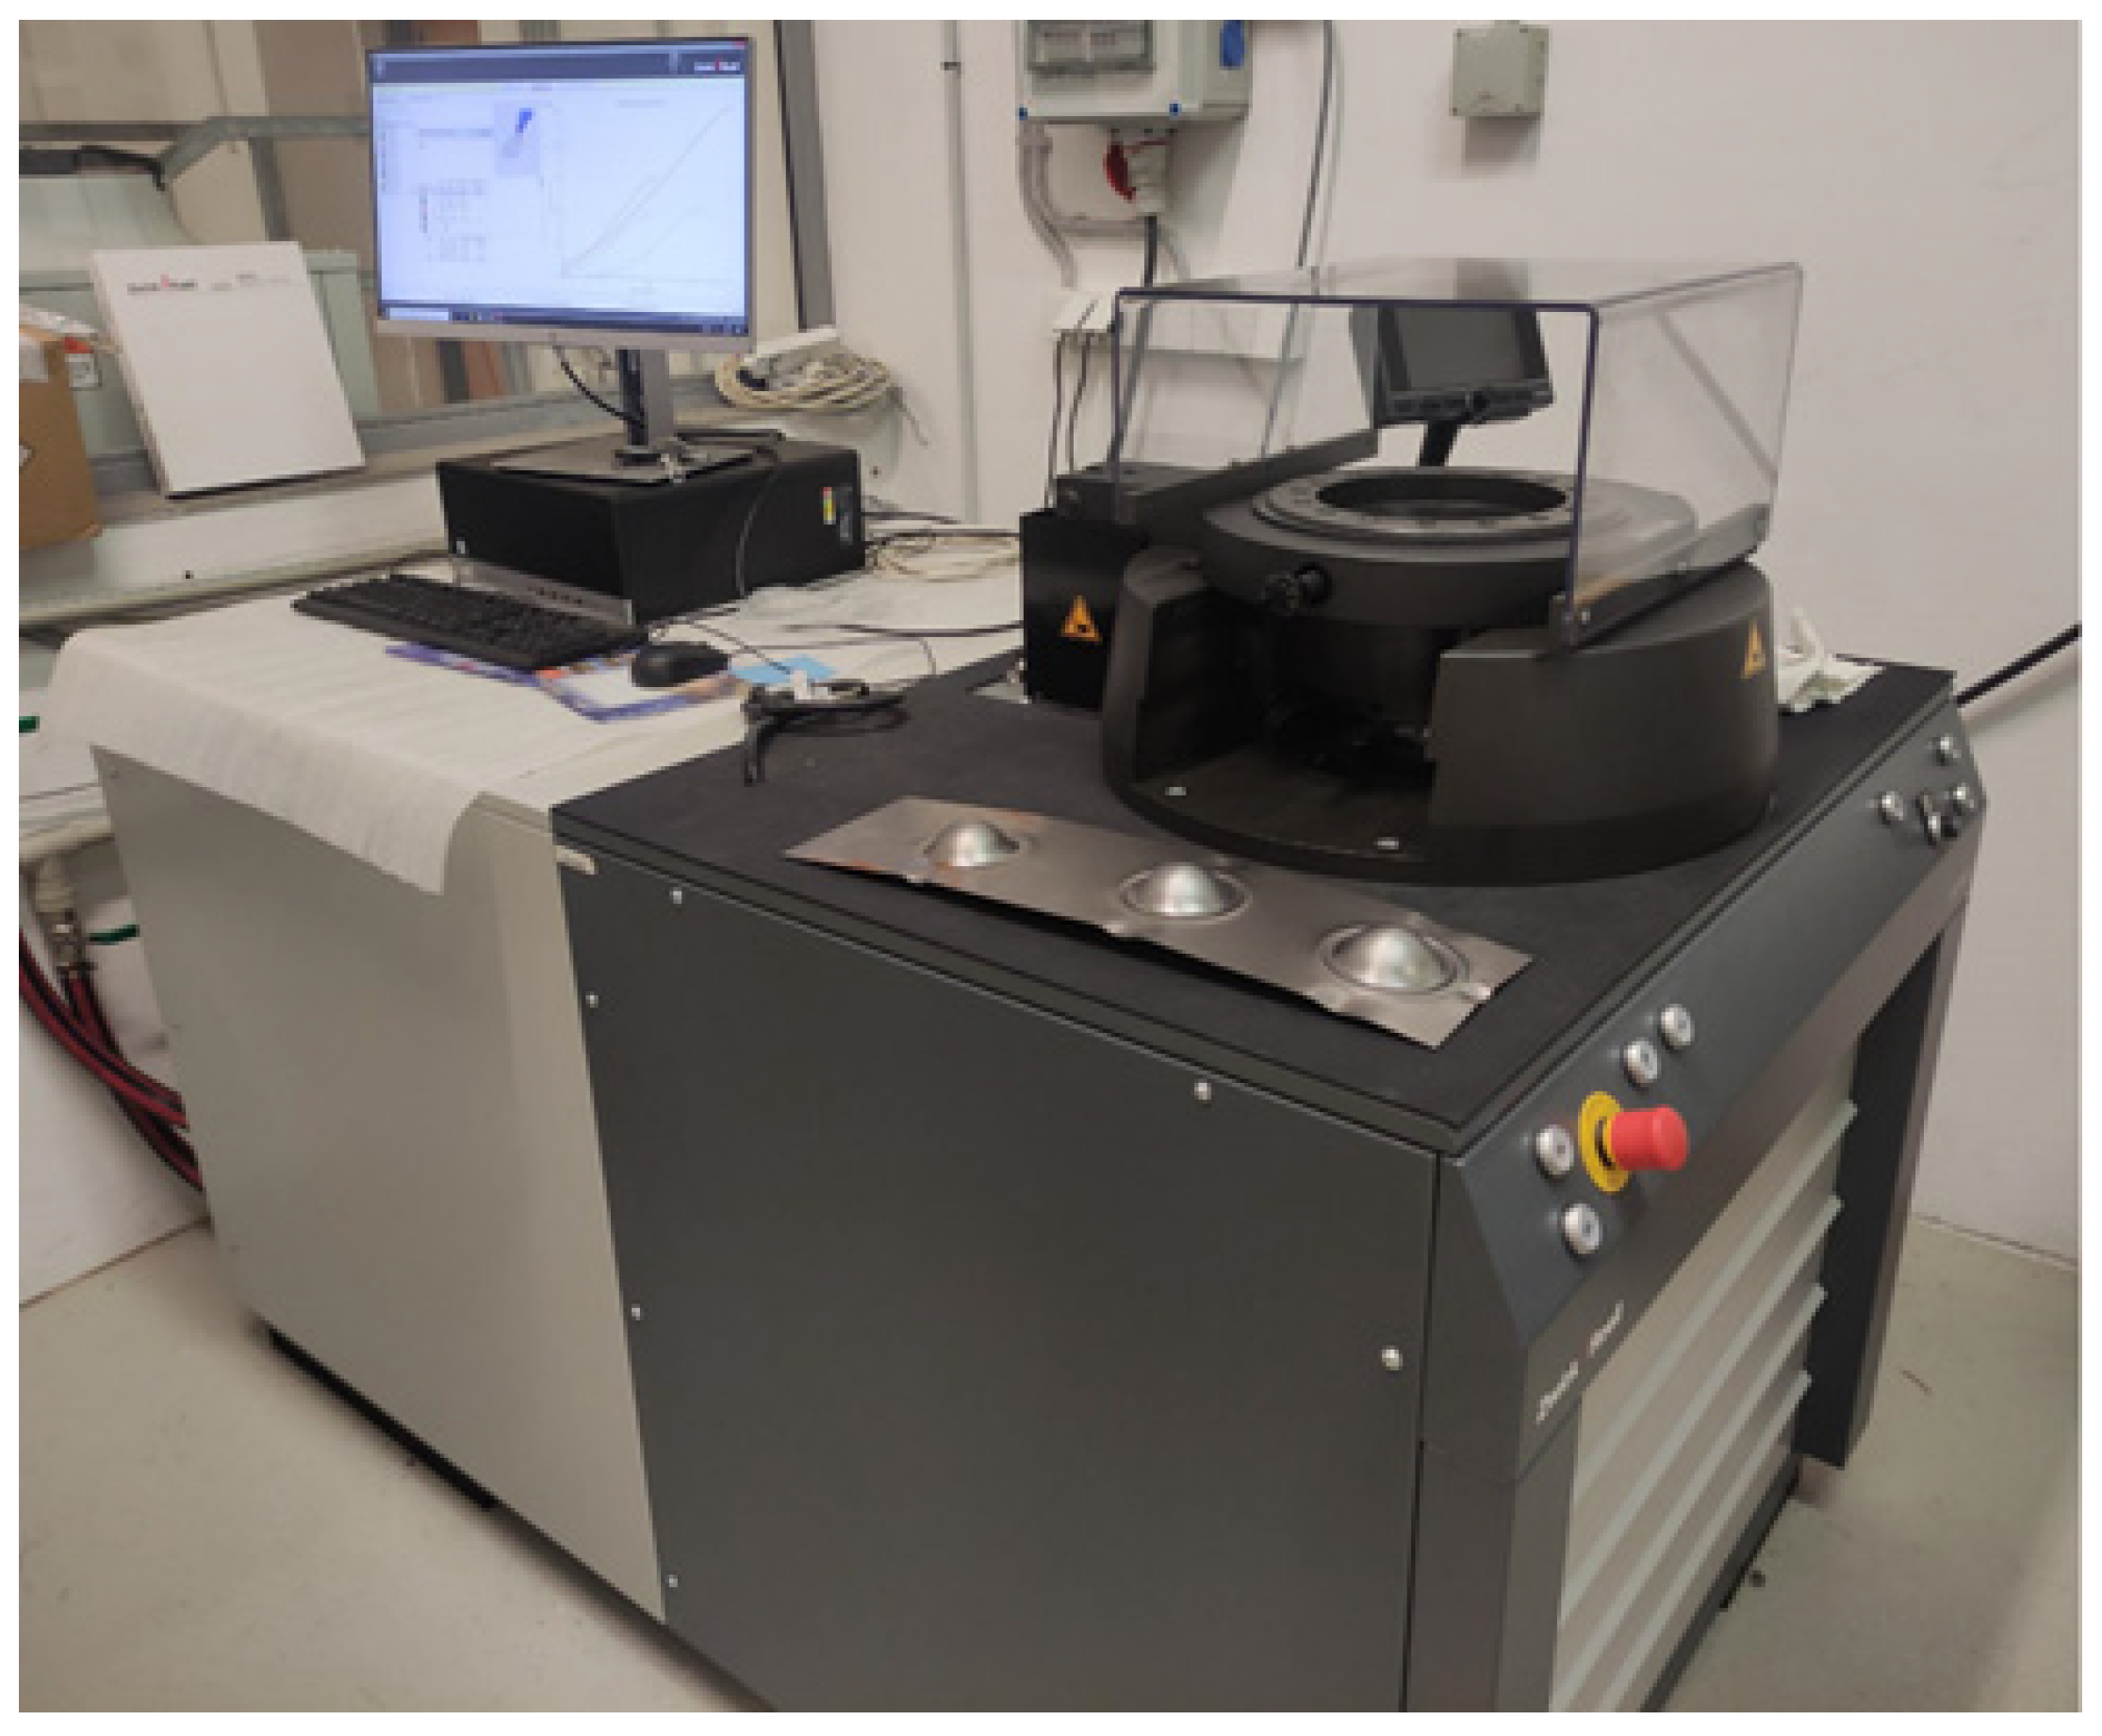
Experiments with deep drawing were conducted with the BUP 600 tool (Figure 5) manufactured by Zwick (Ulm, Germany). This machine is designed for sheet metal testing, which can lead to the determination of formability and influence of surface treatments and lubricants on the behavior of sheet metals during the deep drawing process. BUP–600 enables the inspection of the effectivity of the forming tool during the drawing process, as well as how individual process parameters affect the process. The basic machine parameters can be seen in Table 4.
To compare the effect of the lubricant on the sheet metal drawing, the lubricant type SAF 125 N from BBL Lubricants (Uhersky Brod, Czech Republic) was used. SAF 125 N is based on synthetic and vegetable renewable polymers, specially designed for use in deep drawing areas and high-speed operations of ferrous and non-ferrous materials. The lubricant was sprayed as a thin layer on both sides of the sheet metal. The technical parameters of the lubricant can be seen in Table 5.

2.4. Sample Preparation

To perform the deep drawing test, samples were prepared, individual segments were cut, pressed, and polished.
The individual segments were cut on a Buehler IsoMet 4000 laboratory linear precision saw using a diamond grinding wheel by company Buehler (Lake Bluff, IL, USA). To eliminate the thermal influence of the cutting process, a cooling liquid was fed to the cutting site. The saw speed was set to 2000 rpm.
The cut segments were then pressed on a SimpliMet 1000 automatic press from the company Buehler (Lake Bluff, IL, USA). The pressing process was set to a heating time (1:30 min), cooling time (4 min), and pressing pressure (290 bar). The sample diameter was set to 40 mm and the pressing temperature to 150 °C. PhenoCure resin from the same company, Buehler, was used as the powder.
The pressed samples were then ground on an EcoMet 250 Pro device with a rotating AutoMet 250 head from Buehler (Lake Bluff, IL, USA). The rotation speed of the head (40 rpm) and table (100 rpm) was set on the device, as well as the pressure force (20 N) with which the samples are pressed against the grinding wheel. Water was fed to the grinding site to improve the cooling effect and chip removal. Grinding was performed in several steps with grinding wheels of different grit sizes (P180, P320, P600, and finally P1200). A diamond suspension with particle sizes of 9 μm and 3 μm was used to polish the samples. Polishing was performed without cooling.

2.5. Mechanical Properties

Instrumented hardness testing is performed using the MCT3 micro-combination tester from CSM instruments (Graz, Austria). The measurement parameters are set to an indentation force of 1 N, a loading and unloading speed of 2 N/min, and a load holding time of 12 s. The measurement was performed in accordance with the ČSN 14557 standard [41,42,43,44].
Indentation hardness (HIT) is a material’s resistance to permanent (plastic) deformation, determined via Instrumented Indentation Testing (DSI) based on load–depth curves rather than measuring residual indentation size. Unlike conventional methods, it is calculated continuously during loading, providing a fast, automated measure of surface properties, thin films, or small volumes, often in compliance with ISO 14577 [41,42,43,44]. It is calculated as the maximum load (Fmax) divided by the projected area of contact (Ap) at that load, often using a Vickers or Berkovich indenter [41,42,43,44].
H I T = F m a x A p
Indentation modulus (EIT) is a key mechanical parameter derived from Instrumented Indentation Testing (DSI) that quantifies a material’s elasticity, closely approximating Young’s modulus. It is calculated from the unloading slope of the indentation curve according to standards like ISO 14577, reflecting the elastic response of coatings and bulk materials [41,42,43,44].
As described in the ISO14577 standard, the reduced modulus (Er), is used to account for the fact that the elastic displacements occur in both the indenter and the sample. The instrumented elastic modulus in the test material (EIT), can be calculated from (Er). Where (νs) is the Poisson’s ratio for the sample and (Ei) and (νi) are the elastic modulus and Poisson’s ratio, respectively, of the indenter. This reduced elastic modulus can be linked to the measured stiffness S [41,42,43,44].
E I T = E · ( 1 v s 2 )
E = 1 1 E r 1 v i 2 E i
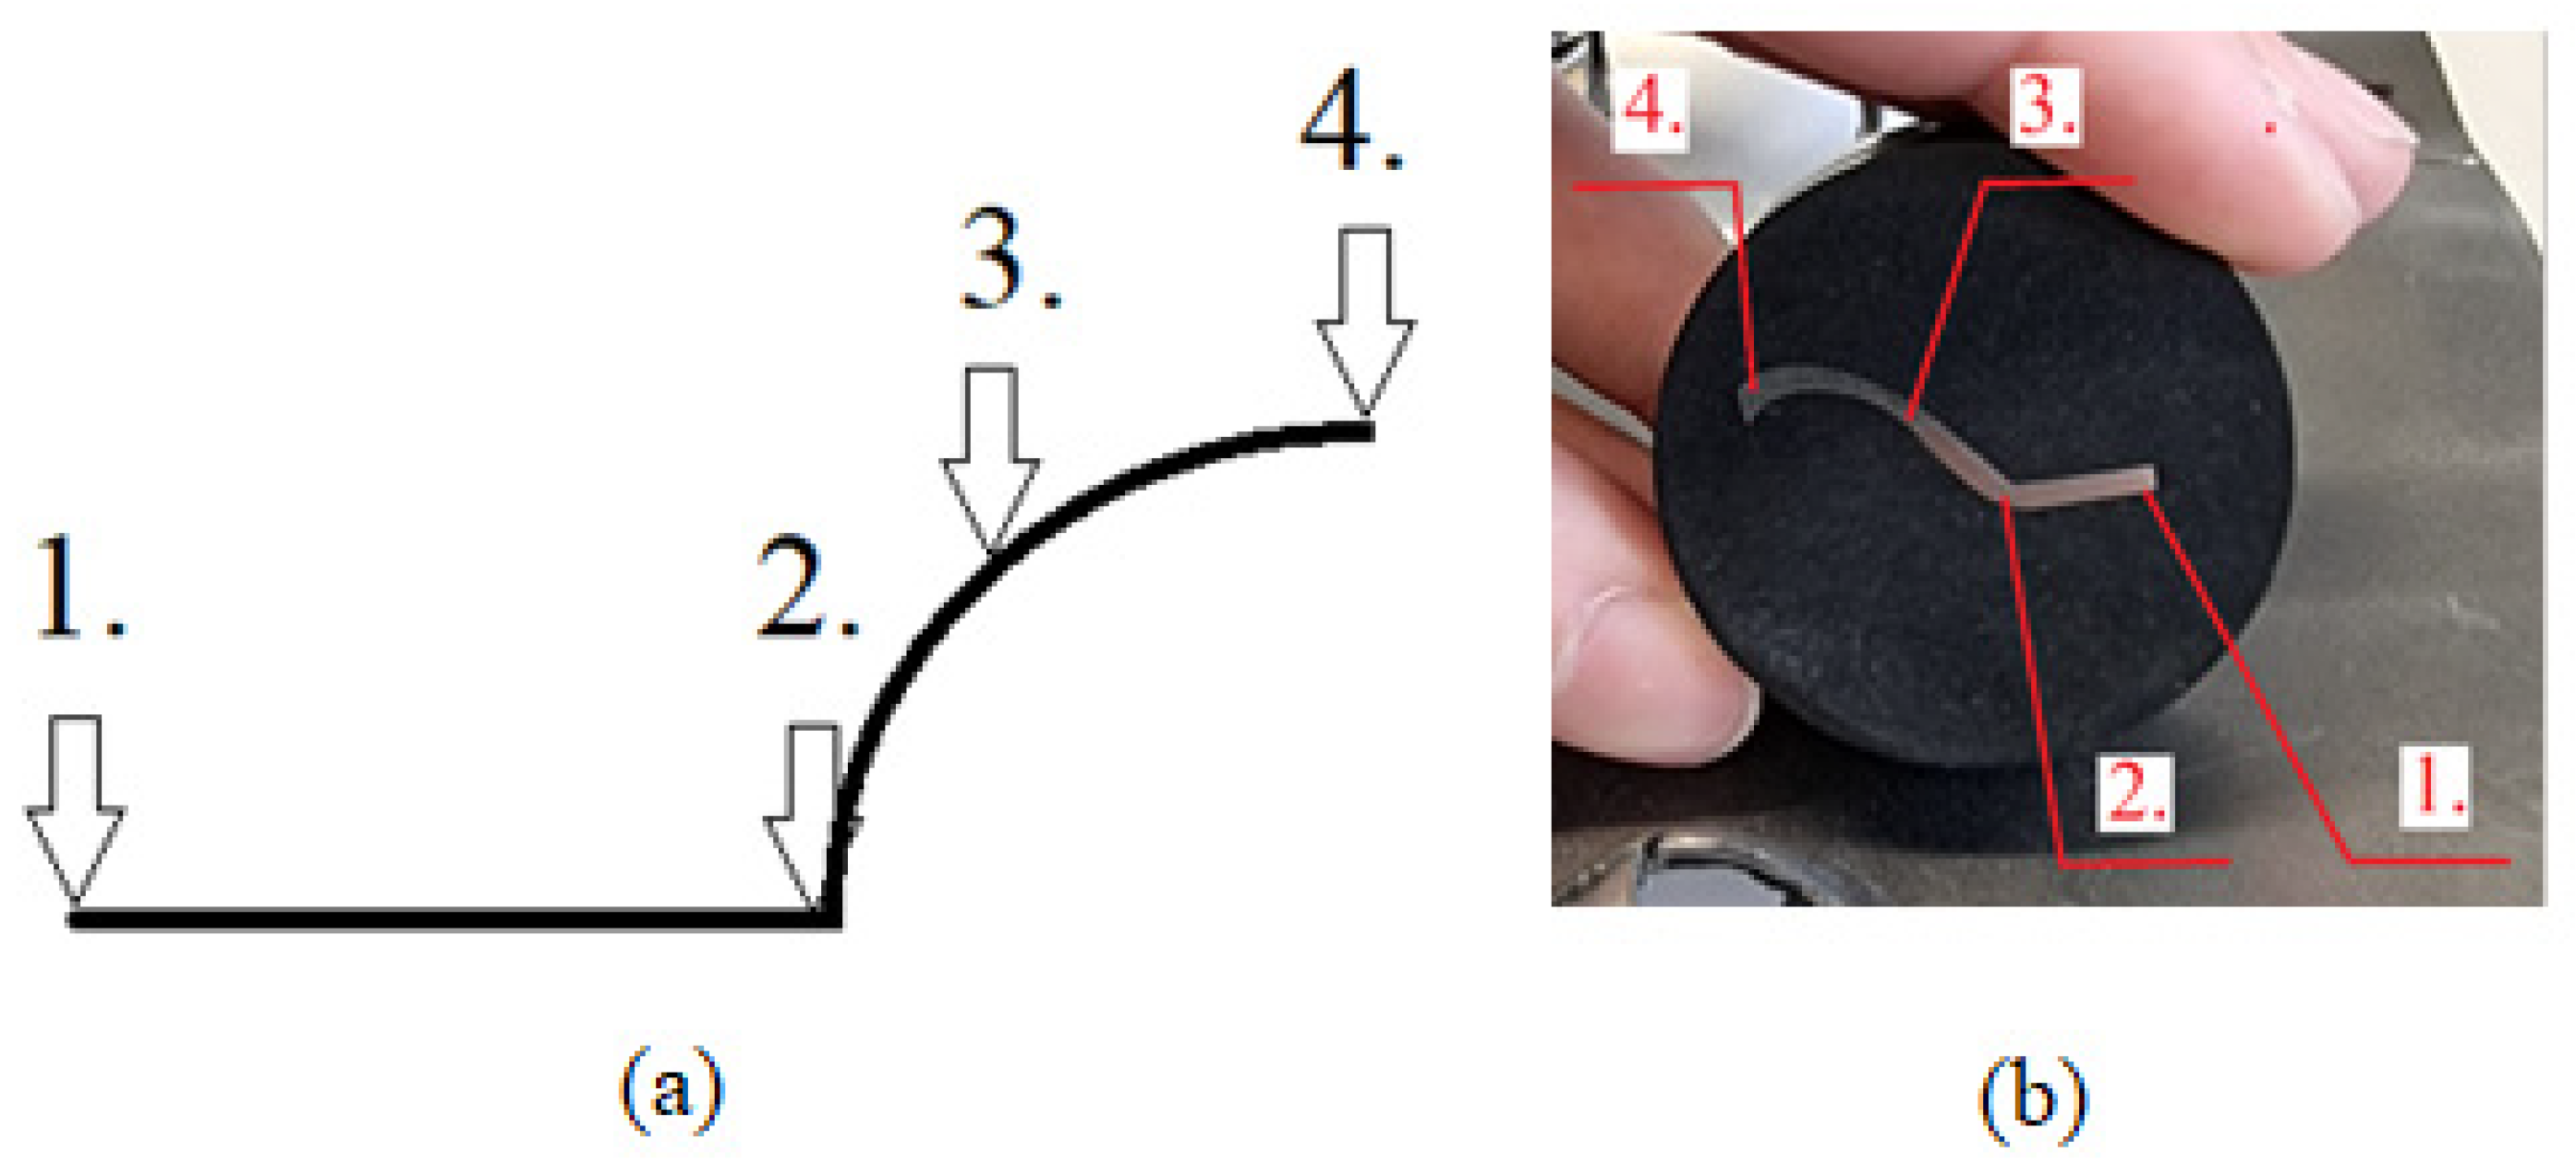
The individual measurement points for the Erichsen geometry are shown in Figure 6. These are as follows:
  • The area of the original (unaffected) metal sheet (1.);
  • The area of the beginning of deep drawing (2.);
  • The area of deep drawing process (3.);
  • The area of the peak of the draw (4.).
The segments of the drawn sheet metal were cut so as not to affect the key areas of the extract, such as the lower radius (area 3), and lower (area 4), and upper dome (areas 5 and 6) of the extract. The sheet was cut into three segments, between segments 2 and 3 and between segments 4 and 5. The tested X8CrMnNi19-6-3 sheet is an austenitic stainless steel with anisotropic properties. For this reason, the individual cuts and measurements of mechanical properties were performed along the axes of material anisotropy, as based on the authors’ findings in publication [45].

3. Results

Deep drawing was performed on prepared blanks of various thicknesses using the Erichsen method, both with and without lubricant. Forming simulation was performed to verify the forming process and identify critical points. The mechanical properties (indentation hardness, Vickers hardness, indentation modulus, and deformation work) were measured on the prepared samples at specified locations.

3.1. Forming Simulation

This chapter looked at simulations of the drawing process for sheets with thicknesses of 1.5 mm and 1 mm. For both sheet variants, drawing was simulated without lubricant and with lubricant. The simulation in Autoform software was set up according to a real formability test (based on the drawing depth until cracking occurred). The simulation therefore shows areas that may indicate sample cracking in red. When comparing the simulation and the real test, it can be stated that sample cracking was detected in the same places.

3.1.1. Comparison of the Influence of Lubricant on the Drawing Process

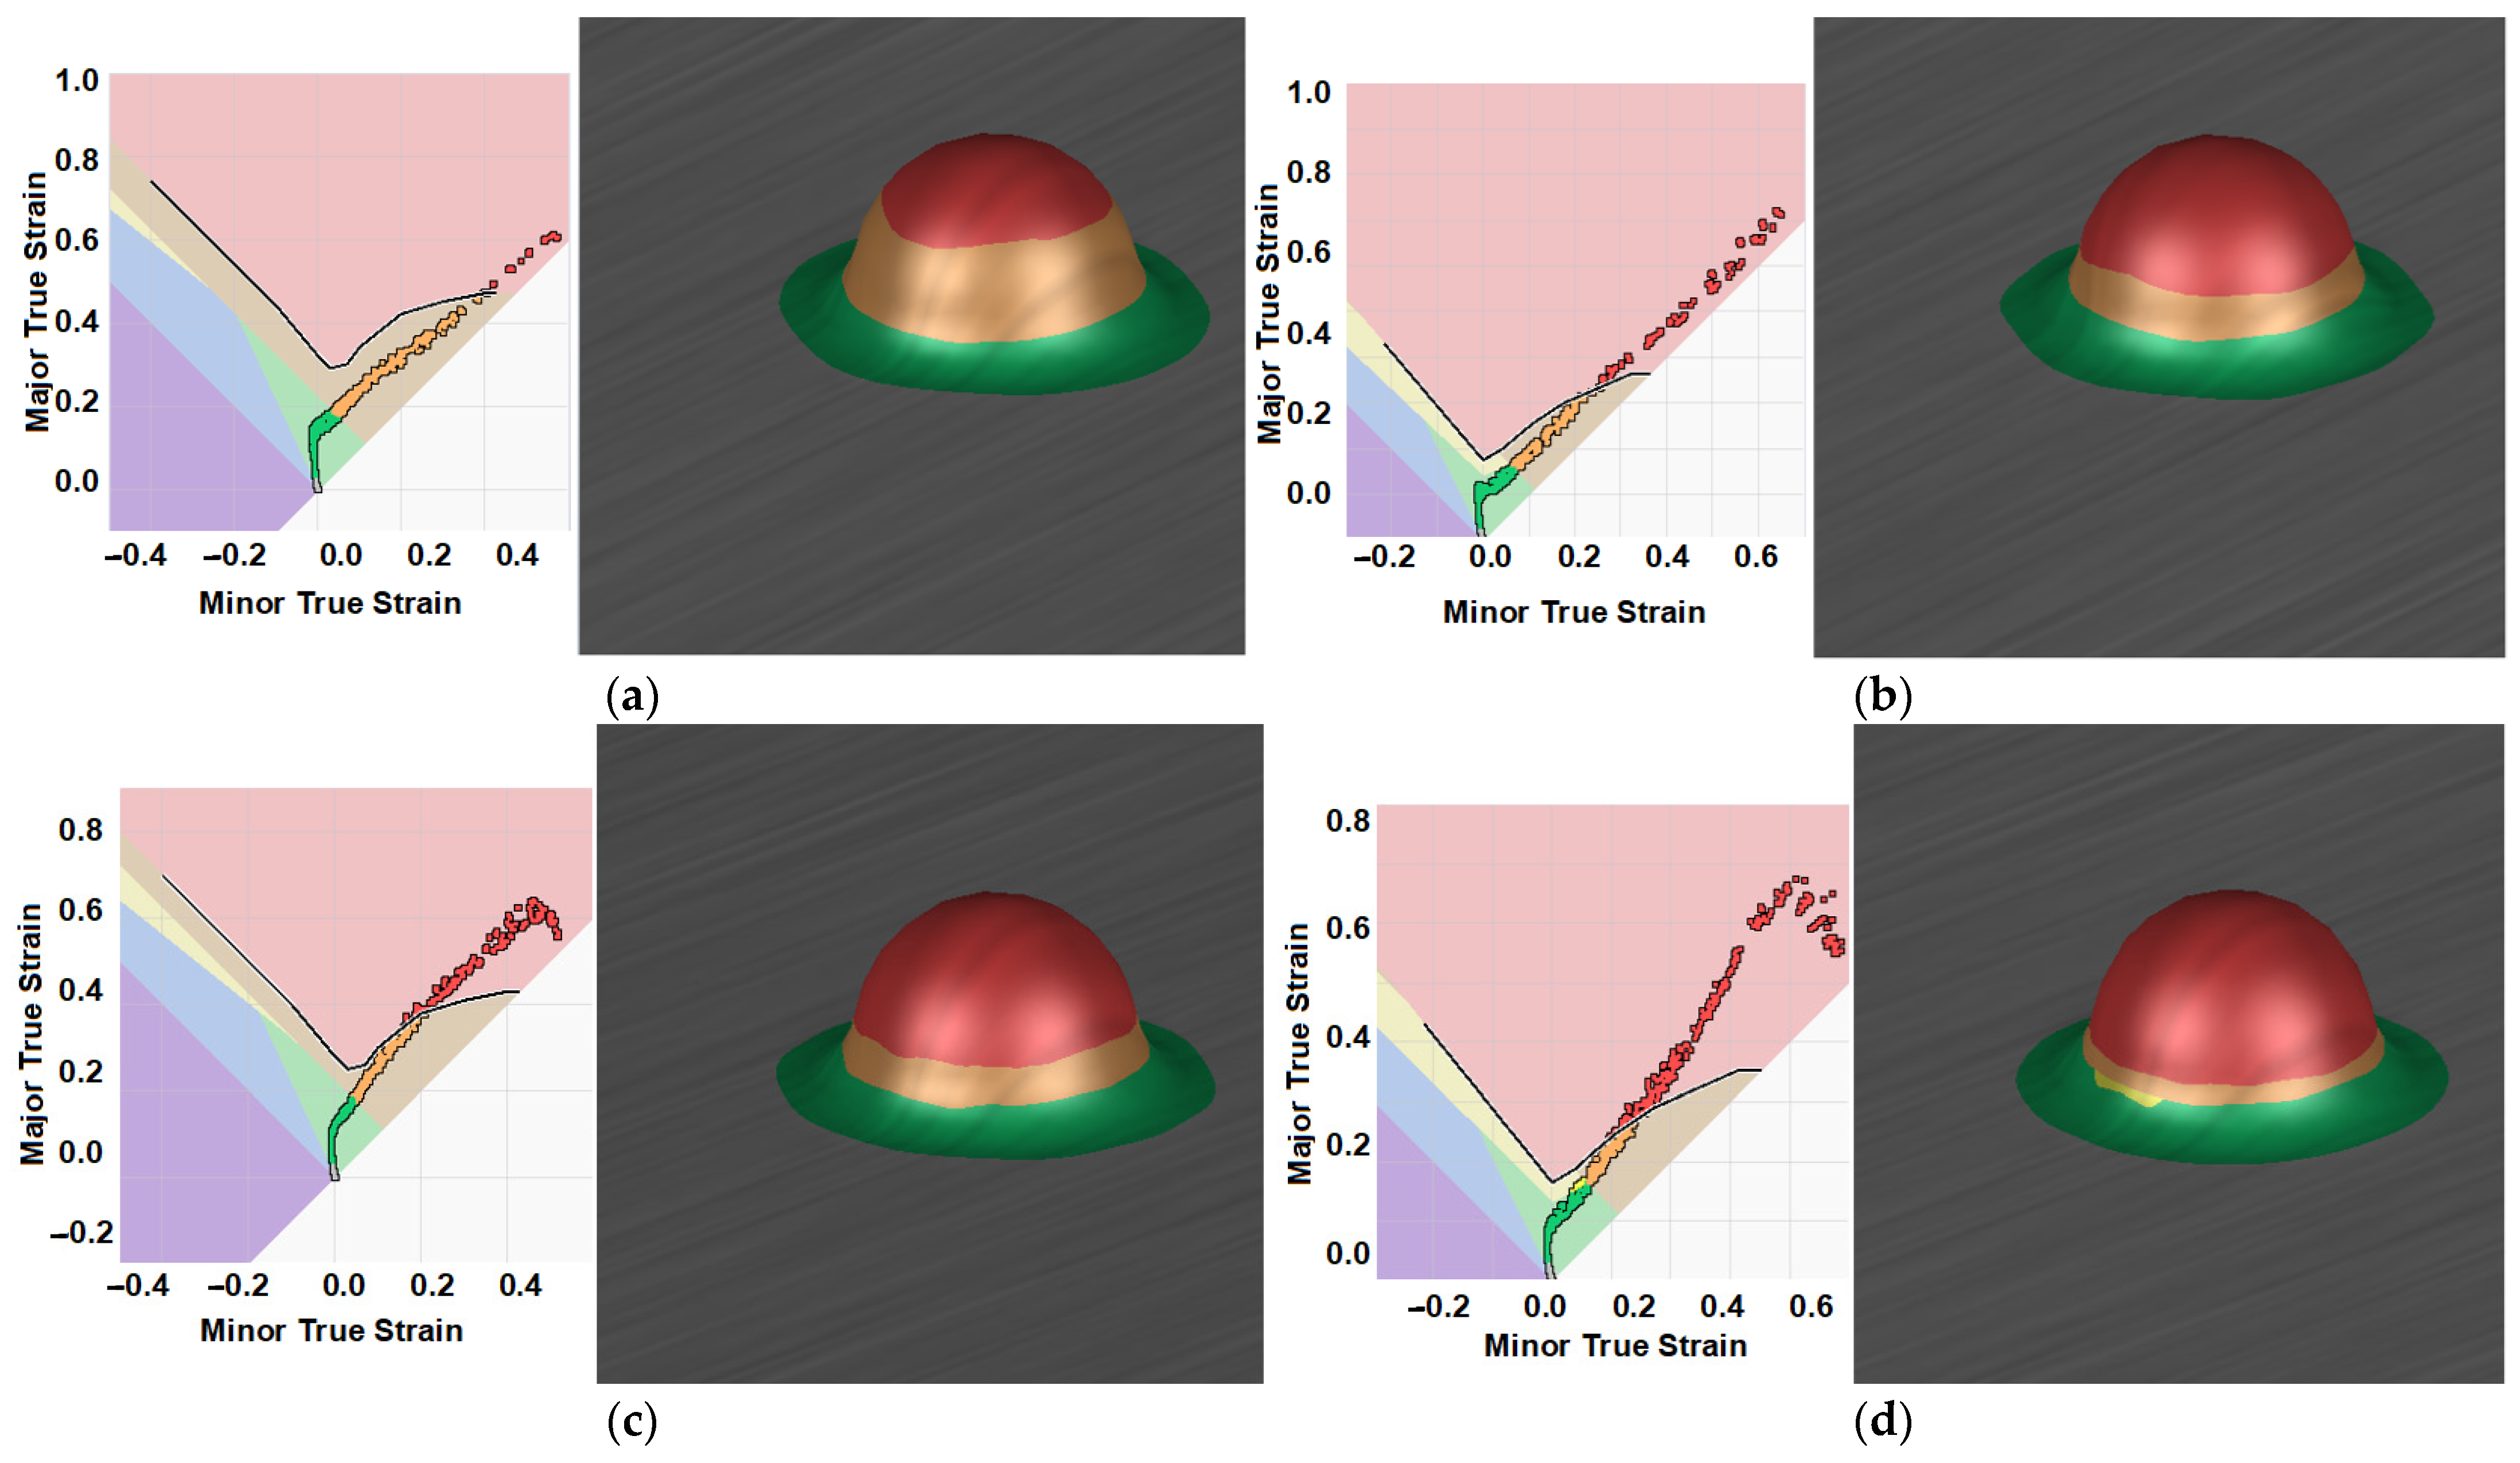
As shown by the sheet metal formability results in Autoform software in Figure 7, the use of lubricant has a significant impact on deep drawing of sheet metal. Figure 7 shows the results for a sheet thickness of 1.5 mm. Without the use of lubricant (Figure 7b), a significant critical area (red) was predicted, which could lead to cracking during drawing. With the use of lubricant (Figure 7a), this critical area (red) was significantly reduced and only occurred on the upper dome of the draw.
Figure 7c,d shows the simulation results for a sheet thickness of 1 mm, which predict the cooling effect of the lubricant on the drawing process. When the lubricant is applied, friction between the sheet and the drawing die is reduced, resulting in higher tensile strength.
Table 6 lists the maximum forming forces calculated using AutoForm software. The forming forces were calculated for both sheet thicknesses and for both lubricated and unlubricated conditions.
When comparing the forming forces determined by AutoForm (Table 6) and the actual forming forces from the test (Table 7), it can be concluded that the simulation results in AutoForm closely match the actual results of the formability test. As is evident, AutoForm software can be used to predict the actual results of formability tests for sheet metal parts.
Based on the findings in this chapter, further simulations were calculated for sheets drawn only with lubricant. The most important parameters were evaluated from the forming simulation, including the following:
  • Formability (FLD);
  • Max failure;
  • Thinning.

3.1.2. Formability

The FLD, or Formability Limit Diagram, is used to assess formability. It indicates the ability of the sheet metal to achieve the desired shape and highlights critical drawing points. The aim of this chapter is to focus on dangerous areas of failure (marked in red or orange) predicted by the AutoForm software and to measure the resulting mechanical properties in these areas, which will indicate the resulting strengthening that may manifest itself as cracking.
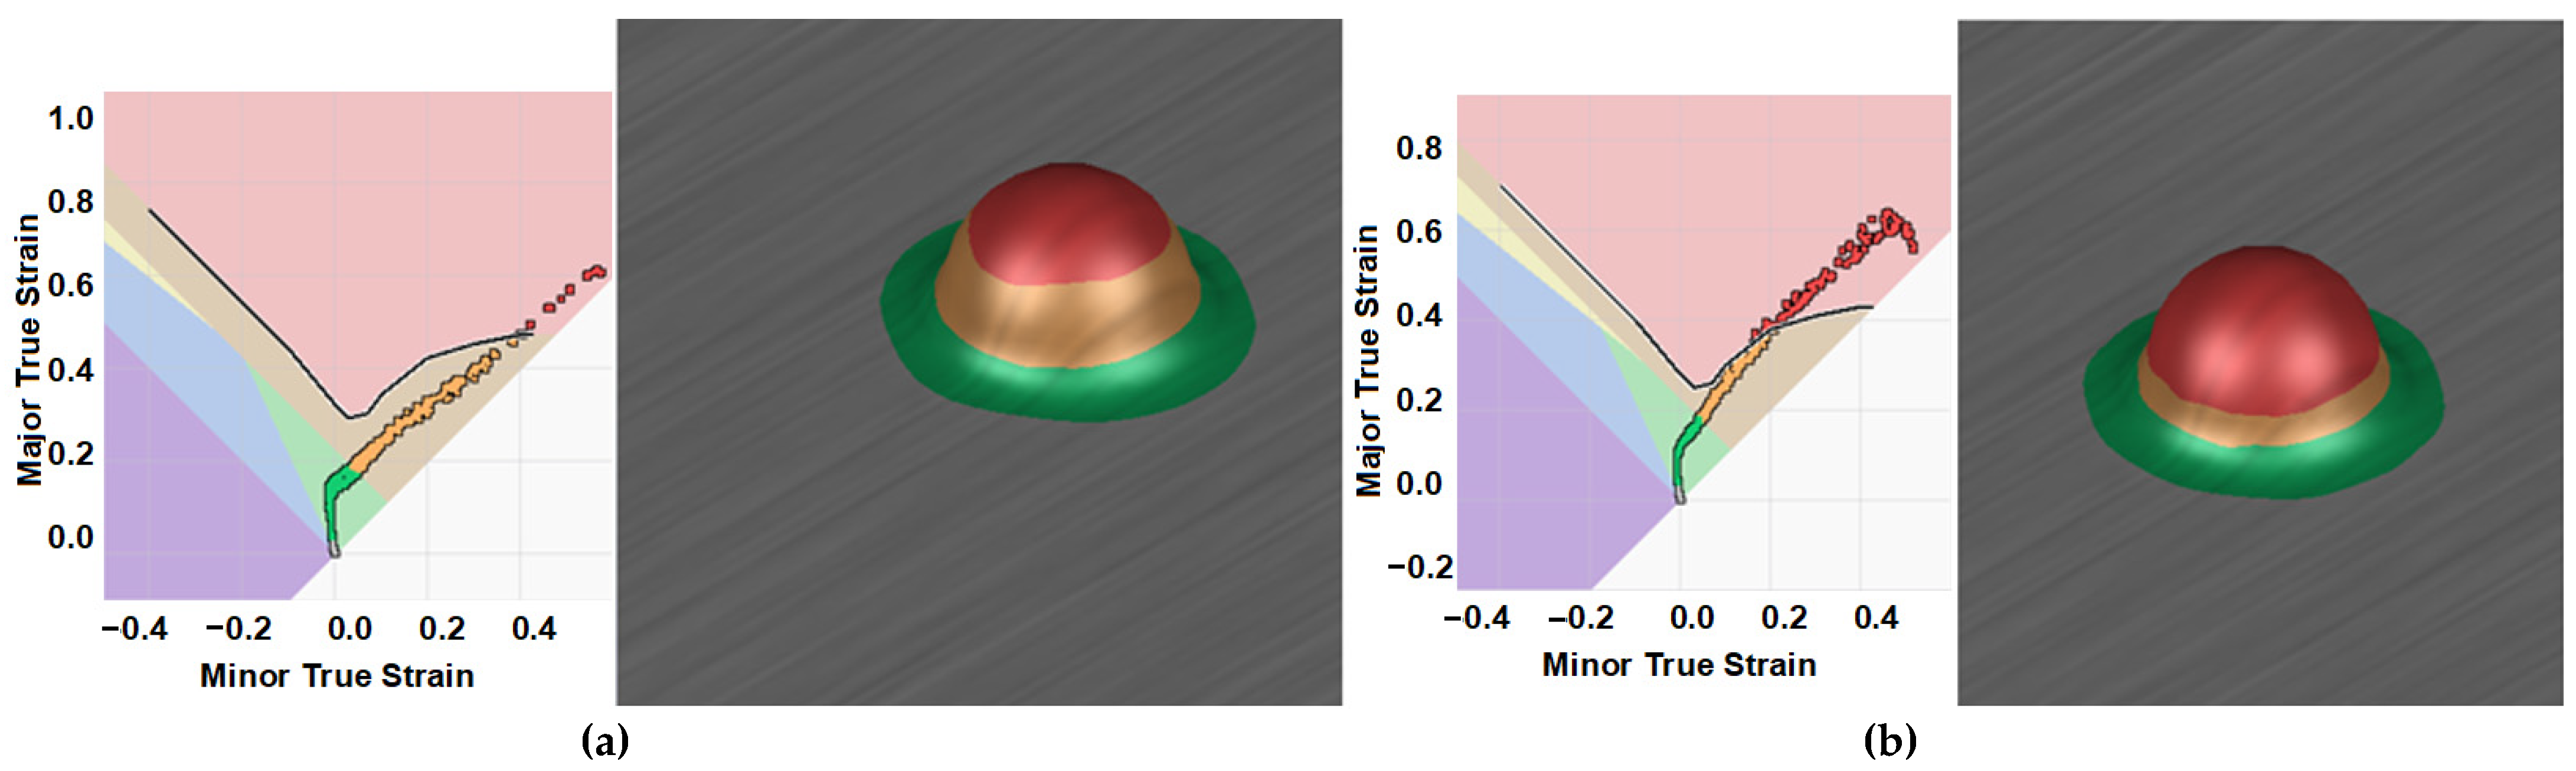
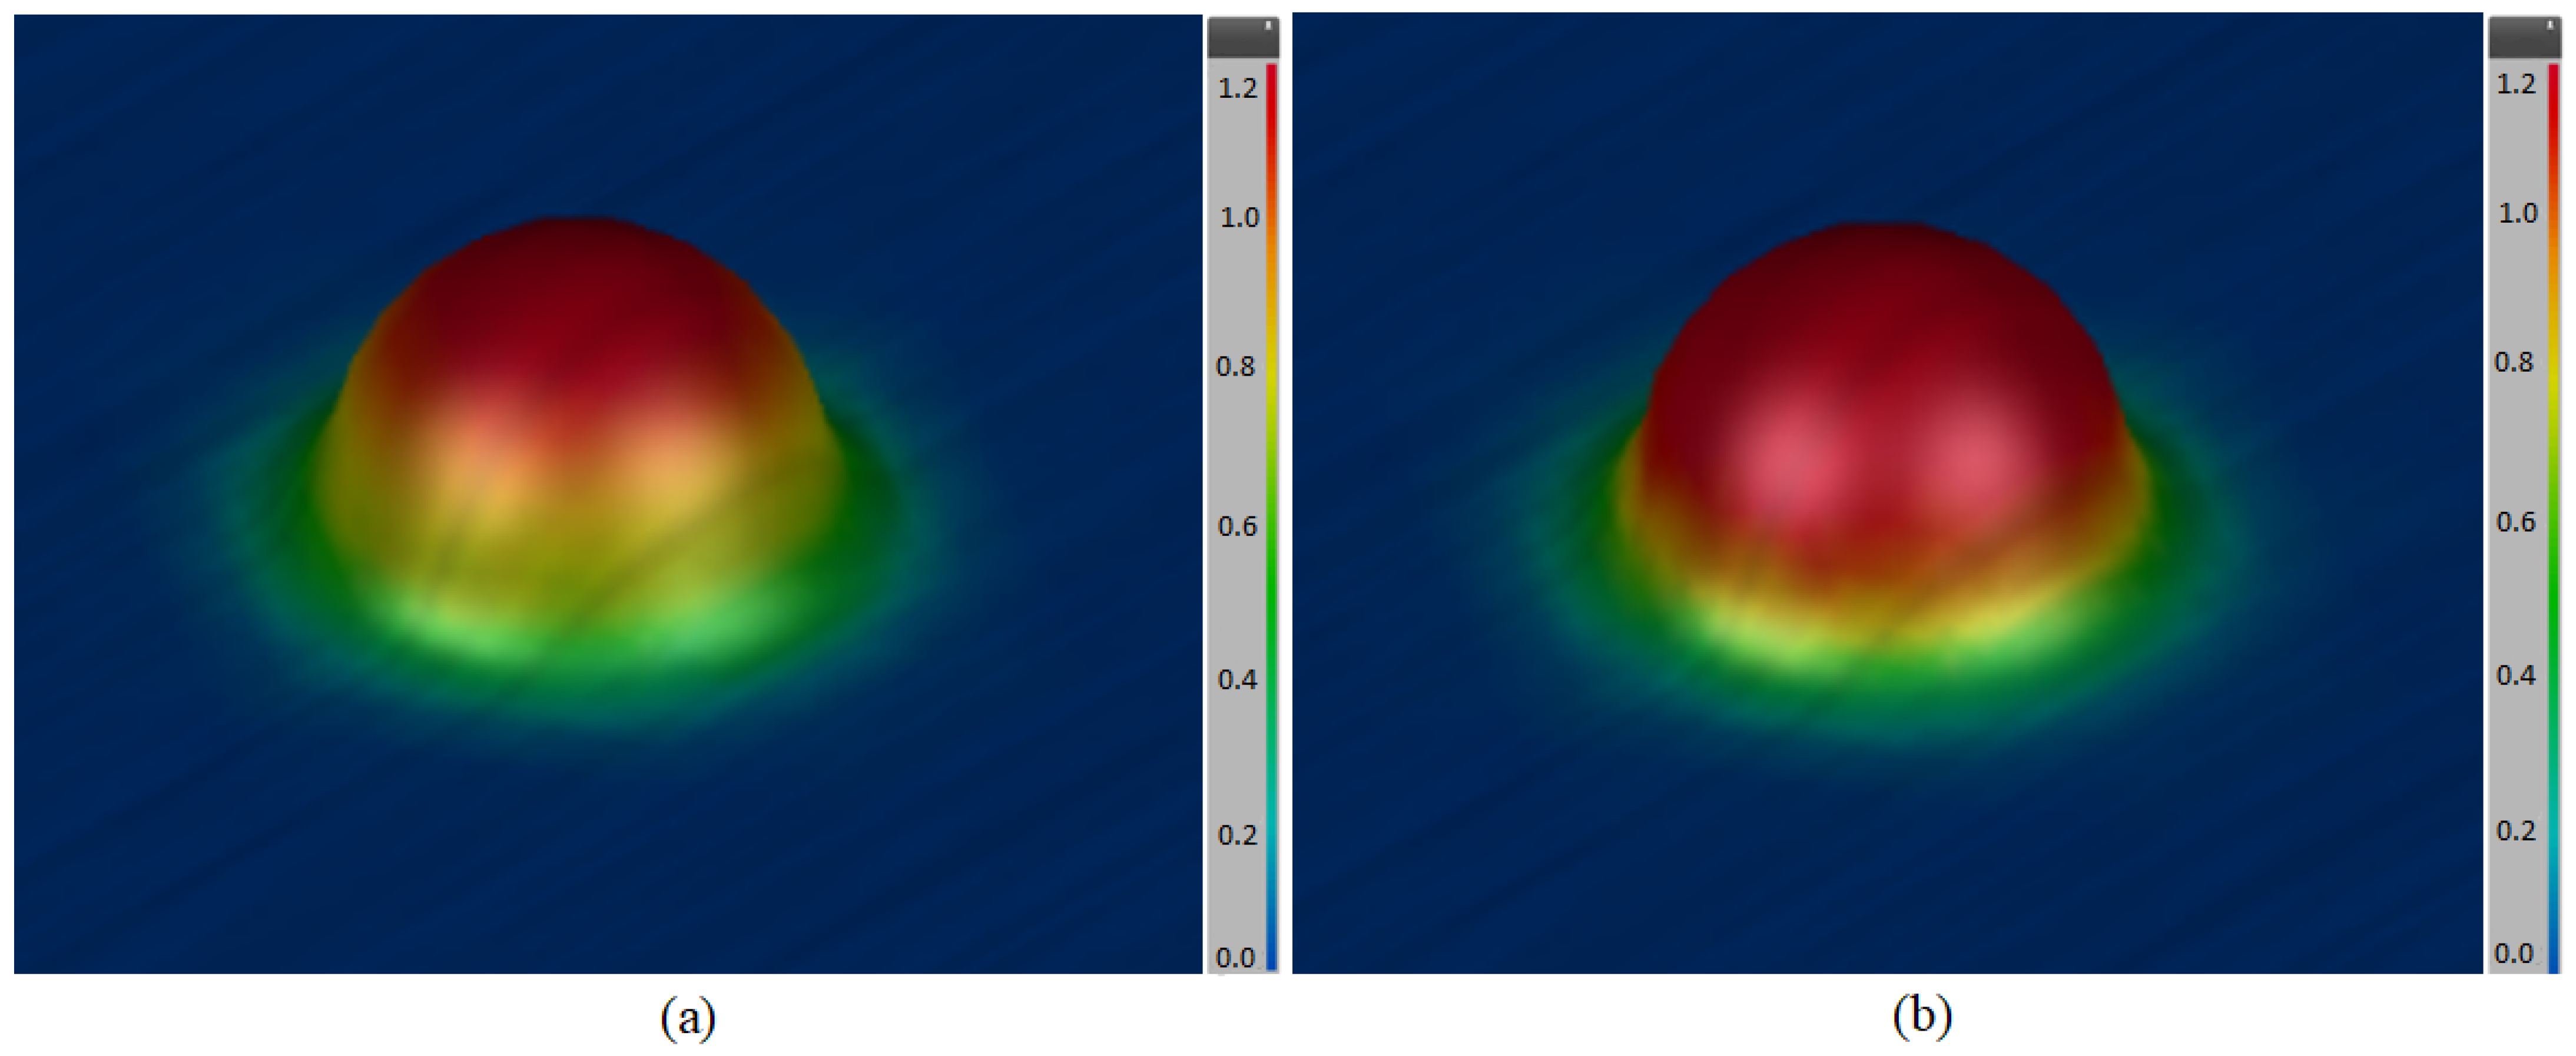
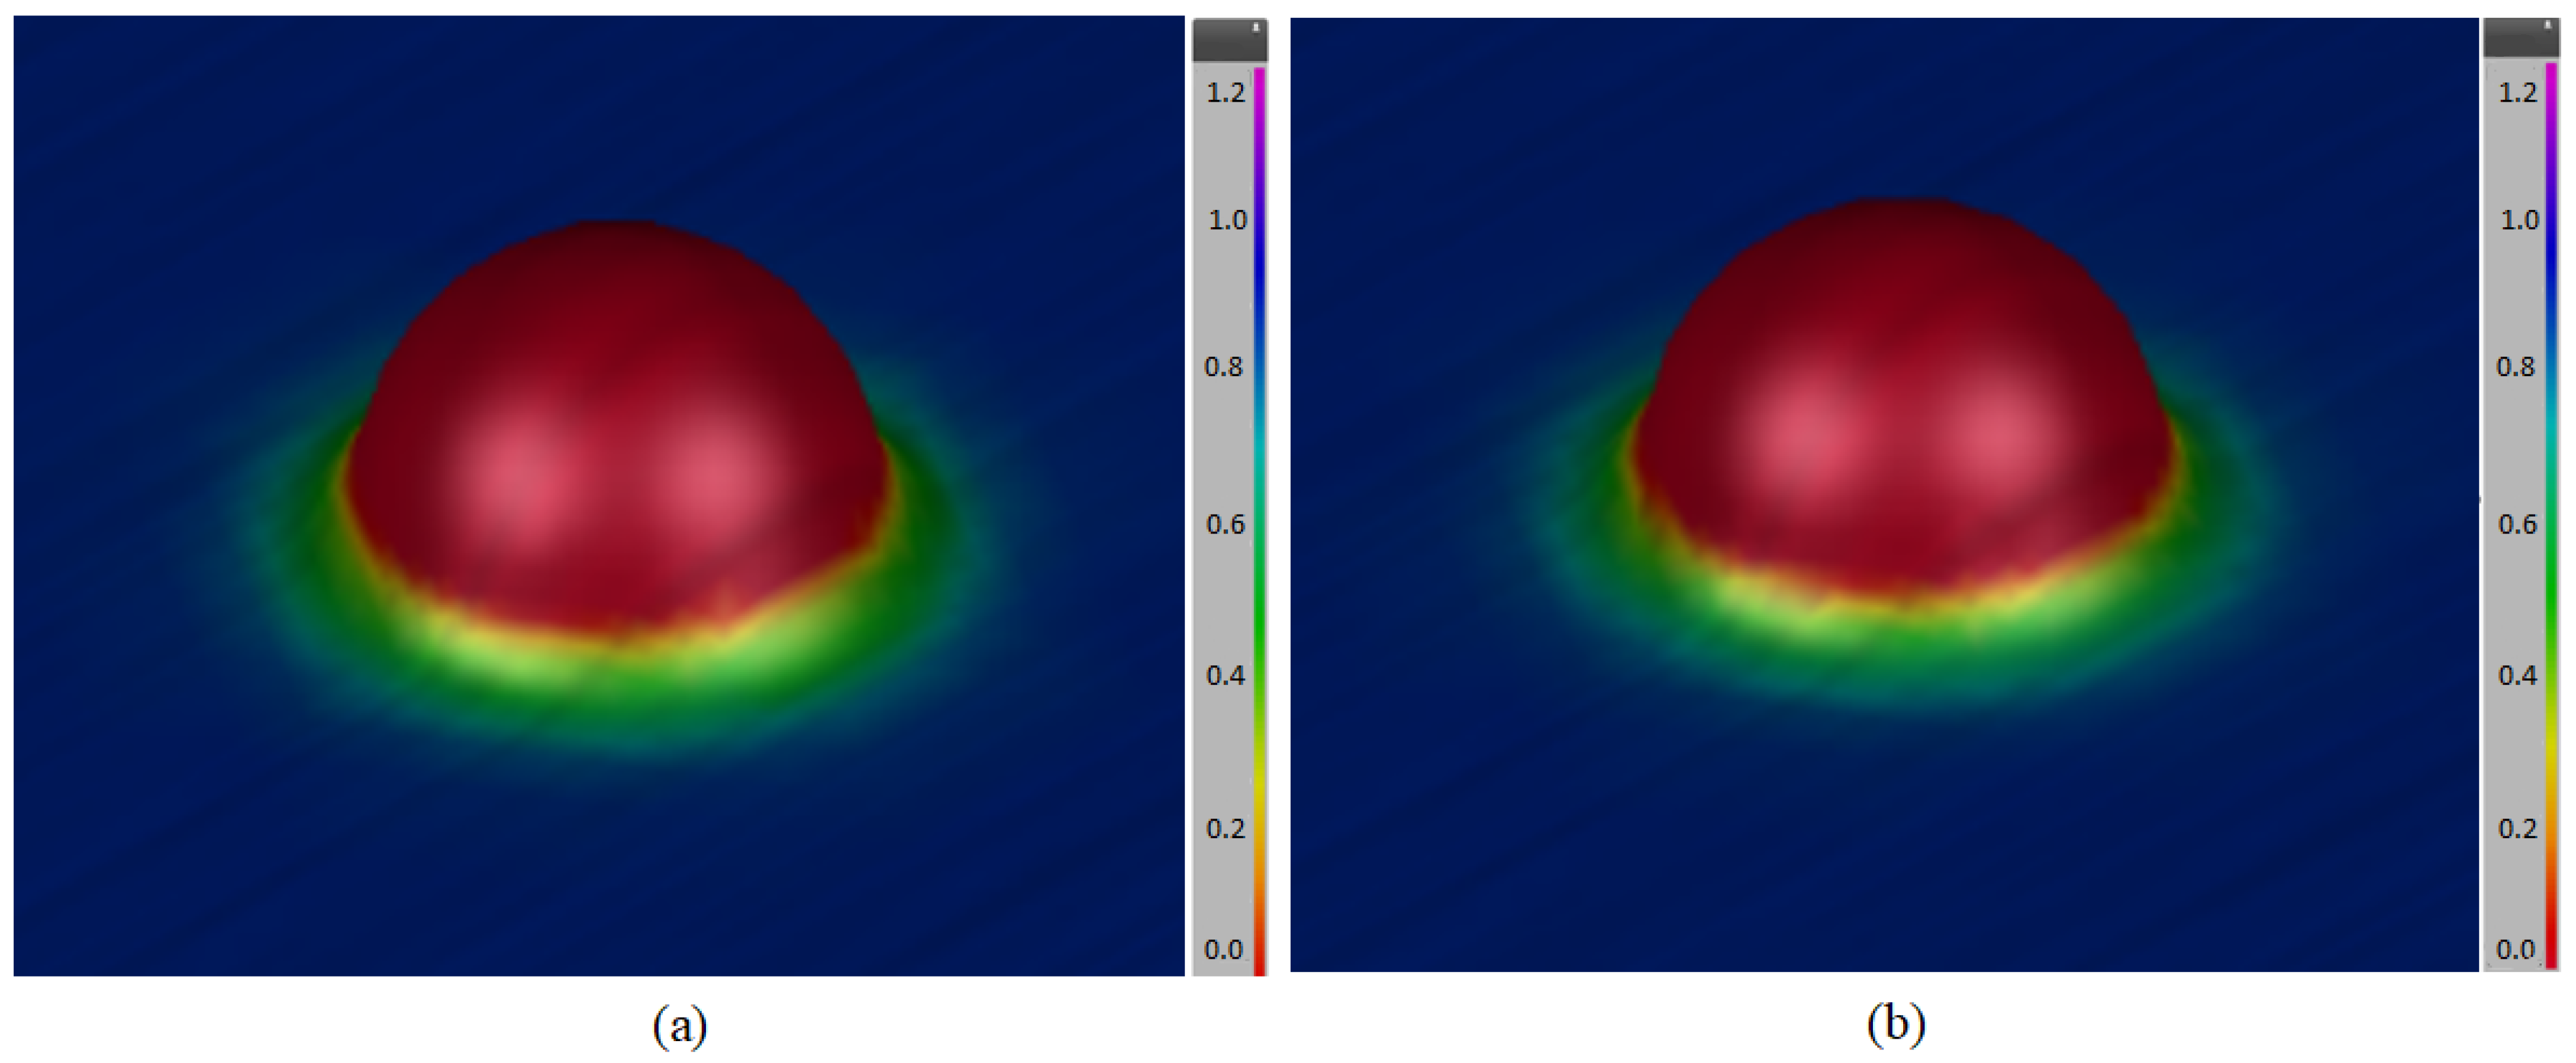
For the Erichsen deep drawing test, a puller with a diameter of 20 mm was defined for the standard test. The simulated sheet metal was 1.4376 with a thickness of 1.5 mm (Figure 8a). In terms of formability, 94.11% lies in the area of sheet unusability due to the large sheet cut. The red area of crack formation, measuring 1.34%, is located in the upper part of the extract, which corresponds to the most common problem of bottom tearing due to poorly set production conditions. If the aim of the work was to produce a defect-free part, a change in material or the use of braking elements would be considered. The result is used to compare the real process with the forming simulation, which confirms the area where the failure occurs.
The same mandrel diameter was used for the next simulation, but the sheet thickness was reduced to 1 mm (Figure 8b). According to the formability visualization, as the sheet thickness decreases, the unsafe area of failure increases and cracks occur much earlier than in the case of 1.5 mm thick sheet. The entire simulation process was set according to the forming conditions for sheet thicknesses of 1.5 mm (and 1 mm) so that the results would not be influenced by other parameters.

3.1.3. Max Failure

The maximum failure value (Max failure) indicates the percentage of the failure of the draw (Figure 9). The color scale is set between 0 and 1.2 as standard and is used to facilitate the identification of problems during the forming of sheet metal parts. If the value exceeds 1, it is a serious failure and the draw is torn. Each point can be checked separately to determine the problem. One simulation result may not indicate a major problem, so it depends on the specified conditions. For example, the maximum failure value may exceed the specified limit (usually 0.8), but the sheet thinning value is below the limit. Such a case requires a more detailed examination of the problem at the given location and an assessment according to the specified conditions.
The failure value (Max failure) is related to the FLD and formability. The risk area of failure is located in the upper part of the extract, which again indicates the danger of the bottom of the extract breaking off. High stress accumulates and subsequently manifests itself in the form of a crack, which enlarges and causes failure of the draw. The aim is to evaluate the change in mechanical properties during deep drawing of sheet metal and to determine the reasons for the most common failure of the part. The failure value exceeds 1.0 in the upper area and reaches a maximum value of 1.2. For 1.5 mm thick sheet metal, a maximum deep drawing depth of 22.6 mm was achieved with a critical failure value greater than 1.2. This indicates a real possibility of the part cracking. The result corresponds to the drawing depth observed in the practical test (23.9 mm). According to the simulation, the sheet metal reached the recommended failure value (0.8) at a drawing depth of 17.3 mm. Above this deep drawing depth, the actual risk of part fracture increases.
The maximum deformation value does not change, but the size of the area in which the maximum deformation occurs changes. The area with possible occurrence (orange area) has largely transformed into an area of deformation (red area). The sheet metal cutout is blue in most areas, which takes on a value of zero because there is no forming and it is unused sheet metal. For 1 mm thick sheet metal, a maximum deep drawing depth of 18.9 mm was achieved with a critical failure value greater than 1.2. As with the 1.5 mm thickness, this indicates a realistic possibility of part cracking. The result corresponds to the deep drawing depth observed in the practical test (19.7 mm). According to the simulation, the sheet metal reached the recommended failure value (0.8) at a deep drawing depth of 14.1 mm. Above this deep drawing depth, there is a real possibility of the part cracking. When comparing 1.5 mm and 1 mm thick sheet metal, the difference in deep drawing depth at a safe failure value of 0.8 is approximately 23%.

3.1.4. Thinning

The thinning result expresses the thinning of the sheet metal in individual areas due to the deep drawing process. The thinning parameter affects the mechanical properties of the blank and may pose a risk of further use of the part in production. A sheet metal part affected by thinning will not only fail to exhibit the required strength, but may also fail to perform its intended function when deformation is required in automotive parts. Thinning is characterized by a color scale with values that express the percentage of sheet thickness reduction.
In AutoForm, the Thinning parameter is one of the most important criteria for evaluating the quality of a stamped part. It indicates the percentage change in sheet thickness relative to its original nominal value (t0). For 1.4376 steel, it is recommended to limit the maximum thinning to 18–20%. Above this value, the TRIP effect is exhausted (all austenite has already transformed into hard martensite) and the material becomes rapidly brittle.
The thinning results show both positive and negative thinning values. In areas marked in pink, there was an accumulation of material, indicating an increase of 10% of the original thickness of 1.5 mm (Figure 10a). At the dome pull point, the sheet thinning is around 30%. This value is caused by pressing the puller into the sheet surface while stretching the sheet into the desired shape. Due to the large change in shape, the subsequent thinning under the set conditions is adequate and expected. For 1.5 mm thick sheet metal, a maximum deep drawing depth of 22.6 mm was achieved with a critical thinning ratio of 0.5. This indicates a real possibility of part cracking. The result corresponds to the deep drawing depth observed in the practical test (23.9 mm). According to the simulation, the sheet reached the recommended thinning value (0.2) at a deep drawing depth of 14.8 mm. Above this deep drawing depth, there is a real possibility of the part cracking.
Changes in metal sheet thickness are not distinguished on the color scale in the case of different sheet thicknesses, and, at first glance, similar results are obtained. However, the results are linked to a percentage reduction in relation to the original thickness. A 30% reduction in size means a reduction of 0.3 mm for a sheet with a thickness of 1 mm (Figure 10b). Examining selected points separately allows for a more detailed identification of the process, but this is not the purpose of this work, and therefore the results shown are sufficient. The basis is to obtain a visualization and approximate behavior of the sheet metal, which will influence the mechanical properties being investigated. For 1 mm thick sheet metal, a maximum deep drawing depth of 18.9 mm was achieved with a critical thinning ratio of 0.45. As with the 1.5 mm thickness, this indicates a real possibility of part cracking. The result corresponds to the deep drawing depth observed in the practical test (19.7 mm). According to the simulation, the sheet metal reached the recommended thinning value (0.2) at a drawing depth of 11.9 mm. Above this drawing depth, there is a real possibility of the part cracking. When comparing 1.5 mm and 1 mm thick sheet metal, the difference in drawing depth at a safe thinning value of 0.2 is approximately 24%.

3.2. Sheet Metal Drawing Using the Erichsen Method

The sheet metal was drawn using the Erichsen method on two sheet thicknesses (1 mm and 1.5 mm) with and without lubricant.
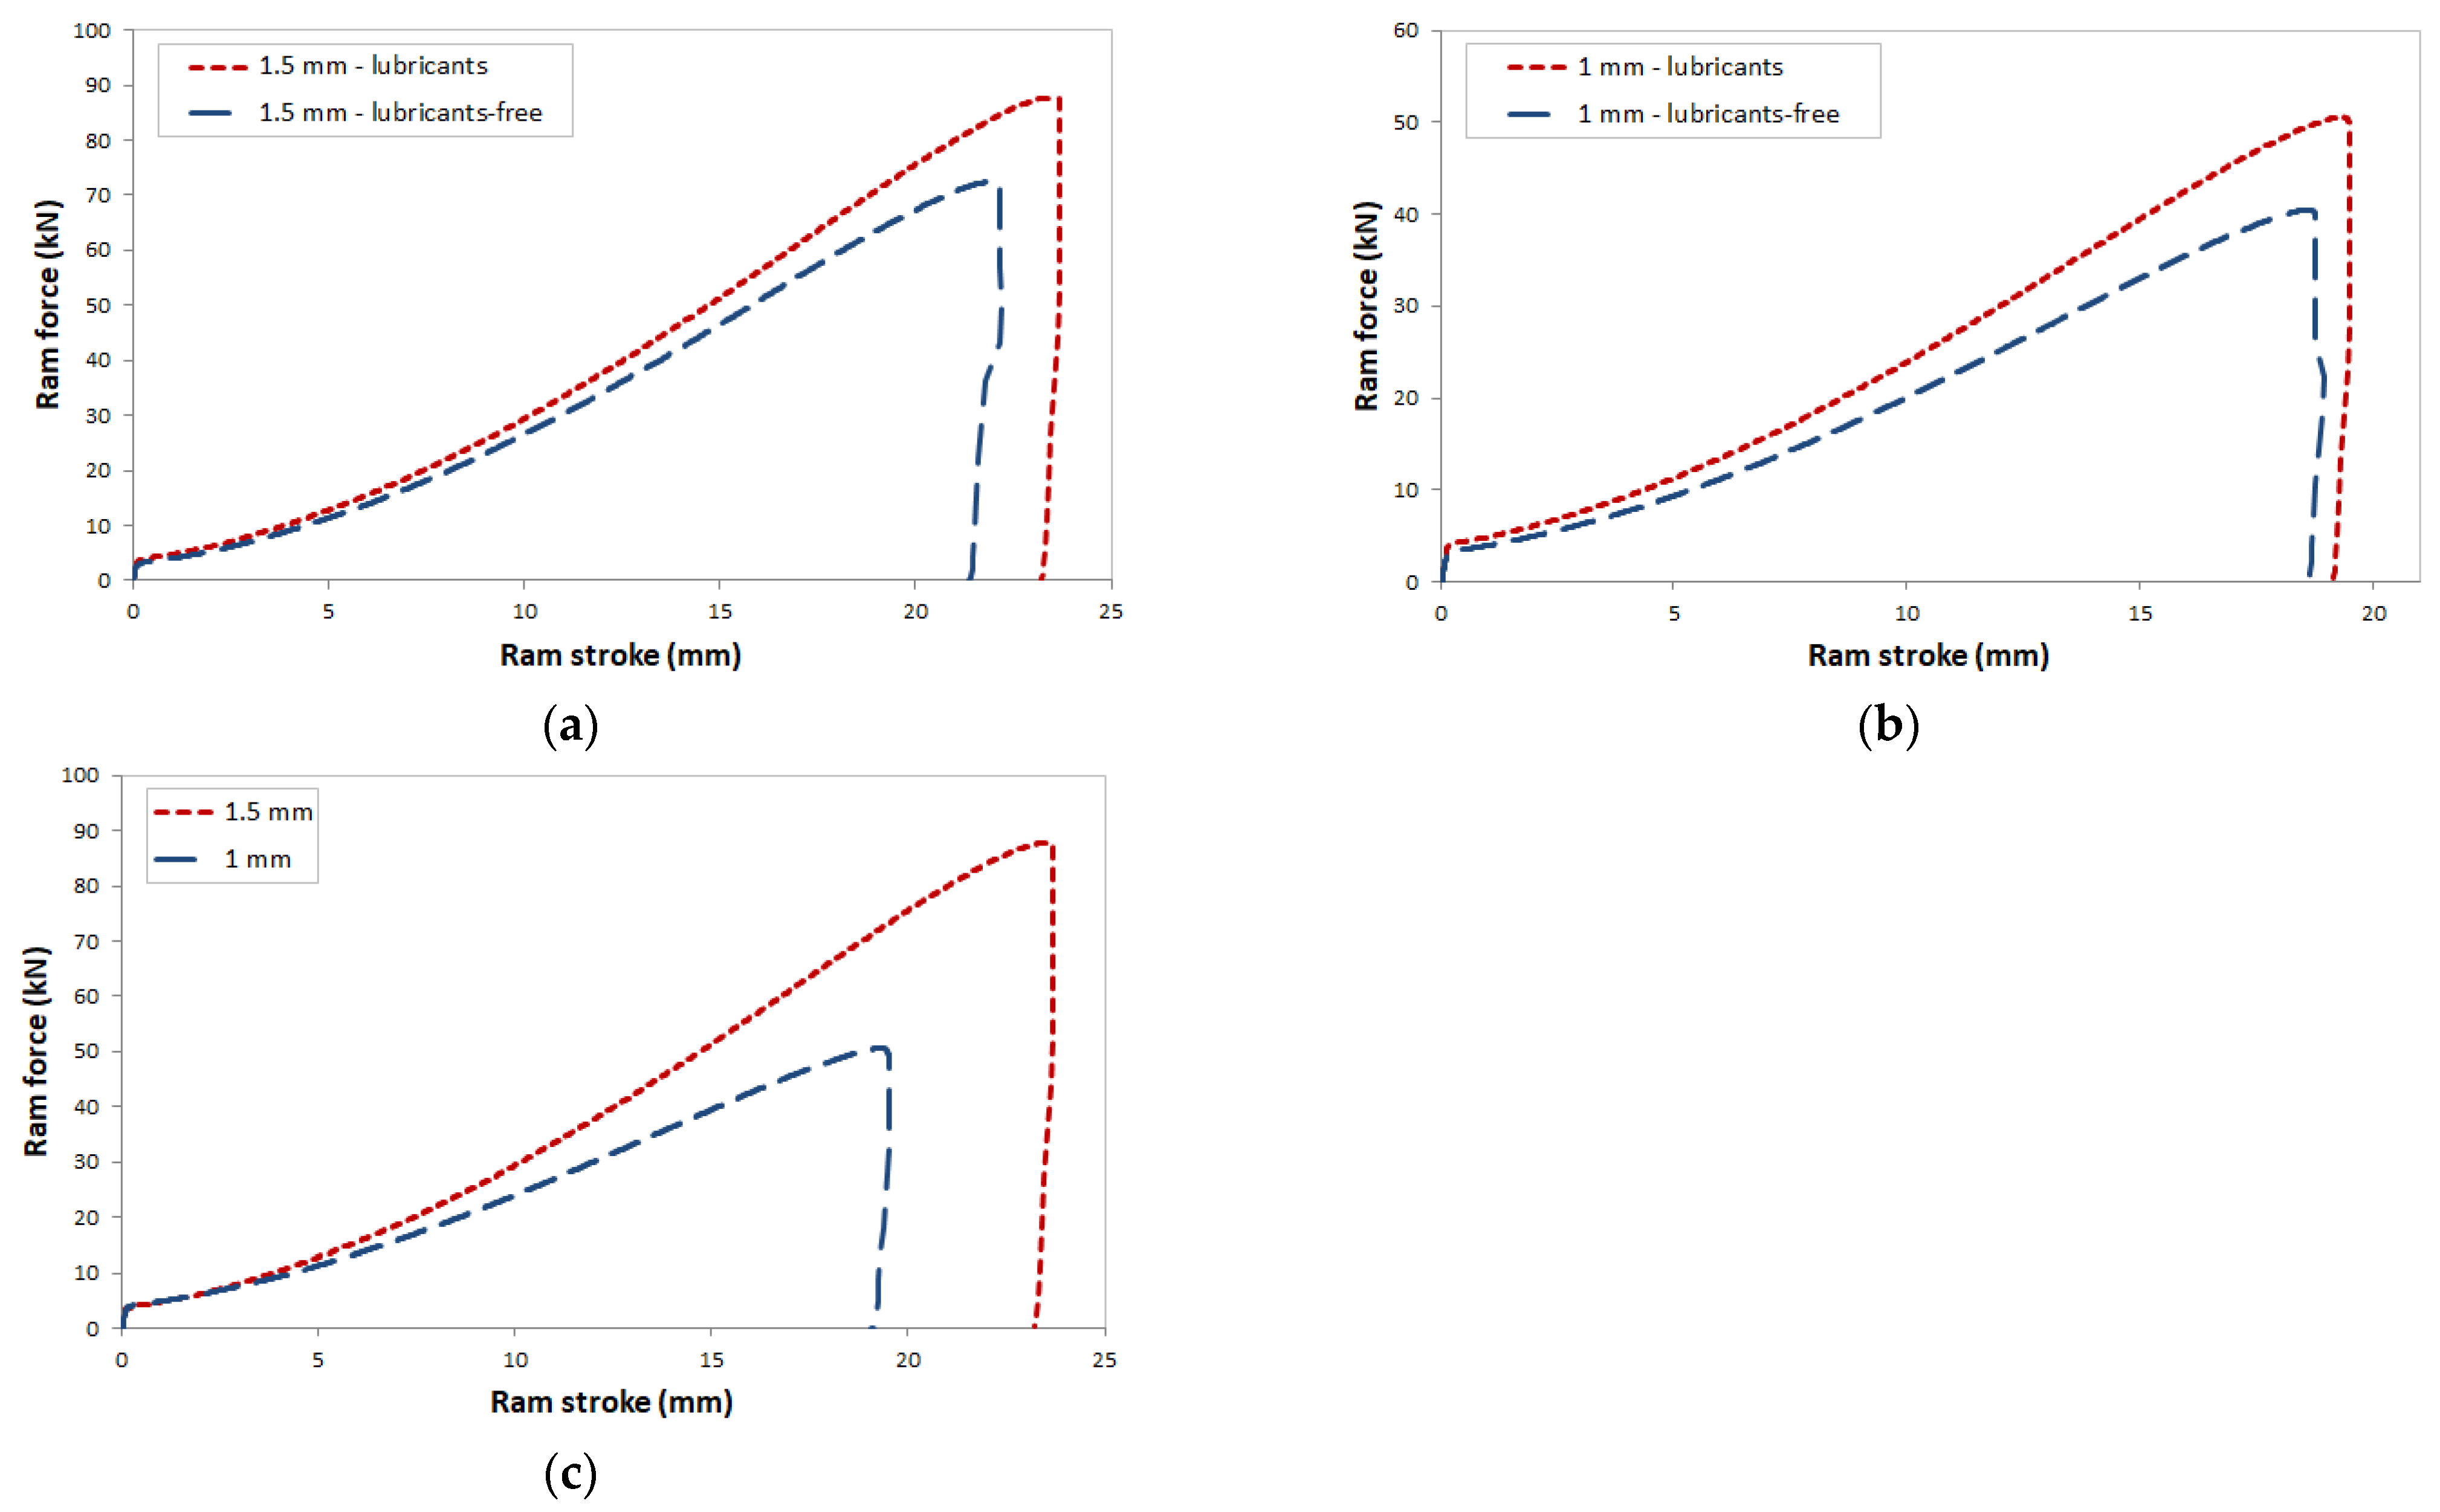
The output of the sheet metal test from the BUP-600 device is data on the load force and drawing distance. The data plots are shown in Figure 11. During the test, the sheet metal is drawn, and the force is gradually increased. At the maximum possible load, the sheet metal breaks, and the load force drops to zero. The individual plots are similar to each other but differ in the magnitude of the load force and the drawing distance.

3.2.1. Comparison of the Influence of Lubricant on the Drawing Process

As shown by the simulation results in Section 3.1.1, the use of lubricant has a significant effect on sheet metal drawing. The individual drawing processes are shown in Figure 11. For a sheet thickness of 1.5 mm (Figure 11a), a drawing distance of 24 mm was achieved with the use of lubricant and a drawing distance of 22 mm without lubricant. The difference in drawing distance with and without lubricant was 10%. The tensile travel corresponded to the tensile force results, with 88 kN measured when using lubricant and 72 kN without lubricant. The difference in tensile force when applying lubricant was up to 22%. Similar results were measured for a sheet thickness of 1 mm (Figure 11b). With the application of lubricant, the tensile travel and force increased by approximately 25%.
These results confirm the findings from simulations in AutoForm software and indicate that lubricant plays a significant role in the drawing process, as it reduces friction, which increases the drawing path and reduces critical points on the part. These points can then lead to part cracking and defects.
For high-strength austenitic stainless steel sheets such as 1.4376, lubrication conditions substantially affect the mechanics of the forming process. In this context, the lubricant does not merely reduce friction; it also directly affects the stress distribution within the sheet material, thereby altering both formability and susceptibility to defect initiation. Under high-friction conditions (dry contact, µ = 0.4), a significant restraining effect develops at the contact interfaces. Material flow is restricted within the contact zone, which results in a localized increase in tensile stresses in the surrounding unconstrained regions. Under such conditions, plastic instability becomes localized, leading to premature necking. Although the investigated material exhibits high nominal elongation values (approximately 40%), the unfavorable friction conditions prevent the full utilization of its deformation potential throughout the formed component.
In contrast, reduced friction under lubricated conditions (µ = 0.07) enables smooth material flow across the die shoulder and along the punch contact surface. This leads to a more homogeneous stress state, allowing the forming load to be distributed throughout a considerably larger volume of the sheet material.
The 1.4376 stainless steel exhibits pronounced strain-hardening behavior. By lowering frictional resistance, effective lubrication allows strain hardening to develop within the bending zone while facilitating the transfer of deformation energy into adjacent regions that have not yet undergone significant hardening. This mechanism improves the effective formability of the entire component.
The friction coefficient also strongly influences the occurrence of characteristic forming defects. Insufficient lubrication is typically associated with splitting and crack formation, adhesive wear accompanied by galling, and severe localized thinning. In contrast, excessive lubrication or inappropriate lubricant selection may induce wrinkling, dimensional inaccuracies, and springback.

3.2.2. Comparison of the Influence of Sheet Metal Thickness

Deep drawing tests according to Erichsen were performed on the BUP-600 for individual sheet thicknesses, the course of which is shown in Figure 11c. For each sheet, the parameters of maximum force Fmax, maximum breaking force Fbreak, and drawing distance to breaking Travelbreak were evaluated. The results of the individual parameters are shown in Table 7.
The highest drawing values were recorded for the 1.5 mm thick sheet. The drawing distance was measured at 23.9 mm at a load force of 86.1 kN. Conversely, lower tensile values were measured for 1 mm sheet metal. The tensile distance was measured at 19.7 mm at a load force of 50.3 kN. The measured values of forces and tensile distances are determined by the geometry of the tensile testing machine.
Sheet metal formability is markedly dependent on sheet thickness, with the dominant contributions arising from geometrical instability due to thinning, microstructural conditions characterized by the grain-to-thickness ratio, and tribological effects associated with friction. As shown in Table 7, the thinner sheet (1 mm) exhibits lower formability because it lacks sufficient geometric and structural capacity to redistribute deformation energy efficiently. As a result, microscopic material defects or local increases in friction lead to rapid loss of stability and subsequent crack initiation. In comparison, the thicker sheet (1.5 mm) can effectively absorb and disperse these local disturbances within the material volume.

3.3. Mechanical Properties

The mechanical properties were measured only on blanks that were drawn with lubricant applied. The application of lubricant affected the drawing process itself as well as the resulting draw path.
The mechanical properties were measured by an instrumented hardness test and evaluated using the Oliver–Pharr method, which evaluates parameters such as indentation hardness, Vickers hardness, indentation modulus, and deformation from the indentation characteristics obtained during the indentation process.
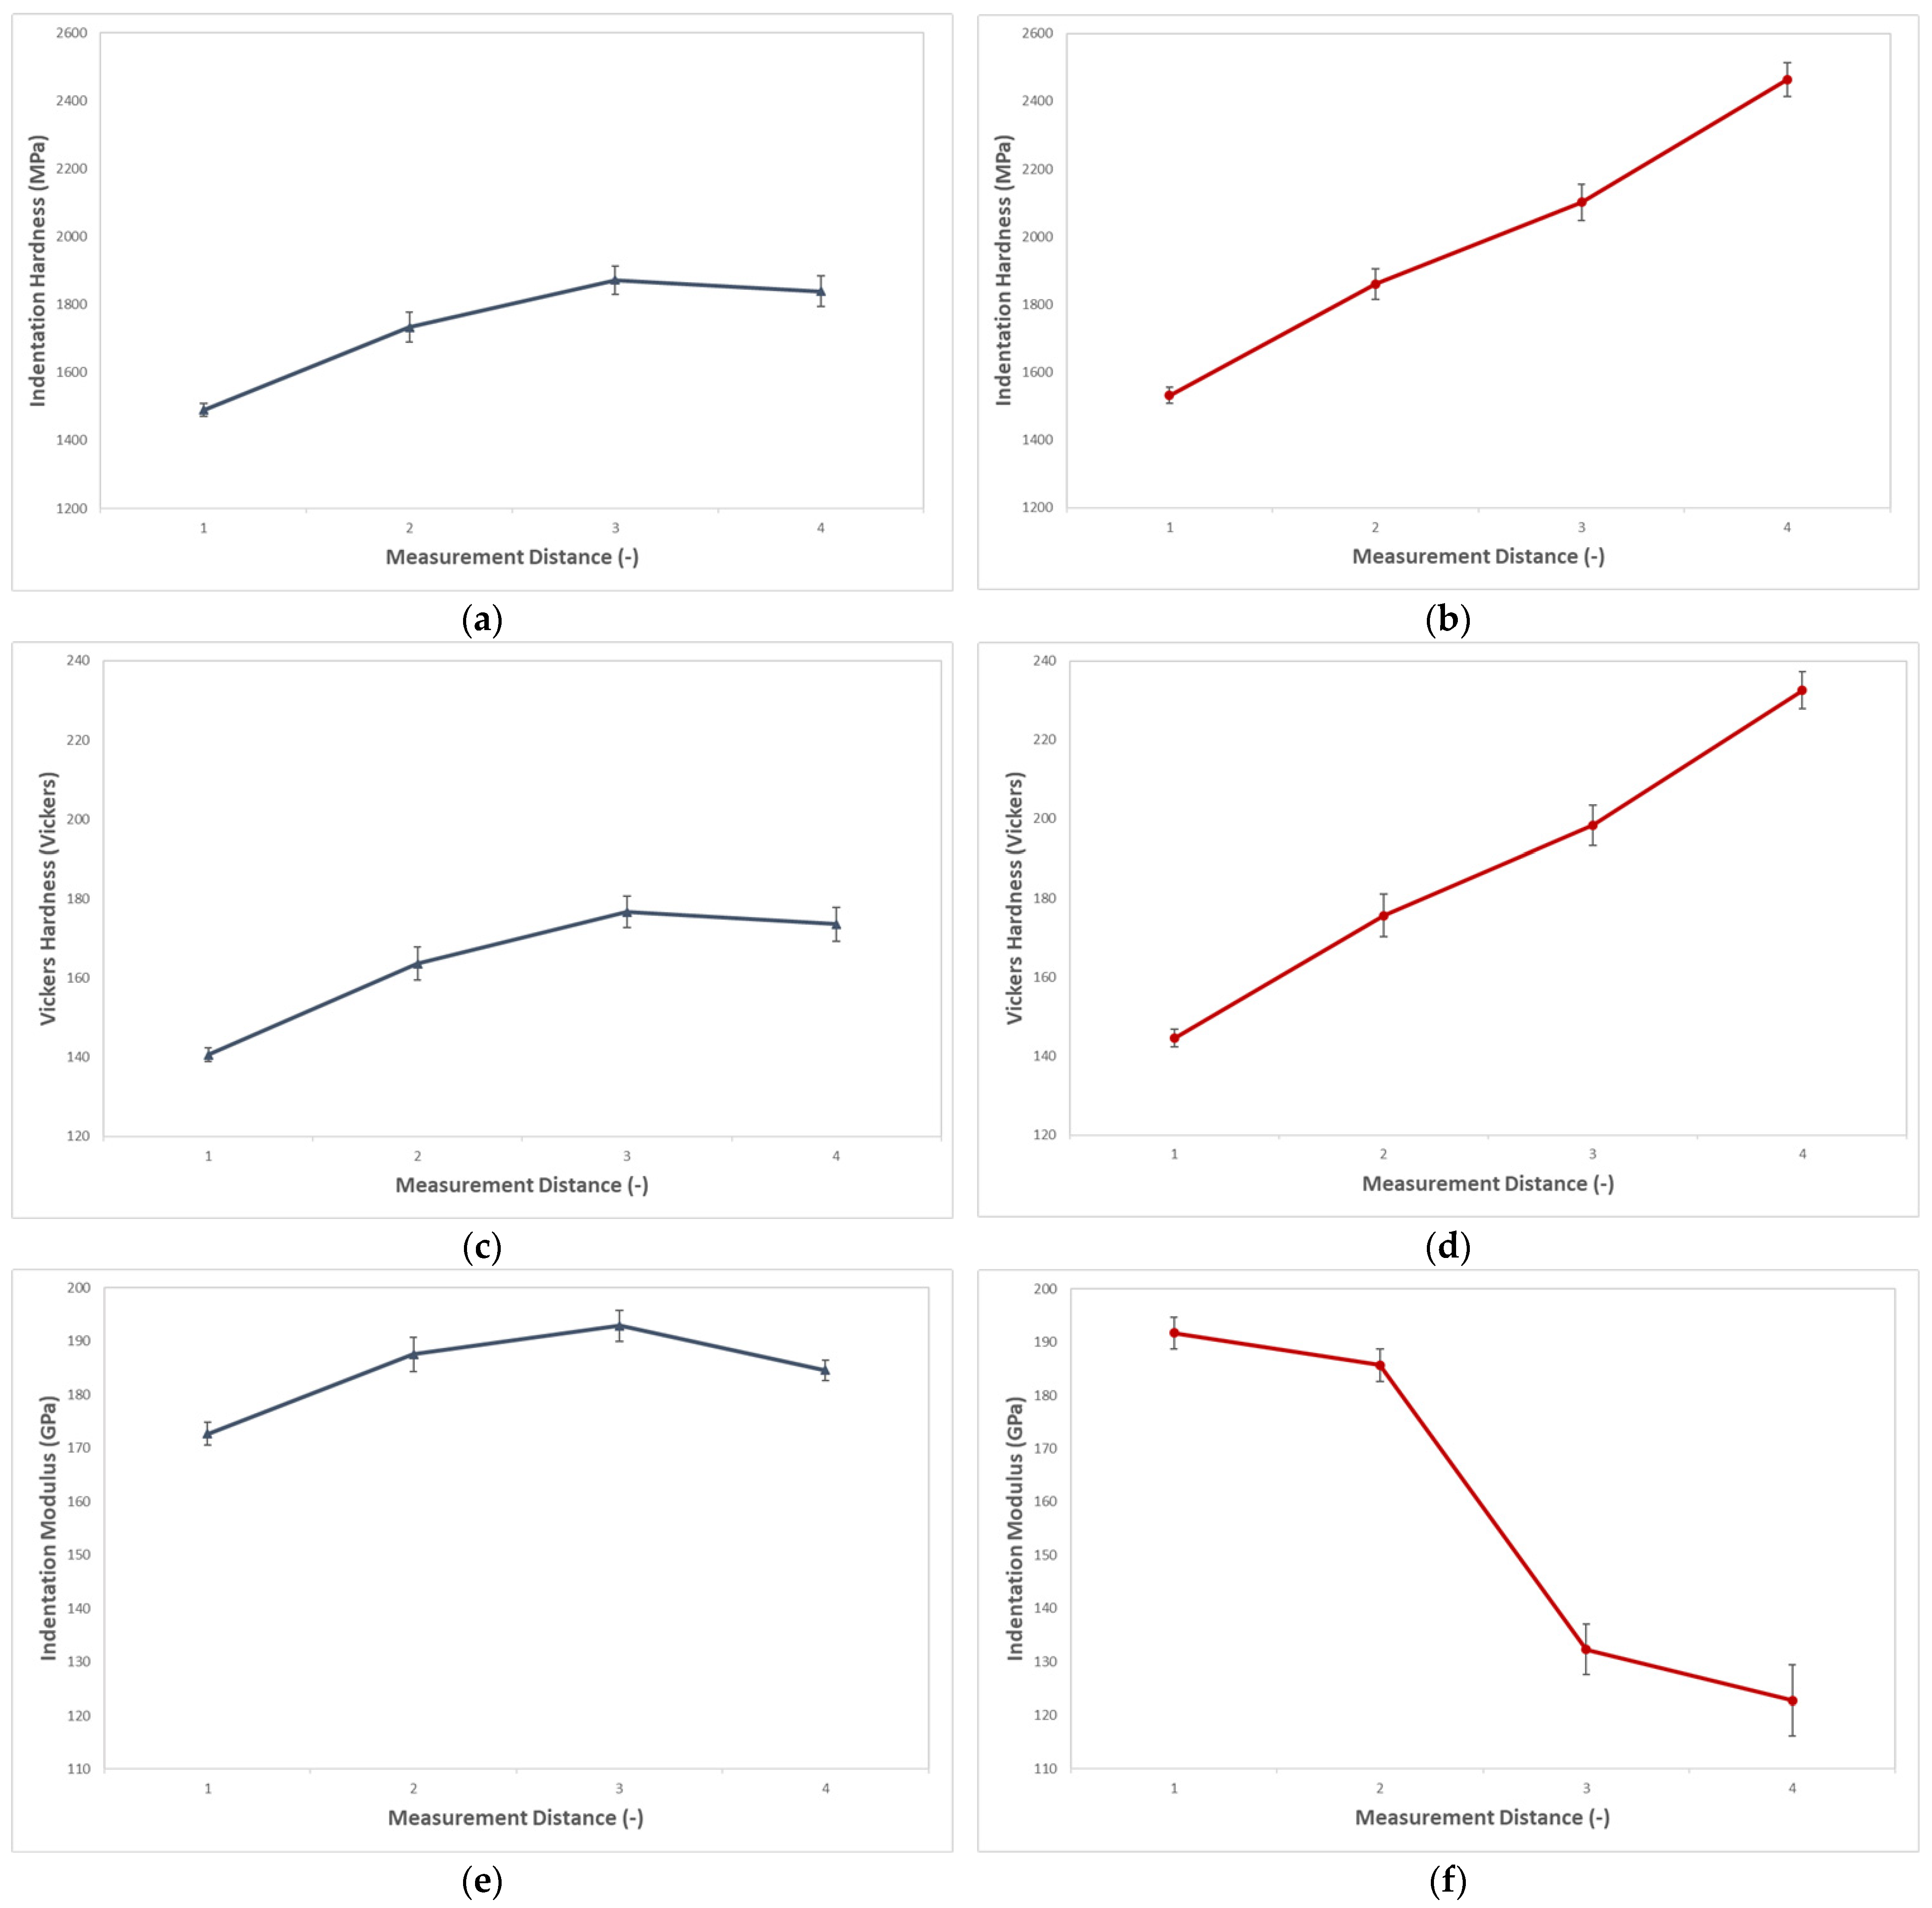
The basic mechanical property evaluated is indentation hardness, which is shown in Figure 12a,b. Hardness characterizes the resistance of the material to the penetration of the indenter. The evaluation of HIT indentation hardness for the Erichsen method with a 20 mm diameter indenter assesses four areas of the sheet metal. The evaluation is considered for sheet metal thicknesses of 1 mm and 1.5 mm.
Position 1 indicates the location before the actual sheet metal drawing, where there is no significant impact on the sheet metal and therefore this location also shows the lowest indentation hardness values (approximately 1500 MPa). Area 2 shows the beginning of the dome drawing. For sheet thicknesses of 1 mm and 1.5 mm, there is an increase in hardness due to sheet drawing. This increase was 22% for 1 mm thick sheet and 16% for 1.5 mm thick sheet. Area 3 describes the course of dome drawing and shows an increase in hardness for both sheet thickness variants. According to the simulation, this is a dangerous area in which the draw may crack. For 1 mm thick sheet, higher indentation hardness values were measured compared to 1.5 mm thick sheet. The examined area of the draw peak, marked with position 4, shows different behavior for both sheet thicknesses. For 1 mm thick sheet, an increase in values up to a maximum value of 2468 MPa was measured. The difference between the unaffected area (area 1) and the dome peak area (area 4) is 63%. This indicates a significant strengthening of the sheet due to tensile stress and may lead to the formation of cracks. This critical area was also shown in the simulation results. For sheet metal with a thickness of 1.5 mm, a decrease in indentation hardness was measured compared to the previously assessed area. The evaluation of the measured values corresponds to the dangerous areas of the simulation, and it is necessary to pay attention to the correct selection of the material, the selected sheet thickness, and the conditions of the deep drawing process.
In addition to indentation hardness, it is possible to obtain the Vickers hardness value, which is commonly used in technical practice; see Figure 12c,d. The measured values for indentation hardness and Vickers hardness are similar. Further evaluation of the results shows an increase in Vickers hardness for 1 mm thick sheet metal. The highest value (233 Vickers) is found at the top of the draw, which is confirmed by simulations in AutoForm R8. For thicker sheet metal, there is a smaller increase in indentation hardness due to less sheet metal deformation. During the tensile test, no cracks appeared in the 1.5 mm thick sheet metal. This is confirmed by the lower Vickers hardness value.
Another important parameter describing the mechanical properties of a material is the indentation modulus. The indentation modulus of elasticity is a material constant that indicates the stress required to achieve a certain deformation. As the modulus of elasticity increases, the stress required to achieve the same deformation as in the case of a lower modulus value also increases, Figure 12e,f.
The tensile elastic modulus (EIT) plays a fundamental role in sheet metal forming, although the forming process itself predominantly occurs within the regime of plastic deformation. Its contribution becomes particularly relevant during unloading, when the forming tool no longer imposes external stresses on the sheet. The elastic modulus determines the extent of springback, i.e., the partial recovery of the sheet toward its original geometry following tool release. Moreover, it contributes to process stability and affects the susceptibility to buckling. Since it governs sheet stiffness during forming, it also influences the formation of wrinkling defects. Furthermore, the elastic modulus alters the micromechanical interaction at the sheet–tool interface. Lower elastic modulus values facilitate improved conformity of surface asperities to the tool surface, thereby modifying the real contact area and consequently influencing lubricant effectiveness.
The thickness of the sheet metal had a significant effect on the indentation modulus of elasticity. For sheet metal with a thickness of 1 mm, a decrease in values was measured from the unaffected area (area 1) to the top of the drawn dome (position 4). At the unaffected area of the sheet metal (area 1), a compression modulus value of 191 GPa was measured, and at position 4, a significant decrease to a value of 120 GPa was measured. This difference is 59%. A 1 mm thick sheet appears to be unsuitable mainly due to the significant decrease in the modulus of elasticity and thus the loss of mechanical properties. The decrease in the modulus value is influenced by the thinning of the sheet and the formation of stresses that cause cracks in the critical area. The reduction in elastic modulus can be attributed to the increased dislocation density and the microstructural changes occurring during the forming process. The dominant factor is the mobility of dislocations. Plastic deformation gives rise to a substantial increase in the number of dislocations within the material structure. During unloading, some of these dislocations undergo limited reverse motion. Simultaneously, high strain levels cause crystal grains to rotate toward the direction of the maximum tensile stress, leading to texture development. Since iron crystals are elastically anisotropic, changes in grain orientation can influence the measured value of the elastic modulus in a particular direction, such as the direction of tensile loading.
The opposite trend was measured for sheet metal with a thickness of 1.5 mm. At the beginning of the sheet drawing (area 1), a lower modulus of elasticity was measured than in the case of the 1 mm thick sheet draw. For areas 2 and 3, the modulus value increased and then decreased from a maximum value of 193 GPa to 185 GPa at the peak.
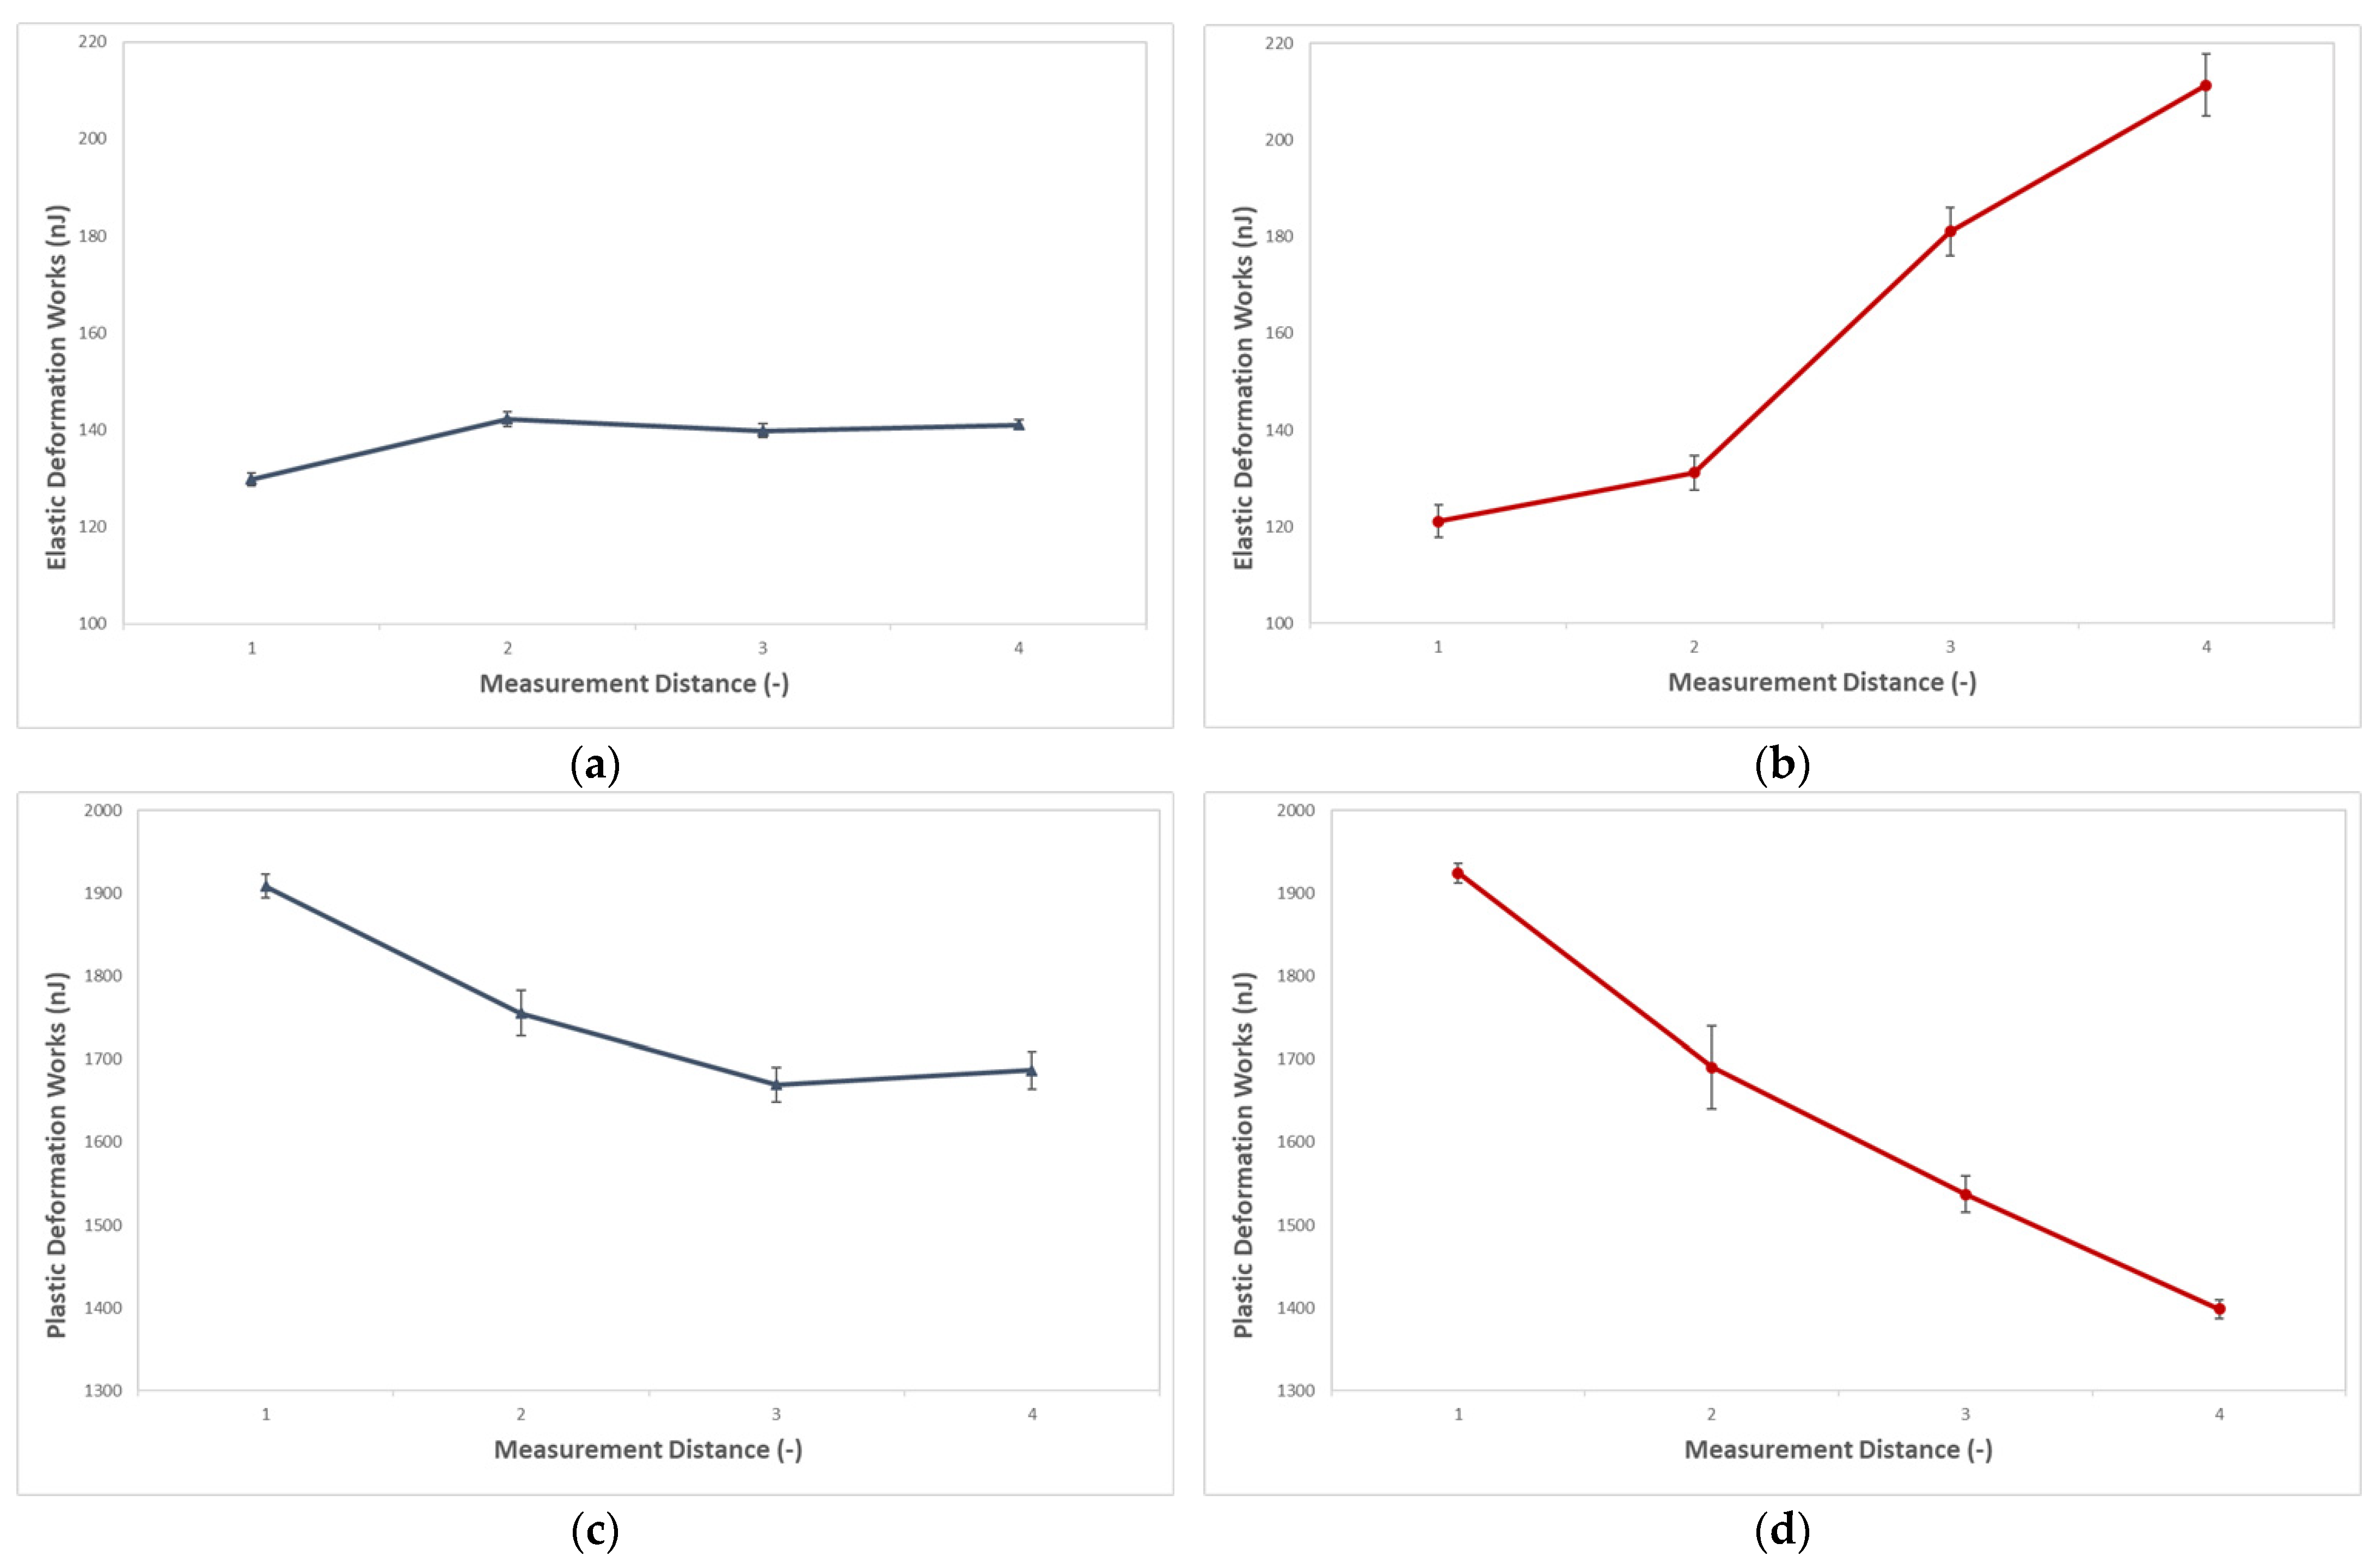
An important material characteristic describing the behavior of a material is the distribution of elastic (Figure 13a,b) and plastic (Figure 13c,d) deformation. The elastic part of the deformation is considered to be the residual deformation expended during the load relief process and describes the elastic deformation that disappears after the load is relieved, while the plastic part of the deformation remains in the form of an indentation of a certain depth.
With a sheet thickness of 1 mm, there is a gradual increase in the value of elastic deformation towards the peak of the draw. The area of unaffected sheet metal (position 1) showed an elastic part of deformation of 122 nJ. In areas where the dome was drawn, a significant increase in the elastic part of deformation was measured. The maximum elasticity at the top of the draw reaches a value of 211 nJ. The difference between area 1 and area 4 was 73%.
In the case of sheets with greater thickness, there is an increase in the value of elastic deformation at the beginning of dome drawing, where a maximum of 145 nJ is measured. During dome drawing, the value decreases slightly and then increases again slightly at the peak of the draw (142 nJ). The values of the elastic component of work are higher for 1 mm sheet metal than for 1.5 mm sheet metal. The elastic component confirms fundamental changes during sheet metal drawing and corresponds to the results of hardness and modulus of elasticity.
The course of plastic deformation for both sheet thicknesses is similar. The value of plastic deformation decreases towards the peak of the draw (area 4). The maximum value of plastic deformation reaches 1924 nJ. The lowest value at the peak of the draw reached 1398 nJ. The difference in plastic deformation is 38%.
For thicker sheet metal, there was an increase in the maximum value of plastic deformation. From area 1 to area 3, the deformation values decrease to 1685 nJ. At the peak of the draw, the deformation increased slightly. The individual measured values are similar in their progressions and therefore depend more on the setting of the drawing process for individual sheet thicknesses.
As is evident from both components of deformation, the plastic part of the deformation is dominant and has a decreasing tendency towards the peak of the draw. On the contrary, the elastic part of the deformation shows significantly lower values and, on the contrary, has an increasing trend towards the peak of the draw.
As shown in Figure 12 and Figure 13, the 1 mm sheet exhibited a higher degree of strain hardening relative to the 1.5 mm sheet. This difference can primarily be attributed to the prior thermomechanical processing history associated with rolling, as well as to the thermal conditions arising during the forming process itself. The thinner sheet is characterized by a higher level of inherited cold work resulting from the greater cumulative rolling reduction applied during manufacturing. Even though both materials were subjected to final recrystallization annealing, the 1.0 mm sheet still retained a greater residual dislocation density together with a finer subgrain morphology. Consequently, the material exhibits a substantially steeper strain-hardening response during subsequent deformation.
The increased hardening of the thinner sheet is further intensified by the accelerated kinetics of the TRIP mechanism (Transformation-Induced Plasticity). Austenitic steel 1.4376 is metastable and undergoes deformation-induced transformation from austenite to martensite during deformation. During plastic deformation, the initially ductile austenitic matrix gradually transforms into hard deformation-induced martensite. Owing to its low material volume within the bending zone, the 1.0 mm sheet undergoes extremely rapid local heating; however, its high surface-to-volume ratio simultaneously enables immediate heat dissipation into the colder tool surfaces, namely the die and the punch. This rapid thermal shock, involving localized heating followed by instantaneous cooling in contact with the tool, together with elevated shear stresses, promotes accelerated martensitic transformation, which manifests itself as an enhanced strain-hardening response.
The use of instrumented indentation in the study of deep drawing allows for a more detailed analysis of local material changes. The main advantage lies in the ability to measure local hardening directly in critical zones of the finished drawn part, such as the drawing edges, bend radii, or the bottom of the drawn part. In these locations, performing a standard tensile test is technically unfeasible due to the geometric limitations of the test specimens.
The DSI method thus allows for the precise determination of the gradient of mechanical properties across the structure of the drawn part, providing the necessary data for calibrating and validating results in finite element method numerical simulations. The obtained parameters (particularly the local increase in hardness and decrease in modulus) are essential for eliminating defects such as cracking or excessive springback, and lead to an overall refinement of drawing die design in industrial practice.
As the authors note in their studies [46,47,48,49], lubricants significantly modulate the depth of forming (Erichsen index, IE) by reducing friction and allowing for greater plastic deformation across the entire area. Reducing the coefficient of friction at the contact surface allows for greater plastic deformation of the surface before a crack form. The publications demonstrate significant differences in friction coefficients for various materials depending on the lubricants used, which correlates with the results of the Erichsen cup test and with the contact model in AutoForm software simulations. Modeling the Erichsen cup test is useful for predicting the effects of lubricants and drawing parameters on formability itself.

4. Conclusions

The paper dealt with the issue of deep drawing using the Erichsen method (drawing diameter 20 mm) on 1.4376 sheet metal with thicknesses of 1.5 mm and 1 mm. Drawing was performed with and without the application of lubricant. The deep drawing process was supported by deep drawing simulation in AutoForm R8, which helped to identify critical points during sheet metal drawing.
The main conclusions of this study are as follows:
  • The use of lubricant has a significant effect on the drawing process, as it reduces friction between the sheet metal and the drawing tool, which resulted in an increase in drawing distance and force.
  • With the application of lubricant, the drawing distance and force increased by approximately 25%.
  • The drawing results correlated with the results of simulations in AutoForm software, which also predicted the positive effect of lubricant on the drawing process.
  • The sheet reaches maximum hardness at the top of the draw.
  • The difference between the unaffected area (area 1) and the dome top area (area 4) is 63% for a sheet thickness of 1 mm.
  • For 1.5 mm thick sheet metal, the difference between the unaffected sheet metal and the sheet metal affected by drawing was approximately 28%.
  • The risk of tearing increases towards the top of the draw, and, in this case, a sheet thickness of 1 mm could show defects due to increased hardness.
The deep drawing process has a significant impact on the resulting mechanical properties of the drawn sheet. Each area of deep drawing exhibits different mechanical properties, which in practice can manifest themselves as critical points. These critical points can lead to subsequent cracking of the part in real operation. Simulation can also be used to predict these areas and take them into account.

Author Contributions

Conceptualization, M.O.; methodology, M.O.; validation, J.Z., O.S. and M.S.; formal analysis, J.Z. and O.S.; investigation, M.S.; resources, M.O.; data curation, J.Z. and O.S.; writing—original draft preparation, M.O.; writing—review and editing, M.O.; visualization, M.O.; supervision, M.O.; and project administration, M.S. All authors have read and agreed to the published version of the manuscript.

Funding

This research was conducted with the support of the Internal Grant Agency of Tomas Bata University in Zlín, supported under project no. IGA/FT/2026/001.

Institutional Review Board Statement

Not applicable.

Data Availability Statement

The original contributions presented in this study are included in the article. Further inquiries can be directed to the corresponding authors.

Conflicts of Interest

The authors declare no conflicts of interest.

References

  1. Wang, D. (Ed.) Handbook of Metal Forming Process; NY Research Press: New York, NY, USA, 2015; Volume vi, p. 212. [Google Scholar]
  2. Dvorak, M.; Gajdos, F.; Novotny, K. Technologie Tváření: Plošné a Objemové Tváření, 3rd ed.; Academic Publishing CERM: Brno, Czech Republic, 2013; 169p. [Google Scholar]
  3. Boljanovic, V. Sheet Metal Forming Processes and Die Design; Industrial Press: New York, NY, USA, 2004. [Google Scholar]
  4. Merklein, M.; Allwood, J.M.; Behrens, B.-A.; Brosius, A.; Hagenah, H.; Kuzman, K.; Weckenmann, A. Bulk forming of sheet metal. CIRP Ann. 2012, 61, 725–745. [Google Scholar] [CrossRef]
  5. Groover, M.P. Fundamentals of Modern Manufacturing, 4th ed.; John Wiley: Hoboken, NJ, USA, 2011. [Google Scholar]
  6. Larsson, J.; Jansson, A.; Karlsson, P. Monitoring and evaluation of the wire drawing process using thermal imaging. Int. J. Adv. Manuf. Technol. 2019, 101, 2121–2134. [Google Scholar] [CrossRef]
  7. Ballikaya, H.; Savas, V.; Ozay, C. The limit drawing ratio in die angled hydromechanical deep drawing method. Int. J. Adv. Manuf. Technol. 2020, 106, 791–801. [Google Scholar] [CrossRef]
  8. Schuler, G. Metal Forming Handbook, 2nd ed.; Springer: Berlin/Heidelberg, Germany, 2012. [Google Scholar]
  9. Bodhe, A.B.; Mandavgade, N.K.; Tajne, A. Selection of Blank Size for Deep Drawing of Rectangular Parts. In Smart Technologies for Energy, Environment and Sustainable Development; Springer: Singapore, 2019. [Google Scholar]
  10. Tekkaya, A.; Karbasian, E.H.; Homberg, W.; Kleiner, M. Thermo-mechanical coupled simulation of hot stamping components for process design. Prod. Eng. 2007, 1, 85–89. [Google Scholar] [CrossRef]
  11. Lazarescu, L.; Nicodim, J.; Banabic, D. Evaluation of Drawing Force and Thickness Distribution in the Deep-Drawing Process with Variable Blank-Holding. Key Eng. Mater. 2015, 639, 33–40. [Google Scholar] [CrossRef]
  12. Schreijag, S. Microstructure and Mechanical Behavior of Deep Drawing DC04 Steel at Different Length Scales, 18th ed.; KIT Scientific Publishing: Karlsruhe, Germany, 2013. [Google Scholar]
  13. Hu, P.; Ma, M.; Zhu, Y.-G. Theories, Methods and Numerical Technology of Sheet Metal Cold and Hot Forming: Analysis, Simulation and Engineering Applications; Springer: London, UK, 2013; 210p. [Google Scholar]
  14. Huang, G.; Sadagopan, S.; Schreier, H. Determination of Forming Limit and Fracture Limit Curves Using Digital Image Correlation. SAE Int. J. Mater. Manuf. 2014, 7, 574–582. [Google Scholar] [CrossRef]
  15. Dwivedi, R.; Agnihotri, G. Study of Deep Drawing Process Parameters. Mater. Today Proc. 2017, 4, 820–826. [Google Scholar] [CrossRef]
  16. ISO 20482:2013; Metallic materials — Sheet and Strip — Erichsen Cupping Test. ISO: Geneva, Switzerland, 2013.
  17. Moore, P.; Booth, G. Mechanical testing of welds. In The Welding Engineers Guide to Fracture and Fatigue; Elsevier: Amsterdam, The Netherlands, 2015; pp. 113–141. [Google Scholar]
  18. Ray, R.K.; Ghosh, P.; Bhattacharjee, D. Effects of composition and processing parameters on precipitation and texture formation in microalloyed interstitial free high strength (IFHS) steels. Mater. Sci. Technol. 2013, 25, 1154–1167. [Google Scholar] [CrossRef]
  19. Santos, R.O.; Pereira, A.B.; Butuc, M.C.; Vincze, G.; Festas, A.; Moreira, L.P. Development of a Device Compatible with Universal Testing Machine to Per-form Hole Expansion and Erichsen Cupping Tests. Machines 2019, 8, 2. [Google Scholar] [CrossRef]
  20. Kumar, S.R.; Selvaraj, S.K.; Arravind, M.S.; Venkateswarlu, D. Effect of Microstructure and Mechanical Properties of Austenitic Stainless Steel 1.6mm Butt Welded by Plasma Arc Welding. Mater. Sci. Forum 2019, 969, 619–624. [Google Scholar] [CrossRef]
  21. Keskitalo, M.; Hamada, A.; Hietala, M.; Jaskari, M.; Järvenpää, A. Micro-structure and Formability of Laser Welded Dissimilar Butt Joints of Austenitic-Ferritic Stainless Steels. Key Eng. Mater. 2021, 883, 258–265. [Google Scholar] [CrossRef]
  22. Luiz, V.D.; Santos, A.J.; Câmara, M.A.; Rodrigues, P.C.d.M. In-fluence of Different Contact Conditions on Friction Properties of AISI 430 Steel Sheet with Deep Drawing Quality. Coatings 2023, 13, 771. [Google Scholar] [CrossRef]
  23. Giuliano, G.; Samani, F.S. Effect of Lubrication on the Erichsen Test. Appl. Mech. Mater. 2013, 365–366, 425–428. [Google Scholar] [CrossRef]
  24. Evin, E.; Daneshjo, N.; Mares, A.; Tomas, M.; Petrovcikova, K. Experi-mental Assessment of Friction Coefficient in Deep Drawing and Its Verification by Numerical Simulation. Appl. Sci. 2021, 11, 2756. [Google Scholar] [CrossRef]
  25. Saray, O.; Pürçek, G.; Karaman, İ.; Maier, H.J. Formability of Ultrafine-Grained Interstitial-Free Steels. Metall. Mater. Trans. A 2013, 44, 4194–4206. [Google Scholar] [CrossRef]
  26. Sorce, F.S.; Ngo, S.; Lowe, C.; Taylor, A.C. Quantification of coating surface strains in Erichsen cupping tests. J. Mater. Sci. 2019, 54, 7997–8009. [Google Scholar] [CrossRef]
  27. Pramod, R.; Kumar, S.M.; Shanmugam, N.S.; Vendan, S.A. Formability studies on plasma arc welded duplex stainless steel 2205 sheet. Mater. Und Werkst. 2020, 51, 163–173. [Google Scholar] [CrossRef]
  28. Bandyopadhyay, K.; Panda, S.K.; Saha, P. Prediction of formability of laser-welded dual-phase steel by finite element analysis. Proc. Inst. Mech. Eng. Part B J. Eng. Manuf. 2013, 228, 1048–1057. [Google Scholar] [CrossRef]
  29. Gavrus, A. An Inverse Analysis of the Erichsen Test Applied for the Automatic Identification of Sheet Materials Behavior. Engineering 2010, 2, 471–476. [Google Scholar] [CrossRef][Green Version]
  30. Freisse, H.; Seefeld, T.; Vollertsen, F.; Dean, T.A.; Qin, Y.; Yaun, S.J. Tool surface with a supporting plateau of hard particles for deep drawing of high alloy steel. MATEC Web Conf. 2018, 190, 14006. [Google Scholar] [CrossRef][Green Version]
  31. Witulski, J.; Trompeter, M.; Tekkaya, A.E.; Kleiner, M. High wear resistant deep drawing tools made of coated polymers. CIRP Ann. 2011, 60, 311–314. [Google Scholar] [CrossRef]
  32. Qin, Y.; Wan-Nawang, W.A.; Zhao, J. Forming of Micro-sheet Metal Components. In Micromanufacturing Engineering and Technology; Elsevier: Amsterdam, The Netherlands, 2015; pp. 299–322. [Google Scholar]
  33. Carleer, B.; Burchitz, I.; Stippak, M. Systematic Drawbead Design; AutoForm Engineering GmbH: Pfäffikon, Switzerland, 2019. [Google Scholar]
  34. Zaid, A. Effect of Different Lubricants on Deep Drawing of Galvanized Steel. Int. J. Sci. Eng. Res. 2017, 8, 1584–1589. [Google Scholar]
  35. Szpunar, M.; Trzepiecinski, T.; Żaba, K.; Ostrowski, R.; Zwolak, M. Effect of Lubricant Type on the Friction Behaviours and Surface Topography in Metal Forming of Ti-6Al-4V Titanium Alloy Sheets. Materials 2021, 14, 3721. [Google Scholar] [CrossRef]
  36. Pereloma, E.; Timokhina, I. Bake hardening of automotive steels. In Automotive Steels; Elsevier: Amsterdam, The Netherlands, 2017; pp. 259–288. [Google Scholar]
  37. Uriya, Y.; Yanagimoto, J. Bore-expanding test for thermosetting carbon-fiber-reinforced plastic sheets. Int. J. Mater. Form. 2017, 10, 823–829. [Google Scholar] [CrossRef]
  38. Ovsik, M.; Bednarik, M.; Reznicek, M.; Stanek, M. Sheet Forming via Limiting Dome Height (LDH) Test: Influence of the Application of Lubricants, Location and Sheet Thickness on the Micro-Mechanical Properties of X8CrMnNi19-6-3. Lubricants 2024, 12, 260. [Google Scholar] [CrossRef]
  39. Sahu, Y.K.; Pradhan, M.K. Modelling and Simulation of Deep Drawing Process of Circular Cup on AL1200 Using Fi-nite Element Analysis. In Advances in Simulation, Product Design and Development; Springer: Singapore, 2020. [Google Scholar]
  40. ČSN EN ISO 10088-1; Stainless Steels—Part 1: Overview of Stainless Steels. ISO: Geneva, Switzerland, 2024.
  41. ČSN EN ISO 14577-1; Metallic Materials—Instrumented Indentation Test for Hardness and Materials Parameters—Part 1: Test Method. ISO: Geneva, Switzerland, 2015.
  42. ČSN EN ISO 14577-2; Metallic Materials—Instrumented Indentation Test for Hardness and Materials Parameters—Part 2: Verification and Calibration of Testing Machines. ISO: Geneva, Switzerland, 2015.
  43. ČSN EN ISO 14577-3; Metallic Materials—Instrumented Indentation Test for Hardness and Materials Parameters—Part 3: Calibration of Reference Blocks. ISO: Geneva, Switzerland, 2015.
  44. ČSN EN ISO 14577-4; Metallic Materials—Instrumented Indentation Test for Hardness and Materials Parameters—Part 4: Test Method for Metallic and Non-Metallic Coatings. ISO: Geneva, Switzerland, 2016.
  45. Muzyka, N.R. Influence if the Anisotropy of Materials on the Accuracy of Measuring of the Vickers Hardness. Strength Mater. 2007, 39, 211–218. [Google Scholar] [CrossRef]
  46. Więckowski, W.; Adamus, J.; Dyner, M.; Motyka, M. Tribological Aspects of Sheet Titanium Forming. Materials 2023, 16, 2224. [Google Scholar] [CrossRef] [PubMed]
  47. Adamus, J.; Więckowski, W.; Lacki, P. Analysis of the Effectiveness of Technological Lubricants with the Addition of Boric Acid in Sheet Metal Forming. Materials 2023, 16, 5125. [Google Scholar] [CrossRef] [PubMed]
  48. Naidu, K.; Datta, R.; Bhargava, M. Experimental Investigation on the Mechanical Properties and Formability Analysis of Stainless Steel 316 Thin Sheets at Different Annealing Temperatures. Key Eng. Mater. 2025, 1012, 11–18. [Google Scholar] [CrossRef]
  49. Singh, R.P.; Kumar, S.; Singh, P.K.; Meraz, M.; Srivastwa, A.K.; Salunkhe, S.; Hussein, H.M.A.; Nasr, E.A.; Kamrani, A.K. A Mathematical Model for Force Prediction in Single Point Incremental Sheet Forming with Validation by Experiments and Simulation. Processes 2023, 11, 1688. [Google Scholar] [CrossRef]
Figure 1. (a) Formability Limit Diagram (FLD) with the Formability Limit Curve (FLC); (b) working principal of Erichsen cupping test.
Lubricants 14 00218 g001
Figure 2. Erichsen test models: (a) tensile tester; (b) tensile tester with holder; (c) adaptive mesh on the model.
Lubricants 14 00218 g002
Figure 3. Material card: (a) hardening curve; (b) yield surface with BBC criterion; (c) Formability Limit Curve (FLC).
Lubricants 14 00218 g003
Figure 4. Material card information.
Lubricants 14 00218 g004
Figure 5. BUP–600 machines for testing of sheet metal deep drawing.
Lubricants 14 00218 g005
Figure 6. Measured areas for the Erichsen test: (a) scheme of measured locations; (b) real measurement locations.
Lubricants 14 00218 g006
Figure 7. FLD with visualization of deep drawing process (sheet metal thickness 1.5 mm): (a) drawing with lubricant—sheet metal thickness 1.5 mm; (b) drawing without lubricant—sheet metal thickness 1.5 mm; (c) drawing with lubricant—sheet metal thickness 1 mm; and (d) drawing without lubricant—sheet metal thickness 1 mm.
Lubricants 14 00218 g007
Figure 8. FLD with visualization of deep drawing process: (a) sheet metal thickness of 1.5 mm; (b) sheet metal thickness of 1 mm.
Lubricants 14 00218 g008
Figure 9. The maximum deformation of the draw: (a) sheet metal thickness of 1.5 mm; (b) sheet metal thickness of 1 mm.
Lubricants 14 00218 g009
Figure 10. Thinning of the wall thickness of the draw: (a) sheet metal thickness of 1.5 mm; (b) sheet metal thickness of 1 mm.
Lubricants 14 00218 g010
Figure 11. Sheet metal drawing process using the Erichsen method with and without lubricant application: (a) sheet metal thickness of 1.5 mm; (b) sheet metal thickness of 1 mm; (c) comparison of the influence of sheet metal thickness.
Lubricants 14 00218 g011
Figure 12. Mechanical properties for Erichsen method: (a) indentation hardness—sheet metal thickness of 1.5 mm; (b) indentation hardness—sheet metal thickness of 1 mm; (c) Vickers hardness—sheet metal thickness of 1.5 mm; (d) Vickers hardness—sheet metal thickness of 1 mm; (e) indentation modulus—sheet metal thickness of 1.5 mm; (f) indentation modulus—sheet metal thickness of 1 mm.
Lubricants 14 00218 g012
Figure 13. Deformation works for the Erichsen method: (a) plastic part of the deformation—sheet metal thickness of 1.5 mm; (b) plastic part of the deformation—sheet metal thickness of 1 mm; (c) elastic part of the deformation—sheet metal thickness of 1.5 mm; (d) elastic part of the deformation—sheet metal thickness of 1 mm.
Lubricants 14 00218 g013
Table 1. Chemical composition (%) of steel 1.4376 [40].
Chemical
Designation
Numeric Designationw/w%
CSiMnPSCrNiN
X8CrMnNi19-6-31.43760.101.005.0–8.00.0450.01517.0–20.52.0–4.50.30
Table 2. Mechanical properties of steel 1.4376 [40].
ParameterUnitValue
Tensile sstrengthMPa700–800
0.2% Yield pointMPa300–450
Elongation%˃35%
Elastic modulGPa200
Densitykg/dm37.9
Anisotropy parameters r-1.0–1.4
Table 3. Dependence of the Erichsen Index on sheet thickness.
Sheet Thickness (mm)IE—No Lubrication (mm)IE—Lubricant (mm)
1.010.1–10.812.8–13.5
1.512.4–13.215.2–16.0
Table 4. Preset parameters of BUP-600 device.
ParameterUnitValue
Force clampkN30
Speed cupmm/s0.5
FmaxkN100
Force punchkN70
Table 5. Technical data of SAF 125 N.
ParameterUnitValue
Appearance-Green/Blue
pH-8.3–8.5
Specific Gravity-1.01–1.03
Viscosity (ISO)cSt4
Table 6. Maximum forming forces determined using Autoform software.
Sheet Metal Thickness1.5 mm1.5 mm1 mm1 mm
Lubricantswith LubricantWithout Lubricantwith LubricantWithout Lubricant
Fmax (kN)82.768.453.641.1
Table 7. Parameters for sheet metal drawing using the Erichsen method.
Sheet Metal Thickness1.5 mm1 mm
Fmax (kN)86.150.3
Fbreak (kN)85.950.1
TravelBrake (mm)23.919.7
Disclaimer/Publisher’s Note: The statements, opinions and data contained in all publications are solely those of the individual author(s) and contributor(s) and not of MDPI and/or the editor(s). MDPI and/or the editor(s) disclaim responsibility for any injury to people or property resulting from any ideas, methods, instructions or products referred to in the content.