Abstract
With the rapid development of electric vehicles, the issue of wiper–windshield friction noise has become more prominent. However, limitations in the hardware and software configurations of existing experimental systems restrict in-depth studies of frictional vibration and noise mechanisms. This study develops an experimental system with functions for working condition adjustment, data acquisition, and analysis of wiper–windshield frictional vibration and noise. First, the overall design of the wiper–windshield experimental system is described. The system allows adjustment of the motion gear and friction coefficient and facilitates data collection and analysis of pressure, vibration, and noise. The design includes the mechanical structure, electronic and electrical components, and software system of the experimental setup. A PLC control program (lower computer) and human–computer interaction software (upper computer) based on LabVIEW are developed to drive and control the mechanical structure, enabling working condition adjustment, data acquisition, and analysis. Finally, an experimental scheme is implemented to verify the feasibility of the wiper–windshield experimental system. Mechanical property, vibration, and noise data from the wiper are collected by simulating the operating conditions of a real vehicle. The experimental results demonstrate that the designed wiper–windshield experimental system can adjust various working conditions and support the collection and analysis of diverse data, facilitating theoretical research on the generation mechanism, influence rules, and control methods for wiper–windshield frictional vibration and noise.
1. Introduction
Wipers play a crucial role in maintaining clear visibility and reducing the risk of accidents by removing rain, snow, and dust from car windshields [1]. They are a vital and consumable component of every vehicle, with significant usage rates. With the rapid advancement of electric vehicles, the issue of wiper noise has become increasingly prominent [2]. Extensive research has been conducted to understand the friction, vibration, and noise generation mechanisms in wiper–windshield systems through vehicle experiments, bench experiments, and theoretical analyses. Wiper noise can be categorized into flutter noise (below approximately 100 Hz), scream noise (approximately 1000 Hz), and reverse noise (below approximately 500 Hz) [3]. It has been determined that wiper noise exhibits nonlinearity, time variability, and randomness. This is closely related to the characteristics of the wiper blade and glass surface [4], the operational state of the blade [5], the lubrication boundary conditions [6,7], the motion speed of the blade [8,9,10], and the applied positive pressure [11]. Friction noise results from the self-excited oscillations induced by the friction force, leading to system instability and subsequent noise generation. Friction noise significantly impacts driving comfort and safety. Effectively understanding and controlling the mechanisms of frictional vibration noise pose a significant challenge for researchers.
Experiments serve as the fundamental approach to investigating friction vibration noise in wiper–windshield systems. Directly analyzing the appearance characteristics of friction, vibration, and noise enables the qualitative and quantitative analysis of key influencing factors. Currently, research on friction vibration and noise in wiper–windshield systems mainly consists of bench experiments and real vehicle experiments. There are two types of bench experiments: rotary and translation. On rotary wiper test benches, the wiper blade is securely attached to a glass surface, and the round glass is rotated to simulate the wiper’s movement. The speed at which the wiper blade scrapes the glass is quantified as the angular velocity [12]. Translation wiper test benches operate in two modes [13]. First, the glass remains fixed while the wiper blade is driven by a linear actuator, resulting in linear blade motion across the glass. Second, the wiper blade remains fixed while the lower glass is driven by a linear actuator, causing the glass to scrape the blade in a straight-line motion. In both operational modes, the scraping speed is measured as linear. Goto [14] constructed a rotary wiper test bench to observe the operational state of a wiper blade and compared it with the results of finite element simulation. Deleau’s experimental platform, powered by a brushless motor [15], measured the contact pressure of the scraper using a static force sensor, with values ranging from 0 to 20 N. Friction, vibration, and noise data during rotation were captured using a torque sensor, accelerometer, and microphone, respectively. Min [16] constructed a rotary wiper test bench to investigate the factors influencing the screech noise produced by friction between real vehicle wipers and a windshield under specific conditions. This test bench successfully generated screech noise at a frequency similar to that produced by actual vehicle wipers. Xiao [17] developed a friction coefficient tester specifically for measuring the friction between a wiper strip and a glass surface. The tester operates by using a direct current (DC) motor to rotate circular glass while an internal spring adjusts the downward pressure of the blade in real time. This pressure is then detected by a static force sensor. Additionally, a dynamic force sensor detects the amount of friction during the scraping motion of the blade. The data collected by these sensors are processed by a processor and are displayed as the friction coefficient between the blade and the glass. By employing the principle of reverse motion, the tester effectively addresses the challenge of maintaining constant friction between the scraper and the glass, thus enabling accurate measurements of the friction coefficient according to the dry and wet conditions of the glass surface. These measurements serve as a reliable foundation for the design of wipers. Similarly, Zhang [18] invented a friction tester specifically for wiper blades and glass surfaces. This tester is securely fixed onto glass and utilizes a motor to rotate on its surface. The force sensor on the tester collects data on the friction between the scraper and the glass. By analyzing these data, the tester is able to determine the optimal fit between the blade and the glass, as well as to study the influence of different cleaning fluids on the friction force. However, it is important to note that the maximum speed of the tester’s motor is only 10 r/min, resulting in a scraping speed of approximately 104.72 mm/s for the outermost scraper when using a 100 mm blade in the example. This speed significantly differs from the actual scraping speed of a wiper on a real car.
Koenen [11] utilized a translation wiper experimental device to establish temperature (0~60 °C) and humidity (20%~90%) controls. By doing so, they were able to determine the relationships between the friction coefficient of the scraper and the ambient temperature, brushing speed, normal load, and dry and wet conditions of the glass surface. Additionally, the study explored the connection between the viscous friction phenomenon and screaming noise. Lee [19] independently developed a translation wiper test bench specifically designed to measure the dynamic behavior of a wiper. By employing a high-speed camera, the study monitored the cross-sectional shape of the wiper. The contact pressure distribution between the blade and the glass surface, as well as the motion pattern of the blade over time, was measured. The experimental results exhibited a high degree of consistency with the simulation results. Bóda [13] developed a translation wiper test bench capable of simulating the linear speed of wiper operation in an actual vehicle. The experimental bench was able to concurrently measure the horizontal friction and vertical pressure of the blade on the glass during wiper motion, with a speed control range of 0.1~150 mm/s.
The Yabuno team has conducted multiple studies on the reverse characteristics of wipers utilizing the same translational wiper reverse bench [20,21,22]. The experimental bench enables the adjustment of the blade’s downward pressure on the glass through bolts, while the motor-driven internal sliding bearing prompts the wiper blade to move back and forth across the glass surface. A high-speed camera captures the movement changes in each section’s cross-section when the blade is reversed. The scraper’s cross-section is simplified into a single- or two-degrees-of-freedom linkage model. The motion equation of the scraper is derived and numerically solved. The results from the theoretical derivation and experimentation are mutually corroborated. Zhang [23], Chen [24], and Huang [25] collected vibration and noise data from wipers under different operating conditions (e.g., speed and dry/wet conditions) through real vehicle experiments. They conducted time–frequency domain analysis and transmission path analysis. The findings demonstrate that the vibration and noise of wipers are significantly influenced by the dry/wetness of the windscreen glass. Additionally, when the wiper is reversed, it exhibits an impact phenomenon, resulting in noticeable structural vibrations. By analyzing the mechanisms of vibration and noise, proposed measures for improvement are presented.
The pressure distribution on the glass of the scraper is nonuniform, and the scraping speed in the middle of the wiper significantly differs from the maximum scraping speed achieved by the experimental equipment. Therefore, there may be substantial deviations between the results obtained on benches and real vehicles. However, measuring the dynamic mechanical parameters of a wiper blade directly during its motion in real vehicle experiments is challenging.
To summarize, the hardware equipment and software functions of wiper test benches still have some problems and deficiencies. First, the motor speed used in the bench is relatively low and fails to meet the operating conditions of 600 mm/s and above in the middle position of low-speed windshield wipers. Second, the impact of uneven fit on experimental test results is neglected when the wiper is pressed to the glass. Third, in translation test benches, the software cannot set and adjust the acceleration and deceleration times when the wiper is reversed on both sides. Fourth, the platform relies on manual spraying to achieve wet glass surfaces, and automation in adjusting the water spray volume and friction coefficient is lacking. Considering these problems, this paper addresses the needs of the hardware equipment and software functions of the experimental system. This approach combines systematic development, modular methods, and automation technology to develop a wiper–windshield friction vibration noise experimental system. This experimental system enables the setting and adjustment of different dry and wet conditions, brushing speeds, acceleration and deceleration times, pressures, and other experimental conditions. Additionally, it facilitates the collection, analysis, and preservation of experimental data through self-developed software.
2. The Design of the Wiper–Windshield Experimental System
First, the overall design process and design framework of the wiper–windshield experimental system were established. Then, the design specifications and requirements were analyzed. Finally, the functional design of the experimental system was based on the design specifications. Figure 1 illustrates the design flow of the wiper–windshield experimental system. The design specifications of the experimental system include three components: the design of the experimental platform structure, the implementation of key measurement and control methods, and the adjustment of target parameters. The implementation of key measurement and control methods is further divided into three subparts: the programmable logic controller (PLC); signal acquisition, analysis, and preservation; and Modbus communication. Based on the design specifications, the experimental system includes a drive control function module and a data acquisition function module. By deploying these two functions in the experimental test, the mechanical properties of the wiper, as well as the vibration and noise experimental test functions, can be determined.

Figure 1.
General design process of experimental system for wiper–windshield frictional vibration and noise.
2.1. Experimental System Design Index
With reference to the standards QC/T 44-2009 [26] and GB 15085-2013 [27], this paper defines and sets the experimental conditions and parameters of the wiper–windshield experimental system based on the description of the process of the wiper experiment project in domestic and foreign studies.
Windshield glass surfaces can be categorized into dry, wet, and semiwet states [11]. The wet state is characterized by continuous water coverage on the glass surface. In the experiment, water was continuously supplied by a pump at a rate of 0.25~0.3 L/m2 [13]. To ensure an appropriate amount of water and brushing speed, the glass surface cannot be overly wet, and the amount of water is determined by the brushing speed. The friction coefficient between the blade and the glass under wet conditions is approximately 0.25. The semiwet state, also known as the sticky state, represents the transitional phase between wet and dry conditions. By adjusting the amount of water sprayed and implementing an intermittent water supply, several thin water film areas of different sizes were formed on the glass surface during the experiment. The friction coefficient between the scraper and the glass gradually increases in this state, reaching a peak value of approximately 1.25. The dry state refers to a clean and dry glass surface without any water stains, with a friction coefficient between the scraper and the glass surface of approximately 0.95.
The scraping speed reflects the linear velocity of each point on the vehicle wiper blade as it moves along a circular path. Due to the translational scraping form of the scraper in the experimental system, differences exist compared to the oscillating scraping form used in vehicles. In vehicles, all points on the wiper blade move on a circular path, with the linear speed at the outer radius of the circumference being one order of magnitude greater than that at the inner radius [13]. In vibration tests, an accelerometer typically installed in the middle position of the wiper is used [23]. To determine the running speed of the wiper, linear speed data of a passenger car wiper were collected. The wiper brush speed ranges were divided into low speed, high speed, and intermittent speed, with the intermittent and low brush speeds being the same [23]; hence, only low speed and high speed are tested. The position of the wiper blade is tested at the inside, middle, and outside positions. The inner circle radius is 250 mm, and the outer circle radius is 850 mm. The wiper swing angle is approximately 90°. Figure 2 illustrates the wiper stroke at these three positions.
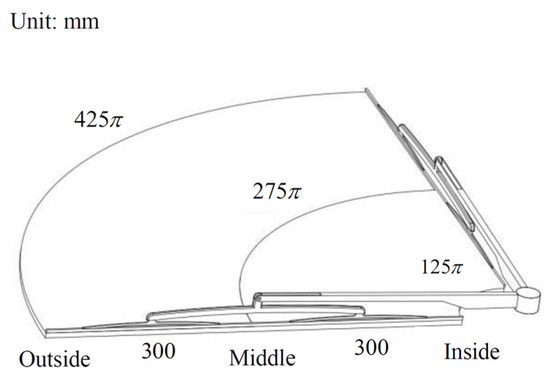
Figure 2.
Measurement of linear velocity at each position of wiper.
The time spent was recorded for the same number of brushings; thus, the linear velocity v at the three positions was calculated from Equation (1).
where N is the number of round trips of scraping, s is a single stroke of scraping, and t0 is the time. Table 1 lists the wire speeds of the wipers in their low and high gears. The maximum wire speed of the wiper outside the high gear was 2100 mm/s.

Table 1.
The linear speed in each wiper position for the low and high gears of the real vehicle wiper.
Wiper acceleration and deceleration time refer to the time it takes for the wiper to reach its maximum speed from a stop and to reach a stop from its maximum speed. This time reflects the ability of the wipers to start and stop quickly. Wipers exhibit a retrace phenomenon at the top dead center and bottom dead center, where they decelerate and then accelerate in the opposite direction. The time required for this reversal is known as the middle stop time, which is typically approximately 0.2 s [23]. For reference, the average pressure per unit length of the wiper blade on the glass ranges from 15 N/m to 25 N/m [13], and the pressure between the wiper and the glass is set at 0–5 N.
In summary, the design parameters of the wiper–windshield experimental system are as follows: (1) The experimental bench structure is of the translation type, allowing for the adjustment of the friction coefficient and movement speed between the wiper and the windshield. This enables the simulation of the wet, semiwet, and dry conditions of the vehicle glass surface. (2) A pressure distribution adjustment device was designed to ensure uniform contact between the wiper and the glass, balancing the contact pressure and ensuring accurate experimental results. (3) The driving mechanism consists of a servo motor and a water pump, with control facilitated through the PLC pulse, direction, and Modbus communication. (4) An independent software system was designed to accurately adjust parameters and control the movement of the mechanism, as well as to acquire, analyze, and preserve data.
The adjustable parameters in the experimental system include a wiper stroke of 1000 mm, a wiper speed of 2100 mm/s, a rated motor speed of 3000 r/min, a minimum water spray volume of 0.058 L/min, wiper acceleration and deceleration time, wiper reversal time, and the wiper pressure on the glass. The data to be collected, analyzed, and saved include the following: wiper pressure distribution, dynamic pressure and friction between the wiper and the glass, and wiper vibration and noise.
2.2. Experimental System Design Function
The drive control function module ensures the smooth operation of the wiper–windshield experiment system. By transforming the required experimental conditions into corresponding parameter variables and inputting them into the system, the output of the running carrier (e.g., direction, position, and state) can follow the input parameters to achieve driving control. The main operating carrier is the screw module, with the driving unit comprising a servo motor, servo driver, DC driver, and water pump. The control unit is the PLC.
The data acquisition function module is responsible for obtaining data from the wiper–windshield experiment system. While the wiper is in operation, the experimental system can convert signals from various sensors into digital signals using data acquisition cards. These digital signals are then transmitted to the upper computer for analysis, processing, and storage. The main sensors used are force sensors, accelerometers, microphones, and thin-film pressure sensors. The signal conversion tools include control instruments and conditioning modules, and the primary acquisition tools are data acquisition cards.
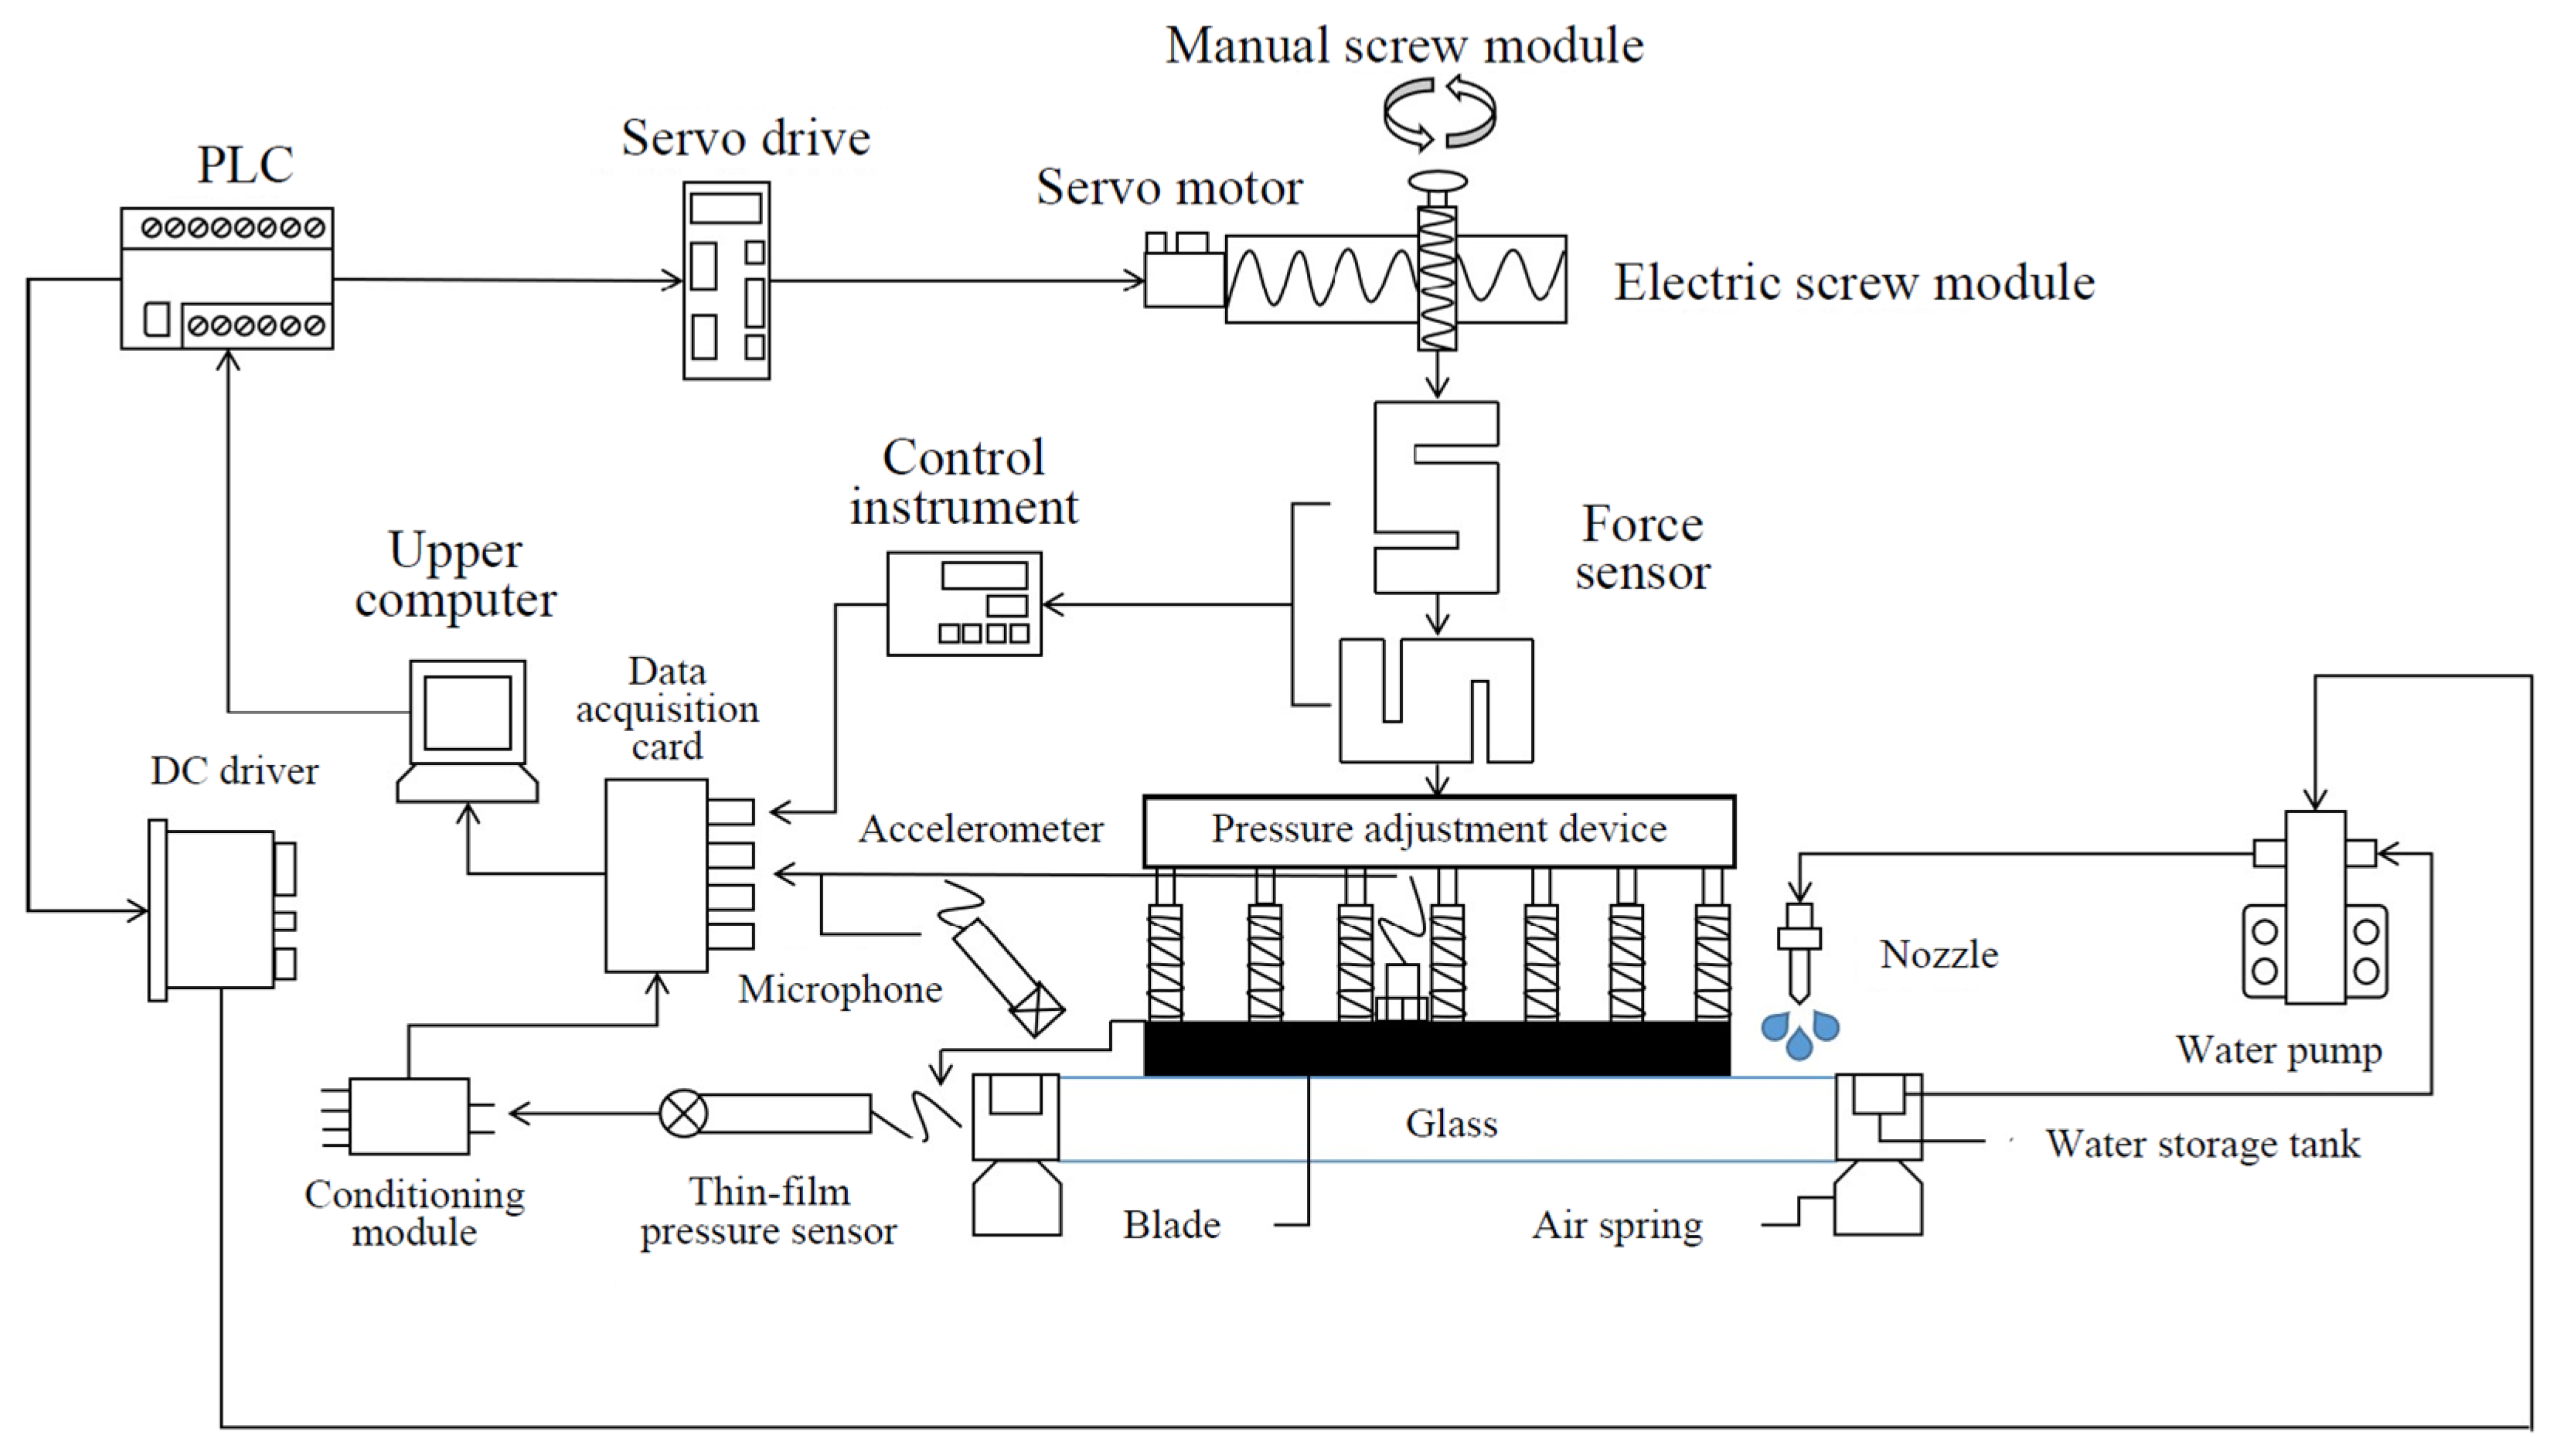
Figure 3 displays the models of the drive control and data acquisition function modules. The servo drive and DC drive are controlled by a PLC simultaneously to adjust the speed of the servo motor and the water pump. This, in turn, allows for the adjustment of the wiper speed and the amount of water sprayed. The pressure adjustment of the blade on the glass was accomplished manually using a screw module. Real-time measurement of the dynamic pressure and friction between the blade and the glass is achieved through the use of a force sensor in both the Z- and X-axis directions. The multipoint pressure distribution adjustment device, which is situated on the upper end of the wiper, enables the adjustment of the multipoint position of the scraper. This ensures a uniform fit between the scraper and the glass. The thin-film pressure sensor records the pressure at each point. Additionally, two three-way accelerometers are positioned in the middle and on one side of the upper end of the wiper blade. These accelerometers are used to measure the tangential (X), axial (Y), and vertical (Z) vibrations of the wiper. Four microphones are placed at each reverse position of the wiper blade to measure its noise. The sensor data are collected in real time by the data acquisition card and transmitted to the upper computer.
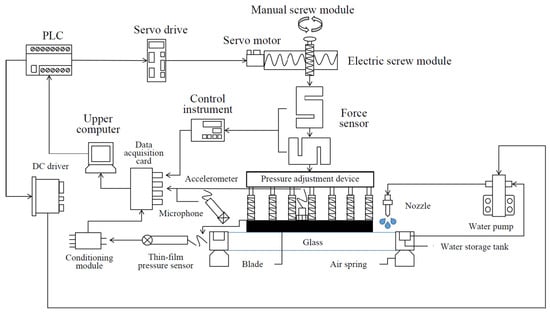
Figure 3.
The functional modules of the designed wiper–windshield experimental system.
To ensure the accuracy of the experimental data, it is necessary to carefully select a suitable sensor for the acquisition module. Based on the time domain and frequency domain characteristics of the wiper vibration and noise signals collected from the vehicle [23,25], the Model 378B02 microphone and Model 356A16 accelerometer from the PCB Inc. (Buffalo, NY, USA) were selected. Furthermore, considering the dynamic simulation and prediction results of the wiper’s impact force on the windshield’s contact pressure [28], when the contact pressure is 7–8 N, the impact force at the reverse moment reaches 29.66 N. Therefore, an AT8314 type S bidirectional force sensor from the AUTODA AT series (Suzhou AUTODA Automation Co., Ltd., Suzhou, China), which is equipped with waterproof capabilities, was selected. To complement the force sensor, the AUTODA AD2020EB control instrument was paired with it, which converts the force sensor’s output signal into an analog voltage signal and transmits it to the data acquisition card. Additionally, a thin-film pressure sensor, specifically the Model CHENGTEC DF9-40 series flexible film pressure sensor manufactured by Shanghai Chengke Electronics Technology Co., Ltd. (Shanghai, China), was utilized to measure the static pressure of the wiper at different points on the glass. According to the simulation and prediction results of the static pressure distribution on a windshield by wiper [28], a CHENGTEC DF9-40 series flexible film pressure sensor was selected and equipped with a conditioning module. For the data acquisition card, an NI 9234 model with an input signal range of ±5 V and a four-slot CompactRIO controller, both manufactured by National Instruments (NI) Corporation (Austin, TA, USA), were employed.
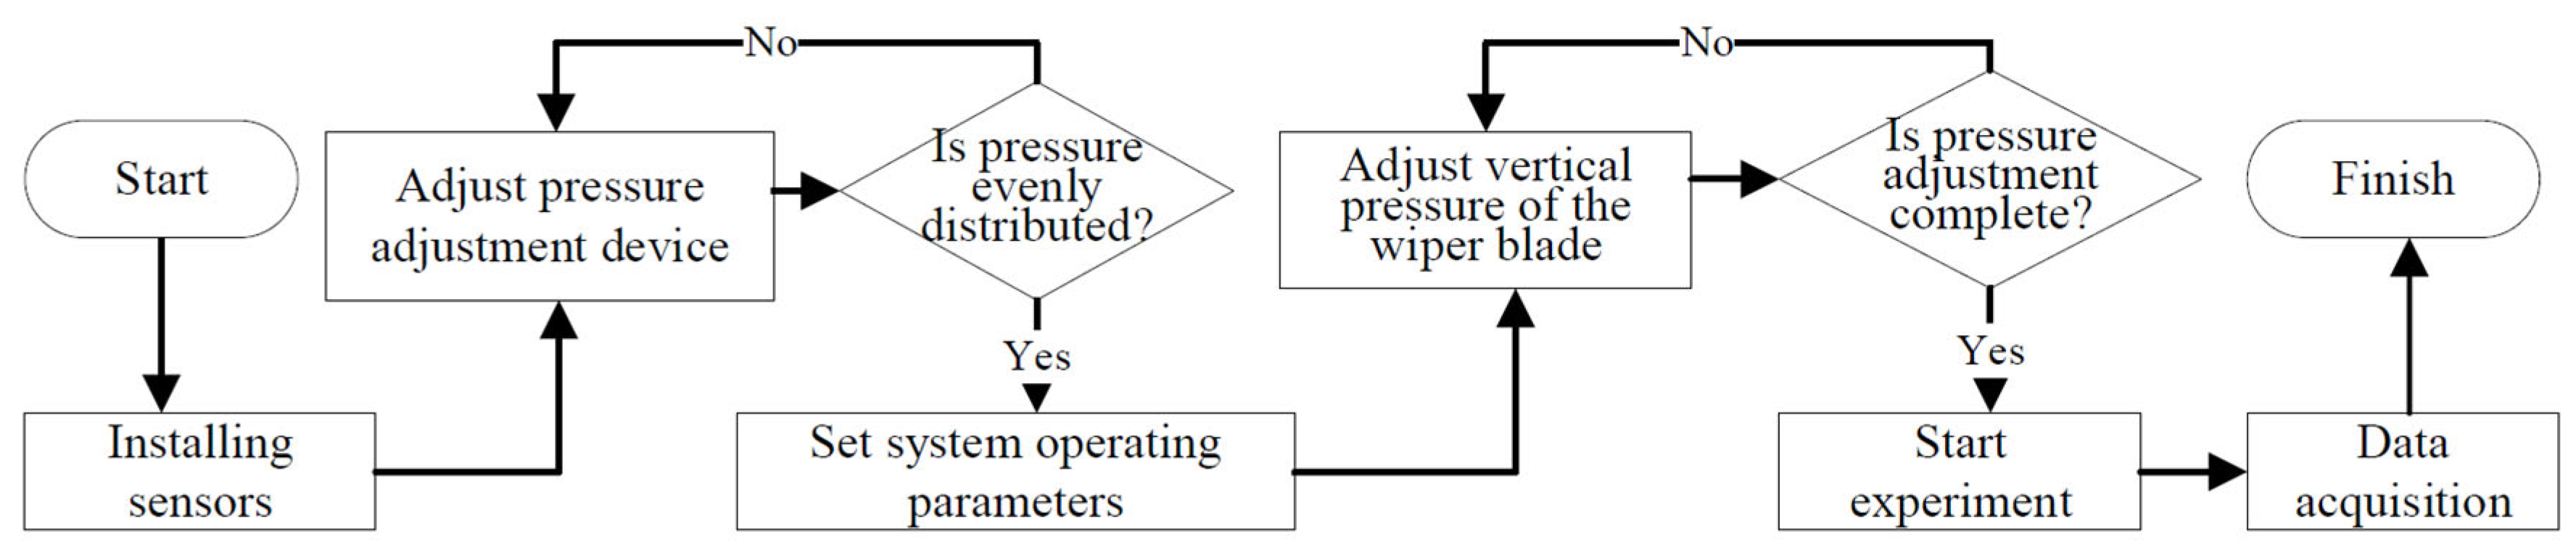
The experimental test functions were categorized into mechanical property, vibration, and noise experiments. A flow diagram outlining these functions is presented in Figure 4. The mechanical properties include the wiper pressure distribution on the glass, dynamic pressure, and friction. Before conducting the experiment, it is crucial to install the relevant sensors and verify whether the pressure distribution is evenly distributed. Adjustments should be made if necessary. After running the wiper for a certain duration, the dynamic pressure and friction caused by the wiper’s brush and reversal are measured under various experimental conditions. Additionally, the vibration and noise generated by the friction of the wiper on the glass surface are recorded.
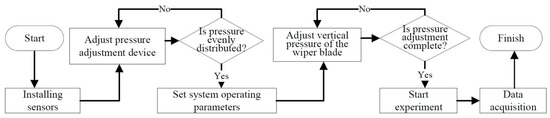
Figure 4.
Flow diagram of the experimental process.
3. Mechanical Structure and Hardware Design of Wiper–Windshield Experimental System
Based on the design scheme of the wiper–windshield experimental system, the mechanical structure and hardware components of the system were designed. The structure of each mechanism and the model parameters of each component were determined. The circuit schematic diagram of the control cabinet was devised, and the model of the servo motor was selected through parameter calculation.
3.1. Experimental Bench Mechanical Structure Design
The mechanical structure of the wiper test bench mainly consists of three main components: the cross-moving mechanism, the wiper assembly mechanism, and the water spraying mechanism [29]. The cross-moving mechanism is the central component of the wiper test bench and is responsible for the operation and pressure functions of the bench. As shown in Figure 5, the design includes the following components: 1—servomotor (Z-axis); 2—screw module (Z-axis); 3—screw module (X-axis); 4—servomotor (X-axis); 5—bottom plate; 6—glass; 7—air spring; 8—support column. The bottom plate and support column, which are nonstandard components, are made of a high-strength and lightweight aluminum alloy (7A09 GB/T3190-2008 [30], grade 7075-T6). The X-axis and Z-axis screw module are fixed onto the bottom plate using the support column. Both screw modules are equipped with sliding blocks and guide rails. The servomotor (4) drives the internal ball screw to rotate, enabling the slider to move along the horizontal guide rail, thus causing the screw module (2) to move in a reciprocating straight line. A force sensor detects friction data in the horizontal direction when the wiper brushes the glass surface. The real-time friction value is then displayed on the control instrument. The glass can be customized and replaced to simulate different types of windshields.
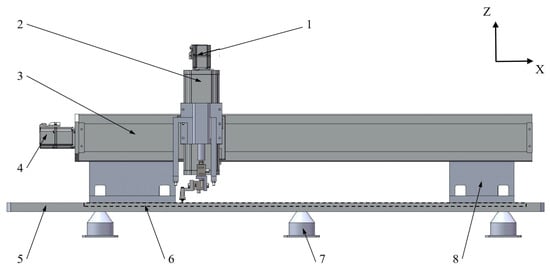
Figure 5.
Physical diagram of cross-moving mechanism structure.
According to the wiper stroke and speed defined in Section 2.1, the stroke l of the Z-axis screw module is determined to be 1000 mm, and the lead BP of the screw is calculated by Formula (2).
In the formula, BP is the lead of the electric screw (3), v is the maximum scraping speed, and n is the rated speed of the servo motor. The lead of the screw was 40 mm/r.
Pressure regulation is accomplished by the Z-axis screw module. This motion ensures that the lower wiper assembly mechanism applies a certain pressure to stick the scraper onto the glass. A force sensor detects dynamic pressure data in the vertical direction when the wiper brushes the glass surface. The real-time pressure value is then displayed on the control instrument. Pressure adjustment is achieved by setting the servo motor JOG mode speed and distance of movement through the PLC. In JOG mode, the blade is moved to the desired position using point motion, and the position is continuously adjusted until the desired pressure value is reached. The vertical servo motor has a brake function that maintains the vertical direction of the blade and the relative static state of the glass after the vertical pressure adjustment is completed.
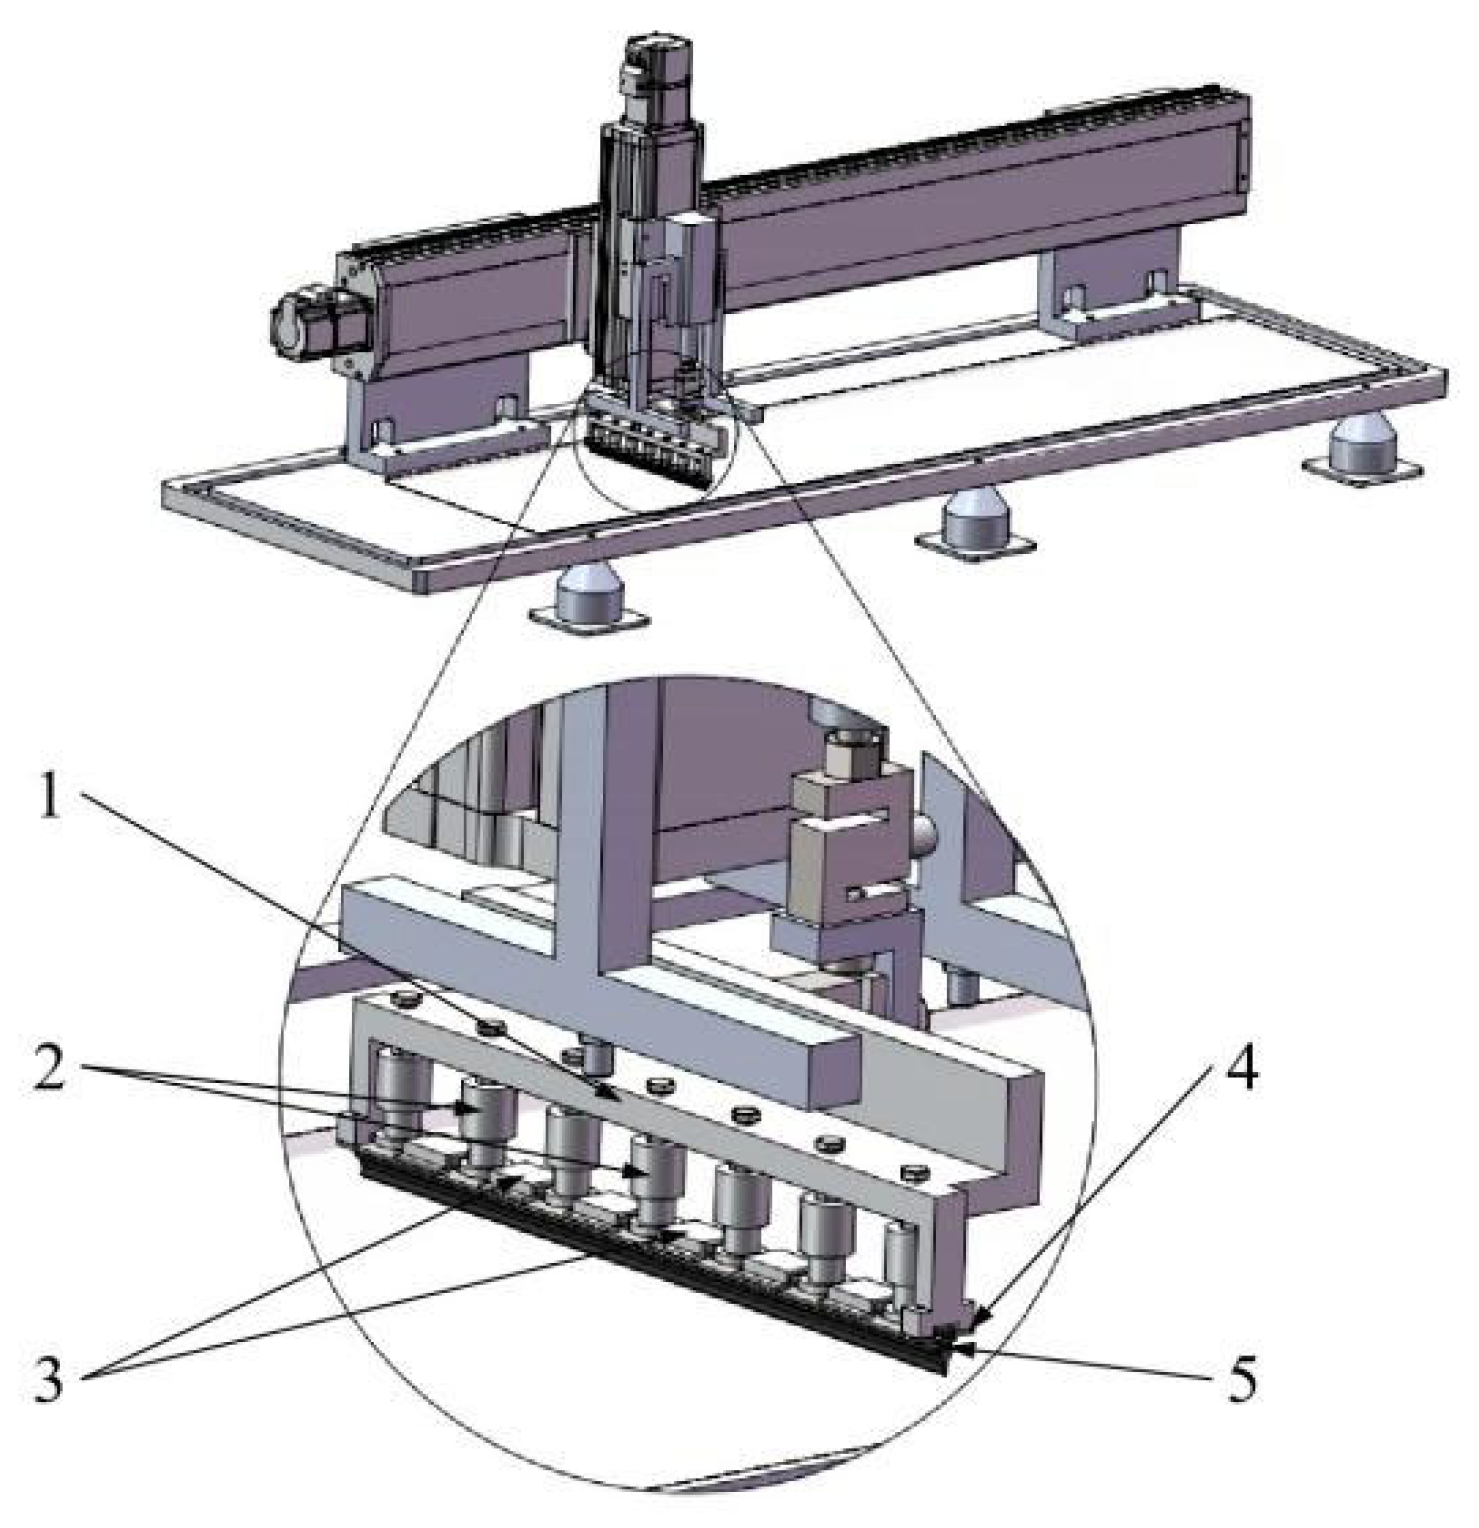
To enhance the accuracy of the dynamic pressure and friction test results of the wiper, it is crucial to ensure a uniform fit between the blade and the glass. Thus, a wiper assembly mechanism (Figure 6) was designed, including the following components: 1—fixed base; 2—pressure distribution adjustment device; 3—connecting plate; 4—steel bar; 5—wiper blade. The upper end of the wiper assembly mechanism is connected by two perpendicular force sensors, and the lower end is in contact with the glass. Referring to patent US8819889B2 [31], boneless wipers are used for the steel bars and blades. The fixtures can also be adjusted to accommodate different types of wipers. The other components can be adjusted and adapted based on the structure of the wiper test bench. The length of the steel bar and blade is set to 200 mm, with the steel bar embedded in the grooves on both sides of the blade to transfer the pressure while fixing the blade.
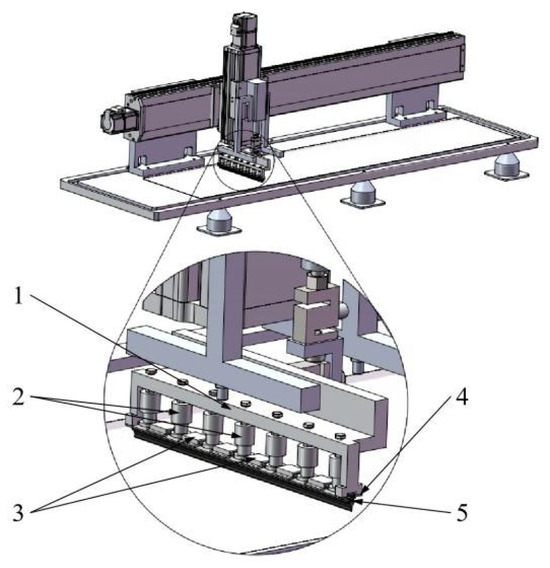
Figure 6.
A physical diagram of the structure of the wiper assembly mechanism.
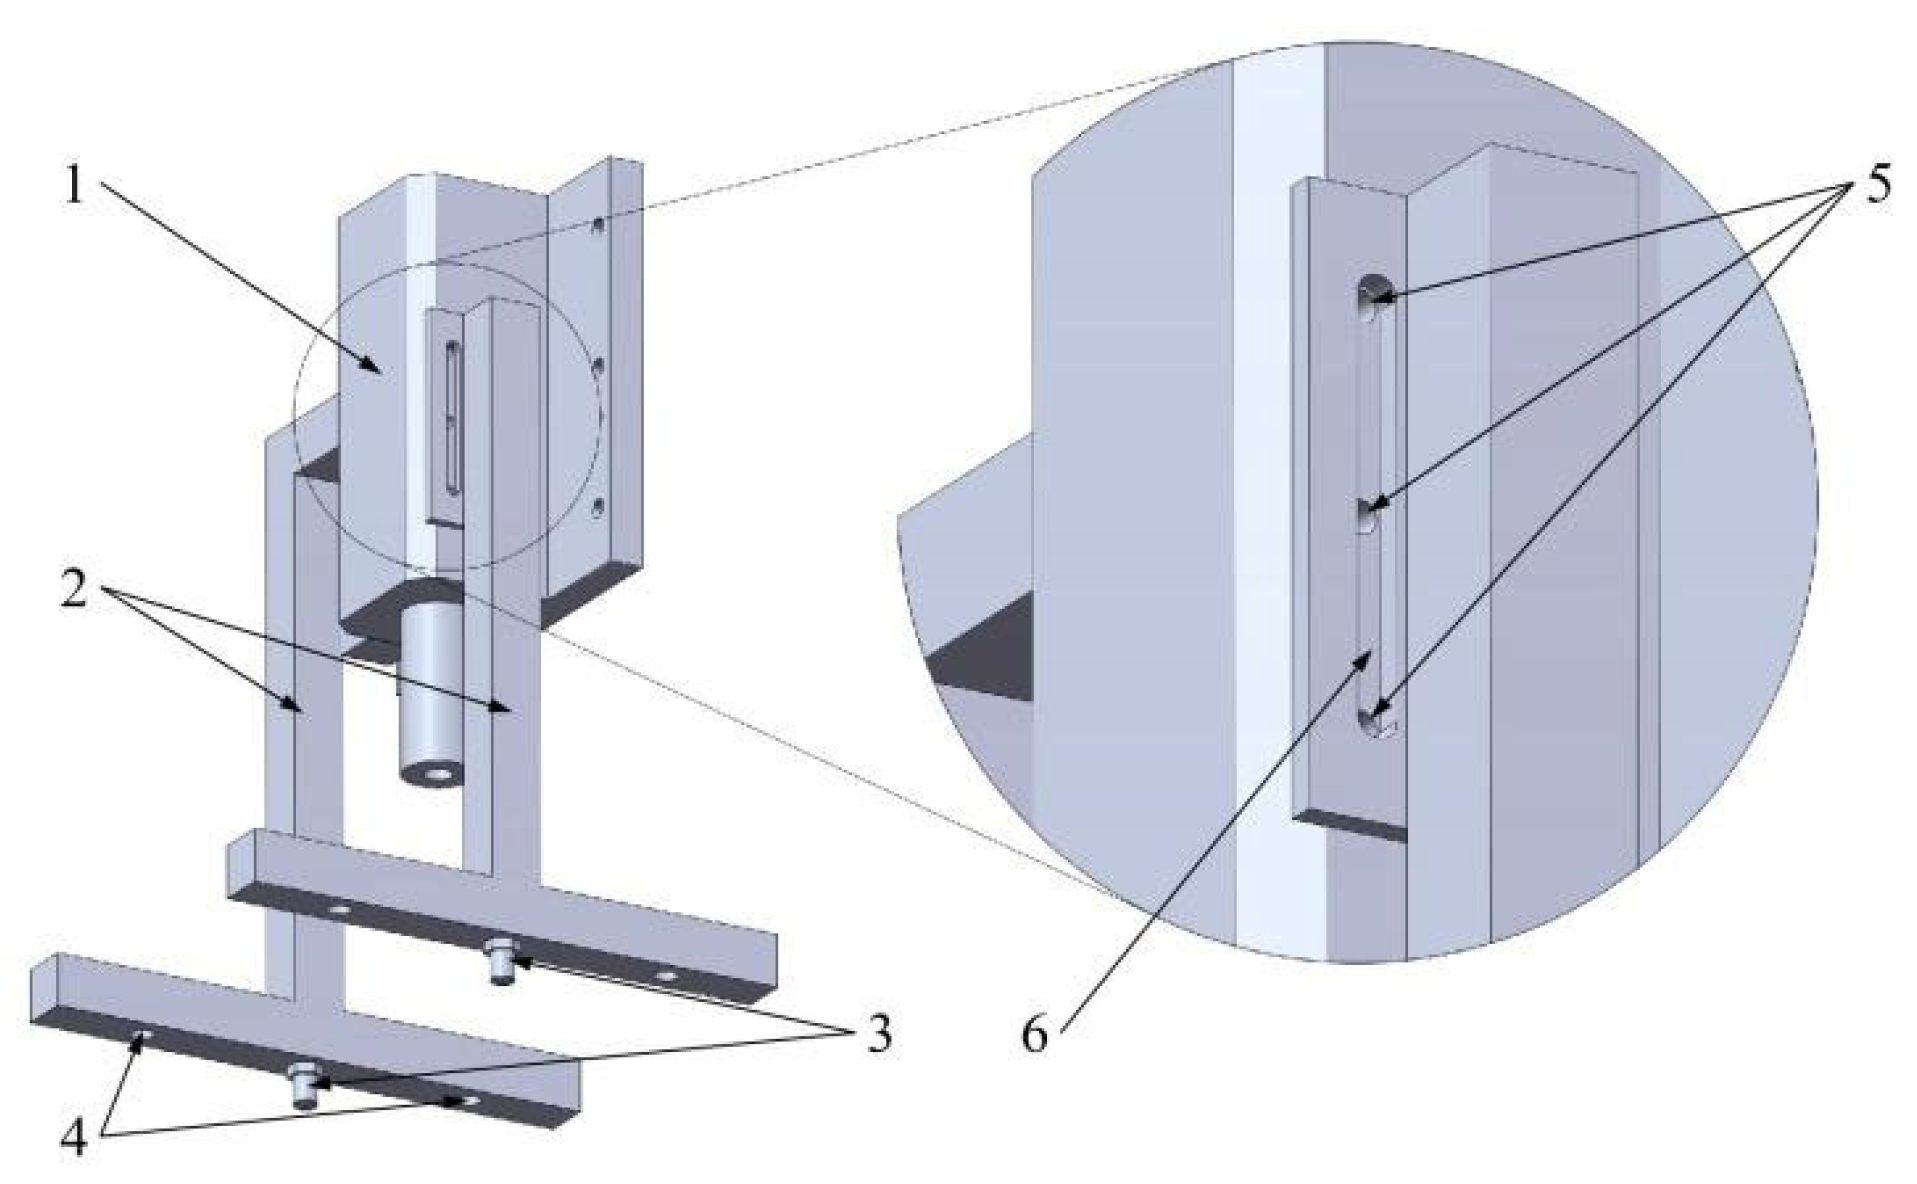
The pressure distribution adjustment device is installed in the fixed seat of the wiper assembly mechanism, with the lower part positioned near the scraper. The explosion diagram shown in Figure 7 illustrates its components: 1—bolt; 2—nut; 3—upper sleeve; 4—spring; 5—lower sleeve. This device utilizes a double-sleeve design structure; the bolt (1) runs through the upper sleeve (3) and is threaded with the lower sleeve (5). Its purpose is to regulate the pressure at each point of the blade, ensuring a consistent fit between the glass and the blade. The spring (4) is positioned within the double sleeve and interacts with the upper and lower sleeves. By manipulating the nut (2) to push the upper sleeve down, the spring (4) undergoes slight deformation, effectively transferring pressure from the lower sleeve to the blade and ultimately to the glass. The inclusion of the spring serves to provide damping, preventing permanent deformation resulting from the excessive compression of the steel bar. To achieve a uniform blade-to-glass pressure distribution, the pressure distribution adjustment device simultaneously adjusts multiple target positions to generate pressure at multiple points. This results in the creation of a static pressure distribution. By keeping the distance x0, at which the spring is stopped, consistent and varying the downward pressure FN based on the spring stiffness k, as indicated in Equation (3), the device ensures the improved accuracy of pressure measurement.
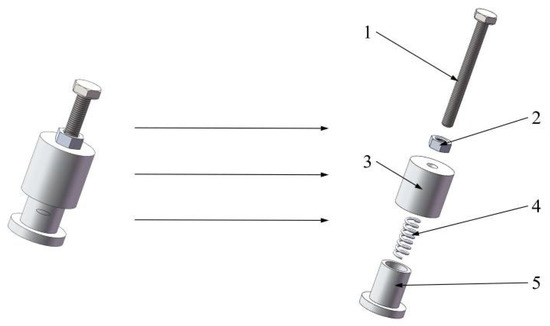
Figure 7.
Physical diagram of pressure distribution regulating device under explosion conditions.
To replicate the dry and wet conditions of a vehicle’s glass surface, a water spraying mechanism was designed with an adjustable water quantity, as depicted in Figure 8. This mechanism consists of several components: 1—connecting plate; 2—spraying support; 3—nozzle; 4—water outlet hole; 5—mounting hole; 6—straight notch. As the wiper blade moves, it divides the glass into two left and right areas. To ensure that both areas receive water simultaneously, the water spraying mechanism was symmetrically designed. Water spray supports were installed and securely fixed at both ends of the connecting plate. These T-shaped supports undergo internal hollowing to facilitate the introduction of water through the upper water inlet. At the lower end of the support, three 1/8 RC tapered pipe thread holes were designed. The number and arrangement of the nozzles were determined according to specific spraying requirements and needed to ensure the uniformity of the water film on the glass surface. Through the use of a pump, the nozzle is able to atomize water into small water beads, forming a conical water mist that is uniformly sprayed onto the glass. After conducting various experimental tests on different nozzles, a 0.8 mm cone nozzle made of 304 stainless steel was chosen as the optimal option. The upper end of the water spray support was designed with a straight notch, and three mounting holes are present on each side of the connecting plate. By securing the two mounting holes, the spraying support can be adjusted along the Z axis to control the area of water mist sprayed onto the glass. Prior to initiating the water spraying mechanism, water is stored in a platform storage tank. A diaphragm pump is then used to transport the water to the upper ends of the two spray supports. Once sprayed by the nozzle, the water is subsequently scraped back into the tank by a scraper. This design establishes a water circulation system that effectively minimizes costs and conserves resources.
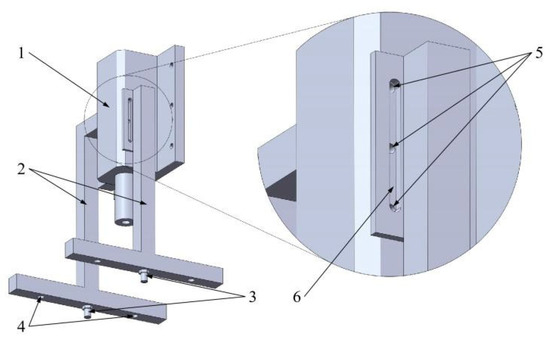
Figure 8.
Physical diagram of water spraying mechanism structure.
According to the amount of precipitation, different amounts of water are used. Table 2 is a classification table of precipitation intensity [32], where precipitation P is the precipitation depth of one day (24 h). The formula for calculating the water spraying quantity Q of the wiper test bench is
where S is the glass area used by the wiper test bench. According to the maximum precipitation intensity (heavy downpour), the water spray volume was calculated to be 58,000 mm3/min. According to the maximum spray volume, range of adjustable water volume, pumping pressure, and output power, a micro-high-pressure diaphragm pump was selected for the water supply. The output flow of the diaphragm pump changes with the change in the power supply current, so the pump is controlled, and the speed is adjusted by matching the DC driver. The technical parameters of the diaphragm pump are a voltage of 24 V, a maximum current of 4.0 A, a maximum flow of 5.3 L/min, a speed of 12,000 r/min, a maximum pressure of 1.0 MPa, a suction range of 5 m, and an input power of 40 W.
Table 2.
Grading table of precipitation intensity.
3.2. The Design of the Drive Control System Based on the PLC
The drive control system is crucial for ensuring the normal operation and functioning of the wiper test bench. By setting the parameters of the drive control system, the operating position, direction, and state of the drive wiper can meet the user’s requirements. The main controller of the drive control system is the PLC, which facilitates communication with the upper computer, sends instructions to the servo drive, and monitors the operation of the servo motor [33]. Depending on the control type and signal requirements, the drive control system adopts the control mode of pulse and direction input for the servo driver and Modbus communication for the DC driver. The PLC can store all the data in its register, which can be automatically read and written through the human–computer interaction interface of the upper computer [34].
3.2.1. Drive Control System Design
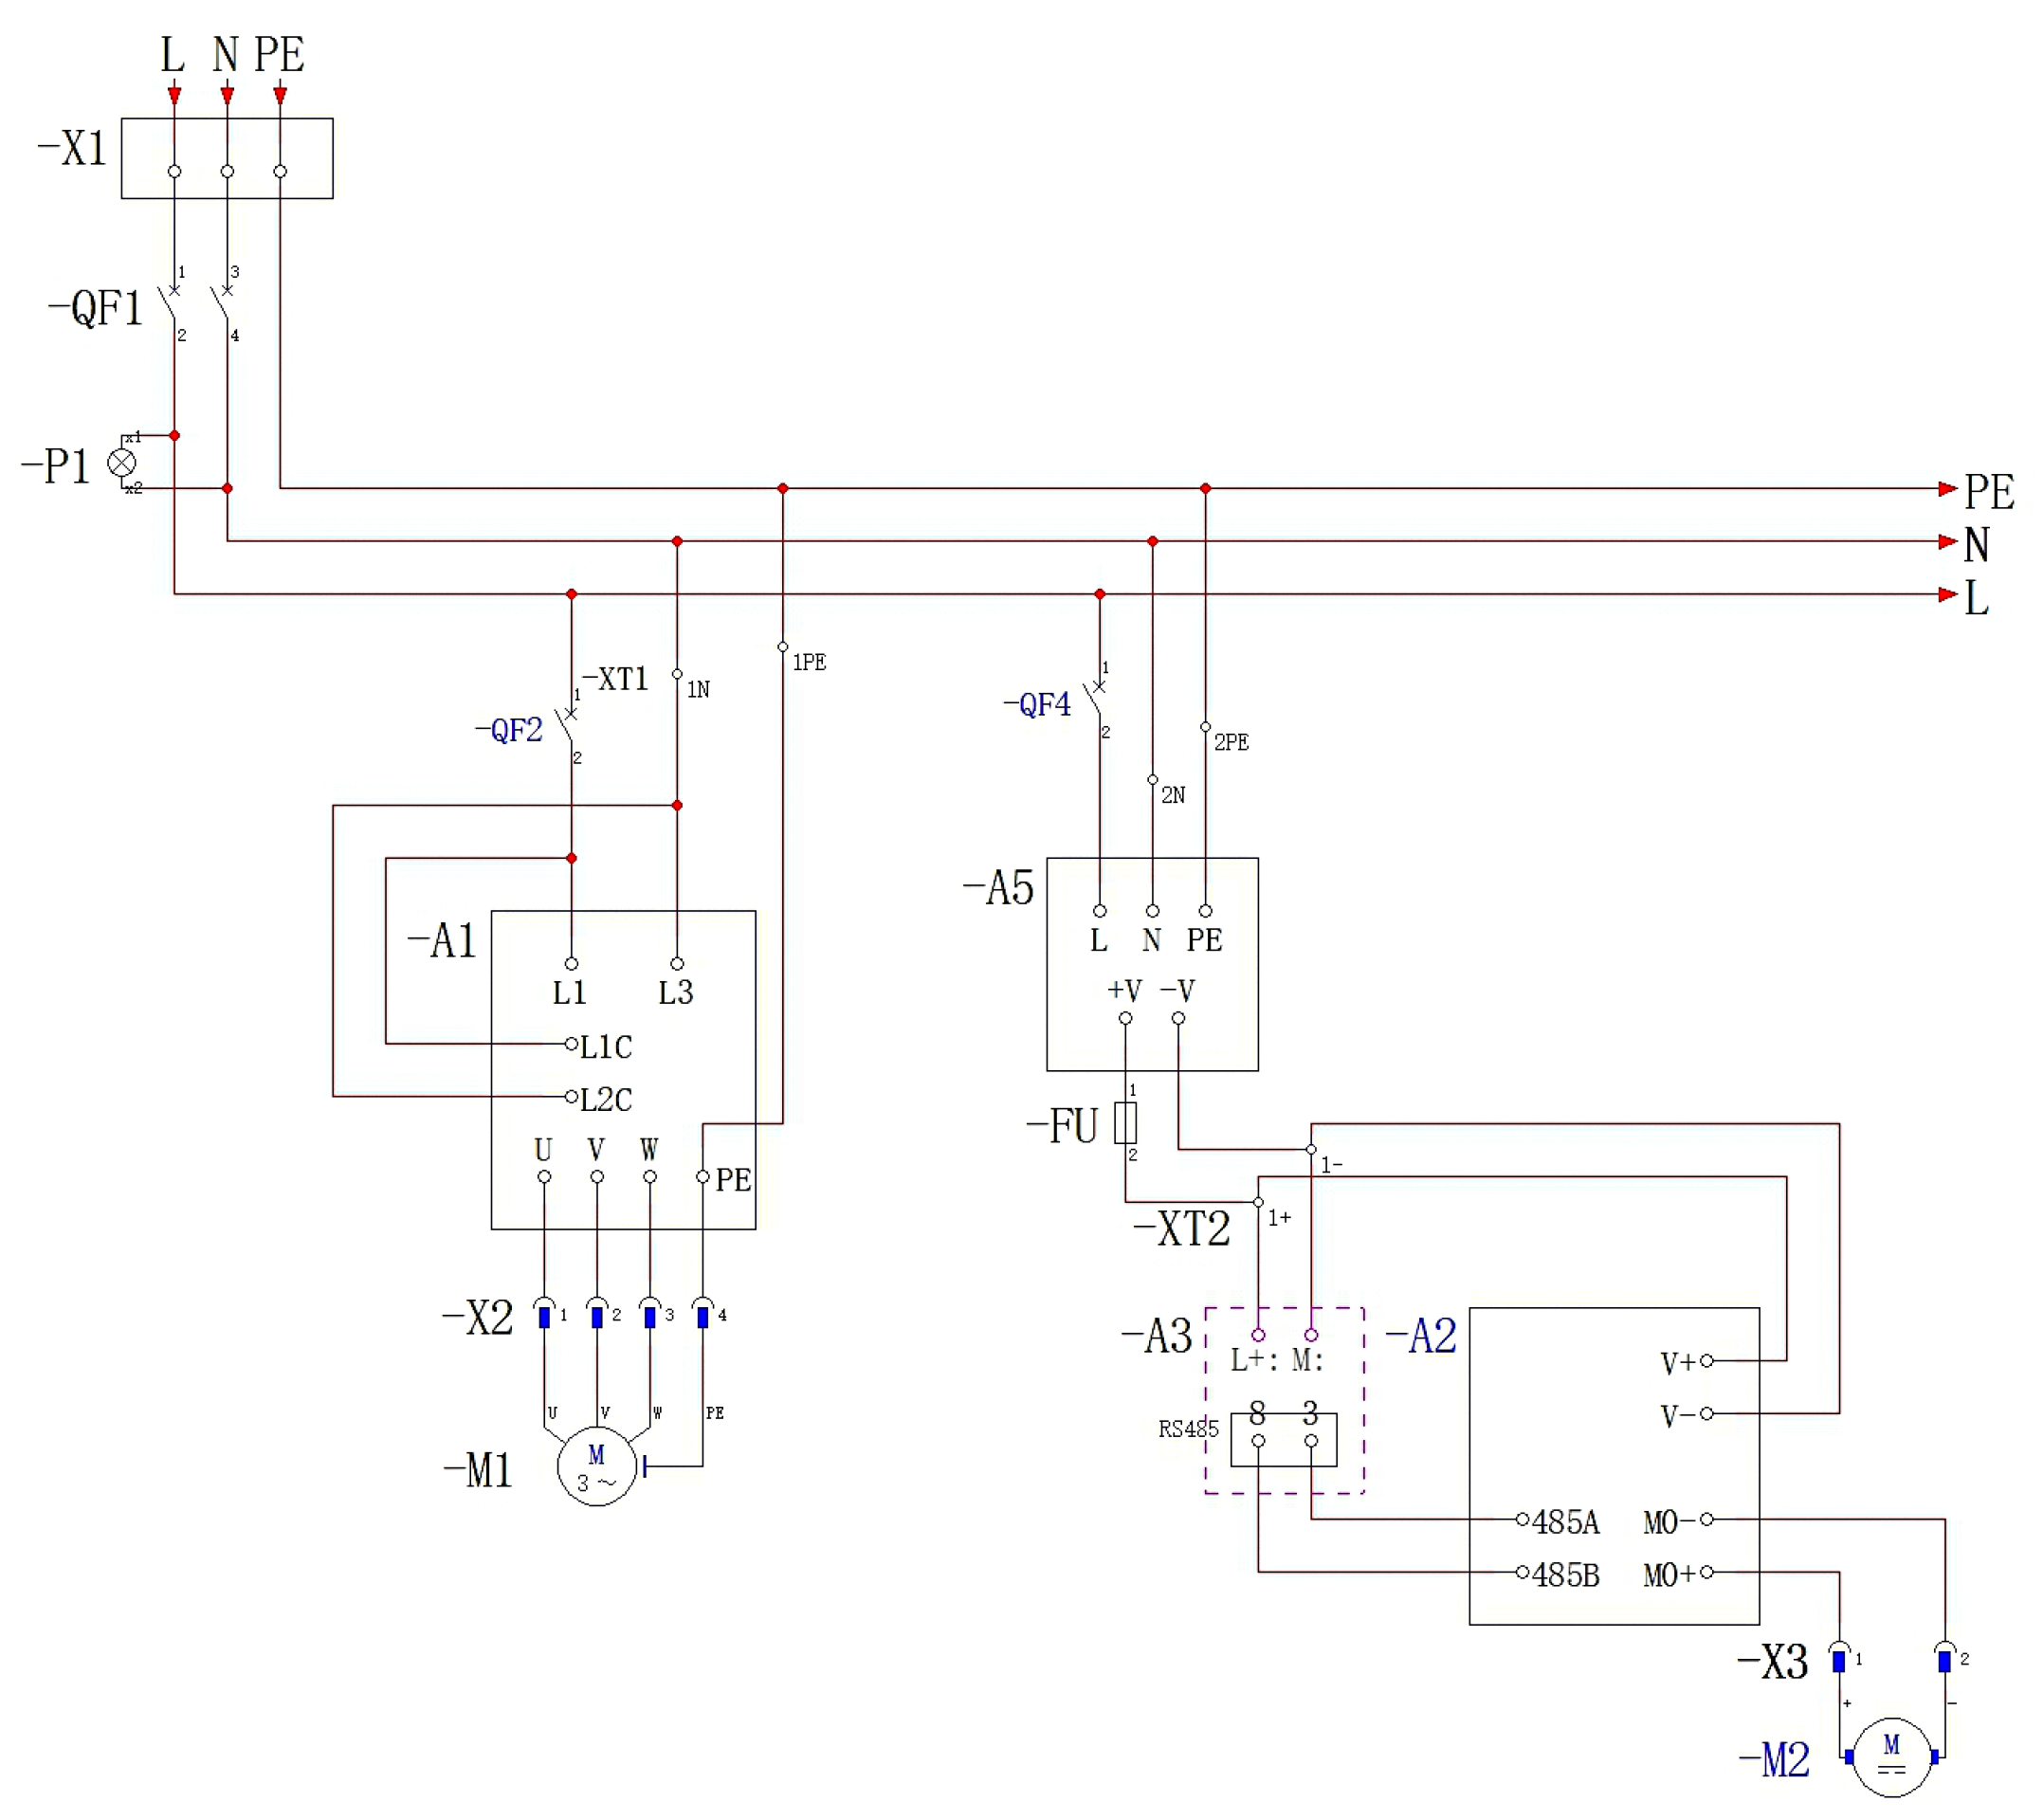
The design principle of the drive system is depicted in Figure 9, with only the X-axis servo motors shown because the wiring principle is similar for both the X-axis and Z-axis servo motors. The power supply mode is a 220 V three-phase voltage. Initially, the noise filter X1 is selected to effectively filter out additional noise, and the total power supply is controlled by the circuit breaker QF1 to switch on and off. Once the power is switched on, the power indicator P1 is activated. Second, terminal block XT1 is used for the circuit shunt, while servo drivers A1 and 24 V power supply A5 implement circuit on–off and protection through circuit breakers QF2 and QF4, respectively. The 24 V power supply is responsible for supplying power to the DC driver (A2), PLC (A3), and other low-power electrical equipment, while the fuse FU is employed to prevent current short circuits. Finally, the servo motor and the DC motor are connected via the aviation plug on the rear panel of the control cabinet.
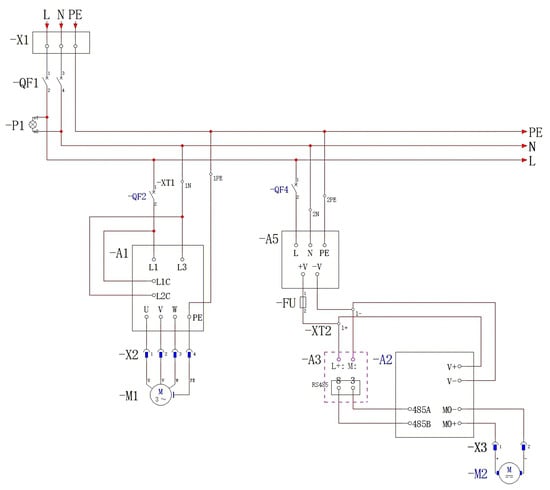
Figure 9.
Design schematic diagram of drive system.
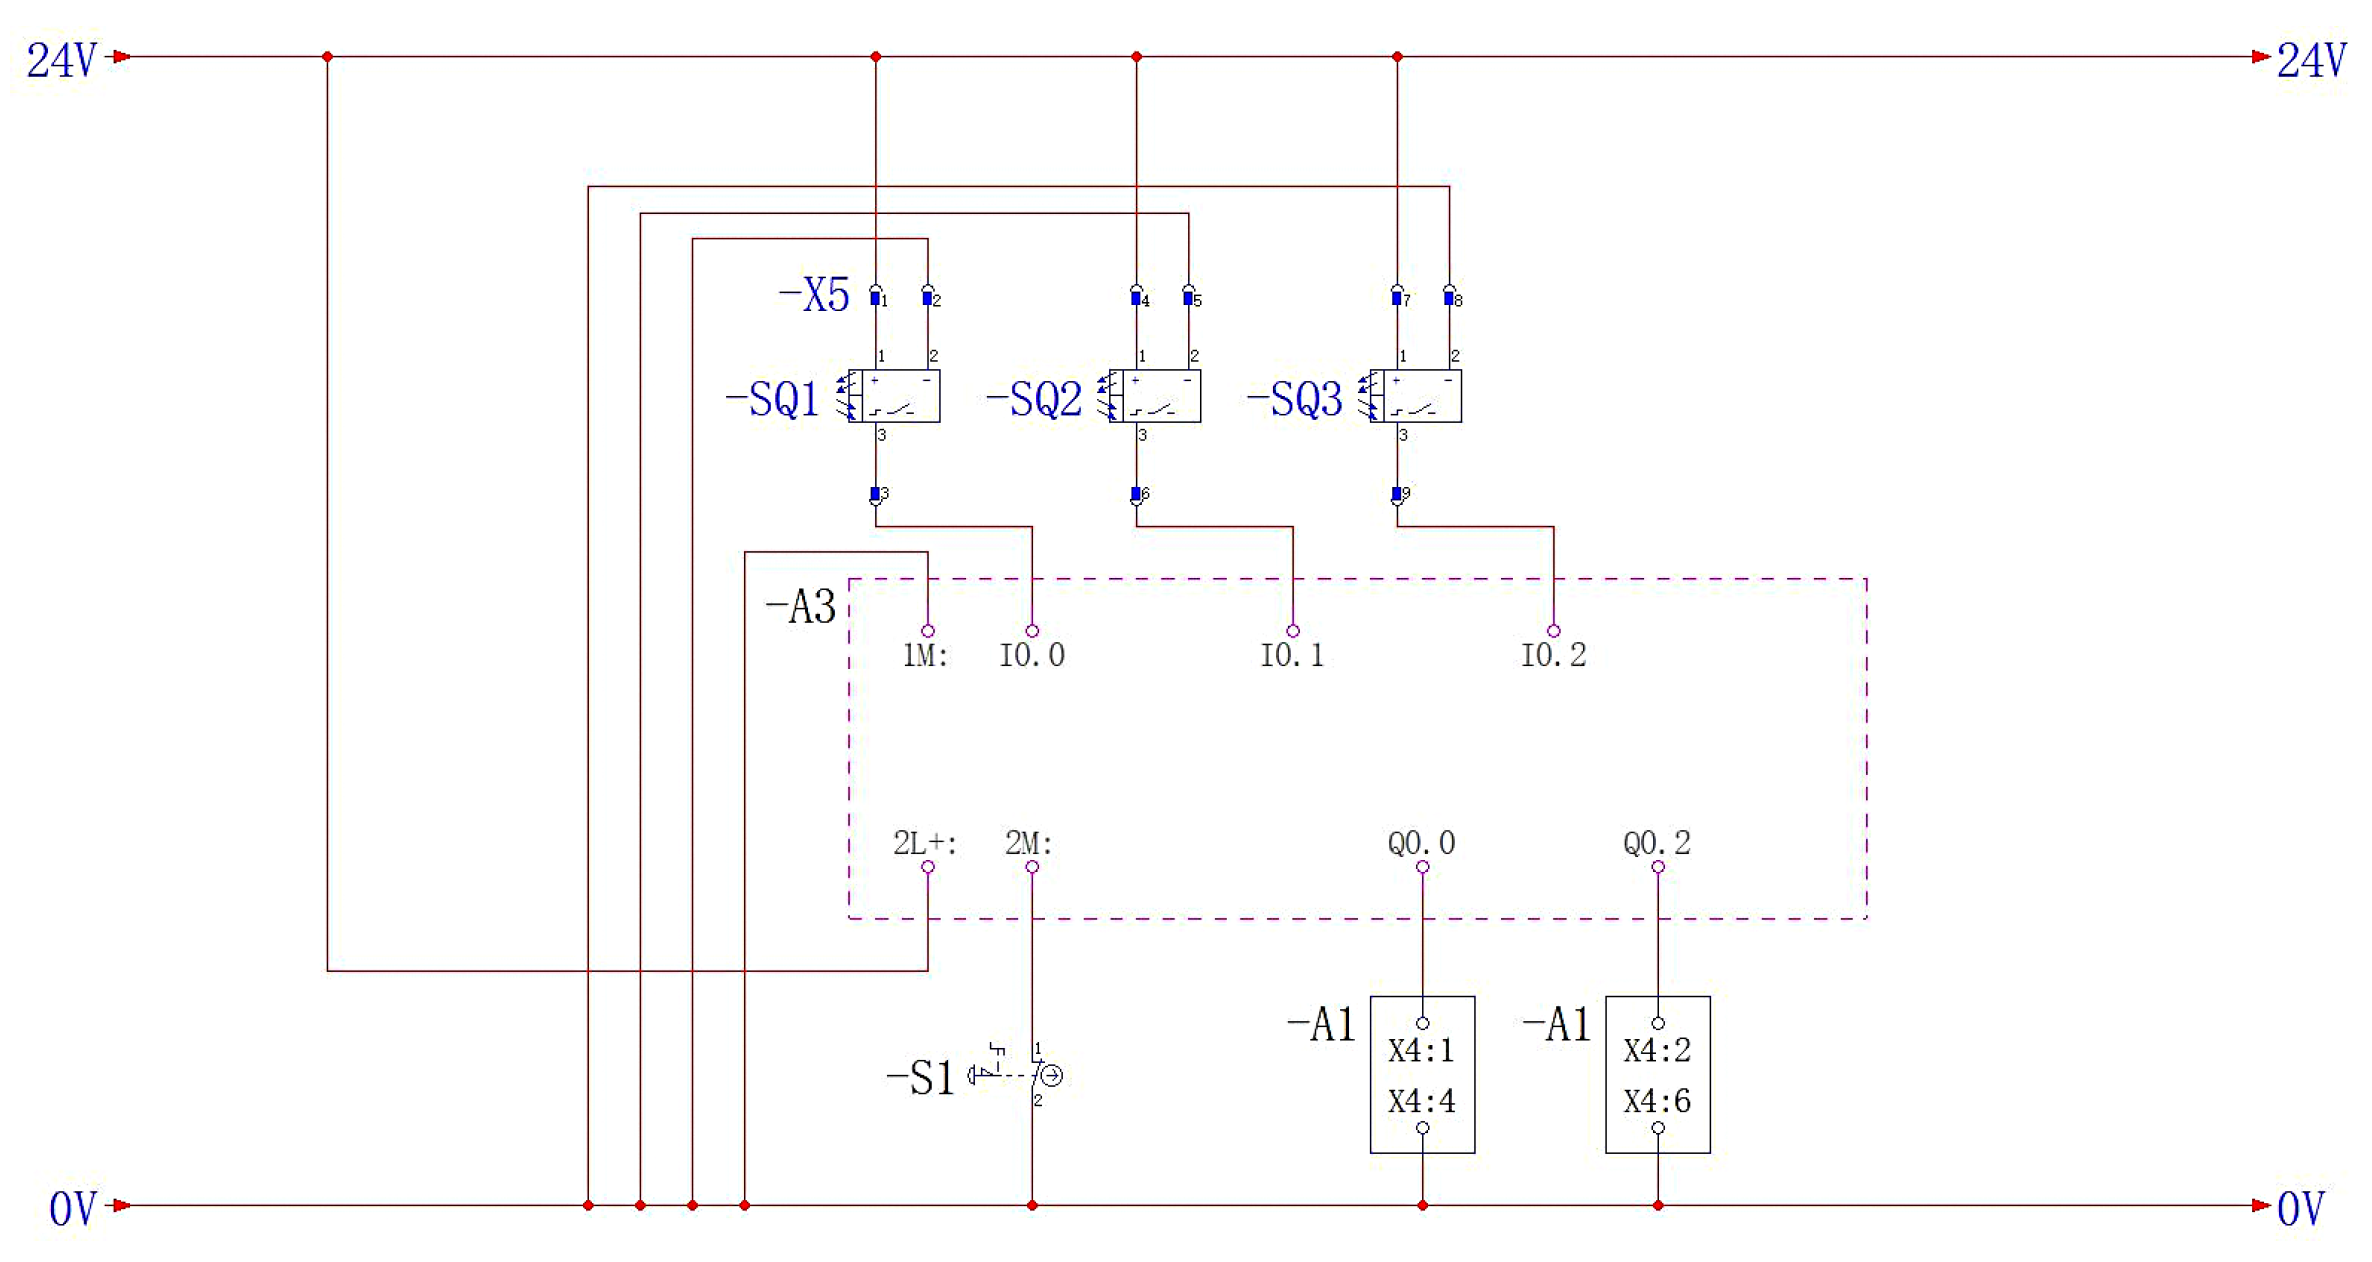
The main electronic and electrical component of the control system is the PLC, which controls parameters such as the speed, stroke, and water spray of the wiper blade and monitors the operating position, direction, and speed of the motor. There are three input switch quantities and three output pulse quantities that need to be controlled. The output pulse quantity is input into the servo drive, including the servo enable, command pulse, and command directions. The servo enable input is directly connected with a 24 V supply voltage. To meet these requirements, the Siemens AG Model S7-200SMART CPU ST20 [35] (Munich, Germany) was selected. This model is a transistor source PLC with twelve inputs and eight outputs for onboard digital I/O channels, along with an RS485 serial port for communication. Figure 10 illustrates the design principle of the control system.
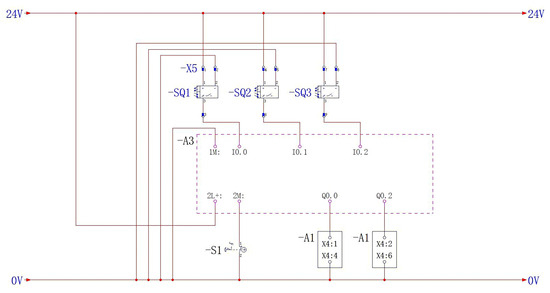
Figure 10.
Design schematic diagram of control system.
Three limit switches, denoted as SQ1, SQ2, and SQ3 in Figure 10, are mounted on the upper ends of the X-axis electric screw module. These switches are connected to the I0.0, I0.1, and I0.2 inputs. The I0.0 and I0.1 inputs serve as the maximum limits for the negative and positive travel of the screw module, preventing the servo motor from exceeding the left and right travel ranges. The I0.2 input acts as the screw module reference point switching input and is used to establish the reference point or origin position. Based on the position control mode of the servo drive, pins 1, 4, 2, and 6 were selected for accessing the servo drive via pulse and direction input. The emergency stop switch is connected to the 2 M output end of the PLC, allowing the pulse input to the servo drive to be cut off promptly in case of an emergency. The control system operates on a 24 V power supply, forming a closed loop.
3.2.2. Servomotor Parameter Calculation
The servo motor is utilized to drive the coupling, enabling the high-speed rotation of the screw to facilitate different operating modes for the experimental conditions. The first step was to determine the screw parameters. Following this, the inertia ratio was determined based on the inertia of the servo motor load part and the preselected motor. Finally, the model of the servo motor was determined by comparing the maximum torque and aging torque during operation with the instantaneous maximum torque and rated torque of the servo motor. The X-axis electric screw module was initially selected as a servo motor. Its specifications include a lead of 40 mm, maximum speed of 2000 mm/s, rated thrust of 16 N, maximum horizontal handling mass of 18 kg, repeated positioning accuracy of ±0.01 mm, screw diameter of 20 mm, screw grade of C5, and standard effective stroke of 1000 mm. The inertia ratio is calculated using the following formula:
In the formula, JL is the inertia of the load part (the sum of the inertia of the coupling JC and the part of the workpiece JB), JM is the rotor inertia of the preselected motor, ρ is the screw density, BD is the screw diameter, BL is the screw length mm, BP is the driving distance of the screw rotation one turn, and WA is the mass of the load part. The larger the multiple of the inertia ratio, the stronger the servo motor impact. By calculating the inertia ratio of 28.4 and comparing it with the recommended inertia ratio, the servo motor inertia ratio was controlled within 30. The torque Tf generated at constant speed, Ta generated at acceleration, and Td generated at deceleration during operation are calculated as follows:
where μ is the friction coefficient of the screw during operation, Bη is the working efficiency of the screw, n is the rated speed of the servo motor, ta is the acceleration time, and td is the deceleration time. According to the calculations, Tf is 0.01 N∙m, Ta is 2.50 N∙m, and Td is 2.48 N∙m. As a result, the maximum torque produced by the screw during operation Tmax is 2.50 N∙m, which is less than the instantaneous maximum torque of the preselected motor of 3.82 N∙m. The aging torque Trms in operation is calculated as follows:
where tb is the constant speed time and tc is the time taken to cycle a cycle. The calculated Trms is 1.11 N∙m. Therefore, the aging torque generated during screw operation is less than the rated torque of the preselected motor of 1.27 N∙m. According to the calculations and the parameters of the preselected motor, the Model MSMF042L1U2M servo motor from Panasonic Corporation (Osaka, Japan) was selected to support the low-inertia position control driver MBDLN25SE. The rated power of the servo motor is 400 W, the rated torque is 1.7 N∙m, the instantaneous maximum torque is 3.82 N∙m, the rated speed is 3000 r/min, the maximum speed is 6000 r/min, and the rotor inertia is 0.27 × 10⁻⁴ kg·m2.
4. Software Design of Wiper–Windshield Experimental System
The software used for the wiper–windshield experiment system is divided into a PLC program (lower computer) and a human–computer interaction interface (upper computer). The human–computer interaction interface includes a login interface, parameter initialization interface, experiment test interface, and data analysis interface. The software system needed to be designed to be versatile, practical, user friendly, and secure [36].
4.1. PLC Program Design
The program design is based on the programming software STEP7-MicroWIN SMART V2.5 of the Siemens S7-200 SMART PLC, which enables the control and monitoring of the hardware equipment in the wiper–windshield experiment system. It also establishes communication with the upper computer interface to facilitate data reading and writing. Additionally, the design allows for easy system diagnosis and maintenance, saving time for debugging and maintenance.
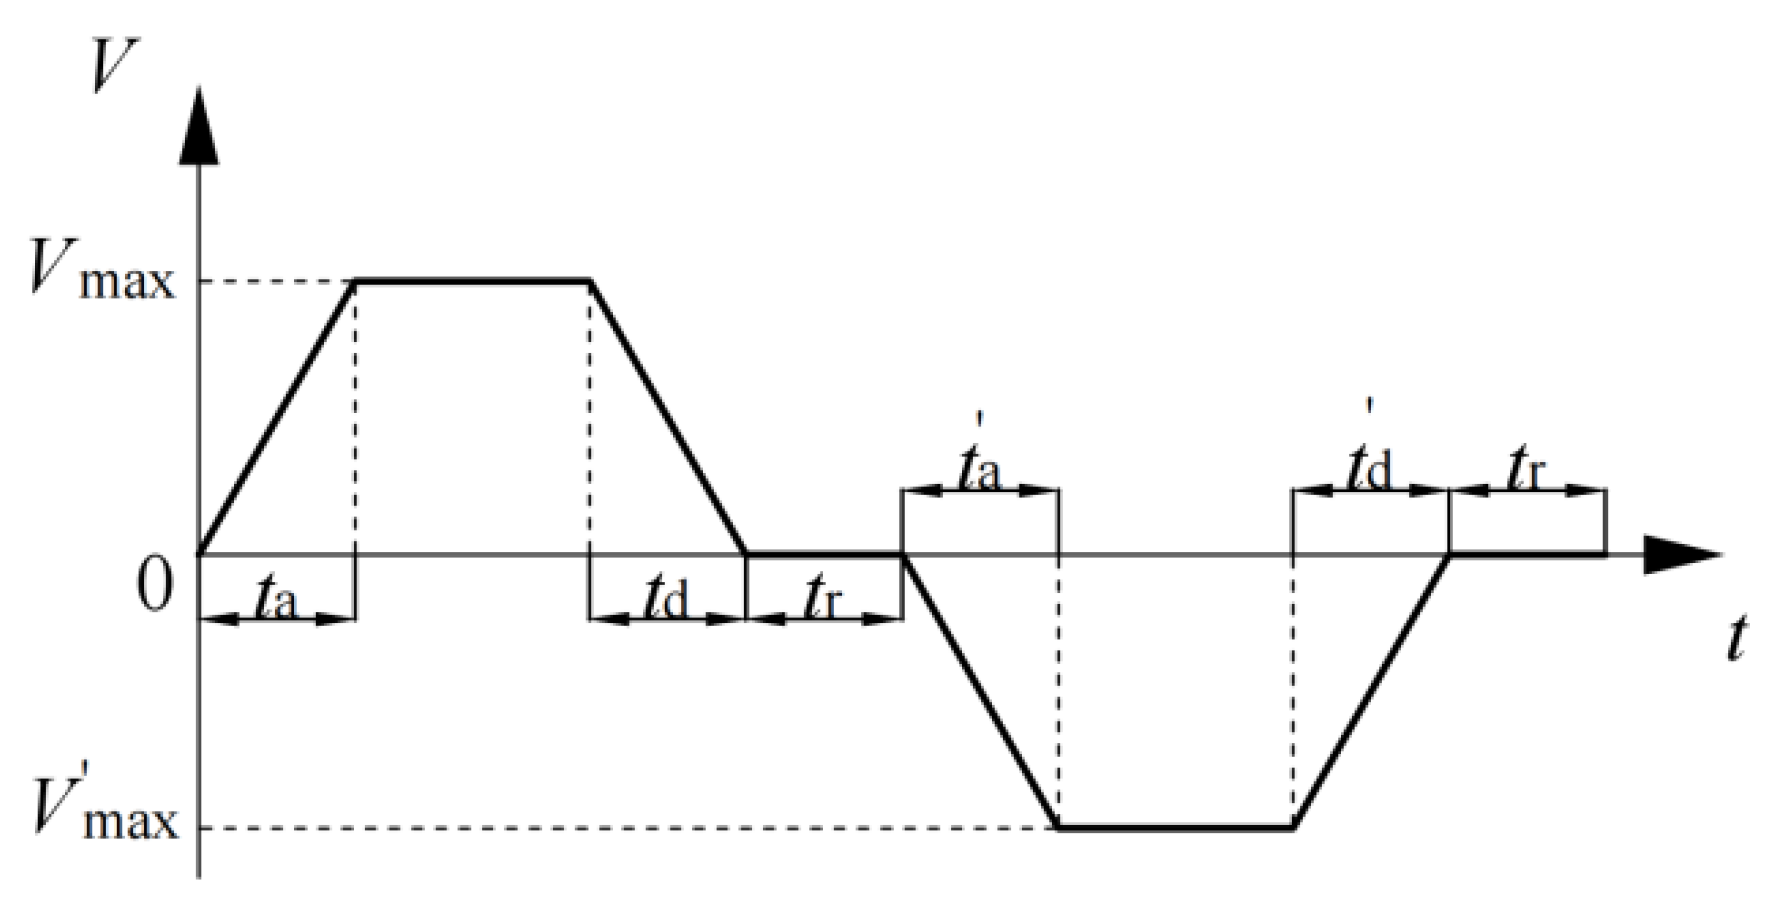
The parameters to be set are listed based on the time–speed curve of the wiper movement cycle, as depicted in Figure 11. The operation steps of the wiper during movement include acceleration, uniform motion, forward deceleration, reversal, reverse acceleration, uniform motion, and reverse deceleration.
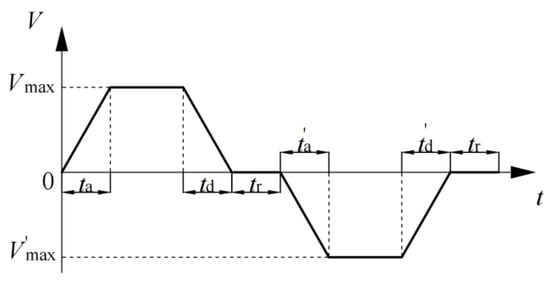
Figure 11.
Wiper movement cycle time–velocity curve.
Here, Vmax is the forward maximum speed, V′max is the reverse maximum speed, ta is the forward acceleration time, td is the forward deceleration time, tr is the reverse acceleration time, t′d is the reverse acceleration time, and t′d is the reverse deceleration time. Thus, the necessary parameters to be set include the running speed and line distance, acceleration and deceleration time, and reversal time. The motion control wizard of the programming software is utilized to determine the parameters of axis 0, using the X-axis servo motor as an example. The wizard includes the measurement system, direction control, input switching quantity, motor speed, JOG mode, motor acceleration and deceleration time, reference point search, and other relevant parameters. The basic unit of measurement is set as mm. The lead of the screw BP is calculated using Formula (2), and one rotation of the motor corresponds to a displacement of 40 mm generated by the wiper blade. By applying Formula (10), the number of pulses P required for servo motor rotation is determined.
In the formula, P is the number of pulses required by the motor to rotate one circle, Pmax is the maximum number of pulses that the PLC can send out per second, and n is the rated speed of the servo motor. The number of pulses required for one revolution of the motor is 2000.
The program based on the PLC comprises the main program, pump control program, and axis 0 control program. The main program signifies the beginning of program execution and incorporates functions such as establishing communication with the upper computer and calling subroutines. The MBUS_SERVER command is employed in the main program to receive the connection request from the Modbus TCP client, accept the Modbus function requests, send response messages, and directly invoke the pump and axis 0 subroutines.
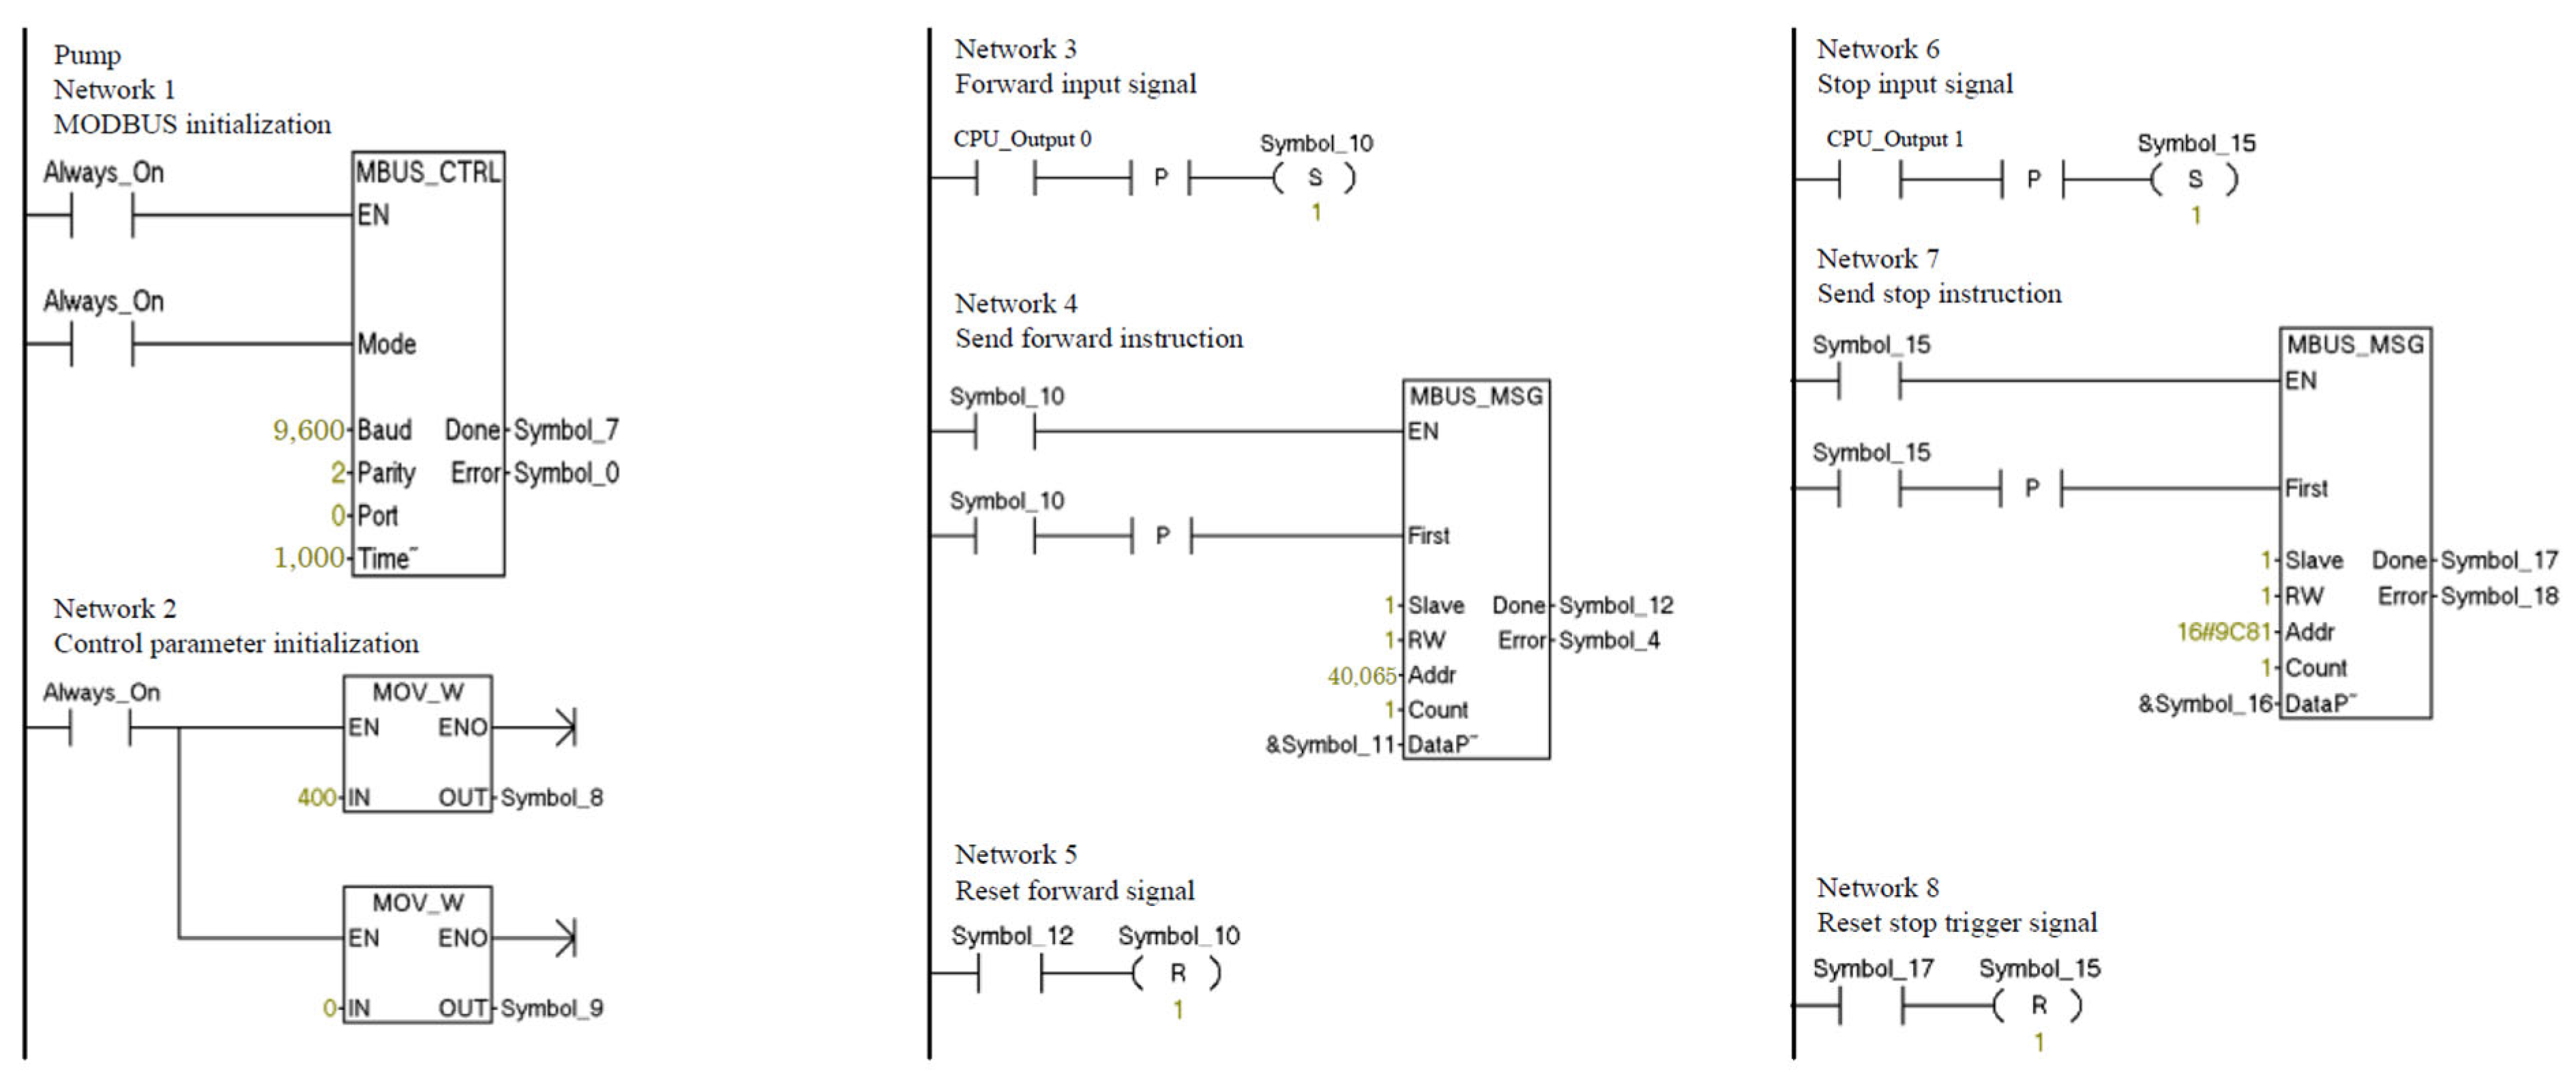
The pump control program regulates the pump’s startup, shutdown, and spray volume, as depicted in Figure 12. Initially, the PLC is connected to the DC driver via RS485 cables, and Modbus initialization settings are implemented. Next, parameter initialization occurs, and the pump’s speed is assigned during forward rotation and stoppage using the word transfer command. The assigned value is stored in the V storage area. Finally, instructions for forward rotation and stopping are provided, and they are triggered by BOOL contact.
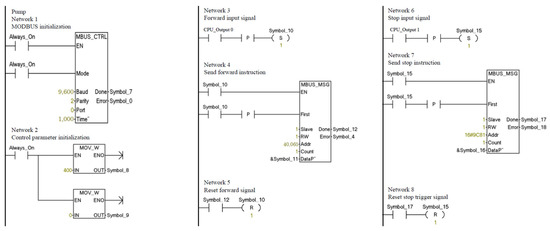
Figure 12.
Physical diagram of PLC pump control program.
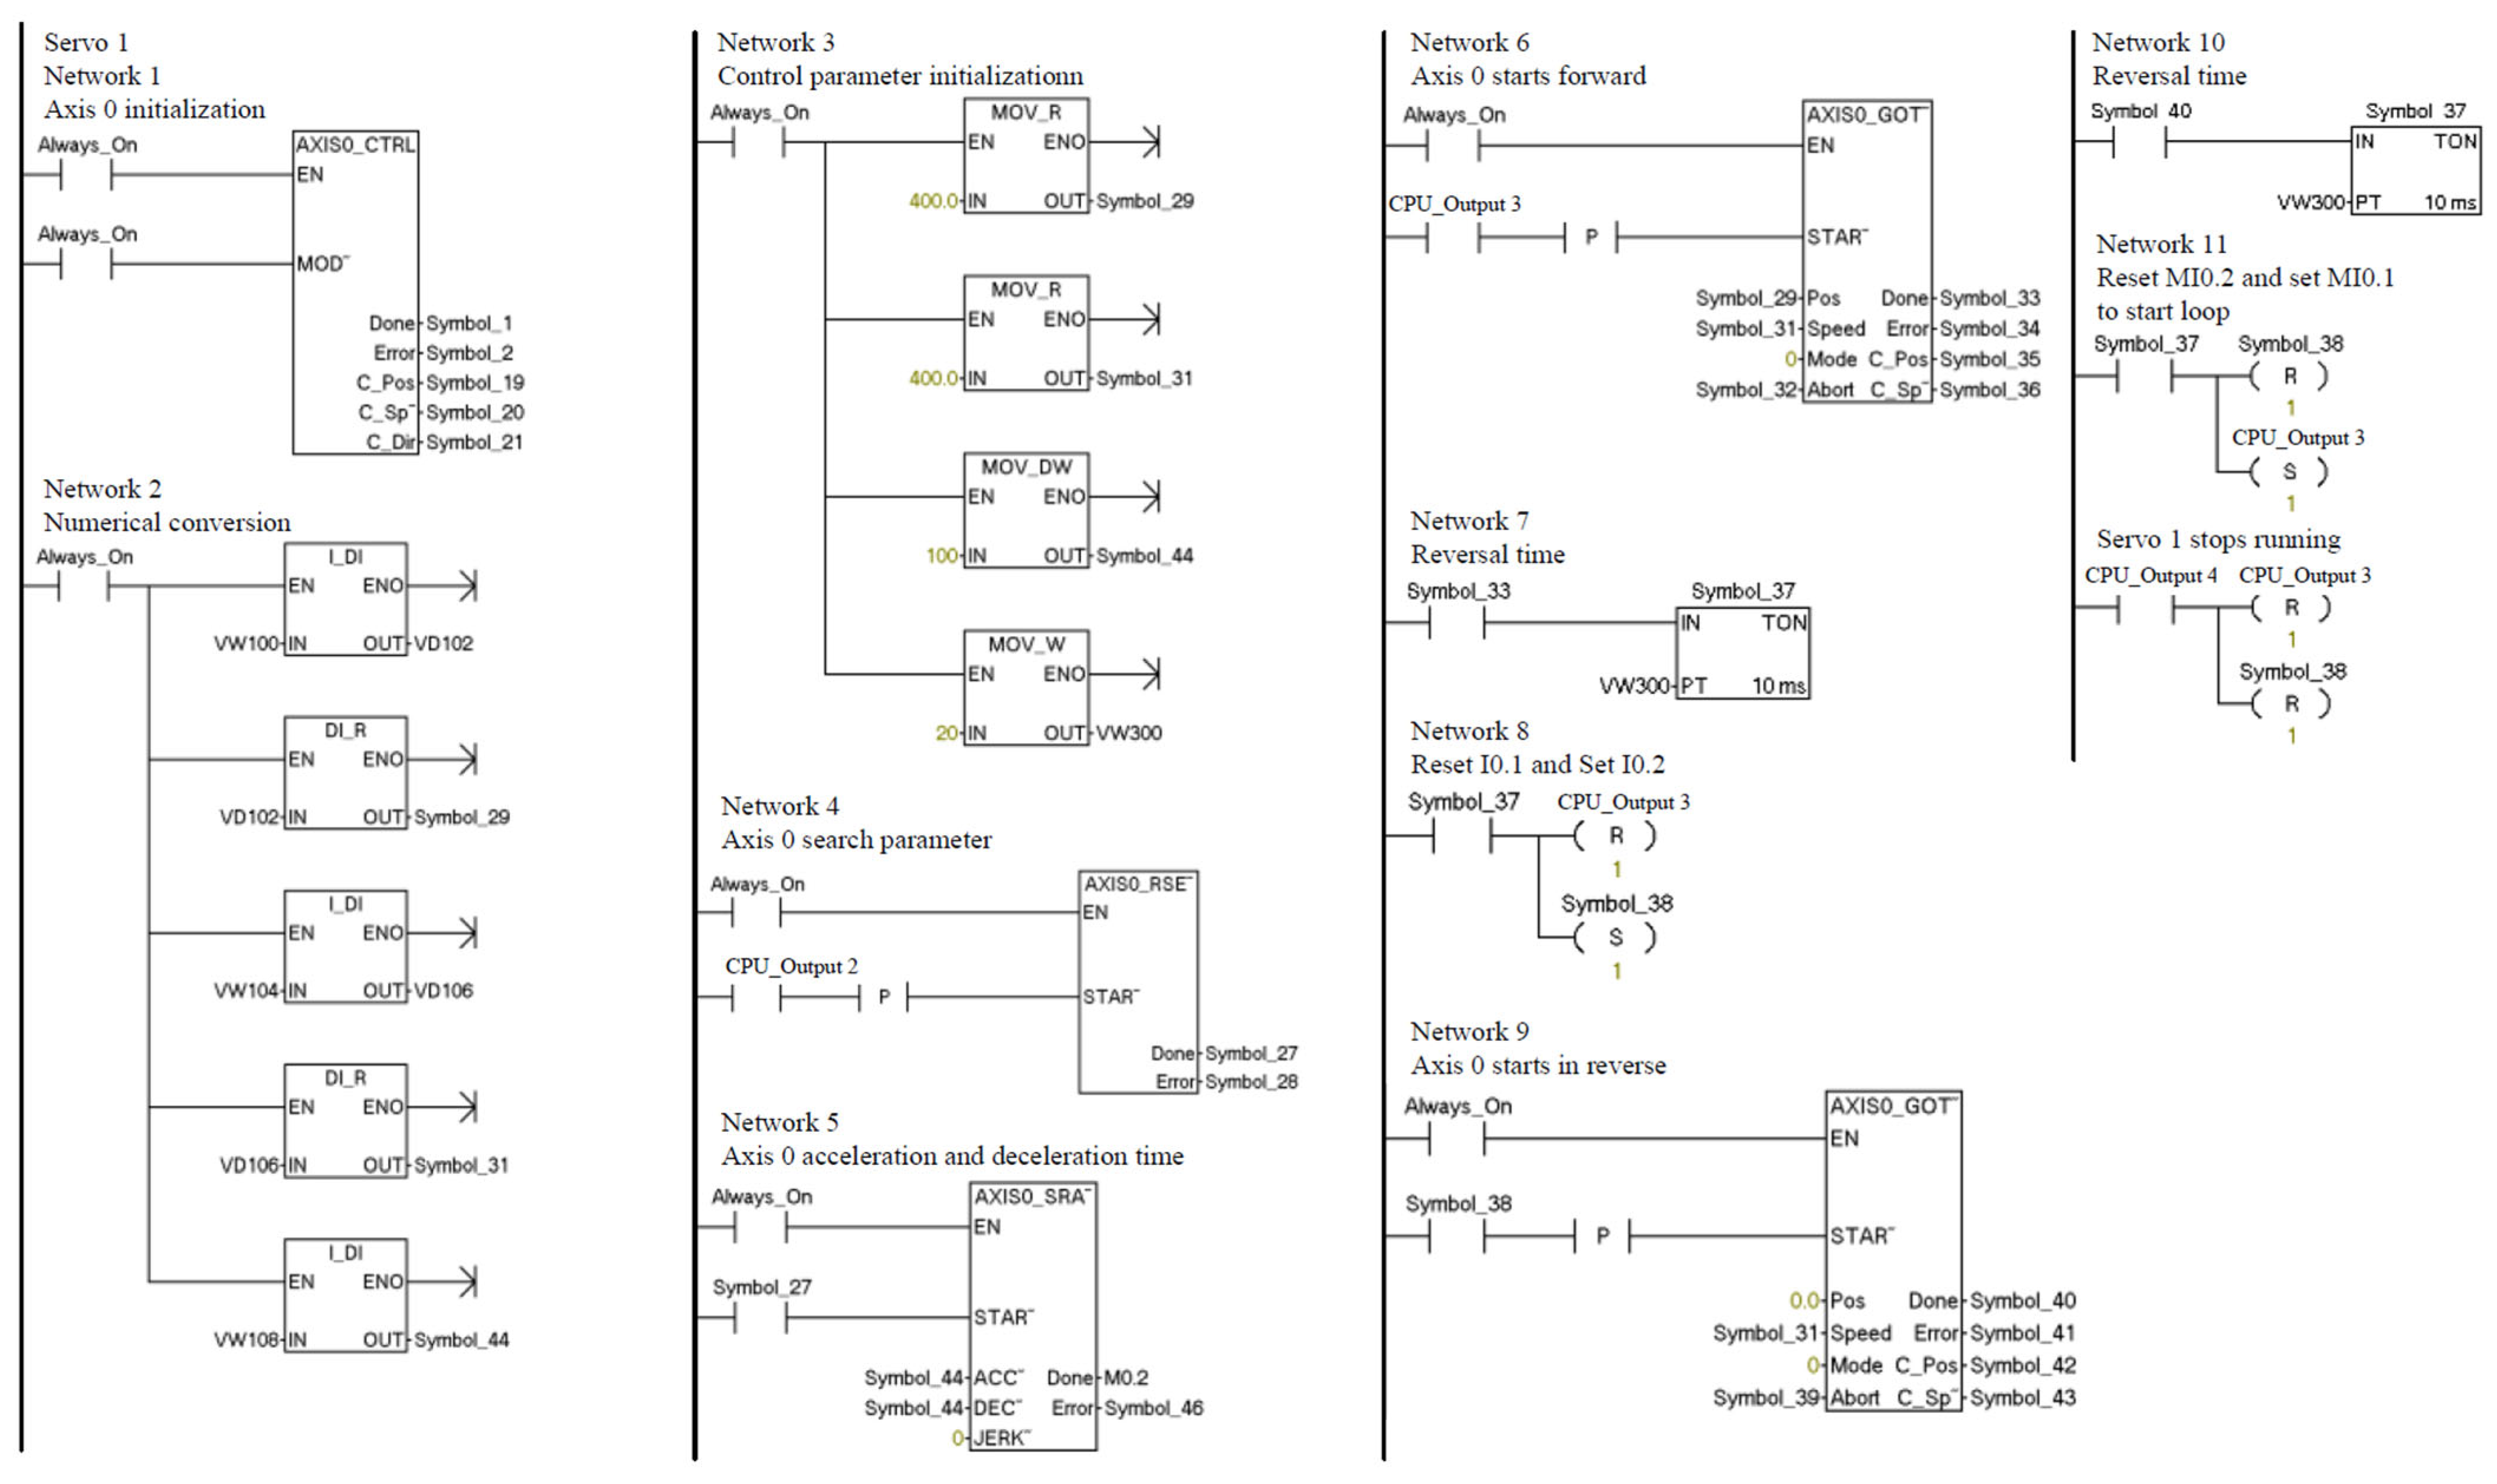
The axis 0 control program configures the servo motor’s parameters and controls its startup and shutdown. The motion control subroutines required to control the servo motor parameters include axis 0 initialization (AXIS0_CTRL), axis 0 reference point search (AXIS0_RSEEK), axis 0 acceleration and deceleration time setting (AXIS0_SRATE), and axis 0 forward (and backward) movement (AXIS0_GOTO).
The program diagram in Figure 13 illustrates the control part of axis 0 in the PLC. First, the parameters of axis 0 are written using standard conversion instructions to convert the input value to the designated format. The converted value is then transferred to the VD memory using the MOV instructions to store parameters such as displacement, speed, acceleration, and deceleration time. Second, the reverse time of the wiper is achieved by setting a timer. The timer instructions are set to a precision of 10 ms, meaning that the reverse time is set to 10 times the count value. The count value is input and transmitted to the VW memory. Finally, the cyclic motion mode of the wiper is enabled through the reset and set of the coil.
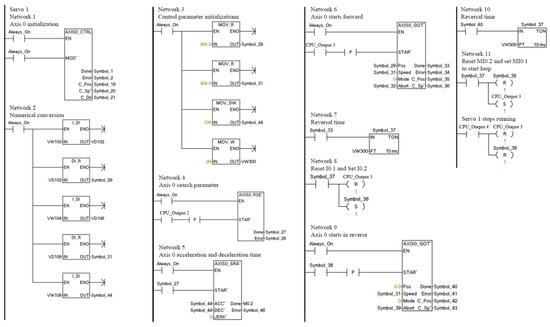
Figure 13.
A physical diagram of the axis 0 control program of the PLC.
4.2. Human–Computer Interaction Interface Design
The user operating software for the wiper–windshield experiment system was developed using LabVIEW 2021. LabVIEW [37] is a graphical program compilation platform created by NI, also known as the G language. Unlike traditional programming languages, LabVIEW utilizes a graphical program flow based on the concept of “data flow”, allowing programming to be performed concurrently with the design of the flowchart. LabVIEW is widely applied in fields such as measurement and testing, image processing, computer simulation, and industrial control [38,39,40]. Additionally, the LabVIEW library provides functions such as signal interception analysis, numerical logic operation, noise and vibration analysis, and data storage. The features of LabVIEW include simple and easily understandable data flow programming, high development efficiency, and convenient software maintenance.
4.2.1. Login and Initialization Interface
The login interface enables users to input their accounts and passwords to protect the data. Upon successful login, the system automatically transitions to the main interface of the human–computer interaction system and closes the login interface.
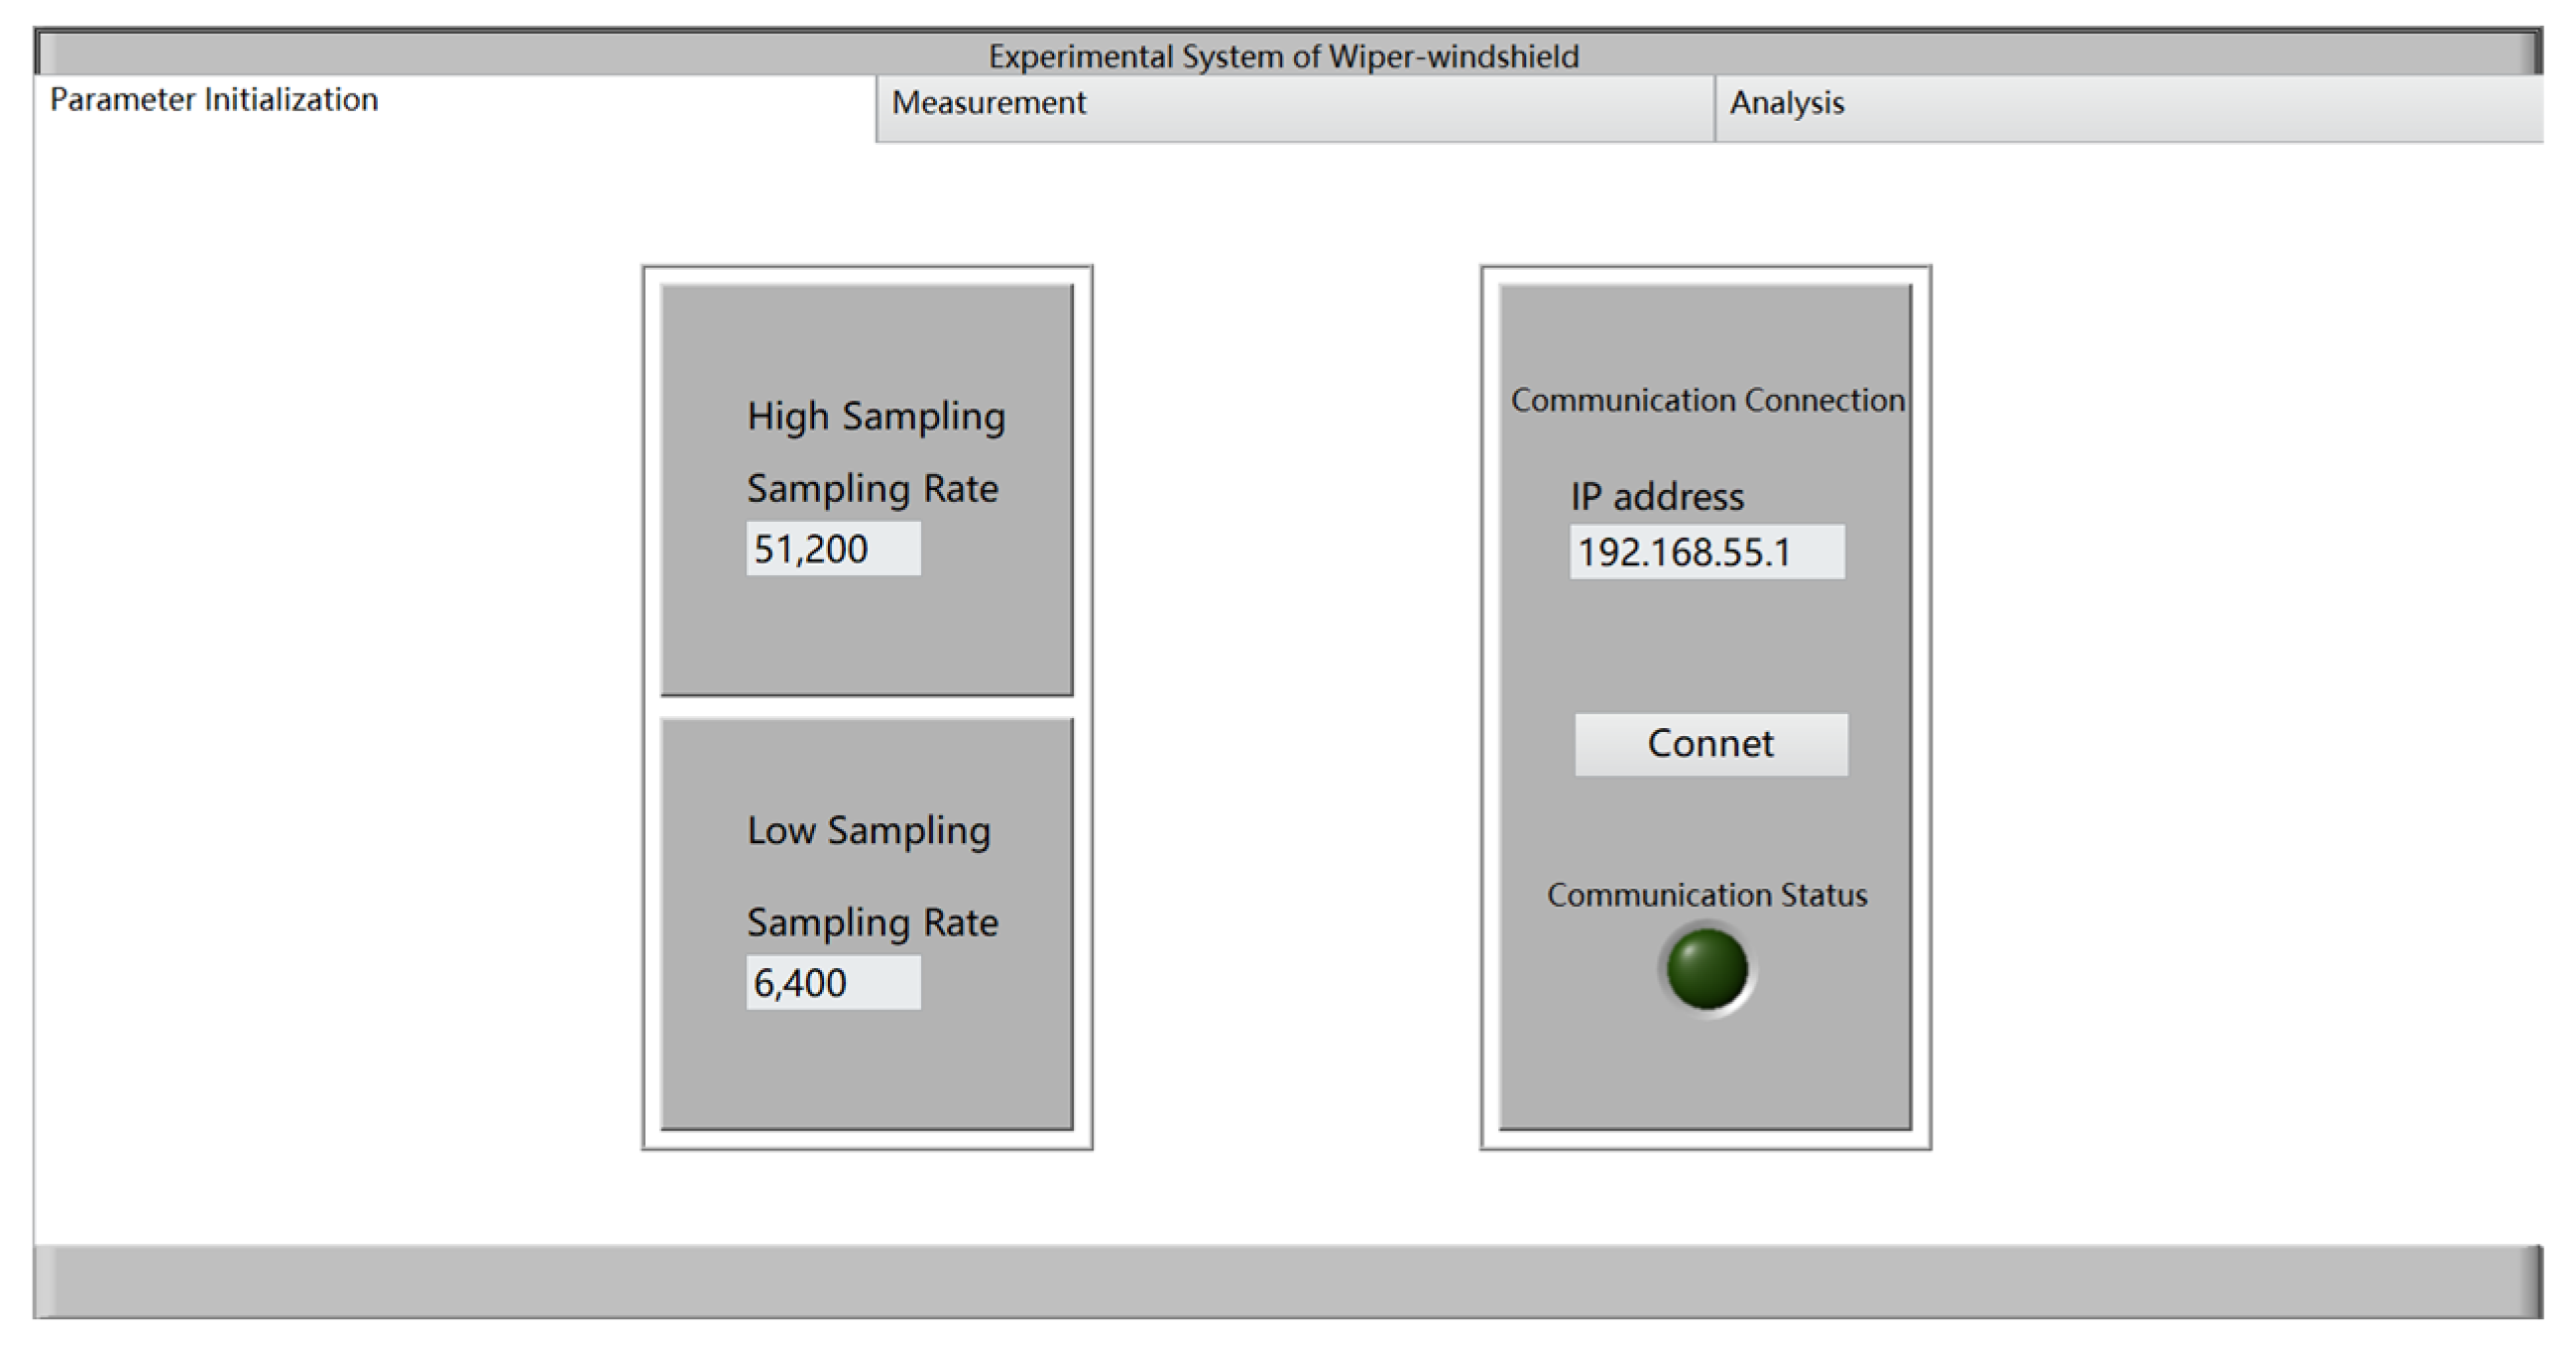
According to the design of the experimental system, the proper initialization of system parameters is crucial for ensuring the smooth operation of the experimental test function. This initialization process, as depicted in Figure 14, involves setting the initial parameters of the data acquisition card and PLC, which includes configuring the high and low sampling rates as well as the IP address. The connected data acquisition card is located in the device and interface of the NI MAX remote system. It is then operated using the LabVIEW NI driver NI-DAQmax, with the VI-DAQ assistant being utilized to set the desired sampling rate. The sampling rate, expressed as the number of samples per second per channel, varies based on the specific type of signal being measured in the experimental system. For dynamic pressure, friction, vibration, and noise signals, a high sampling rate is needed. Conversely, the pressure distribution signal obtained from the thin-film pressure sensor necessitates a low sampling rate.
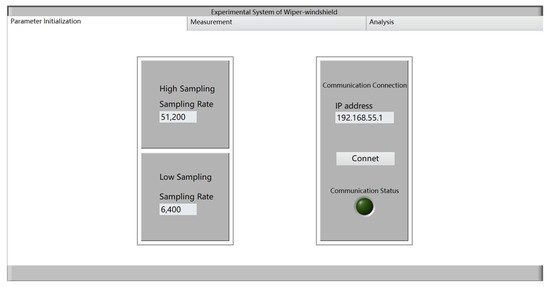
Figure 14.
Parameter initialization interface.
The communication connection facilitates the transfer, writing, and reading of data between the upper computer’s human–computer interaction interface and the lower computer. For communication purposes, the Plasmionique Modbus Master component is employed, utilizing the Modbus TCP communication protocol. The IP address corresponds to the fixed Ethernet port address of the PLC.
4.2.2. Experimental Test Interface
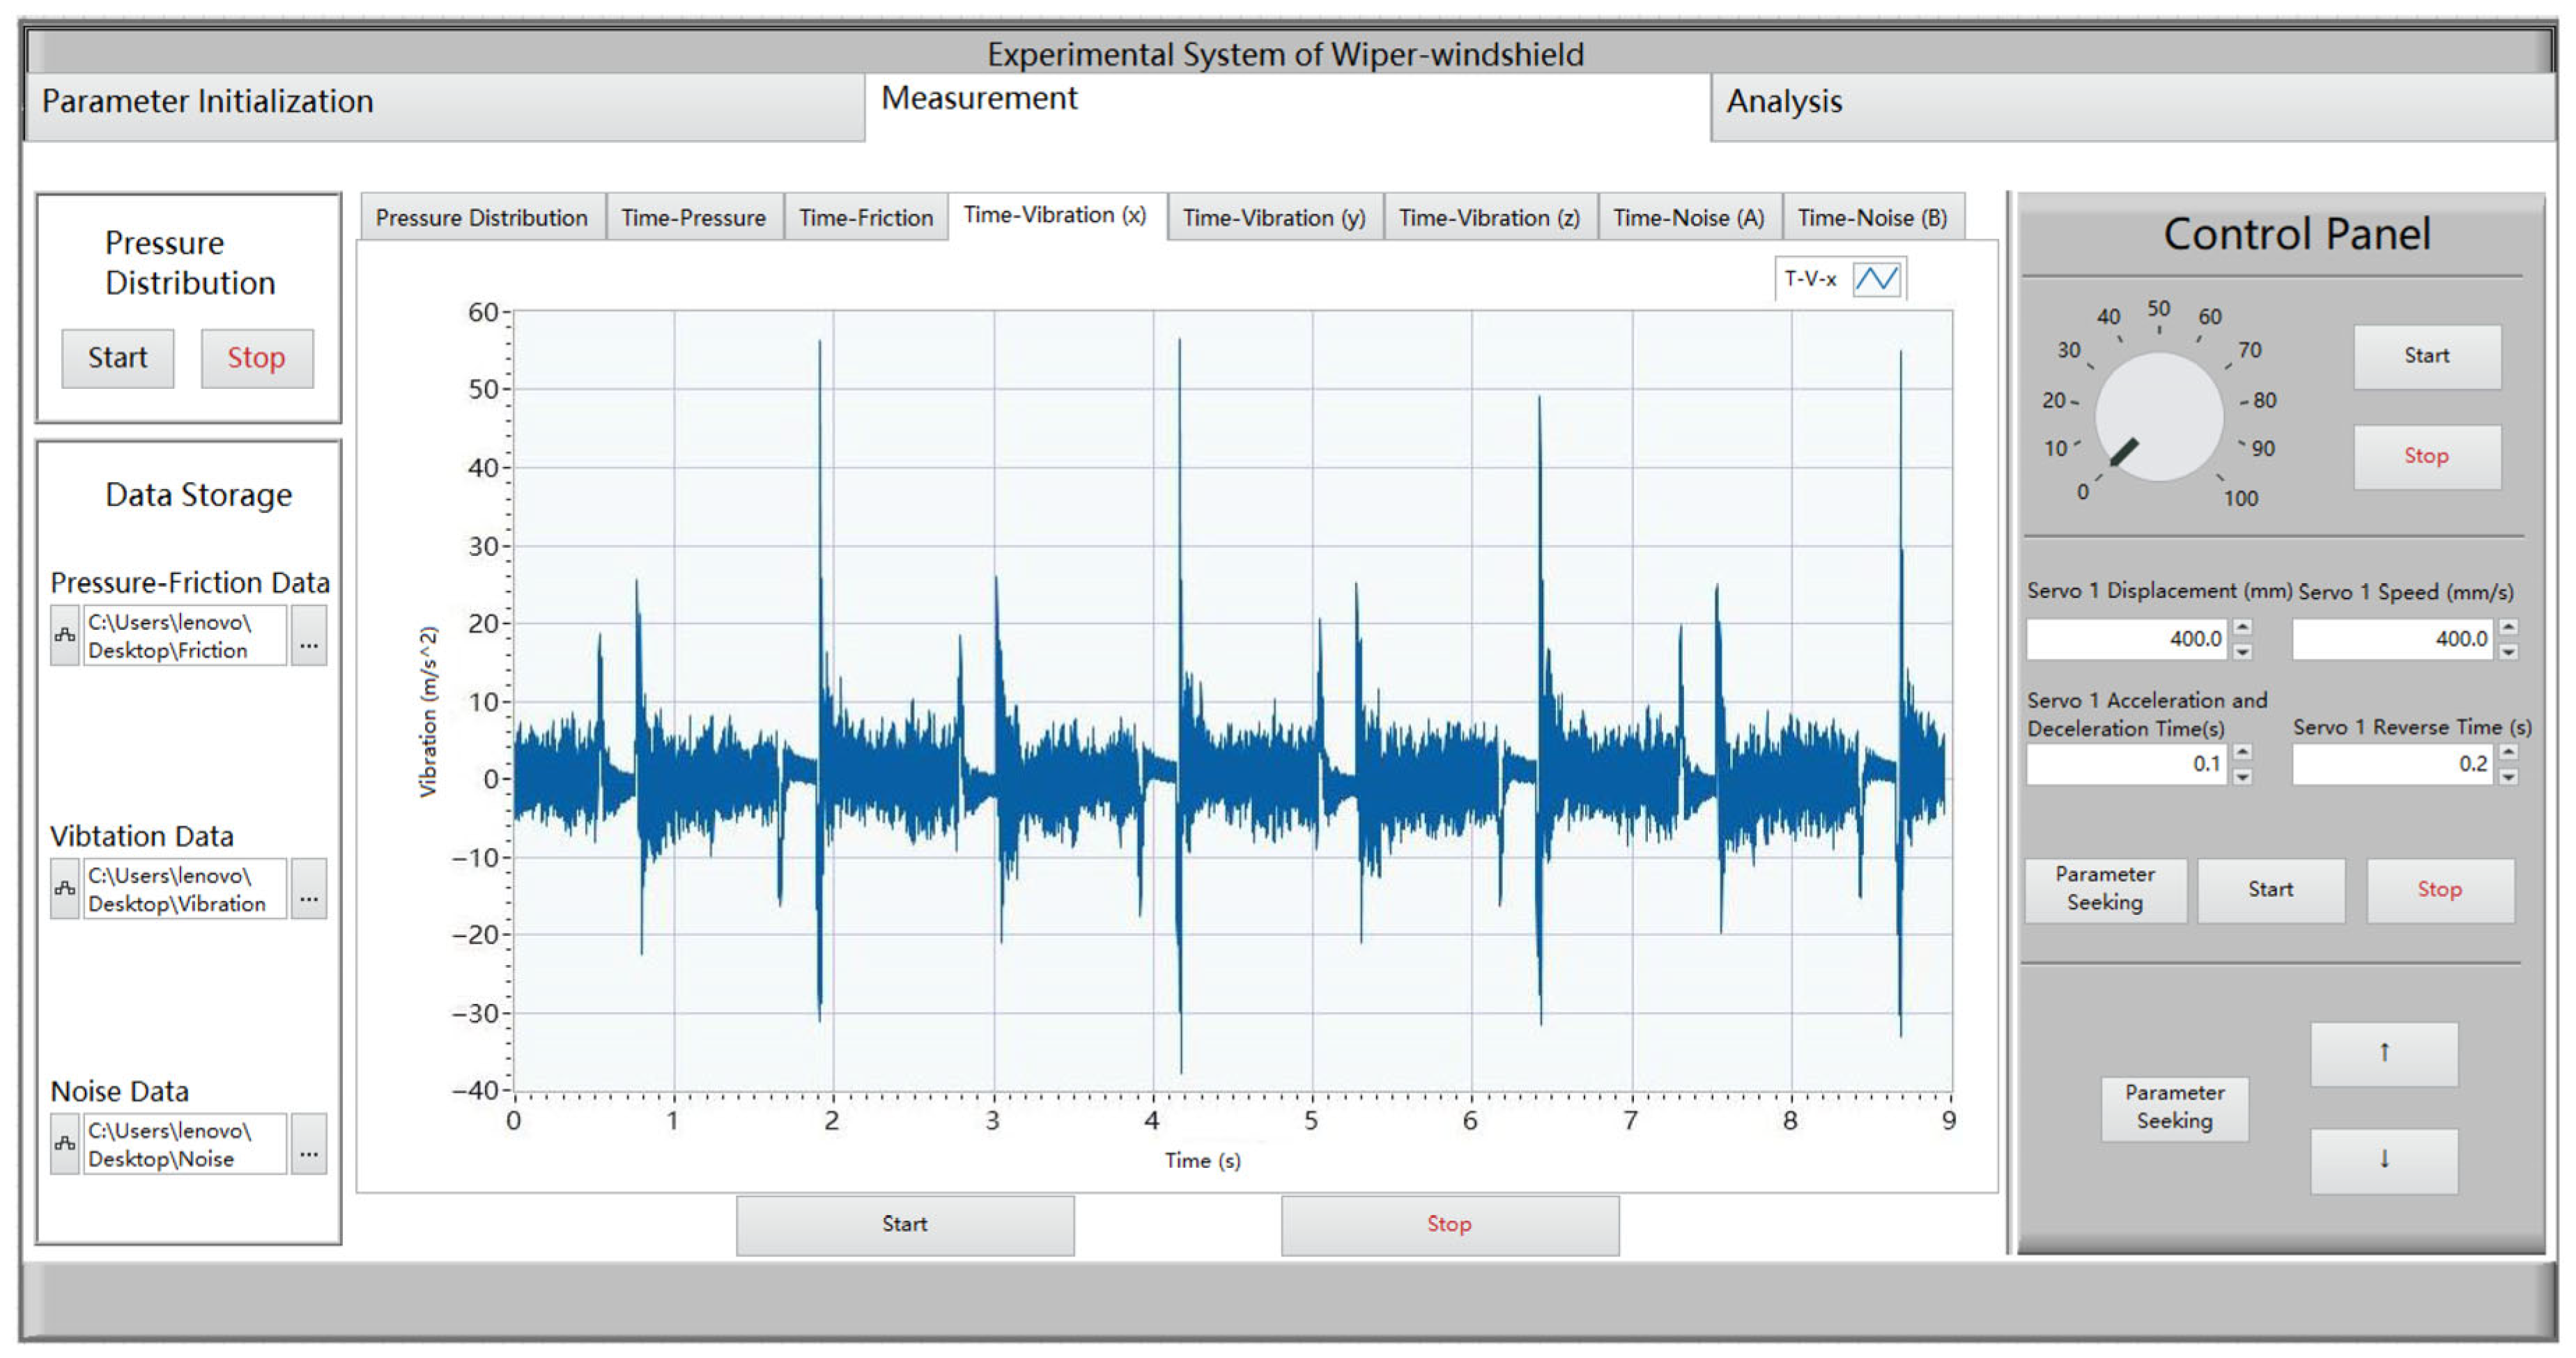
After the successful initialization of the parameters, the test interface is displayed, as shown in Figure 15. The interface features a control panel for the servo motor and water pump, which is located on the right side. The top part of the interface consists of a knob for adjusting the water spraying capacity of the pump, as well as buttons for starting and stopping water spraying. In the middle, various parameters for the X-axis servo motor, such as displacement, speed, acceleration, deceleration time, and reverse time, can be set. Additionally, there are buttons for servo motor parameter seeking, starting, and stopping. Below that, the Z-axis servo motor parameter seeking and up-and-down click buttons are located. The upper left side of the interface houses the start and stop buttons for pressure distribution. On the lower side, users can enter the saving path for pressure, friction, vibration, and noise data. The middle of the interface displays real-time acquisition waveforms of the data, including pressure distribution curves, time–friction curves, time–vibration curves, and time–noise curves, among others. The layout design of the experimental test interface is intuitive and simple, making it easy to understand and operate.

Figure 15.
Experimental test interface.
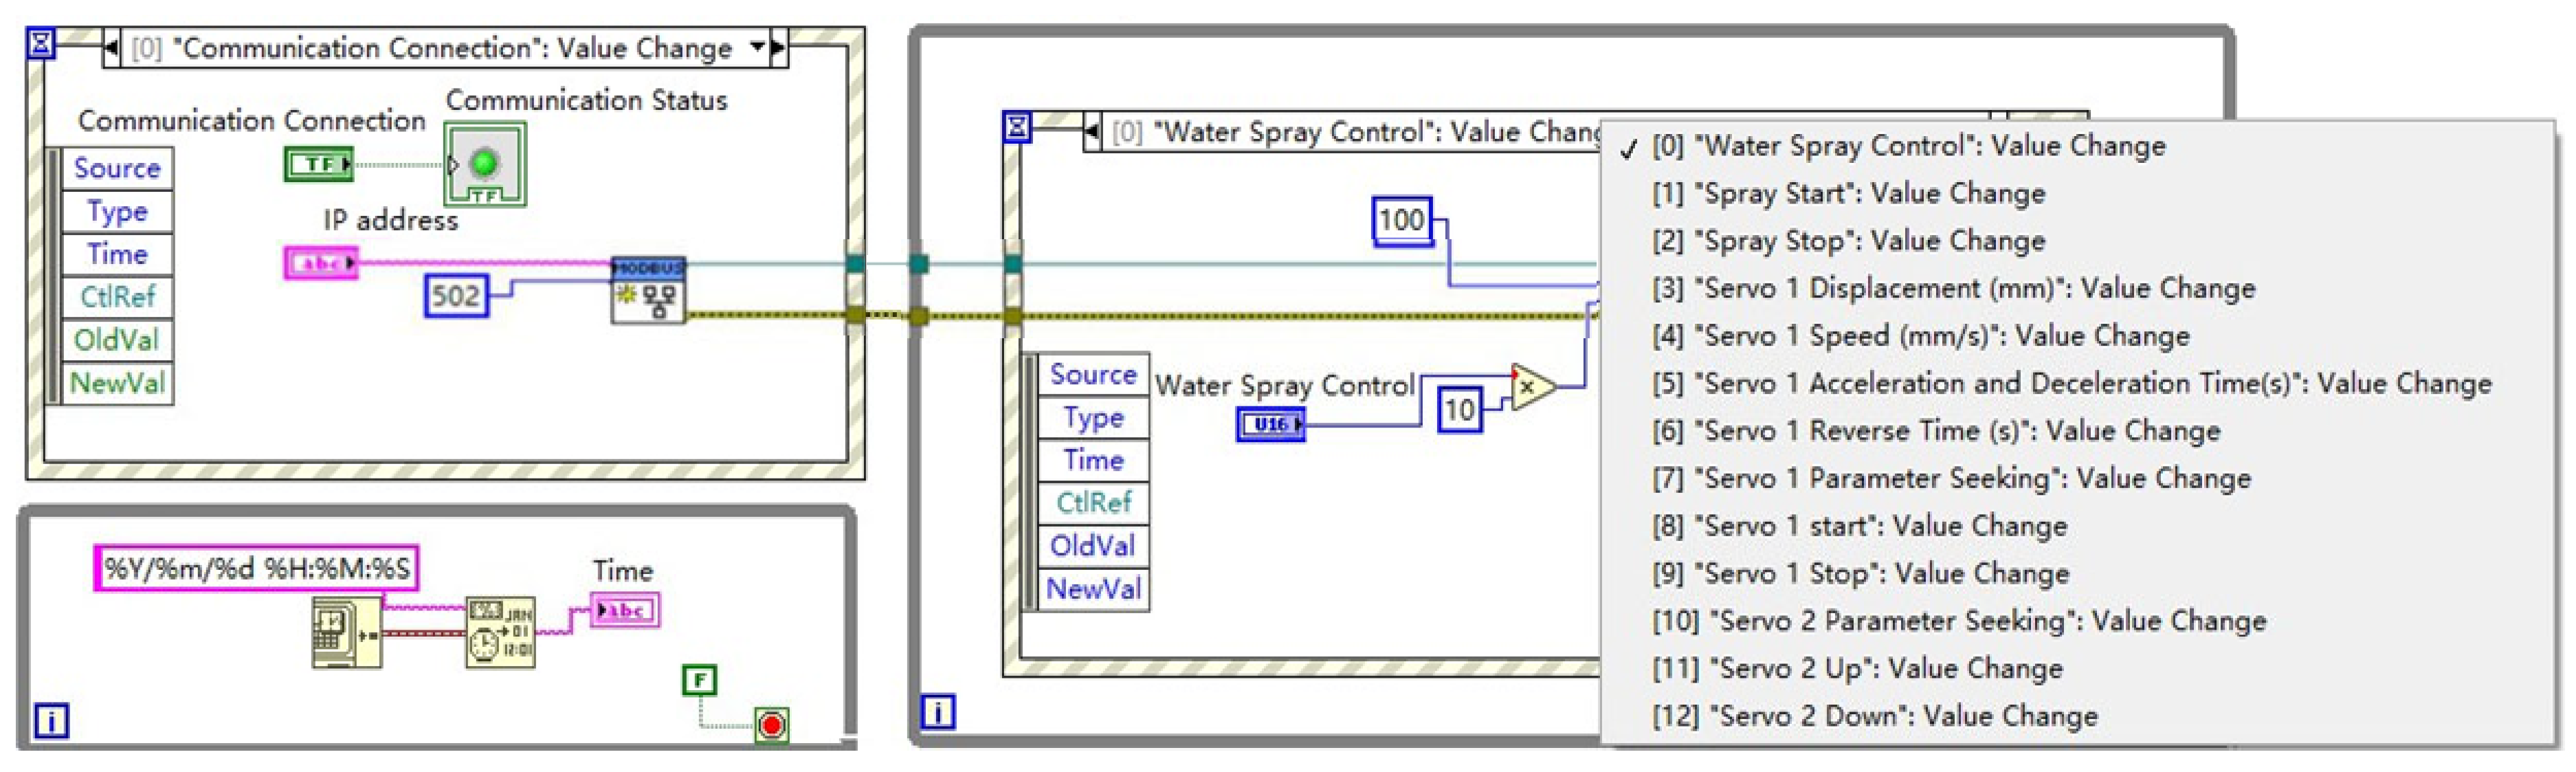
Once the Modbus TCP communication between the upper computer and the lower computer is established, all the parameters and variables are written into the PLC program through VI functions such as “Write to a single register” and “Write to a single coil”, as shown in Figure 16. The logic behind this address mapping is to assign the Modbus address to the CPU address in the PLC program. The required addresses include the output address of the discrete quantity and the save register address of the V memory. These Modbus addresses are then converted to the corresponding LabVIEW addresses.
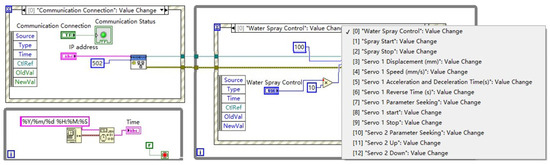
Figure 16.
Program flowchart of control panel.
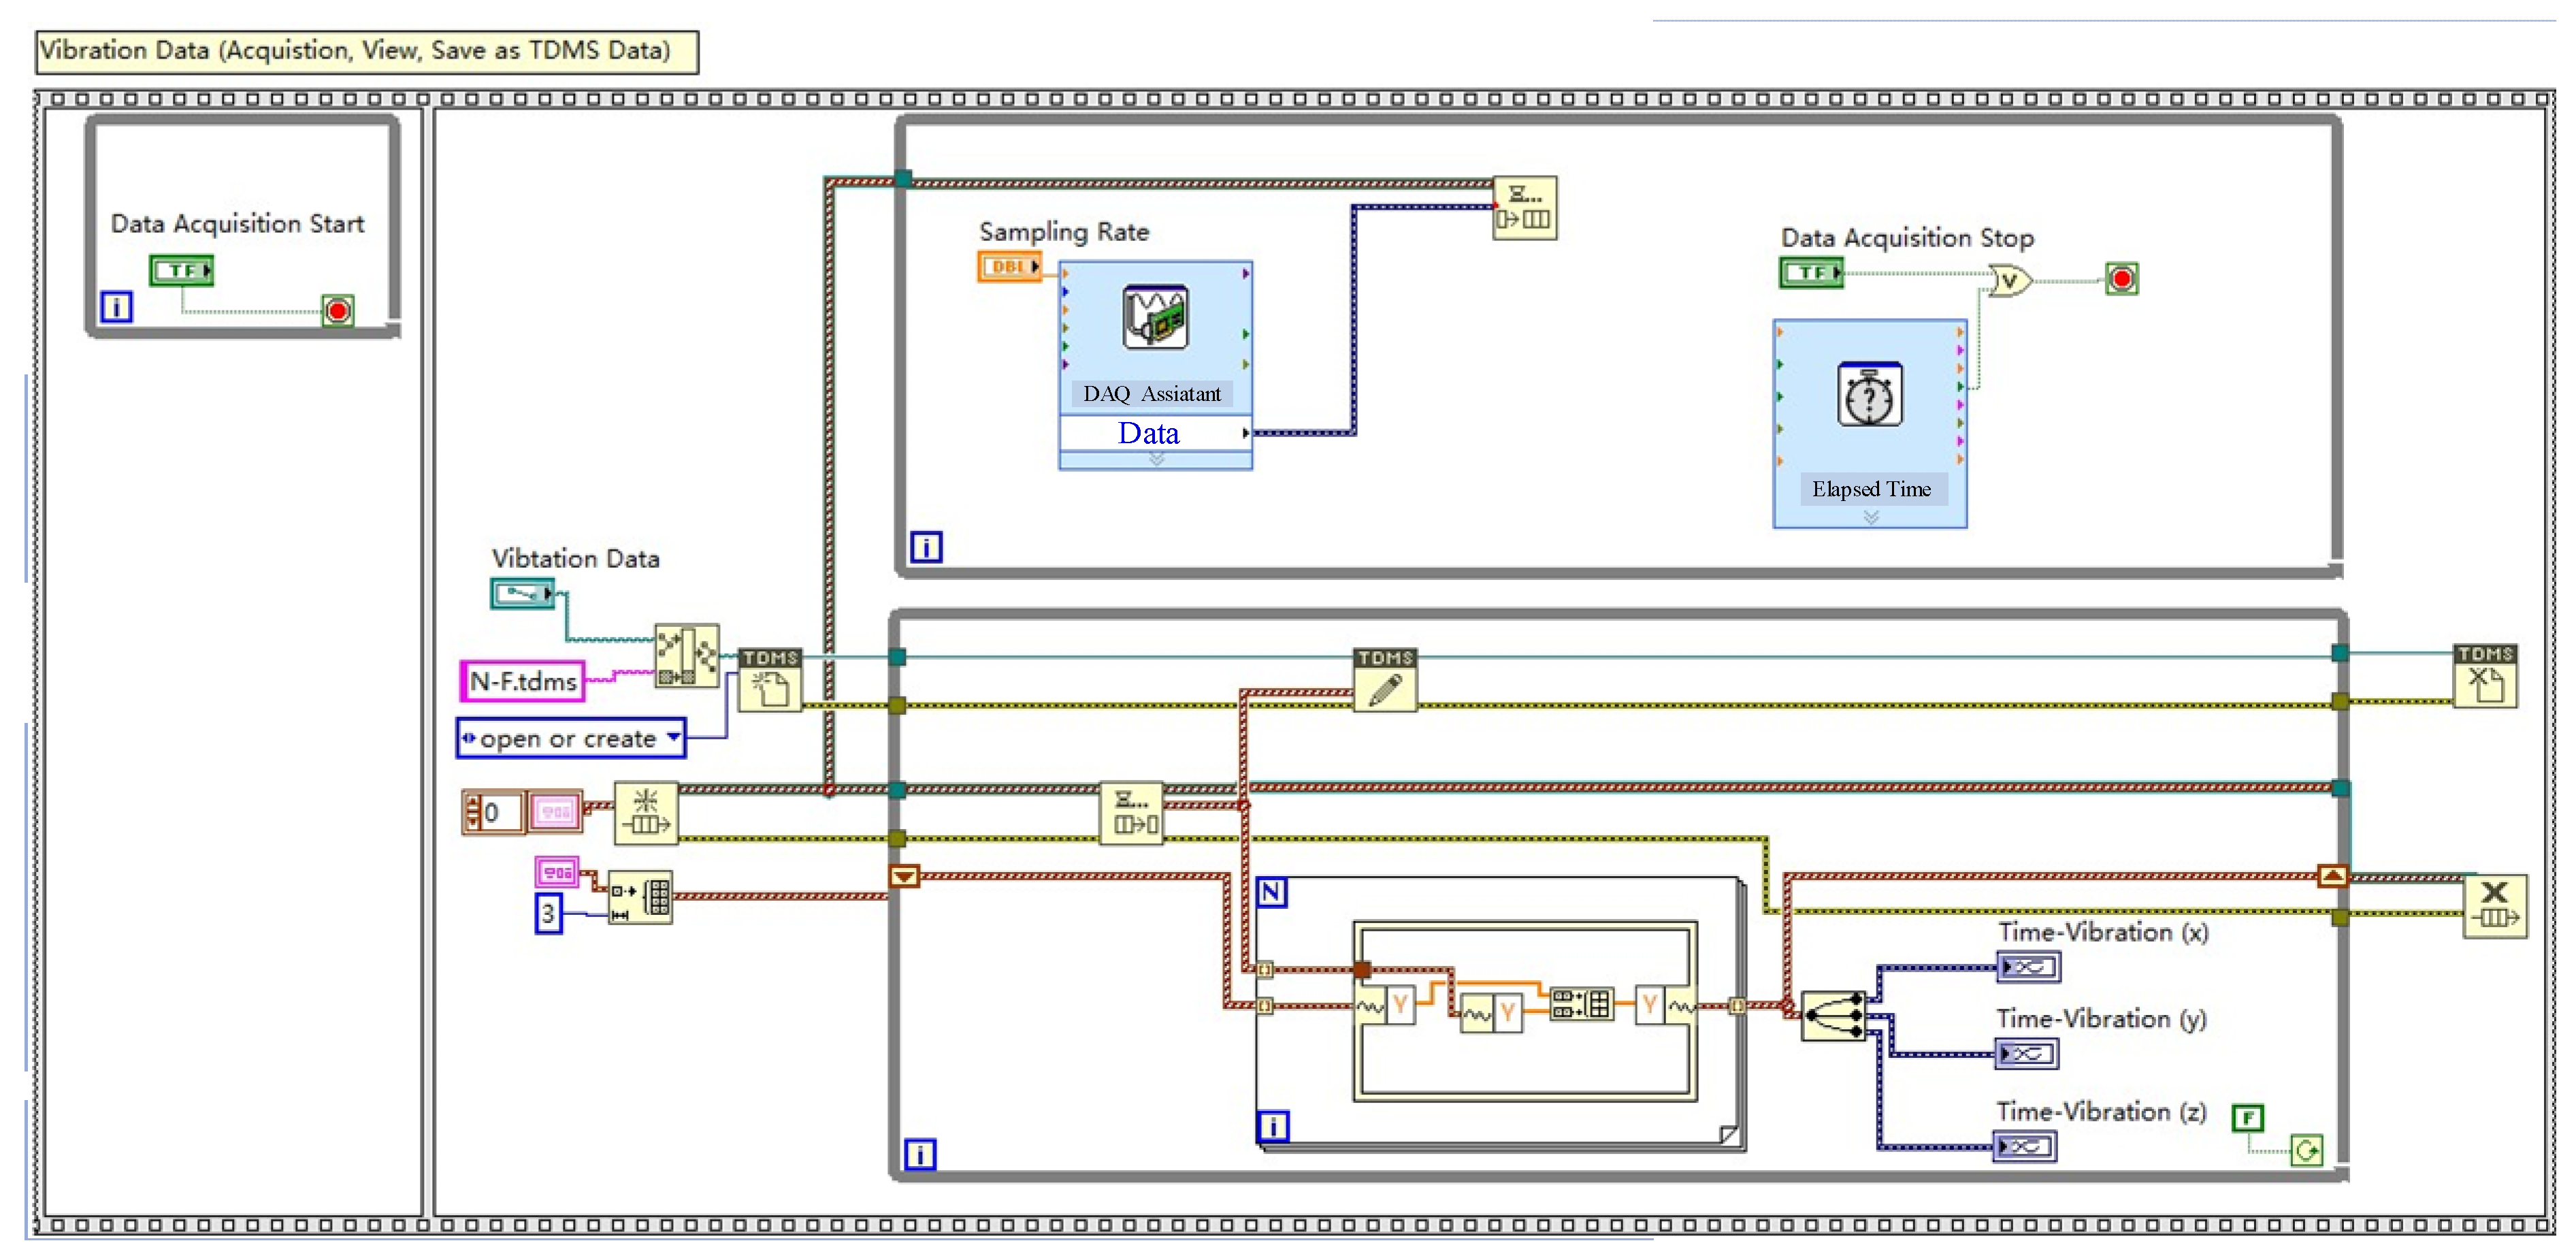
To illustrate the running logic, we take the block diagram of the vibration data acquisition program shown in Figure 17 as an example. The steps are as follows: (1) The user sets the data saving path and clicks the Start button to observe the real-time curve of the vibration data. (2) During the data collection process, the program creates a new TDMS file under the preset saving path and simultaneously writes and reads the vibration data to/from the new file. (3) The program automatically stops the collection after 10 s or can be manually stopped if abnormal vibration data are detected. (4) Upon stopping the collection, the TDMS file can be opened and saved in formats such as xls, xlsx, or txt, or directly used for subsequent data analysis operations.
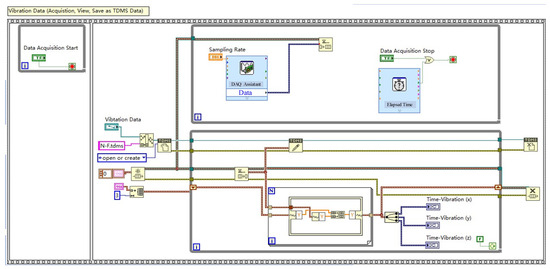
Figure 17.
Program flowchart of acceleration of X, Y, and Z data acquisition.
4.2.3. Data Analysis Interface
The data analysis interface consists of a data comparison interface, a time–frequency conversion interface, and a noise filtering interface.
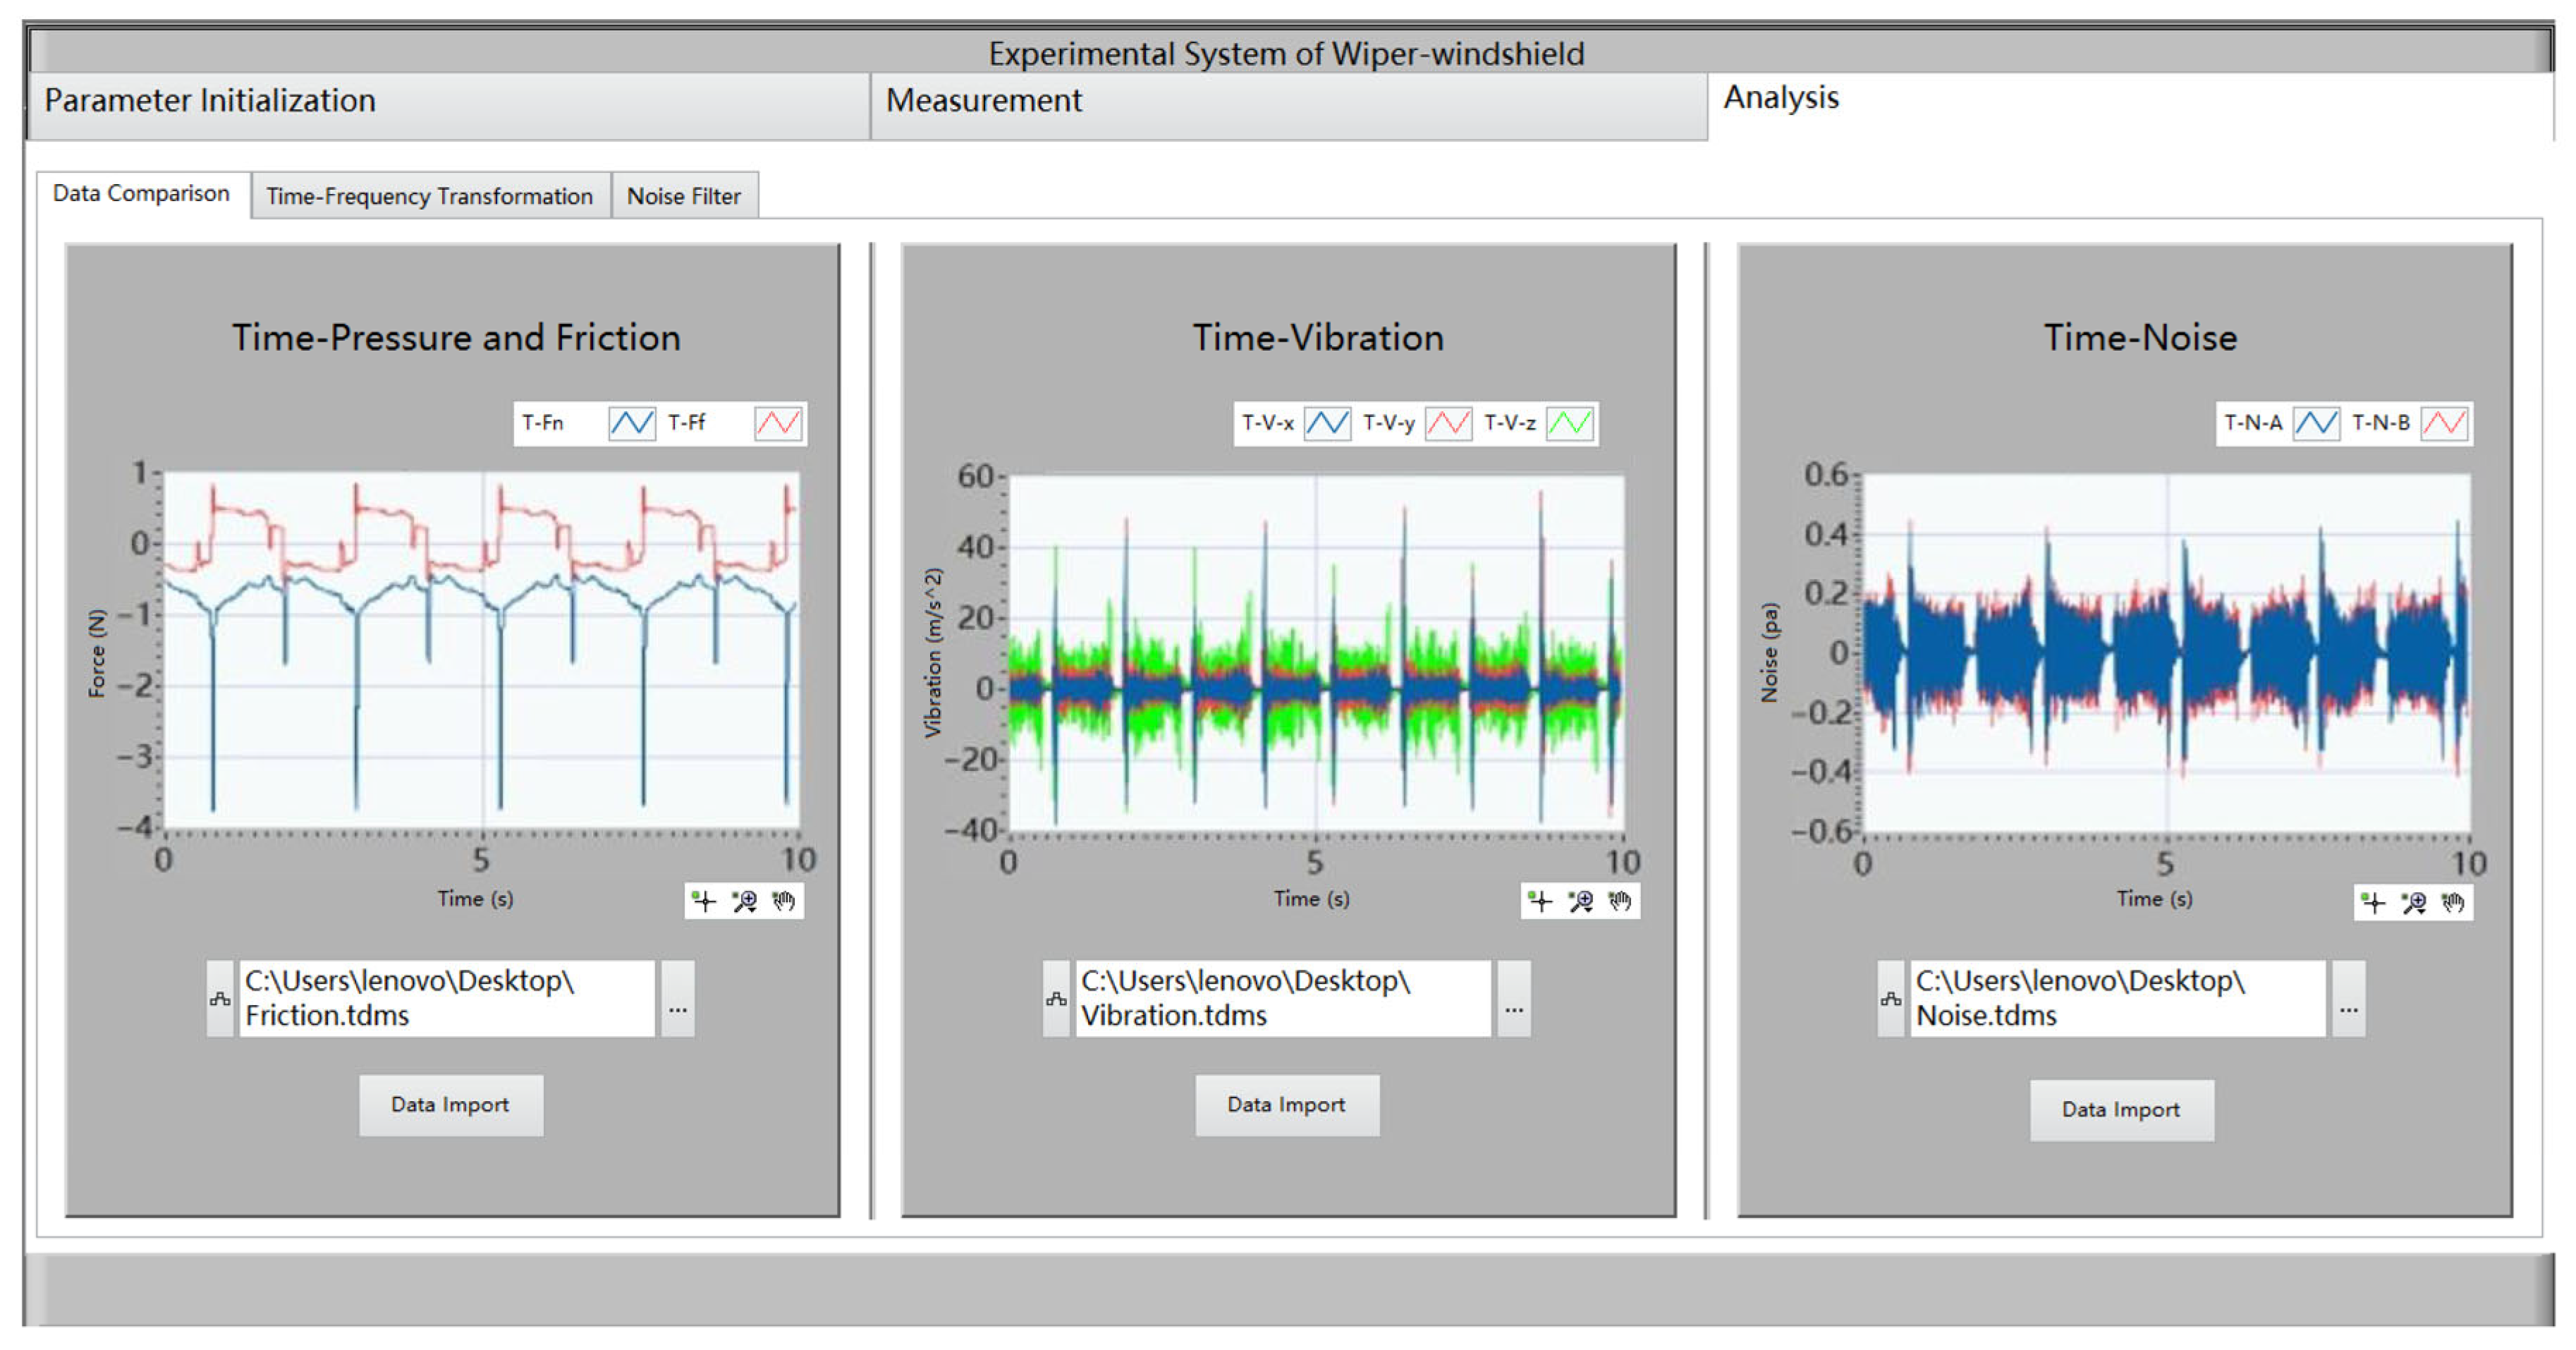
(1) Figure 18 displays the interface for comparing data. Users have the capability to import TDMS-format data directly within the experimental test saving path. Each channel’s data are represented by different colors in the waveform diagram, enabling the quick viewing, comparison, and confirmation of the data. This facilitates subsequent operations.
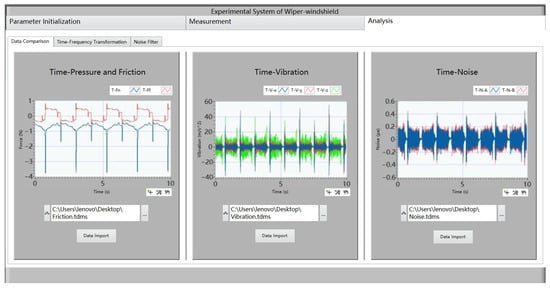
Figure 18.
Data contrast interface.
(2) The time–frequency conversion interface is used to analyze and compare the vibration and noise amplitudes at various frequencies in the frequency domain. This analysis allows for the determination of the frequency band range for peak values, providing insight into the components of vibration and noise within each frequency band. This interface serves as a reference for subsequent noise filtering. The time domain data from the data comparison interface are exported in the xlsx format, converted to the txt format, and then imported into the time–frequency conversion interface. The selected time–frequency converter is the spectrum measurement in LabVIEW signal processing, and the fast Fourier transform (FFT) is used to obtain the corresponding spectrum diagram. The amplitude is calculated using the root mean square (RMS) value, and the Hanning windowing method is employed.
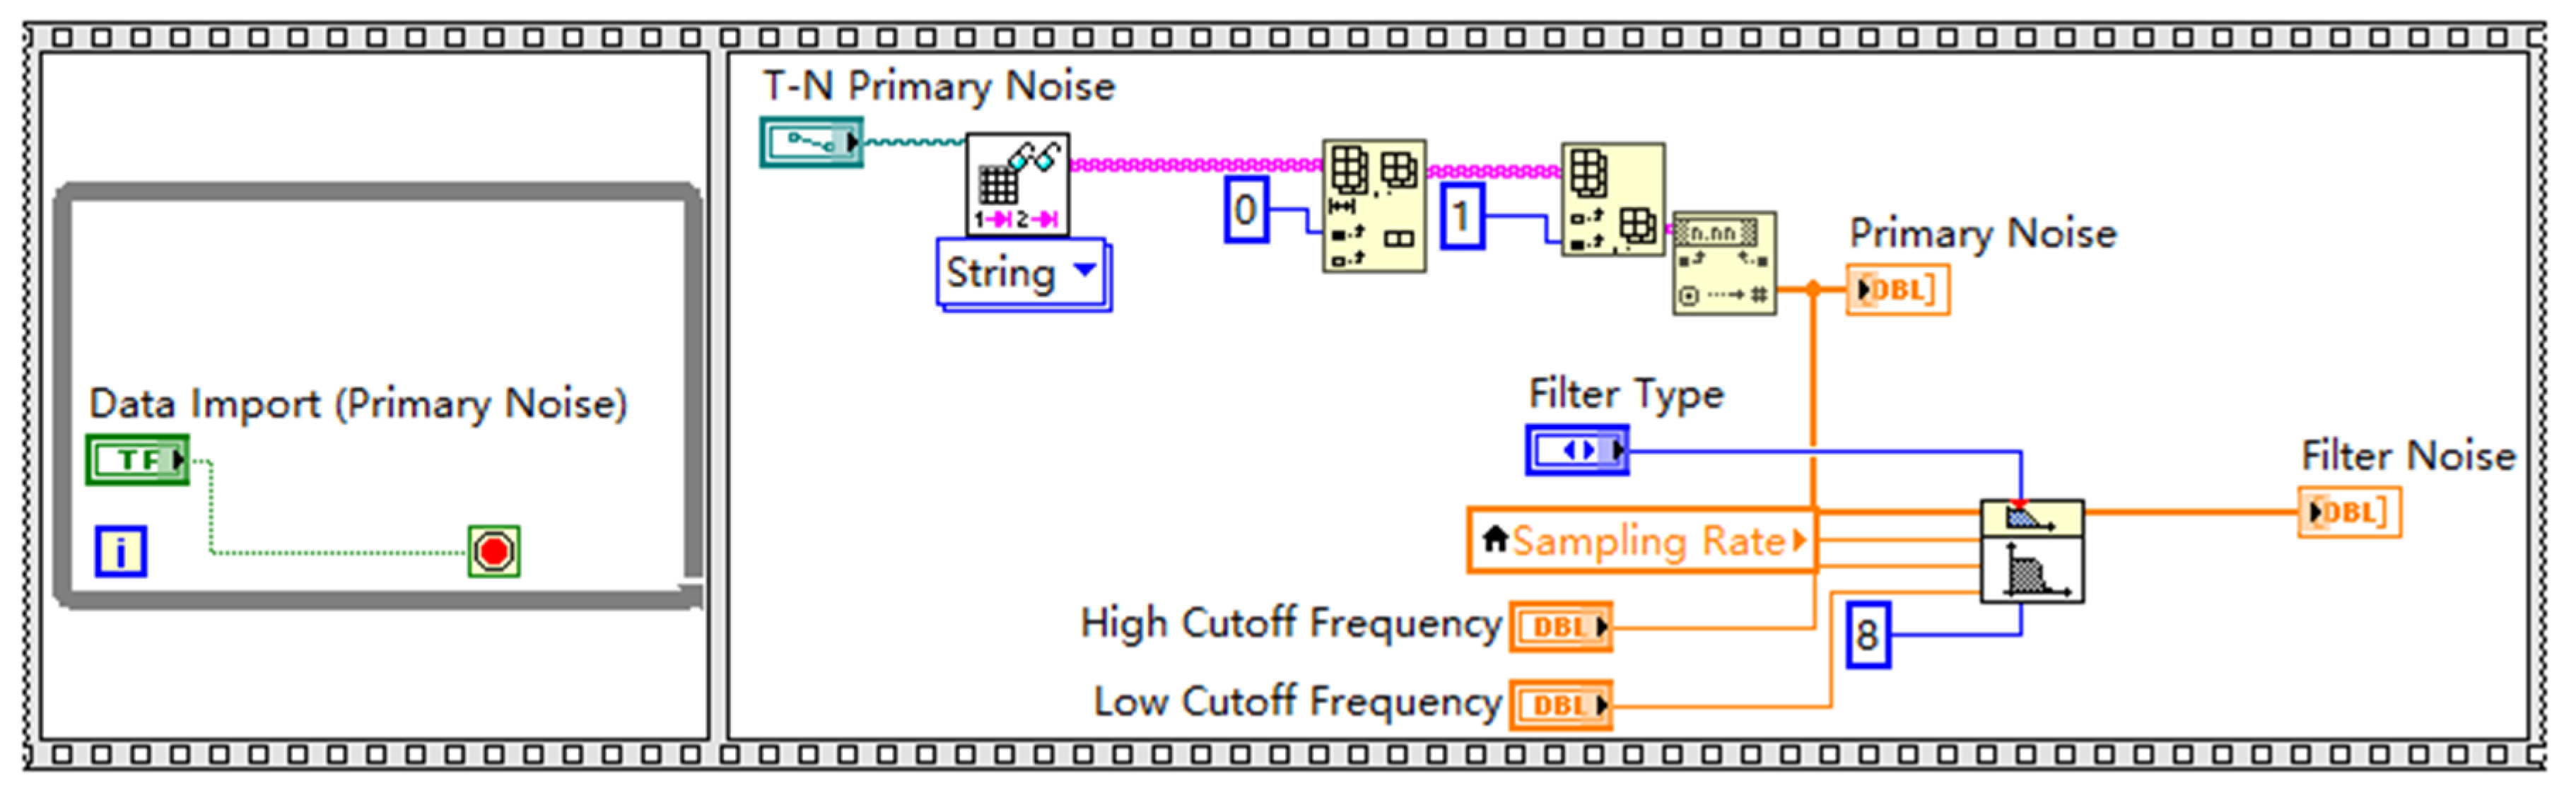
(3) The wiper test bench generates background noise in addition to wiper noise during operation. Some examples include the low-frequency noise arising from ball screw rotation and friction between the slider and guide rail, as well as the high-frequency noise generated during servo motor activation. The microphone captures both the background noise and the target noise, resulting in inaccurate experimental data. To enhance the precision of the wiper friction noise data, a noise filtering interface was designed. This interface filters out the background noise and extracts the target noise. Figure 19 shows the noise filtering program’s block diagram.
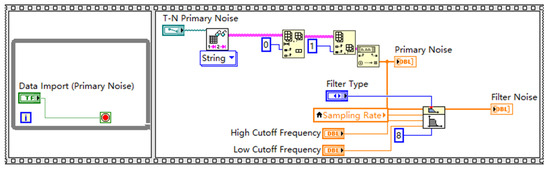
Figure 19.
Program flowchart of noise filtering.
The noise data collected by the microphone under various working conditions of the experimental bench without a wiper were analyzed in the frequency domain to examine the distribution of noise frequencies. The frequency range of the background noise peak was determined, and an appropriate filter type was chosen to filter and extract the recorded wiper noise data. The Butterworth filter, which offers lowpass, highpass, bandpass, and bandstop functions, was selected. For instance, based on the background noise spectrum diagram, it was necessary to filter out the high-frequency noise generated by the servo motor with a frequency band above 1000 Hz, as well as the reverse, chatter, and screaming noise of the wiper blade within the 0 to 1000 Hz range. Therefore, a lowpass filter with a low cutoff frequency of 1000 Hz was selected for background noise filtering, with a filtering order of 8. The filtered noise frequency domain diagram is displayed in the interface, facilitating visual comparison between the original and filtered noise. In the lower right corner of each waveform, a graphics tool selection board is available, allowing for zooming in, zooming out, intercepting, and dragging the curves within the waveform to observe the data clearly.
5. Experimental System Test and Verification
Through the experimental system platform, a wiper experiment, including a mechanical property experiment, a vibration experiment, and a noise experiment, was tested and verified.
5.1. Experimental Scheme Design
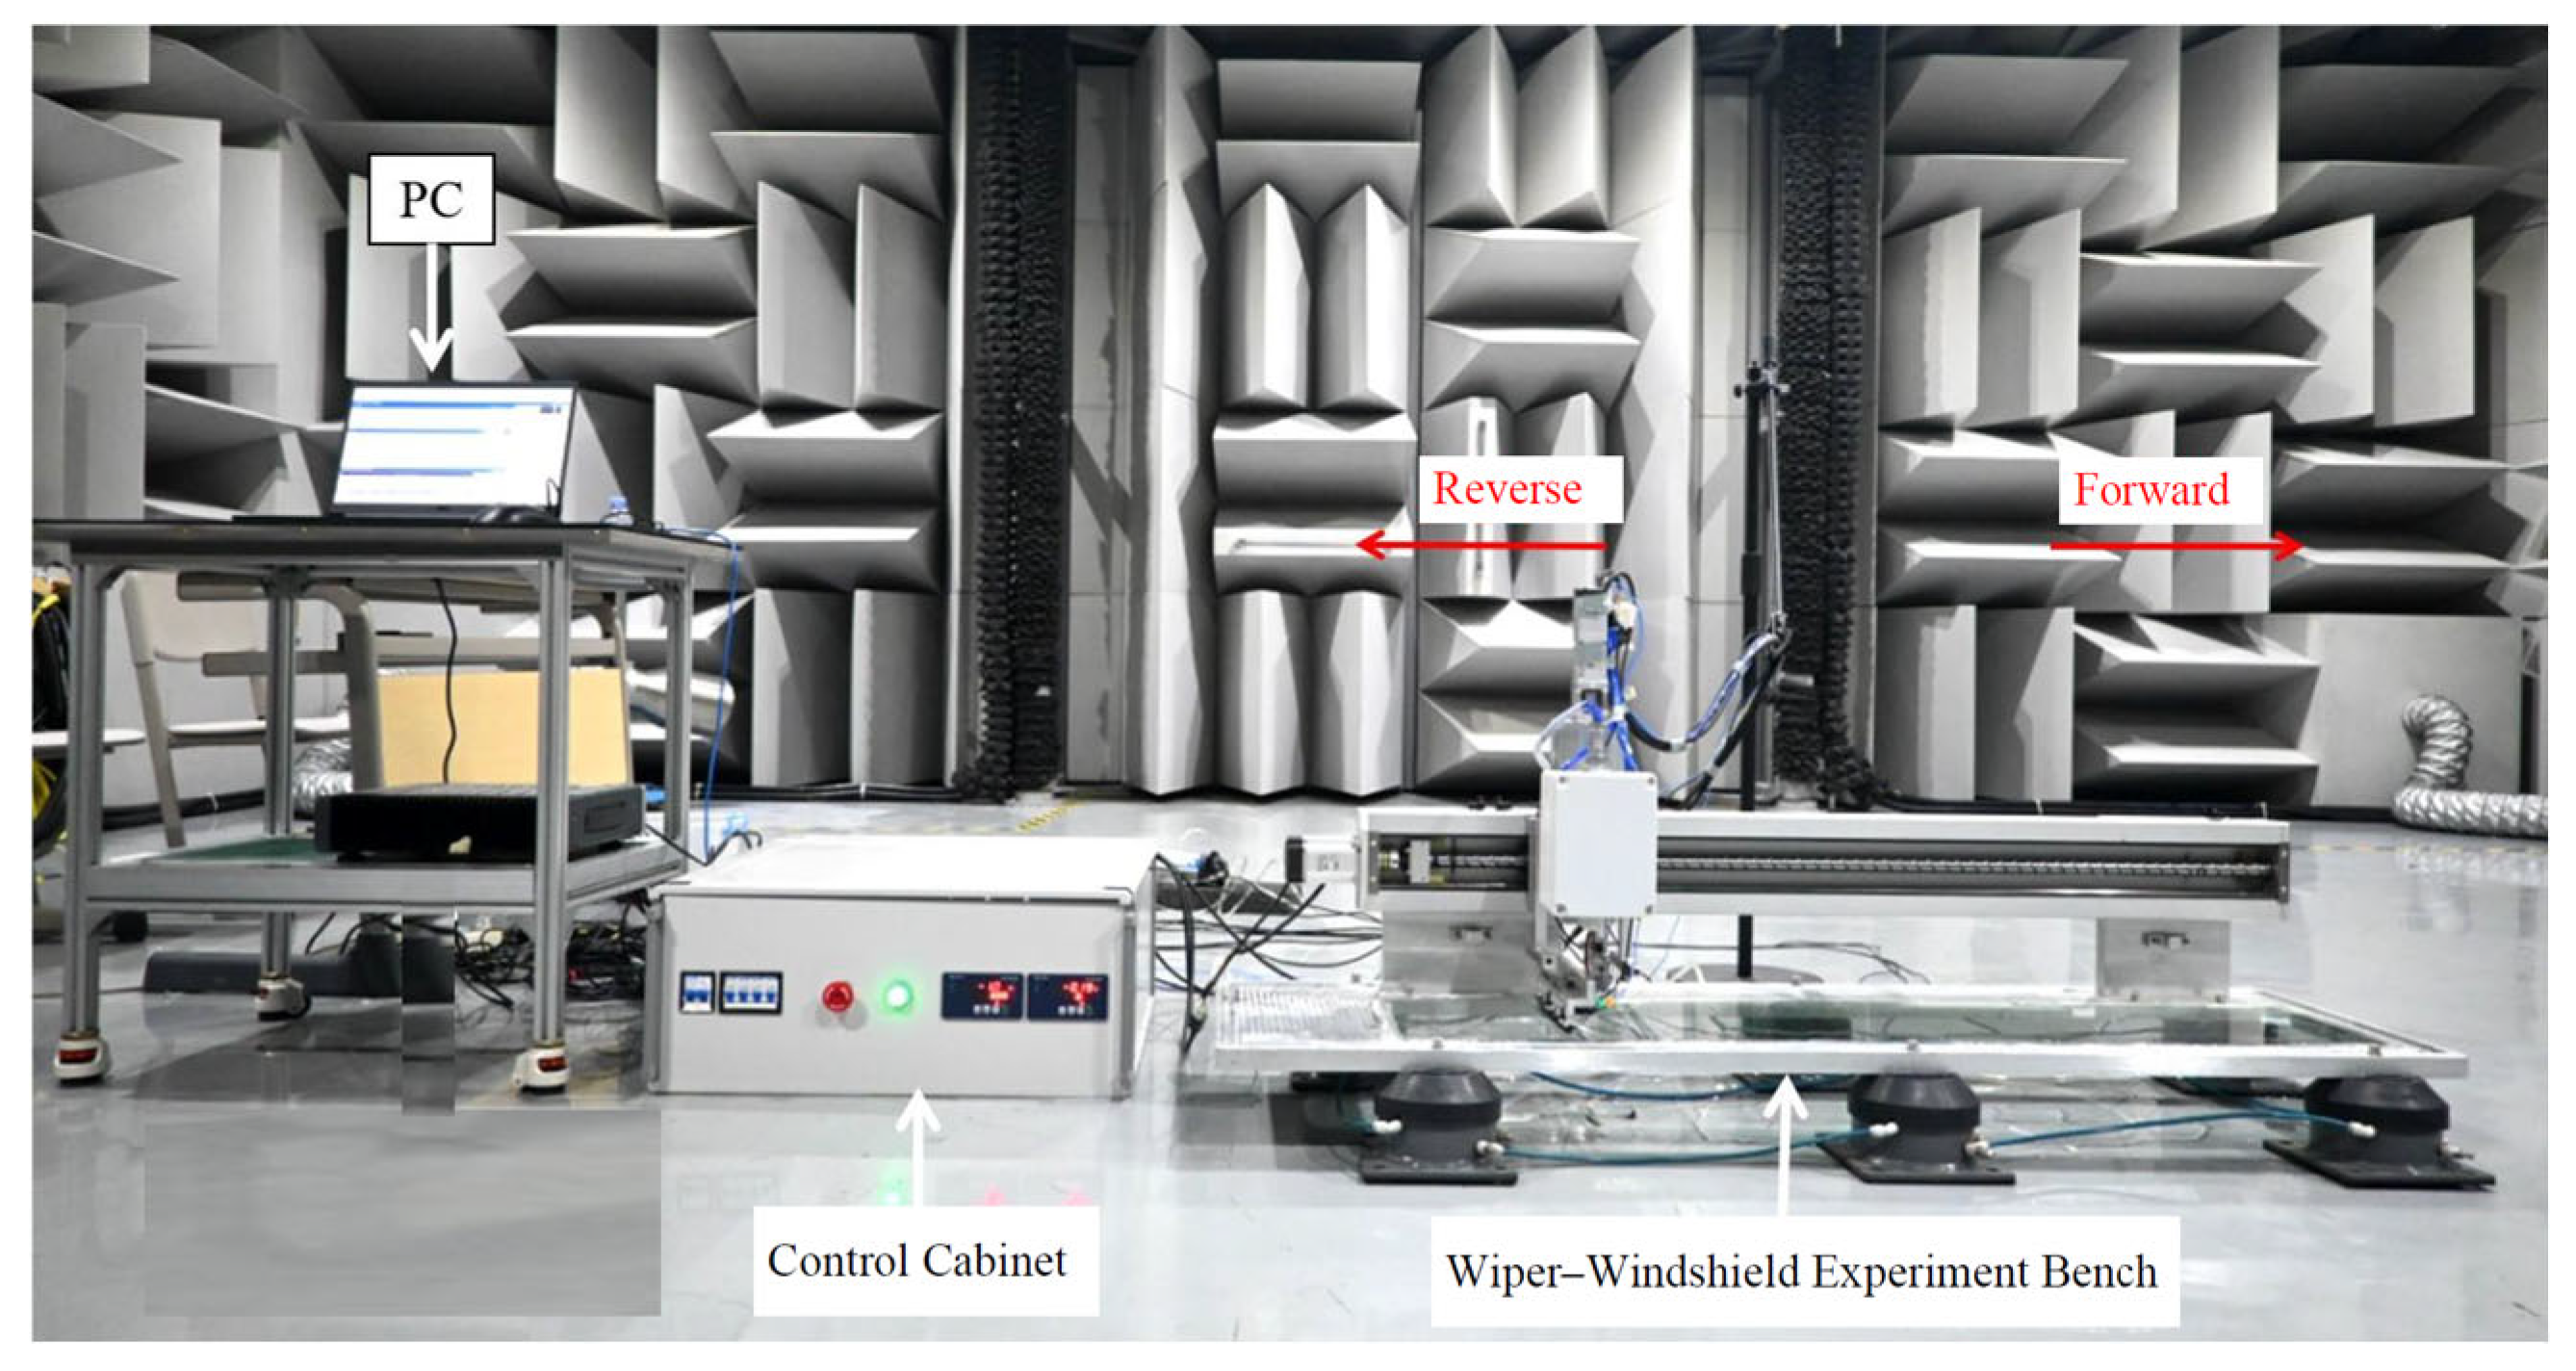
Figure 20 illustrates the configuration of the wiper–windshield experimental system. The experimental environment featured a semianechoic room measuring 9.76 m × 8.6 m × 3.5 m, with a cutoff frequency of ≤63 Hz and background noise levels below 20 dBA. The entire movement cycle of the wiper, ranging from right to left, was tested during the experiment. Data regarding the friction force, normal force, vibration, and noise between the windshield wiper and windshield glass were collected to verify the test functionality of the experimental system.

Figure 20.
Overall arrangement of experimental equipment.
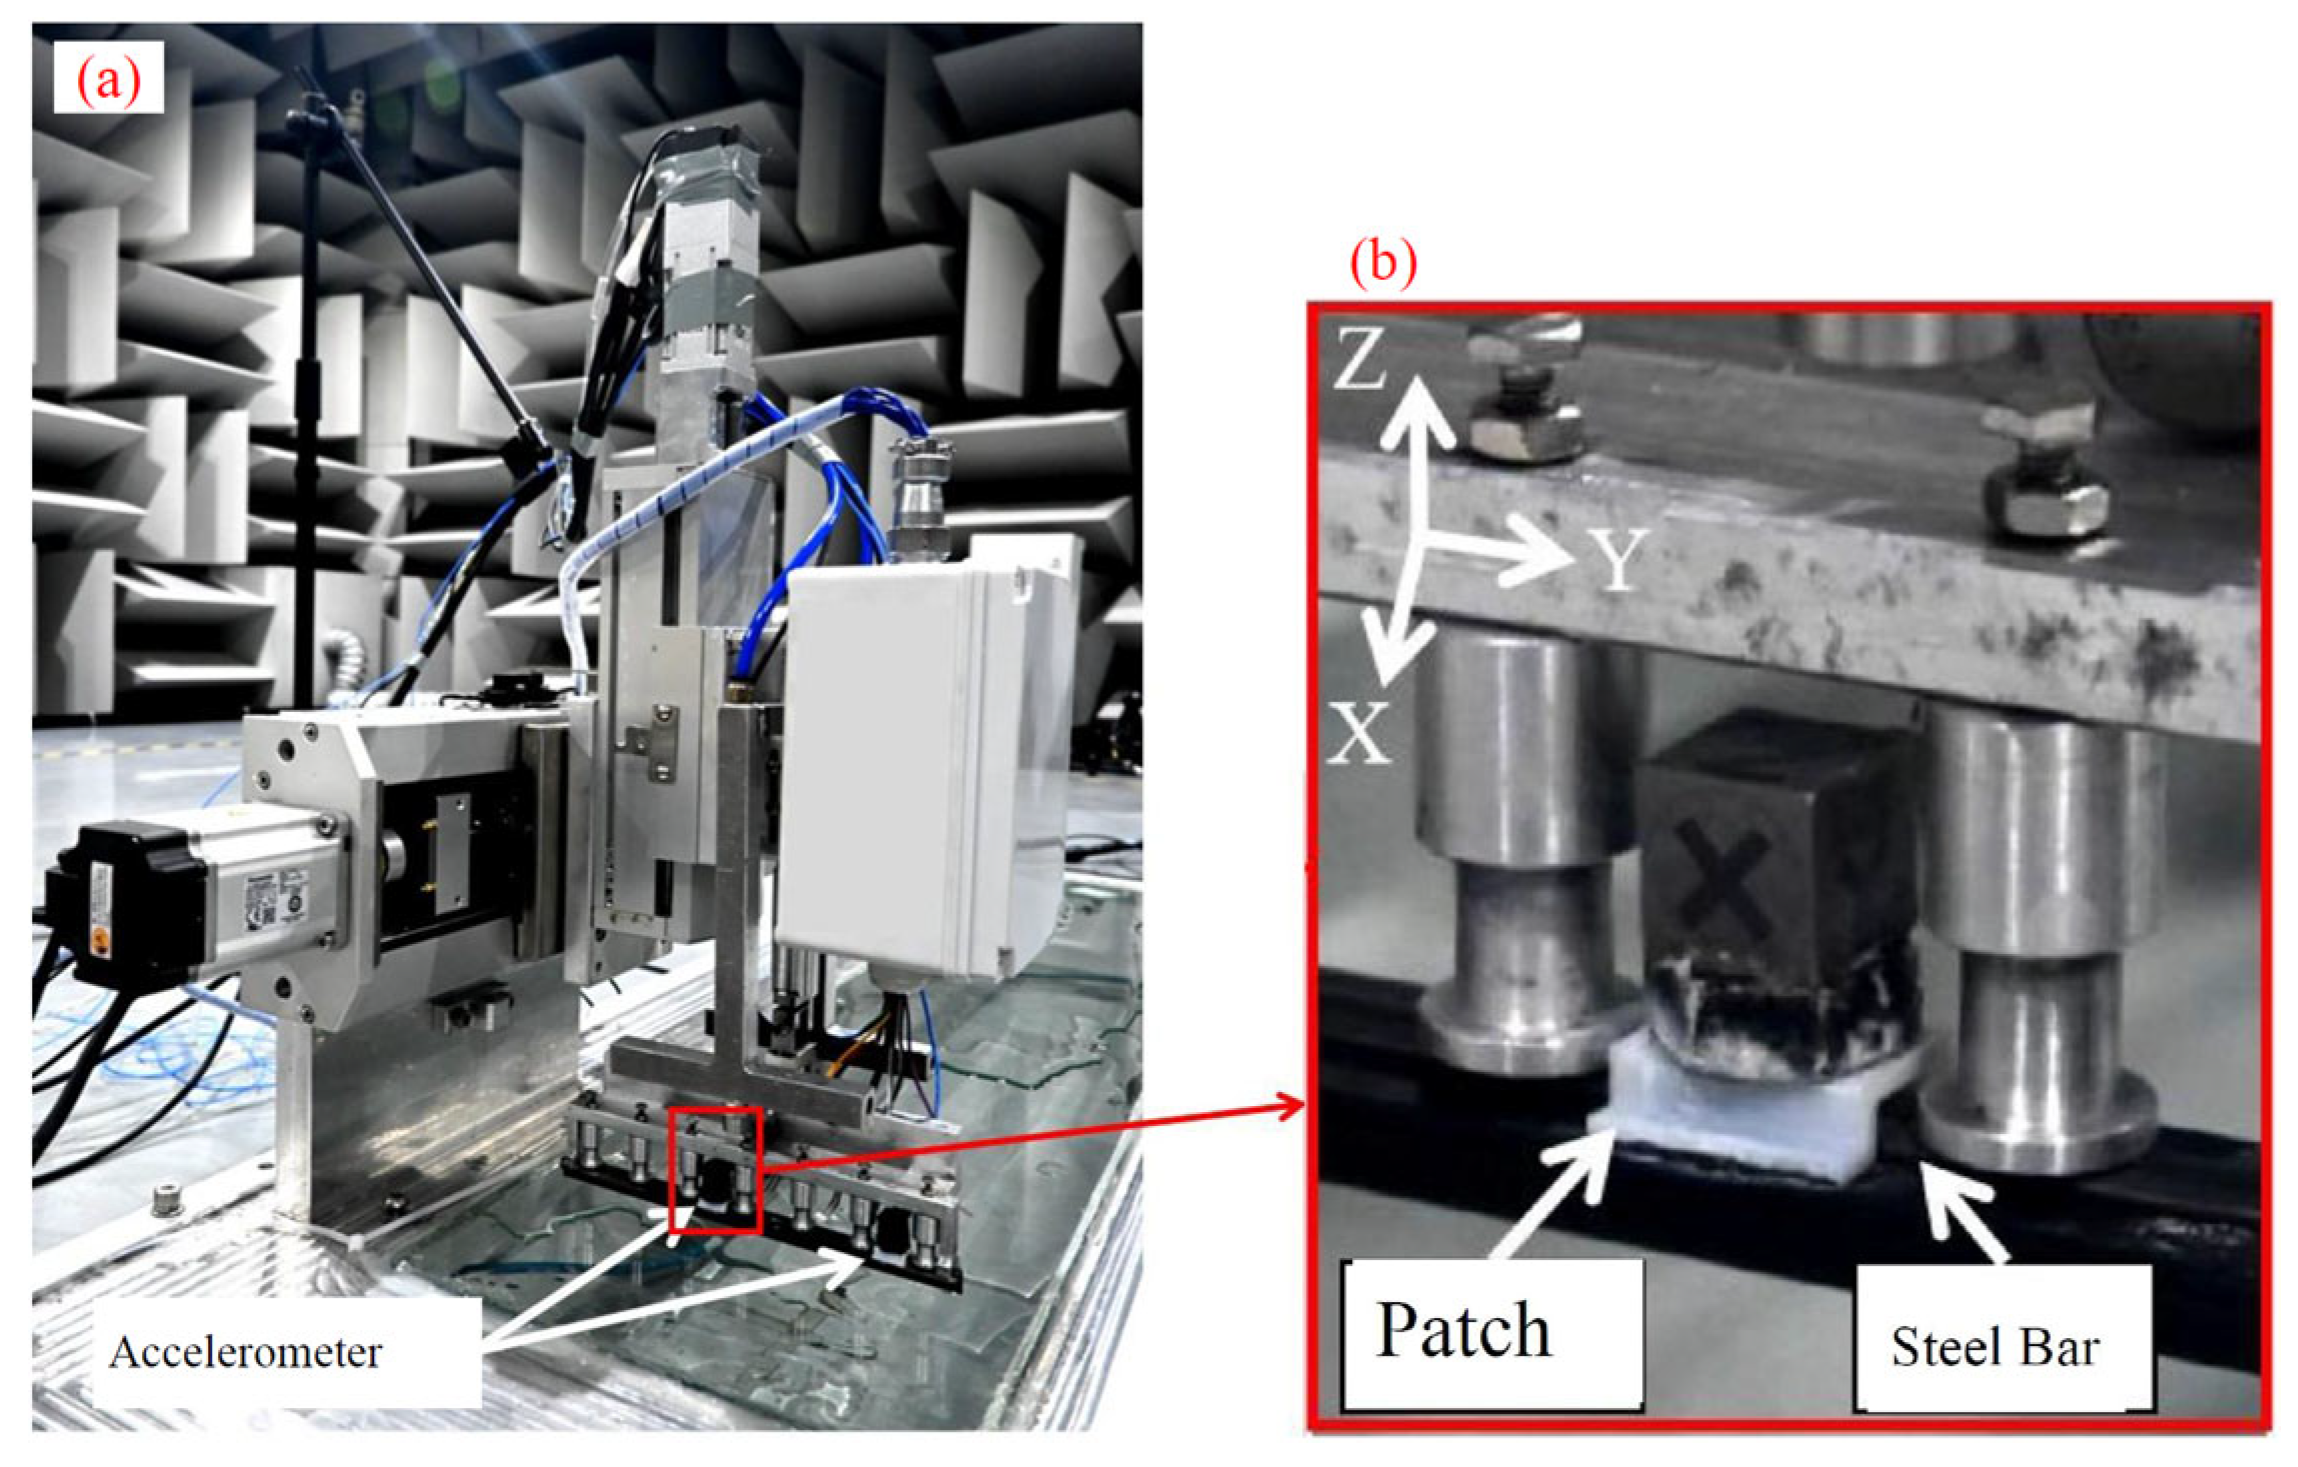
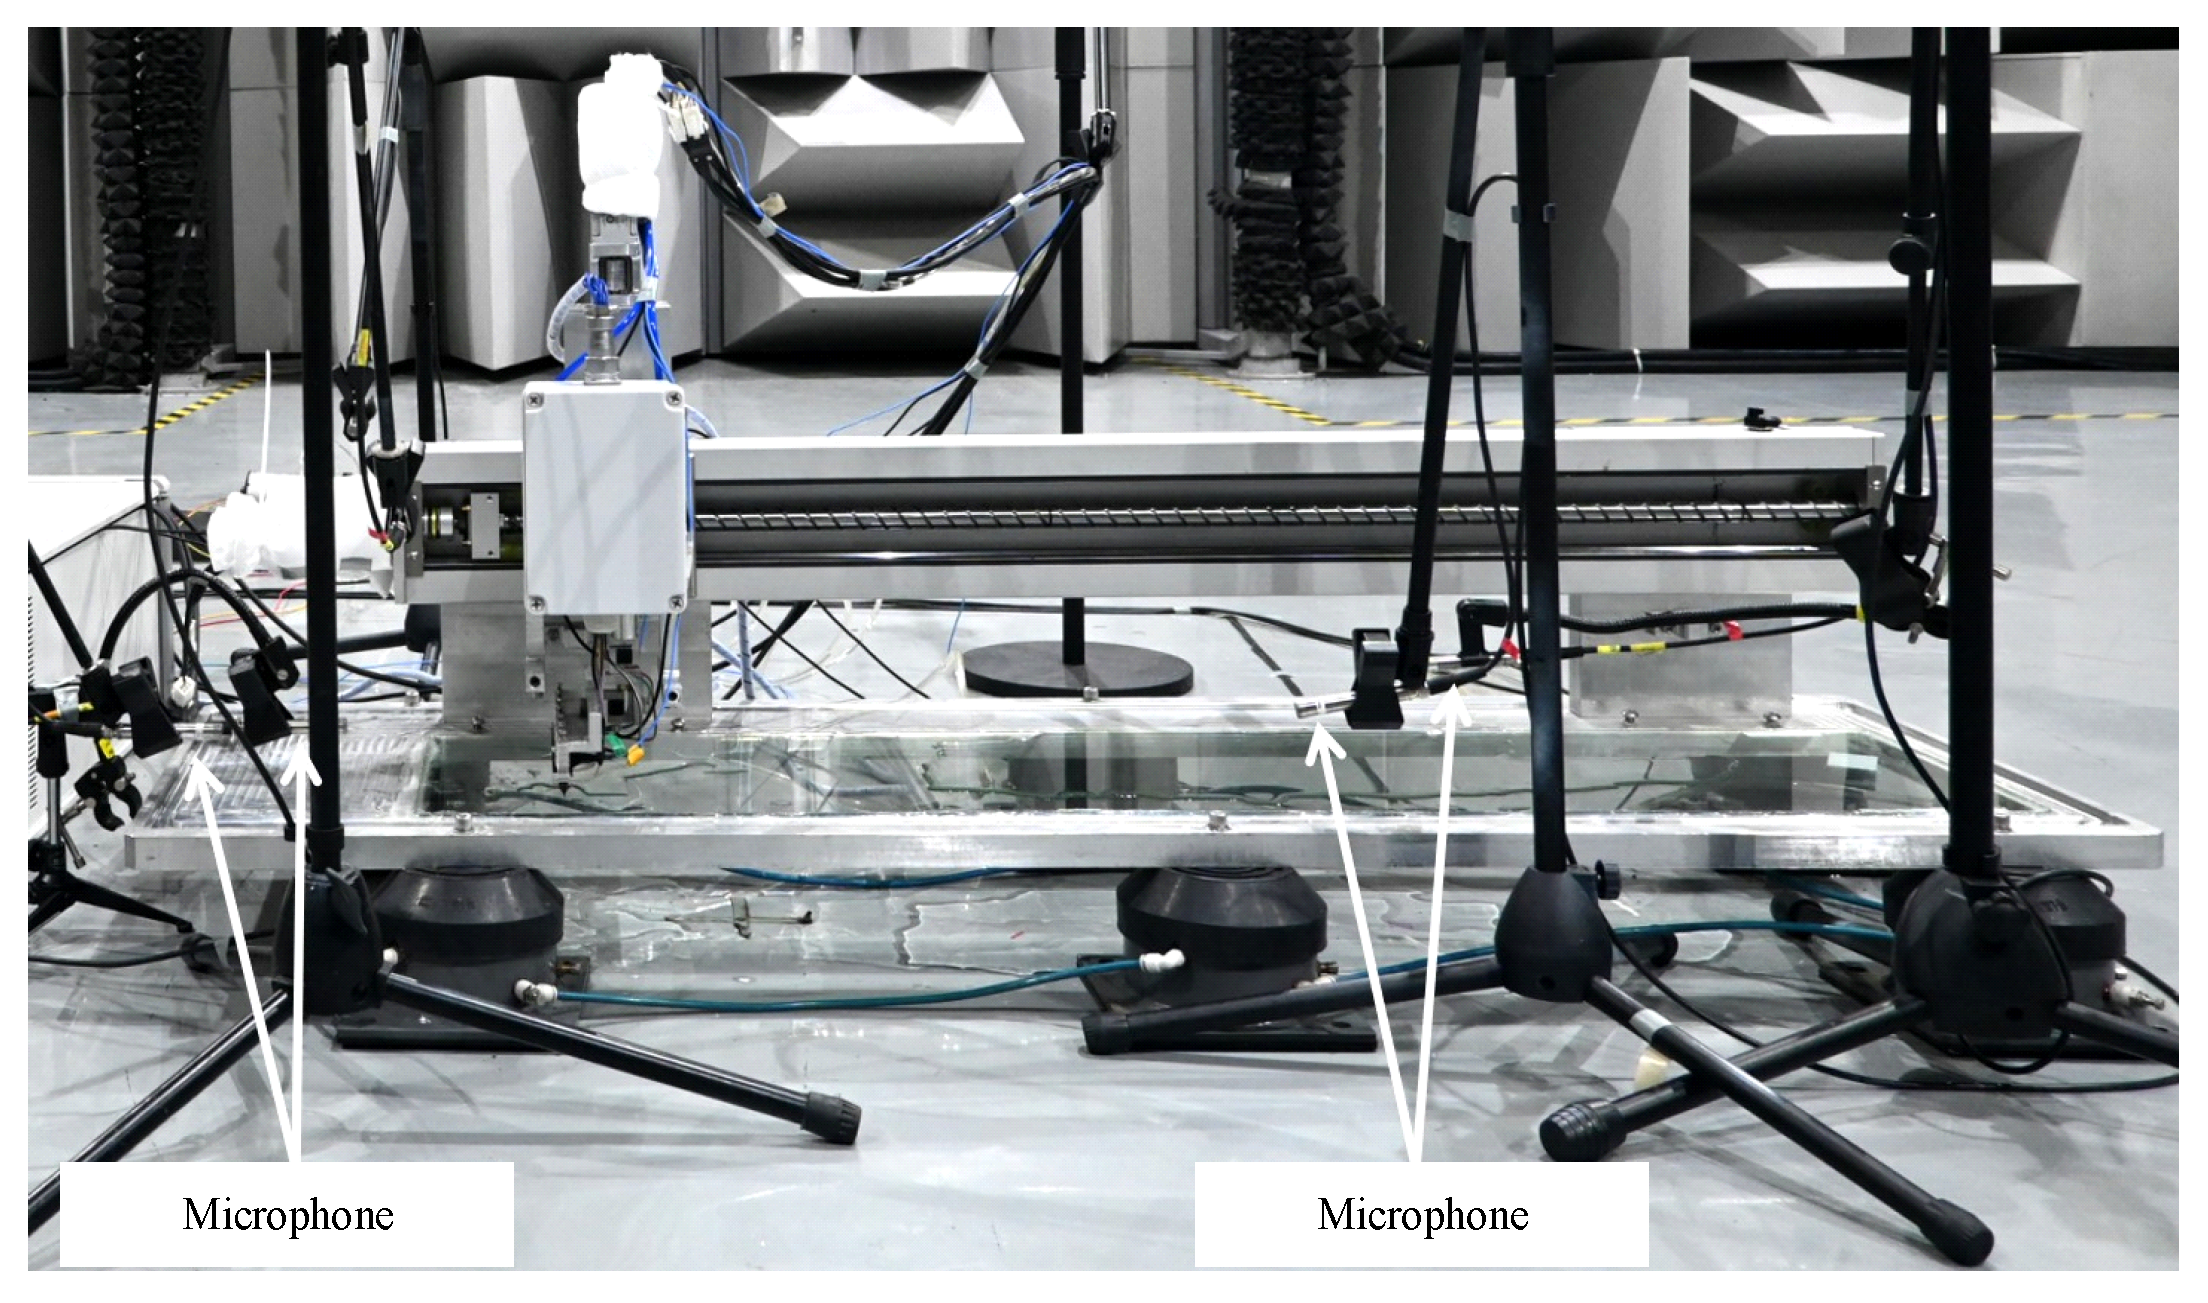
The vibration and noise measurement points were positioned in accordance with standards and experimental requirements. Two accelerometers were placed in the middle and on one side of the scraper, and 454 quick-drying glue was used to affix them to the upper end of the patch, as shown in Figure 21. The sampling frequency for the vibration data was set at 12,800 Hz. Additionally, four microphones were placed at two opposing positions of the wiper, located 150 mm and 300 mm away from the opposing position of the wiper, as depicted in Figure 22. The sampling frequency for the noise data was set at 51,200 Hz, utilizing a Hanning window function and adopting the A-weighted frequency weighting mode.

Figure 21.
Sensor arrangements for vibration measurements: (a) overall view, (b) magnified view.
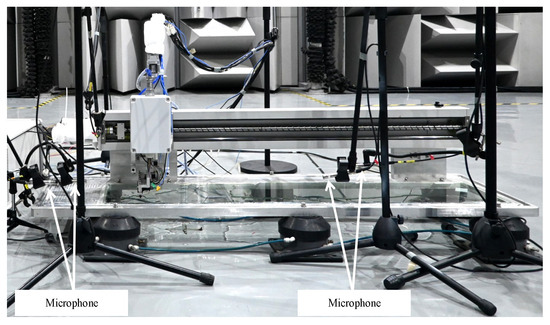
Figure 22.
Microphone arrangements for noise measurements.
The experimental conditions were set according to various dry and wet conditions, brushing speeds, acceleration and deceleration times, and pressures. To accurately measure flutter, scream, and reverse noise near the vehicle wiper, it was necessary to use sound-absorbing cotton to reduce the high-frequency noise generated by the servo motor during the experiment. In addition, a noise filter was used to eliminate background noise. Prior to each experimental test, the glass and scraper were cleaned using a cleaning agent. Once the surface was dry, the scraper was pressed onto the glass surface using the control screw module.
5.2. Analysis of Experimental Results
(1) Mechanical property experiments:
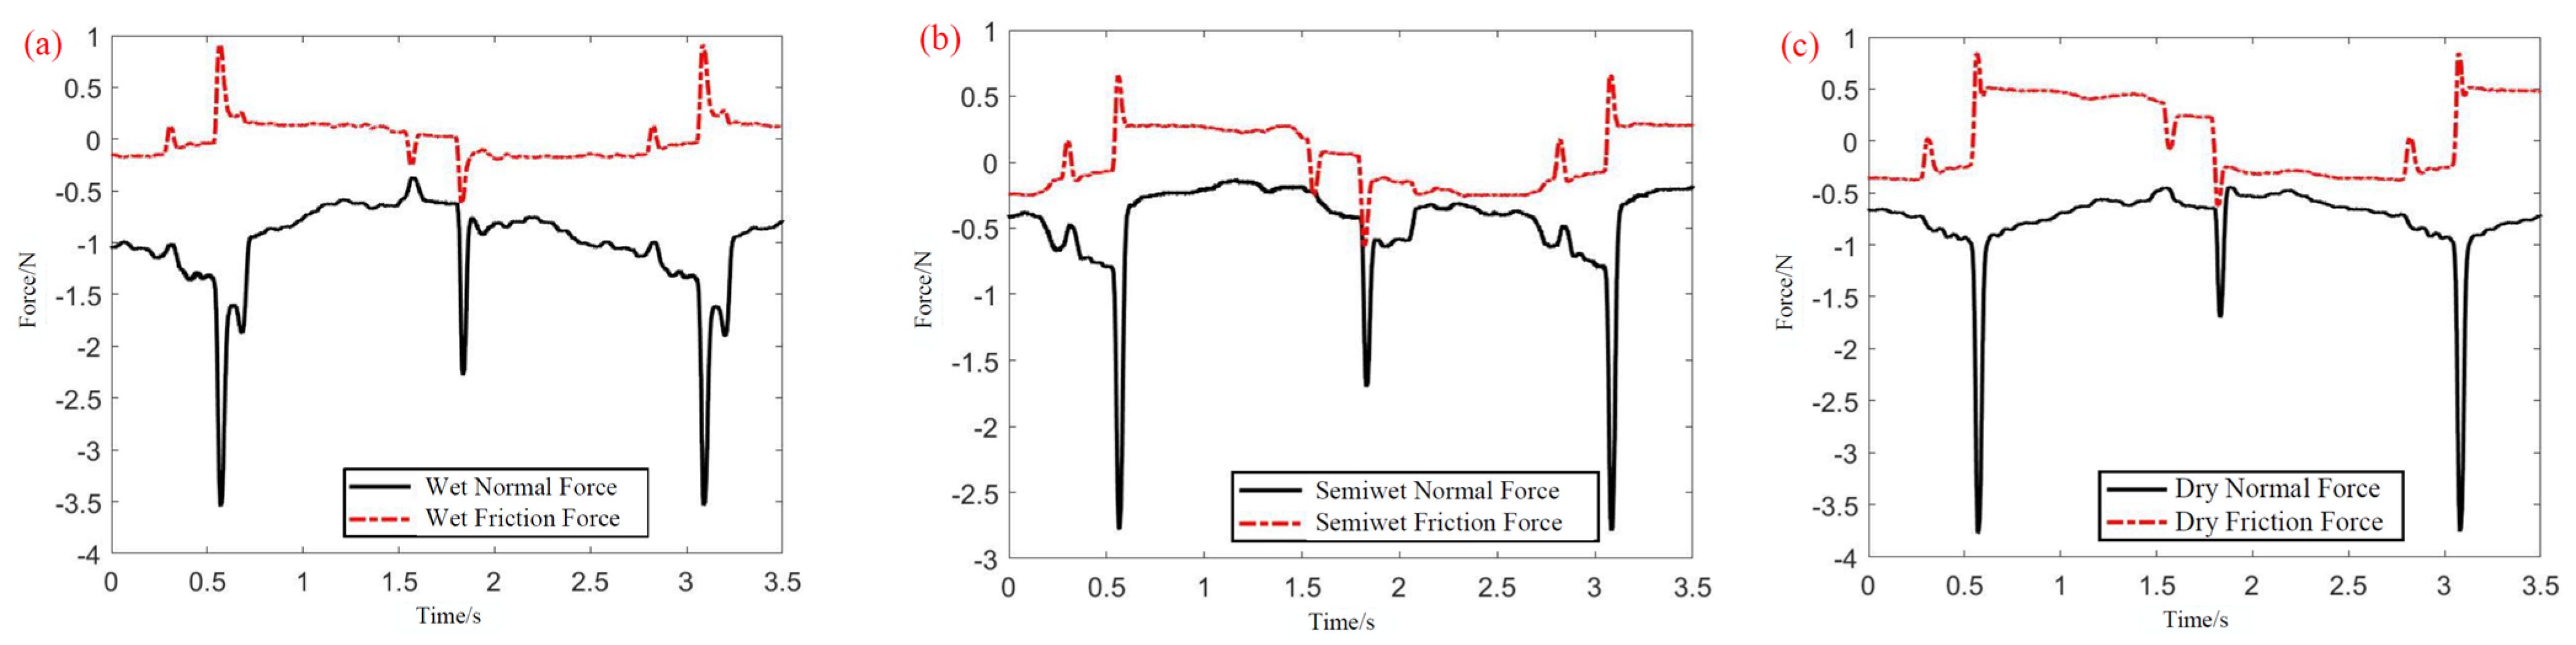
The presence of different dry and wet conditions on the vehicle glass surface significantly influenced the friction coefficient of the wiper. The steady-state friction force and normal pressure between the wiper blade and the glass were measured, and the steady-state friction coefficient was calculated. The experimental test results for the normal force and friction force under different dry and wet states, with a brushing speed of 400 mm/s, acceleration and deceleration time of 0.1 s, and pressure of 2 N, are presented in Figure 23. The calculated friction coefficients were compared with the literature [11]. The friction coefficients obtained in the three dry and wet states showed little deviation from those reported in the literature.
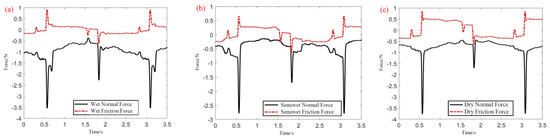
Figure 23.
Variations in normal force and frictional force under (a) wet, (b) semiwet, and (c) dry conditions.
As can be seen in Figure 23, both the amplitude of the friction force and normal force undergo significant changes during the reversal process, subsequently progressively stabilizing during the planar scraping process.
(2) Vibration experiments:
The results of the tangential and normal vibration accelerations of the vehicle wiper and test bench wiper were compared under various working conditions. Figure 24 displays the tangential vibration acceleration results for the wiper blade. The vehicle test results depicted in Figure 24a reveal that the motion cycle of the wiper blade can be divided into four stages: ① initial position reversal, ② forward scraping, ③ end position reversal, ④ reverse scraping. On the other hand, the test results of the experimental bench shown in Figure 24b indicate that the motion cycle consists of six stages: ① initial position reversal, ② forward scraping, ③ tail stagnation before reversal, ④ end position reversal, ⑤ reverse scraping, ⑥ tail stagnation before reversal. The test bench results provide a more detailed understanding of each stage of the motion of the wiper throughout the entire cycle. By analyzing the vibration distributions in the two figures, it becomes evident that the vibrations of the wipers during operation are periodic. During the inversion process, the vibration acceleration experiences two significant abrupt processes with varying peaks. The peak vibration acceleration of both the vehicle wiper and test bench wiper increases with the scraping speed. However, there are differences in the peak vibration acceleration results between the test bench and the vehicle wiper. These differences may arise from variations in the materials, structures, and system stiffness at the wiper installation location, resulting in different vibration transmission paths between the wiper and the accelerometer. Despite these differences, the overall trend of vibration generated by the operation of the wiper on both the vehicle and the test bench remains consistent. Hence, the vibration data can be compared and analyzed under different working conditions.
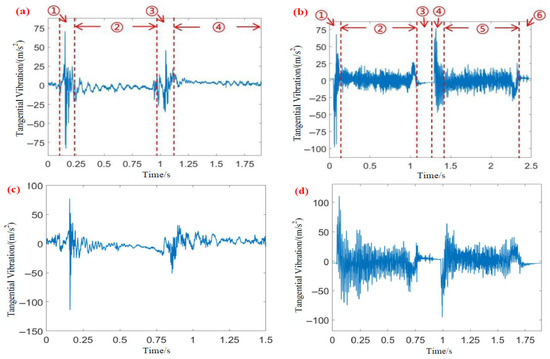
Figure 24.
The tangential vibration acceleration at the middle position of the wiper blade: (a) with the low gear of the vehicle, (b) at a bench speed of 1000 mm/s, (c) with the high gear of the vehicle, (d) at a bench speed of 1500 mm/s.
As can be seen from Figure 24, the wiper produces impact vibration after each reversal, and the vibration attenuates before the next reversal. Due to the relatively low torsional stiffness at the wiper neck and the pressure exerted on the support side of the wiper blade head, the wiper blade deforms during the reversal process. Within a period after reversal, the blade undergoes wider angular variations and vibrates, subsequently stabilizing with vibration attenuation.
(3) Noise experiments:
The time–frequency results of the wiper noise data from both the vehicle and the test bench under various working conditions were compared and analyzed separately. Figure 25 depicts the time domain diagram of the absolute noise pressure generated by the wiper blade when it came into contact with the glass surface in three different wet and dry states. These states were tested under specific conditions, including a brushing speed of 400 mm/s, an acceleration and deceleration time of 0.1 s, and a pressure of 2 N. The figure clearly shows that the amplitude of the noise pressure in the dry state exhibits periodic characteristics, whereas the periodic characteristics tend to weaken in the wet and semiwet states. This weakening can be primarily attributed to the significant differences in noise peaks during the forward and reverse stages of the blade. The nonuniform distribution of water on the glass surface in these states results in an uneven scraping state of the scraper, making it difficult to establish the characteristics of noise periodicity. In the dry state, the main noise components are the transient impact characteristics of forward and reverse inversion noise, while the noise distribution characteristics are less apparent in the wet and semiwet states. During the reversed phase in the semiwet state, the noise generated at the middle scraping position is predominantly observed, partially covering the reverse noise. Additionally, the peak noise is greater in the forward phase than in the reversed phase across all three dry and wet states.
Figure 25.
Absolute values of sound pressure in three states: (a) wet, (b) semiwet, (c) dry.
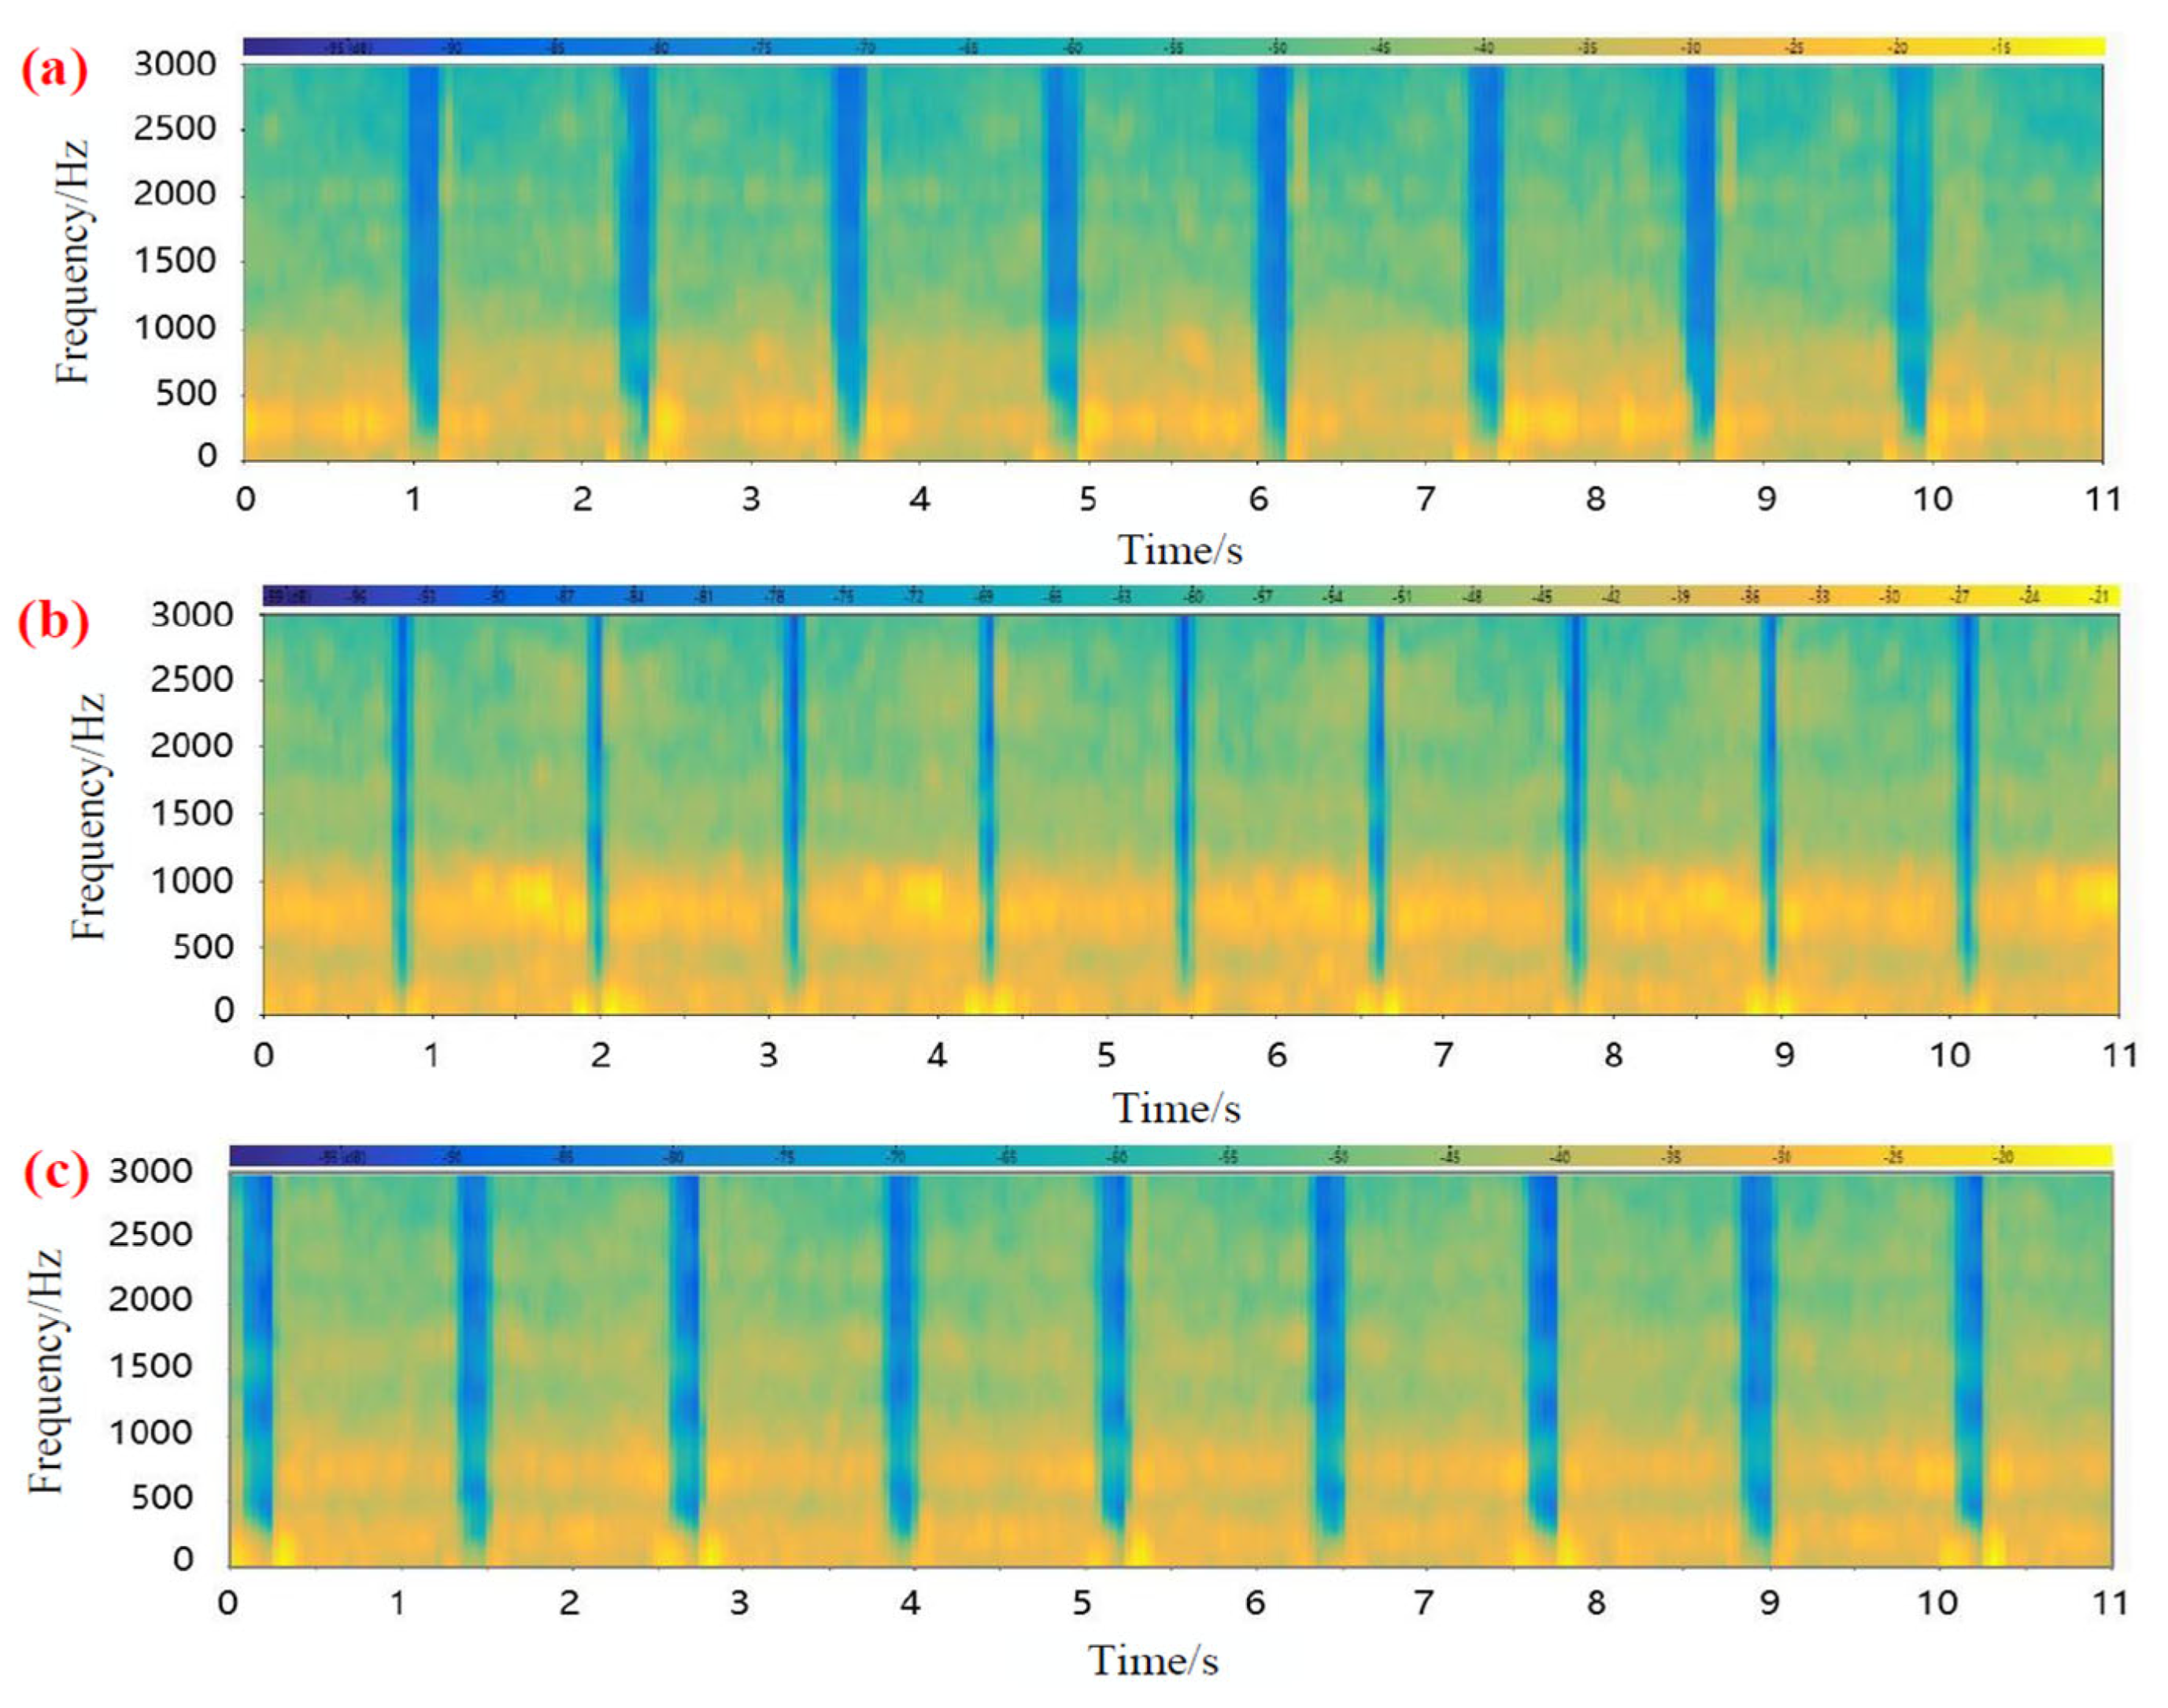
Figure 26 present the time–frequency analysis results of the wiper noise. An examination of the figure reveals that the time–frequency characteristics of the noise are significantly influenced by the three dry and wet states of the glass surface. In the wet state, noise primarily occurs in the forward stage, and its frequency distribution mainly ranges between 0 and 1000 Hz. The peak noise is observed within the 0~500 Hz range and is predominantly present throughout the entire forward stage, while the noise in the reverse stage is minimal. Similarly, in the semiwet state, noise mainly occurs in the forward stage, with a frequency distribution mainly between 0 and 1000 Hz. The peak noise, however, ranges between 800 and 1000 Hz and is also primarily present throughout the forward stage, while the noise in the reverse stage is relatively minimal. During the experiment, sharp whistles were distinctly audible when the wiper was being brushed forward, consistent with findings in the literature [14]. In the dry state, the noise distribution in the forward and reverse stages was relatively even, with the peak noise primarily consisting of the impact noise in the reverse stage within the frequency range of 0~300 Hz. Moreover, the amplitudes of the forward and reverse scraping noise were relatively small, and they were largely overshadowed by the reverse noise.

Figure 26.
Analysis results in time and time–frequency domains of sound pressures measured under three states: (a) wet, (b) semiwet, (c) dry.
During the wiper reversal process, variations in friction force cause impact vibration, which in turn generates radiated noise. There exists a strong correlation between friction force, vibration, and noise; thus, these three parameters exhibit consistent variation trends during wiper operation. This aligns with the friction-induced vibration phenomena observed during the stick–slip motion of wiper blades on glass, as demonstrated in the two-degree-of-freedom linkage model of the wiper–windshield system established by Lancioni et al. [41,42]. Wiper motion exhibits three fundamental types of undesirable vibrations: squeal, reverse noise, and chatter. Yu [28] and Qiu [43] investigated the dynamic response of the contact system and reversal impact noise using a discrete wiper–windshield model. By analyzing their results under varying friction coefficients and wiping speeds, they proposed measures to improve the vibration and noise characteristics of the contact system. Research on wiper–windshield friction noise adheres to general principles such as stick–slip vibration, stick–slip motion, modal coupling, energy feed-in, and structural coupling [4,12,22,44].
Through mechanical property, vibration, and noise experiments, qualitative and quantitative analyses revealed that the experimental system could effectively adjust and simulate various dry and wet states of a vehicle glass surface. It was also capable of simulating the overall trend of vehicle wiper vibration and the variation in vehicle wiper noise under different dry and wet states. These findings validate the feasibility of the experimental tests conducted on the wiper–windshield experimental system.
6. Conclusions
In this study, a comprehensive experimental system was developed to test the friction, vibration, and noise performance parameters of a wiper–windshield system. The experimental system successfully simulates the operational conditions of vehicle wipers while providing control, acquisition, and analysis functionalities. This experimental system contributes to further research on the theory of wiper vibration and noise.
The mechanical structure of the experimental system was constructed by designing a cross-moving mechanism, a wiper assembly mechanism, and a water spraying mechanism. Model parameters of components such as the diaphragm pump, servo motor, PLC, and other electronic and electrical components were determined through calculations. The hardware design of the test bench drive and control system was completed. Following the software system design concepts of universality, ease of use, practicality, and confidentiality, the PLC program and human–computer interaction interface were designed. The PLC serves as the lower machine of the wiper–windshield experiment system, and the servo motor and water pump are programmed using LAD language. The PC operates as the upper computer of the experiment system, and the LabVIEW human–computer interaction interface was utilized to design the login interface, parameter initialization interface, experiment test interface, and data analysis interface. Through the analysis of the mechanical property, vibration, and noise experimental results, it can be inferred that the wiper–windshield experimental system can be adjusted to simulate different dry and wet states of the glass surface of a vehicle. Furthermore, it can simulate the overall trend of vehicle wiper vibration and the variation in noise under different dry and wet states. This confirms the feasibility of conducting experimental tests using this wiper–windshield experimental system.
During wiper operation, variations in frictional force induce changes in vibration, which subsequently generates radiated noise. Therefore, this wiper–windshield experimental system can be utilized to investigate the effects of multiple factors—including dry/wet conditions, operational speed, acceleration/deceleration duration, and applied pressure—on frictional behavior. The system further enables the examination of how different wiper designs and windshield glass properties influence friction characteristics. Additionally, it facilitates research on friction evolution in long-term operational scenarios and mechanistic relationships between frictional forces and vibration-induced noise generation.
Author Contributions
Conceptualization, N.L. and Y.W.; methodology, N.L. and H.G.; software, Z.M.; validation, Z.M., S.Z. and S.H.; formal analysis, T.Y.; investigation, N.L. and Z.M.; resources, H.G.; data curation, N.L. and Z.M.; writing—original draft preparation, N.L.; writing—review and editing, Y.W.; visualization, S.Z.; supervision, Y.W.; project administration, H.G.; funding acquisition, Y.W. All authors have read and agreed to the published version of the manuscript.
Funding
This research was funded by the Project of National Natural Science Foundation of China (No. 52172371) and partly supported by the Development Plan for the Experimental Technical Workforce in Shanghai Universities and Colleges (No. SDJH0403) and the Technical Service Platform for Vibration and Noise Evaluation and Control of New Energy Vehicles (No. 18DZ2295900).
Data Availability Statement
The original contributions presented in the study are included in the article; further inquiries can be directed to the authors.
Conflicts of Interest
The authors declare no potential conflicts of interest with respect to the research, authorship, and/or publication of this article.
References
- Sharveswaran, A.; Nirmal, U. Research Development on Wiper Mechanism in Automotive Application: A Critical Review. Ct. J. Appl. Sci. Tech. 2020, 39, 133–161. [Google Scholar] [CrossRef]
- Farfan-Cabrera, L.I. Tribology of electric vehicles: A review of critical components, current state and future improvement trends. Tribol. Int. 2019, 138, 473–486. [Google Scholar] [CrossRef]
- Okura, S.; Sekiguchi, T.; Oya, T. Dynamic Analysis of blade Reversal Behavior in a Windshield Wiper System. SAE Trans. 2000, 109, 183–192. [Google Scholar]
- Dalzin, F.; Le Bot, A.; Perret-Liaudet, J.; Mazuyer, D. Tribological origin of squeal noise in lubricated elastomer–glass contact. J. Sound Vib. 2016, 372, 211–222. [Google Scholar] [CrossRef]
- Mizokami, M.; Akuto, T.; Fukuda, T.; Yanagisawa, D.; Yoshizawa, M. A fundamental study on the reversal behavior of an automobile wiper blade. In Proceedings of the ASME 2009 International Mechanical Engineering Congress and Exposition, Lake Buena Vista, FL, USA, 13–19 November 2009; Volume 11038, pp. 897–906. [Google Scholar]
- Le Rouzic, J.; Le Bot, A.; Perret-Liaudet, J.; Guibert, M.; Rusanov, A.; Douminge, L.; Bretagnol, F.; Mazuyer, D. Friction-Induced Vibration by Stribeck’s Law: Application to Wiper Blade Squeal Noise. Tribol. Lett. 2013, 49, 563–572. [Google Scholar] [CrossRef]
- Mohamad, S.M.; Othman, N.; Sharif, I.; Zain, M.Z.M.D.; Abu Bakar, A.R. Dynamic behaviour and characteristics of rubber blade car performance. Int. J. Auto. Mech. Eng. 2019, 16, 6437–6452. [Google Scholar] [CrossRef]
- Xu, Z.M.; Zhang, Y.; Liu, J.L.; He, Y.S.; Yuan, L. Sound quality analysis of wiper system noise in cars. Auto. Eng. 2014, 36, 1009–1013. [Google Scholar]
- Awang, I.M.; Abu Bakar, A.R.; Ghani, B.A.; Rahman, R.A.; Md Zain, M.Z. Complex Eigenvalue Analysis of Windscreen Wiper Chatter Noise and its Suppression by Structural Modifications. Int. J. Veh. Struct. Syst. 2009, 1, 24–29. [Google Scholar] [CrossRef]
- Awang, I.M.; Leong, C.Y.; Abu Bakar, A.R.; Abd Ghani, B.; Abd Rahman, R.; Md Zain, M.Z. Modeling and simulation of automotive wiper noise and vibration using finite element method. In Proceedings of the 2nd Regional Conference on Vehicle Engineering and Technology, Kuala Lumpur, Malaysia, 15–17 July 2008; UTM Institutional Repository: Skudai, Malaysia, 2009. [Google Scholar]
- Koenen, A.; Sanon, A. Tribological and vibroacoustic behavior of a contact between rubber and glass (application to wiper blade). Tribol. Int. 2007, 40, 1484–1491. [Google Scholar] [CrossRef]
- Reddyhoff, T.; Dobre, O.; Le Rouzic, J.; Gotzen, N.A.; Parton, H.; Dini, D. Friction Induced Vibration in Windscreen Wiper Contacts. J. Vib. Acoust. 2015, 137, 041009. [Google Scholar] [CrossRef]
- Bódai, G.; Goda, T.J. Sliding friction of wiper blade: Measurement, FE modeling and mixed friction simulation. J. Sound Vib. 2014, 70, 63–74. [Google Scholar] [CrossRef]
- Goto, S.; Takahashi, H.; Oya, T. Clarification of the mechanism of wiper blade rubber squeal noise generation. JSAE Rev. 2001, 22, 57–62. [Google Scholar] [CrossRef]
- Deleau, F.; Mazuyer, D.; Koenen, A. Sliding friction at elastomer/glass contact: Influence of the wetting conditions and instability analysis. Tribol. Int. 2009, 42, 149–159. [Google Scholar] [CrossRef]
- Min, D.; Jeong, S.; Yoo, H.H.; Kang, H.; Park, J. Experimental investigation of vehicle wiper blade’s squeal noise generation due to windscreen waviness. Tribol. Int. 2014, 80, 191–197. [Google Scholar] [CrossRef]
- Xiao, W. Wiper Strip and Glass Friction Coefficient Tester. CN102081036B, 25 July 2012. [Google Scholar]
- Zhang, J.H.; Li, Y.G.; Zhao, Y.S. The Invention Relates to a Friction Tester for Wiper Blade and Glass and a Testing Method Thereof. CN112697696B, 15 August 2023. [Google Scholar]
- Lee, S.H.; Kim, Y.H.; Sung, J.; Shin, K.C.; Oh, J.H. Investigation of the contact force distribution and dynamic behaviour of an automobile windshield wiper blade system. Proc. Inst. MechE. Part D J. Automob. Eng. 2013, 227, 1040–1052. [Google Scholar] [CrossRef]
- Sugita, M.; Yabuno, H.; Yanagisawa, D. Bifurcation phenomena of the reversal behavior of an automobile wiper blade. Nonlinear Dyn. 2012, 69, 1111–1123. [Google Scholar] [CrossRef]
- Unno, M.; Shibata, A.; Yabuno, H.; Yanagisawa, D.; Nakano, T. Analysis of the behavior of a wiper blade around the reversal in consideration of dynamic and static friction. J. Sound Vib. 2017, 393, 76–91. [Google Scholar] [CrossRef]
- Zhao, Z.; Yabuno, H.; Kamiyama, K. Dynamic Analysis of a Wiper Blade in Consideration of Attack Angle and Clarification of the Jumping Phenomenon. Appl. Sci. 2022, 12, 4112. [Google Scholar] [CrossRef]
- Zhang, L.J.; Xu, F.; Wang, X.B. Experimental investigation into friction induced noise of automotive wiper system. J. Tongji Univ. (Nat. Sci.) 2010, 38, 1062–1068. [Google Scholar]
- Chen, Q.S.; Dong, D.W.; Yang, B.; Liu, M.; Tan, X.; Wang, J.X. Experimental investigation of the vibration and noise by affront wiper. Mech. Sci. Tech. Aer. Eng. 2010, 29, 1628–1632. [Google Scholar]
- Huang, G.T.; Dong, D.W.; Yan, B.; Zhang, S.J.; Tang, Q. Experimental investigation of vibration of automotive wiper system. Mech. Eng. Auto. 2017, 29, 136–141. [Google Scholar]
- QC T 44-2009; Vehicle-Windshield Window Wiper of Motor. China Planning Press: Beijing, China, 2009.
- GB 15085-2013; Motor Vehicles-Windscreen Wiper and Washer Systems-Performance Requirements and Test Methods. Standards Press of China: Beijing, China, 2013.
- Yu, Z. Dynamic Analysis of Wiper System and Noise Prediction of Blade Reverse. Master’s Thesis, Beijing Institute of Technology, Beijing, China, 2015. [Google Scholar]
- Mao, Z.A.; Wang, Y.S.; Guo, H.; Sun, P.; Yuang, T.; Zheng, L.H.; Yang, X.; Zhu, B.Y.; Xu, X.H. An Experimental Device for Testing the Friction Vibration Noise of Wipers and Wind Windows. CN113820001B, 18 July 2023. [Google Scholar]
- GB/T 3190-2008; Wrought Aluminium and Aluminium Alloy—Chemical Composition. Standards Press of China: Beijing, China, 2008.
- Weber, C.A. Windshield Wiper Assembly. U.S. Patent 8819889B2, 2 September 2014. [Google Scholar]
- Wang, M.J. Shanghai Flood Control Manual; Fudan University Press: Shanghai, China, 2018. [Google Scholar]
- Cerezo, J.M.; Leon, S.; Vega, E.V.A. CQMIH PLC simulator host-link communications protocol experience. In Proceedings of the 2016 Technologies Applied to Electronics Teaching (TAEE), Seville, Spain, 22–24 June 2016; IEEE International Frequency Control Symposium and Exposition: Miami, FL, USA, 2016; pp. 1–6. [Google Scholar]
- GBT 40329–2021; Electrical Equipment and System of Industrial Machines-PLC Programme in Numerical Control System. The State Standard of the People’s Republic of China: Beijing, China, 2021.
- Wang, A.G. Siemens S7-200PLC Programming Example; Publishing House of Electronics Industry: Beijing, China, 2011. [Google Scholar]
- Chen, S.; Chan, Y.; Huang, S.W.; Yu, Z.T.; Song, Y.K.; Gao, S.L. Design idea and development path of simulation application software for new power system. Autom. Elec. Pow. Sys. 2022, 46, 75–86. [Google Scholar]
- Zhao, Z.X.; Fan, X.B.; Liu, X.P. A Review of Data Acquisition System based on LabVIEW. Int. J. Plant. Eng. Manag. 2018, 23, 134–148. [Google Scholar]
- Xu, S.H.; Zhang, H.B.; Wu, Z.D.; He, X.D.; Yan, S.K.; Li, Z.P. Design of mechanical vibration test system based on virtual instruments. J. Qiqihar Univ. (Nat. Sci. Ed.) 2022, 38, 16–20. [Google Scholar]
- Gong, E.D.; Ding, Y.F. Research on machine visual inspection system based on LabVIEW. J. Chang. Univ. Sci. Technol. (Nat. Sci. Ed.) 2017, 40, 75–77+81. [Google Scholar]
- Yuan, D.K.; Lan, H.Q.; Hu, Z.J. Modelling and simulation of direct current motor control based on LabVIEW. Mechatronics 2021, 27, 37–43. [Google Scholar]
- Lancioni, G.; Lenci, S.; Galvanetto, U. Non-linear dynamics of a mechanical system with a frictional unilateral constraint. Int. J. Non Linear Mech. 2009, 44, 658–674. [Google Scholar] [CrossRef]
- Lancioni, G.; Lenci, S.; Galvanetto, U. Dynamics of windscreen wiper blades: Squeal noise, reversal noise and chattering. Int. J. Non Linear Mech. 2016, 80, 132–143. [Google Scholar] [CrossRef]
- Qin, W.J.; Yu, Z.; Hou, Q.D. Investigation of the dynamic behaviour of an automobile wiper system. Int. J. Vehicle Des. 2016, 72, 162–174. [Google Scholar] [CrossRef]
- Nguyen, D.T.; Wandersman, E.; Prevost, A.; Chenadec, Y.L.; Fretigny, C.; Chateauminois, A. Non Amontons-Coulomb local friction law of randomly rough contact interfaces with rubber. Europhys. Lett. 2013, 104, 5580–5596. [Google Scholar] [CrossRef]


Disclaimer/Publisher’s Note: The statements, opinions and data contained in all publications are solely those of the individual author(s) and contributor(s) and not of MDPI and/or the editor(s). MDPI and/or the editor(s) disclaim responsibility for any injury to people or property resulting from any ideas, methods, instructions or products referred to in the content. |
© 2025 by the authors. Licensee MDPI, Basel, Switzerland. This article is an open access article distributed under the terms and conditions of the Creative Commons Attribution (CC BY) license (https://creativecommons.org/licenses/by/4.0/).