Article

Dynamics-Based Calculation of the Friction Power Consumption of a Solid Lubricated Bearing in an Ultra-Low Temperature Environment

1
School of Mechatronics Engineering, Henan University of Science and Technology, Luoyang 471003, China
2
China Aviation Optical-Electrical Technology Co., Ltd., Luoyang 471003, China
*
Author to whom correspondence should be addressed.
Lubricants 2023, 11(9), 372; https://doi.org/10.3390/lubricants11090372
Submission received: 12 August 2023 / Revised: 31 August 2023 / Accepted: 2 September 2023 / Published: 4 September 2023
(This article belongs to the Special Issue Coatings and Lubrication in Extreme Environments)

Abstract

:
Bearings operating in ultra-low-temperature environments are commonly lubricated with solid lubricants. This study first focused on measuring the traction coefficients of molybdenum disulfide (MoS2) solid lubricant under various working conditions. Based on this data, the friction power consumption of the bearings was calculated and analyzed using a dynamic model. Additionally, experimental verification of the bearing friction power consumption in ultra-low temperature environments was conducted. The research findings will serve as a foundation for the application of solid lubrication bearings in ultra-low-temperature environments.

1. Introduction

In ultra-low-temperature environments, traditional oil and grease lubrication methods are inadequate for meeting the requirements of bearings in liquefied natural gas transport pumps. Instead, solid lubrication becomes necessary [1]. Solid lubrication involves applying solid lubricating materials to the contact surfaces to provide lubrication [2]. Some commonly used solid lubricating materials include molybdenum disulfide (MoS2), silver (Ag), and polytetrafluoroethylene (PTFE) [3]. MoS2 exhibits excellent wear resistance and lubrication performance at low temperatures, making it suitable for a wide range of temperature conditions [4,5]. Ag, on the other hand, does not exhibit brittleness and maintains good lubrication performance even in low-temperature environments [6]. PTFE possesses adaptability to extreme environments and offers repeatability in friction coefficient. By modifying the friction surface, PTFE can enhance the wear resistance of contact pairs and reduce the friction coefficient [7].
Solid lubricants are commonly used in the field of bearings. Kwak et al. [8] conducted a ball disk experiment using Ag and PTFE and obtained the traction curve of the lubricant. They also verified the hydrodynamic friction model, considering the hydrodynamic effect at low temperatures. Burris [9] gained insight into the cryogenic tribological behavior of PTFE using a well-studied linear reciprocating tribometer: the friction coefficient increased monotonically with decreased temperature. Hubner et al. [10] presented low temperature investigations on the tribological behavior of polymers and composites, as well as TiN and carbon coating systems. Zhang et al. [11] obtained the formulas of the elastohydrodynamic traction coefficients of four Chinese aviation lubricating oils through a great number of elastohydrodynamic traction tests. Yukhno et al. [12] mixed various polymer resins with MoS2 and graphite to form a mixed solid lubricating compound that can deposit well on various metal surfaces and form coatings, and conducted low-temperature friction and wear experiments on the above coatings. Cao et al. [13] studied the friction performance of silver-plated bearings under dry friction and compound lubrication with lubricating oil and grease. They found that the friction coefficient of the bearings changed smoothly. Duan et al. [14] investigated the solid lubrication technology of joint bearings and concluded that using a composite lubricant of graphite and MoS2 improved the bearing capacity and lubricity. Lu et al. [15] conducted tests on the friction coefficient of the Pb-Sn alloy coating and demonstrated its good antifriction performance. Being a key component of mechanical products, bearings are subject to power consumption caused by friction during operation. Christian et al. [16] proposed a calculation model for estimating the friction power consumption resulting from cage slippage, particularly under conditions of high speed and poor lubrication. Popescu et al. [17] used the ball forces and moments equilibrium and original models using four possible approaches and proposed the total friction torque and the corresponding dissipated power equations in an angular contact ball bearing operating in dry conditions. Burris et al. [18] reviewed the challenges of low friction measurements and presented a robust reversal technique that eliminates misalignment bias. Experiments with controlled misalignment angles demonstrate the bias sensitivity and validate its elimination using a low-uncertainty tribometer in conjunction with the described reversal technique. Deng et al. [19,20] conducted an analysis of the influence of structure and working condition parameters on the friction torque and fluctuation of gyro ball bearings based on dynamics and thermodynamics. They also carried out experimental verification. Li et al. [21] built a theoretical analysis model for calculating the friction torque on high-speed precision micro ball bearings based on thermal elastohydrodynamic lubrication theory and verified the model by means of a high-speed precision micro bearing machine. Cui et al. [22] established the nonlinear dynamic differential equations of the control moment gyros bearing unit with six degrees of freedom based on the tribology and dynamics of rolling bearings, used the GSTIFF (gear stiff) integration algorithm with variable step to solve the dynamic differential equations, and analyzed the influences of different working environments on the amplitude and fluctuation of bearing friction torque. Liu et al. [23] established dynamic differential formulas for double-row angular contact ball bearings based on the dynamic theory of rolling bearings. They analyzed the impact of bearing working conditions and structural parameters on its friction power consumption. Yu et al. [24] used a home-built cryogenic temperature spherical plain bearing tester to conduct tribological tests on the home-made self-lubricating spherical plain bearing suitable for low-temperature working conditions and investigated the effects of temperature and the normal load on the friction coefficients. They also conducted experiments on the durability of the spherical plain bearing at cryogenic temperatures. Qiu [25] analyzed the change in the low-temperature structure of bearings by finite element software, cited the friction torque calculation model of the existing bearing, and analyzed the trend of bearing friction torque under low temperatures. Zheng et al. [26] elaborated on the development process of the theoretical calculation of ball bearing friction torque through theoretical and experimental research. They also proposed future research directions for ball bearing friction torque. Gao et al. [27] analyzed the main factors contributing to the abnormal fluctuation of batch dynamic friction torque of a precision shaft in a low-temperature environment and the influence of bearing guide clearance and cage pocket clearance on cage motion. They also optimized through mathematical statistics and realized the stable operation of this model of precision shafting at low temperatures. While scholars have extensively studied the friction characteristics of solid lubricating materials and the friction torque characteristics of bearings, there is insufficient research on the friction power consumption of bearings. Particularly, research on the friction work of solid lubricating bearings in ultra-low temperature environments based on dynamics is still scarce.
This study analyzes the friction power consumption characteristics of solid-lubricated bearings operating in ultra-low temperature environments based on the dynamics of rolling bearings. The findings provide a theoretical basis for calculating the friction power consumption of solidly lubricated bearings in ultra-low-temperature environments.

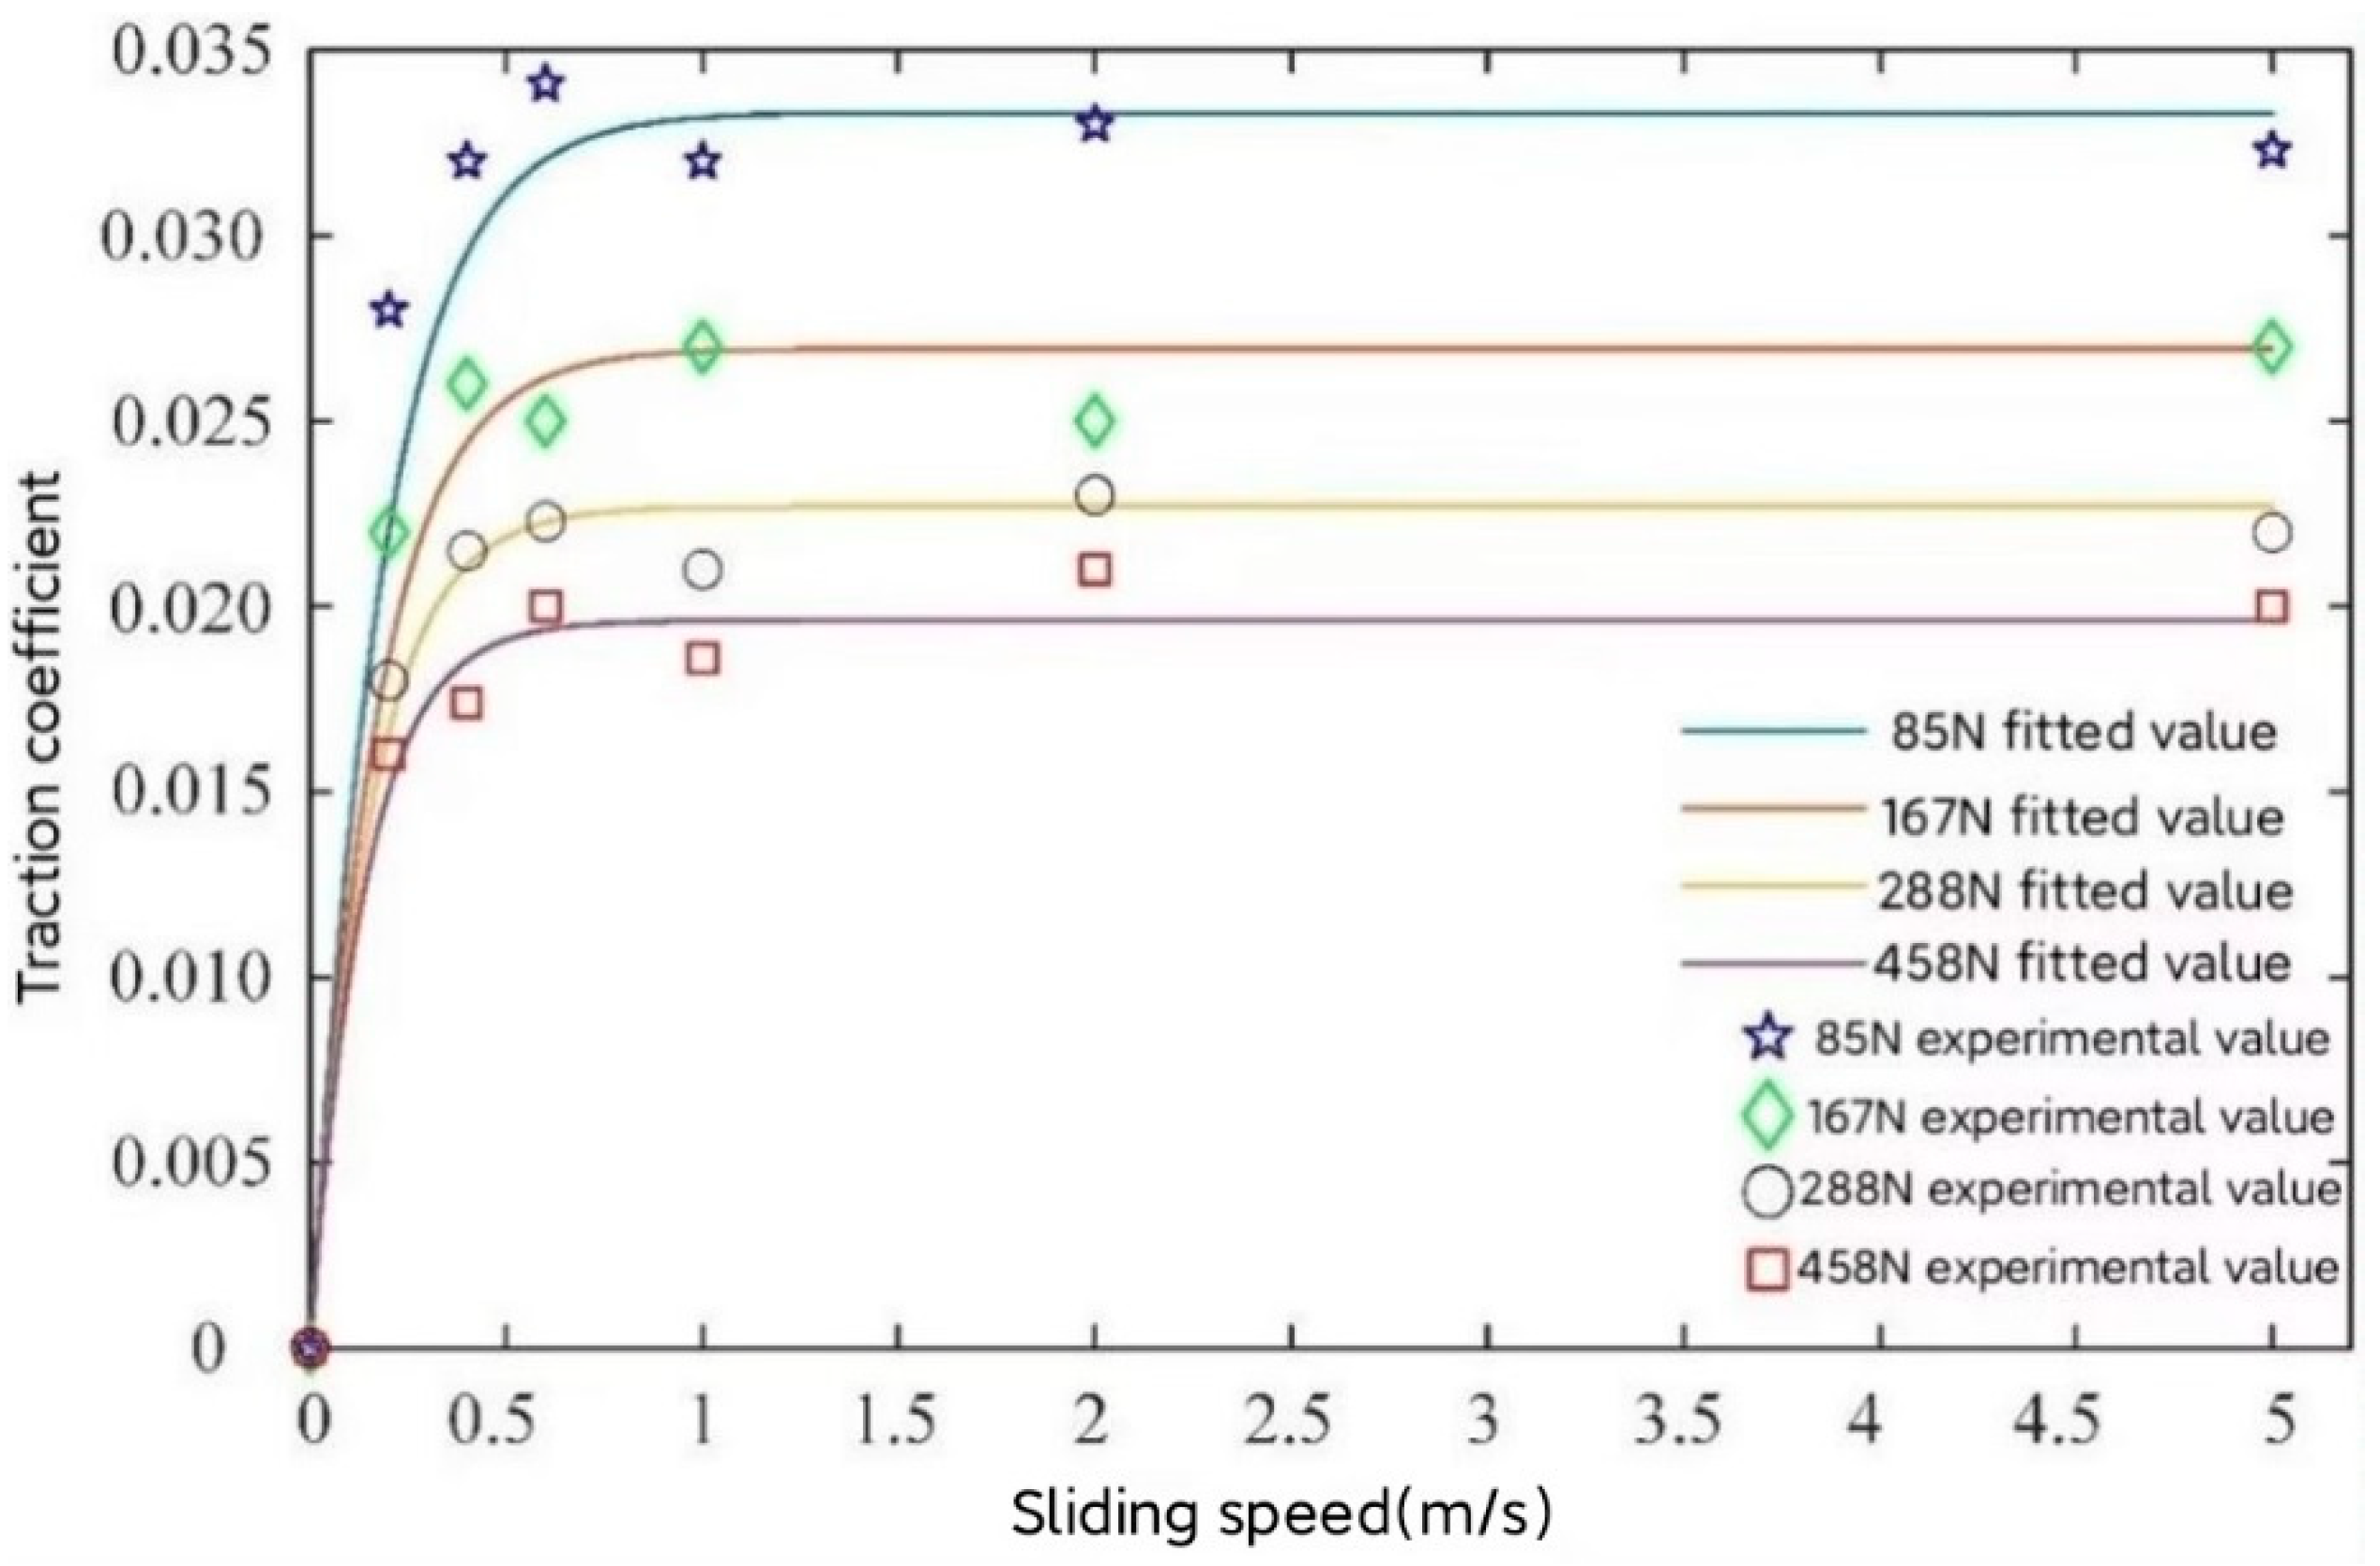
2. Calculation of Traction Coefficient of Solid Lubricant

The traction coefficient μ of solid lubricant is a crucial parameter in the dynamic analysis of bearings. To accurately determine the traction force of MoS2 solid lubricant under different working conditions, the traction force was measured using a low-temperature, multifunctional, high-precision aerospace bearing material performance simulation test machine developed by Henan University of Science and Technology. The experimental results were used to derive an engineering application model for the traction coefficient μ [28]. According to the experiments conducted by foreign scholars on the solid friction between cast iron and steel, as well as cast iron and cast iron, the traction coefficient of solid materials exhibits a curve that varies with sliding speed. The relationship between the traction coefficient and the sliding speed can be described by the following functional form [29]:
μ = ( A + B Δ U ) e C Δ U + D
The traction coefficient of MoS2 is measured using a ball-disk test machine. The ball sample simulates a ball, while the disk sample simulates a raceway. G95Cr18 bearing steel is used for both the ball and disk samples. The disk sample is coated with a physical vapor deposition MoS2 coating based on G95Cr18, and the ball has an accuracy grade of G10.
The test conditions include external loads of W = 85 N, 167 N, 288 N, and 458 N, as well as average rolling speed U = 10   m / s and sliding speed Δ U = 0 ~ 5   m / s . By averaging the friction coefficient, four curves of the friction coefficient changing with sliding speed are obtained. And then, by substituting the data corresponding to these four curves into Formula (1), the fitting values of four groups of coefficients A , B , C and D are obtained. It can be observed in Table 1 that the corresponding coefficients vary under different loads. Therefore, A , B , C and D are related to load parameter W .
For the sake of analysis convenience, the mathematical model of the dimensionless expression of the load is defined as follows:
W ¯ = W / ( E * R 2 )
where E is the equivalent elastic modulus; R is the equivalent radius of curvature. There is an approximately exponential relationship between coefficients A , B , C , D and dimensionless parameters, which is expressed as follows:
{ A = A 0 W ¯ A 1 B = B 0 W ¯ B 1 C = C 0 W ¯ C 1 D = D 0 W ¯ D 1
The fitting coefficients with strong correlation in Table 1 are substituted by Formula (3), and then the regression solutions to Formula (1) are carried out. The results are observed in Table 2. By substituting the coefficient fitting values from Table 2 into Formula (1), the formula for determining the traction coefficient of MoS2 coating can be derived.
In practical applications, the calculated value of the traction coefficient can be calculated by substituting the working condition parameters into the above derivation formula. A graph illustrating the relationship between the calculated value and the measured value of the traction coefficients is depicted in Figure 1.
As depicted in Figure 1, each traction coefficient curve initially increases and then slightly decreases with the rise in sliding speed. The traction coefficient decreases with an increase in load.
The experimental findings demonstrate that the traction properties of solid lubricants are influenced by the applied load. Moreover, the solid lubricating material necessitates peeling off under a specific force and forming a transfer film to facilitate the lubrication of the contact pair surface.
The relative error between the calculated value and the experimental value is small. The residual error is not more than 0.0026, and the correlation coefficient is above 0.95. The results show that the predicted value meets the requirements of the engineering application.

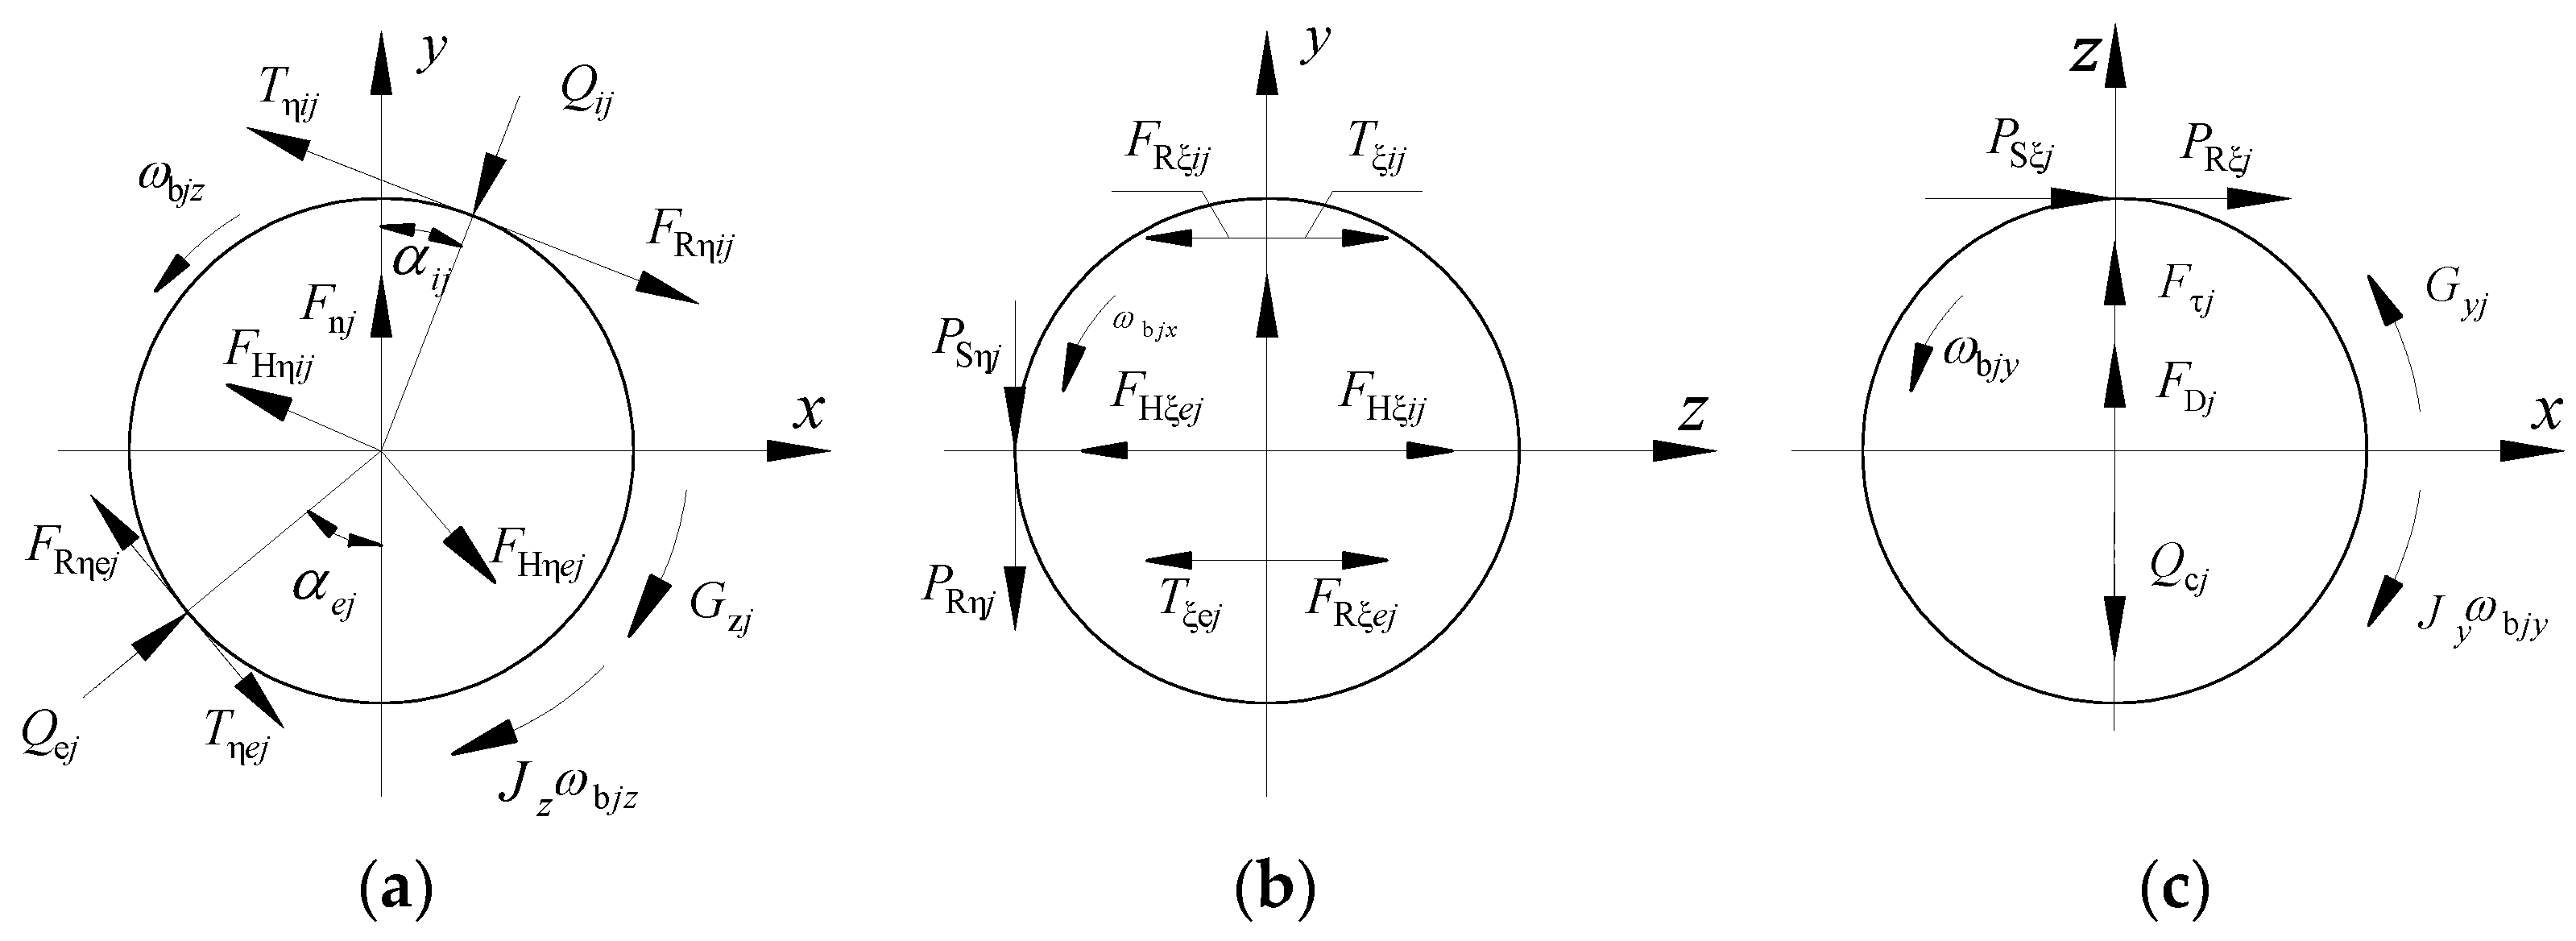
3. Bearing Dynamics Modeling

3.1. Differential Formula of Ball

Figure 2 depicts the force of the ball, and the dynamic differential equation of balls is as follows:
{ m b x ¨ b =   Q e j sin α e j Q i j sin α i j + T η e j cos α e j T η i j cos α i j F R η e j cos α e j +   F R η i j cos α i j + F H η e j cos α e j F H η i j cos α i j + P S ξ j + P R ξ j m b y ¨ b =   Q e j cos α e j Q i j cos α i j T η e j sin α e j + T η i j sin α i j + F R η e j sin α e j   F R η i j sin α i j F H η e j sin α e j + F H η i j sin α i j + F n j P S η j P R η j m b z ¨ b =   T ξ i j T ξ e j F R ξ i j + F R ξ e j + F H ξ i j F H ξ e j Q c j + F D j + F τ j I b ω ˙ b x =   ( T ξ i j F R ξ i j ) cos α i j D w 2 + ( T ξ e j F R ξ e j ) cos α e j D w 2   ( P S η j + P R η j ) D w 2 J x ω ˙ x j I b ω ˙ b y   I b ω b z θ ˙ b = ( F R ξ i j T ξ i j ) sin α i j D w 2 + ( F R ξ e j T ξ e j ) sin α e j D w 2     G y j ( P S ξ j + P R ξ j ) D w 2 J y ω ˙ y j I b ω ˙ b z +   I b ω b y θ ˙ b = ( T η i j F R η i j ) D w 2 + ( T η e j F R η e j ) D w 2 G z j J z ω ˙ z j
where m b is the mass of the ball; x ¨ b , y ¨ b and z ¨ b are the ball acceleration; I b is the moment of inertia of the ball; F n j and F τ j are components of inertia force during the motion of the ball; J x , J y and J z are the components of the moment of inertia of the ball in inertial coordinate system; G y j and G z j are the components of inertia moment during the motion of the ball in inertial coordinate system; ω b x , ω b y and ω b z are angular velocities of the ball; ω ˙ b x , ω ˙ b y and ω ˙ b z are the angular acceleration of the ball; θ ˙ is the revolution speed of the ball.

3.2. Differential Formula of Cage

The cage guide mode studied in this study is the inner ring guide. The dynamic differential equation of the cage is as follows:
{ m c x ¨ c = j = 1 Z ( P S η j + P R η j ) m c y ¨ c = j = 1 Z [ ( P S ξ j + P R ξ j ) cos φ j + Q c j sin φ j ] + F c y m c z ¨ c = j = 1 Z [ ( P S ξ j + P R ξ j ) sin φ j Q c j cos φ j ] + F c z I c x ω ˙ c x ( I c y I c z ) ω c y ω c z = j = 1 Z [ ( P S ξ j + P R ξ j ) D w 2 Q c j d m 2 ] + M c x I c y ω ˙ c y ( I c z I c x ) ω c z ω c x = j = 1 Z ( P S η j + P R η j ) d m 2 sin φ j I c z ω ˙ c z ( I c x I c y ) ω c x ω c y = j = 1 Z ( P S η j + P R η j ) d m 2 cos φ j
where m c is the mass of the cage; x ¨ c , y ¨ c and z ¨ c are the acceleration of the cage; I c x , I c y and I c z are the three main moments of inertia of the cage; ω c x , ω c y and ω c z are angular velocities of the cage; ω ˙ c x , ω ˙ c y and ω ˙ c z are the angular acceleration of the cage.

3.3. Differential Formula of Inner Ring

The inner ring of the rolling bearing mainly bears the force of the ball, cage, lubricating substance, and external load in the contact area, from which the dynamic differential equation of the bearing inner ring can be derived as follows:
{ m i x ¨ i = F x + j = 1 Z ( Q i j sin α i j F R η i j cos α i j ) m i y ¨ i = F y + j = 1 Z [ ( Q i j cos α i j + F R η i j sin α i j ) cos φ j + ( T ξ i j F R ξ i j ) sin φ j ] m i z ¨ i = F z j = 1 Z [ ( Q i j cos α i j + F R η i j sin α i j ) sin φ j + ( T ξ i j F R ξ i j ) cos φ j ] I i y ω ˙ i y ( I i z I i x ) ω i z ω i x = M y + j = 1 Z [ r j ( Q i j sin α i j F R η i j cos α i j ) sin φ j + D W 2 f i T ξ i j sin α i j cos φ j ] I i z ω ˙ i z ( I i x I i y ) ω i x ω i y = M z + j = 1 Z [ r j ( Q i j sin α i j F R η i j cos α i j ) cos φ j D W 2 f i T ξ i j sin α i j sin φ j ]
where m i is the mass of the inner ring; x ¨ i , y ¨ i and z ¨ i are the acceleration of the inner ring; I i x , I i y and I i z are the principal moments of inertia of the inner ring; ω i x , ω i x and ω i x are the angular velocity of the inner ring; ω ˙ i y and ω ˙ i y are the angular acceleration of the inner ring; F x , F y , F z , M y and M z are the supporting forces and moments of the bearing to the rotor; r j is the radial distance between the contact point of the ball and the raceway of the inner ring and the centroid of the inner ring, r j = 0.5 d m 0.5 D w f i cos α i j .

4. Source and Theoretical Calculation of Friction Power Consumption

The friction power consumption of ball bearings includes elastic hysteresis friction power consumption, differential sliding friction power consumption, spin sliding friction power consumption, and friction power consumption caused by sliding between the ball and cage and the cage and guide surface. The total friction power consumption of the bearing is the sum of all these types of friction power consumption. This section utilizes a local method to calculate the friction power consumption of each contact area [30].

4.1. Friction Power Consumption Caused by Elastic Lag between Ball and Raceway

Because the pressure distribution in the elliptical contact area between the ball and the raceway is uneven and the energy conducted in the loading area and the unloading area is different, the calculation formula for friction power consumption caused by elastic hysteresis is as follows:
H E i ( e ) = j = 1 Z M E i ( e ) j ω b j
M E i ( e ) j = d m 4 ( 1 γ 0 2 ) φ i ( e ) j β 0
γ 0 = D w cos α 0 / d m
where ω b j is the rotational angular velocity of the ball; α 0 is the original contact angle; β 0 is the elastic lag coefficient, and take β 0 = 0.007 ; Z is the number of balls.
φ i ( e ) j = 9 128 × ( 2 k π μ ) i ( e ) × 1 V i ( e ) × ( 8 3 ρ i ( e ) ) 2 / 3 × E 1 / 3 Q i ( e ) j 4 / 3
( 2 k π μ ) i ( e ) = 2 K i ( e ) ( e ) π ( π 2 k i ( e ) 2 L i ( e ) ( e ) ) 1 / 3
V i ( e ) = ( 2 L i ( e ) ( e ) π k i ( e ) ) 1 / 3
k i ( e ) = a i ( e ) b i ( e )
E = 4 ( 1 μ b ) 2 E b + 4 ( 1 μ i ( e ) ) 2 E i ( e )
where K i ( e ) ( e ) and L i ( e ) ( e ) are the first and second kinds of elliptic integrals; μ b is Poisson’s ratio of the ball; μ i ( e ) is Poisson’s ratio of rings; a i ( e ) and b i ( e ) are the long and short semi-axes of the contact ellipse; E b is the elastic modulus of the ball; E i ( e ) is the elastic modulus of the ring; ρ i ( e ) and is the sum of the principal curvatures of the contact points between the ball and the rings. It is provided by reference [31] for the solution of ρ i ( e ) .

4.2. Friction Power Consumption Caused by Differential Sliding between Ball and Raceway

The calculation formula for friction power consumption caused by differential sliding between the ball and the raceway is as follows:
H D i ( e ) = j = 1 Z M D i ( e ) j ω b j
M D i ( e ) j = d m ( 1 γ 2 ) 2 D W Ψ D i ( e ) j μ s
Ψ D i ( e ) j = 0.04025 × U i ( e ) r c i ( e ) × ( 3 E 8 ρ i ( e ) ) 2 / 3 × F i ( e ) j
U i ( e ) = ( 2 k i ( e ) 2 L i ( e ) π ) 1 / 3
r c i ( e ) = f i ( e ) D w 0.5 + f i ( e )
where μ s is the traction coefficient of solid lubricant.

4.3. Friction Power Consumption Caused by Ball Spin Sliding

The calculation formula for the friction power consumption of the ball due to spin sliding is as follows:
H S i ( e ) = j = 1 Z M S i ( e ) j ω s i ( e ) j
M S i ( e ) j = 3 8 × μ s × L i ( e ) ( e ) a i ( e ) j Q i ( e ) j sin α i ( e ) j
where α i ( e ) is the working contact angle and ω s i ( e ) is the spin angular velocity of the ball.

4.4. Friction Power Consumption Caused by Sliding between Cage and Guide Surface

The calculation formula for friction power consumption caused by sliding between the cage and guide surface is as follows:
H c r = M c r w c
M c r = 1.38 × 10 7 W f c n i ( e ) c 2 ε D 2 i ( e ) ( 1 r ) 2 × 10 3
where ω c is the angular velocity of the cage; n i ( e ) c is the speed of the ring relative to the cage; D 2 i ( e ) is the flange diameter of the guide ring; W is the weight of the cage; f c is the friction coefficient between the cage and the bearing steel.

4.5. Friction Power Consumption Caused by Contact between Ball and Cage

The calculation formula for friction power consumption caused by contact between the ball and the cage is as follows:
H c b = M c b ω b
M c b = d m 4 ( 1 r 2 ) sin [ α 0 + a r c t g ( D w sin α 0 r 1 ) ] W f c
where r 1 = 1 / 2 d m ( 1 r ) .

4.6. Total Friction Power Consumption of Ball Bearings

The formula for calculating the total friction power consumption of ball bearings is as follows:
H t o t a l = H E i ( o ) + H D i ( o ) + H S i ( o ) + H c r + H c b
where H t o t a l is the total friction power consumption of the bearing.

5. Influencing Factors of Friction Power Consumption

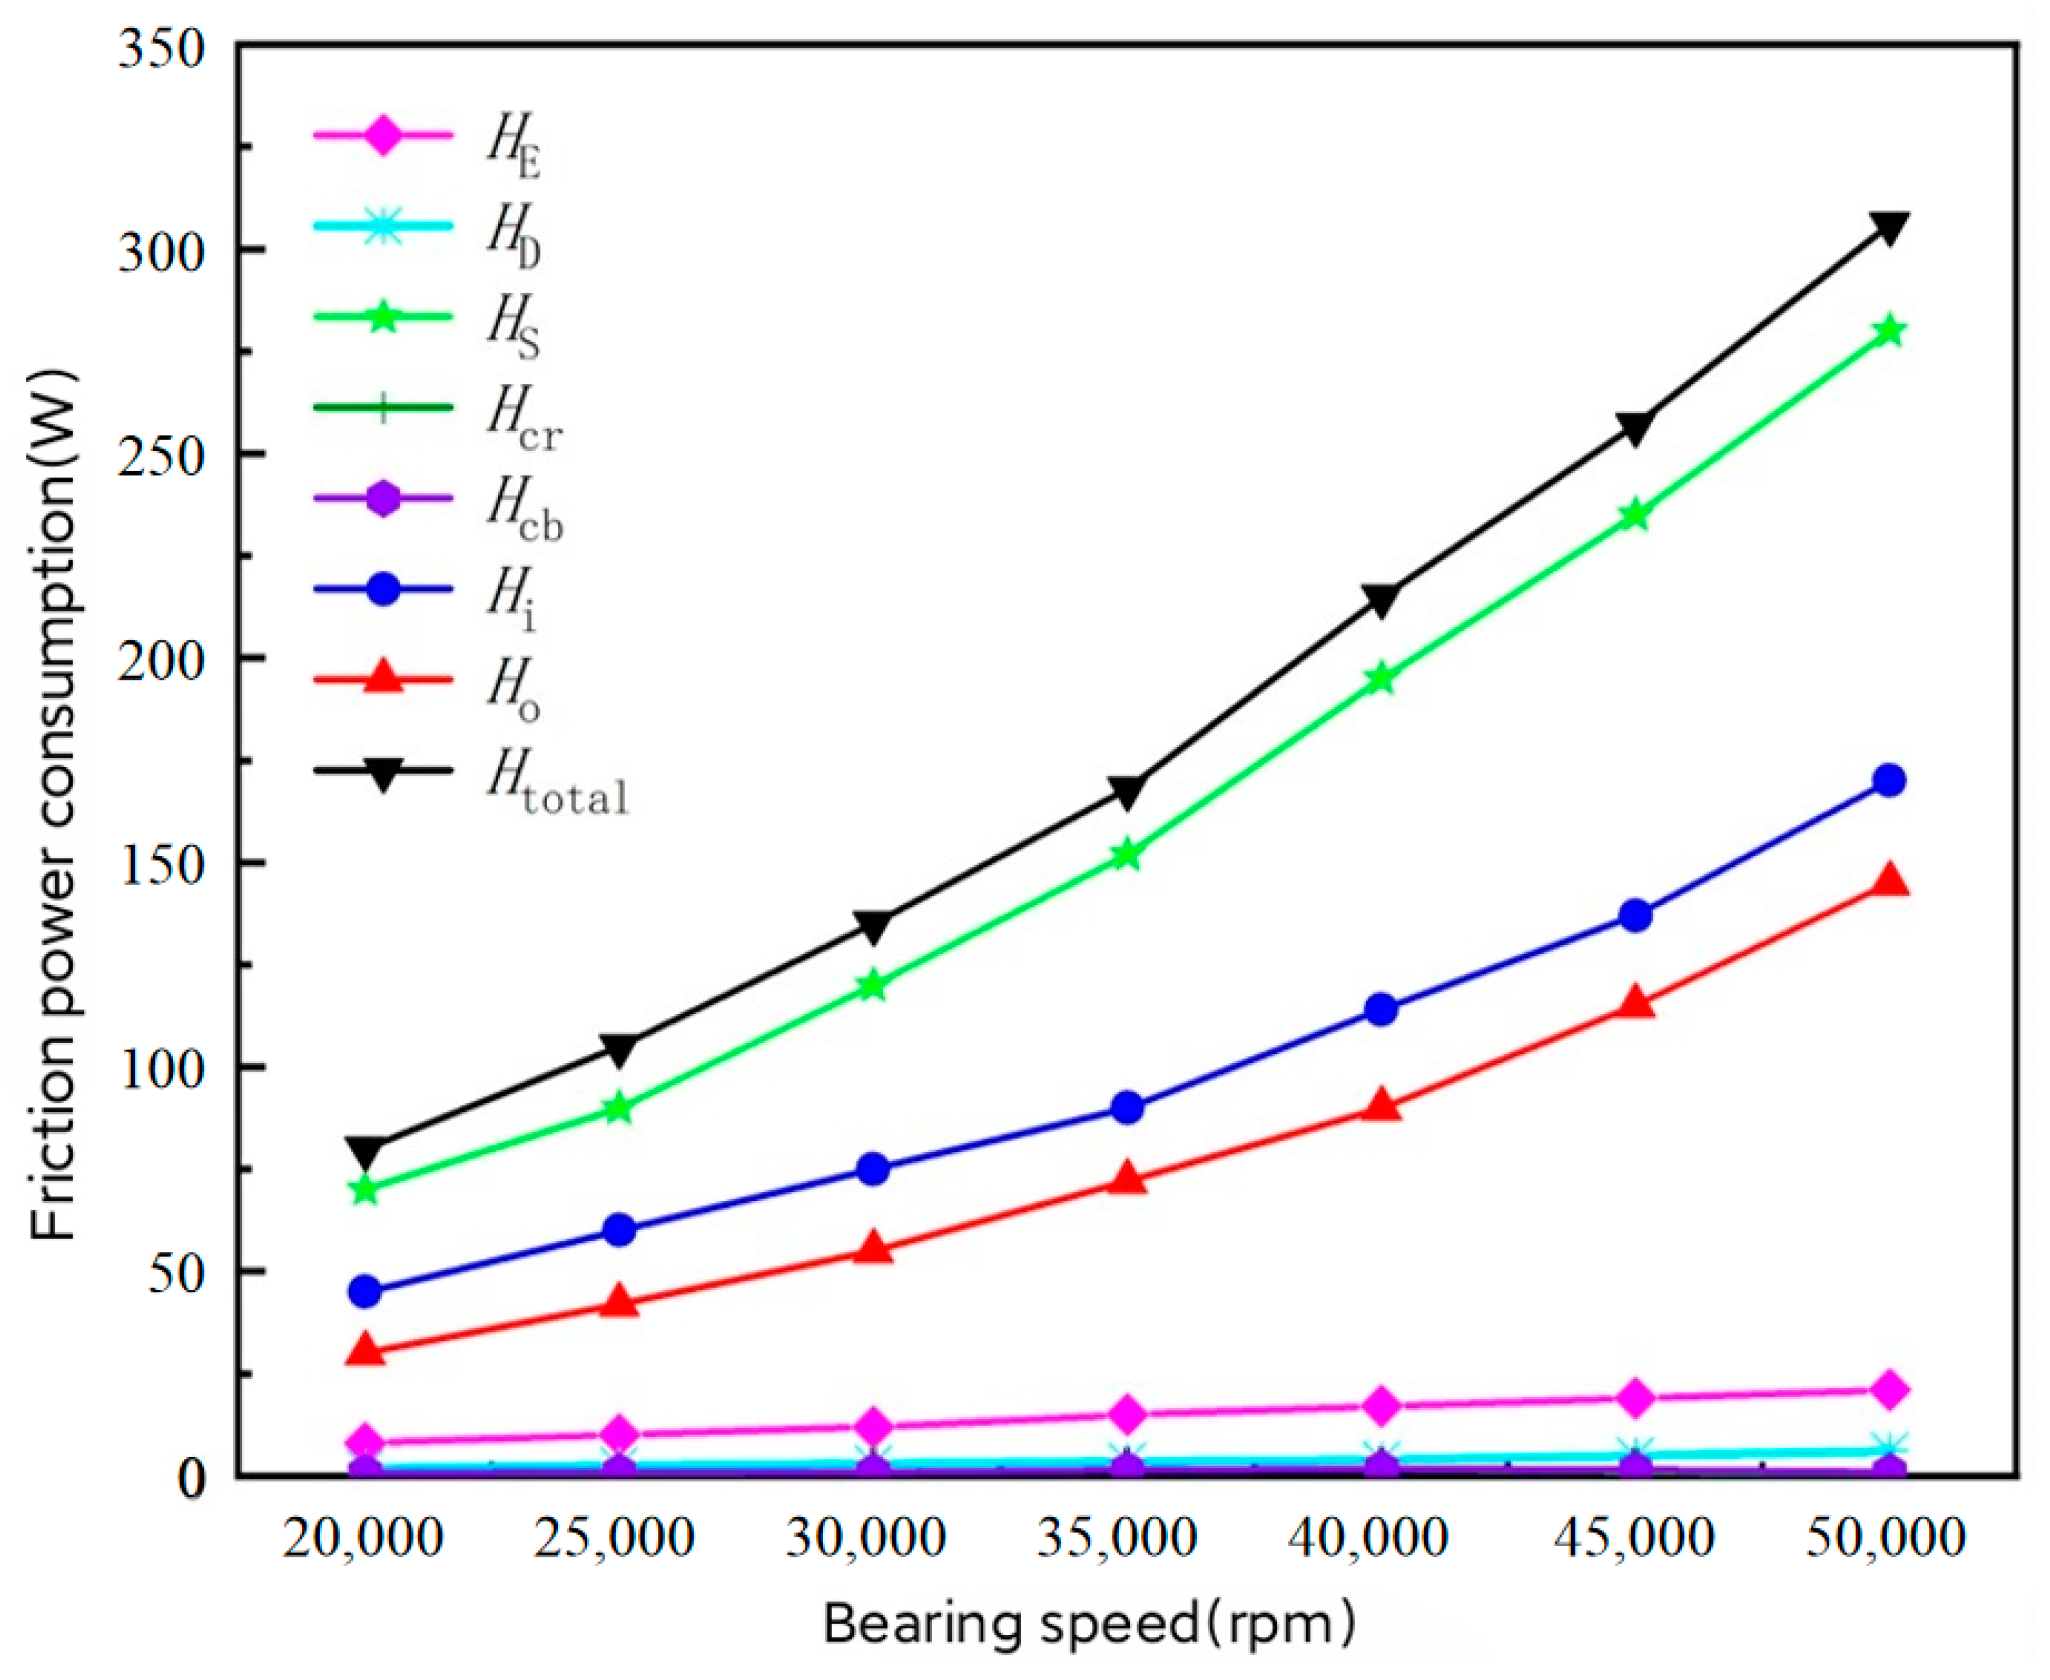
5.1. Influence of the Bearing Speed on Friction Power Consumption

The variation laws of various friction power consumption under the working conditions of an axial load of 2000 N, a radial load of 800 N, and an inner ring speed range of 20,000~50,000 rpm were obtained through simulation, as depicted in Figure 3. It can be observed from Figure 3 that all types of friction power consumption in the bearings increase with the increase in bearing speed, resulting in an overall increase in total friction power consumption. The maximum total friction power consumption is 316.4 W, while the minimum is 77.8 W. Among these, the friction power consumption due to the spin sliding of the ball has the greatest impact on the total friction power consumption, while the remaining friction power consumption has little influence on it.

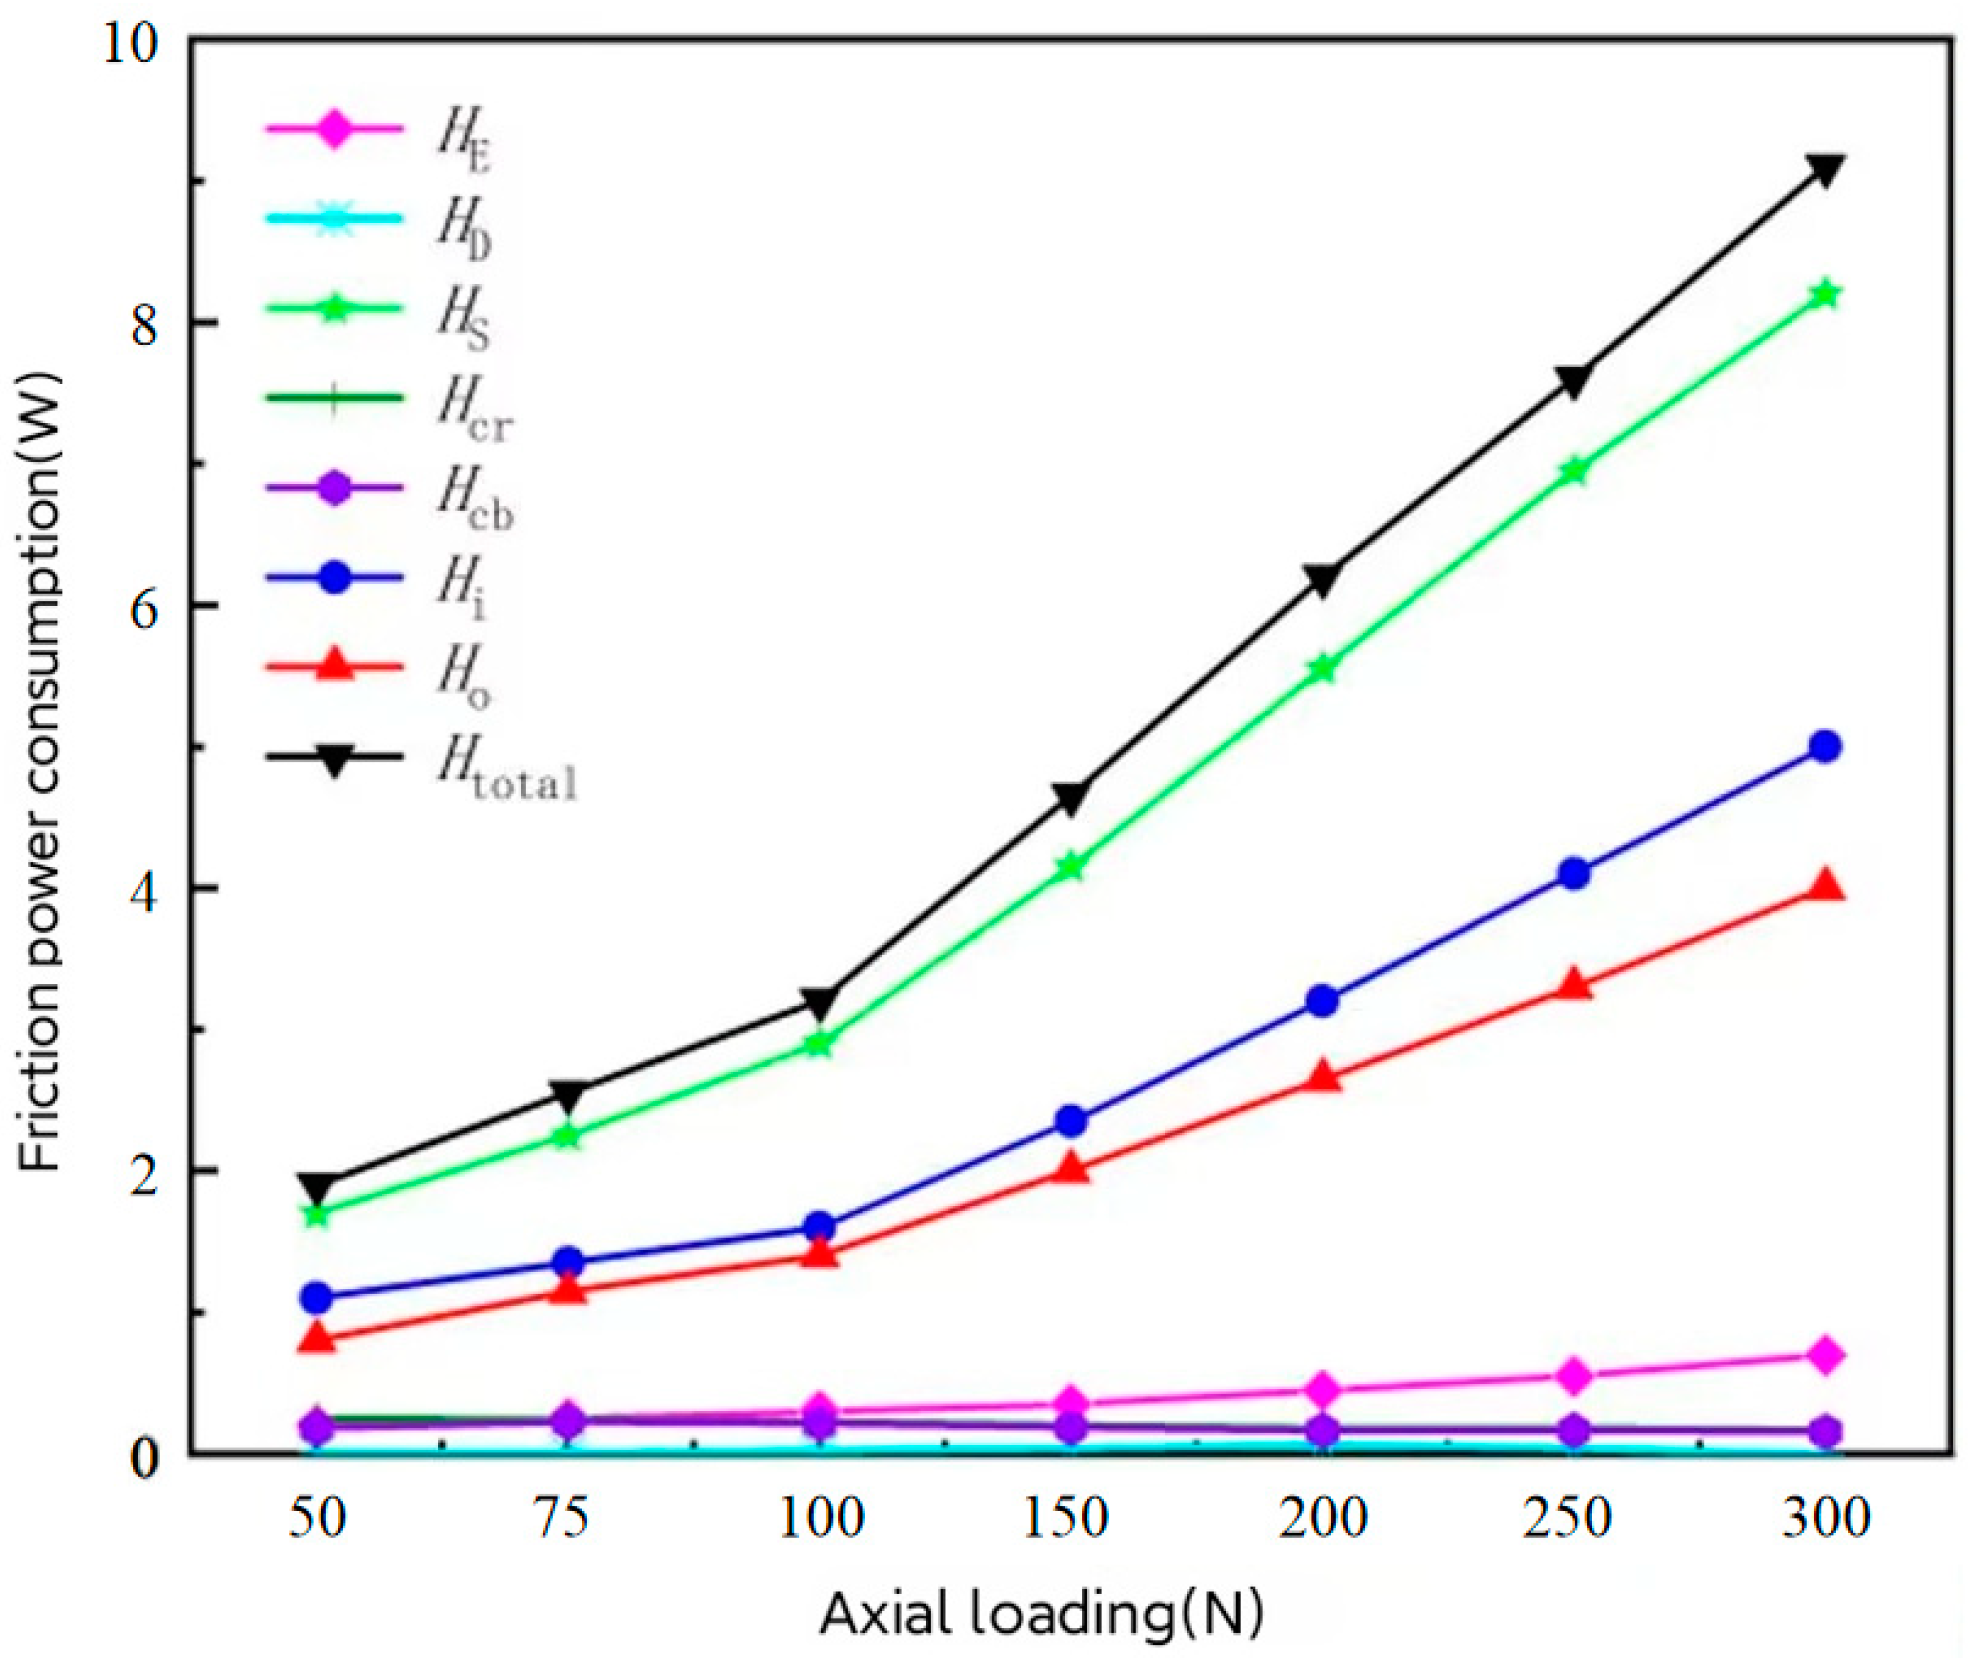
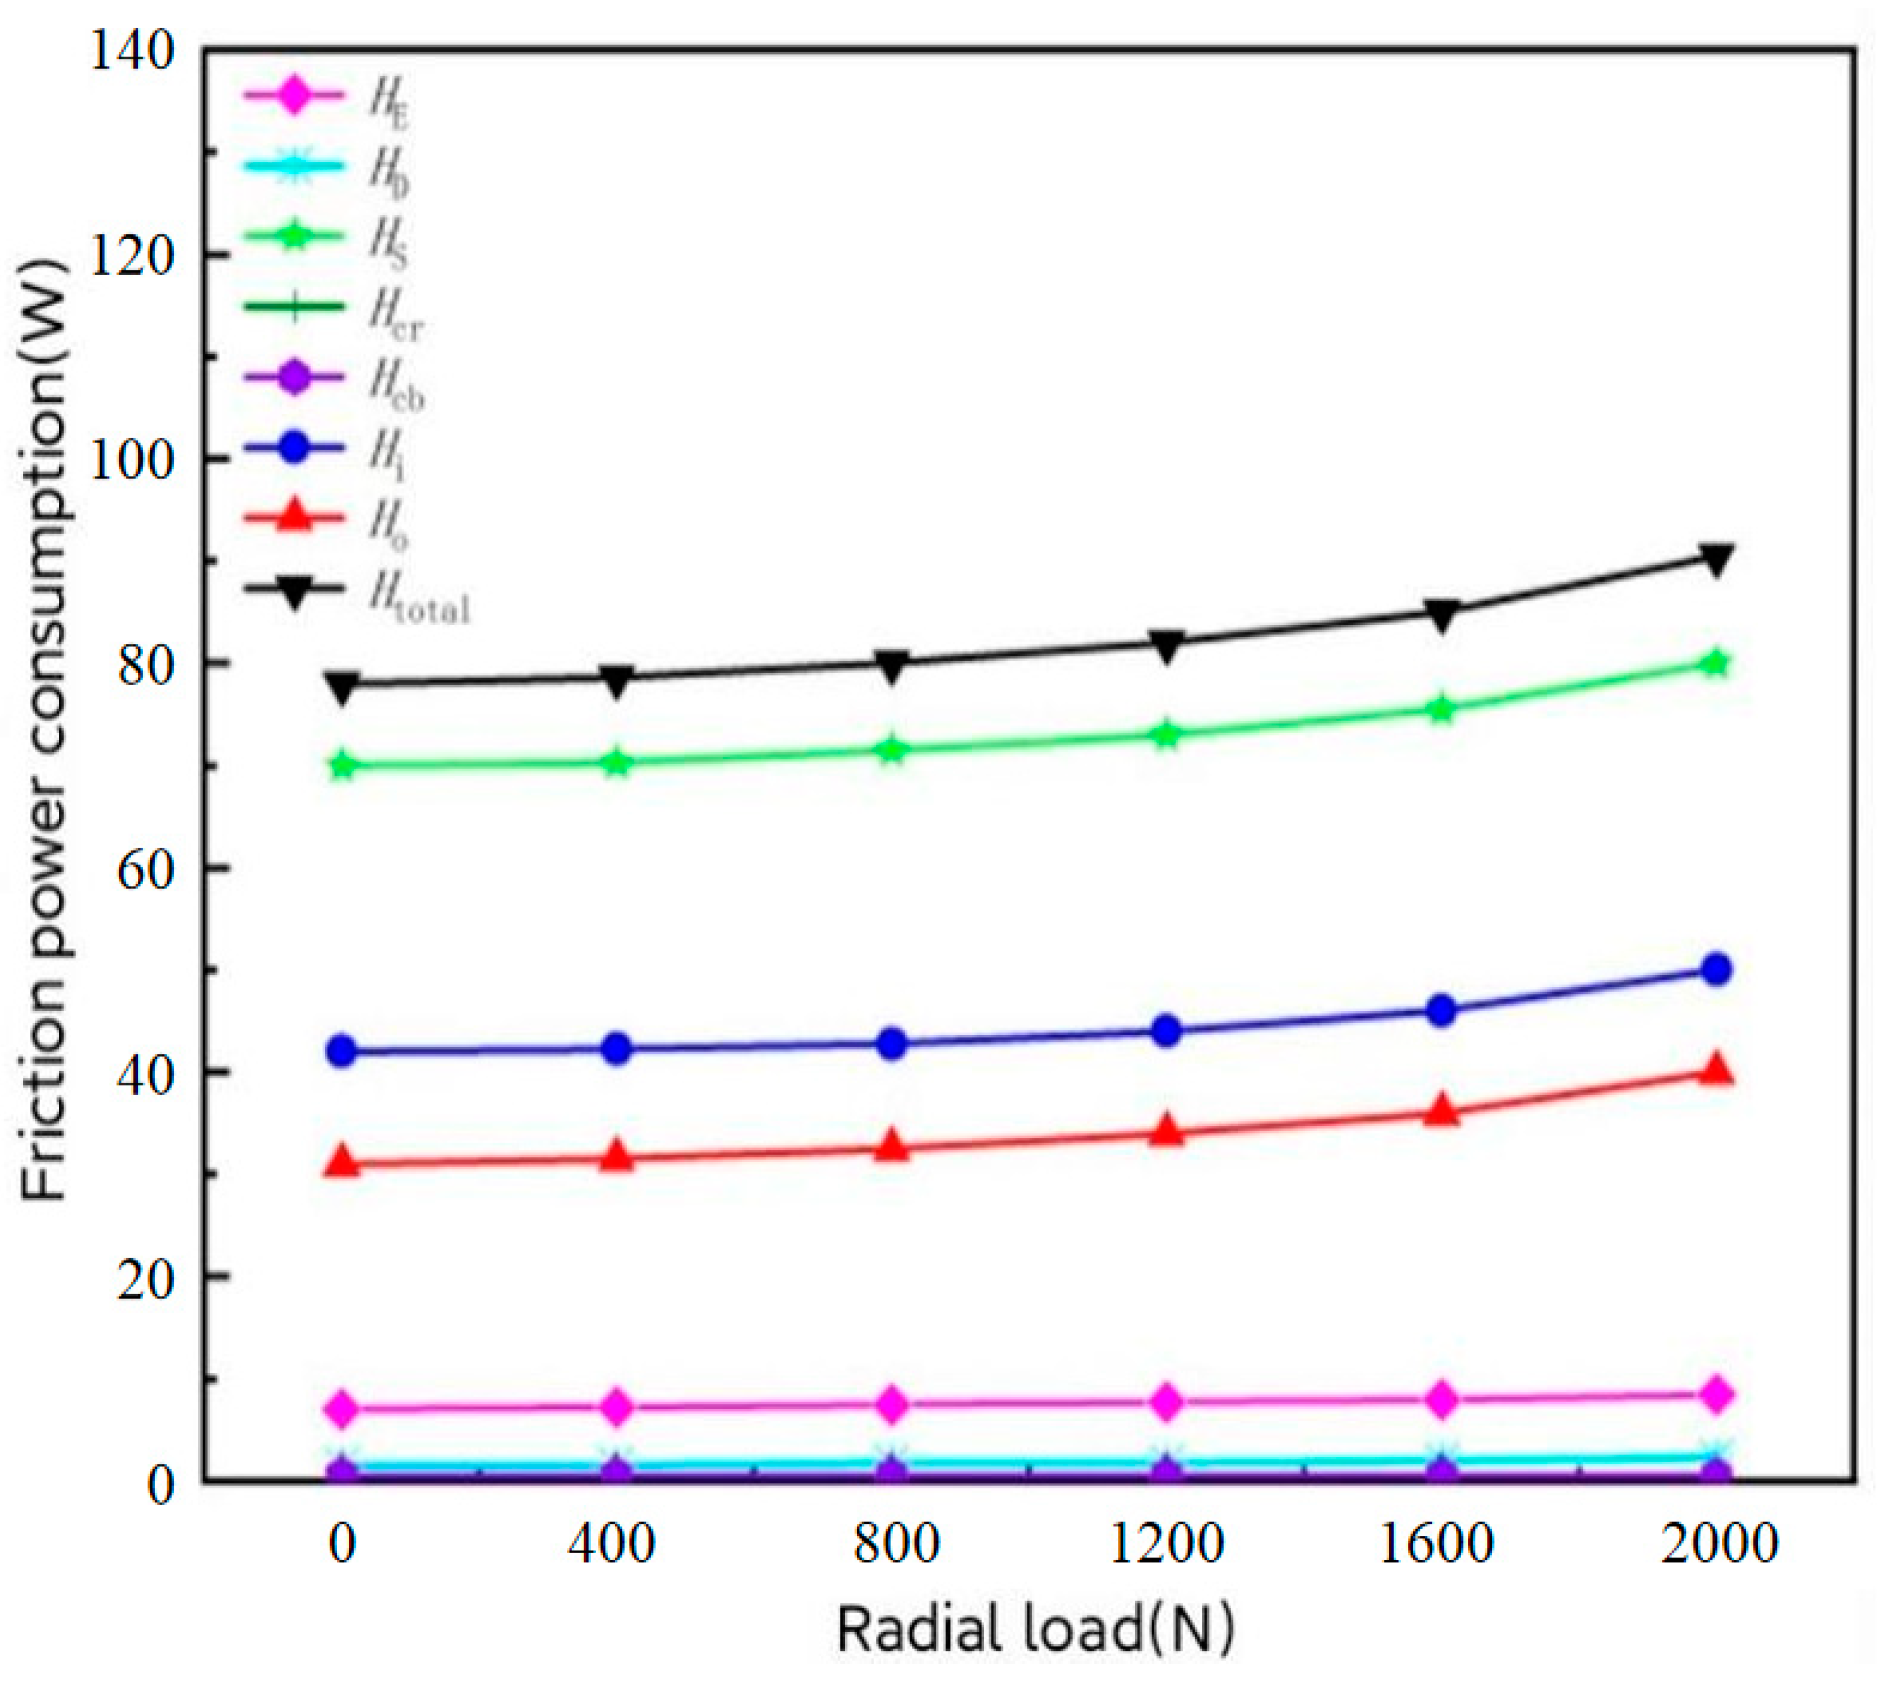
5.2. Influence of Load on Friction Power Consumption

Similarly, under the working conditions of 0 N radial load, 20,000 rpm bearing speed, and 50~300 N axial load, the variation laws of various types of friction power consumptions with axial load were obtained through simulation, as depicted in Figure 4. It can be seen from Figure 4 that the total friction power consumption has increased from 1.8 W to 8.6 W, and the trend of friction power consumption on the rings is basically consistent with the total friction power consumption.
When the axial load is 2000 N and the bearing speed is 20,000 rpm, the variation laws of various friction power consumptions with radial load are obtained through simulation, as depicted in Figure 5. It can be observed from Figure 5 that as the radial load increases, the friction power consumption of the bearings also slightly increases. The total friction power consumption increases from 75.8 W to 88.7 W. Among these, the friction power consumption due to ball spinning and sliding accounts for the largest proportion, while the other types of friction power consumption have minimal impact on the total friction power consumption.

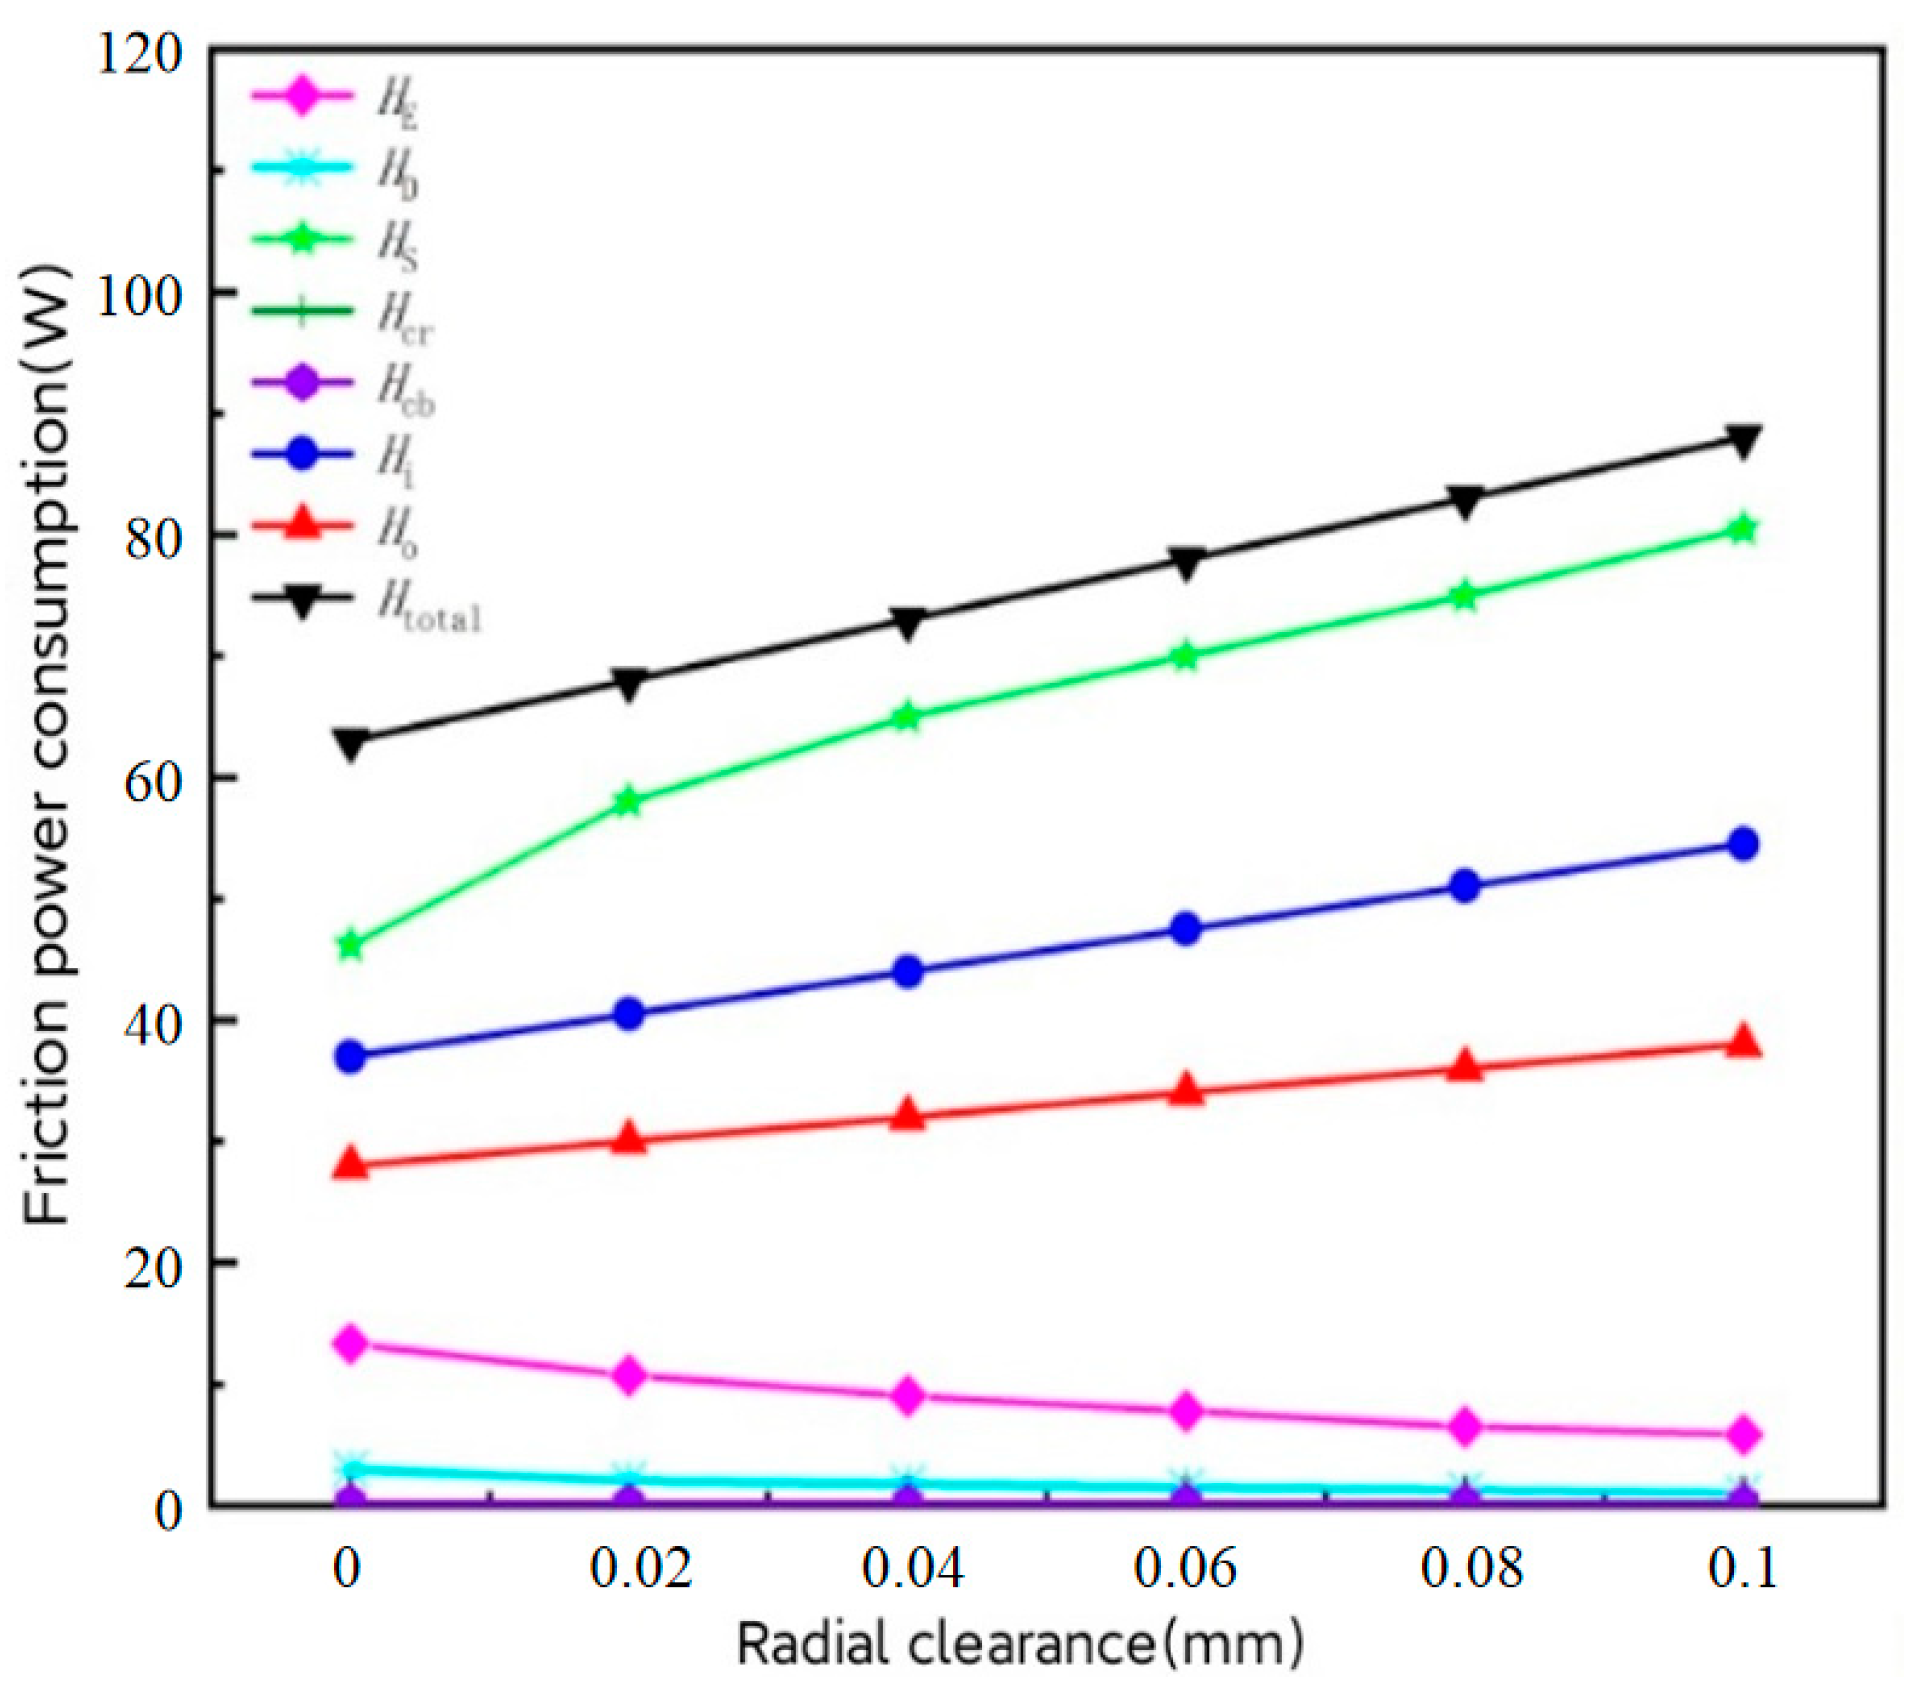
5.3. Influence of Radial Clearance on Friction Power Consumption

Under the working conditions of a bearing speed of 20,000 rpm, an axial load of 2000 N, and a radial load of 800 N, the simulation results show the change in friction power consumption with radial clearance, as depicted in Figure 6. The analysis reveals that as the radial clearance increases, the total friction power consumption gradually increases. The total friction power consumption rises from 61.7 W to 85.1 W. The power consumption caused by the spin sliding of the steel ball was the same as the changing trend of the total friction power consumption and accounted for the largest proportion of all kinds of friction power consumption.

6. Experimental Comparison of Friction Power Consumption of Solid Lubricated Ball Bearings

6.1. Main Parameters of Test Bearing

The initial basic parameters and working conditions of the test bearing are observed in Table 3. In addition, the bearing ring and ball are made of G95Cr18, and the cage is made of nylon 66. The material characteristics are observed in Table 4.

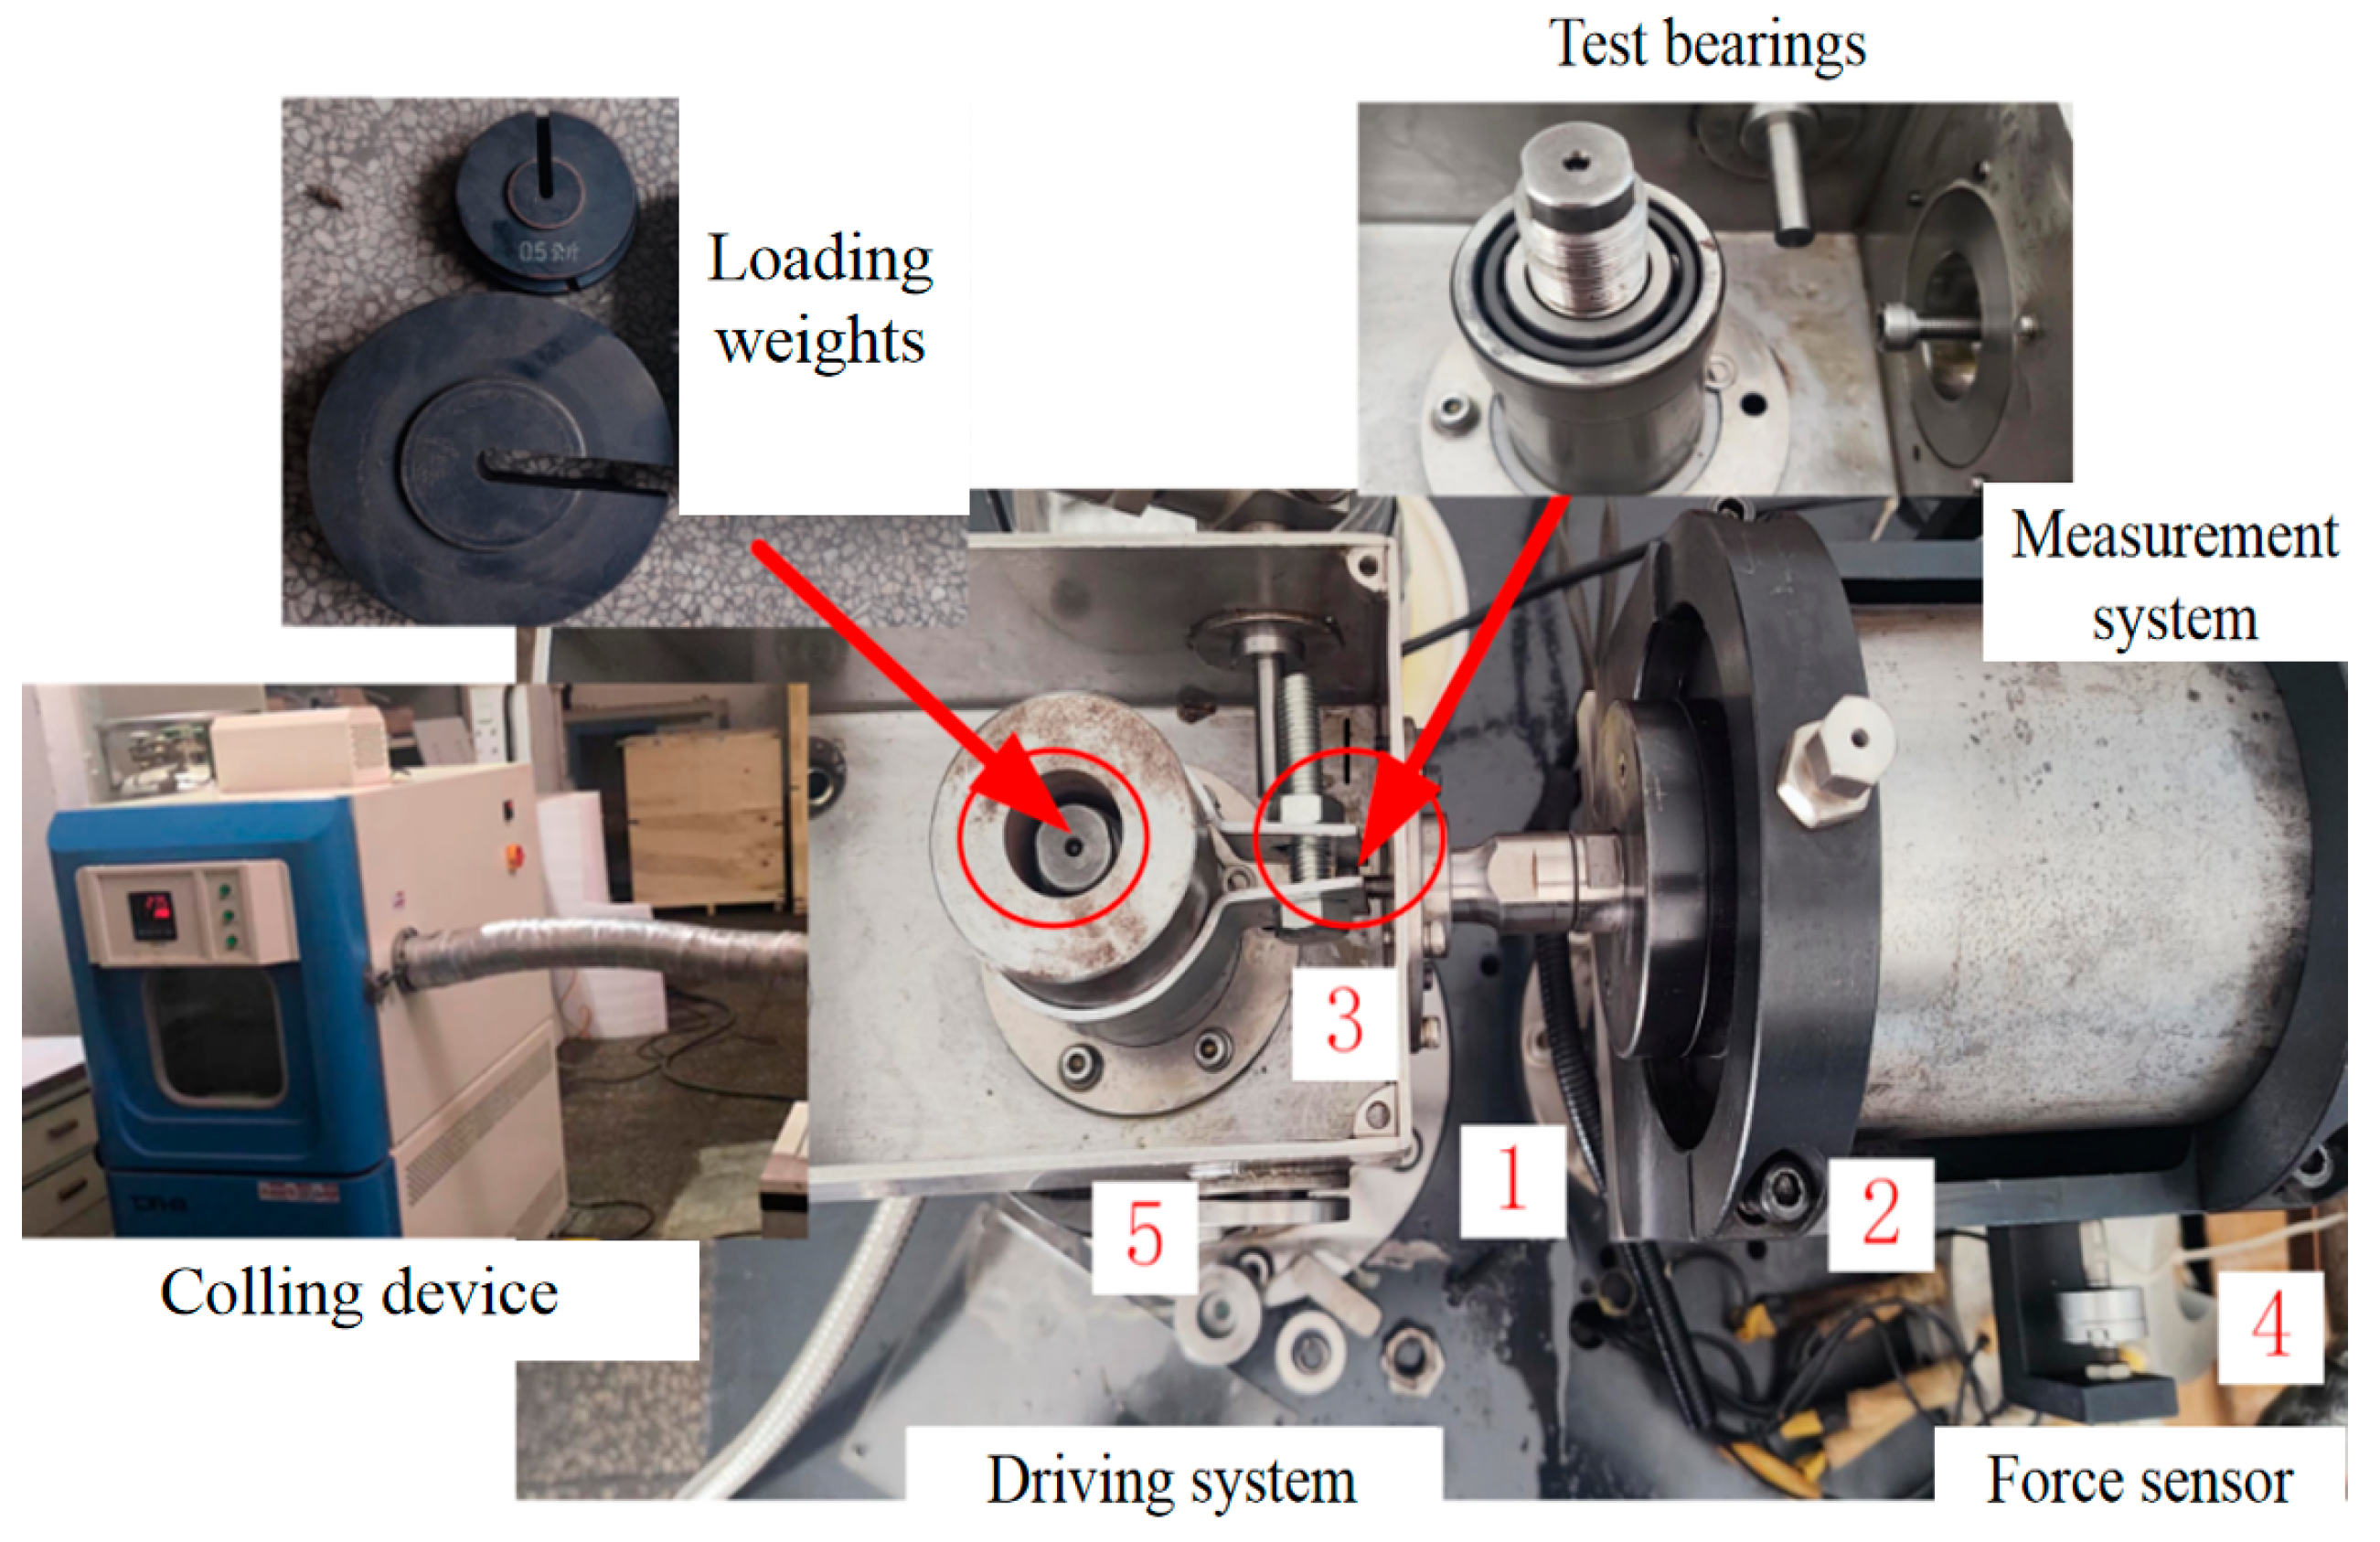
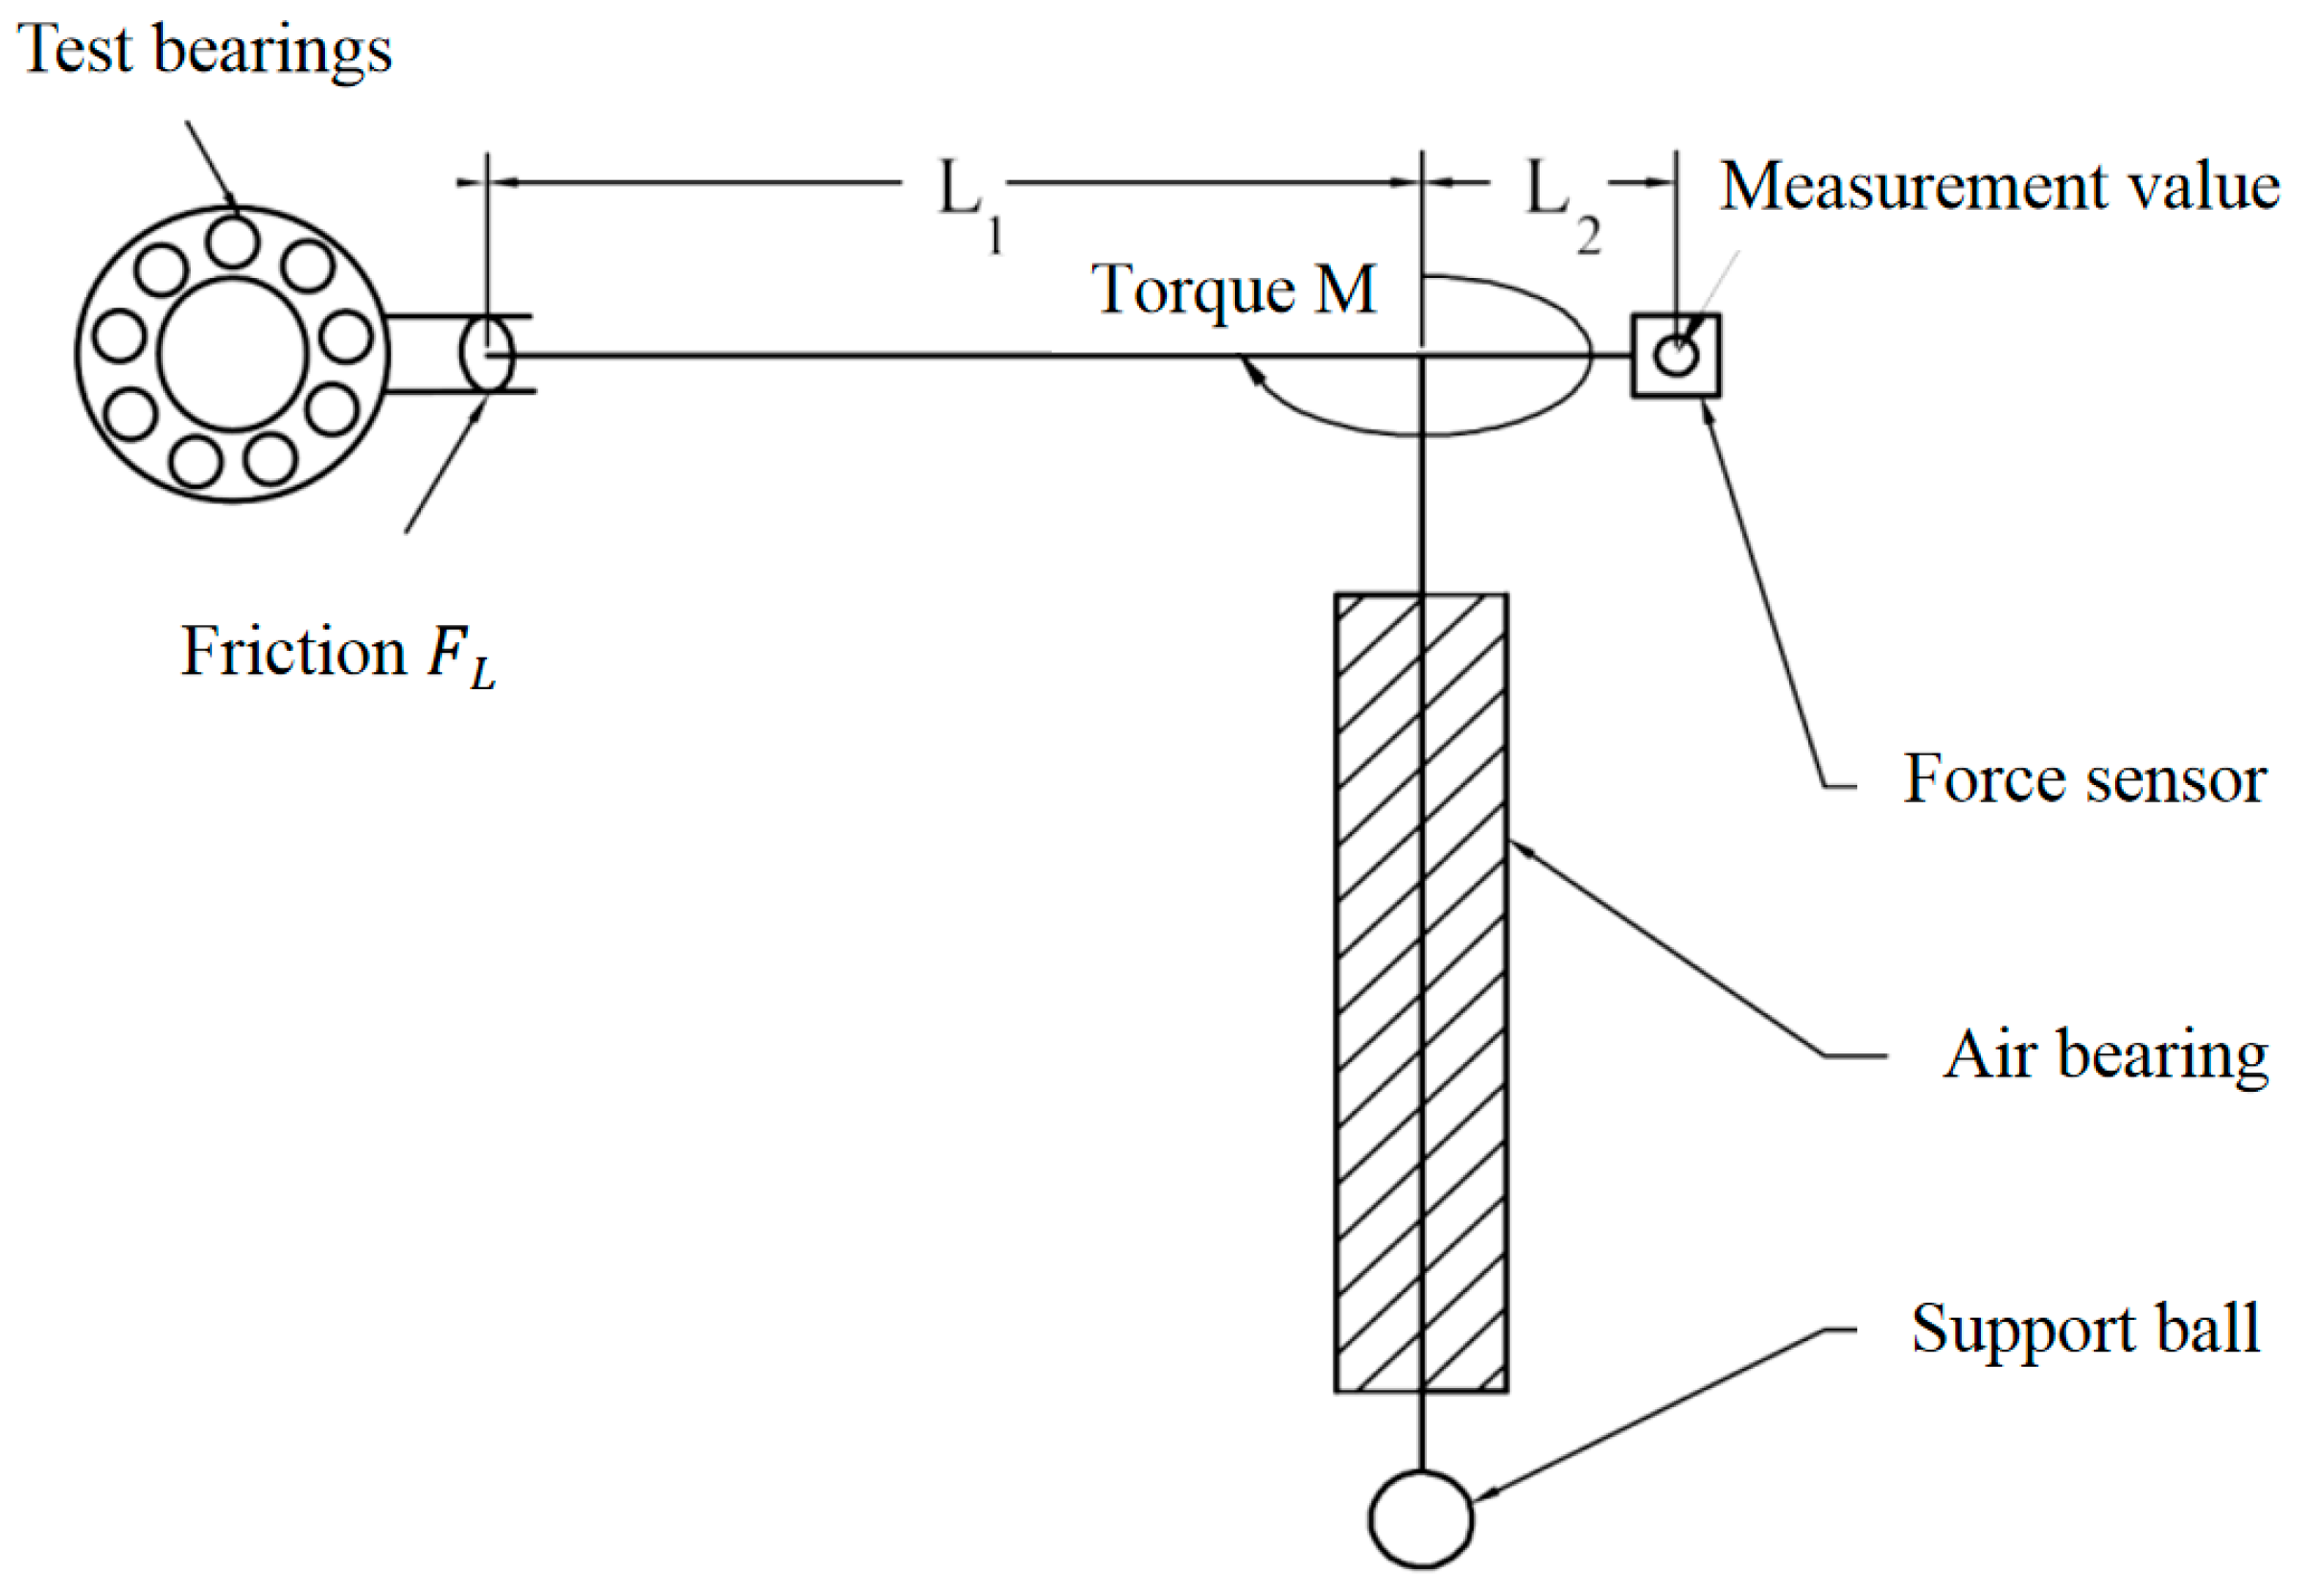
6.2. Test Equipment and Experimental Principle

The test device described in Figure 7 utilizes the balanced torque method to measure the bearing friction torque. It consists of various components, including a friction measurement system, a rotating displacement device, a bearing installation device, and a low-temperature cooling device. The air suspension shaft (1), bracket (2), force-measuring pendulum rod (3), force sensor (4), and rotating spindle (5) are shown in the figure. To create a low-temperature environment for testing, liquid nitrogen is continuously supplied from the liquid nitrogen tank to the test system. The experimental procedure involves applying an axial load to the outer ring of the bearing and then rotating the inner ring using the rotating spindle. Under the influence of the bearing friction torque, the outer ring is driven to rotate. Additionally, the force swing rod is installed on the shaft core of the air bearing and connected to the O-ring clamp on the end cover of the bearing outer ring. This allows the swing rod to be deflected along with the bracket when the outer ring rotates. The resistance on the force sensor hinders the rotation of the outer ring, ensuring that the bearing friction torque remains in a dynamically balanced state. The chosen force sensor is a resistance strain force sensor, which achieves integrated and intelligent measurement by utilizing an appropriate amplifier, signal transmitter, and multi-channel signal acquisition instrument. By measuring the resistance value with the force sensor, the dynamic friction torque of the bearing can be determined by converting the force arm between the measurement point and the action point. The structure of the measurement system and the diagram illustrating the measurement principle are shown in Figure 8.
Main technical requirements for test device: (1). −175 °C. (2). Bearing bore diameter: 20 mm. (3). Using weight loading. (4). Range of spindle speed: 0~20,000 rpm. (5). Using computer-automated control.
It can be seen from the Figure 8 that:
M = 0.5 F L × d m
F L = F × L 2 L 1
where M is the friction torque of the bearing to be tested, in N·mm; F is the resistance measured by the force sensor, in N; F L is the force between the top of the swing lever and the marked point of the O-shaped hoop, in N; d m is the bearing pitch diameter, in mm; L 1 is the distance from the force measuring point to the rotary center of the air bearing, in mm; L 2 is the distance from the force sensor to the rotary center of the air bearing, in mm.

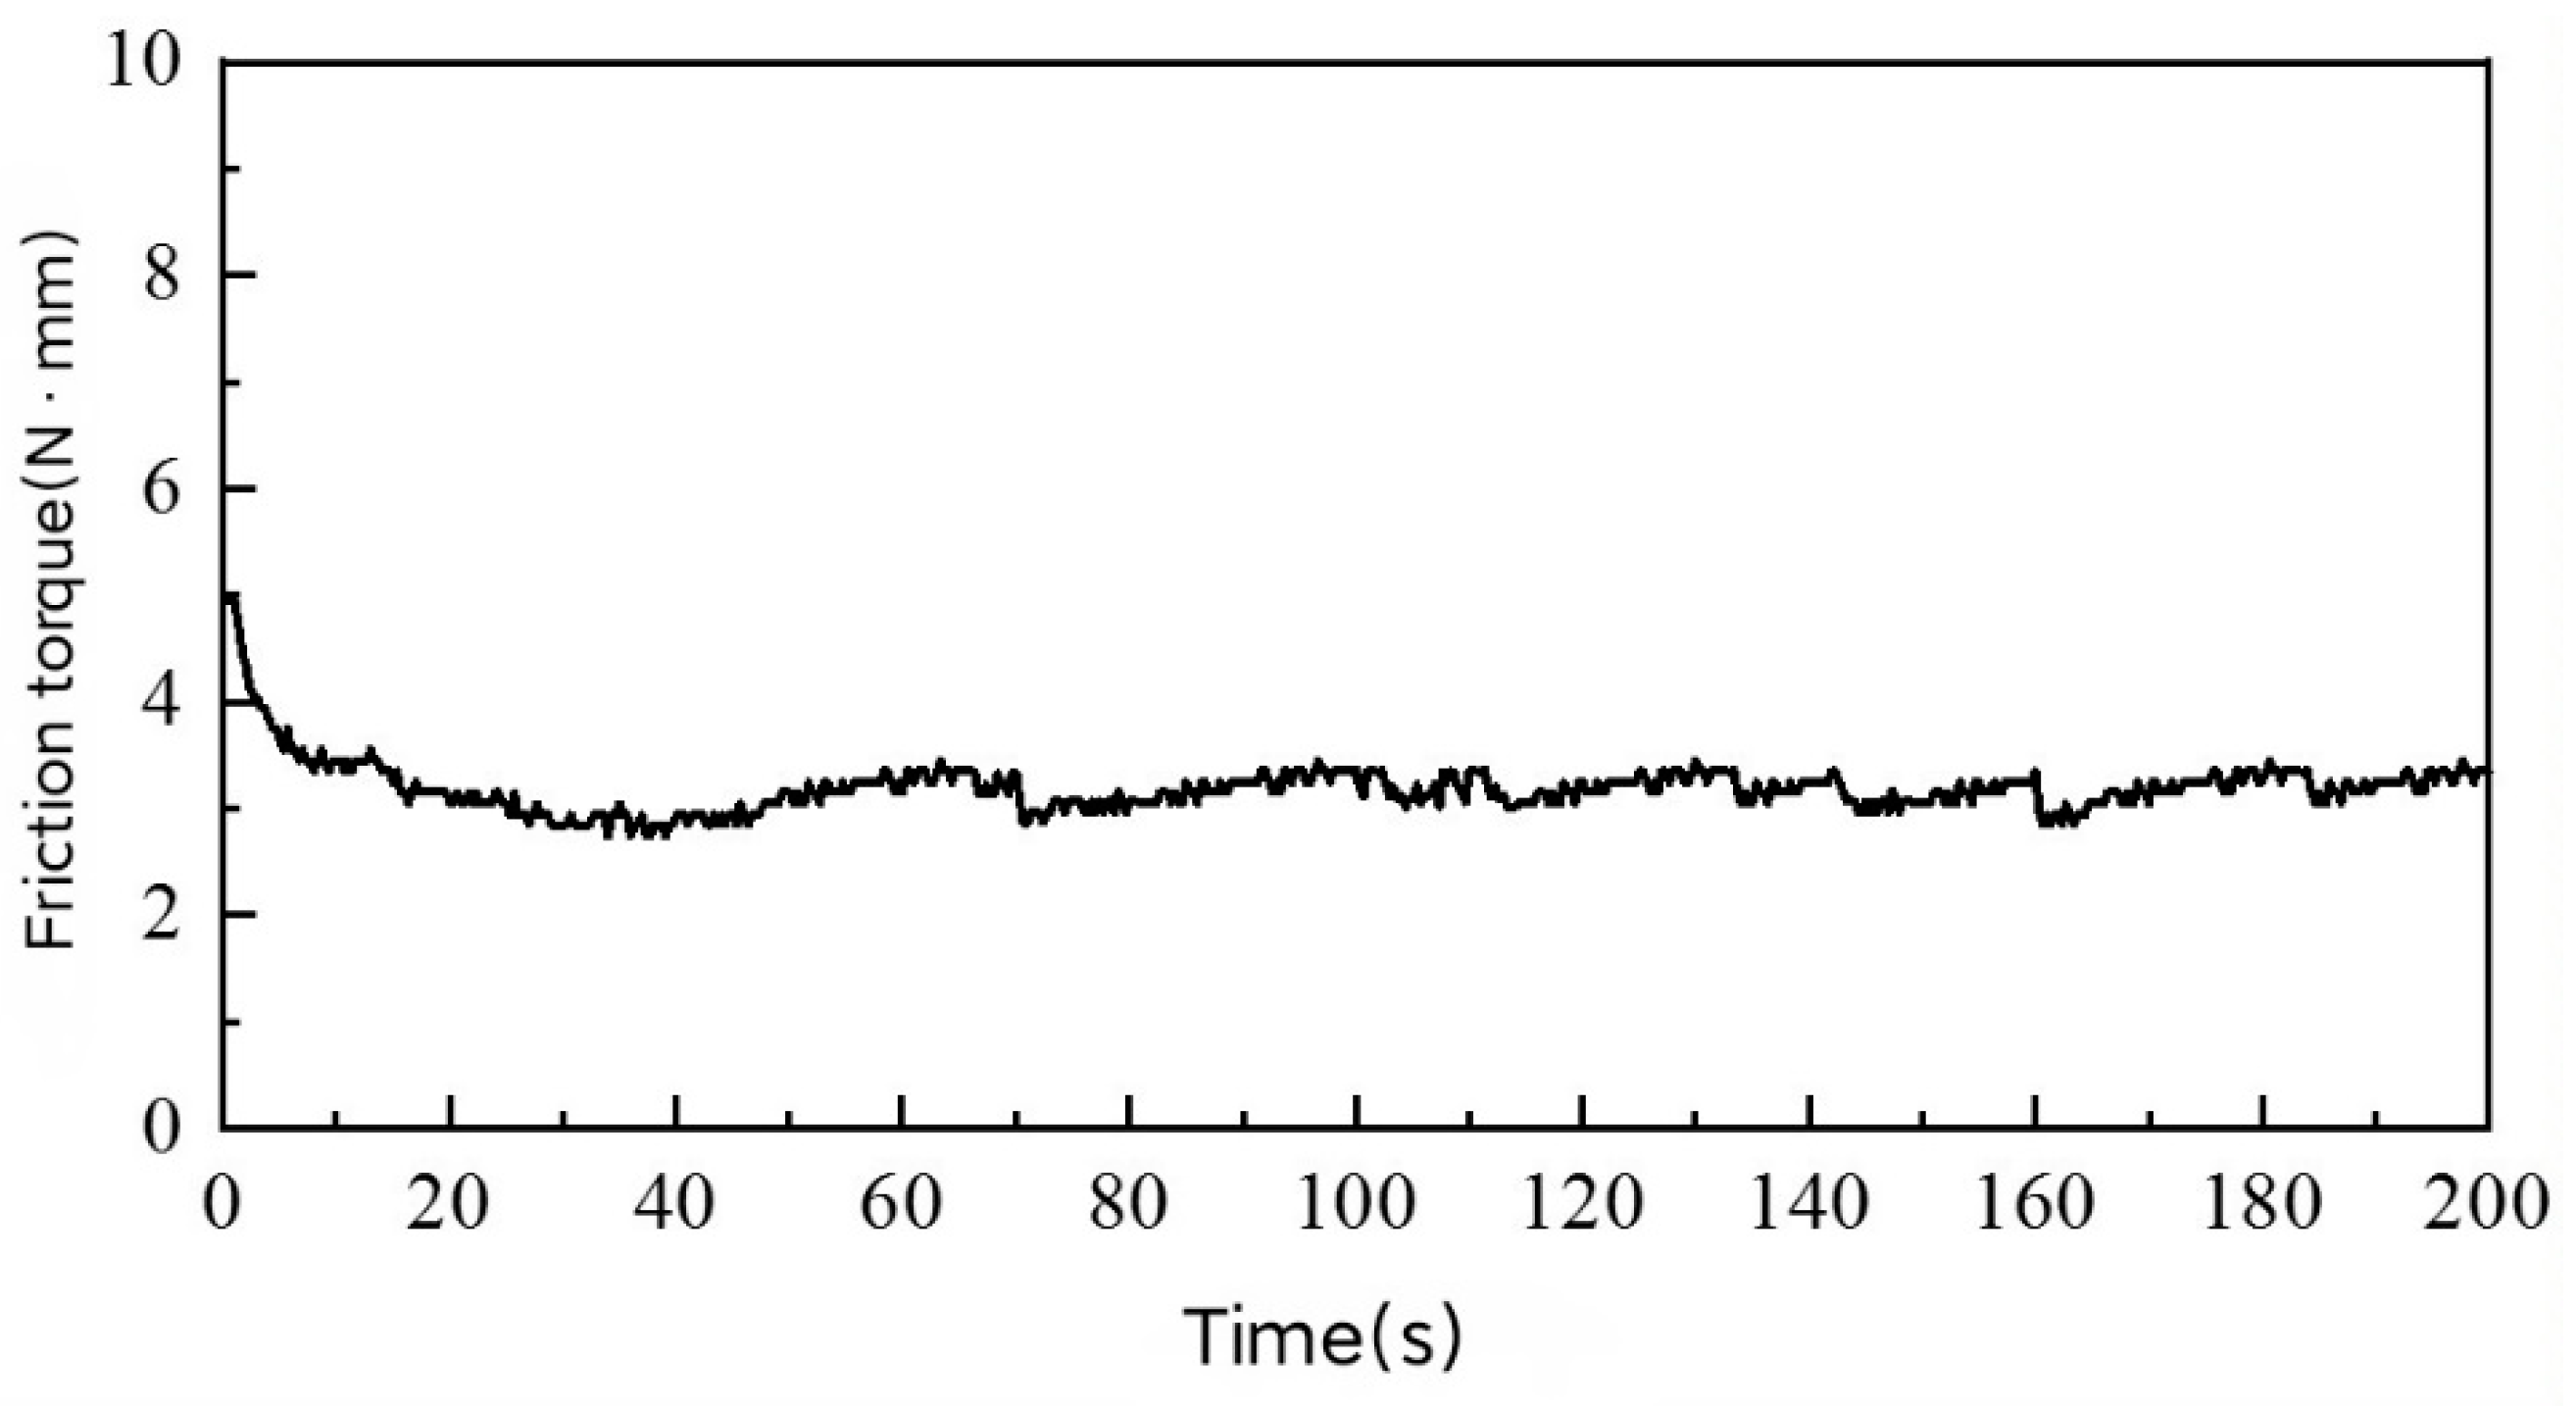
6.3. Analysis of Test Results

The force at the friction sensor is converted between the arms to obtain the friction torque value. Figure 9 illustrates the collected bearing friction torque at a bearing speed of 20,000 rpm and an axial load of 150 N. The friction torque fluctuates within a certain range with the change in test time. The obtained friction torque from the test can be approximated as the total friction torque. To calculate the friction power consumption of the bearing, it can be obtained by multiplying the total friction torque by the bearing speed, as depicted in Formula (29). The calculated results are then compared with the simulation values obtained from the dynamic model in this study.
H = 1.047 × 10 4 n M t e s t
where H is friction power consumption, in W; n is the bearing speed of the ring, in rpm; M t e s t is the friction torque obtained from the test, in N·mm.
As depicted in Figure 10, this study compares the friction power consumption calculated from the experimentally measured root-mean-square value of the total friction torque with the simulation value based on the dynamic model proposed in this study. The results presented in Figure 10 demonstrate that the changing trend of friction power consumption obtained from the experiment is consistent with the simulation result as the axial load increases, indicating the reliability of the friction power consumption calculated in the dynamic analysis of this study. Additionally, the comparison between the simulation result and the experimental value reveals a certain error, with a maximum deviation of 13.6%. However, this error falls within an acceptable range, indicating that the accuracy of the simulation results is reasonably good.
In the analysis of the root causes of these errors, the following factors can be identified: (1) The simulation assumes ideal conditions, neglecting the impact of bearing precision, installation, raceway roundness, and fit on friction power consumption. (2) The test instrument employs a supporting ball and air bearing shaft as intermediate supports, which will inevitably include the foundational friction torque in the measurement results, resulting in a certain error between the simulation results and the measurement results.

7. Conclusions

In this study, a solid lubricated bearing working in ultra-low temperature environments is taken as the research object, and the friction power consumption of the bearing is calculated, analyzed, and verified by experiments. The conclusions are as follows:
  • The traction coefficient of MoS2 solid lubricating material first increases and then slightly decreases with an increase in sliding speed. The traction coefficient decreases with an increase in load.
  • As the bearing speed increases, total friction power consumption also increases. A slight upward trend is observed in total friction power consumption with an increase in radial load and radial clearance, while an increase in axial load results in a more obvious upward trend in total friction power consumption.
  • The simulation value of friction torque, based on the bearing dynamic model proposed in this study, shows good consistency with the experimental results.

Author Contributions

Conceptualization, B.S., S.M. and G.Z.; Data curation, S.M. and G.Z.; Formal analysis, S.M. and B.S.; Funding acquisition, Y.C.; Investigation, S.M., H.L. and B.S.; Methodology, B.S. and Y.C.; Project administration, B.S. and Y.C.; Resources, Y.C.; Software, S.M.; Supervision, Y.C. and B.S.; Validation, G.Z., H.L. and S.M.; Writing—original draft, G.Z. and B.S.; Writing—review & editing, S.M. and B.S. All authors have read and agreed to the published version of the manuscript.

Funding

This research was funded by the National Natural Science Foundation of China (52005158).

Data Availability Statement

The data used to support the findings of this study are available from the corresponding author upon request.

Acknowledgments

The authors would like to thank the National Natural Science Foundation of China (52005158) for the financial support.

Conflicts of Interest

The authors declare no conflict of interest.

References

  1. Liu, J. Dynamic Analysis on Cage Dynamic Characteristics and Strength of Angular Contact Ball Bearing in Ultra-Low Temperature Environment. Master’s Thesis, Henan University of Science and Technology, Luoyang, China, 2020. [Google Scholar]
  2. Yan, H.Y. The Principle and Application of Solid Lubrication Technology. Technol. Mark. 2016, 23, 133. (In Chinese) [Google Scholar]
  3. Gu, L.; Wang, L.Q.; Li, X.J. Research Status of Cryogenic Solid Lubrication. Tribology 2002, 22, 314–320. (In Chinese) [Google Scholar]
  4. Kang, J.J.; Li, G.L.; Wang, H.D. Development of Research on the Layered Solid Lubrication Films. Heat. Treat. Met. 2007, 32, 15–18. (In Chinese) [Google Scholar]
  5. Dunckle, C.G.; Aggleton, M.; Glassman, J. Friction of molybdenum disulfide titanium films under cryogenic vacuum conditions. Tribol. Intern. 2011, 44, 1819–1826. [Google Scholar] [CrossRef]
  6. Ma, G.Z.; Xu, B.S.; Wang, H.D. State of Research on Space Solid Lubrication Materials. Mater. Rep. 2010, 24, 68–71. (In Chinese) [Google Scholar]
  7. Wong, K.C.; Lu, X.; Cotter, J. Surface and friction characterization of MoS2 and WS2 third body thin films under simulated wheel/rail rolling–sliding contact. Wear 2007, 264, 526–534. [Google Scholar] [CrossRef]
  8. Kwak, W.; Lee, J.; Lee, Y. Theoretical and experimental approach to ball bearing frictional characteristics compared with cryogenic friction model and dry friction model. Mech. Syst. Signal Process. 2019, 124, 424–438. [Google Scholar] [CrossRef]
  9. Burris, D.L. Investigation of the tribological behavior of polytetrafluoroethylene at cryogenic temperatures. Tribol. Trans. 2008, 51, 92–100. [Google Scholar] [CrossRef]
  10. Hubner, W.; Gradt, T.; Schneider, T. Tribological behaviour of materials at cryogenic temperatures. Wear 1998, 216, 150–159. [Google Scholar] [CrossRef]
  11. Zhang, W.H.; Deng, S.E.; Chen, G.D. Influence of Lubricant Traction Coefficient on Cage’s Nonlinear Dynamic Behavior in High-Speed Cylindrical Roller Bearing. J. Tribol. 2017, 139, 061502. [Google Scholar] [CrossRef]
  12. Yukhno, T.P.; Vvedensky, Y.V.; Sentyurikhina, L.N. Low temperature investigations on frictional behavior and wear resistance of solid lubricant coatings. Tribol. Intern. 2001, 34, 293–298. [Google Scholar] [CrossRef]
  13. Cao, P.; Bai, Y.; Zhang, Y.H. Tribological Characteristics of Deposited Ag Film Bearing under Dry, Oil and Grease Lubricating. Lubr. Eng. 2011, 36, 29–31. (In Chinese) [Google Scholar]
  14. Duan, X.S.; Chen, R.; Mai, N.N. Research on Solid-lubrication Craft of Joint Bearing. Lubr. Eng. 2015, 40, 116–119. (In Chinese) [Google Scholar]
  15. Lu, J.H.; Kuang, Y.F. Research on the Lubrication and Friction Reduction Performance of Lead Tin Alloy Coating. Mater. Prot. 2007, 40, 12–13. (In Chinese) [Google Scholar]
  16. Christian, B.; Alexander, H.; Jens, R. Cage Friction in High-Speed Spindle Bearings. Tribol. Trans. 2014, 57, 77–85. [Google Scholar]
  17. Popescu, A.; Houpert, L.; Olaru, D.N. Four approaches for calculating power losses in an angular contact ball bearing. Mech. Mach. Theory 2020, 144, 103669. [Google Scholar] [CrossRef]
  18. Burris, D.L.; Sawyer, W.G. Addressing practical challenges of low friction coefficient measurements. Tribol. Lett. 2009, 35, 17–23. [Google Scholar] [CrossRef]
  19. Deng, S.E.; Li, X.L.; Wang, J.G. Analysis on the Friction Torque Fluctuation of Angular Contact Ball Bearings. J. Mech. Eng. 2011, 47, 104–112. (In Chinese) [Google Scholar] [CrossRef]
  20. Deng, S.E.; Li, X.L.; Wang, J.G. Frictional Torque Characteristic of Angular Contact Ball Bearings. J. Mech. Eng. 2011, 47, 114–120. (In Chinese) [Google Scholar] [CrossRef]
  21. Li, S.S.; Chen, J.; Ling, J. Analytic and Experimental Study on Friction Torque for High-speed Micro Ball Bearing. Lubr. Eng. 2013, 38, 32–35. (In Chinese) [Google Scholar]
  22. Cui, Y.F.; Deng, S.E.; Deng, K.W. Friction Torque Characteristics of Control Moment Gyros Bearing Unit. Aerosp. Control Appl. 2020, 46, 73–80. (In Chinese) [Google Scholar]
  23. Liu, Y.Y.; Yang, H.S.; Su, B. Simulation Analysis of the Friction Power Consumption of Double Row Angular Contact Ball Bearings for Aero-engine. J. Mech. Transm. 2021, 45, 129–135. (In Chinese) [Google Scholar]
  24. Yu, C.G.; Chen, W.H.; Liang, B. Study on the tribological properties of a self-lubricating spherical plain bearing at a cryogenic and wide temperature range. Sci. Sin. 2020, 50, 775–785. (In Chinese) [Google Scholar]
  25. Qiu, S.D. Experimental Study and Low Temperature Friction Characteristic of Angular Contact Ball Bearing. J. Mech. Transm. 2018, 42, 180–184. (In Chinese) [Google Scholar]
  26. Zheng, C.T.; Xu, S.R.; Yang, D.Q. State and Development on Research of Friction Torque of Ball Bearing. Bearing 2009, 8, 52–56. (In Chinese) [Google Scholar]
  27. Gao, F.; Yang, Y.X.; Zhao, Y. Analysis of dynamic friction moment fluctuation of precision shafting at low temperature and its optimization adjustment. Bearing 2023, 1–7. Available online: http://kns.cnki.net/kcms/detail/41.1148.TH.20230821.1545.002.html (accessed on 1 September 2023). (In Chinese).
  28. Liu, F.B.; Su, B.; Zhang, G.T. Development of a Cryogenic Tester with Air Bearing to Test Sliding-Rolling Contact Friction. Lubricants 2022, 10, 119. [Google Scholar] [CrossRef]
  29. Gupta, P.K. Traction Coefficients for Some Solid Lubricants for Rolling Bearing Dynamics Modeling. Tribol. Trans. 2000, 43, 647–652. [Google Scholar] [CrossRef]
  30. Zhang, K.; Li, J.H. Analysis and Calculation of Friction torque of Ball Bearings. Bearing 2001, 8–11. (In Chinese) [Google Scholar] [CrossRef]
  31. Deng, S.E.; Jia, Q.Y. Design Principle of Rolling Bearings, 2nd ed.; China Standard Press: Beijing, China, 2014; pp. 222–244. [Google Scholar]
Figure 1. Comparison between fitted value and experimental value of traction coefficient formula.
Lubricants 11 00372 g001
Figure 2. Diagram of ball forces. (a) X-y plane; (b) Z-y plane; (c) X-z plane.
Lubricants 11 00372 g002
Figure 3. Influence of the bearing speed on friction power consumption.
Lubricants 11 00372 g003
Figure 4. Influence of the axial load on friction power consumption.
Lubricants 11 00372 g004
Figure 5. Influence of the radial load on friction power consumption.
Lubricants 11 00372 g005
Figure 6. Influence of the radial clearance on friction power consumption.
Lubricants 11 00372 g006
Figure 7. Test device of bearing.
Lubricants 11 00372 g007
Figure 8. Principle of friction torque measurement.
Lubricants 11 00372 g008
Figure 9. Test results.
Lubricants 11 00372 g009
Figure 10. Comparison between simulation value and experimental value.
Lubricants 11 00372 g010
Table 1. The fitting values of coefficients of Formula (1).
Rolling Speed (m/s)Load (N)ABCDResidual
Error
Correlation
Coefficient
1085−0.03200.1544.4450.03200.00090.998
10167−0.02700.1585.2800.02700.00140.9933
10288−0.0220.07975.7140.0220.00080.9959
10458−0.019973,932133,6070.01990.00260.9532
Table 2. Regression value of each parameter.
AiBiCiDi
i0−1.05 × 10⁻³−4.14 × 10−542.641.05 × 10−3
1−0.32−0.540.18−0.32
Correlation
coefficient
0.990.9560.9870.956
Table 3. Basic parameters and working conditions of bearings.
ParametersSymbolValue
Outside diameterD47 mm
Bore diameterd20 mm
WidthB14 mm
Ball diameterDW7.938 mm
Initial radial clearanceu00.091 mm
Number of ballsZ10
Contact angleα25°
Axial loadingFa2000 N
Bearing speedn20,000 rpm
Table 4. Bearing material parameters.
MaterialModulus of Elasticity (GPa)Poisson’s
Ratio
Density (g/cm3)Coefficient of Linear Expansion (10−6 °C−1)Thermal Conductivity (W/(m·°C))
G95Cr182000.287.811.529.3
Nylon 662.830.41.151.20.25
Disclaimer/Publisher’s Note: The statements, opinions and data contained in all publications are solely those of the individual author(s) and contributor(s) and not of MDPI and/or the editor(s). MDPI and/or the editor(s) disclaim responsibility for any injury to people or property resulting from any ideas, methods, instructions or products referred to in the content.

