Lubricated Impact Dynamics and Pressure Spike Generation: Expanding on Contributions of Dr. R. Gohar


Abstract
:1. Introduction
2. Theory
3. Calculation
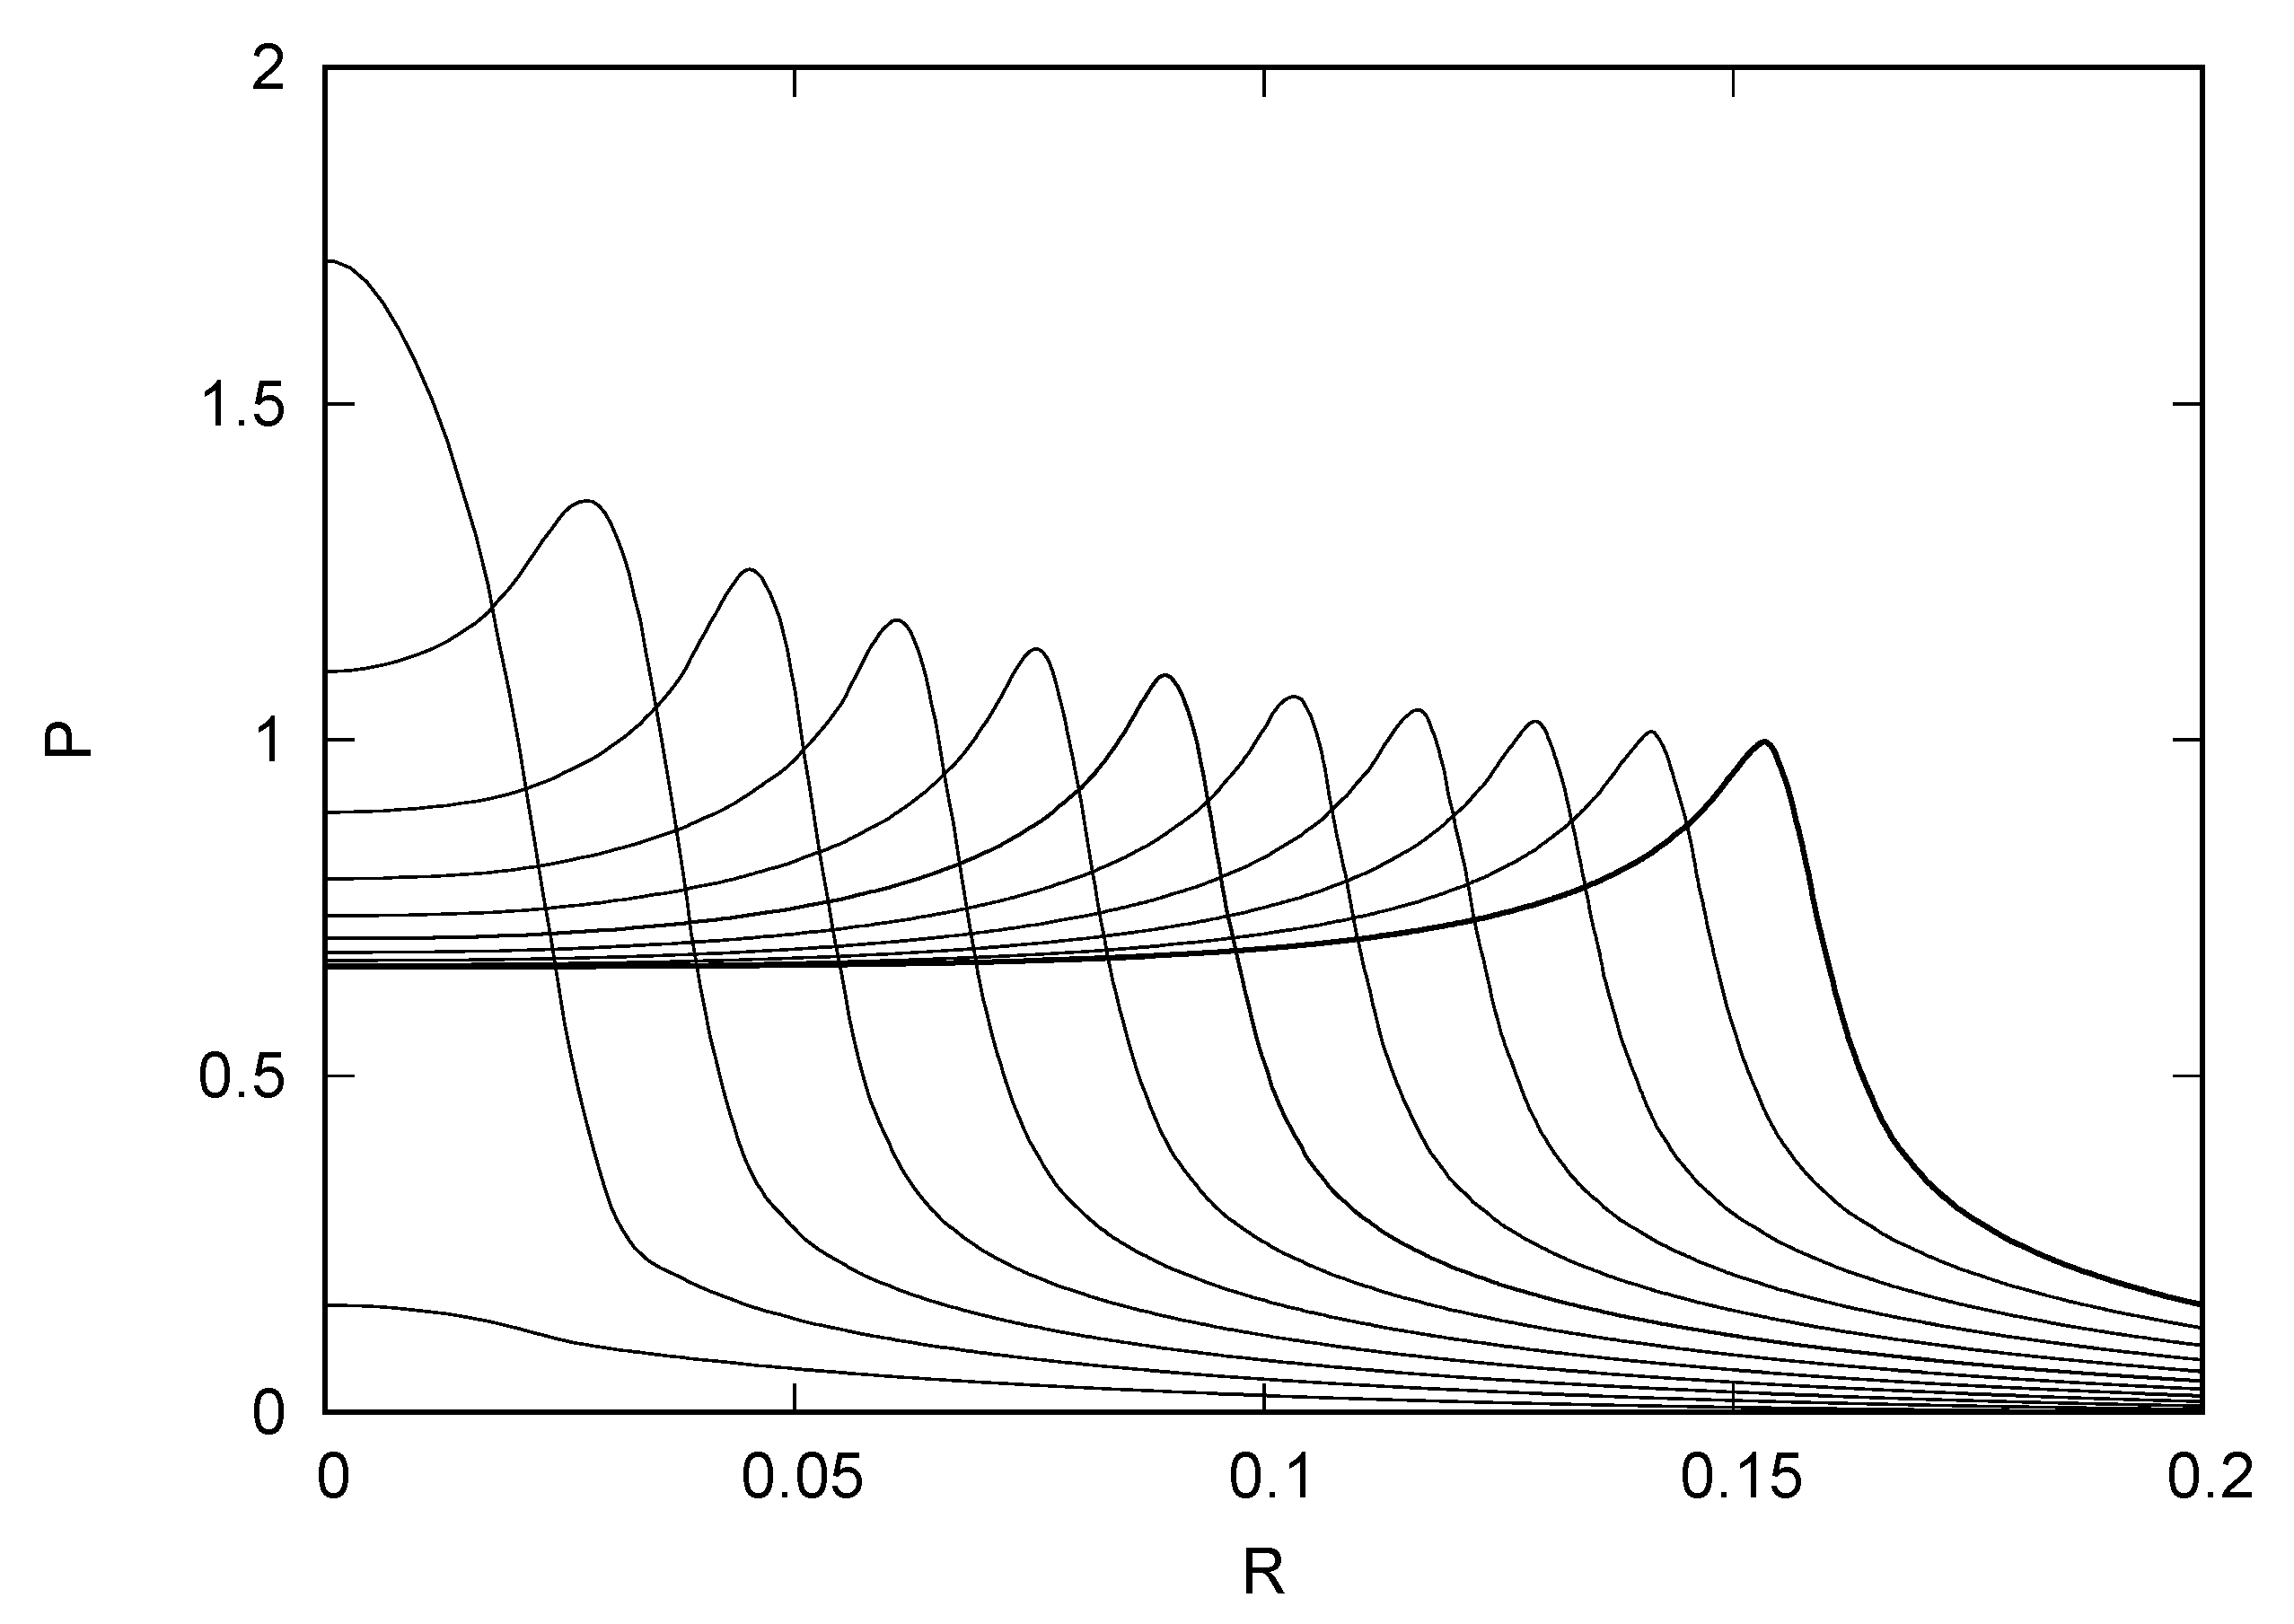
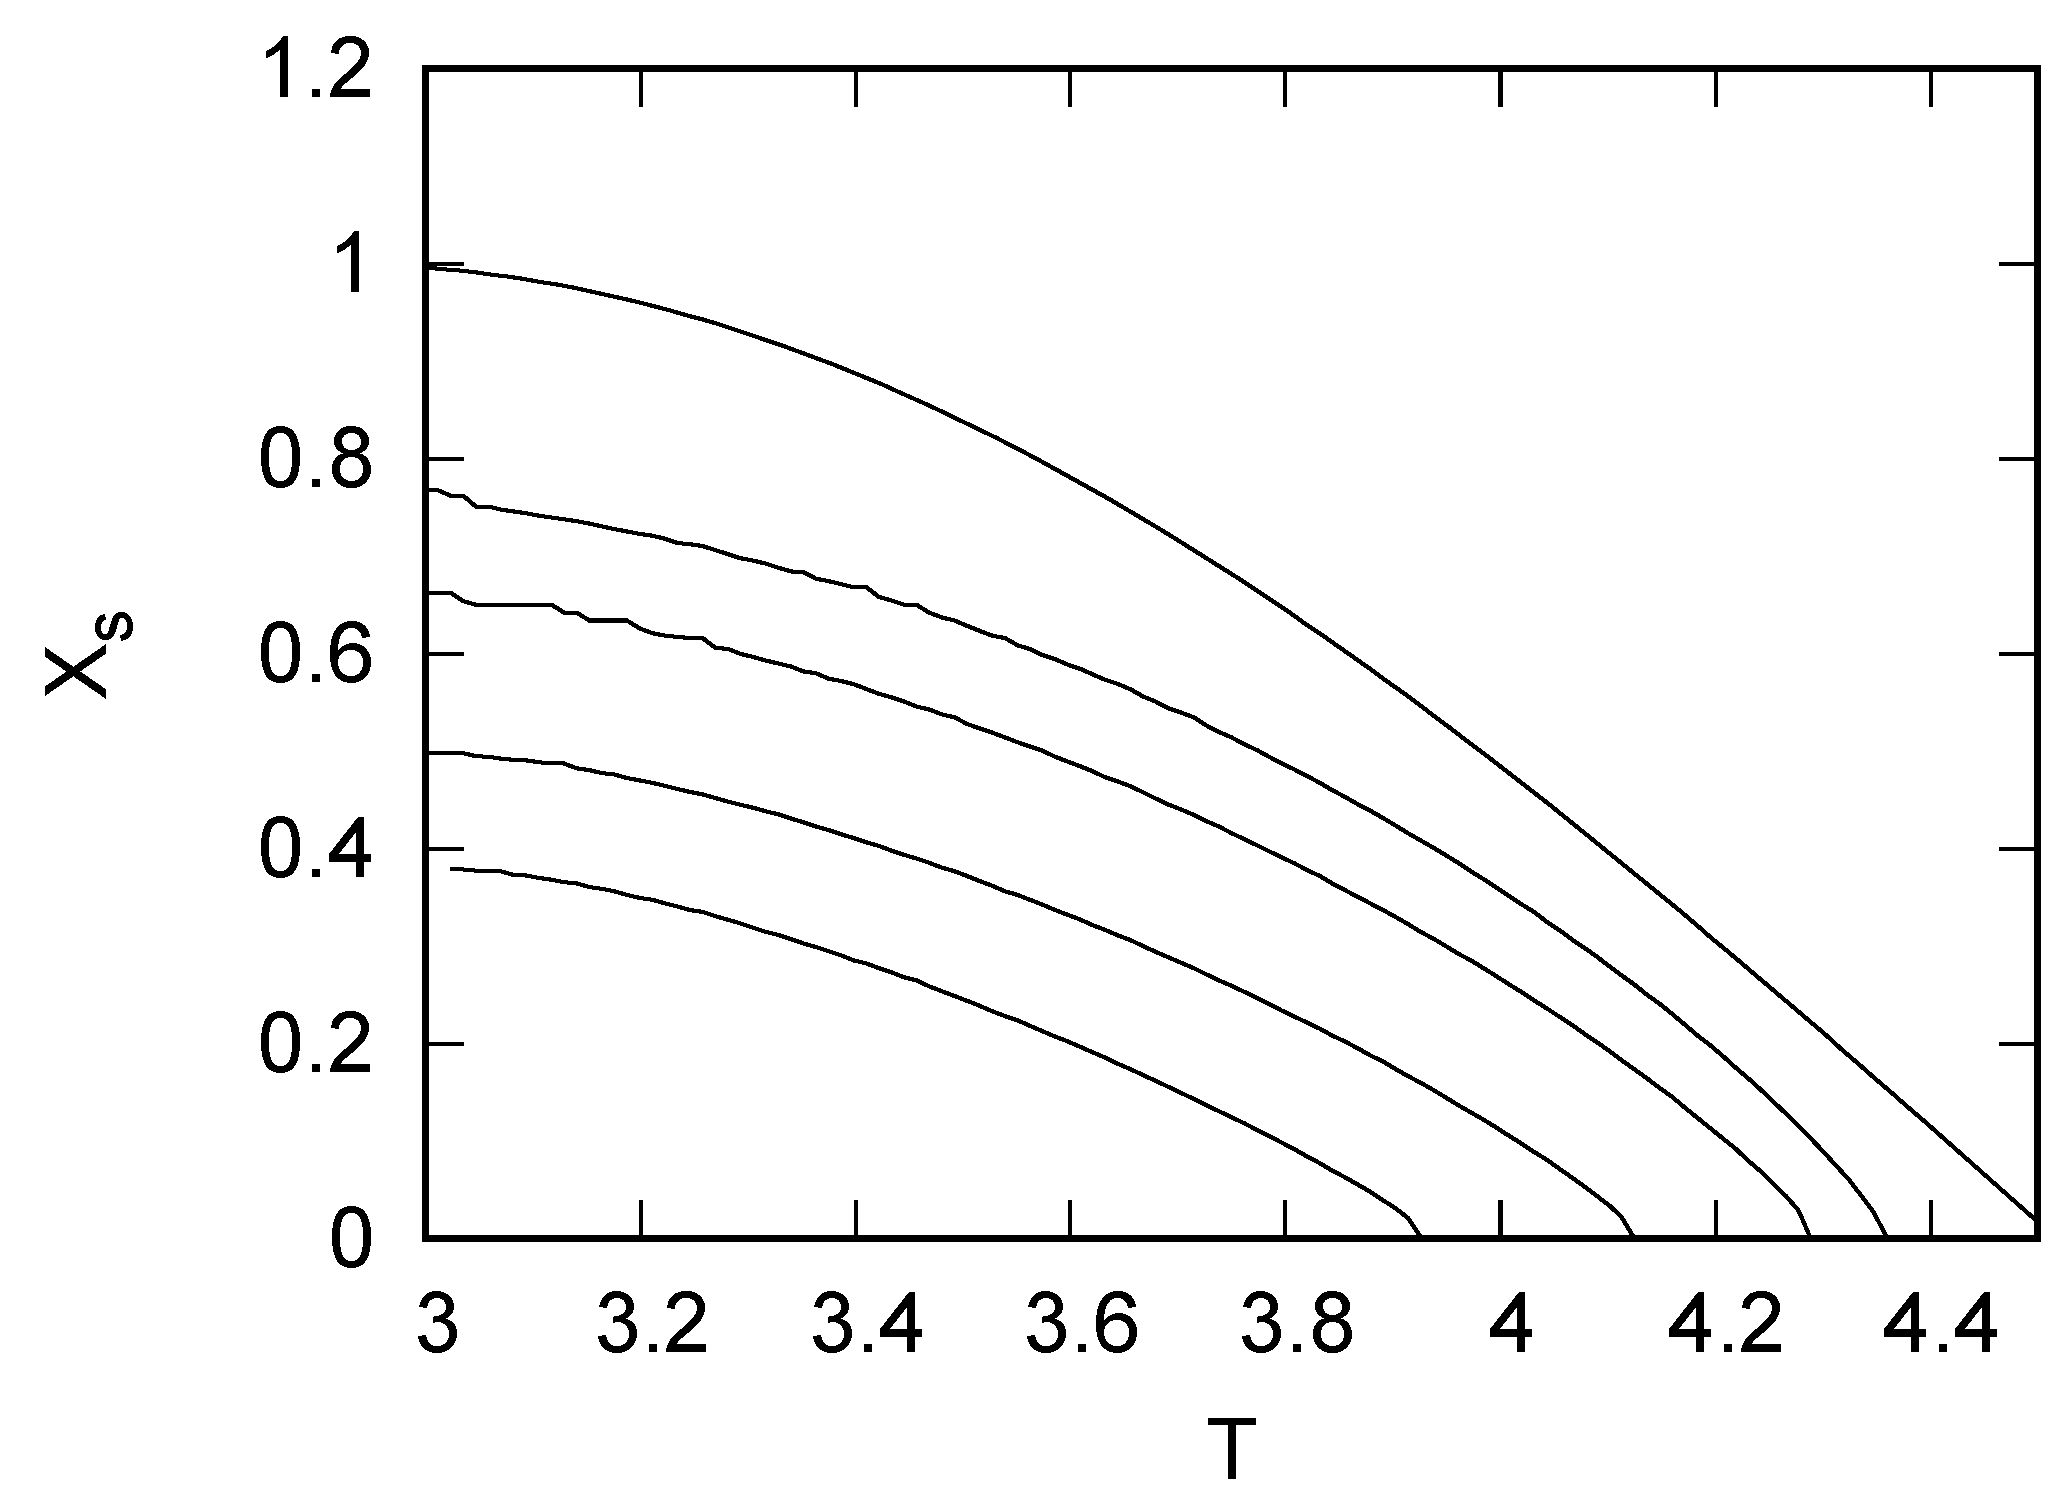
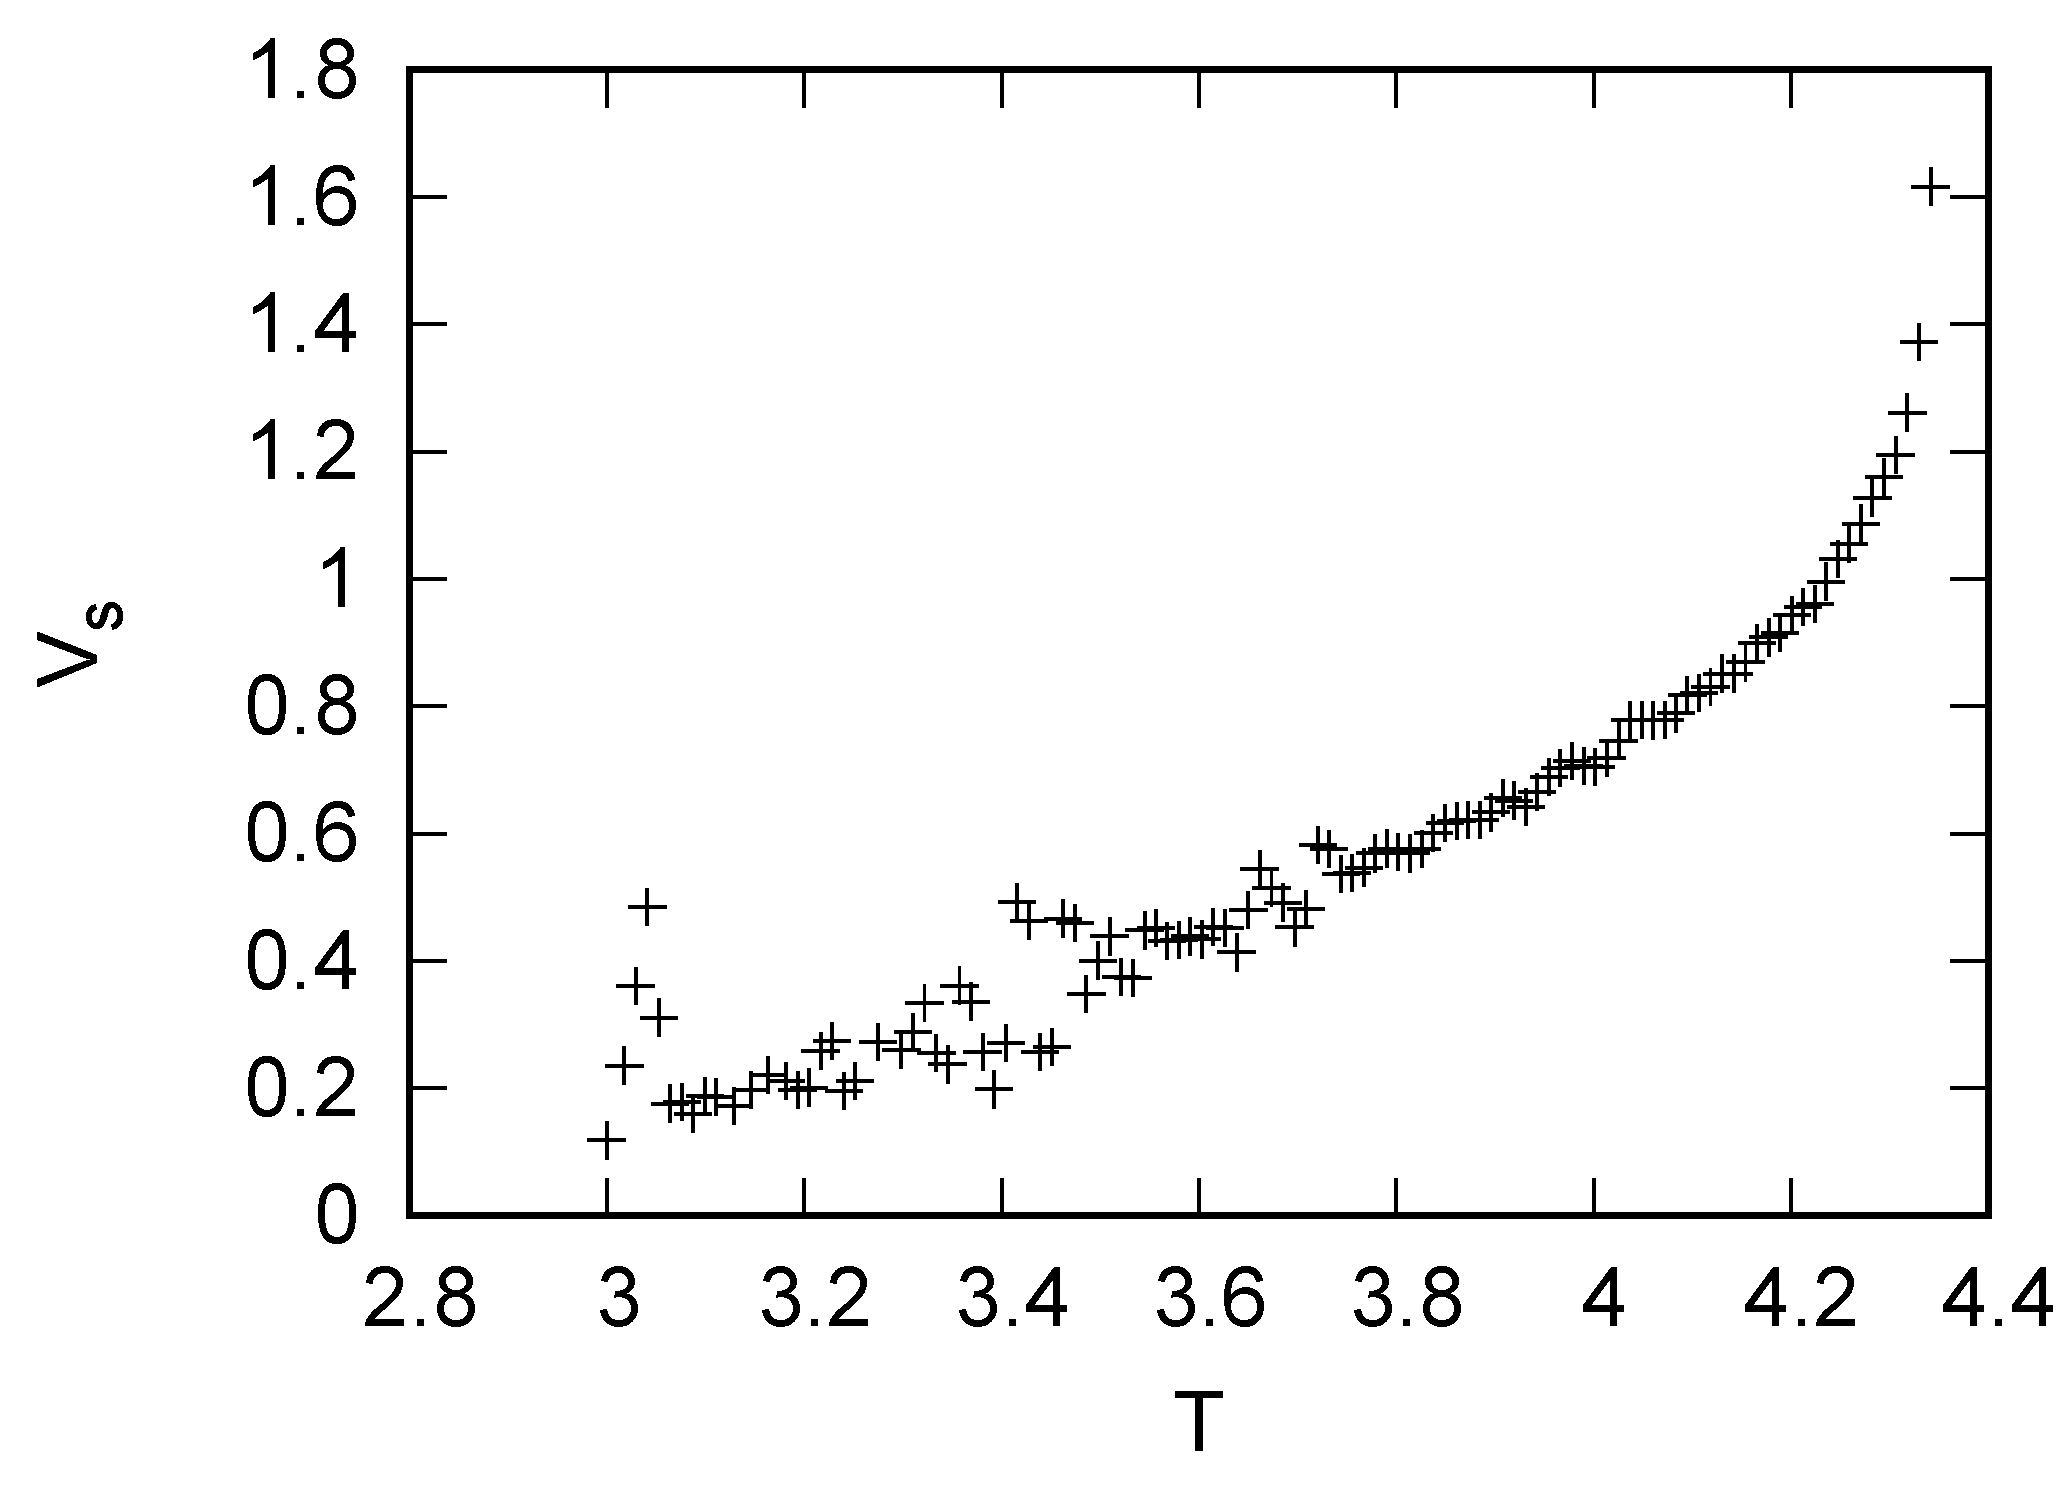
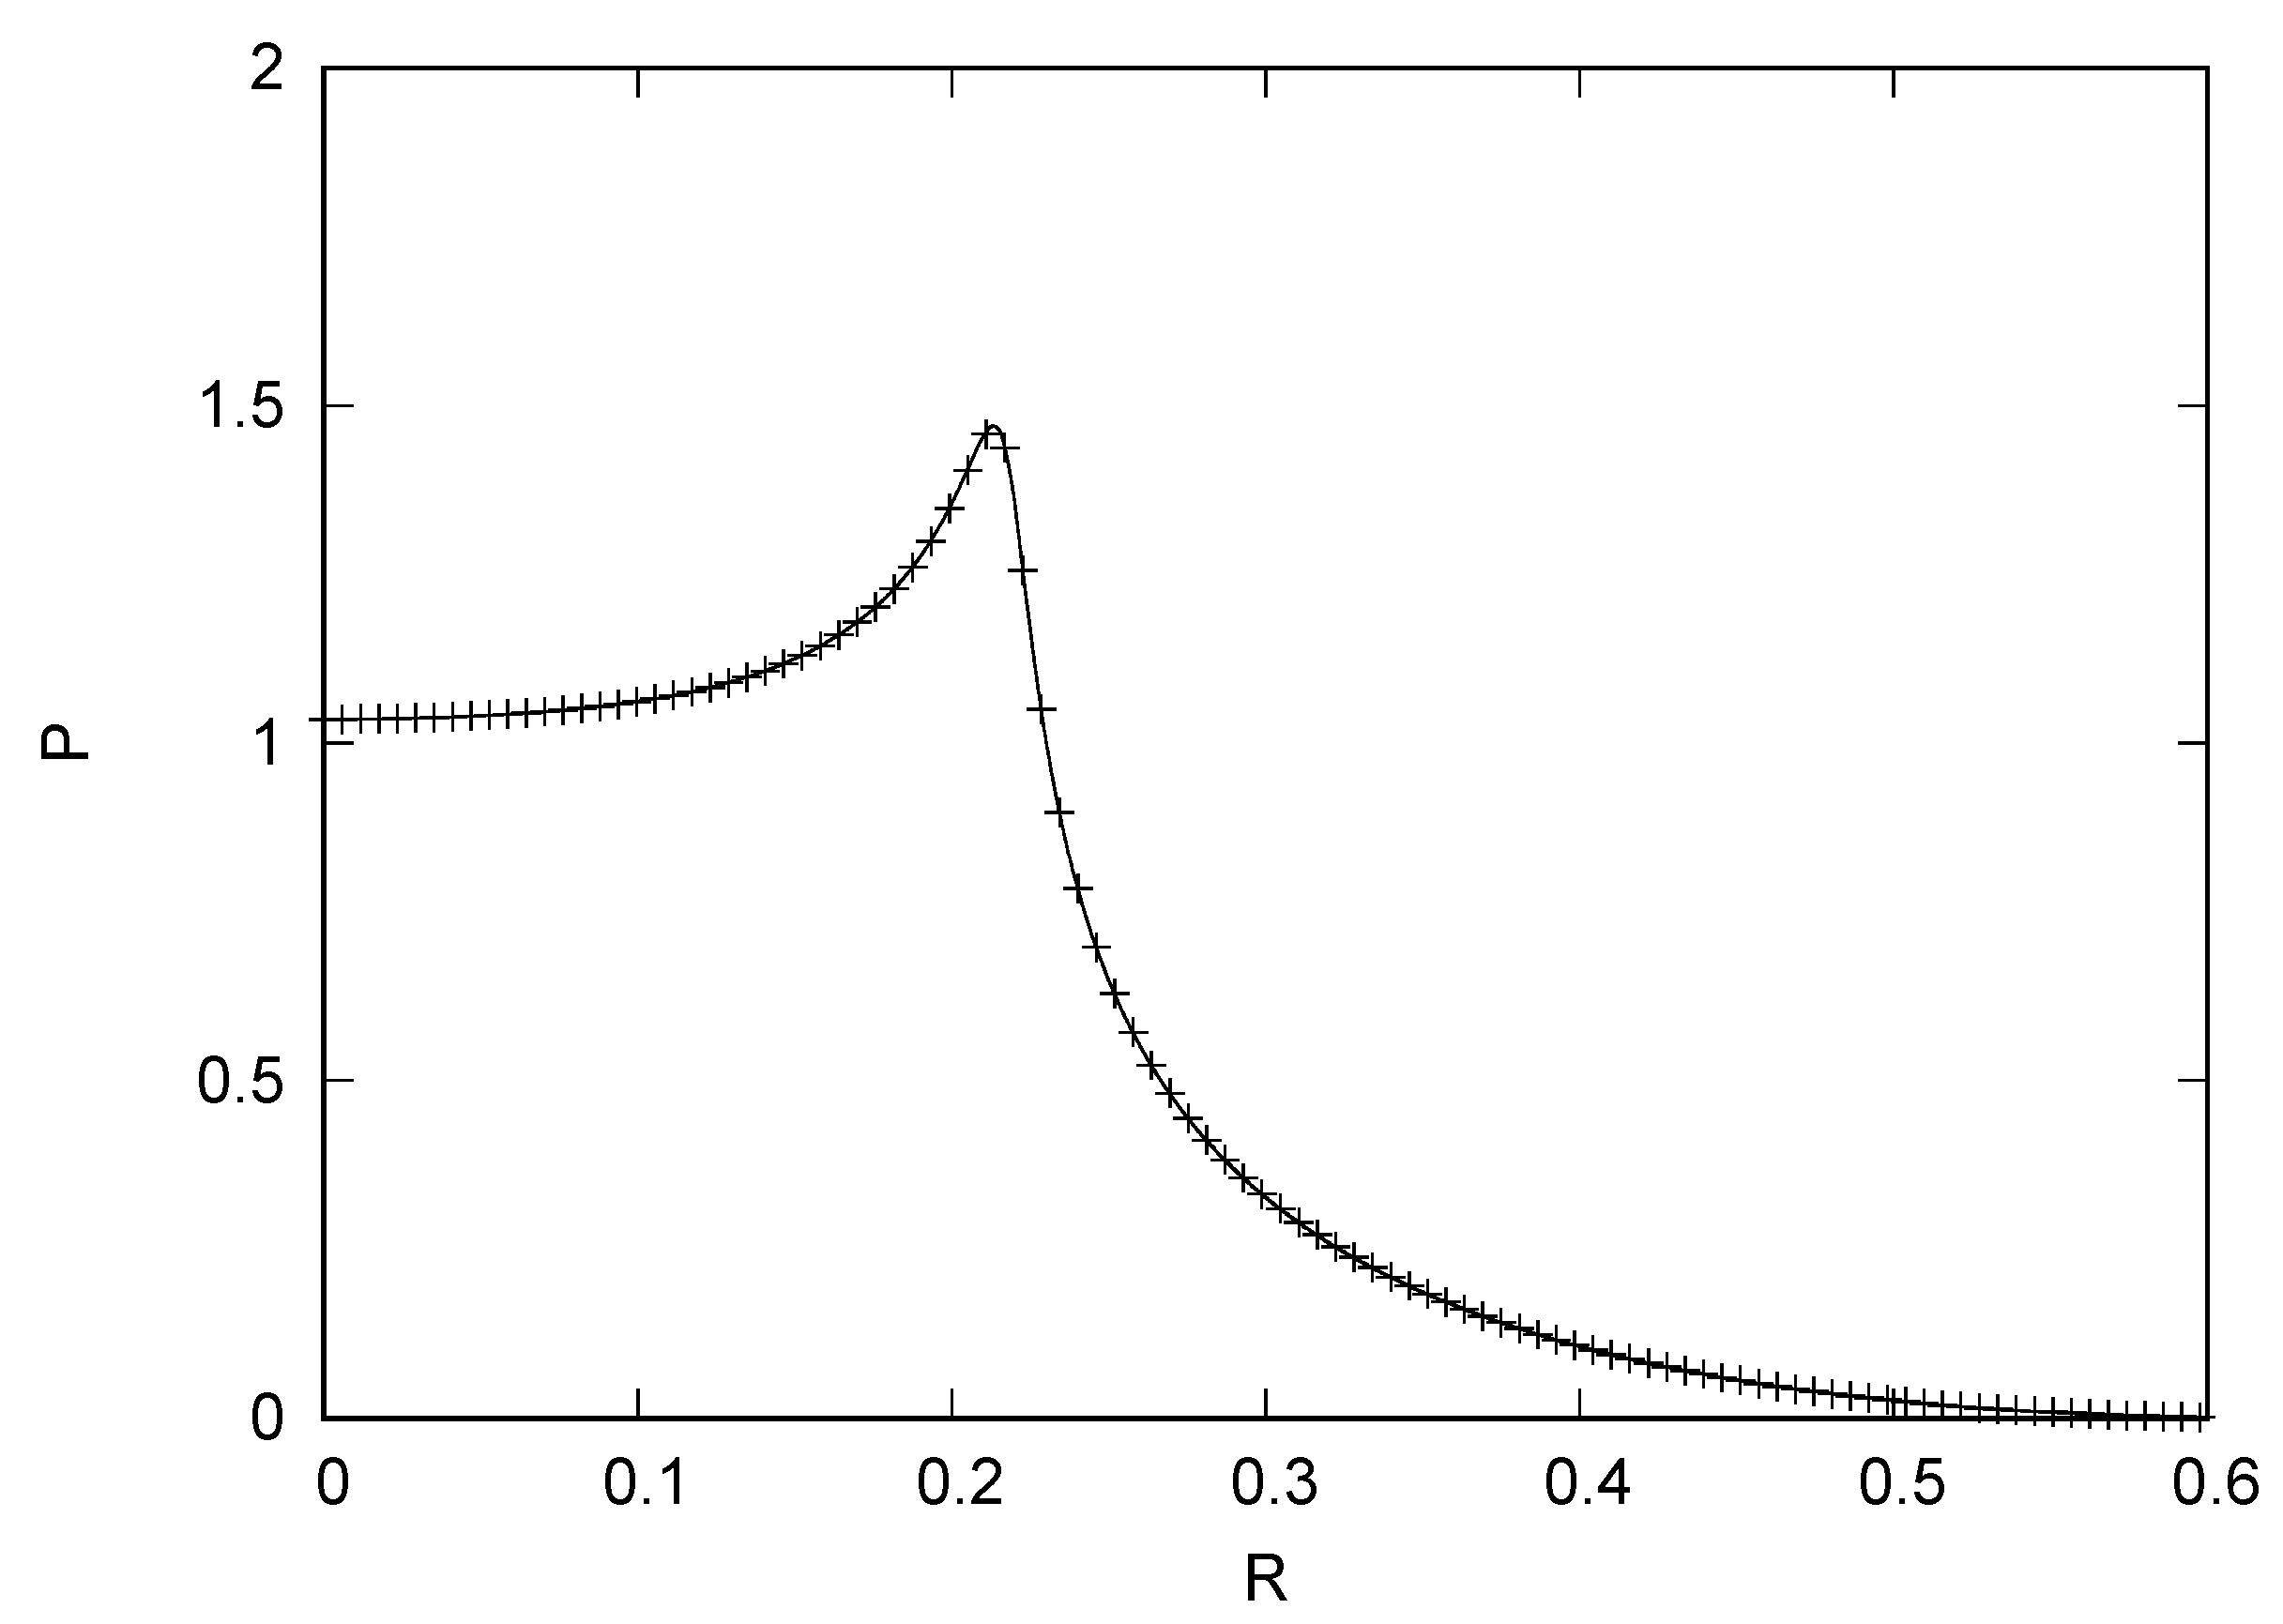
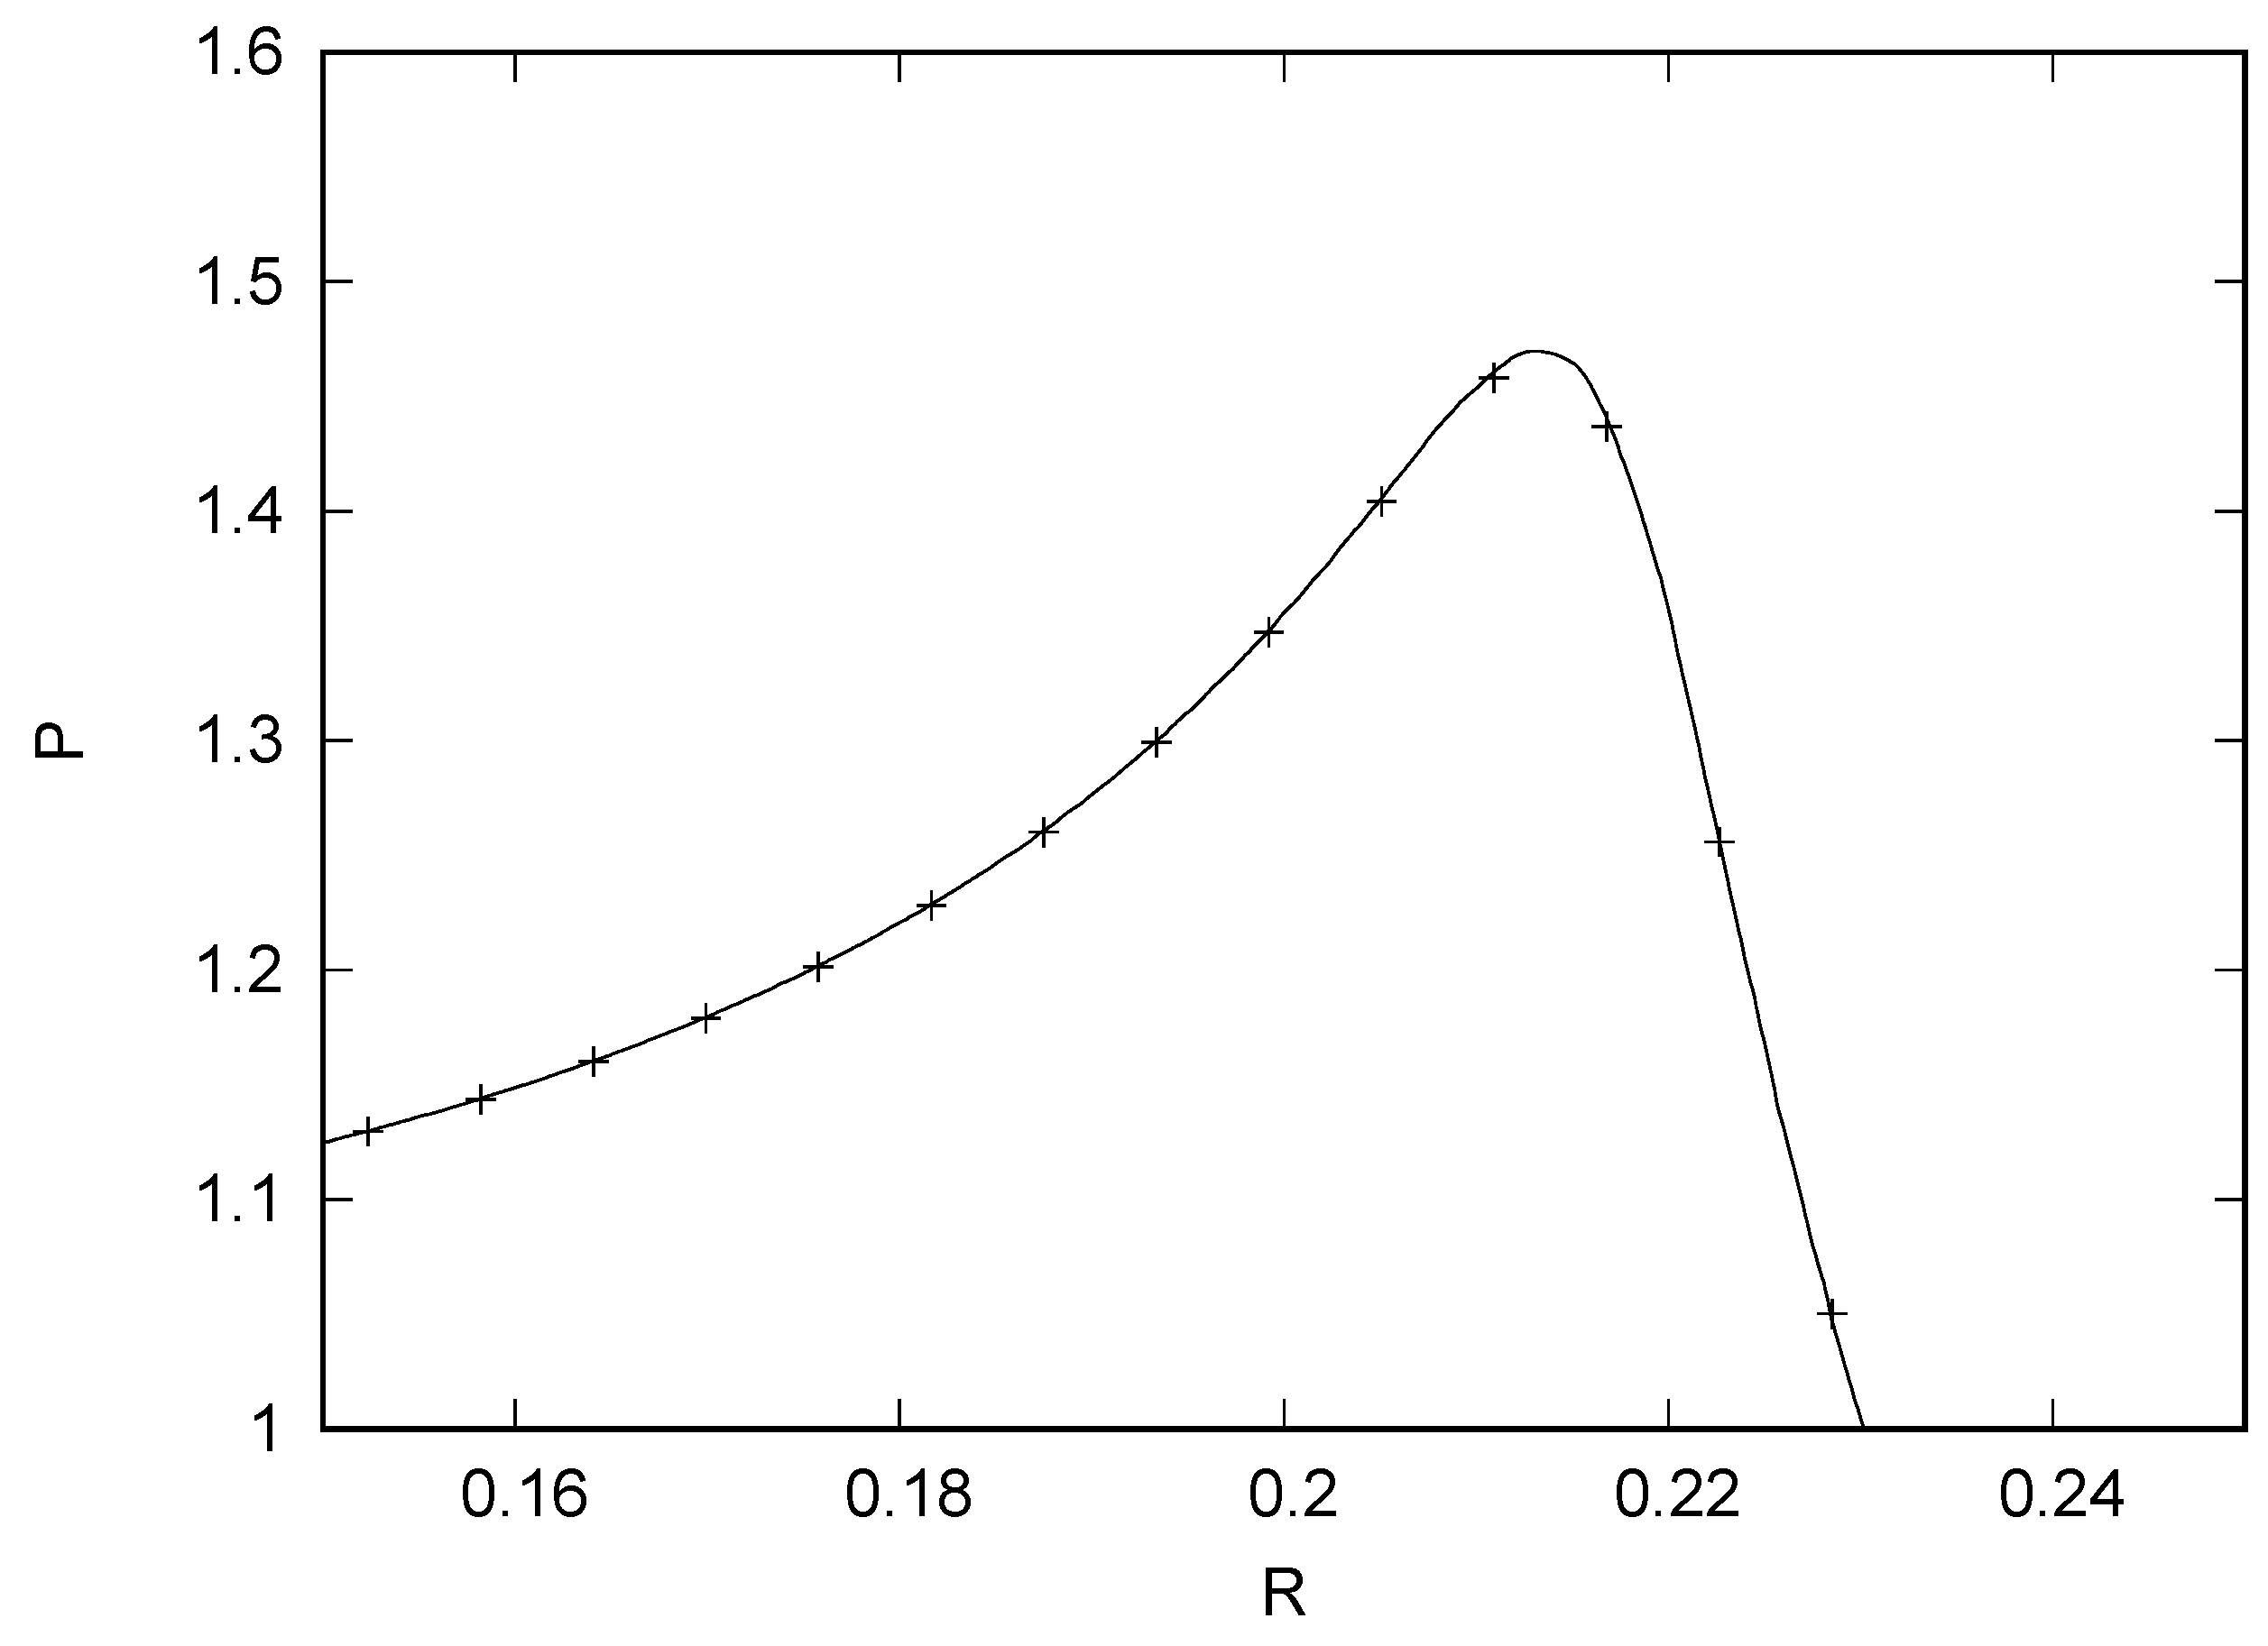
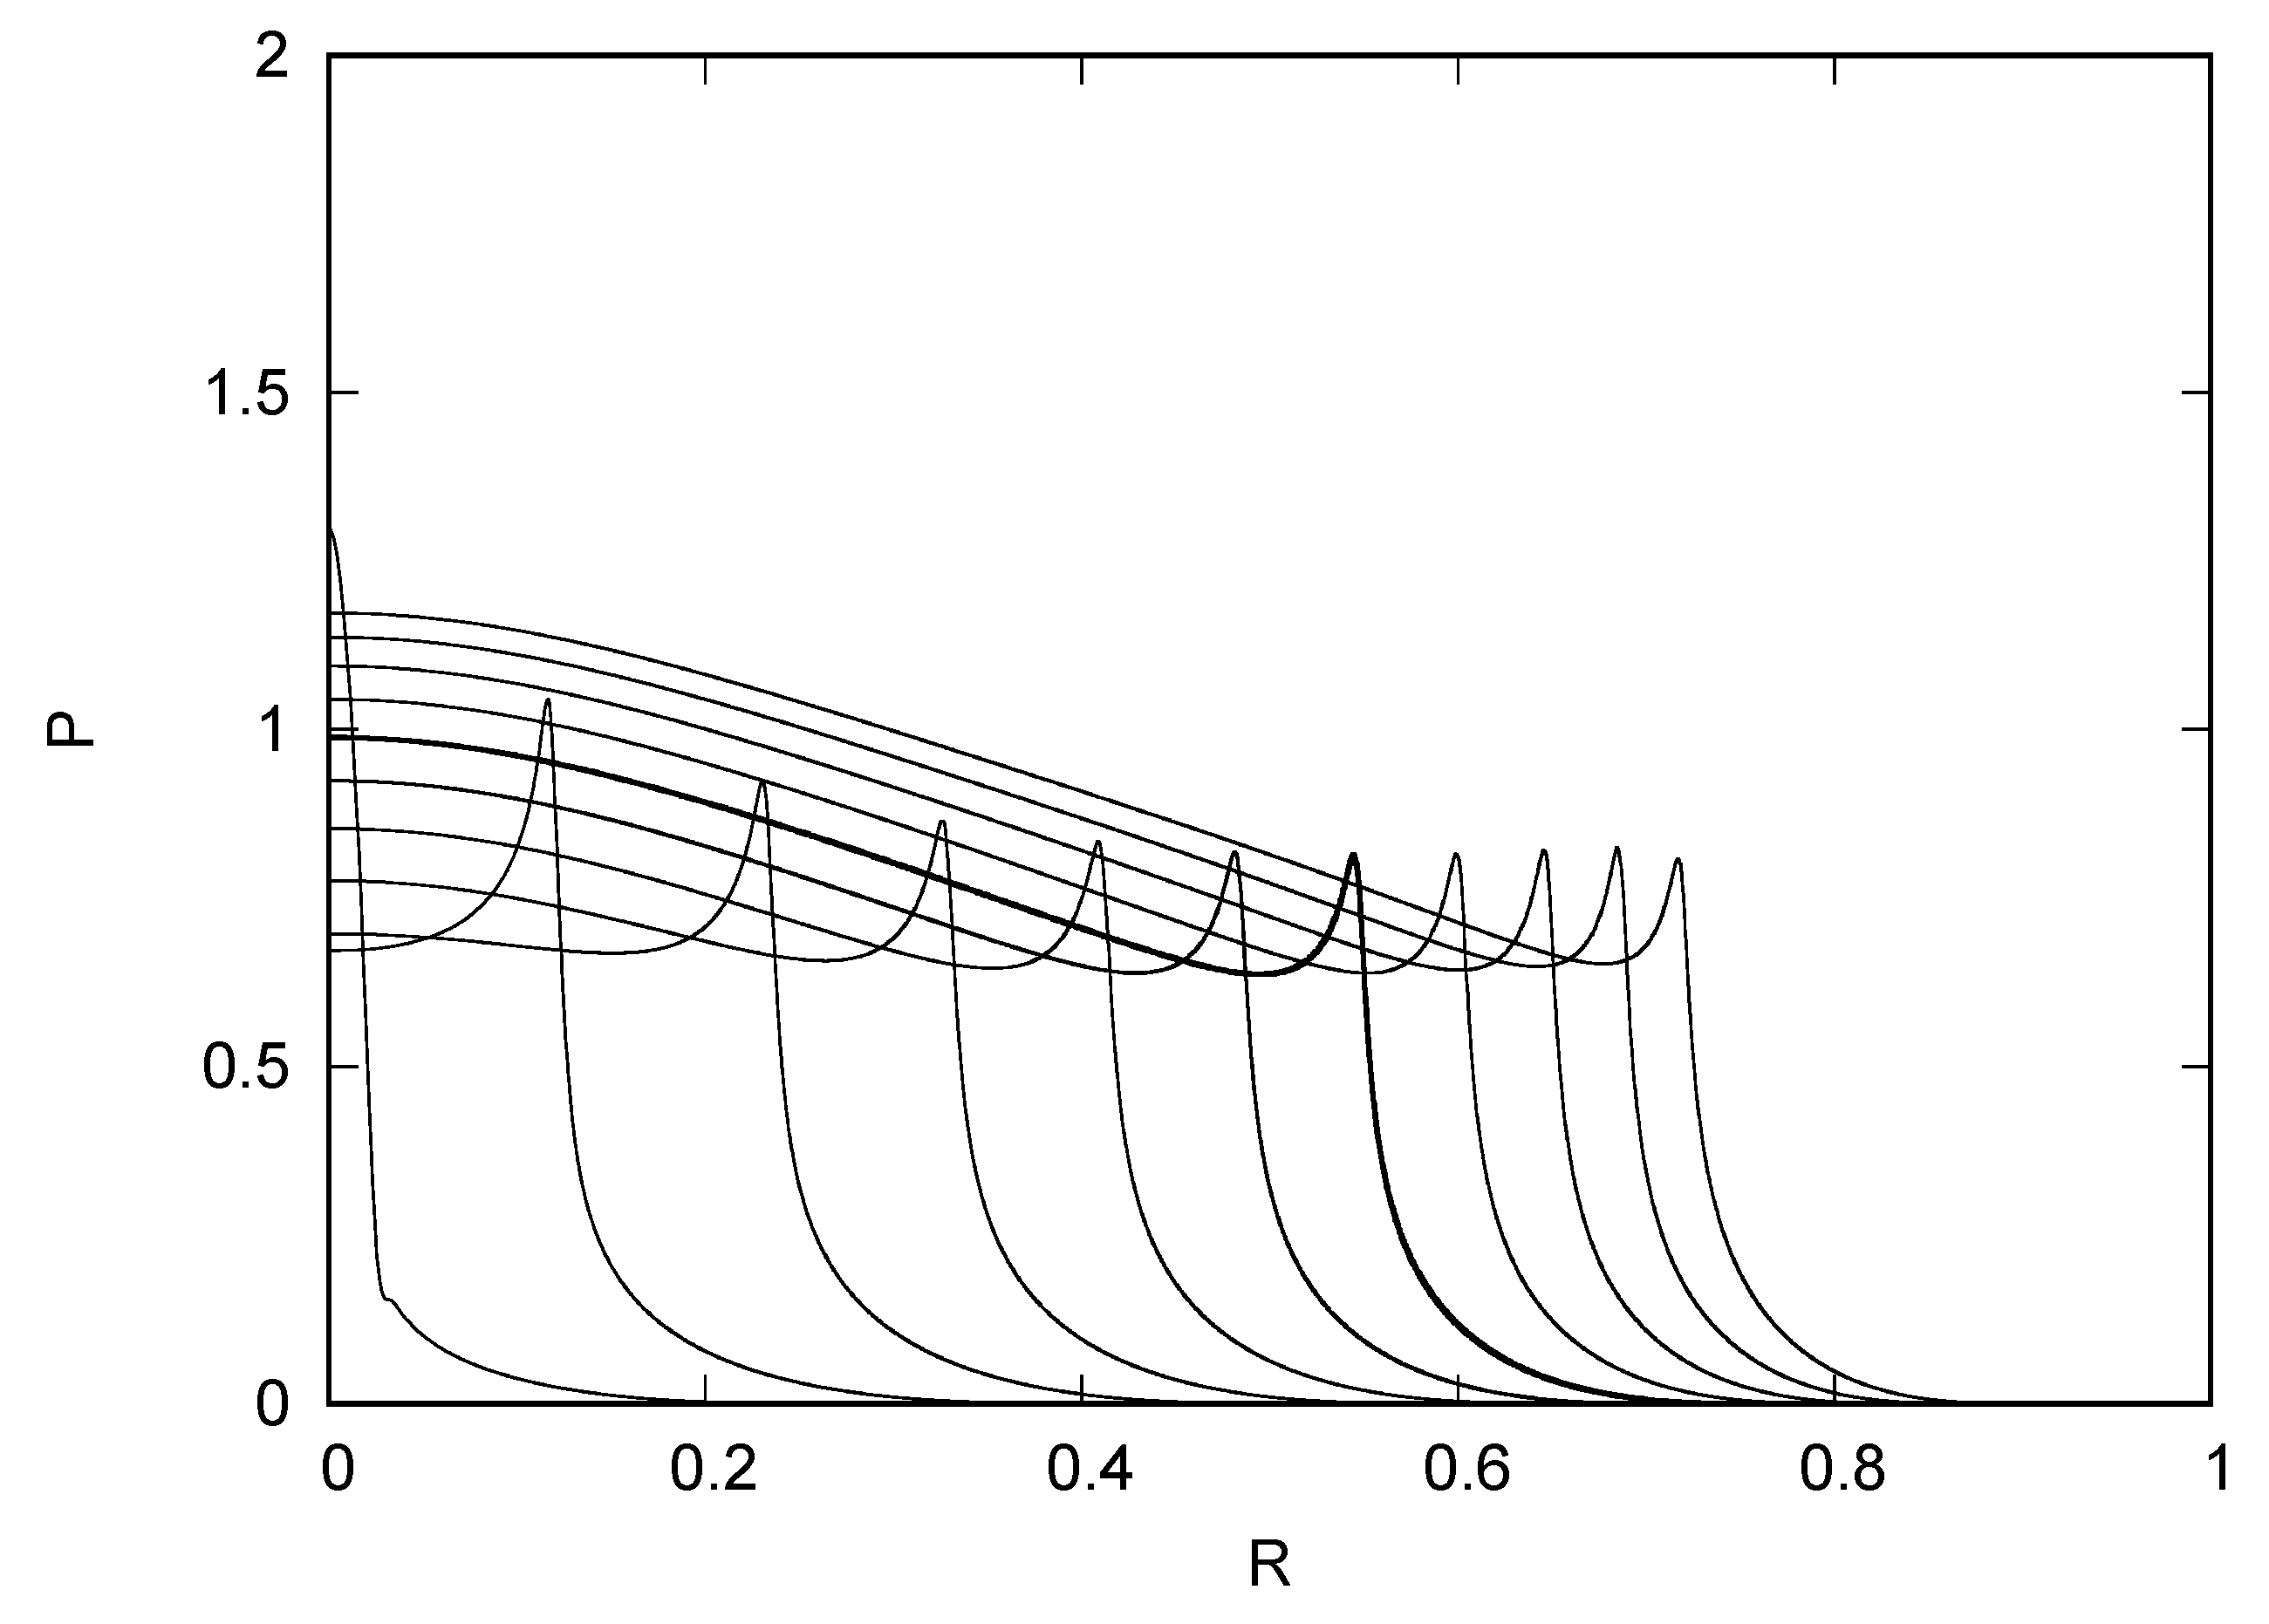
4. Results
5. Conclusions
Author Contributions
Funding
Institutional Review Board Statement
Informed Consent Statement
Data Availability Statement
Conflicts of Interest
Abbreviations
| a | Hertzian contact radius |
| reduced elastic modulus | |
| h | film thickness |
| H | dimensionless film thickness (Hertz) |
| L | dimensionless Moes parameter |
| M | dimensionless Moes parameter |
| Hertzian contact pressure | |
| P | dimensionless pressure |
| R | dimensionless radial coordinate |
| impact time | |
| T | dimensionless time |
| initial vertical impact velocity | |
| V | dimensionless vertical impact velocity |
| X | dimensionless coordinate |
| Y | dimensionless coordinate |
| pressure viscosity index | |
| dimensionless parameter | |
| rigid body separation | |
| dimensionless rigid body separation | |
| dimensionless viscosity, | |
| dimensionless parameter | |
| dimensionless density, | |
| superscript : maximum over time |
References
- Gohar, R.; Cameron, A. Optical measurement of oil film thickness under elasto-hydrodynamic lubrication. Nature 1963, 200, 458–459. [Google Scholar] [CrossRef]
- Cameron, A.; Gohar, R. Theoretical and experimental studies of the oil film in lubricated point contact. Proc. R. Soc. London Ser. A Math. Phys. Sci. 1966, 291, 520–536. [Google Scholar]
- Safa, M.M.A. Elastohydrodynamic Studies Using Thin Film Transducers. Ph.D. Thesis, Imperial College, University of London, London, UK, 1982. [Google Scholar]
- Safa, M.M.A.; Gohar, R. Pressure distribution under a ball impacting a thin lubricant layer. Trans. ASME J. Lubr. Tech. 1985, 108, 372–376. [Google Scholar] [CrossRef]
- Johns-Rahnejat, P.M.; Gohar, R. Measuring contact pressure distributions under elastohydrodynamic point contacts. Tribotest J. 1994, 1, 33–53. [Google Scholar] [CrossRef]
- Rahnejat, H.; Gohar, R. The vibrations of radial ball bearings. Proc. ImechE 1985, 199, 181–193l. [Google Scholar] [CrossRef]
- Gohar, R. Elastohydrodynamics, 2nd ed.; World Scientific: Singapore, 2001. [Google Scholar]
- Gohar, R.; Safa, M.M.A. Measurement of contact pressure under elastohydrodynamic lubrication conditions. In Tribology and Dynamics of Engine and Powertrain; Woodhead Publishing: Sawston, UK, 2010; pp. 222–245. [Google Scholar]
- Venner, C.H.; Wang, J.; Lubrecht, A.A. Central filmthickness in EHL point contacts under pure impact revisited. Tribol. Int. 2016, 100, 1–6. [Google Scholar] [CrossRef]
- Wijnant, Y.H.; Wensing, J.A.; van Nijen, G.C. The influence of lubrication on the dynamic behaviour of ball bearings. J. Sound Vib. 1999, 222, 579–596. [Google Scholar] [CrossRef]
- Wijnant, Y.H. Contact Dynamics in the Field of Elastohydrodynamic Lubrication. Ph.D. Thesis, University of Twehte, Enschede, The Netherlands, 1998. [Google Scholar]
- Wijnant, Y.H.; Venner, C.H. Contact dynamics in Elastohydrodynamic Lubrication. In Lubrication at the Frontier: The Role of the Interface and Surface Layers in the thin Film and Boundary Layer Regime, Proceedings of the 1998 Leeds Lyon Symposium on Tribology, Lyon, France, 8–11 September 1998; Elsevier: The Netherlands, Amsterdam.
- Petrusevich, A.I. Fundamental conclusions from the contact hydrodynamic theory of lubrication. Izv. Acad. Nauk. SSR 1951, 2, 209–223. [Google Scholar]
- Dowson, D.; Higginson, G.R. A numerical solution to the elastohydrodynamic problem. Proc. IMechE Part C J. Mech. Eng. Sci. 1959, 1, 6–15. [Google Scholar]
- Dowson, D.; Higginson, G.R. Elastohydrodynamic Lubrication, the Fundamentals of Roller and Gear Lubrication; Pergamon Press: Oxford, UK, 1966. [Google Scholar]
- Greenwood, J.A. An extension of the Grubin theory of EHL. J. Phys. D Appl. Phys. 1972, 5, 2195–2211. [Google Scholar] [CrossRef]
- Hall, R.W. Pressure Spikes in Elastohydrodynamic Lubrication—Some Elastic Considerations. WEAR 1989, 131, 151–161. [Google Scholar] [CrossRef]
- Greenwood, J.A.; Morales-Espejel, G.E. Pressure Spikes in EHL. Tribol. Ser. 1995, 30, 555–564. [Google Scholar]
- Kannel, J.W. The Measurement of Presure in Rolling Contacts. Proc. IMechE 1966, 180, 135–142. [Google Scholar]
- Hamilton, G.M.; Moore, S.L. Deformation and Pressure in an EHD Contact. Proc. R. Soc. London 1971, 322, 313–330. [Google Scholar]
- Mansot, J.L.; Martin, J.M. Measurements of Local Pressure in a Static Sphere/Plane Interface Containing Organic Compounds by Means of Raman Spectroscopy. In Proceedings of the 12th Leeds-Lyon Symposium on Tribology, Lyon, France, 3–6 September 1985; pp. 234–237. [Google Scholar]
- Gardiner, D.J.; Baird, E.; Craggs, C.; Dare-Edwards, M.P.; Bell, J.C. Raman Microspectroscopy of a Working Elastohydrodynamic Contact. Lubr. Sci. 1989, 1, 301–313. [Google Scholar] [CrossRef]
- Jubault, I.; Molimard, J.; Lubrecht, A.A.; Mansot, J.L.; Vergne, P. In situ pressure and film thickness measurements in rolling/sliding lubricated point contacts. STLE Tribol. Trans. 2000, 35, 696–706. [Google Scholar]
- Cann, P.M.E.; Spikes, H.A. Measurement of pressure distribution in EHL-development of method and application to dry static contacts. Tribol. Trans. 2005, 48, 474–483. [Google Scholar] [CrossRef]
- Åström, H.; Venner, C.H. Soap-thickener induced local pressure fluctuations in a grease-lubricated elastohydrodynamic point contact. Proc. Inst. Mech. Eng. Part J J. Eng. Tribol. 1994, 208, 191–198. [Google Scholar] [CrossRef]
- Jolkin, A.; Larsson, R. Film Thickness, Pressure Distribution and Traction in Sliding EHL Conjunctions. Triboloy Interface Eng. Ser. 1999, 36, 505–516. [Google Scholar]
- Larsson, P.O.; Larsson, R.; Jolkin, A.; Marklund, O. Pressure Fluctuations as Grease Soaps pass through an EHL contact. Tribol. Int. 2000, 33, 211–216. [Google Scholar] [CrossRef]
- Molimard, J.; Querry, M.; Vergne, P.; Krupka, I.; Hartl, M. Calculation of pressure distribution in EHD point contats from experimentally determined film thickness. Tribol. Int. 2005, 38, 391–401. [Google Scholar] [CrossRef]
- Biboulet, N.; Sperka, P.; Venner, C.H.; Lubrecht, A.A.; Krupka, I. Obtaining the pressure spike and maximum shear stress in circular EHL contacts in the elastic-piezoviscous regime. Tribol. Int. 2013, 62, 1–7. [Google Scholar] [CrossRef]
- Dowson, D.; Wang, D. An analysis of the normal bouncing of a solid elastic ball on an oily plate. WEAR 1994, 179, 29–37. [Google Scholar] [CrossRef]
- Larsson, R.; Höglund, E. Numerical Simulation of a Ball Impacting and Rebounding a Lubricated Surface. J. Tribol. 1995, 117, 94–102. [Google Scholar] [CrossRef]
- Workel, M.F.; Dowson, D.; Ehret, P.; Taylor, C.M. Measurements of the coefficients of friction of different lubricants during impact under high pressure and shear. Proc. Inst. Mech. Eng. Part J J. Eng. Tribol. 2003, 217, 115–124. [Google Scholar] [CrossRef]
- Newmark, N.M. A Method of Computation for Structural Dynamics. J. Eng. Mech. Div. 1959, 85, 76–94. [Google Scholar] [CrossRef]
- Venner, C.H.; Lubrecht, A.A. MultiLevel Methods in Lubrication; Elsevier: Amsterdam, The Netherlands, 2000; 379p. [Google Scholar]
- Moes, H. Lubrication and beyond; University of Twente: Enschede, The Netherlands, 2000; pp. 1–366. [Google Scholar]
- Johnson, K.L. Contact Mechanics; Cambridge University Press: Cambridge, UK, 1985. [Google Scholar]


Publisher’s Note: MDPI stays neutral with regard to jurisdictional claims in published maps and institutional affiliations. |
© 2022 by the authors. Licensee MDPI, Basel, Switzerland. This article is an open access article distributed under the terms and conditions of the Creative Commons Attribution (CC BY) license (https://creativecommons.org/licenses/by/4.0/).
Share and Cite
Lubrecht, T.; Venner, K. Lubricated Impact Dynamics and Pressure Spike Generation: Expanding on Contributions of Dr. R. Gohar. Lubricants 2022, 10, 186. https://doi.org/10.3390/lubricants10080186
Lubrecht T, Venner K. Lubricated Impact Dynamics and Pressure Spike Generation: Expanding on Contributions of Dr. R. Gohar. Lubricants. 2022; 10(8):186. https://doi.org/10.3390/lubricants10080186
Chicago/Turabian StyleLubrecht, Ton, and Kees Venner. 2022. "Lubricated Impact Dynamics and Pressure Spike Generation: Expanding on Contributions of Dr. R. Gohar" Lubricants 10, no. 8: 186. https://doi.org/10.3390/lubricants10080186
APA StyleLubrecht, T., & Venner, K. (2022). Lubricated Impact Dynamics and Pressure Spike Generation: Expanding on Contributions of Dr. R. Gohar. Lubricants, 10(8), 186. https://doi.org/10.3390/lubricants10080186